Unlocking opportunities Strategic and emerging issues in ... · Investec Bank, Mercantile Bank...
108
2011 Edition Unlocking opportunities Strategic and emerging issues in South African banking 2011 www.pwc.com/za June 2011
Transcript of Unlocking opportunities Strategic and emerging issues in ... · Investec Bank, Mercantile Bank...

2011 Edition 1
Unlocking opportunitiesStrategic and emerging issues in South African banking 2011
www.pwc.com/za
June 2011

2 2011 Edition
Table of contents
Section Page
Foreword 3
About the author 4
Background 5
Executive summary 6
Strategy and markets 12
Regulatory compliance and risk 27
Operations and technology 36
Performance 40
People and remuneration 49
Competitor landscape 53
Peer review 62
PwC point of view 72
Appendices
Methodology 88
Bank groups 89
Participants 90
Background comments on participants 91
PwC – Who we are 100
2011 Edition 3
Foreword
• Participants strongly disagreed withthe removal (in the new CompaniesAct) of the annual audit requirementsfor certain companies – for credit riskmanagement reasons.
The banking industry is a dynamic industry and much has happened since we conducted our research for this survey in February and March 2011.
For example, the Minister of Finance announced a new ‘Twin Peaks’ regulatory framework in his budget speech. This is designed as an enhancement of the current system. The new proposals mean that prudential regulation will be overseen by the South African Reserve Bank and market conduct by the Financial Services Board.
Internationally, the European debt crisis and political unrest in North Africa continue and it is unclear how these issues will be resolved.
Furthermore, the Registrar of Banks, Mr. Errol Kruger, has announced his early retirement after a long and distinguished career at the SARB.
We would like to thank the CEO and Senior Executives who participated in this survey and whose support made it possible. We also thank the partners and staff in our Johannesburg office who have helped to produce this report. Particular thanks goes to Dr Brian Metcalfe for his work in creating this report.
As in the past, we look forward to your feedback on this survey and on topics you think should be included in future years.
Johannes Grosskopf Johannesburg 30 June 2011
This is the 12th PwC survey on banking in South Africa, highlighting the ‘strategic and emerging issues’ in the sector.
This survey has been developed by PwC and Dr Brian Metcalfe and builds on previous surveys.
As in previous years, the key objectives of this survey are to encourage debate around these strategic and emerging issues, provide data summaries of industry trends, and understand the thinking of CEOs and senior executives in the banking industry. We also aim to provide perspectives on how banking in South Africa could evolve over the next three years.
In this edition, for the first time, we have included a section on PwC’s Point of view where we provide our opinion and views on some key industry trends observed locally and globally.
Here are some of the key points in this year’s survey:
• Basel III is currently the most importantdriver of change in the market, due tothe effect it will have on banks’ fundingmodels
• Revenue growth and profitabilitycontinue to be pressing issues for CEOs,though longer term projections arebullish
• Mobile banking and electronic channelsare gaining momentum, and homeloans seem to have lost their appeal
• There is strong interest in investmentopportunities in Africa, particularly inthe SADC countries
• South Africa is seen as the gatewayto Africa, with further interest frominternational banks not being ruled out
Johannes Grosskopf Banking and Capital Markets Leader PwC Southern Africa
Tom Winterboer Financial Services Leader PwC Southern Africa and Africa

4 2011 Edition
About the author
Dr Brian Metcalfe is an associate professor in the Business School at Brock University, Ontario, Canada. He has a doctorate in financial services marketing and has researched and produced over 40 reports, such as this one, on behalf of PwC in 14 different countries including Australia, Canada, China, India, Japan and South Africa.
Previous reports have examined strategic and emerging issues in corporate, investment and private banking, life, property and casualty insurance, insurance broking and wealth management.
He recently authored a report on banking in west coast Africa which covered five markets; Angola, Cote d’Ivoire, DRC, Ghana and Nigeria.
He has consulted for a wide range of organisations, including Royal Bank of Canada, Bank of Nova Scotia, Barclays Bank, Sun Life Insurance Company, Equitable Life of Canada and several major consulting firms.
He has taught an executive management course entitled ‘Financial Services Marketing’ at the Graduate School of Business, University of Cape Town.
This report was researched and written by Brian Metcalfe, Ph.D. Information presented herein, while obtained from sources believed reliable, is not guaranteed as to accuracy or completeness. This report has been commissioned by and distributed through PricewaterhouseCoopers Inc., Johannesburg.
Additional copies of this report can be obtained from Johannes Grosskopf, Banking and Capital Markets Leader: Financial Services Practice – PricewaterhouseCoopers Inc., 2 Eglin Road, Sunninghill, 2157
Telephone: +27 11 797 5407 Fax: +27 11 209 5407 E-mail: [email protected]
©2011. PricewaterhouseCoopers (“PwC”), the South African firm. All rights reserved. In this document, “PwC” refers to PricewaterhouseCoopers in South Africa, which is a member firm of PricewaterhouseCoopers International Limited (PwCIL), each member firm of which is a separate legal entity and does not act as an agent of PwCIL.
Dr Brian Metcalfe

2011 Edition 5
This survey focuses on ‘strategic and emerging issues’ in South African banking.
Participants are a combination of domestic and foreign banks; they range from local niche players to branches of global banks to the ‘Big Four’ domestic banks.
The survey attempts to synthesise diverse viewpoints, protect confidentiality and offer insights into the ever-changing banking and financial services environment.
It is based on interviews with CEO and senior executives of 20 banks, 11 of whom are foreign-owned and nine of whom are domestically-owned (ABSA and Nedbank is still included in the latter category and within the Big Four group, despite ownership by Barclays and Old Mutual (Pty) Ltd).
In addition, Mercantile Bank and The South African Bank of Athens are also in this group although both are foreign-owned. They all possess characteristics more typically found in a domestic bank and to include them in the foreign bank category would compromise their confidentiality.
The participants in 2011 closely match those involved in the 2009 report. Capitec and UBank participated in 2009 but they declined this time. Imperial Bank was excluded, as it is now wholly owned by Nedbank. Sasfin Bank has been added in 2011. Commerzbank, Dresdner Bank and RBS were not represented but Bank of China and State Bank of India were added in 2011.
The interviews with participants were approximately one hour in length and were conducted in Johannesburg during February 2011.
The domestic participants included ABSA Bank (even though it is controlled by Barclays in the UK and Nedbank controlled by Old Mutual Plc), African Bank, FirstRand Bank, Investec Bank, Mercantile Bank (even though controlled from Portugal), Nedbank Group Ltd, The South African Bank of Athens (even though controlled from Greece), Sasfin Bank and The Standard Bank of South Africa.
The foreign participants were Bank of China, Credit Agricole (formerly called Calyon), China Construction Bank, Citibank NA, Deutsche Bank AG, HSBC, JPMorgan Chase Bank, Société Générale, State Bank of India, Standard Chartered Bank and UBS.
Background

6 2011 Edition
Executive summary

2011 Edition 7
Main findings
Africa continues to feature strongly in banks expansion plans
An underlying theme of the report is the continued strong interest in Africa. One Big Four bank went so far as to suggest that current opportunities in Africa now matched those in the BRICS countries. However, a number of participants emphasised that their interest was not in Sub-Saharan Africa but rather in the SADC countries. Participants suggested that many banking assets in Africa are for sale,
but it remained a challenge to find banks with good quality management and staff. As a result, human resources are stretched. Part of the push into Africa has been driven by the banks’ need to follow and service their corporate clients as they expand in these markets. When considering opportunities outside Africa, participants weighted Asia, Middle East and South America equally.
Innovation will drive change as mobile and electronic channels become more important
Participants identified the importance of mobile banking in the future: two banks noted a doubling of activity in 2010. They also mentioned that
electronic channels will increase efficiency and lower costs. Innovation in these areas will be critical for future success.
Executive summary
Strategy and markets
The key themes emerging from this year’s survey have been summarised below:

8 2011 Edition
Regulatory changes remain a concern and will force banks to consider changing their business models
Banks have been dealing with regulatory changes for a number of years and this is set to continue for some time.
It is therefore not surprising that the number one driver of change is the introduction of Basel III and the challenges this will bring. Banks say that they will have to make fundamental changes to their business models if the proposed liquidity rules are implemented. Coupled with the more stringent capital requirements on trading positions and securitisations, as well as the other changes being introduced, this means that banks will have to be even more efficient in their use of capital if they want to avoid lower future returns on equity.
Banks also have to implement changes to comply with other legislation being introduced, specifically the new Companies Act. Although Banks have generally received this Act favourably, many respondents strongly disagree with the relaxation of the audit requirements, under which companies with a score of 750 or less (based on turnover, staff compliment, stakeholders and external lending) no longer need to be subject to an audit.
Regulation has also forced banks to make changes to their remuneration structures, with two thirds of the respondents having confirmed that they have made changes to cash bonuses and have introduced more stringent bonus deferral conditions.
Technology challenges will continue
Participants identified a number of technology weaknesses. There is a belief that South Africa needs to increase internet bandwidth and international connectivity.
Challenges remain with legacy systems, integrated business process management and card fraud.
Given these challenges, the Big Four noted that they will spend in excess of R30b over the next three years on upgrading or replacing their IT platforms and processes.
Profitability and revenue growth are the top two pressing issues
Banks have been reporting sluggish revenue growth and increasing growth features high on their list of priorities. Connected to this is a focus on driving profitability. Respondents believe they can trim staff costs further and increase efficiencies by eliminating duplication. However, a number of respondents noted they were in an expansive mode and consequently predicted that any fall in costs would be restricted to between 0% and 5%.
When asked to predict future return on equity and growth in profitability, respondents were more bullish than we might have expected. Thirteen respondents believed their ROEs will increase to above 19% in the next three to five years with the remainder predicting ROEs of between 13% and 18% over the same period. Similarly, when asked to predict profit after tax growth, ten banks predicted a range of between 11% to 20% over both the next 12 months and for the coming three to five years.
Executive summary
Operations and technology
Performance
Regulatory compliance and risk

2011 Edition 9
Risk management is maturing, but skills gaps remain
Participants expressed confidence in the robustness of South African banks’ risk management systems. One foreign bank cited South African banks’ sixth place in the World Economic Forum’s 2010 global ranking of bank “soundness”.
However, respondents highlighted skills shortage as a problem, putting risk management understanding at the top of the list. Furthermore, several domestic banks expressed concerns over the quantitative aptitudes of new entrants.
The competitive landscape is evolving
A number of new players are expected to enter the market. Locally, the Postbank was cited as a competitor for the future. Banks also believe that competition at the lower end of the market will continue as Capitec and African Bank continue to grow.
South Africa is seen as the gateway to Sub-Saharan Africa and as a result,
the ‘return of foreign banks’ was highlighted by several participants as a key future development. This is a reversal of the sentiment expressed by participants two years ago. Respondents also believe that some foreign banks still have an appetite for major investments in South African banks, despite HSBC’s aborted interest in Nedbank.
Market dynamics are changing
The importance of home loans to respondents has dropped when compared to previous years. This is possibly as a result of increased funding costs, heavy losses suffered during the economic downturn and the administrative burden placed on banks to collect overdue accounts following the introduction of the National Credit Act (NCA).
There have also been other marked changes over the last two years; most
notably in retail banking, where respondents note that competition has increased and that they have made significant changes to strategy.
Corporate and investment banking and trading, which saw a drop in the levels of perceived competition in 2009, have rebounded strongly; 88% of the respondents view it as intensively competitive.
Executive summary
People and remuneration
Competitor landscape

10 2011 Edition
2011 2009 2007 2005
Corporate Banking Standard Bank Standard Bank Standard Bank Standard Bank
BEE Deals FirstRand (RMB) FirstRand (RMB) FirstRand (RMB) FirstRand (RMB)
Listings FirstRand (RMB) FirstRand (RMB) Standard Bank FirstRand (RMB)
Mergers and Acquisitions Deutsche Bank FirstRand (RMB) FirstRand (RMB) JP Morgan Chase
Foreign Exchange Trading Standard Bank Standard Bank Standard Bank Standard Bank
Derivatives Standard Bank Standard Bank * *
Fixed Income Standard Bank Standard Bank * *
Money Markets Standard Bank Standard Bank Standard Bank Standard Bank
Equities FirstRand (RMB Morgan Stanley)
Standard Bank * *
Commodities Standard Bank Standard Bank * *
Structured Finance FirstRand (RMB) FirstRand (RMB) FirstRand (RMB) FirstRand (RMB)
Brokerage – Institutional Deutsche Bank Deutsche Bank Deutsche Bank Deutsche Bank
Brokerage – Retail Standard Bank Standard Bank Investec *
Retail Lending and Deposits ABSA ABSA and Standard Bank
ABSA ABSA
Wealth Management Investec * * *
Retail Mortgages – Home Loans ABSA ABSA ABSA ABSA
Vehicle and Asset Financing FirstRand (WesBank) FirstRand (WesBank)
FirstRand (WesBank)
FirstRand (WesBank)
Internet Banking FirstRand (FNB) Standard Bank ABSA/ Standard Bank
ABSA
Private Banking Investec Investec Investec Investec
Micro Lending Capitec African Bank African Bank African Bank
Commercial Property Finance Investec Nedbank Investec ABSA
Trade Finance Standard Bank Standard Bank Standard Bank *
Unsecured Personal Lending African Bank * * *
* Not rated in these years
The top ranked bank/financial institution in each category based on peer ranking is shown in the table below (comparisons are shown with the rankings for the two previous reports). In 2011 there are two new categories, wealth management and unsecured personal lending. It was decided to exclude the private equity category from the peer review in 2011 given that only a few banks remain active in this segment. The prime
broking category was also omitted this year because the voting was inconclusive.
As in the past, participants were asked, for their opinion of the top three banks in terms of success – which does not necessarily only include market share, but also performance, momentum etc. Participants were not permitted to vote for their own institution.
Executive summary
Peer review

2011 Edition 11
Number of retail customers
In this report the Big Four banks said they have 34.5million accounts and the number would grow by 16% to 40m by 2014.
Number of employees
The 20 participating banks employ 149,612 people and expect this number to grow by 4.3% to 156,000 by 2014.
The Big Four banks employ 128,000 people and anticipate growth to reach 131,000 by 2014.
Ten of the 11 foreign banks expected to increase their number of employees by 2014. However, the employment growth among the foreign banks is modest.
In 2009 the Big Four banks recorded 122,000 employees and expected a total of 125,000 by 2012.
Number of branches
The Big Four banks have 2,740 branches and expect an increase of 6.2% to 2,910 branches by 2014.
In the 2009 report the Big Four banks reported that they had 2,786 branches.
Number of ATMs
The Big Four banks have 21,000 ATMs and will expand their network to 22,500 ATMs by 2014.
In the 2009 survey they forecast that they would reach a combined total of 22,500 by 2012.
The network expansion has therefore not been as aggressive as predicted two years ago.
Background profile
Executive summary

12 2011 Edition
Strategy and markets
2011 Edition 13
Below is a list of the most important developments cited by the participants:
• Change in the competitivelandscape. A number of new playersare expected to enter the market,including Postbank and severalforeign banks. Mobile banking isdeveloping and gaining momentum,as in the case of m-pesa in Kenya.Capitec and African Bank includinga number of retailers, are becomingmore serious players.
• A small domestic bank believes thestronghold of the Big Four banks isloosening and being eroded at thebottom end of the market by Capitecand African Bank.
• Basel III and its application in theSouth African economy was widelymentioned as a major change. Theimpact on certain asset classes,such as mortgage finance, was citedfrequently. Participants debatedhow this might affect an emergingmarket such as South Africa.
• Many participants expect increasedregulation, driven by both externalforces as a result of the financialcrisis and internal forces reflectingthe influence of the labour unionson the government.
• Margin compression is anticipatedto continue in the retail market.
• Exchange controls are expected tobe further relaxed.
• The ‘return of the foreign banks’was highlighted by severalparticipants.
• The implementation of the debtreview process provisions under theNCA was viewed by one participantas highly dysfunctional. The resultof the inability of credit providers torecover losses means that prices willrise and credit will become moredifficult to obtain in the future.
Q In your opinion, what are the most important changes/developments taking place in your financial services market?
Strategy and markets

14 2011 Edition
Q Identify three major criticisms of the South African banking industry at present
The participants highlighted a number of criticisms about their industry:
• One Big Four bank acknowledgedthat all the banks had over extendedtheir retail lending in 2007/2008and when the economy turned in2008, they suffered because of theirpast pricing strategy.
• Mismatching of assets andliabilities. Every emerging markethas a misalignment of home loansfunded by short-term deposits.
• A smaller domestic bank expressedthe opinion that in today’s financialenvironment, it would be impossibleto start a new bank in South Africa.
• A foreign bank criticised thedomestic banks because of theirinability to address cost structures.One domestic bank contended thatcosts are growing at a faster pacethan revenue.
• A foreign bank believes that thedomestic banks need to do more toservice the needs of entrepreneursand the SME sector.
• A domestic bank failed to findany criticisms and said the banksare well run and had performedwell during the crisis. A foreignbank echoed this sentiment andmentioned that the 2010 WorldEconomic Forum’s ‘soundness’indicator ranked South Africanbanks in sixth place.
• A domestic bank criticised thecountry’s rigid labour legislationthat makes it difficult to lay off staff.
• A foreign bank criticised theinflexibility in the financial system,including the existence of one stockexchange and high bank charges.
• A foreign bank highlighted theoverall lack of skills in the industryand said this means recruiting isdifficult.
Strategy and markets

2011 Edition 15
Q Will Basel III change your business model?
Twelve banks believe that Basel III will change their business model. Only one domestic bank contended that it would not impact their business model.
The most common opinion on Basel III revolved around the future funding model. One Big Four bank stressed that South Africa had a small savings pool and this would mean it would be difficult to satisfy the Net Stable Funding Ratio (NSFR). Another Big Four bank argued that future business would grow at a slower pace and the home loan market would be negatively impacted.
A smaller domestic bank expressed concern about the increased competition among banks for deposits, which will impact funding costs.
A foreign bank noted that the need to comply with head office instructions would have a trickle down effect on the South African market.
A domestic bank which operates a bancassurance model noted that they would also need to consider Solvency II. Solvency II is often called ‘Baselfor insurers’ and covers the amount of capital needed by an insurer, governance, risk management and disclosure requirements.
Basel III ‘to squeeze bank profits’
Bank profits will be hit hard by the new Basel III international banking regulations, said Absa CEO Maria Ramos.
The rules, set up by the Basel Committee on Banking Supervision – SA is a member – stipulate capitalratio requirements for banks to cushion themselves against potential losses such as those incurred in 2008 at the height of the global credit crisis.
Speaking at Absa’s results presentation this week, Ramos said liquidity requirements “will continue to be a challenge to SA banks given the structure of our markets”.
Sasha Naryshkine, an analyst at Vestact, said the capital rules are “more onerous now, whereas prior the rules were a bit too lax”.
The Banking Association of SA is in discussions with the Treasury and the SA Reserve Bank on how to phase in the new rules that apply to SA banks.
Cas Coovadia, the banking association’s managing director, said it was unfair to expect developing economies to adopt rules that would detract from their economic growth “simply because America and Europe have screwed up”.
Fitch Ratings, which has a stable outlook for SA banks in 2011, said that from a capital adequacy point of view, the sector appears well placed for Basel III. However, it said there may be a need for structural reform of SA’s funding markets to enable the sector to meet the enhanced liquidity requirements
Source: www.timeslive.co.za 20 February, 2011
Strategy and markets

16 2011 Edition
Two thirds of respondents believe that there is a place for bancassurance in South Africa.
Several banks commented that it depends on how you define the bancassurance model. Is it defined as a bank with insurance subsidiaries, or a model where the bank dominates the insurance partner, or vice versa?
Success differs across these different structures.
Q Do you believe that there is a place in the market for bancassurance model?
Q If you answered yes to the question above, what do you believe are the key benefits to retain the bancassurance model?
Several participants expressed the opinion that bancassurance works well for simple generic insurance products that could be efficiently distributed through the branch network. A domestic bank argued against the sale of proprietary products and suggested that it is important to offer a best of breed product range.
A foreign bank suggested that it only works if the clients perceive additional benefits.
A small domestic bank indicated that credit insurance sales are a very important part of their business mix.
One Big Four bank cited the collaboration between Banco Santander and Zurich Insurance in Latin America. In February 2011 these players signed a 25 year strategic distribution arrangement which provides Zurich access to 5,600 branches and 36m customers in Latin America.
Several participants mentioned the ‘unbundling’ of two of FirstRand’s insurance subsidiaries; Outsurance and Momentum.
No Yes
Strategy and markets

2011 Edition 17
In considering developments and drivers relating to electronic banking, participants emphasised that the market could be subdivided into the corporate and commercial segment and the retail segment.
At the corporate level, it will facilitate a lowering of costs and improved efficiency.
At the retail level, mobile banking has gained increased significance.
Two Big Four banks stressed that mobile banking activity doubled in 2010.
Several participants cited the success of m-pesa in Kenya and recognised the activity of Surebank and Wizzit (both divisions of South African Bank of Athens).
Visa buys SA’s Fundamo for $110m
Global payments giant Visa is buying Cape Town-based Fundamo, a mobile payments company focused on emerging markets, for $110m in cash.
Fundamo is privately held by a group of SA investors, including Sanlam, Remgro and HBD Venture Capital, founded by billionaire Mark Shuttleworth, the man behind the popular Ubuntu Linux operating system.
Visa says the deal will help “accelerate the execution” of its global strategy, announced last month, to provide the “next generation of payments solutions, allowing consumers to transact wherever and whenever they choose, using a card, computer or mobile device”.
Fundamo has more than 50 active mobile financial services deployments in about 40 countries, including 27 countries in Africa, Asia and the Middle East.
Fundamo CEO Hannes van Rensburg and his management team will continue to run the company after conclusion of the deal. Prior to the formation of Fundamo, Van Rensburg was chief information officer at Sanlam. He is also one of the founders of the Cape IT Initiative.
In announcing the deal, Visa says that although “mobile financial services in developing markets are growing and have become a core service offered by many mobile operators and financial institutions, these services are often limited in scalability and reach and not interoperable with other regional payment services on global payments networks”.
“Fundamo’s platform enables the delivery of mobile financial services to unbanked and under-banked consumers around the world — including person-to-person payment, airtime top-up, bill payment and branchless banking services,” it says. “The combined Visa-Fundamo platform will add enhanced functionality and new services to existing mobile financial services subscribers across Africa, Asia and Latin America.”
Visa says the deal will “expand the utility of closed-loop systems, enable them to be interoperable, make financial services available to more consumers and offer merchants access to new customers”.
“This has the potential to connect billions of unbanked and under-banked consumers to each other and to the global economy.” — Staff reporter, TechCentral. 9 June 2011
Q What are the key drivers for electronic banking channels/products (e.g. mobile banking and e-wallet) in the next three years?
Strategy and markets

18 2011 Edition
Strategy and markets
No
Yes
No
Yes
Q Do you expect any emergence of new banks (new local or foreign banks) in South Africa over the next three years?
Local bank
Foreign bank
The majority of participants are pessimistic on the emergence of new domestic banks. The only exception to this was the new Postbank. A Big Four bank predicts that there will be more community banks emerging.
The participants strongly agreed that there will be more foreign banks. This is a reversal of the opinion expressed in 2009, when foreign banks were said to be reviewing their presence. One factor that has encouraged a more positive outlook is the increased importance of Africa as a financial market and the leveraging of Johannesburg as the gateway.
The Indian and Chinese bank participants also indicated that new entrants can be expected from these markets.

2011 Edition 19
Postbank to be a fully fledged retail bank
Postbank is preparing to wade into the muddy waters of banking competition after obtaining legislative approval to operate as a retail bank. The state-owned bank will come up against the Big Four and smaller banks that are engaged in a turf war for customers, particularly at the lower end of the market segment. The government wants it to increase financial inclusion, particularly for South Africans who still have no access to banking facilities. According to the latest Finscope survey 76,5% of South African adults were financially included last year, that is, using some financial product or service from either the formal or informal sectors, compared to 73,9% in 2009 and 76,4% in 2008. Analysts say the big banks could struggle to find a viable formula to penetrate the unbanked market, given the pressure on them to maximise earnings and deliver shareholder value on a low cost base.
Postbank chief operating officer John Wentzel says he relishes the prospect of entering the retail banking sector despite the tough, competitive environment. This is because Postbank already has is own strengths over rivals, among them a customer base of more than 6.2 million. This ranks it among the top six banks, though its product menu excludes such offerings as lending and merchant banking.
The latest financial figures show it has a deposit base of about R6.4bn and customer liabilities of R4.5bn. “So we are on a sound financial footing,” Mr Wentzel says. Its transactional fees for such services as savings and investment accounts are also some of the lowest in the market, Mr Wentzel says. “We also have got
over 40% market share in Mzansi accounts and we have shown that we can grab market share even on an unequal footing. “So this is not a little company and we can safely say we have got enough customers to compete with the Big Four banks.”
Postbank will use the Post Office infrastructure of more than 2400 branches to reach and grow its customer base. More than half these branches target the underserved and rural markets. Mr Wentzel says the coast is clear now that Parliament has approved the South African Postbank Limited Bill, which paves the way for the corporatisation of Postbank. At present operating as a division of the South African Post Office, Postbank will convert into a fully fledged retail bank with its own board, executive management and governance structure.
He says it should start operating as a retail bank by next year once a banking licence has been issued, and that this new journey will not be without its own challenges, key among them governance and risk management issues, in addition to ensuring a strong capital base. “We have to first go through the formal process of applying for a banking licence from the Reserve Bank and, before that happens, there are a number of processes that have to be completed,” he says. “I am hoping that by the end of the year, we will be able to submit our application for a banking licence to the central bank for their consideration. “Our hope is that by early 2012 we will be able to start operating as a retail bank.” Postbank will have to introduce risk management and customer deposit protection systems that satisfy the central bank’s requirements, he says. It will also have to demonstrate it has
appointed “office bearers who are fit and proper” to manage its affairs and operations.
Mr Wentzel says Postbank’s banking infrastructure, including IT systems, will be key to ensuring a robust and uninterrupted customer service. He estimates that R750m could be invested in IT infrastructure in the next 12 to 24 months. More experienced staff will be recruited, while employees are being reoriented and trained to equip them with the technical and soft skills needed to run an efficient retail bank, he says.
Source: www.bankmonitor.co.za 12 January 2011
Strategy and markets

20 2011 Edition
The participants unanimously agreed that there will be further foreign bank investments over the next three years.
Participants frequently cited HSBC and Standard Chartered Bank and the former’s withdrawal of interest in Nedbank in the past year.
More Chinese and Indian banks are expected to enter the market while both Portuguese and Spanish banks were also mentioned; although the latter two countries are going through a difficult period domestically and it is questionable if banks from these countries are in acquisition mode.
Some foreign banks that already have a presence are expected to increase their levels of involvement and open or widen their activities in Sub-Saharan Africa.
Q Do you expect any further foreign bank investments in the South African banks over the next three years?
Strategy and markets
Q Are there special opportunities for South African banks to invest in Africa given the international turmoil?
The participants agree that there are many special opportunities for South African banks in Africa. Interestingly, one bank disagreed with this position, they have examined some neighbouring markets and concluded that this was not the right time to enter these markets.
One Big Four bank held the opinion that Africa can match the BRICS countries and offer significant opportunities. Another Big Four bank noted the need for the banks to service their clients in these emerging markets. One participant highlighted the following markets as possible investment opportunities: Angola, Ghana, Mozambique, Nigeria, Tanzania and Zambia.
The foreign banks also endorsed the optimism over Sub-Saharan Africa although several foreign banks suggested they were focussing on the SADC countries.
Two domestic banks cautioned that the movement into Africa is not easy. They noted that while many banking assets are for sale, the process continued to be challenging and many banks remain expensive.

2011 Edition 21
Q Please rank the top three considerations when investing in a bank in Africa
0 5 10 15 20 25 30
Number of branches & ATMs
Product offerings
Number of exiting bankingclients of entity
Quality of local managementand staff
Parent Company influence
Score
The participants identified the top three considerations when investing in a bank in Africa as follows:
Strategy and markets
• Number of banking clients ofthe acquired bank. Acquisitionof existing operations with acorporate/commercial and retailclient base is important as theacquiring bank hopes to gain criticalmass.
In fourth place the participants placed the product offerings of the acquired bank. Surprisingly, the number of branches and ATMs received a very low score. Given the cost involved in increasing these, we would have expected a higher score.
• Parent company influence – meaningthe ability of the acquiring bankto leverage its brand, network andmanagement.
• Quality of local managementand staff. The acquiring banks’management is often stretched asthey move into multiple markets inSub-Saharan Africa. As a result, itis critical to acquire a bank that hasgood quality management and staff.This is frequently a real challenge.

22 2011 Edition
Q Please rank the top three obstacles when investing in a bank in Africa
0 1 2 3 4 5
Shareholder opposition
Population backlash against foreign presence in the local market
Unexpected costs
Cultural issues/conflicts
Political interference/opposition
Inadequate leadership
Conflicting regulatory requirements
Score
Q Where do you see future growth over the next year outside Africa in other emerging markets?
South America
Middle East
Asia
The biggest obstacle for banks investing in the rest of Africa was identified as conflicting regulatory requirements. Additional obstacles with similarly high were: inadequate leadership, political interference or opposition, cultural issues and unexpected costs.
One Big Four bank commented that there is often a danger that acquiring banks look at Sub-Saharan African as a homogeneous mass. In reality it is a patchwork of contrasting financial development and opportunities.
Ten banks answered the question on future growth beyond Africa. They were almost equally divided between Asia (including India), Middle East and South America.
Strategy and markets

2011 Edition 23
0 10 20 30 40 50 60 70
Capital markets activity
Labour legislation
Mergers/Consolidation
Recruitment of good personnel
Demographics
Globalisation
Cost to income ratio
Regulation and reporting
Funding constraints
Investment in the rest of Africa
Political or Government intervention
Pace of Technology change
Economic cycle
Basel III and liquidity measures
Based on responses from 17 banksScore
Q What are the major drivers of change in the Banking industry today? Please rank the top five in order of importance.
The most important driver of change in the banking industry was identified as Basel III.
The new regulations and policies envisaged in Basel III are the response of the G20 countries to the 2008 financial crisis.
Media speculation suggests that Basel III will be phased in over a ten year period, commencing in 2013. South African banks have already expressed concern over the onerous liquidity requirements and how these requirements can be achieved in a developing economy such as South Africa.
The second most important driver of change after Basel III was economic cycle. Technology change was placed in third position. Political and Government intervention and investments in the rest of Africa in fourth position.
Strategy and markets

24 2011 Edition
-0.6 -0.3 0.0 0.3 0.6 0.9 1.2 1.5
Insurance of business risks
Rogue Trader
Banking for the previously unbanked
Valuation and pricing of financial instruments
Business continuity management
National Credit Act
Financial Services Charter
Increased risk of loan defaults - Retail
Market volatility
Complexity and scrutiny of structured products including derivatives
Appropriate staff incentive schemes
Staff turnover rate
Increased risk of loan defaults - Corporate
Relevance of regulatory reporting
Low cost competitors
Liquidity of banks
Legal Risks (because of new Companies Act)
Internet security risks
Fee and Service Charge Erosion
Data security
Capital management / the future need to hold more capital
Recruiting/Training Front Office Staff
Risk management techniques
Introducing New Information Technology
Client retention
Availability of key skills
Service quality
Addressing new compliance & regulations (Basel III and IFRS)
Duration / lengthening of funding profile
Profit Performance
Improving Revenue Growth
Increasingly important issue
Q Below is a list of bank related pressing issues? Can you rate them in importancefrom 1 to 5?
The participants were asked to score 31 different pressing issues on a scale of 1 to 5, where 5 represented greatest importance. The centre axis, 0, represents 3 on the 5 point scale, those to the right are ‘most pressing’ and range from 3 to 5.
The most pressing issue was improving revenue growth. In both 2007 and 2009, improving revenue growth was in third position. In 2009 it was preceded by service quality and profit performance.
In 2011, profit performance falls to second place, while service quality is in fifth position.
A new issue in 2011, the duration and lengthening of the funding profile, is in third position. Addressing new compliance and regulations has moved from tenth position in 2009, to fourth position this year.
Strategy and markets

2011 Edition 25
-1.0 -0.5 0.0 0.5 1.0 1.5 2.0
Insurance of business risks
Complexity and scrutiny of structured products including derivatives
Business continuity management
Valuation and pricing of financial instruments
Increased risk of loan defaults - Retail
Financial Services Charter
Banking for the previously unbanked
Rogue TraderRelevance of regulatory reporting
Staff turnover rate
National Credit Act
Market volatility
Appropriate staff incentive schemes
Increased risk of loan defaults - Corporate
Legal Risks (because of new Companies Act)
Risk management techniques
Liquidity of banks
Fee and Service Charge Erosion
Data security
Recruiting/Training Front Office Staff
Low cost competitors
Capital management / the future need to hold more capital
Internet security risks
Client retention
Duration / lengthening of funding profile
Introducing New Information Technology
Availability of key skills
Service quality
Addressing new compliance & regulations (Basel III and IFRS)
Profit Performance
Improving Revenue Growth
Increasingly pressing issue
Based on responses from 7 domestic and 8 foreign banks
Domestic banks
Foreign banks
Pressing issues: Domestic versus foreign banks
A comparison between the responses from the domestic and foreign banks displays both similarities and differences.
Revenue growth is a priority for both groups. Some issues, such as profit performance, service quality, availability of key skills and new information technology, all received higher scores from the domestic banks.
The foreign banks assigned higher scores to compliance and regulatory constraints and risk management techniques than their domestic counterparts.
Strategy and markets

26 2011 Edition
Mobile Banking Usage Jumps in South Africa
Cellphone banking has surged in the past year, as South African consumers gain confidence in their handheld devices as a tool for both communications and efficiency.
Among urban cellphone users, 44% now use cellphone banking services, compared to 27% a year earlier, according to the Mobility 2011 research project conducted by World Wide Worx and backed by First National Bank.
In smaller centres and towns, 27% now use cellphone banking, suggesting that rural areas lag urban users by about a year in take-up of these services.
In total, 37% of South Africans in urban and rural areas aged 16 and above now use cellphone banking. “Our predominant customer base resides within the mainstream market: 65% of FNB’s 2.6 million customer base earns less than R100 000 per annum and are between the ages of 18 – 40 years old.
Cellphone Banking is becoming the preferred alternative as people across the board are driven by the ‘anywhere, anytime’ concept of banking.” says Ravesh Ramlakan, CEO FNB Cellphone Banking Solutions
Usage of cellphone banking peaks in the 26-34 age group, at 41%, and drops to 11% in the over-45 group. Male usage far outpaces that of females, at 56% against 44%.
While education is a factor in usage of cellphone banking, with 43% of cellphone banking users having matric, and 38% with post-matric qualifications, the biggest proportion of cellphone banking users – no less than 27% – earn less than a R,1000 a month. The vast majority of cellphone banking customers still use the basic services, such as balance enquiries (78%) and notifications (58%).
However, transactional services are for the first time major components of cellphone banking services, with half of respondents buying airtime, 24% paying accounts, and 17% transferring funds between accounts.
Emerging Mobile commerce transactions such as purchases and sending money to another persons’ cellphone are also appearing on the radar screen for the first time. 12% of cellphone banking users also send money to other individuals, and 11% make a purchase via their cellphone.
Source: Cellular News, 3 February 2011
Strategy and markets

2011 Edition 27
Regulatory compliance and risk

28 2011 Edition
Regulatory compliance and risk
No
Yes
Q Do you believe South African banks’ risk management systems are sufficiently robust?
Q In which areas could there be improvements in your banks’ risk management systems?
Responding to the question on possible areas of improvement the following comments were offered:
• Cloning of cards and card fraud is abig issue;
• Liquidity management;
• Improve respect for compliance;
• Credit scoring models;
• Price risk, liquidity risk, portfolioconcentration risk and over-concentration on large corporates.;and
• Operational risk.
The participants scored the robustness of South African banks’ risk management systems very positively.
Within the group of 20 banks only one European bank recorded a negative opinion.
Another bank offered the opinion that South African banks have entered the consumer credit market too hastily.
Q What do you see as the most likely steps South African banks will take to comply with Basel III Net Stable Funding Ratio (‘NSFR’) and Liquidity Coverage Ratio (‘LCR’)?
There was a general consensus among the participants that the NSFR will require adaption to local market conditions.
Participants recognised the need to lengthen funding and to issue paper with longer term maturities. One bank described the need to change the architecture of the savings system.
A smaller domestic bank commented that small banks will need to increase utilisation of capital markets to lock in long term funding. They questioned whether adequate long-term funding was available and predicted intense competition to tap whatever might be available.

2011 Edition 29
EU states urge flexibility in Basel rules
Brussels is being urged to give European Union countries more flexibility when it tries to implement the new Basel III rules on banking capital across the 27-country bloc later this year.
Seven member states – including the UK – have written to EU internal market commissioner Michel Barnier, warning about the potential downside of using a “regulation” to implement the global rules adopted late last year by the Basel Committee on Banking Supervision.
Designed to improve the stability of the banking system, the Basel III standards will increase the amount and quality of the capital that banks have to hold against potential losses.
Regulations – unlike directives – give member states limited scope for tailoring new rules to domestic circumstances, and are the most binding form of EU legislation. In their letter, the countries warn that “a regulation would prevent member states from increasing or varying pillar one requirements such as capital levels or risk weights even when a specific situation justified it”.
This, they point out, was not the intention of the Basel III agreement, which they say was aimed at setting minimum capital requirements, rather than maximum levels. The countries add that the fixed approach is not acceptable to them.
They argue that some countries may want to set higher capital requirements “in specific circumstances to protect financial stability”, and that the rules need to make allowances for the different levels of importance of the financial sectors in different economies and the varying sizes of banking sectors relative to GDP across member states.
“In addition to this, another reason for not restricting national authorities’ ability to set higher standards is the need to develop a macro-prudential approach for the regulation of the financial system,” they add.
The eight countries also claim that member states should have some flexibility to implement the new Basel III rules more quickly if they wish to do so. “If not, unintended consequences could arise. For example, it would be very unfortunate if some EU banks reduced their capital after January 1, 2013, and then are required to gradually increase it again to meet the January 1, 2019 requirements, without member states being able to prohibit this ill-judged behaviour through national legislation”.
States signing the letter are Bulgaria, Lithuania, Spain, Sweden, Estonia, Slovakia and the UK.
Brussels is currently finalising its proposals and is expected to unveil the draft legislation in July.
However, in their letter which is also addressed to EU economics and monetary affairs commissioner Olli Rehn, the states acknowledge the aim of ensuring that the new rules are “applied across member states in a uniform and timely manner” – something which the regulation would achieve. Even so, they ask the commissioners to reconsider the existing draft text in the light of their remarks.
A commission official said that, at this stage, the intention was to apply harmonised (pillar one) rules to everybody in the same way, except for a few explicitly specified cases. “We believe this is essential to maintain a level playing-field in the EU’s single market,” she added.
But she stressed that it was not the intention to prevent any supervisor from requiring higher capital requirements for a particular bank or range of banks if risk profiles demanded, and that, technically, this could be done by pillar two measures.
EU officials believe that using a regulation will make for consistent implementation of the new Basel rules across the EU, while using a more flexible directive could make this very problematic.
Source: Financial Times, 25 May 2011
Regulatory compliance and risk

30 2011 Edition
Q Do you believe that Basel III will enhance the banking risk management processes? (Yes/No)
Don't know
No
Yes
Based on 19 participants
Q How robust are your credit models?
The participants provided a positive response to their assessment on the ‘robustness of credit models.’
Eighteen banks answered the question and assigned an average score of 4.1 out of 5. This score included five banks that awarded the maximum 5 out of 5 score.
One banker commented that if the credit models were too conservative, the banks would be reluctant to extend credit.
Fifteen participants believe that Basel III will further enhance risk management processes.
However, several banks cautioned that special exceptions will need to be made for South Africa when applying some of the rules. In that respect, a domestic bank qualified its, positive response by suggesting that Basel III’s success will depend on its application.
A foreign bank contended it would increase costs but questioned whether it would decrease risk.
Regulatory compliance and risk

2011 Edition 31
All local banks believe they will comply with King III by the end of 2011. However, several participants noted that compliance means that they may have to use the ‘comply or explain’ exemption to meet the 2011 deadline.
The three banks that responded negatively were all foreign banks.
The participants identified external fraud as the most likely source of operational risk in the banking industry in terms of the scale of losses.
Three of the Big Four banks awarded the maximum score of 5 to this factor. It was placed just ahead of system failures.
Finally, both internal fraud and process management scored 3 on a scale of 1 to 5.
Q In the context of operational risk of the banking industry, can you estimate, on a scale of 1 to 5, the areas giving rise to the most significant losses?
No
Yes
Q Do you believe you will be fully compliant with King III requirements by the end of 2011?
Regulatory compliance and risk

32 2011 Edition
King III
King III has broadened the scope of corporate governance in South Africa with its core philosophy revolving around leadership, sustainability and corporate citizenship.
These key principles are given prominence:
Good governance is essentially about effective leadership. Leaders need to define strategy, provide direction and establish the ethics and values that will influence and guide practices and behaviour with regard to sustainability performance.
Sustainability is now the primary moral and economic imperative and it is one of the most important sources of both opportunities and risks for businesses. Nature, society, and business are interconnected in complex ways that need to be
understood by decision makers. Incremental changes towards sustainability are not sufficient – we need a fundamental shift in the way companies and directors act and organise themselves.
Innovation, fairness, and collaboration are key aspects of any transition to sustainability – innovation provides new ways of doing things, including profitable responses to sustainability. Fairness is vital because social injustice is unsustainable and collaboration is often a prerequisite for large-scale change.
Social transformation and redress is important and needs to be integrated within the broader transition to sustainability. Integrating sustainability and social transformation in a strategic and
coherent manner will give rise to greater opportunities, efficiencies, and benefits, for both the company and society.
King II required companies to implement sustainability reporting as a core aspect of corporate governance. Since 2002, sustainability reporting has become a widely accepted practice and South Africa is an emerging market leader in the field. However, sustainability reporting is in need of renewal in order to respond to:
The lingering trust deficit among civil society of the intentions and practices of big business Concerns among business decision makers that sustainability reporting is not fulfilling their expectations in a cost-effective manner.
Source: PWC South Africa – 2011
Regulatory compliance and risk

2011 Edition 33
No
Yes
No
Yes
No
Yes
No
Yes
No
Yes
SMEturnover <R25m
Small businessturnover R25m – R50m
Commercialturnover R50m – R200m
Medium corporateturnover R200m – R400m
Large corporateturnover >R400m
Based on responses from 15 banks
Q In terms of the new Companies Act, a number of unlisted companies will no longer be subject to an annual audit (those with a score of less than 750, with the score being determined by turnover, staff, stakeholders and unsecured debt). From a credit risk management perspective, would you be satisfied if the following companies are no longer subject to an audit?
As the charts below indicate, over three quarters of respondents disagree with this change for commercial, medium corporate and large corporates.
In the case of small businesses with turnover of R25m to R50m the majority still favour an audit. Even for SMEs with a turnover below R25m, the majority still support the need for an audit.
Regulatory compliance and risk

34 2011 Edition
Q What other provisions of the new Companies Act concern you from a risk management perspective?
0.0 0.5 1.0 1.5 2.0 2.5 3.0 3.5 4.0
Insider trading
Debit card
Misappropriation of assets/theft
Fraudulent financial reporting/ accounting manipulation
Bribery and corruption
Unauthorised securities trading/ personal account trading
Credit card
Score
Q In the context of the banking industry please rank the types of fraud that you believe have been perpetrated in the past financial year according to size and contribution to the overall fraud losses: (scale 1 to 5, where 5 represents the greatest loss)
A domestic bank complimented the new Companies Act and said it simplified many issues although it believed the relaxation of audit requirements was a problem.
A Big Four bank cited the Companies Act and the National Credit Act and the overall handling of the debt issue.
Another domestic bank believed the handling of business rescue was a step forward but much depended on the quality of people conducting the rescues.
A smaller domestic bank argued that the high level of protection envisaged would prejudice the lender.
Credit card fraud was considered the most prevalent type of fraud experienced by the banks over the last year.
This was followed by anti-competitive behaviour including unauthorised securities trading and personal account trading.
The remaining types of fraud scored below 3 suggesting they were deemed to be less prevalent. Although debit card fraud was placed in sixth position, several banks indicated it was becoming more prevalent.
Regulatory compliance and risk

2011 Edition 35
Q Do you support the concept of deposit insurance? Yes/No? What would you consider to be the appropriate level of deposit insurance?
Deposit level Number of banks
Up to R50,000 3
R50k to R100k 5
R100k to R500k 3
>R500k 2 NoYes
20072005
2009
Neutral
2011
Support for the concept of deposit insurance remains strong among the banks. Thirteen of the 20 reporting banks support the concept.
One of the Big Four banks argued that it was unnecessary. Another Big Four bank asked if smaller banks would pay relatively more?
Eight of the 13 banks believe the level of deposits insured should not exceed R100,000 and three banks felt the amount should be below R50,000.
In 2009, eight banks also believed the amount should be below R100,000. Based on responses from 20 banks in 2011, 22 banks in 2009, 20 banks in 2007 and 16 banks in 2005.
Regulatory compliance and risk

36 2011 Edition
Operations and technology

2011 Edition 37
Q Do you believe that ‘traditional’ branches will decrease/increase in the next three years? By what percentage?
Only eight banks responded to this question. Six banks believe ‘traditional’ branches will decline in number over the next three years. Only one bank suggested there might be an increase.
One Big Four Bank said that it will marginally (less than 5%) increase ‘traditional’ branches over the next three years.
Seven banks unanimously agreed that there will be an increase in new outlets or ‘sales centres’ rather than branches.
One small domestic bank indicated that they plan to expand ‘segment driven branches’. These branches are characterised as cash and transaction free, with a focus on the distribution of small loans.
Another domestic bank planned to increase its distribution outlets in association with retailers.
Only one bank provided an estimate of the rate of increase – between 5% and 10%.
Remain the same
IncreaseDecrease
Operations and technology

38 2011 Edition
Operations and Technology
Q Can you identify major technology weaknesses in the financial services industry?
The participants identified a number of technology weaknesses in the financial sector. They included:
• Implementation of 4G andinadequate internet bandwidth;
• Prevention of card fraud;
• Technology weaknesses not somuch in South Africa but rather therest of Africa;
• Prevalence of legacy systems andsystem duplication;
• Lack of integration, the need for adashboard overview;
• Business process management;
• Links to the Johannesburg StockExchange;
• International connectivity; and
• An integrated settlement methodfor mobile banking.

2011 Edition 39
Q Do you envisage any IT platform changes in the short term?
Many respondents to this question pointed out that upgrades were being made on an on-going basis.
One bank stated that it had just undertaken a ‘massive replacement’ of its core banking systems.
A small domestic bank talked about innovations in cloud computing, the move to mobile banking and an increase in outsourcing.
Many banks mentioned initiatives to increase integration across systems. Retail banks often cited the need to have a more holistic view of client relationships.
Q What will you spend over the next three years on your IT platform?
Sixteen banks provided information on their cumulative spend on IT over the next three years. There was a wide variation on the level of expenditure which reflected the nature and size of the bank. In some cases, banks had just completed a major spend and, as a result, their reduced estimates over the next three years reflected the heavy expenditure in the last couple of years.
Five banks (including the Big Four), provided an estimate of R30bn over the next three years. This total includes very sizeable estimates by two banks.
The eleven other banks that answered this question included a mix of both domestic and foreign banks. Together, they provided an estimate of R589m over the three years. Two banks within the group plan an expenditure exceeding R100m. Some of the larger foreign banks provided estimates around the R60m mark. However, this figure is difficult to discern because IT initiatives originate with Head Office and the local country head may not be aware of the full cost of the IT being updated.
No
Yes
Operations and Technology

40 2011 Edition
Performance

2011 Edition 41
Q What is your expected ROE for the next 12 months and then for three to five years?
10-12% 13-15% 16-18% 19-21% Other
10-12%
13-15%
16-18%
19-21%
Other
Next three to five years
Next 12 months
R
RR
R R
RRR
R
RRR
RR
RRR
R(30%)
(>21%)
(<10%) (all >21%)
R
R
Domestic bank
Foreign bank
The following table records the anticipated ROE (return on equity) over the next 12 months (vertical axis) and over the next three to five years (horizontal axis).
The highest levels of ROE are found in the bottom right corner, where three foreign banks anticipate ROE above 21% in both time frames.
Two domestic banks fall into the 19-21% category and are accompanied by two foreign banks.
One domestic bank expects more than 20% ROE in three to five years while another domestic bank expects ROE above 30%.
Performance
42 2011 Edition
0.5%-0.7%
0.8%-1%
1.1%-1.3%
1.3%-1.5%
Other
0.5%-0.7%
0.8%-1%
1.1%-1.3%
1.3%-1.5%
Other
Next 12 months
R
R
R
R
R
RR
RRR
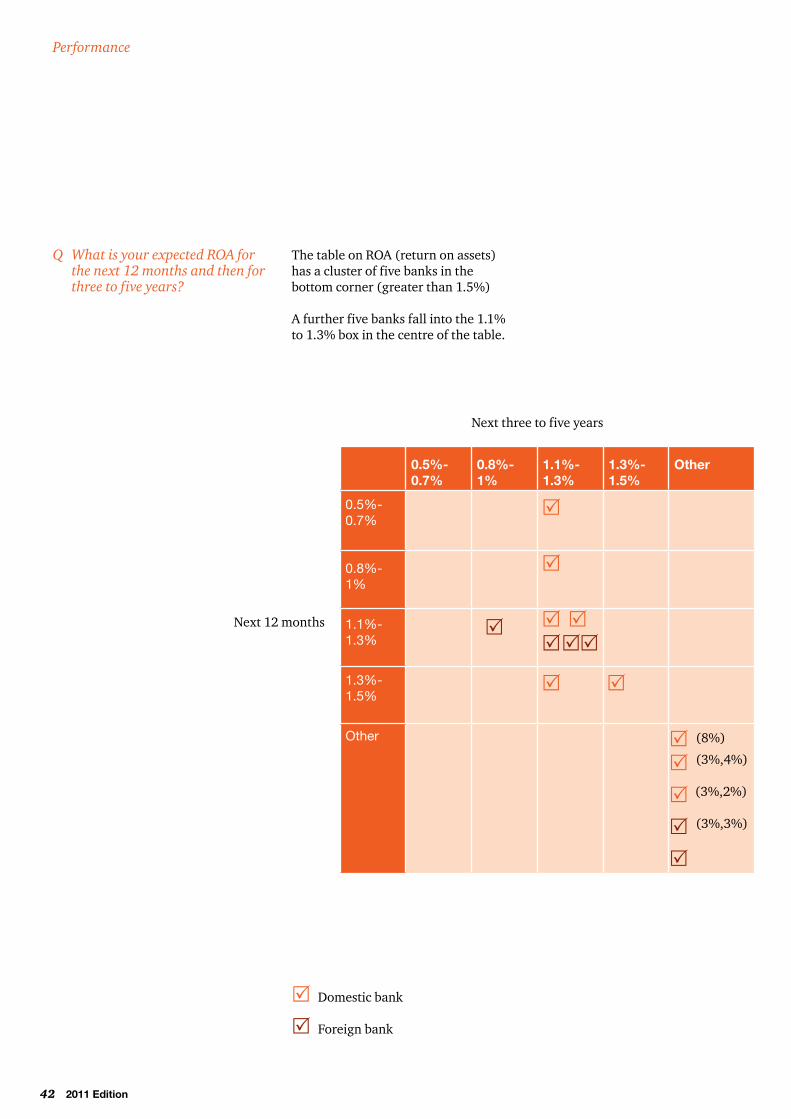
Q What is your expected ROA for the next 12 months and then for three to five years?
R
RR
R
R (3%,3%)
(8%)
(3%,4%)
(3%,2%)
R
R
Domestic bank
Foreign bank
The table on ROA (return on assets) has a cluster of five banks in the bottom corner (greater than 1.5%)
A further five banks fall into the 1.1% to 1.3% box in the centre of the table.
Performance
Next three to five years

2011 Edition 43
Q What is your expected asset growth for the next 12 months and then for three to five years?
3%-6% 7%-9% 10%-12%
Other
3%-6%
7%-9%
10%-12%
Other
Next 12 months
R
R
RR
R
RR
RR
RR
R
R
R
R
R
R
(20%,20%)(20%)
Next three to five years
(20%,15%)
(20%,20%)
(20%,25%)
ROA
ROE
Q Which ratio, ‘ROE’ or ‘ROA’ is the most important indicator for long-term investment and return considerations?
R
R
Domestic bank
Foreign bank
The respondents clearly believe that ROE is a more important indicator than ROA. Eighteen banks selected ROE versus just two banks that chose ROA. One domestic bank suggested ROA was a better measure of operational performance, while a foreign bank suggested that ROA may become more meaningful following the introduction of Basel III.
Strong asset growth is projected over the next 12 months and also for the next three to five years.
Three domestic banks and two foreign banks placed themselves in the bottom right hand corner, these banks expect annual asset growth of around 20%. A further eight banks anticipated growth above 10% per annum in the three to five year range.
Performance

44 2011 Edition
0%-5% 6%-10% 11%-15%
16%-20%
21%-25%
26%-30%
Other
0%-5%
6%-10%
11%-15%
16%-20%
21%-25%
26%-30%
Other
Next three to five years
Next 12 months
Q What is your expected profit before tax growth rate for the next 12 months and then for three to five years?
R
R
R
RR
R
R
R
RR
R
RR
(25%,25%)
(35%)
RR
R
R
Domestic bank
Foreign bank
Projection on the banks’ profit before tax growth rate results in a clustering of ten banks in the 11% to 20% range over both the next 12 months and beyond to three to five years.
An additional two foreign banks suggest that they will achieve profit before tax growth rates above 30% in both the short and medium term.
Performance

2011 Edition 45
Q In your opinion, which of the following revenue streams will show the most growth: gross interest income or non-interest income?
Equal between the two
Non-interest income
Gross interest income
Equal between the two
Non-interest income
Gross interest income
Next year
Next three to five years
The respondents hold similar views on future revenue streams over both the next year and looking out three to five years. They expect higher relative growth from non-interest income.
If interest rates increase one bank suggested this would increase interest income. But the same bank also stressed that pressures on capital will direct banks toward earning more non-interest income.
Performance

46 2011 Edition
Q Please list the top three key drivers to how the growth above will be achieved
0 5 10 15 20 25 30
Outsourcing
Restructuring
Acquisitions or mergers
Bad debt reduction
Other
Innovation in electronic banking channel
Focus on cost management
Focus on new markets
New banking products
Score
The two most important drivers of growth were identified as the introduction of new banking products and the focus on new markets. In third place is focused on cost management.
Innovation in the electronic channels is also expected to stimulate growth.
The other factor includes a diverse range of initiatives, including electronic banking in the corporate sector, growth in fee income and transactional banking for a retail bank, expanding market share and an improving economy.
Performance

2011 Edition 47
Most participants believe that they can cut costs in the 0% to 5% range but five banks think costs can be cut by 5% to 10%.
Several banks noted that they are in a growth mode and therefore believe it would be difficult to maintain their costs at the current levels.
Q In consideration of the banking industry where do you believe the greatest focus would be on cost management for the next three years? (Rank top 3)
0 5 10 15 20 25 30
Accommodation
Equipment rentals and maintenance
Marketing and advertising
Other
Professional fees
Information technology
Removal of duplication and overlap
Staff cost
Score
0
5
10
15
> 20%
10%
-20%
5% -
10%
0% -
5%
Numberof banks
Q By what percentages can you cut current operating costs?
The participants were asked to identify areas that offer the best opportunities for cost management. Their responses included reduction in staff costs, removal of duplication and overlap across bank operations and information technology.
Professional fees were also identified as an area of excess. Several banks mentioned the high level of legal fees. The other category included travel and entertainment and savings from product innovation.
Performance

48 2011 Edition
Q Over the last year what has your bank’s profits in terms of capital allocated in each area been?
R
R
Domestic bank
Foreign bank
Loss < 0%
Marginally profitable 0-10%
Profitable 10-20%
30% or more
Retail banking
Home loans
Vehicle financing
Credit cards
Unsecured personal loans
Micro finance
Private banking
Internet banking
Corporate banking
Investment banking and trading
Treasury
Commercial Prop. Finance
Stock Brokerage
Asset Mgmt & Unit trusts
Life insurance
The following table shows the distribution of profits in terms of capital allocated across 15 different lines of business.
Not all participants answered this question and responses are based on the participants involvement in each of the different lines reviewed.
Responses ranged from loss making to 30% or more returns on capital. Merchant banking and treasury showed very positive results.
Performance
R
R
R
R
R
RRRR
R R
R
R
R
R
R
R
R
R
R
R RRR R
R R
RRR
R
R
R R R
R
R
R
R
R R
R R
R RRR
R RRR R
R
R
R
RRRRR R
R RR
R
R
R R
R
RR
R RRRR R
R
R
R R
R R
R
RR
R R
R
R R RR RRR
RR R
RR
RRR RR
RRR R R

2011 Edition 49
People and remuneration

50 2011 Edition
Q Have you made any changes to your remuneration structures given the global developments and regulation in this area?
No
Yes
N/A
No Yes
No
Yes
Cash bonus changes
Equity option/shares changes
Bonus deferral mechanism changes
All the banks in this survey have made adjustments to their remuneration structure in the post-financial crisis era.
Two thirds of participants have made changes to cash bonuses, with just over half of the respondents also acknowledging changes to equity options even though such schemes were in the past and not applicable to some foreign banks.
Furthermore, about two thirds of respondents also suggested that new bonus deferral mechanisms had been introduced.
Two foreign banks mentioned deferrals that stretched out to three or four years. A European foreign bank indicated that base salaries had been increased, while another foreign bank indicated that a new method of remuneration entailed indexing of base salaries at a percentage of inflation.
People and remuneration

2011 Edition 51
0 10 20 30 40 50 60
Understanding of tax issues
Product knowledge
Ability to collaborate
Ability to lead others
Global experience
Client relationship skills
Quantitative skills
Ability to adjust to change quickly
Business experience
Understanding of risk
Based on responses from 17 banksScore
Q In which areas are you currently experiencing the greatest shortage of skills? (please rank the top five).
The most pronounced skill shortage was identified as ‘an understanding of risk’. This was followed by three skills that all scored almost identically:
• Business experience;
• Ability to adjust to change quicklyand quantitative skills; and
• Quantitative skills.
One Big Four bank believes that there is a chronic shortage of new recruits that possess quantitative and numerical skills.
A smaller domestic bank commented that South Africa continues to suffer from an ‘across the board’ skills shortage.
People and remuneration

52 2011 Edition
People and remuneration
South Africa a battleground for foreign banks
There is no visible blood on the floor, but South Africa is becoming a battleground for foreign banks fighting for deals – and for talented people to execute them successfully.
“There are far too many players hunting from the same talent pool as well as the same deal pool,” says Phryne Williams, director of Capital Assignments, a specialist financial services recruitment firm. “There is only so much deal flow going around and the number of players that are competing for that limited resource pool is growing by the month.”
This week JPMorgan Chase announced it has beefed up its team, luring two South Africa bankers from its Geneva and London offices and also poaching people from other foreign banks. “We lost critical mass with people leaving and the financial crisis. We want to be in a top-tier position in any business,” said John Coulter, Ceo of JPMorgan’s sub-Saharan Africa division. “This is a market set for increasing investment both by existing players and a number of additional new participants.”
The declared objective is climbing up South Africa’s equity sales rankings and catching up with Morgan Stanley, which in joint venture with Rand Merchant Bank has conquered a 40% share of the market this year. Damian Dolland, JPMorgan’s new head of investment banking for sub-
Saharan Africa, has been poached from Morgan Stanley.
This year, Credit Suisse officially ended its joint venture with Standard Bank after four years because they both want to control their own brokerage. The Swiss bank is now keen to grow its own business offering trading, private banking and investment banking. “The changes with Credit Suisse Standard Securities may be a hiring opportunity, but it’s also a further squeeze on already tight resources in the local market because one institution becomes two,” admits Coulter.
Other foreign players, big and small, crowd the field. BoA Merrill Lynch, Deutsche Bank, Goldman Sachs and HSBC are all trying to grow their presence. Russia’s Renaissance Capital has also aggressively been building up its business in South Africa. The situation is not sustainable, says Williams: “There is a wave of loss leaders flooding into SA all hoping for a big pay off at some stage. The question is for how long they can hold out before they lose patience and leave again. My concern is that the international banks that are coming in and growing rapidly may find that they grow tired of having to finance such a competitive risk.”
Source: www. efinancialcareers.co.za 12 November 2010

2011 Edition 53
Competitor landscape

54 2011 Edition
Competitor landscape
Q What is the level of intensity of the competition in the following markets, and how do you expect this to affect your competitive response?
Response
Moderate
Intensive
None
Light
Nochange
Minorchange
Significantoperationaland organsationalchange
Fundamentalchange instrategyandpositioning
Note: Based on responses from 8 banksShading represents greater than 20%
12% 12%64%
12%
Response
Moderate
Intensive
None
Light
Nochange
Minorchange
Significantoperationaland organsationalchange
Fundamentalchange instrategyandpositioning
Note: Based on responses from 7 banksShading represents greater than 20%
14%
30% 14%
14%
14%
14%
Response
Moderate
Intensive
None
Light
Nochange
Minorchange
Significantoperationaland organsationalchange
Fundamentalchange instrategyandpositioning
Note: Based on responses from 6 banksShading represents greater than 20%
17%
17%
33%
33%
Retail banking
Home loans
Vehicle and asset financing
The level of intensive competition in retail banks has moved up from 70% in 2009 to 88% in 2011.
Furthermore, seven of the eight reporting banks indicated that they have made significant or fundamental changes over the last year.
There seems to have been little change in the competition for vehicle financing.
Half the participants viewed it as intensive.
The majority of respondents said they have made minor or no changes.
In 2007, 100% of respondents believed home loan competition was intensive. This fell to 60% in 2009 and in 2011 it was recorded at 42%.

2011 Edition 55
Q What is the level of intensity of the competition in the following markets, and how do you expect this to affect your competitive response?
Response
Moderate
Intensive
None
Light
Nochange
Minorchange
Significantoperationaland organsationalchange
Fundamentalchange instrategyandpositioning
Note: Based on responses from 6 banksShading represents greater than 20%
17%
33%17%
33%
Response
Moderate
Intensive
None
Light
Nochange
Minorchange
Significantoperationaland organsationalchange
Fundamentalchange instrategyandpositioning
Note: Based on responses from 17 banksShading represents greater than 20%
6%
12%
35%29%
6%
6%
6%
Response
Moderate
Intensive
None
Light
Nochange
Minorchange
Significantoperationaland organsationalchange
Fundamentalchange instrategyandpositioning
Note: Based on responses from 8 banksShading represents greater than 20%
12%
12%
38%12%26%
Internet banking
Corporate banking
Investment banking and trading
Perceived competition is split 50%/50% between intensive and moderate competition.
Four banks said they have made significant changes.
In 2009, banks recorded only minor or no change.
In 2009, corporate banking appeared less competitive than in previous surveys. This trend has reversed.
In 2011, the level of intensive competition has moved from 56% to 76%.
In 2009, none of the participants said they had made fundamental changes.
In 2011 six banks claimed to have made fundamental changes from the prior year.
Investment banking and trading has experienced a rise in competition. Only one bank considered competition to be moderate.
In 2009, six banks said it was either moderate or light.
Five banks have made significant or fundamental changes to their strategies because this area has become more contested.
Competitor landscape

56 2011 Edition
1
2
3
4Trading activities (rates, fx, credit, commodities and equities) (17)
Trade finance (18)
Structured products (14)
Structured finance - Projects
and infrastructure (14)
Prime broking (agent for hedge funds) (9)
Stock broking (12)Property finance - Commercial property (14)
Foreign exchange (19)
Private equity (12)
Corporate finance - underwriting (13)
Corporate finance - M & A (13)
Corporate finance - Listings (11)
Commercial lending (18)
Q Can you to score, on a scale of 1 to 5, the importance of each of these markets for your bank over the next three years?
All banks – Future importance Corporate and investment banking and trading
The chart below suggests eleven of the thirteen different wholesale markets reviewed will be very important to the banks over the next three years.
Scores above 4, on a maximum scale of 5, were reflected in commercial lending, mergers and acquisitions, foreign exchange, project and infrastructure financing, structured products, and trading activities.
Many of these markets experienced similar scores in 2009.
Competitor landscape

2011 Edition 57
All banks – Future importance Retail banking
1
2
3
4Insurance - life (7)
Insurance - short term (8)
Trust services (5)
Vehicle and asset financing (7)
Micro finance (5)
Retail lending (8)
Retail deposit taking (9)
Wealth management (9)
Private banking (8)
Mortgages - home loans (8)
Unsecured personal loans (8)
Mobile banking (9)
Credit cards (9)
Asset management (8)
Fourteen different components of the retail market were examined.
Segments that scored above 4 out of 5, include asset management, wealth management, mobile banking and retail deposits.
The lowest score was assigned to home loans. In 2009 it scored 3.7 and in 2011 the score dropped to 2.8.
Competitor landscape

58 2011 Edition
Importance – Domestic banks Corporate and investment banking and trading
Importance – Foreign banks Corporate and investment banking and trading
1
2
3
4Trading activities (rates, fx, credit,
commodities and equities) (7)
Trade finance (8)
Structured products (6)
Structured finance - projects and
infrastructure (6)
Prime broking (agent for hedge funds) (4)
Stock broking (6) Property finance - commercial property (8)
Foreign exchange (8)
Private equity (7)
Corporate finance - underwriting (6)
Corporate finance - M & A (6)
Corporate finance - listings (6)
Commercial lending (8)
1
2
3
4
Trading activities (rates, fx, credit, commodities and equities) (10)
Trade finance (10)
Structured products (8)
Structured finance - projects
and infrastructure (8)
Prime broking (agent for hedge funds) (5)
Stock broking (6) Property finance - commercial property (6)
Foreign exchange (11)
Private equity (5)
Corporate finance - underwriting (7)
Corporate finance - M & A (7)
Corporate finance - listings (5)
Commercial lending (10)
The domestic banks attributed a high score to commercial lending.
They also contrasted with the foreign banks in the level of importance attached to commercial property finance.
The foreign banks attributed high importance scores to mergers and acquisitions, underwriting, structured
products, project and infrastructure financing.
Competitor landscape

2011 Edition 59
In their self assessment of success in the Corporate and investment banking and trading market, the banks awarded their highest score to mergers and acquisitions, being 3.8 out of 5.
While nine segments scored above 3, they failed to record the same levels found in the future importance response.
Commercial lending was awarded a score of 2.9 out of 5 by the 18 banks that responded.
All banks – Levels of success Corporate and investment banking and trading
Q How successful has your bank been in penetrating the following markets in the last year?
1
2
3
4Trading activities (rates, fx,
credit, commodities and equities) (14)
Trade finance (17)
Structured products (13)
Structured finance - projects
and infrastructure (15)
Prime broking (agent for hedge funds) (8)
Stock broking (12)Property finance - commercial property (14)
Foreign exchange (17)
Private equity (12)
Corporate finance - underwriting (13)
Corporate finance - M & A (13)
Corporate finance - listings (11)
Commercial lending (18)
Competitor landscape

60 2011 Edition
All banks – Levels of success Retail banking
Domestic banks – Levels of success Corporate and investment banking and trading
1
2
3
4Trading activities (rates, fx, credit, commodities
and equities) (5)
Trade finance (8)
Structured products (7)
Structured finance - projects and infrastructure (6)
Prime broking (agent for hedge funds) (5)
Stock broking (6)
Property finance - commercial property (8)
Foreign exchange (7)
Private equity (7)
Corporate finance - underwriting (6)
Corporate finance - M & A (6)
Corporate finance - listings (6)
Commercial lending (8)
1
2
3
4Insurance - life (7)
Insurance - short term (7)
Trust services (4)
Vehicle and asset financing (5)
Micro finance (5)
Retail lending (7) Retail deposit taking (8)
Private banking (6)
Mortgages - home loans (7)
Unsecured personal loans (6)
Mobile banking (7)
Credit Cards (7)
Asset management (8)
The levels of success were even more modest in the retail sector. Across the fourteen segments reviewed, none
scored above 4, nine scored above 3, four scored above 2 and one segment, micro-finance scored just 1.8 out of 5.
The domestic banks recorded their greatest success in the trading activities segment.
Competitor landscape

2011 Edition 61
Foreign banks – Levels of success Corporate and investment banking and trading
1
2
3
4Trading activities (rates, fx, credit, commodities and equities) (9)
Trade finance (9)
Structured products (6)
Structured finance - projects
and infrastructure (9)
Prime broking (agent for hedge funds) (3)
Stock broking (6) Property finance - commercial property (6)
Foreign exchange (10)
Private equity (5)
Corporate finance - underwriting (7)
Corporate finance - M & A (7)
Corporate finance - listings (5)
Commercial lending (10)
The foreign banks experienced success in a broader range of markets when compared to their domestic counterparts.
Structured products, prime broking and mergers and acquisitions enjoyed strong recognition.
Competitor landscape

62 2011 Edition
Peer review

2011 Edition 63
Q Can you name the top three banks in terms of success (performance, presence, momentum, etc.) across a variety of different markets?
As in previous years, the participants ranged from retail banks to merchant and investment banks to universal banks.
A simple scoring method awarded 3 points to first place, 2 points to second and 1 point to third place. This allowed the banks to be ranked based on a total score.
The arrow in the right-hand column portrays a directional change in ranking from the 2009 report.
Two new categories appear for the first time in 2011, wealth management and unsecured personal lending, therefore a change column is not displayed.
Corporate banking Ranking First Second Third Score Change
Standard Bank 11 2 35
FirstRand (RMB) 4 8 3 31
ABSA 1 4 6 17
Nedbank 4 2 10
Citibank 1 3
HSBC 1 2
Investec 1 1
§ Based on 17 banks
We decided to exclude the private equity category from the peer review in 2011, given that only a few banks remain active in this sector. Prime broking category has also been omitted this year because the voting was inconclusive.
Banks were asked not to record an opinion unless they were active in that segment and were comfortable providing an accurate ranking in terms of success (performance, presence and momentum) as opposed to mere size.
They were not permitted to rank their own institution. Often banks chose just to indicate first or second place.
BEE deals Ranking First Second Third Score Change
FirstRand (RMB) 8 2 28
ABSA 4 2 14
Standard Bank 4 6 14
Nedbank 3 2 8
Investec 2 4
Citibank 1 3
Deutsche Bank 1 2
§ Based on 13 banks
Peer review

64 2011 Edition
Listings Ranking First Second Third Score Change
FirstRand (RMB) 6 2 2 24
Nedbank 2 1 8
JPMorgan Chase 2 1 8
Standard Bank 1 2 4
ABSA 1 3
Deutsche Bank 1 1 3
Morgan Stanley 1 1 3
Investec 1 2
UBS 1 1
§ Based on 11 banks
Mergers and acquisitions Ranking First Second Third Score Change
Deutsche Bank 3 3 1 16
FirstRand (RMB) 2 1 5 13
JPMorgan Chase 1 4 11
Standard Bank 2 1 3 11
Goldman Sachs 2 2 8
ABSA 1 1 5
HSBC 1 3
Morgan Stanley 1 3
Citibank 1 2
Nedbank 1 2
Investec 1 2
Merrill Lynch 1 1
UBS 1 1
§ Based on 13 banks
Peer review
Ranking First Second Third Score Change
FirstRand (RMB) 5 3 1 22
Standard Bank 3 4 3 20
ABSA 2 3 2 14
Nedbank 1 1 1 6
Investec 1 1 4
HSBC 1 2
§ Based on 12 banks
Structured finance

2011 Edition 65
Foreign exchange trading Ranking First Second Third Score Change
Standard Bank 14 1 1 45
ABSA 5 2 12
FirstRand (RMB) 4 2 10
Nedbank 1 1 2 7
JPMorgan Chase 1 1 5
Citibank 1 3
Deutsche Bank 1 1 3
UBS 1 1 3
Credit Suisse 1 1
§ Based on 17 banks
Derivatives Ranking First Second Third Score Change
Standard Bank 3 5 1 20
FirstRand (RMB) 2 2 4 14
ABSA 1 2 2 9
Deutsche Bank 2 6
Investec 2 6
Nedbank 1 2 4
Cadiz 1 1 3
Goldman Sachs 1 3
Peregrine 1 3
JPMorgan Chase 1 2
§ Based on 12 banks
Fixed Income Ranking First Second Third Score Change
Standard Bank 3 6 2 23
FirstRand (RMB) 3 3 3 18
ABSA 4 2 1 17
Deutsche Bank 3 1 10
JPMorgan Chase 1 2 7
Nedbank 1 2 4
HSBC 1 1
Investec 1 1
§ Based on 14 banks
Peer review

66 2011 Edition
Money Markets Ranking First Second Third Score Change
Standard Bank 6 2 2 24
ABSA 4 4 2 22
FirstRand (RMB) 1 4 3 14
Nedbank 2 3 9
Investec 1 2
§ Based on 13 banks
Peer review
Equities Ranking First Second Third Score Change
FirstRand (RMB Morgan Stanley)
4 1 2 16
Deutsche Bank 4 1 1 15
Standard Bank 4 3 11
UBS 1 1 1 6
Merrill Lynch 1 1 5
ABSA 1 1 4
JPMorgan Chase 2 4
Credit Suisse 1 3
Investec 1 2
Macquarie 1 2
Citibank 1 1
Nedbank 1 1
§ Based on 12 banks

2011 Edition 67
Ranking First Second Third Score Change
Standard Bank 6 2 3 25
FirstRand (RMB) 3 1 1 12
ABSA 1 2 7
Deutsche Bank 1 2 5
Nedbank 2 4
Goldman Sachs 1 3
Standard Chartered 1 3
Investec 1 2
Morgan Stanley 1 2
§ Based on 13 banks
Commodities
Peer review
Brokerage – Institutional Ranking First Second Third Score Change
Deutsche Bank 8 1 25
UBS 2 1 1 9
FirstRand (RMB Morgan Stanley)
1 2 2 9
JPMorgan Chase 2 1 5
Credit Suisse 2 4
Investec 2 4
Merrill Lynch 2 4
Standard Bank 1 1 4
Sanlam 1 3
PSG 1 2
ABSA 1 1
Citibank 1 1
Macquarie 1 1
§ Based on 13 banks

68 2011 Edition
Brokerage – Retail Ranking First Second Third Score Change
Standard Bank 3 1 10
Investec 3 2 8
Sanlam 2 6
ABSA 2 1 5
Nedbank/BOE 1 1 4
BJM 1 3
Peregrine 1 3
PSG 1 3
Cadiz 1 2
§ Based on 9 banks
Peer review
Wealth management Ranking First Second Third Score
Investec 8 1 25
ABSA 1 3 9
HSBC 1 1 1 6
Peregrine 2 4
Standard Bank 1 2 4
Citibank 1 3
Melville Douglas 1 3
Nedbank 3 3
Citadel 1 2
Credit Suisse 1 2
FirstRand (FNB) 1 2
§ Based on 12 banks
Ranking First Second Third Score Change
Investec 5 1 1 18
FirstRand (RMB) 1 3 5 14
Nedbank 2 2 1 11
Standard Bank 3 1 11
ABSA 3 2 8
§ Based on 11 banks
Commercial property

2011 Edition 69
Retail lending and deposits Ranking First Second Third Score Change
ABSA 5 4 1 24
Standard Bank 2 6 2 20
FirstRand (FNB) 4 5 17
Nedbank 1 3 5
ABIL 1 3
Capitec 1 3
§ Based on 13 banks
Peer review
Retail mortgagesRanking First Second Third Score Change
ABSA 5 4 23
Standard Bank 2 4 1 15
FirstRand (FNB) 1 2 4 11
Nedbank 2 3 9
§ Based on 10 banks
Vehicle financing Ranking First Second Third Score Change
FirstRand (WesBank) 10 3 36
Nedbank/MFC 2 3 1 13
ABSA 2 3 7
Standard Bank 1 1 2 7
§ Based on 13 banks

70 2011 Edition
Internet banking Ranking First Second Third Score Change
FirstRand (FNB) 2 3 12
Standard Bank 1 3 2 11
ABSA 2 2 10
Investec 2 1 1 9
Nedbank 2 1 7
§ Based on 9 banks
Private banking Ranking First Second Third Score Change
Investec 12 36
FirstRand (FNB) 1 2 2 9
Nedbank/BOE 4 1 9
Standard Bank 3 3 9
ABSA 2 4
HSBC 1 1
§ Based on 13 banks
Peer review
Micro-lending Ranking First Second Third Score Change
Capitec 8 7 38
African Bank 7 5 1 32
Bank of Athens 1 2
§ Based on 15 banks

2011 Edition 71
Trade finance Ranking First Second Third Score Change
Standard Bank 4 1 1 15
ABSA 2 2 1 11
Standard Chartered 3 1 11
FirstRand (FNB) 2 1 1 9
HSBC 1 2
Investec 1 2
Nedbank 2 2
Mercantile Bank 1 1
§ Based on 11 banks
Peer review
Unsecured personal lending
Ranking First Second Third Score
African Bank 4 2 16
Capitec 3 2 13
ABSA 1 1 1 6
Nedbank 2 1 5
FirstRand (FNB) 1 2
Standard Bank 2 2
§ Based on 8 banks

72 2011 Edition
PwC point of view
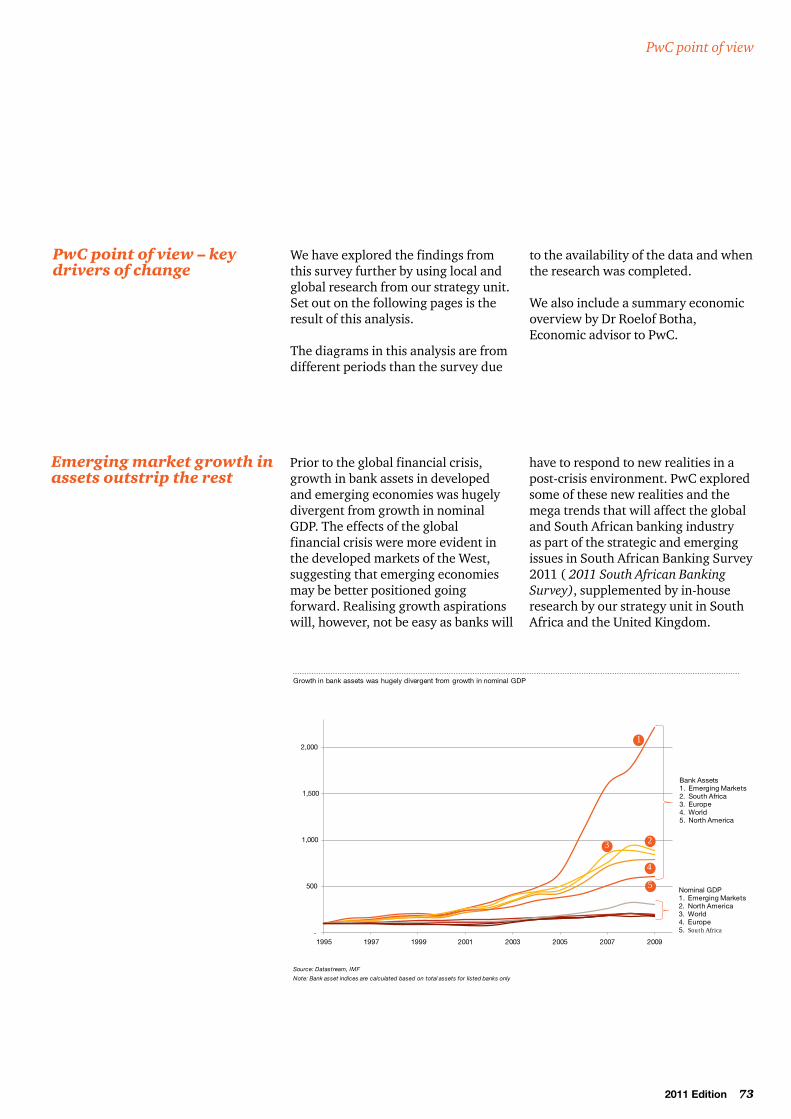
2011 Edition 73
PwC point of view – key drivers of change
We have explored the findings from this survey further by using local and global research from our strategy unit. Set out on the following pages is the result of this analysis.
The diagrams in this analysis are from different periods than the survey due
to the availability of the data and when the research was completed.
We also include a summary economic overview by Dr Roelof Botha, Economic advisor to PwC.
Emerging market growth in assets outstrip the rest
Prior to the global financial crisis, growth in bank assets in developed and emerging economies was hugely divergent from growth in nominal GDP. The effects of the global financial crisis were more evident in the developed markets of the West, suggesting that emerging economies may be better positioned going forward. Realising growth aspirations will, however, not be easy as banks will
have to respond to new realities in a post-crisis environment. PwC explored some of these new realities and the mega trends that will affect the global and South African banking industry as part of the strategic and emerging issues in South African Banking Survey 2011 ( 2011 South African Banking Survey), supplemented by in-house research by our strategy unit in South Africa and the United Kingdom.
PwC services and experienceGrowth in bank assets was hugely divergent from growth in nominal GDP
Source: Datastream, IMF
Note: Bank asset indices are calculated based on total assets for listed banks only
-
500
1,000
1,500
2,000
1995 1997 1999 2001 2003 2005 2007 2009
Bank Assets1. Emerging Markets2. South Africa3. Europe4. World5. North America
1
23
4
5Nominal GDP1. Emerging Markets2. North America3. World4. Europe5. South Africa
PwC point of view

74 2011 Edition
In this survey the South African banking CEOs identified improving revenue growth as the most pressing issue facing the banking industry. This is consistent with our research into the drivers of change in the banking industry and also consistent with the message delivered by the Big Four banks during the last round of results updates. South African banks are struggling to grow top-line revenue, as consumers are reluctant to borrow due to over-indebtedness (debt to disposable income peaked at 80% during 2009). This is compounded by inflation fears resulting from the impact of political instability on oil prices and the reality of future interest rate hikes. Finally, unemployment levels in South Africa inhibit our ability to grow at the same pace
as other leading emerging market economies, with resulting negative consequences for growth in the South African banking sector.
The South African government recently announced a ‘new growth path’ set to generate 5m additional jobs by 2020, which will be supported by a R9bn job fund. Building new and maintaining existing infrastructure is a key element of government’s aim to create 5 million jobs. However, it should be noted that local government failed to spend 17% of the 2009/2010 allocated capital expenditure. Effectively utilising the allocated budgets for job creation will be critical to reducing unemployment levels and stimulating growth.
Top-line growth is top of mind for South African banks
PwC point of view
Source: PwC analysis
30%
40%
50%
60%
70%
80%
90%
1980 1985 1990 1995 2000 2005 2010
% D
ebt
vs.
inco
me
South Africa’s household debt to disposable income peaked in 2008 and remains relatively high
PwC services and experienceDe-leveraging
Source: PwC analysis
PwC services and experienceUnemployment levels impact on South Africa’s growth aspirations.
1.00%
6.00%
11.00%
16.00%
21.00%
26.00%
31.00%
1989 1994 1999 2004 2009 2014
Brazil China Nigeria South Africa United Kingdom United States
Unemployment levels

2011 Edition 75
It is evident from the 2011 South African Banking Survey that regulatory reform is top of mind for South African banking CEOs. Regulatory reform
is also one of the drivers of change explored in our research on the future of banking.
PwC point of view
South African banking CEOs expect Basel III to be the most significant driver of change
PwC services and experienceRegulatory reformThere are many proposals to change the regulation and structure of financial markets, which operate over different geographical jurisdictions
US
• Dodd-Frank Wall St Reform and Consumer Protection Act
• Volcker Rule
UK
• Financial Services Act• FSA Turner Review • BoE macro prudential policy agenda• Vickers• Treasury Select Committee• OFT
EU
•Committee of European BankingServices (CEBS) stress-testing
•Capital Requirements Directive IV
•Bank-funded EU resolution funds (land levies)
Global
• Basel III• G20 Framework• IMF taxes (Foreign Sales Corporation Tax and
Financial Activities Tax)
• Financial Stability Board Framework• International Financial Reporting Standards
Selected regulatory reforms
Source: PwC UK analysis
South Africa
•King III•Companies Act•Twin Peaks•Structural Funding Task Team set
up to explore regulatory environment in South Africa
Changes to Basel III, particularly the proposed new liquidity requirements will fundamentally change the business models of South African banks. The structural features of the South African economy and the lack of a savings culture amongst households could severely impact banks’ ability to meet global liquidity standards, such as the net stable funding ratio and the liquidity coverage ratio. This
could have unintended business model implications and could even affect credit origination. It is likely that the proposed regulatory measures will decrease banks’ return on equity. Shareholders will have to adjust their expectations to lower returns and banks will have to find ways of increasing profitability and/or reduce capital requirements.
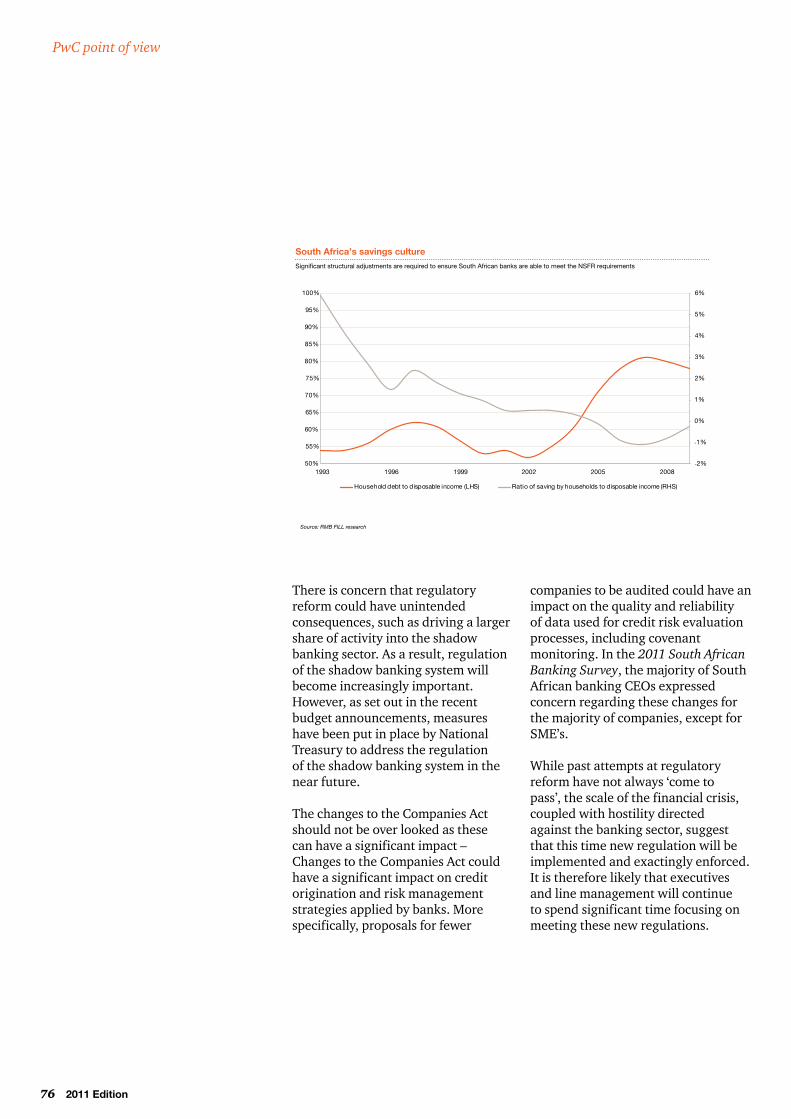
76 2011 Edition
There is concern that regulatory reform could have unintended consequences, such as driving a larger share of activity into the shadow banking sector. As a result, regulation of the shadow banking system will become increasingly important. However, as set out in the recent budget announcements, measures have been put in place by National Treasury to address the regulation of the shadow banking system in the near future.
The changes to the Companies Act should not be over looked as these can have a significant impact – Changes to the Companies Act could have a significant impact on credit origination and risk management strategies applied by banks. More specifically, proposals for fewer
companies to be audited could have an impact on the quality and reliability of data used for credit risk evaluation processes, including covenant monitoring. In the 2011 South African Banking Survey, the majority of South African banking CEOs expressed concern regarding these changes for the majority of companies, except for SME’s.
While past attempts at regulatory reform have not always ‘come to pass’, the scale of the financial crisis, coupled with hostility directed against the banking sector, suggest that this time new regulation will be implemented and exactingly enforced. It is therefore likely that executives and line management will continue to spend significant time focusing on meeting these new regulations.
PwC point of view
Source: RMB FILL research
-2%
-1%
0%
1%
2%
3%
4%
5%
6%
50%
55%
60%
65%
70%
75%
80%
85%
90%
95%
100%
1993 1996 1999 2002 2005 2008
Household debt to disposable income (LHS) Ratio of saving by households to disposable income (RHS)
PwC services and experienceSouth Africa’s savings cultureSignificant structural adjustments are required to ensure South African banks are able to meet the NSFR requirements

2011 Edition 77
Our research on the future of banking indicates that banks have started to think seriously about mobile phone banking, which is likely to represent a significant opportunity in the medium term. South Africa has the highest mobile penetration rate (in excess of 100%) in Africa. This provides banks with a lucrative market to offer mobile banking services. Currently, approximately 40% of South African cell phone subscribers use mobile banking services. More work is, therefore, required to capitalise on this banking channel.
This is consistent with expectations reflected by the South African banking CEOs in the 2011 South African
Banking Survey. More specifically, the South Africa banking CEOs expect new banking products and technological innovation to be two of the more significant catalysts of growth over the medium term.
Prepaid channels and mobile banking should also contribute to ensure banking services become more easily accessible to the unbanked market. A significant proportion of South African consumers still transact in cash. Therefore, the supply of products and services via prepaid and mobile channels is, becoming an increasingly significant distribution model.
PwC point of view
New banking products and technological innovation are expected to serve as catalysts for growth
Capitec and African bank have grown assets at a faster rate than the rest of the market
Source: PwC analysis
0
500
1,000
1,500
2,000
2,500
3,000
3,500
4,000
1997 1999 2001 2003 2005 2007 2009 2011
SA Banks Capitec Bank African Bank
Ind
ex
PwC services and experienceAccessible bankingRelative to Tier 1 banks, Tier 2 banks experienced exponential asset growth (Bank assets index)
We also researched the growth of assets by banks. Not surprisingly this indicates that the Tier 2 banks have managed to grow assets at a much faster rate than the larger banks of a lower base. A significant portion of this growth has been achieved in the previously unbanked market. This is consistent with the observations
made by some of the South African banking CEOs in the 2011 South African Banking Survey, who believe Capitec, African Bank and retailers are becoming more serious players. Not surprisingly, Capitec was rated as the top bank in micro lending, while African Bank received the top rating in unsecured personal lending.

78 2011 Edition
PwC point of view
Source: PwC’s 14th Global CEO survey
0% 10% 20% 30% 40% 50% 60% 70% 80% 90%
Candidates with skill l imited
Technical skills lack flexibility and creativity
Challenges in recruiting
Competitors recruit the best people
Understand talent availability in emerging markets
Provide attractive career paths
Difficult to deploy experienced talent globally
Key staff change career for personal reasons
Scrutiny of reward structures by regulators and/or investors
Poor retention of female talents
Retirement of older workers
Global South Africa 2010
South African companies face unique challenges to attract and retain key talent
PwC services and experienceCompetition for talent
Growth opportunities, especially in emerging markets, prompt changes to talent strategies
South African banking CEOs acknowledged in the 2011 South African Banking Survey that the availability of key skills remains a concern. The African expansion strategies of many of the South African banks, coupled with the lack of quality resources in those markets, place further pressure on human resources of South African banks.
Based on our research, filling the skills gap in emerging markets begins with banks making themselves more attractive to potential and current employees, as well as looking for better ways to develop and deploy staff globally. Becoming the employer of
choice is a vital advantage in markets where top talent has the pick of jobs from a diverse range of employers. Furthermore, South African banks will have to reconsider remuneration policies and development opportunities offered to attract and retain key talent. Banks have told us that flexible working arrangements and global mobility opportunities are two of the other talent management strategies being considered. Within the context of closely aligned international regulatory frameworks and information technology that can identify and connect talent in an instant, global mobility will become part of the new normal.

2011 Edition 79
As many world populations age, birth rates in most mature economies are trending downward. Many Western economies cite declining birth rates as a major problem in the war for talent. Yet China, India, Eastern Europe and parts of South America are also grappling with critical talent shortages. The UN anticipates that China’s working-age population (those aged 15-59) will lag behind India and Brazil in 2025. China is already facing skills shortages at the senior management and executive level and expects workforce growth of less than 5% by 2015, at which time one-third of the country’s billion-plus population will be over 50 years old.
Our research indicates the current economically active population are more open to overseas assignments than any previous generation and see working overseas as an important part of their own personal development – 92% of the new generation in South Africa surveyed expects to work on overseas assignments. Their focus is on interest and opportunity, not necessarily monetary rewards.
PwC point of view
Source: PwC’s 14th Global CEO survey
PwC services and experience
-58%
-43%
-40%
-39%
-38%
-24%
-23%
-20%
28%
36%
35%
34%
43%
34%
36%
38%
10%
15%
16%
18%
14%
26%
27%
26%
4%
6
9%
7%
4%
15%
13%
15%
-60 -40 -20 0 20 40 60 80
No change Changing somewhat Change to large extent Changing significantly
Percentage change
1. Managing people through change (e.g., redefining roles in organisation)
2. Training and development programmes
3. Staff morale and employee engagement programmes
4. Remuneration levels
5. Flexible working environments
6. Collaborations with networks of external specialists
7. Global mobility, incl. staff travel or international secondments
8. Pension and healthcare arrangements
PwC services and experienceCompetition for talentTalent management strategies are expected to change as banks compete for key talent

80 2011 Edition
Western banks will need to adjust to governments exerting greater control over their activities and the real economy. In developed markets, the crisis necessitated a rapid increase in state intervention and, in many people’s eyes, has legitimised ongoing intervention. The rise of state directed capitalism is one of the mega trends
that will have an impact on banking globally. Western banks’ ability to respond to opportunities in emerging markets will largely depend on the risk appetites of governments. This creates opportunities for emerging market banks to capture market share if they are able to respond to opportunities quickly.
PwC point of view
PwC services and experienceSkills migration will continue to follow economic growth and business models need to align or risk losing key talent
Talent mobility 2010
• Demand for global mobility of talent increases as new markets emerge for companies to sell their products and services and also manufacture their goods at lower cost.
• Off-shoring gathers pace. • A new breed of mobile worker emerges alongside the
expatriate and meets the globalisation demand through commuter, rotational, and technology-enabled virtual assignments.
• The flow of talent is still predominantly from West to East or intra-continental, but companies begin to tap into rich talent pools in emerging markets, particularly India.
Talent mobility 2020
• Global talent mobility continues to grow in volume.• Within the context of closely aligned international
regulatory frameworks, the growth of cross-border acquisitions by sovereign wealth funds, lingering public investments in private business concerns, greater security co-operation between nations, and information technology that can identify and connect talent in an instant, global mobility becomes part of the new normal.
• Mobility of talent is fluid. For example, a Chinese company may engage a European team to manage an investment in Africa.
Source: PwC analysis
Competition for talent
Source: Deutsche Bank, PwC analysis
59%
28% 31%
20% 18%
0%
10%
20%
30%
40%
50%
60%
70%
UK US Spain Germany France
% o
f 20
09 G
DP
Public funds committed to the financial sector, 2008 - 2009
$1,290bn $4,320bn $414bn $677bn $486bn
Total funds committed
PwC services and experienceRise of state-directed capitalismMany point to the high public cost of the crisis and the argument that it arose through inadequate control of banks’ activity to justify greater state intervention in banking
Political influence will play an increasingly important role in the local and global banking industry

2011 Edition 81
Rise of state-directed capitalismSovereign states own significant stakes in major banks, both in western and emerging economies
Source: BankscopeNote: *The banks shown against each country are those headquartered in that country with assets greater than $15bn as at 31.12.09 and with greater than 20% of ordinary shares owned by the domestic state (i.e. with ‘significant’ domestic state ownership). The graphs show total assets for each bank which meets the above criteria. (a): LB = Landesbank. (b): LKB = Landeskreditbank. (c): IB = Investitionsbank
CHINA
INDIA
RUSSIA
BRAZIL
USA
UKGERMANY
Banks with significant domestic state ownership*, October 2010
0200400600800
1,0001,2001,400
050
100150200250300350400450
Tot
al b
ank
asse
ts a
t D
ec ’
09 ($
bn)
Tot
al b
ank
asse
ts a
t D
ec ’
09 ($
bn)
0200400600800
1,0001,2001,4001,6001,8002,000
Tot
al b
ank
asse
ts a
t D
ec ’
09 ($
bn)
020406080
100120140
Tot
al b
ank
asse
ts a
t D
ec ’
09 ($
bn)
050
100150200250300
Tot
al b
ank
asse
ts a
t D
ec ’
09 ($
bn)
0500
1,0001,5002,0002,5003,000
Tot
al b
ank
asse
ts a
t D
ec ’
09 ($
bn)
NOTE• Banks shown are those where domestic state ownership exceeds 20%
• Levels of Government ownership differ across the banks shown • See footnote for further details
0
500
1,000
1,500
2,000
Tot
al b
ank
asse
ts a
t D
ec ’
09 ($
bn)
Although South African Banks escaped the global financial crisis, we believe political influence will also be a major driver of change for the South African banking landscape. This is consistent with the views expressed by the South African banking CEOs in the 2011 South African Banking Survey. The minister of finance recently announced that South Africa will be adopting a ‘Twin Peaks’ approach to financial regulation. Under the revised regulatory framework, the Reserve Bank will be given lead responsibility for prudential regulation and the Financial Services Board for consumer protection. As part of this, the mandate
of the Financial Services Board will be expanded to include the market conduct of retail banking services, including developing principles on how banks should set their fees, how these fees should be reported and what constitutes fair behaviour. Within the Financial Services Board, a retail banking services market conduct regulator will be established. This new regulator will focus on issues of market structure and banking fees and work closely with the National Credit Regulator, which has a complementary role in regulating the extension of credit. These changes will have an impact – how much is yet to be seen.
PwC point of view

82 2011 Edition
The E7 is rapidly gaining share from the G7, both in terms of GDP and banking assets
Our economic forecast, developed in the UK, suggests that the GDP of E7 emerging economies may become bigger than that of the G7 economies by 2020, and that China may overtake the US before the end of the decade. It is therefore not surprising that many
Western banks are looking to offset slow growth in their home markets by strengthening their presence in South America, Africa, Asia and the Middle East (SAAAME).
The E7 is rapidly gaining share from the G7, both in terms of GDP and banking assets
Source: PwC - The World in 2050 (Published January 2011) Source: PwC - Banking in 2050 (Published 2007)
Note: E7 = Brazil, Russia, India, China, Indonesia, Mexico and Turkey. G7 = Canada, France, Germany, Italy, Japan, UK and USA
CA
GR
200
4 -
2050
Do
mes
tic
cred
it ($
bn
2009
pri
ces)
E7 G7 Rest of the worldE7 G7 Rest of the world
Share of global banking assets, 2004 vs. 2050
2004 2050
Reduced G7 share
9%
41%
65%
35%
26% 24%
0%
20%
40%
60%
80%
100%
PwC services and experienceRise of SAAAME
350,000
350,000
350,000
350,000
300,000
250,000
200,000
150,000
100,000
50,000
02009 2014 2019 2024 2029 2034 2039 2044 2049
Based on our global research, sixty-one percent of global CEOs think that emerging markets will be more important than developed markets to their organisation’s future. However, success will be hard won as emerging economies respond to international interest. For example, the interest in the African continent from international players has not been lost on African CEOs: 28% have changed their strategy because of competitive
threats compared to a global average of 10%. This is consistent with responses reflected in the 2011 South African Banking Survey. The South African banking CEOs agree with our findings and believe there is renewed interest by foreign players in Africa. Respondents also believe that some foreign banks still have an appetite for a major investment in a domestic bank in South Africa.
PwC point of view

2011 Edition 83
We believe a block of countries, consisting of countries in South America, Africa, Asia and the Middle East (SAAAME), is emerging as a dominant bloc for trade and investment. SAAAME does not need to look to the US or Europe for capital,
consumers, manufacturing, labour, natural resources or oil. Although traditional trade flows will remain, trade between emerging nations (particularly SAAAME) is growing at a significantly faster pace.
A bloc of countries, comprising South America, Africa, Asia and the Middle East (SAAAME) is emerging as a dominant bloc fortrade and investment
Rise of SAAAME
World trade flows, 2009
$627bn
North AmericaAsia
Middle East
Africa
Europe
$324bn
$96bn
$115bn
$366bn
$292bn
$60bn
$49bn
$66bn
$28bn$102bn
$85bn
$163bn
$357bn
$426bn
$641bn
$95bn
$128bn
South and Central America
Source: WTO, PwC analysis Note: Map excludes trade flows from the CIS
Source: PwC analysis
PwC services and experienceSAAAME has a combined population of 5466million people and contributed 47% of the world GDP in 2010
Economist Intelligence Unit, UN Population Division, PwC analysis
Rise of SAAAME
US EU SAAAME
GDP growth (06-10) (%) 3.0 2.2 5.1
Share of world GDP PPP (2010) (%) 20 20 47
Population (2010) (m) 317 732 5466
PwC point of view

84 2011 Edition
In parallel with the growing importance of emerging nations and SAAAME, particularly to trade and investment, it is projected that emerging nations will play an increasingly central role in the banking sector.
South Africa, and our well developed financial and banking system, is well placed to capitalise on this and to become the financial centre for Africa and also more widely than that.
PwC point of view
Based on responses in the 2011 South African Banking Survey and our in-house research, it is clear that South African banks will have to contend with a number of new realities if they wish to remain relevant in the
post-crisis environment. The likely to be those that can respond to these opportunities, while at the same time making the most of their competitive strengths.
Conclusion: Execution will be paramount

2011 Edition 85
Any lingering doubt over the sustainability of South Africa’s recovery from the 2008/09 recession was removed with a solid economic growth performance during the first quarter of 2011.
Real GDP has now expanded for seven successive quarters and the
annualised real growth rate during the first quarter of the year amounted to 3.6%. The sectors for manufacturing, wholesale & retail trade and transport & communication fared particularly well over the past year, although manufacturing activity remains below its pre-recession level (as illustrated by figure 1).
Consolidation of new economic growth cycleBy Dr Roelof Botha, Economic Advisor, PwC
Several authoritative forecasting agencies are predicting growth for 2011 of between 3.5% and 4%, whilst the Minister of Finance has publicly stated that the growth forecast contained in the February Budget
(of 3.4%) would in all likelihood be surpassed. The data in the table provides a one-year and three-year perspective of the recovery by key sector.
Value added by major economic sector at 2011 basic prices and real % change over one year & three years
Value Q1’11 (R b)
Q1’10 to Q1’11 (%)
Q1’08 to Q1’11 (%)
Finance & business services 138.3 3.1 5.2
Government services 104.2 3.2 10.6
Manufacturing 89.7 4.9 -2.8
Wholesale & retail trade 85.2 4.3 1.2
Mining and quarrying 61.4 3.5 5.0
Transport and communication 56.4 3.8 7.3
Personal services 39.3 2.9 2.0
Construction 23.5 0.5 13.0
Electricity and water 15.8 1.5 2.0
Agriculture, forestry and fishing 11.6 1.6 -2.9
GDP at market prices 709.8 3.6 3.9
Note: Ranked by value added in Q1 2011
0
30
60
90
120
150
Q1'11
Q1'10
Q1'09
Q1'08
Finance & bus. servicesManufacturingGovt. servicesTrade & catering
PwC point of view

86 2011 Edition
A feature of the new economic growth cycle is for the relatively large sectors of economic activity to outperform the relatively smaller ones. A second feature is for the three-year comparison of growth rates to exhibit considerably larger variance than over one year.
Growth prospects have been enhanced, inter alia, by the strong recovery of global commodity prices, which has assisted a significant increase in non-gold mining output since 2009. Retail sales have also increased by 10% in real terms since the low recorded in October 2009. A point of lingering concern, however, is the lethargy of the lagging composite business cycle indicator to shed the effects of the recent recession, mainly due to the slow pace of formal sector employment creation over the past year.
The strength of the domestic currency represents the key reason for the inability of manufacturing to recover all of its lost ground since 2008. The fairly robust recovery of global
economic activity since mid-2009, particularly in emerging markets, has been accompanied by a swift recovery of commodity prices for metals and minerals, which has boosted South Africa’s export earnings over the past five quarters.
Combined with imports remaining fairly subdued, this has resulted in a fairly dramatic lowering of the deficit on the current account of the balance of payments (from 7.1% of GDP in 2008 to 2.8% in 2010) and, as an inference, has played a major part in the appreciation of the US$/rand exchange rate since the beginning of 2009.
An interesting feature of the new economic upswing is the lack of facilitation by the banking sector, as illustrated by figure 2. GDP at current prices has increased by more than 20% since its peak prior to the recession (3rd quarter of 2008), whilst credit extended to businesses remains marginally lower than the peak achieved in the same quarter.
The ratio of credit extended to the business sector as % of annual nominal GDP increased steadily after the 1994 elections from a level of 25% to more than 33% in 2000. It then declined sharply during the currency crisis of 2001/02 to a level of 27.6% in 2004, before recovering again to reach an
all-time high of 38.4% in 2007 (during a period of GDP growth in excess of 5%). This ratio has now fallen back to 31.5%, suggesting an imminent recovery in the level of formal banking intermediation for business enterprises.
0
100
200
300
400
500
600
700
800
Q1'
11432
Q1'
10432
Q1'
09432
Q1'
08432
Q1'
07432
Q1'
06
Figure 2
PwC point of view

2011 Edition 87
Appendices

88 2011 Edition
Methodology
Previous experience has shown that personal interviews with senior bankers, using a standard questionnaire, offers the best research approach. The questionnaire contained approximately 40 questions and was completed during interviews of approximately one hour. The author conducted all interviews during February 2011 in Johannesburg.
Responses have not been attributed to individual banks but rather collectively within two groups: foreign banks (11) and domestic banks (9). Included within the domestic bank group are the Big Four banks (ABSA, FirstRand Bank, Nedbank and Standard Bank) and, on occasion, their results are shown alongside the overall domestic bank group.
At times, individual banks declined to answer particular questions or were unable to provide sufficiently accurate data. This is noted where applicable.
The time commitment and support by all banks in this survey was outstanding. Once again, they provided interpretation and direction on how South African banking may unfold over the next three years.

2011 Edition 89
Bank groups
Bank groupsThe information provided has been considered proprietary and remains confidential. Results are therefore presented in a ‘disguised’ group format, in the form of foreign or domestic banks. The members of the bank groups are as follows:
Domestic banks (9): ABSA Bank* African Bank FirstRand Bank Investec Bank Mercantile Bank* Nedbank Group Ltd* Sasfin Bank Standard Bank of South Africa The South African Bank of Athens*
Big Four banks: ABSA Bank* FirstRand Bank Nedbank Group* Standard Bank of South Africa
Foreign banks (11): Bank of China Credit Agricole China Constructon Bank Citibank NA Deutsche Bank AG HSBC JPMorgan Chase Bank Société Générale Standard Chartered Bank State Bank of India UBS South Africa
Foreign banks classification:
Registered branches Bank of China China Construction Bank Citibank NA Credit Agricole Deutsche Bank AG HSBC Bank Plc JPMorgan Chase Bank Société Générale Standard Chartered Bank State Bank of India
Registered banks – Foreign controlled The South African Bank of Athens
Foreign banks – Representative offices UBS South Africa
*Included in this category in this particular survey to ensure confidentiality (ABSA controlled from the UK, Nedbank controlled by Old Mutual Plc, Mercantile Bank controlled from Portugal and also The South African Bank of Athens controlled from Greece). The South African Bank of Athens, although a foreign controlled registered bank was included in the domestic group because of its retail and middle market focus. To include it in the foreign bank group would have compromised its identity.

90 2011 Edition
Name Position Bank
Domestic banks:Louis von Zeuner Deputy Chief Executive Officer ABSA Bank*
Johan de Ridder Executive Director African Bank
Sizwe Nxasana Chief Executive Officer FirstRand Bank
Stephen Koseff Managing Director Investec Bank
Dave Brown Managing Director Mercantile Bank*
Mike Brown Chief Executive Officer Nedbank Group Ltd*
Roland Sassoon Chief Executive Officer Sasfin Bank
Jacko Maree Chief Executive Officer The Standard Bank of South Africa
Spiro Georgopolous Chief Executive Officer The South African Bank of Athens*
Foreign banks:Ashley Cameron Assistant General Manager Bank of China
Guillaume Fay Senior Country Officer Credit Agricole
Dr Windsor Chan Deputy General Manager China Construction Bank
Donna Nemer Oosthuyse Chief Executive Officer Citibank NA
Herman Bosman Chief Executive Officer Deutsche Bank
Ian Carr Head of Global Banking, Africa HSBC
John Coulter Managing Director Head Sub-Saharan Africa JPMorgan Chase Bank
Kathryn Spencer Chief Financial Officer JPMorgan Chase Bank
Pierre Wolmarans Chief Executive Officer Société Générale
James Hopkinson Regional Head of Origination and Client Coverage Standard Chartered Bank
Oliver Chaplin Regional Head of Financial Institutions Standard Chartered Bank
Dr M.G. Vaidyan Regional Head, CEO Africa State Bank of India
Sarah Jane Wagg Managing Director UBS South Africa
* Although classified as domestic banks, all four of these banks are foreign controlled
Participants

2011 Edition 91
Background comments on participants
Big Four bank group
Big Four Banks
World ranking *The Banker, July 2010
Home country
Ranking* Tier 1Background comments **
Tier 1 Assets
ABSA Bank
38,000 employees www.absa.co.za
Foreign owned
2 Absa is a subsidiary of Barclays Bank PLC, which holds a stake of 55.5% in the Group. Absa’s business is conducted primarily in South Africa, but also has equity holdings in banks in Mozambique and Tanzania. At 31 December 2010, the Group had 718.2m shares in issue and a market capitalisation of R100.5bn. The Group had assets of R716.5bn, 11.8m customers and 8,963 automated teller machines.
FirstRand Bank
32,000 employees www.firstrand.co.za
158 155 3 FirstRand was created in 1998 through the merger of the financial service interests of Anglo American Corporation and RMB Holdings. The major companies involved at the time were the listed entities: First National Bank Holdings of Southern Africa Limited and Southern Life Association Limited, which were controlled by AAC and Momentum Life Assurers Limited, the holding company of Discovery Health and Rand Merchant Bank, which were controlled by RMBH.
Nedbank Group Ltd.
28,000 employees www.nedbankgroup.co.za
181 163 4 Nedbank Group focuses on southern Africa. Nedbank Group's headquarters are in Sandton, with operational centres in Durban and Cape Town. Principal services offered by the group comprise: business, corporate and retail banking, property finance, investment banking, private banking, foreign exchange and securities trading. Nedbank Group also generates income from private equity, credit card issuing and processing services, custodial services, unit trust administration, asset management services and bancassurance. As at 31 December 2010, the group had total assets of R608.7bn.
The Standard Bank of South Africa
30,000 employees www.standardbank.co.za
106 98 1 Standard Bank Group operates in a range of banking and related financial services. The group spans 17 African countries and 15 countries outside of Africa with an emerging markets focus. Standard Bank has 681 branches in South Africa and 332 in the rest of Africa. The group had total assets of over R1341bn (approximately US$202 billion) at 31 December 2010 and employed more than 53,000 (including Liberty) worldwide. Standard Bank’s market capitalisation at 31 December 2010 was R170b (approximately US$26 bn). In 2008, (ICBC) took a 20.1% stake in Standard Bank, and on other 27.8% of its shareholder base is foreign.
* World rankings were taken from The Banker, July 2010** The background comments were taken from the respective banks’ websites in April 2011

92 2011 Edition
Background comments on participants
Domestic bank group
Other domestic B
World ranking *The Banker, July 2010
Home country
Ranking* Tier 1Background comments **
Tier 1 Assets
African Bank
15,000 employees www.africanbank.co.za
560 869 6 Prior to 1998, African Bank operated for 24 years as a small commercial bank concentrating on the historically disadvantaged market. In December 1999, Theta Group Limited changed its name to African Bank Investments Limited (ABIL). Currently, African Bank Investments Limited (ABIL) is a publicly quoted bank-controlling company listed on the JSE Limited. ABIL services approximately 4m clients through its 1,500 outlets and 3,500 staff members and currently has an advances book totalling R20bn.
Investec
3,700 employees www.investec.com
212 232 5 Investec services a niche client base in three principal markets, the United Kingdom, South Africa and Australia, as well as certain other geographies. Investec is organised as a network comprising five business divisions: Investment Banking, Treasury and Specialised Finance, Private Client Activities, Asset Management, and Property Activities. Since Investec was founded in South Africa in 1974, it has expanded through a combination of organic growth and strategic acquisitions. It had total asset of £47 billion at the end of 2010.
Mercantile Bank*
430 employees www.mercantile.co.za
* Caixa Geral de Depositos
113 101 NA Mercantile Bank Limited provides a full range of foreign and domestic banking, custodial and securities services. It operates in selected retail, commercial, corporate and alliance banking niches, to which it offers banking, financial and investment services. The world rankings are for Caixa Geral de Depositos S.A of Portugal, which owns a stake of 91.75% of Mercantile. It wants to break away from the image of being a bank exclusively for the Portuguese community.
SASFIN Bank
560 employees www.sasfin.com
NA NA NA Sasfin was founded in 1951 by Sydney Sassoon, the father of current CEO Roland Sassoon. The bank serves both individuals and businesses, focusing on large corporate clients and high networth individuals. The stock of the bank’s holding company Sasfin Holdings Limited, is listed on the Johannesburg Stock Exchange. The World Bank, through its arm International Finance Corporation (IFC), owns a US$10m equity shareholding in Sasfin, made in July 2009.
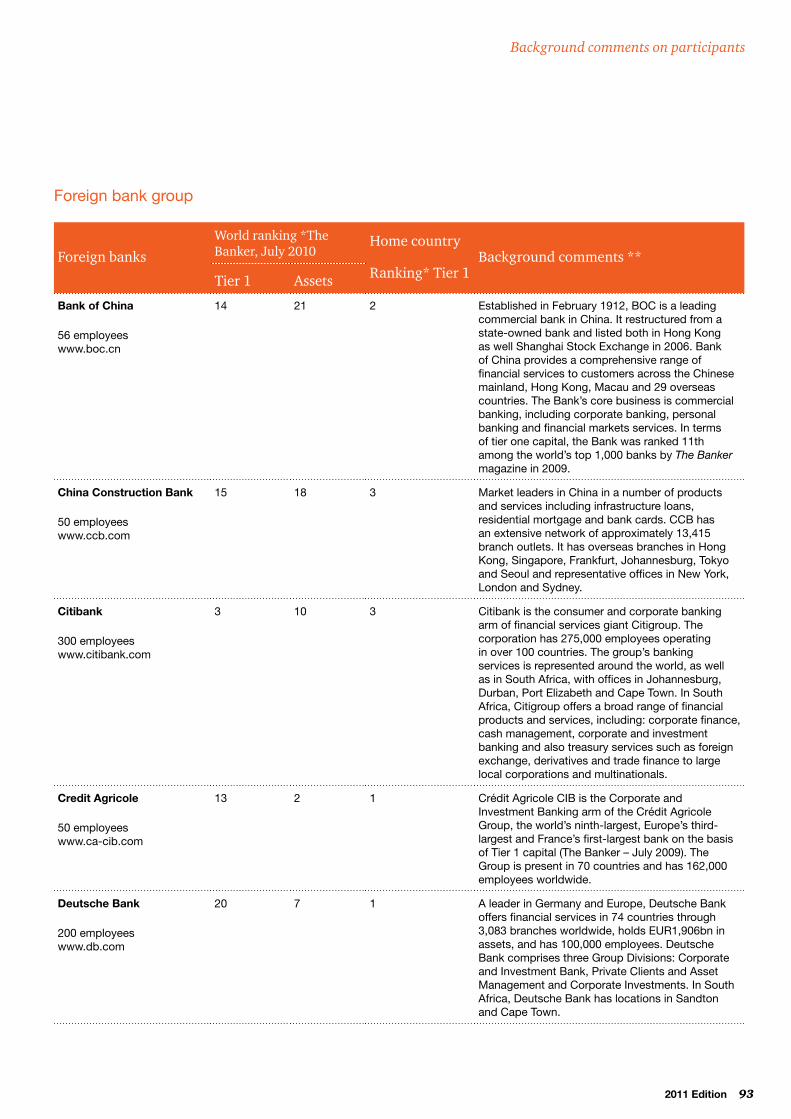
2011 Edition 93
Background comments on participants
Foreign bank group
Foreign banksWorld ranking *The Banker, July 2010
Home country
Ranking* Tier 1Background comments **
Tier 1 Assets
Bank of China
56 employees www.boc.cn
14 21 2 Established in February 1912, BOC is a leading commercial bank in China. It restructured from a state-owned bank and listed both in Hong Kong as well Shanghai Stock Exchange in 2006. Bank of China provides a comprehensive range of financial services to customers across the Chinese mainland, Hong Kong, Macau and 29 overseas countries. The Bank’s core business is commercial banking, including corporate banking, personal banking and financial markets services. In terms of tier one capital, the Bank was ranked 11th among the world’s top 1,000 banks by The Banker magazine in 2009.
China Construction Bank
50 employees www.ccb.com
15 18 3 Market leaders in China in a number of products and services including infrastructure loans, residential mortgage and bank cards. CCB has an extensive network of approximately 13,415 branch outlets. It has overseas branches in Hong Kong, Singapore, Frankfurt, Johannesburg, Tokyo and Seoul and representative offices in New York, London and Sydney.
Citibank
300 employees www.citibank.com
3 10 3 Citibank is the consumer and corporate banking arm of financial services giant Citigroup. The corporation has 275,000 employees operating in over 100 countries. The group’s banking services is represented around the world, as well as in South Africa, with offices in Johannesburg, Durban, Port Elizabeth and Cape Town. In South Africa, Citigroup offers a broad range of financial products and services, including: corporate finance, cash management, corporate and investment banking and also treasury services such as foreign exchange, derivatives and trade finance to large local corporations and multinationals.
Credit Agricole
50 employees www.ca-cib.com
13 2 1 Crédit Agricole CIB is the Corporate and Investment Banking arm of the Crédit Agricole Group, the world’s ninth-largest, Europe’s third-largest and France’s first-largest bank on the basis of Tier 1 capital (The Banker – July 2009). The Group is present in 70 countries and has 162,000 employees worldwide.
Deutsche Bank
200 employees www.db.com
20 7 1 A leader in Germany and Europe, Deutsche Bank offers financial services in 74 countries through 3,083 branches worldwide, holds EUR1,906bn in assets, and has 100,000 employees. Deutsche Bank comprises three Group Divisions: Corporate and Investment Bank, Private Clients and Asset Management and Corporate Investments. In South Africa, Deutsche Bank has locations in Sandton and Cape Town.

94 2011 Edition
Foreign banks
World ranking *The Banker, July 2010 Home country
Ranking* Tier 1Background comments **
Tier 1 Assets
HSBC
200 employees www.hsbc.co.za
5 4 2 HSBC Holdings plc is headquartered in the UK. With assets of US$2,455bn at 31 December 2010, HSBC is one of the world’s largest banking and financial services organisations. HSBC established a presence in Sub-Saharan Africa in 1981 and entered the South African market in 1995. The HSBC Bank plc – Johannesburg branch employs over 120 staff. Its operations in the region now cover Commercial Banking, Corporate Banking, Global Investment Banking, Transaction Banking (Trade Services and Payments and Cash Management), Treasury and Capital Markets and Equities.
JPMorgan Chase Bank
500 employees www.jpmorganchase.com
2 8 2 JPMorgan Chase is a global financial services firm with assets of US$2 trillion, more than 200,000 employees and operations in more than 60 countries. It is a component of the Dow Jones Industrial Average. JPMorgan Chase has corporate headquarters in New York and U.S. and consumer and commercial banking headquarters in Chicago. It is involved in six lines of business: Investment Bank, Retail Financial Services, Card Services, Commercial Banking, Treasury & Securities Services and Asset Management.
Société Générale
51 employees www.socgen.com
19 17 4 Société Générale is a French-based financial services group. The Group operates in 82 countries and employs 160,700 people worldwide in three key businesses: Retail Banking & Financial Services, Global Investment Management & Services, and Corporate & Investment Banking. Société Générale Group serves 22.5m customers in France and worldwide.
Standard Chartered Bank
230 employees www.standardchartered.com
42 49 5 Standard Chartered has a history of over 150 years in banking and operates in many of the world’s fastest-growing markets with a global network of over 1,700 branches in over 70 countries. Standard Chartered serves both Consumer and Wholesale Banking customers worldwide and employs almost 80,000 people, representing over 115 nationalities. In South Africa, Standard Chartered offers Personal Banking, Commercial Banking, and Global Markets services.
Background comments on participants

2011 Edition 95
Foreign banks
World ranking *The Banker, July 2010 Home country
Ranking* Tier 1Background comments **
Tier 1 Assets
The South African Bank of Athens***
170 employees www.bankofathens.co.za
100 106 1 The South African Bank of Athens was established in 1947. It is a 99.70% subsidiary of National Bank of Greece S.A., an international banking and financial service provider listed on the New York and Athens Stock Exchanges, with total assets in excess of euro 100bn in 2010. From its head office in Johannesburg and ten branches in Gauteng, Western Cape and KwaZulu-Natal, Bank of Athens serves its clientele as a fully-fledged, registered, commercial and clearing bank.
State Bank of India
45 employees www.statebank.co.za
68 74 1 State Bank of India (SBI), with a 200 year history, is the largest commercial bank in India in terms of assets, deposits, profits, branches, customers and employees. The Government of India is the single largest shareholder with 59.41% ownership. The SBI group, consists of SBI, six associate banks and more than 50 subsidiaries and joint ventures worldwide. The group has an extensive network, with over 17,000 branches and 142 foreign offices in over 30 countries across the world. As of 31st March 2010, the Group had assets worth US$284bn. In South Africa, the Johannesburg branch of SBI was established in March 1997.
UBS
70 employees www.ubs.com
35 20 2 UBS is present in all major financial centres, with offices in more than 50 countries. It employs around 65,000 people, with 37% in the Americas, 37% in Switzerland, 16% in the rest of Europe and 10% in Asia Pacific. UBS offers Wealth Management, Asset Management, Investment Banking and Securities and Swiss Retail and Corporate Banking services. It has a BIS Tier 1 ratio of 15.4%, invested assets of CHF 2.23 trillion, shareholders’ equity of CHF 41bn and market capitalisation of CHF 57.1bn on 31 December 2009.
* World rankings were taken from The Banker, July 2010** The background comments were taken from the respective banks’ websites in April 2011*** As noted for confidentiality reasons South African Bank of Athens has been placed in the domestic group alongside ABSA and Mercantile Bank.
Background comments on participants

96 2011 Edition
BA 900 Summary of SA Banks Reprinted with the permission of Ratings Afrika
March 2011
Capital, Deposits and other Liabilities to the Public ( Zar Million ) Page 1/2
Line no: 1 2 3 4 5 6 1-6 3 42 51 58 57 67 78 79 80 97 101 78-101
Item no
Bank
Che
que
d
epo
sits
Sav
ing
d
epo
sits
Oth
er d
eman
d
dep
osi
ts
Sho
rt-t
erm
d
epo
sits
Med
ium
-ter
m
dep
osi
ts
Long
-ter
m
dep
osi
ts
Tota
l dep
osi
ts
Inte
r D
I fu
ndin
g
Rep
urch
ag
reem
ents
Co
llate
ralis
ed
bo
rro
win
gs
Fo
reig
n fu
ndin
g
Oth
er lo
ans
Oth
er p
ublic
lia
bs
Tota
l pub
lic
liab
iliti
es
Acc
epta
nces
Oth
er
liab
iliti
es
Sha
re c
apit
al
Oth
er
rese
rves
Tota
l eq
uity
&
liab
iliti
es
1 Absa Bank Ltd 114,191 65,663 83,110 37,722 98,946 114,214 513,846 24,843 9,173 347 10,115 33,395 566,876 49,662 16,412 33,099 666,049
2 African Bank Ltd 661 901 6,697 19,500 27,760 32 245 2,757 30,761 2,090 7,557 2,393 42,801
3 Albaraka Bank Ltd 174 44 739 931 687 2,575 2,575 15 255 81 2,927
4 Bank of Baroda 29 15 102 159 143 447 70 447 0 63 54 564
5 Bank of China Ltd Jhb Branch 226 463 71 1,890 130 2,779 75 1,956 4,735 97 600 220 5,652
6 Bank of Taiwan South Africa Branch 102 524 86 9 720 2 6 726 17 50 156 949
7 Bidvest Bank Limited 171 638 19 427 22 1,277 5 1,277 239 2 1,029 2,547
8 Credit Agricole Corporate And Investment Bank 41 10,374 2,355 2,124 2,103 16,997 502 16,997 940 583 613 19,133
9 Capitec Bank 4,124 134 204 1,762 4,015 10,238 7 450 10,688 914 259 3,022 14,883
10 China Construction Bank Corporation – Jhb Branch 3,212 1,759 1,433 503 6,907 1,035 6,907 78 700 174 7,858
11 Citibank N.A 9,018 10,477 359 712 20,566 125 1,268 4 21,838 8,776 2,165 1,961 34,740
12 Deutsche Bank Ag 76 12,241 7,838 56 746 20,957 3,468 9,685 30,642 11,501 885 488 43,516
13 FirstRand Bank Ltd 101,978 2,163 125,911 37,811 76,814 93,075 437,751 19,709 35,039 6,595 10,129 8,398 497,911 63,804 14,308 26,337 602,361
14 GBS Mutual Bank 1 16 149 182 319 667 1 667 18 114 799
15 Grindrod Bank Ltd 875 54 1,113 45 2,087 270 2,087 64 227 125 2,503
16 Habib Overseas Bank Ltd 215 40 258 70 58 1 642 13 654 8 20 40 723
17 Hbz Bank Ltd 827 138 54 733 449 27 2,228 5 2,228 27 50 130 2,434
18 Hsbc – Johannesburg Branch 4,715 52 7,725 1,564 1,934 174 16,164 346 13 16,177 650 885 440 18,152
19 Investec Bank Ltd 2,928 43,691 28,184 52,353 36,288 163,444 3,166 10,945 4,569 6,866 185,825 14,401 11,871 5,389 217,486
20 JPMorgan Chase Bank 5,493 69 189 383 6,134 1,470 268 6,402 12,575 2,650 21,628
21 Mercantile Bank Ltd 775 165 992 722 1,244 406 4,305 15 49 4,354 145 1,483 101 6,083
22 Nedbank Ltd 81,828 8,404 137,594 36,825 87,573 100,648 452,872 22,595 13,106 1,570 28,159 495,708 18,388 14,461 22,004 550,560
23 Sasfin Bank Ltd 38 804 159 323 21 1,346 38 82 1,428 197 313 255 2,194
24 Societe Generale Johannesburg Branch 0 5,072 290 607 5,969 772 3 5,972 162 296 160 6,590
25 Standard Chartered Bank 840 5,796 4,503 1,762 2,050 14,951 1,557 14,951 214 1,290 100 16,554
26 State Bank of India 218 10 37 661 148 281 1,355 2 1,355 25 536 104 2,020
27 The S A Bank of Athens Ltd 203 111 196 9 407 41 967 1 26 11 40 1,044 12 195 1,252
28 The Standard Bank of S A Ltd 138,697 38,607 49,202 126,108 89,693 119,548 561,855 20,738 5,337 37,046 32,052 636,290 92,256 26,290 21,657 776,494
29 Ubank Limited 2,164 3 101 394 124 2,786 2,786 104 245 275 3,410
30 VBS Mutual Bank 167 8 3 49 226 3 229 23 252
31 Total 453,917 125,098 505,173 290,614 430,468 495,550 2,300,818 100,851 84,836 13 52,353 20,304 112,215 2,570,539 277,382 104,651 120,544 3,073,116

2011 Edition 97
March 2011
Capital, Deposits and other Liabilities to the Public ( Zar Million ) Page 1/2
Line no: 1 2 3 4 5 6 1-6 3 42 51 58 57 67 78 79 80 97 101 78-101
Item no
Bank
Che
que
d
epo
sits
Sav
ing
d
epo
sits
Oth
er d
eman
d
dep
osi
ts
Sho
rt-t
erm
d
epo
sits
Med
ium
-ter
m
dep
osi
ts
Long
-ter
m
dep
osi
ts
Tota
l dep
osi
ts
Inte
r D
I fu
ndin
g
Rep
urch
ag
reem
ents
Co
llate
ralis
ed
bo
rro
win
gs
Fo
reig
n fu
ndin
g
Oth
er lo
ans
Oth
er p
ublic
lia
bs
Tota
l pub
lic
liab
iliti
es
Acc
epta
nces
Oth
er
liab
iliti
es
Sha
re c
apit
al
Oth
er
rese
rves
Tota
l eq
uity
&
liab
iliti
es
1 Absa Bank Ltd 114,191 65,663 83,110 37,722 98,946 114,214 513,846 24,843 9,173 347 10,115 33,395 566,876 49,662 16,412 33,099 666,049
2 African Bank Ltd 661 901 6,697 19,500 27,760 32 245 2,757 30,761 2,090 7,557 2,393 42,801
3 Albaraka Bank Ltd 174 44 739 931 687 2,575 2,575 15 255 81 2,927
4 Bank of Baroda 29 15 102 159 143 447 70 447 0 63 54 564
5 Bank of China Ltd Jhb Branch 226 463 71 1,890 130 2,779 75 1,956 4,735 97 600 220 5,652
6 Bank of Taiwan South Africa Branch 102 524 86 9 720 2 6 726 17 50 156 949
7 Bidvest Bank Limited 171 638 19 427 22 1,277 5 1,277 239 2 1,029 2,547
8 Credit Agricole Corporate And Investment Bank 41 10,374 2,355 2,124 2,103 16,997 502 16,997 940 583 613 19,133
9 Capitec Bank 4,124 134 204 1,762 4,015 10,238 7 450 10,688 914 259 3,022 14,883
10 China Construction Bank Corporation – Jhb Branch 3,212 1,759 1,433 503 6,907 1,035 6,907 78 700 174 7,858
11 Citibank N.A 9,018 10,477 359 712 20,566 125 1,268 4 21,838 8,776 2,165 1,961 34,740
12 Deutsche Bank Ag 76 12,241 7,838 56 746 20,957 3,468 9,685 30,642 11,501 885 488 43,516
13 FirstRand Bank Ltd 101,978 2,163 125,911 37,811 76,814 93,075 437,751 19,709 35,039 6,595 10,129 8,398 497,911 63,804 14,308 26,337 602,361
14 GBS Mutual Bank 1 16 149 182 319 667 1 667 18 114 799
15 Grindrod Bank Ltd 875 54 1,113 45 2,087 270 2,087 64 227 125 2,503
16 Habib Overseas Bank Ltd 215 40 258 70 58 1 642 13 654 8 20 40 723
17 Hbz Bank Ltd 827 138 54 733 449 27 2,228 5 2,228 27 50 130 2,434
18 Hsbc – Johannesburg Branch 4,715 52 7,725 1,564 1,934 174 16,164 346 13 16,177 650 885 440 18,152
19 Investec Bank Ltd 2,928 43,691 28,184 52,353 36,288 163,444 3,166 10,945 4,569 6,866 185,825 14,401 11,871 5,389 217,486
20 JPMorgan Chase Bank 5,493 69 189 383 6,134 1,470 268 6,402 12,575 2,650 21,628
21 Mercantile Bank Ltd 775 165 992 722 1,244 406 4,305 15 49 4,354 145 1,483 101 6,083
22 Nedbank Ltd 81,828 8,404 137,594 36,825 87,573 100,648 452,872 22,595 13,106 1,570 28,159 495,708 18,388 14,461 22,004 550,560
23 Sasfin Bank Ltd 38 804 159 323 21 1,346 38 82 1,428 197 313 255 2,194
24 Societe Generale Johannesburg Branch 0 5,072 290 607 5,969 772 3 5,972 162 296 160 6,590
25 Standard Chartered Bank 840 5,796 4,503 1,762 2,050 14,951 1,557 14,951 214 1,290 100 16,554
26 State Bank of India 218 10 37 661 148 281 1,355 2 1,355 25 536 104 2,020
27 The S A Bank of Athens Ltd 203 111 196 9 407 41 967 1 26 11 40 1,044 12 195 1,252
28 The Standard Bank of S A Ltd 138,697 38,607 49,202 126,108 89,693 119,548 561,855 20,738 5,337 37,046 32,052 636,290 92,256 26,290 21,657 776,494
29 Ubank Limited 2,164 3 101 394 124 2,786 2,786 104 245 275 3,410
30 VBS Mutual Bank 167 8 3 49 226 3 229 23 252
31 Total 453,917 125,098 505,173 290,614 430,468 495,550 2,300,818 100,851 84,836 13 52,353 20,304 112,215 2,570,539 277,382 104,651 120,544 3,073,116
BA 900 Summary of SA Banks Reprinted with the permission of Ratings Afrika

98 2011 Edition
BA 900 Summary of SA Banks Reprinted with the permission of Ratings Afrika
March 2011
Loans, Advances and Other Assets ( Zar Million ) Page 2 / 2
103 111 117 118 139 150 166 126 135 171 180 194 195 246 258 267
Line no
Bank
Cen
tral
b
ank,
m
one
y &
g
old
SA
Ban
ks
Fore
ign
loan
s
Res
ale
agre
emen
ts
Inst
alm
ent
finan
ce
Mo
rtg
age
adva
nces
Cre
dit
car
ds
Fore
ign
curr
ency
lo
ans
Red
eem
’l p
ref
shar
es
Pub
lic
sect
or
o/d
, lo
ans
Ove
rdra
ft
Pri
vate
se
cto
r
Imp
airm
ents
Inve
stm
ents
Acc
ept
CP,
B
ills
PN
Fixe
d a
sset
s (N
on-
Fin
)
Oth
er
asse
ts
Tota
l ass
ets
1 Absa Bank Ltd 17,611 6,704 2,509 6,292 51,783 301,130 15,525 16,119 3,608 14,710 104,777 12,624 104,617 13,626 7,346 12,316 666,049
2 African Bank Ltd 737 4,615 44 4,011 33,003 6,053 453 1,156 4,414 422 42,801
3 Albaraka Bank Ltd 64 702 346 1,316 15 23 374 104 13 2,927
4 Bank of Baroda 9 112 2 35 385 5 25 1 0 564
5 Bank of China Ltd Jhb Branch 49 74 3,730 1,315 8 39 440 10 3 5,652
6 Bank of Taiwan South Africa Branch 19 9 313 463 114 6 29 1 8 949
7 Bidvest Bank Limited 70 368 87 51 233 6 237 7 724 694 85 2,547
8 Credit Agricole Corporate And Investment Bank 14 0 11,397 3 2,200 4,533 975 1 11 19,133
9 Capitec Bank 1,018 92 996 22 12,126 885 16 915 399 182 14,883
10 China Construction Bank Corporation – Jhb Branch 141 5 3,441 1,320 2,007 79 666 167 168 23 7,858
11 Citibank N.A 1,740 4,074 93 1,878 2,920 202 7,123 94 16,449 88 128 140 34,740
12 Deutsche Bank Ag 2 2,565 13,763 13,358 79 13,152 518 1 79 43,516
13 FirstRand Bank Ltd 14,838 10,669 2,826 29,353 80,216 162,045 10,585 10,250 26,507 10,743 113,342 9,045 93,353 31,387 8,357 6,935 602,361
14 GBS Mutual Bank 16 75 198 426 25 7 21 39 2 4 799
15 Grindrod Bank Ltd 44 68 669 171 1,276 9 16 78 2 187 2,503
16 Habib Overseas Bank Ltd 17 355 37 247 3 2 60 4 4 723
17 HBZ Bank Ltd 30 1,183 242 31 675 9 161 102 14 6 2,434
18 HSBC – Johannesburg Branch 626 581 6 3,291 1,994 12 1,349 10,194 11 111 18,152
19 Investec Bank Ltd 6,768 11,592 8,157 876 68,225 1,337 4,726 9,195 45,706 1,366 39,857 21,286 388 740 217,486
20 JPMorgan Chase Bank 13 13 6,879 407 212 27 12,763 1,278 18 18 21,628
21 Mercantile Bank Ltd 110 92 276 1,891 19 572 2,472 71 118 248 246 111 6,083
22 Nedbank Ltd 15,046 11,243 2,878 9,700 67,222 222,929 8,206 13,354 1,300 16,419 115,857 11,324 55,501 9,269 8,059 4,900 550,560
23 Sasfin Bank Ltd 32 169 725 93 767 59 100 153 84 129 2,194
24 Societe Generale Johannesburg Branch 10 5,732 79 3 221 0 391 36 4 114 6,590
25 Standard Chartered Bank 375 2,753 215 3,022 7,527 52 762 1,829 31 92 16,554
26 State Bank of India 29 253 1 42 176 1,281 43 73 192 1 14 2,020
27 The S A Bank of Athens Ltd 35 18 197 545 14 350 18 1 58 45 7 1,252
28 The Standard Bank of S A Ltd 15,771 43,700 8,128 13,067 43,804 285,259 17,991 51,511 17,841 2,735 112,524 13,522 139,485 20,042 12,647 5,510 776,494
29 Ubank Limited 127 355 0 403 1,097 253 634 753 146 148 3,410
30 VBS Mutual Bank 7 72 0 154 3 0 14 2 1 252
31 Total 75,366 108,243 16,515 90,090 245,779 1,045,487 57,674 139,365 59,047 46,351 568,535 55,568 485,287 115,300 43,328 32,314 3,073,116

2011 Edition 99
BA 900 Summary of SA Banks Reprinted with the permission of Ratings Afrika
March 2011
Loans, Advances and Other Assets ( Zar Million ) Page 2 / 2
103 111 117 118 139 150 166 126 135 171 180 194 195 246 258 267
Line no
Bank
Cen
tral
b
ank,
m
one
y &
g
old
SA
Ban
ks
Fore
ign
loan
s
Res
ale
agre
emen
ts
Inst
alm
ent
finan
ce
Mo
rtg
age
adva
nces
Cre
dit
car
ds
Fore
ign
curr
ency
lo
ans
Red
eem
’l p
ref
shar
es
Pub
lic
sect
or
o/d
, lo
ans
Ove
rdra
ft
Pri
vate
se
cto
r
Imp
airm
ents
Inve
stm
ents
Acc
ept
CP,
B
ills
PN
Fixe
d a
sset
s (N
on-
Fin
)
Oth
er
asse
ts
Tota
l ass
ets
1 Absa Bank Ltd 17,611 6,704 2,509 6,292 51,783 301,130 15,525 16,119 3,608 14,710 104,777 12,624 104,617 13,626 7,346 12,316 666,049
2 African Bank Ltd 737 4,615 44 4,011 33,003 6,053 453 1,156 4,414 422 42,801
3 Albaraka Bank Ltd 64 702 346 1,316 15 23 374 104 13 2,927
4 Bank of Baroda 9 112 2 35 385 5 25 1 0 564
5 Bank of China Ltd Jhb Branch 49 74 3,730 1,315 8 39 440 10 3 5,652
6 Bank of Taiwan South Africa Branch 19 9 313 463 114 6 29 1 8 949
7 Bidvest Bank Limited 70 368 87 51 233 6 237 7 724 694 85 2,547
8 Credit Agricole Corporate And Investment Bank 14 0 11,397 3 2,200 4,533 975 1 11 19,133
9 Capitec Bank 1,018 92 996 22 12,126 885 16 915 399 182 14,883
10 China Construction Bank Corporation – Jhb Branch 141 5 3,441 1,320 2,007 79 666 167 168 23 7,858
11 Citibank N.A 1,740 4,074 93 1,878 2,920 202 7,123 94 16,449 88 128 140 34,740
12 Deutsche Bank Ag 2 2,565 13,763 13,358 79 13,152 518 1 79 43,516
13 FirstRand Bank Ltd 14,838 10,669 2,826 29,353 80,216 162,045 10,585 10,250 26,507 10,743 113,342 9,045 93,353 31,387 8,357 6,935 602,361
14 GBS Mutual Bank 16 75 198 426 25 7 21 39 2 4 799
15 Grindrod Bank Ltd 44 68 669 171 1,276 9 16 78 2 187 2,503
16 Habib Overseas Bank Ltd 17 355 37 247 3 2 60 4 4 723
17 HBZ Bank Ltd 30 1,183 242 31 675 9 161 102 14 6 2,434
18 HSBC – Johannesburg Branch 626 581 6 3,291 1,994 12 1,349 10,194 11 111 18,152
19 Investec Bank Ltd 6,768 11,592 8,157 876 68,225 1,337 4,726 9,195 45,706 1,366 39,857 21,286 388 740 217,486
20 JPMorgan Chase Bank 13 13 6,879 407 212 27 12,763 1,278 18 18 21,628
21 Mercantile Bank Ltd 110 92 276 1,891 19 572 2,472 71 118 248 246 111 6,083
22 Nedbank Ltd 15,046 11,243 2,878 9,700 67,222 222,929 8,206 13,354 1,300 16,419 115,857 11,324 55,501 9,269 8,059 4,900 550,560
23 Sasfin Bank Ltd 32 169 725 93 767 59 100 153 84 129 2,194
24 Societe Generale Johannesburg Branch 10 5,732 79 3 221 0 391 36 4 114 6,590
25 Standard Chartered Bank 375 2,753 215 3,022 7,527 52 762 1,829 31 92 16,554
26 State Bank of India 29 253 1 42 176 1,281 43 73 192 1 14 2,020
27 The S A Bank of Athens Ltd 35 18 197 545 14 350 18 1 58 45 7 1,252
28 The Standard Bank of S A Ltd 15,771 43,700 8,128 13,067 43,804 285,259 17,991 51,511 17,841 2,735 112,524 13,522 139,485 20,042 12,647 5,510 776,494
29 Ubank Limited 127 355 0 403 1,097 253 634 753 146 148 3,410
30 VBS Mutual Bank 7 72 0 154 3 0 14 2 1 252
31 Total 75,366 108,243 16,515 90,090 245,779 1,045,487 57,674 139,365 59,047 46,351 568,535 55,568 485,287 115,300 43,328 32,314 3,073,116

100 2011 Edition
PwC – Who we are

2011 Edition 101
PwC is truly a global organisation committed to helping our clients meet the challenges posed by the global economy. We are one of the largest knowledge businesses in the world – a leader in every market in which we operate. Worldwide, we possess an enviable breadth and depth of resources, yet we work locally, bringing appropriate local knowledge and experience to bear – and using the depth of our resources to provide a professional service, specifically tailored to meet our clients’ needs.
The service we offer to clients is underpinned by our extensive coverage and breadth of skills. When PwC was formed on 1 July 1998, it immediately became the largest professional services firm ever created. This marked a quantum leap in global professional services, bringing together thousands of people all over the world possessing considerable collective expertise and sharing a single goal of enhancing client value.
A leading professional services firm
Servicing our markets The objectives of our service offering are to build trust and enhance value for our clients and stakeholders. To meet the requirements of our clients, as well as regulators, our services are grouped into three distinct service lines, namely Assurance, Advisory and Tax.
We continue to operate as a multi-competency organisation offering a range of high-quality services to clients. In our business change is the only constant and we are continually adapting our range of services to ensure our sustainability and that of our clients and stakeholders. As market needs change, so will our service offering.
AssuranceOur Assurance group provides audit assurance to clients through PwC Incorporated on their financial performance and operations, as well as helping them improve their external financial reporting and adapt to new regulatory requirements such as the King Report on Corporate governance for South Africa 2002 and International Financial Reporting Standards (IFRS).
The true value of an audit is not solely in ensuring compliance with exacting rules, regulations and standards. Instead it lies in our focus on substance over form and on progressing toward a reporting and audit model that communicates better information about a company’s long-term value and the risks that are being taken to achieve such value.
Our leading-edge audit approach can be tailored to meet the needs of any size organisation, as evidenced by our appointment as auditor to some of the largest organisations as well as to thousands of small and mid-sized businesses. In every case, the Our service offering PwC audit is underpinned by our deep industry knowledge, wide international experience, and global network of skilled professionals.
This deep industry knowledge is one of the foundations of our success. Our teams are aligned to the industry groupings in which they have the most expertise, enabling them to deliver tailored solutions to complex issues in these sectors. Our traditional core competency has been augmented over the years by the development of additional services that address our clients’ requirements.

102 2011 Edition
Our audit clients include many of the top performing companies on the JSE Securities Exchange SA, as well as many small and mid-sized businesses. In addition to audit, other services provided include accounting and regulatory advice, and attest and attestrelated services.
Contact person
Brendan Deegan at 011 797 5473 or [email protected].
AdvisoryAdvisory provides advice and assistance based on financial, analytical and business process skills to corporations, government bodies and intermediaries in the implementation of strategies relating to:
• Creating/acquiring/financing businesses
• Integrating them into current operations
• Enhancing performance
• Improving management and control
• Dealing with crises
• Restructuring and realising value
Offered by trained professionals specialising in their respective fields and industries, we provide advisory services in an objective manner that help our advisory clients create stakeholder value, build trust and communicate with the marketplace.
To best serve our advisory clients and build new businesses, we understand their needs through each stage of what we call the business lifecycle. To this end, our advisory services are built around four key client priorities: transactions; performance
improvement; governance, risk and compliance; and crisis management. Our competencies span the breadth of these priorities, and we bring them to our clients in a variety of service offerings.
Transactions
Comprehensive services related to financial transactions, including financial due diligence, valuations, financial modelling, negotiating and structuring acquisitions and disposals, raising finance, and developing exit strategies.
Performance Improvement
Services to assist our clients in identifying and implementing costsaving initiatives, and improving management, control and quality.
Risk Advisory Services
Services to assist our clients in measuring and monitoring ongoing governance, sustainability and compliance infrastructures, and the efficiency and effectiveness of financial, non-financial and information technology controls and systems.
Comprehensive services related to business recovery, restructuring, dispute analysis and forensic investigations.
Contact person
Jacques Louw at 011 797 4400 or [email protected]

2011 Edition 103
TaxTaxation is one of the biggest cost items in any business, yet it is one of the most manageable. Using state-of-the-art methodologies and technology, coupled with specialist skills, our national team of advisers can assist clients to manage their tax risk and where possible, minimise their tax burden by providing innovative, often proven, practical tax and business solutions.
Our advice covers all aspects of Southern African direct and indirect taxes, exchange control regulations and employee-related issues. Through our extensive network of offices we are also able to provide advice on structuring international business operations and investments.
Corporate Tax
Corporate Tax provides specialist advice to assist South African corporates to manage taxation costs and cash flows. Our specialists are informed on current regulatory and business developments, and use this knowledge to maximise the return to our clients through corporate tax planning.
Human Resource Services
We have an established human resource practice delivering solutions to the people-related issues encountered by our clients. By combining our human resource and tax professionals, we are able to offer our clients breadth and depth of expertise in employment tax, reward, equity incentives, personal tax, social security and employment benefit services.
Our experts providing expatriate tax services examine all aspects of deploying people globally, from creating non-standard assignment programmes to managing costs through effective tax planning, process improvements and outsourcing. They are supported by highly experienced immigration specialists in South Africa and worldwide, providing advice on the immigration law and various permit categories.
Indirect Tax
Encompassing value-added tax (VAT), customs and excise duties and RSC levies, indirect tax is an increasingly complex area; every transaction in a business is affected. Our Indirect Tax team advises corporate clients on local and cross-border issues, utilising our global expertise and networks. Our clients operate across the full spectrum of industry, and we use our expertise to advise them on the best solution to their local, regional, and international issues, often utilising our global network to bring best practice to our clients.
International Tax Structuring
We provide business solutions to specific, complex client needs that serve to manage global tax risk and, where possible, minimise the global tax burden, taking into account exchange control as appropriate. We work as part of an integrated local and international industry-focused team of business advisers, to provide specialist international tax and exchange control services.
Transfer Pricing
We develop transfer pricing policies that are practical, defensible and consistent with our client’s overall business strategy. Our services include transfer pricing risk assessments and full transfer pricing studies. We

104 2011 Edition
also provide advice on current and proposed transfer pricing legislation in South Africa and abroad.
Tax Compliance Centre
We provide specialist income tax compliance services to companies, based on global best practice models. The Centre runs stateof-the-art income tax compliance processes, and has a dedicated compliance manager responsible for each outsourcing contract to ensure the timely and efficient delivery of tax returns. Tailored electronic tax data collection applications and robust risk management and quality control procedures ensure the delivery of high quality tax returns.
Contact person
Paul de Chalain at 011 797 4260 or [email protected]
Private Company ServicesBusiness leaders regard business as personal. Our past and continued involvement with business leaders gives us a broad understanding of the unique demands and challenges facing private companies today. Our response is simple – to develop professionals who understand these challenges and rise to them. These Trusted Business Advisers (TBAs) work closely with our industry experts to provide tailor-made solutions specifically geared to adding value in the private company environment. A TBA acts as a gateway to all the knowledge and expertise of our entire organisation, combined with comprehensive knowledge of local markets and industries. Through our TBAs, clients have access to an integrated service delivery approach encompassing any combination of our firm’s services.
Trust and excellence are the foundations of our relationships. We foster those relationships by engaging our clients in conversations around the issues, risks and opportunities of the day, in order to ensure that their businesses continue on the road to sustainable profitability and growth. We also know that life is about more than business. It is also about individuals. We therefore extend our involvement to offering advice on personal finances, taxation, succession, estate and retirement planning. We assist clients with every facet of their business in order to add real value, and help them achieve their business goals and dreams.
Contact person
Andries Brink at 012 429 0600 or [email protected].

2011 Edition 105
One of the foundations of our success is our ability to adapt our services to meet the needs of our clients. Internationally, teams are aligned to the industry groupings in which they have the most expertise, enabling them to deliver tailored solutions to problems in these sectors.
The depth of our industry expertise, like our international perspective, is an attribute that our clients value highly. We invest significant resources in building and sharing such expertise. We have organised ourselves around industries to:
• Share the latest research and points of view on emerging industry trends;
• Locate individual experts on each issue, wherever they are based;
• Develop industry-specific performance benchmarks, based on global best practices;
• Share methodologies and approaches in complex areas such as financial instruments and tax provisioning; and
• Collaborate on accounting or technical issues unique to a particular industry, especially when interpretive guidance is needed.
Our clients range from the country’s largest and most complex organisations to some of its most innovative entrepreneurs – we are privileged to work with such an unrivalled client base. We serve many of the leading businesses in every sector on which we focus; those businesses value our rigorous, practical approach, characterised by a detailed understanding of individual client issues and by deep industry knowledge and experience. We have organised ourselves around industries to:
• Share the latest research and points of view on emerging industry trends.
• Locate individual experts on each issue, wherever they are based.
• Develop industry-specific performance benchmarks, based on global best practices.
• Share methodologies and approaches in complex areas such as financial instruments and tax provisioning.
• Collaborate on accounting or technical issues unique to a particular industry, especially when interpretive guidance is needed.
Our industry groups are:
• Financial Services
• Consumer and Industrial Products and Services (CIPS)
• Technology, InfoComm, Entertainment and Media (TICE)
• Mining
• Public Sector
• Health Care
• Higher Education
• Agribusiness
A focus on industries

106 2011 Edition
The financial services industry landscape is continually changing and increasing in complexity, causing firms to face a diverse array of challenges and concerns. Corporate governance, risk management and regulatory issues continue to impact the industry. Firms have expanded international operations around the globe to tap into new markets as a source of growth, increase their competitiveness, satisfy demand and better leverage their expertise. To assist our clients, our professionals have in-depth knowledge of the issues driving change in the various sectors of the financial services industry.
This knowledge, combined with our specialised skills, enables us to design and implement cost-effective multi-disciplinary solutions to meet the challenges and opportunities facing our clients.
Banking and Capital Markets
The banking and capital markets industry continues to be transformed by increasing globalisation, advancing technology,, and changing demographics. Protecting and enhancing a frim’s reputation as well as rebuilding investor confidence and trust, have become high priorities.
We have the largest specialist financial services practice in Southern Africa, managed by a multidisciplinary team of auditors, advisers and tax professionals. Our strategy is to bring significant business advantage to our clients through global multidisciplinary teams, integrated across industry sectors, geographies and functional skills.
Our banking and capital markets practice has taken the lead in presenting significant research on the local banking industry in order to complement our substantial international research projects.
We act as auditors to more financial services companies in South Africa than any other professional services firm.
The leadership of our Southern African Financial Services practice would be pleased to hear from you.
Financial Services Leader:
Tom Winterboer +27 11 797 5407
Banking and Capital Markets Leader:
Johannes Grosskopf +27 11 797 4346
Insurance Leader:
Victor Muguto +27 11 797 5372
Actuarial Services Leader:
Mark Claassen +27 21 529 2522
Asset Management Leader:
Pierre de Villiers +27 11 797 5368
Retirement and Medical Aid Funds Leader:
Gert Kapp +27 12 429 0059
Financial Services

2011 Edition 107
South Africa Gauteng: Johannesburg and Pretoria
Private Bag X36 Sunninghill 2157
Tel +27 11 797 4000 Fax +27 11 797 5819
Contact: Tom Winterboer
Cape Town
PO Box 2799 Cape Town 8000
Tel +27 21 529 2118 Fax +27 21 529 1618
Contact: Hennie Nel
Southern Africa Namibia, Windhoek
PO Box 1571 Windhoek
Tel +264 61 284 1000 Fax +264 61 284 1001
Contact: Louis van der Riet
Swaziland, Mbabane
PO Box 569 Mbabane
Tel +268 404 3143 Fax +268 404 5015
Contact: Theo Mason
Botswana, Gaborone
PO Box 1453 Gaborone
Tel +267 395 2011 Fax +267 397 3901
Contact: Rudi Binedell
Zimbabwe, Harare
PO Box 453 Harare
Tel +263 4 3383 628 Fax +263 4 3383 96
Contact: Clive Mukondiwa
Mozambique, Maputo
PO Box 2583 Maputo
Tel +258 21 307 620 Fax +258 21 307 621
Contact: Rob Walker

©2011. PricewaterhouseCoopers (“PwC”), the South African firm. All rights reserved. In this document, “PwC” refers to PricewaterhouseCoopers in South Africa, which is a member firm of PricewaterhouseCoopers International Limited (PwCIL), each member firm of which is a separate legal entity and does not act as an agent of PwCIL. 11-09048