
Unleashing India's Innovation
224
Unleashing India’s Innovation
Transcript of Unleashing India's Innovation
Unleashing India’sInnovation

Unleashing India’s Innovation
Toward Sustainable and Inclusive Growth
Mark A. Dutz, Editor
Washington, D.C.
© 2007 The International Bank for Reconstruction and Development / The World Bank1818 H Street, NWWashington, DC 20433Telephone: 202-473-1000Internet: www.worldbank.orgE-mail: [email protected]
All rights reserved
1 2 3 4 10 09 08 07
This volume is a product of the staff of the International Bank for Reconstruction and Development /The World Bank. The findings, interpretations, and conclusions expressed in this volume do not necessarily reflect the views of the Executive Directors of The World Bank or the governments they represent. The World Bank does not guarantee the accuracy of the data included in this work. Theboundaries, colors, denominations, and other information shown on any map in this work do notimply any judgement on the part of The World Bank concerning the legal status of any territory or theendorsement or acceptance of such boundaries.
Rights and PermissionsThe material in this publication is copyrighted. Copying and/or transmitting portions or all of this workwithout permission may be a violation of applicable law. The International Bank for Reconstruction and Development / The World Bank encourages dissemination of its work and will normally grant permission to reproduce portions of the work promptly.
For permission to photocopy or reprint any part of this work, please send a request with completeinformation to the Copyright Clearance Center Inc., 222 Rosewood Drive, Danvers, MA 01923, USA;telephone: 978-750-8400; fax: 978-750-4470; Internet: www.copyright.com.
All other queries on rights and licenses, including subsidiary rights, should be addressed to theOffice of the Publisher, The World Bank, 1818 H Street, NW, Washington, DC 20433, USA;fax: 202-522-2422; e-mail: [email protected].
ISBN: 978-0-8213-7197-8eISBN: 978-0-8213-7198-5DOI: 10.1596/978-0-8213-7197-8
Cover design: Quantum Think, Philadelphia, Pennsylvania
Library of Congress Cataloging-in-Publication DataUnleashing India’s innovation : toward sustainable and inclusive growth / edited by Mark A. Dutz.
p. cm.Includes bibliographical references and index.ISBN 978-0-8213-7197-8 — ISBN 978-0-8213-7198-5 (electronic)
1. India—Economic policy—1991– 2. Sustainable development—India.3. India—Economic conditions—1991– I. Dutz, Mark Andrew.
HC435.3.U55 2007338.954'07—dc22 2007026343
v
Contents
Foreword ix
Acknowledgments xi
Abbreviations xiii
Executive Summary xv
Overview: Toward an Action Agenda for Innovation 1
Mark A. Dutz
1 The Indian Context and Enabling Environment 23
Mark A. Dutz and Carl Dahlman
2 Creating and Commercializing Knowledge 49
Carl Dahlman, Mark A. Dutz, and Vinod K. Goel
3 Diffusing and Absorbing Knowledge 83
Vinod K. Goel, Carl Dahlman, and Mark A. Dutz
4 Promoting Inclusive Innovation 105
Anuja Utz and Carl Dahlman
5 Strengthening Skills and Education for Innovation 129
Isak Froumin, Shanthi Divakaran, Hong Tan, and Yevgeniya Savchenko
6 Upgrading Information Infrastructure 147
Shanthi Divakaran, Anil Srivastava, and Mark Williams
7 Enhancing Innovation Finance 163
Inderbir Singh Dhingra
Technical Appendix 187
Bibliography 193
Index 197
Contents
Boxes1.1 Broadly Based Innovation Activities 28
1.2 Innovation Foresight Processes in Canada and the Netherlands 44
2.1 Private R&D in Pharmaceuticals 51
2.2 R&D Links between Multinational Corporations and Academia 53
2.3 International Programs to Stimulate Early-Stage Technology Development 60
2.4 CSIR: Restructuring from Technology Development for Self-Reliance to
Internationally Competitive, Market-Driven R&D 64
2.5 International Examples of Supporting High-Risk Technologies: DARPA
and ATP 68
2.6 Hsinchu Science Park 75
2.7 Collaborative Public-Private Partnerships: ICICI Knowledge Park and the
Center for Genomic Application 76
2.8 The Israeli Binational Industrial Research and Development Program 79
3.1 Technology Licensing Contracts 90
3.2 Ministry of Small Scale Industries: Selected Metrology, Standards, Testing, and
Quality Initiatives 96
3.3 Ministry of Small Scale Industries: Selected Technology Upgrading
Initiatives 99
4.1 Public Research for Development 108
4.2 University-Enabled Initiatives 109
4.3 Fortune at the Bottom of the Pyramid Initiatives 110
4.4 International Public Good–Type Innovation Efforts 112
4.5 Grassroots Innovation Networks: HBN, SRISTI, GIAN, and NIF 114
4.6 Models for Promoting Inclusive Innovations 115
4.7 Approaches to Designing Intellectual Property Rights for Traditional
Knowledge 119
4.8 China’s Spark Program 121
4.9 The Experiences of Agriculture Technology Management Agencies 122
4.10 NGO Initiatives and Rural Networks 123
4.11 Indian Initiatives for Corporate Social Responsibility 125
5.1 Malaysia’s Human Resource Development Fund 138
5.2 India’s Higher Education System 140
5.3 Training Offered by the Private Sector in India 142
6.1 The Impact of ICT on Small-Scale Fishing Enterprises in Kerala 150
6.2 What Are National Research and Education Networks? 154
6.3 Applications by National Research and Education Networks 155
6.4 Trends among National Research and Education Networks in Europe 158
7.1 International Experience with Funds of Funds to Spur Public-Private
Venture Capital Funds 175
FiguresO.1 Unleashing India’s Innovation Potential 3
1.1 India’s Dualistic Economic Structure 25
1.2 Contributions to Real GDP Growth, by Industrial Category, 2001–06 27vi
Contents
vii
1.3 R&D Effort in Various Countries, 2004 32
1.4 R&D Expenditure in India, 1990–2005 33
1.5 Innovation Outputs in Various Countries, 2003–06 35
1.6 R&D Intensity of Indian Corporations in All Reporting Firms and
Three Key Sectors, 1991–2004 39
1.7 Obstacles to Starting and Closing a Business in Various Countries, 2006 41
2.1 Key Public Institutions Involved in R&D and R&D Expenditures in India,
2003–04 63
3.1 Distribution of Value Added per Worker in India, by Sector and Company
Size, 2004 84
3.2 Openness to Global Flows of Products and Capital in Various Countries 87
3.3 Openness to Global Flows of Intellectual Property in Various Countries,
as Measured by Royalty and License Fee Payments, 2004 89
3.4 Competitive Priorities of Manufacturing Enterprises, 1997 and 2001 93
3.5 Enterprises with Internationally Recognized Quality Certification 94
5.1 Gross Enrollment Rates, 2004 131
5.2 Business Executives with Companies Headquartered in India Respond
to Future Skills Constraints in Their Sectors 134
5.3 Manufacturing Firms Offering In-Service Training 135
5.4 Gross Enrollment Ratio, Tertiary Education 141
5.5 Student Enrollment in Higher Education, 2005–06 141
6.1 Urban and Rural Teledensity (Fixed and Mobile) in India, 1998–2006 152
6.2 Capacity of International Links to National Research and
Education Networks 157
7.1 Mapping of Early-Stage Finance in India 167
7.2 Venture Capital and Private Equity Deals in India, 2000–06 169
7.3 Distribution of Venture Capital and Private Equity Deals by Investment
Stage in India, 2004–05 169
7.4 India’s Venture Capital and Private Equity Landscape: Skewed toward
Larger and Later-Investment-Stage Deals 171
7.5 Credit Flows to Micro and Small Enterprises, End-March 2003–06 179
7.6 Reliance on Internal Funds for Financing New Investments, Various
Countries, 2006 180
7.7. Access to Bank Finance in India, by Firm Size, 2006 181
Tables1.1 Changes in Labor Productivity Relative to Agriculture, by Economic
Sector Based on Principal Status of Workers, 1983–2000 26
1.2 Formal Innovation Inputs and Outputs in Various Countries, 2003–04 31
1.3 Indian Patent Applications and Grants, 1975–2005 33
1.4 Key Innovation-Related Findings of the India 2006 Enterprise Survey 36
1.5 The Enabling Environment for Innovation: Policies, Institutions,
and Capabilities 38
2.1 Programs to Promote Private R&D 56
Contents
4.1 Grassroots Innovations: Activities and Actors 113
6.1 Average Annual Growth of Value Added in Communications and Business
Services in India, 1950s–2000s 148
6.2 IT-Enabled Services and Business Process Outsourcing Revenues and
Employment in India, by Service Line, 2003–04 149
6.3 Mobile and Broadband Penetration in Various Countries, 2005–06 152
6.4 High-Speed Networks in Various Countries 156
6.5 Core Network Capacity in Selected EU/EFTA National Research and
Education Networks 159
7.1 Number of Early-Stage Deals in India, 2000–05 170
A.1 Formal and Informal Employment by Industrial Category, FY 2000 187
A.2 Innovation Outputs and Productivity: Ordinary Least Squares Estimation of
Productivity Function 188
A.3 Creation versus Absorption and Productivity: Estimation of Frontier
Production Function 189
A.4 Distribution of Indian Firms by Incidence of In-Service Training 190
A.5 Joint Estimation of Bivariate Probit Model for Innovation and
Training Decisions 191
A.6 In-Service Training and Productivity: Estimation of Productivity Function
(Ordinary Least Squares) 192
viii
ix
Foreword
The goals of this book and the collaborative process underlying its preparation are
to develop concrete actions that strengthen India’s innovation environment, enhance
productivity growth, and reduce poverty. Because innovation is a broad topic, this
volume covers a vast array of areas ranging from India’s broader economic and insti-
tutional regime—with a priority on promoting stronger competition among enter-
prises to unleash innovation—to more specific areas, such as
• formal research and development (R&D) and intellectual property rights (IPR);
• foreign investment and technology transfer;
• grassroots innovation;
• metrology, standards, testing, and quality services;
• education and skills;
• telecommunications infrastructure and high-speed research networks; and
• early-stage technology development finance and venture capital.
The book also offers many recommendations. Implementing them will require
actions by many ministries, as well as by the private sector and civil society. For tech-
nical and political reasons, not all the recommendations have the same priority or
are as easy to implement. Many have different time horizons. Some require changes
in policies and regulations. Others involve redeploying existing resources. Still others
require additional public and private resources. In addition, many of the changes will
have greater impact if there is coordination and appropriate sequencing, because
many are interdependent.
Thus, this volume should be viewed as a first step toward bringing together the
many elements that need to be addressed for India to develop an innovation economy.
The next step should be developing a realistic implementation plan that sorts
through the different priorities and sequencing of what is feasible given India’s
complex economy. This would best be done by a task force of Indian policy makers
working with business and social leaders.
Foreword
In addition, efforts should be made to raise public awareness of what is at stake
for India in light of both the rapidly changing and demanding international environ-
ment and the country’s needs and potential. The World Bank Group stands ready to
work with Indian counterparts on the issues raised in this book to help generate con-
crete results.
Praful Patel Michael U. KleinVice President, South Asia Region Vice President, Finance and Private Sector DevelopmentThe World Bank and Chief Economist
International Finance Corporation
x
xi
Acknowledgments
This book results from joint work between World Bank staff and their Indian
counterparts from government, research institutes, universities, and the private
sector. The book reflects a number of background papers commissioned in 2006
from Indian experts: Parthasarathi Banerjee (Acting Director, National Institute of
Science, Technology, and Development Studies, Council of Scientific and Industrial
Research), H. R. Bhojwani (Adviser, Ministry of Science and Technology), Evalue-
serve, C. S. Jha (Indian Institute of Technology Delhi, former Vice Chancellor,
Banaras Hindu University, and former Adviser, Ministry of Education), A. S.
Kolaskar (Adviser, National Knowledge Commission, and Vice Chancellor, Univer-
sity of Pune), A. C. Gupta (former Quality Manager and Scientist “G” at the National
Physical Laboratory), Paritosh Gupta (CEO, PDCOR Limited, Infrastructure Leasing
and Financial Services Group), R. K. Gupta (Head, Intellectual Property Management
Division, Council of Scientific and Industrial Research), Riya Sinha (former CEO,
National Innovation Foundation), Kuldeep Mathur (retired, Center for the Study of
Law and Governance, Jawaharlal Nehru University, New Delhi), Anil Srivastava
(Executive Vice President and Head, International Cooperation and Academic Rela-
tions, Capital Technology Information Services), Gopika Kannan, and Jiban Khuntia
(Center for the Development of Advanced Computing).
Based on these papers and many other inputs, a team of Bank staff and inter-
national consultants led by Mark A. Dutz (editor and lead author) wrote and con-
tributed to this volume. Carl Dahlman and Vinod K. Goel provided strong support,
as did Bruce Abramson, Gabi Afram, Inderbir Singh Dhingra, Shanthi Divakaran,
Isak Froumin, Yevgeny Kuznetsov, Yevgeniya Savchenko, Anil Srivastava, Hong Tan,
Tilahun Temesgen, Anuja Utz, and Mark Williams.
The team is grateful for the extremely helpful suggestions provided from India by
Vijay Kelkar and Sarath Naru as formal reviewers and by Ashok Ganguly, Anil Gupta,
Arun Maira, R. A. Mashelkar, H. K. Mittal, Anand Patwardhan, Sam Pitroda, and
T. Ramasami. The book has also benefited from extensive consultations with Indian
stakeholders in a range of entities involved in supporting innovation, including the
Ministry of Science and Technology, Council of Scientific and Industrial Research
and a number of its laboratories, Ministry of Small Scale Industries, Ministry of
Commerce and Industry, Ministry of Communications and Information Technology,
Acknowledgments
Ministry of Finance, National Knowledge Commission, National Productivity
Council, various universities and training entities—including the India School of
Business, Administrative Staff College of India, and several Indian Institutes of Tech-
nology and Indian Institutes of Management—industry associations (Confederation
of Indian Industries, Federation of Indian Chambers of Commerce and Industry,
AssoCham, Automotive Research Association of India), private enterprises, finance
companies, and others. The team also appreciates strong Bank management support
from Michael Carter, Fayez Omar, Sadiq Ahmed, and Simon Bell, and the helpful
feedback provided by Itzhak Goldberg, Mel Goldman, and Willem Janssen as formal
reviewers; and by Alok Aggarwal, Kareem Aziz, Heather Boyles, Juan Costain,
Michael Foley, Anupam Khanna, Harvey Newman, Tenzin Norbhu, Vincent Palmade,
Sonia Plaza, Jamil Salmi, Tatyana Soubbotina, Shashi Srivastava, Andrew Stone,
Anubha Verma, Alfred Watkins, and Charles Wessner. The volume was edited by
Paul Holtz.
Preliminary findings of the work were shared and discussed at a workshop
in New Delhi on July 4, 2006, with representatives from the public and private sec-
tors. The team held further consultations in December 2006, which included another
workshop in New Delhi on December 13, with participants from the private sec-
tor, universities, research and development laboratories, government ministries,
and other bodies.
xii
Abbreviations
Rs Indian rupees. The conversion to U.S. dollars is roughly 41 Rs to
US$1.00.
$ Unless otherwise designated, this symbol refers to U.S. dollars.
APIDC Andhra Pradesh Industrial Development Corporation
ATMA Agriculture Technology Management Agency
ATP (U.S.) Advanced Technology Program
BIRD (Israel–U.S.) Binational Industrial Research and Development Fund
BRICKM Brazil, Russia, India, China, Korea, and Mexico
BYST Bharatiya Yuva Shakti Trust
CSIR Council of Scientific and Industrial Research
DARPA (U.S.) Defense Advanced Research Projects Agency
DRDO Defence Research and Development Organization
DSIR Department of Scientific and Industrial Research
DST Department of Science and Technology
ERNET Education and Research Network
ESTD early-stage technology development
FDI foreign direct investment
GARUDA National Grid Computing Initiative
GIAN Grassroots Innovation Augmentation Network
GDP gross domestic product
HBN Honey Bee Network
HGT Home Grown Technology program
HIV/AIDS human immunodeficiency virus/acquired immune deficiency
syndrome
ICAR Indian Council of Agricultural Research
ICICI formerly Industrial Credit and Investment Corporation of India,
now ICICI Bank
ICMR Indian Council of Medical Research
ICT information and communication technology
IIMs Indian Institutes of Management
IISc Indian Institute of Science
IIT Indian Institute of Technology
IP intellectual propertyxiii
Abbreviations
IPR intellectual property rights
ISO International Organization for Standardization
IT information technology
ITES information technology–enabled services
MNC multinational corporation
MSE micro and small enterprise
MSME micro, small, and medium enterprise
MST Ministry of Science and Technology
MSTQ metrology, standards, testing, and quality
NASSCOM National Association of Software and Service Companies
NGO nongovernmental organization
NIF National Innovation Foundation
NMITLI New Millennium Indian Technology Leadership Initiative
NRDC National Research Development Corporation
NREN national research and education network
OECD Organisation for Economic Co-operation and Development
PCT Patent Cooperation Treaty
PPP purchasing power parity
PRDSF Pharmaceuticals R&D Support Fund
R&D research and development
SBIR (U.S.) Small Business Innovation Research program
SBIRI Small Business Innovation Research Initiative
SIRO scientific and industrial research organization
SME small and medium enterprise
SPREAD Sponsored Research and Development program
SRISTI Society for Research and Initiatives for Sustainable Technologies
and Institutions
SSTP State Science and Technology Program (State Councils)
TDB Technology Development Board
TDDP Technology Development and Demonstration Program
TePP Techno-entrepreneurs Promotion Program
TFP total factor productivity
TCGA The Centre for Genomic Application
TIFAC Technology Information Forecasting and Assessment Council
TKDL Traditional Knowledge Digital Library
TRIPS Trade-Related Aspects of Intellectual Property Rights
WTO World Trade Organization
xiv
xv
Executive Summary
India is increasingly becoming a top global innovator for high-tech products and
services. Still, the country is underperforming relative to its innovation potential—
with direct implications for long-term industrial competitiveness and economic
growth. About 90 percent of Indian workers are employed in the informal sector, and
this sector is often characterized by underemployment, as well as low-productivity
and low-skill activities. Although India has the benefit of a dynamic young
population—with more than half of the country’s population under 25 years old—
only 17 percent of people in their mid-20s and older have a secondary education. To
sustain rapid growth and help alleviate poverty, India needs to aggressively harness
its innovation potential, relying on innovation-led, rapid, and inclusive growth to
achieve economic and social transformation.
One of the unique features of this book is its focus on inclusive innovation—
that is, knowledge creation and absorption efforts most relevant to the needs of
the poor in India. This is in addition to the book’s emphasis on how faster growth
can be facilitated by promoting “new to the world” knowledge creation and
commercialization—the traditional understanding of the term innovation—as well
as through often underappreciated but even higher-impact “new to the market”
diffusion and absorption of existing knowledge.
To unleash its innovation potential, India needs to develop a three-pronged
strategy:
1. India would benefit from increasing competition as part of efforts to improve the
investment climate, supported by stronger skills, better information infrastructure,
and more finance—public and private.
• Competition is vital to unleash innovation. India must encourage stronger com-
petition among enterprises. Since the Indian economy was opened up in 1991,
the private sector has invested the most in research and development (R&D)
in the sectors most open to competition. In 2004, enterprise R&D was more
than seven times higher than in 1991. Recommended actions to spur competi-
tion include removing nonessential regulations and applying essential ones
more transparently in product, land, labor, capital, and infrastructure services
markets—for example, easing limits on small industries, restrictions on foreign
direct investment (FDI), and barriers to import competition, as well as intro-
ducing bankruptcy reforms and modernizing the Industrial Disputes Act.
xvi
Executive Summary
• Limited skills and training are a major bottleneck. Only 16 percent of Indian
manufacturing firms offer in-service training, compared with 92 percent in
China and 42 percent in the Republic of Korea. The Indian firms that provide
in-service training are 23–28 percent more productive than those that do not.
Moreover, gross enrollment in higher education is only 12 percent in India,
compared with 90 percent in Korea and 68 percent in the Russian Federation.
The skills bottleneck could be unblocked by providing public matching funds
for firms to invest in training, increasing the fiscal and managerial autonomy
of universities and colleges, and increasing private participation in higher
education.
• Better information flows are needed. India is already the world’s fastest-
growing market for mobile phones, with the number of wireless subscribers
jumping 55 percent in 2006. However, disparity persists between rural and
urban areas: teledensity is 40 percent in urban areas and just 4 percent in rural
areas. And while high-speed national research and education networks accel-
erate the pace of new discoveries and the expansion of knowledge, India’s
connectivity is less than 1 percent of China, Korea, the United States, and
European Union countries. Information-related actions could include expe-
diting the allocation of radio and wireless broadband spectrums, increasing
targeted subsidies for rolling out rural mobile and broadband, and agreeing
on an organizational structure to deploy and manage a national research and
education network.
• More early-stage funding is needed. In 2005, just 13 percent of deals by venture
capital and private equity providers were for early-stage funding. In dollar
terms, early-stage deals accounted for even less of such investments: 4–6 per-
cent. Cumulative start-up capital provided for seed financing in India is esti-
mated to be $25 million–$35 million—enough for 75–100 start-ups, many
fewer than the 450–600 start-ups needed. Finance-related actions could include
facilitating regulations for early-stage venture capital investments, and govern-
ment provision of leveraged returns for private investments in innovation areas
overlooked by the market (such as rural industry and pro-poor, grassroots inno-
vations) by creating a fund of funds—with distinct windows for pro-growth
innovations and inclusive innovations—with venture capital funds managed by
the private sector.
2. India would benefit from strengthening efforts to create and commercialize
knowledge, as well as better diffuse existing global and local knowledge and
increase the capacity of smaller enterprises to absorb it. If all enterprises could
costlessly achieve national best practices based on knowledge already in use in
India, economic output could more than quintuple.
• Variations in productivity highlight the need for better knowledge diffusion.
Average enterprise productivity in finance, insurance, and real estate compa-
nies is nearly 23 times that in agriculture. But these industries account for only
Executive Summary
xvii
1.3 percent of employment, while agriculture accounts for 60 percent. Actions
to better diffuse existing knowledge could include increasing openness to
trade and FDI, coupled with strengthening and expanding public support for
technology at the cluster level and modernizing infrastructure for metrology,
standards, testing, and quality (especially metrology). India could also consider
strengthening its support infrastructure for technology licensing by creating a
public-private technology acquisition fund, building on intellectual property
that is already locally available.
• Private enterprises need to increase R&D spending. Aggregate domestic R&D
spending has never exceeded 1 percent of GDP, and 75–80 percent comes
from the public sector. However, between 1998 and 2003, multinational cor-
porations spent $1.3 billion on R&D in India—showing that its valuable
assets could be exploited more effectively. Actions to spur private R&D could
include consolidating and expanding public early-stage technology develop-
ment programs, as well as developing a policy and action plan to use public
procurement to promote innovation. Reforms to existing early-stage technol-
ogy development programs could include establishing a streamlined match-
ing grant program building on India’s Sponsored Research and Development
program and Small Business Innovation Research Initiative—targeted mainly
at smaller enterprises and promoting more collaboration.
• New domestic knowledge needs to be converted to commercial use. Of the top
50 applicants for patents in India between 1995 and 2005, 44 were foreign
firms. Only six were Indian; three of these were public institutions and one, a
public corporation. Just two were private Indian firms, both in the pharma-
ceutical industry. Actions to promote commercialization and strengthen links
among industry, universities, and public laboratories could include providing
support to technology transfer offices, creating a patent management corpo-
ration, developing technology parks and incubators, and improving India’s
regime for intellectual property rights. India should also consider enhancing
support for higher-risk technology R&D and commercialization by strength-
ening its New Millennium Indian Technology Leadership Initiative—
including by opening the program to international collaboration and giving
grants to both research institutions and private enterprises, with sharing of
any resulting royalties. To further spur international collaboration, India
could create a Global Research and Industrial Partnership program to pro-
mote advanced R&D and commercialization efforts conducted jointly by
domestic and foreign enterprises.
• The diaspora needs to be tapped more effectively. About 2 percent of India’s
population—20 million people—live abroad, where they earn the equivalent
of two-thirds of India’s GDP. Actions to more effectively tap India’s overseas
talent could include supporting a larger diaspora network, building on exist-
ing groups that aggregate this population’s talent and capital for use in India.
3. India would benefit from fostering more inclusive innovation—by promoting
more formal R&D efforts for poor people and more creative grassroots efforts by
them, and by improving the ability of informal enterprises to exploit existing
knowledge. Existing pro-poor initiatives need to be scaled up. Inclusive innovation
can play a critical role in lowering the costs of goods and services and in creating
income-earning opportunities for poor people. The Council of Scientific and
Industrial Research has developed technology applications for rural India, and
university and formal private initiatives (such as e-Choupal and Amida’s Simputer)
have delivered benefits. The National Innovation Foundation has a repository of
more than 50,000 grassroots innovations and traditional knowledge practices.
And a number of initiatives exist to help the informal sector better absorb knowl-
edge. More favorable matching grant support for pro-poor early-stage technology
development could significantly increase collaboration among public R&D entities,
universities, nongovernmental organizations, national industries, and global
networks. Increased support for grassroots innovators could be provided to the
National Innovation Foundation to scale up impact. To leverage traditional
knowledge into revenue, a policy-oriented intellectual property rights think tank
could propose how to implement a cheaper intellectual property regime. Finally,
successful technology upgrading programs could be extended to help informal
and rural enterprises make better use of existing knowledge.
The action-oriented recommendations that form part of this volume’s three-
pronged innovation strategy require a realistic, time-bound implementation plan.
This may best be accomplished through a consensus-building process that includes
a task force of Indian policy makers working with business and social leaders—who
would be in the best position to set priorities among the recommendations and
develop an appropriate sequencing of activities. To help capture the nation’s imagi-
nation, it may be desirable to focus on “grand challenges” such as access to clean
water throughout the country or mitigating road congestion in cities. A light-touch
public-private oversight mechanism may be required to evaluate and address the
fragmentation of India’s current innovation system; encourage collaboration and
facilitate streamlining of the system’s constituent programs, using public-private
partnerships wherever appropriate; and monitor the achievement of realistic targets,
with periodic international benchmarking as India’s innovation potential is
unleashed. India’s successes with inclusive innovation will be of particular interest to
other developing and emerging market economies also seeking to harness innovation
for poverty reduction and economic development.
xviii
Executive Summary
1
India’s recent growth has been impressive, with real GDP rising by over 8 percent
a year since 2004—accompanied by a jump in innovative activities. Growth has been
driven by rapid expansion in export-oriented, skill-intensive manufacturing and,
especially, skill-intensive services. For example, pharmaceutical firms such as
Dr. Reddy’s Lab have been pursuing a twin strategy of profiting from the production
of generic drugs and investing in research and development (R&D) to discover new
ones. Growth has also been fueled by increased local demand, backed by rising urban
and rural incomes, and a sharp rise in savings and investment rates. Indian manu-
facturers have focused on delivering low-cost products to previously untapped mar-
kets by innovating to lower costs and create new delivery mechanisms—as with Tata
Motors, which has promised to deliver a car, geared toward India’s middle class,
priced at less than $3,000. Thanks to its innovations in outsourcing, Bharti Tele-
Ventures offers some of the world’s lowest telephone prices. And innovations in
supply chains have integrated those at the bottom of India’s economic pyramid, as
exemplified by e-Choupals. These cyber kiosks, established in thousands of villages,
have given farmers the power of information—eliminating middlemen and resulting
in higher productivity and better prices for farmers.
Growth, accompanied by innovations, has been associated with rising living stan-
dards and a reduced number of poor people. However, despite pockets of innovative
activities in both the formal and informal sectors, innovation remains concentrated
in a small segment of the economy. Roughly 90 percent of the workforce is employed
in the informal sector, which is often characterized by low-productivity and low-skill
activities. Productivity is also low in most formal enterprises. Given this dualism in
the economy, what can be done to strengthen the likelihood of sustained high
growth rates and, in particular, to address the unmet needs of the informal sector
and the poor? Innovation is crucial for increasing growth and can also help reduce
Overview: Toward an Action Agendafor InnovationMark A. Dutz
2
Mark A. DutzO
poverty. By applying knowledge in new ways to production processes, better and
previously unavailable products can be produced with the same or fewer inputs—to
meet the needs of all sections of Indian society.
This book provides action-oriented recommendations for India to unleash existing
capabilities and build on its innovation potential, to help meet the dual challenges of
sustained and inclusive growth. Sustaining growth is a challenge because of both
intensified external competition brought on by information and communication
technology (ICT)–spurred globalization and internal pressures linked to skill
shortages. As a basis for its recommendations, the volume examines the extent to
which Indian enterprises are undertaking innovative activities and analyzes their
enabling environment.
Given the dualism of the Indian economy, innovation is broadly defined to include
“new to the world” knowledge creation and commercialization as well as “new to the
market” knowledge diffusion and absorption. This second type of innovative activi-
ties involves enterprises applying existing technologies in new locations and product
areas. Both types of activities seek to provide better, cheaper products in response to
consumer needs—creating more and higher-paying jobs. Although both types of
innovation activities are essential, India stands to gain more from catching up to the
global frontier of knowledge through increased absorption than from trying to push
out the frontier through creation. An enormous amount of existing global knowledge
is not yet fully used in India. A 2006 World Bank Enterprise Survey of roughly 2,300
manufacturing enterprises in 16 Indian states found that applying existing technology
in new settings is more likely to be associated with increases in productivity than are
efforts to create new knowledge. In addition, given the overriding need to better
address the needs of the poor in India, knowledge creation and absorption efforts
most relevant for the poor are indicated by the term “inclusive innovation.”
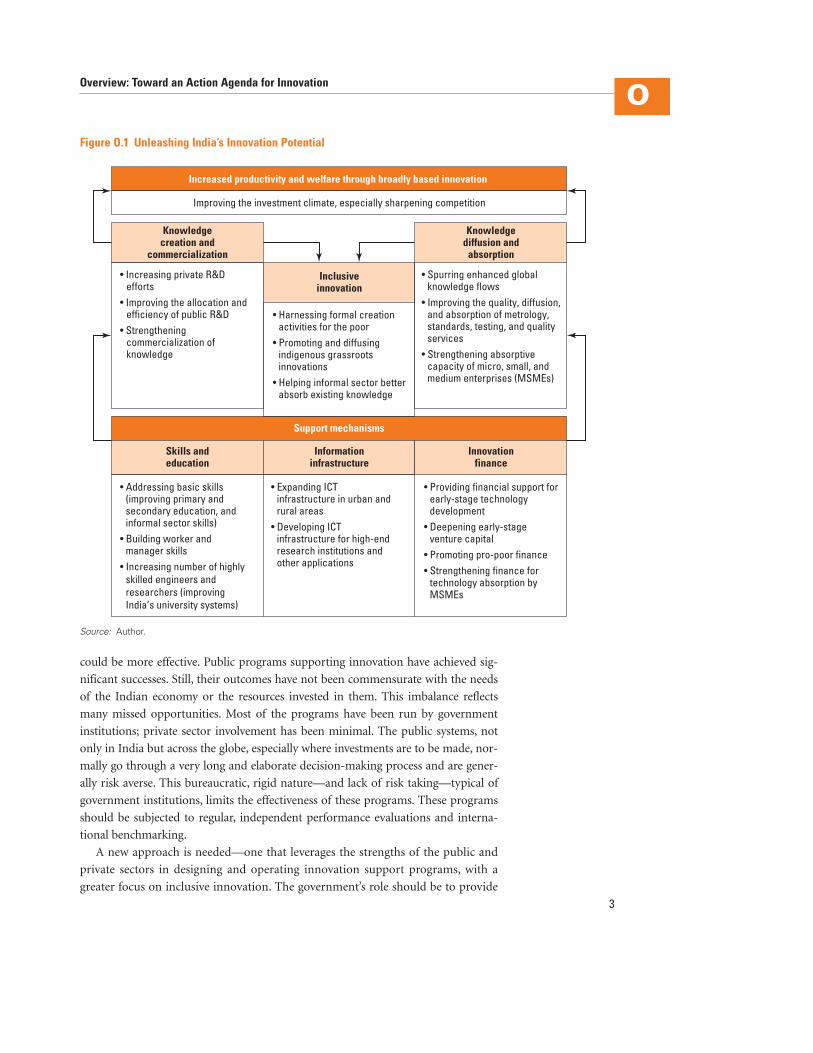
This book has three main messages (figure O.1 shows how they are interrelated).
To unleash its innovation potential, India needs to develop a strategy that does the
following:
• Focuses on increasing competition as part of improving its investment climate,
supported by stronger skills, better information infrastructure, and more
finance—public and private.
• Strengthens its efforts to create and commercialize knowledge, as well as better
diffuse existing global and local knowledge and increase the capacity of smaller
enterprises to absorb it—if all enterprises could costlessly achieve national best
practice based on knowledge already used in India, the output of the economy
could increase more than fivefold.
• Fosters more inclusive innovation—by promoting more formal R&D efforts for
poor people and more creative grassroots efforts by them, and by improving the
ability of informal enterprises to exploit existing knowledge.
Recognizing the importance of generating, commercializing, and absorbing R&D,
in recent years the government has created a number of support programs—but they
could be more effective. Public programs supporting innovation have achieved sig-
nificant successes. Still, their outcomes have not been commensurate with the needs
of the Indian economy or the resources invested in them. This imbalance reflects
many missed opportunities. Most of the programs have been run by government
institutions; private sector involvement has been minimal. The public systems, not
only in India but across the globe, especially where investments are to be made, nor-
mally go through a very long and elaborate decision-making process and are gener-
ally risk averse. This bureaucratic, rigid nature—and lack of risk taking—typical of
government institutions, limits the effectiveness of these programs. These programs
should be subjected to regular, independent performance evaluations and interna-
tional benchmarking.
A new approach is needed—one that leverages the strengths of the public and
private sectors in designing and operating innovation support programs, with a
greater focus on inclusive innovation. The government’s role should be to provide
Overview: Toward an Action Agenda for InnovationO
3
Figure O.1 Unleashing India’s Innovation Potential
• Increasing private R&D efforts• Improving the allocation and efficiency of public R&D• Strengthening commercialization of knowledge
• Harnessing formal creation activities for the poor• Promoting and diffusing indigenous grassroots innovations• Helping informal sector better absorb existing knowledge
• Spurring enhanced global knowledge flows• Improving the quality, diffusion, and absorption of metrology, standards, testing, and quality services• Strengthening absorptive capacity of micro, small, and medium enterprises (MSMEs)
• Addressing basic skills (improving primary and secondary education, and informal sector skills)• Building worker and manager skills• Increasing number of highly skilled engineers and researchers (improving India’s university systems)
• Expanding ICT infrastructure in urban and rural areas• Developing ICT infrastructure for high-end research institutions and other applications
• Providing financial support for early-stage technology development• Deepening early-stage venture capital• Promoting pro-poor finance• Strengthening finance for technology absorption by MSMEs
Improving the investment climate, especially sharpening competition
Knowledgecreation and
commercialization
Inclusiveinnovation
Knowledgediffusion and
absorption
Skills andeducation
Informationinfrastructure
Innovationfinance
Support mechanisms
Increased productivity and welfare through broadly based innovation
Source: Author.
a policy and regulatory framework that encourages the private sector to undertake
riskier initiatives that are economically beneficial but that firms would not normally
undertake. Removing nonessential regulations and facilitating more transparent
application of essential ones in product, land, labor, capital, and infrastructure
services markets—thereby promoting fairer and more intense competition—are
critical to spurring innovation efforts. Reforms that enhance genuine competition
are essential. This framework should be complemented by financial support where
needed, with significantly more for pro-poor innovation. The private sector should
be called on to manage such programs, with appropriate checks and balances as well
as performance standards and monitoring. Moreover, all public support programs
should periodically receive thorough reviews by independent experts, including
international ones as appropriate. Based on these evaluations and international
benchmarking, public support programs should be expanded, restructured, or
closed.
India could benefit from an explicit, multipronged innovation strategy—building
on existing private and public innovation efforts. This volume examines key issues
and offers recommendations in six areas, in addition to an initial discussion of the
Indian context and enabling environment. It argues that India’s innovation strategy
should build on the complementarities between knowledge creation and commer-
cialization (that is, more state-of-the-art innovation), knowledge diffusion and
absorption (greater acquisition and use of existing knowledge), and more explicit
promotion of inclusive innovation—all supported by strengthened skills, upgraded
information infrastructure, and enhanced innovation finance. The book is structured
as follows:
• Chapter 1 reviews the Indian context and enabling environment.
• Chapter 2 analyzes knowledge creation and commercialization.
• Chapter 3 discusses knowledge diffusion and absorption.
• Chapter 4 encourages inclusive, pro-poor innovation.
• Chapter 5 addresses the need for stronger skills and education for innovation.
• Chapter 6 examines ways of improving information infrastructure.
• Chapter 7 suggests approaches to enhance innovation finance.
The recommendations that form this book’s multipronged innovation strategy
need to be prioritized and molded into an action plan—ideally through a collabora-
tive process. Innovation is a broad topic that cuts across government ministries and
economic sectors, and affects all Indians. It requires both private and public
commitments and efforts—especially collaboration between partners with different
perspectives. At the government level, some policy elements and investment deci-
sions will be federal, while others will be more state responsibilities. This volume
offers a number of recommendations, many with sizable cost implications, for
implementation by the government, private entities, and civil society. The Ministry
4
Mark A. DutzO
of Science and Technology is beginning to prepare a national innovation program to
scale up or modify some of the ongoing initiatives discussed in this book and introduce
others. In addition, India would benefit from a broader complementary effort—
including representatives from government, academia, the private sector, and civil
society who are in a good position to set priorities among the recommendations and
consider appropriate sequencing of activities, with a possible focus on national
“grand challenges” such as road transport congestion in cities or access to clean
water. A bold implementation approach emanating from such a consensus-building
process would then benefit from a “light” public-private oversight mechanism—one
that helps address the fragmentation of the current innovation system and tracks the
achievement of realistic targets, with continuous feedback and periodic international
benchmarking as the program evolves.
The Indian Context and Enabling Environment
The now-famous “Dabbawala” (literally, lunchbox-carrier) system is an innovative
business process that allows 4,500–5,000 semiliterate Dabbawalas to deliver almost
200,000 lunches to workers every day in Mumbai. The Dabbawalas reportedly make one
mistake per 6 million deliveries. So remarkable is this delivery network that interna-
tional business schools have studied the work flows of the Dabbawala system to under-
stand the key to its stellar performance rating.
In chapter 1, Mark A. Dutz and Carl Dahlman discuss the “dualism” of the Indian
economy. India’s heterogeneity—with dispersion in enterprise productivity even
wider within than across economic sectors—calls for support to create and commer-
cialize new knowledge as well as to diffuse and absorb existing knowledge, with greater
emphasis on inclusive innovation. Indicators of India’s innovation capacity highlight
its innovation potential. Still, India is behind the global frontier in most sectors of the
economy. Thus, innovation in India should not be thought of as simply pushing out
the global technological frontier in a few areas, but as improving practices across the
whole economy. More inclusive innovation efforts are especially important for poor
people and informal enterprises. This chapter discusses
• relevant structural features of the Indian economy;
• the book’s definition of broadly based innovation, aggregate indicators of inno-
vation, and links between innovation and productivity; and
• the enabling environment for innovation, including the centrality of competition
as the key stimulus for innovation and the need for agreed on principles for coor-
dinating innovation support programs.
India is a heterogeneous economy, with productivity dispersion even wider within
than across sectors. On the one hand, India is the world’s fourth-largest economy
in purchasing power parity (PPP) as well as nuclear and space power. Moreover,
it is increasingly becoming a top global innovation player in biotechnology,
Overview: Toward an Action Agenda for InnovationO
5
pharmaceuticals, automotive parts and assembly, information technology (IT),
software, and IT-enabled services (ITES).
On the other hand, India is still a largely subsistence economy, with illiteracy rates
of 46 percent among women and 25 percent among men, and about a quarter of its
population living below the national poverty line, with significant spatial variance
across and within states. Less than 3 percent of the Indian workforce is in the modern
private sector, while roughly 90 percent is in the informal sector. This heterogeneity
translates into a wide dispersion in productivity levels. Productivity dispersion of
formal enterprises in manufacturing sectors is wider in India than in all other major
comparator countries (Brazil, China, the Republic of Korea, Mexico, the Russian
Federation) except Brazil. And India’s productivity dispersion is wide across both
formal and informal sectors of the economy. The average productivity of finance-
related businesses is 23 times that of agricultural activities. Productivity dispersion is
even wider within sectors, suggesting a strong potential for productivity improve-
ment. The least productive formal enterprises in auto components and textiles are
hundreds of times less productive than the most productive firms in those sectors
within the country. Such differences are even starker among informal enterprises.
The heterogeneity of the Indian economy calls for a broader definition of
innovation—one that distinguishes between “new to the world” innovation (cre-
ation and commercialization), “new to the market” knowledge (diffusion and
absorption), and explicit promotion of innovation to reduce poverty (inclusive
innovation). India has many islands of excellence. Still, it falls behind the global fron-
tier in most sectors of its economy. Thus, innovation in India should not be thought
of as simply shifting outward the global technological frontier, but as improving
practices across the entire economy. Innovative activities are not restricted to new
products but include innovations in processes and organizational models. Though
the recommendations have broader applicability, this volume focuses on central gov-
ernment support for industrial innovation—not agricultural, medical, or other
innovations, or state-level support. Though based on the best available comparable
data, given the pace of change in this area, reported statistics may have been over-
taken by recent developments.
Indicators of India’s capacity for innovation highlight its potential and the links
among innovation, productivity, and competitiveness. India’s stock of scientists and
engineers engaged in R&D is among the largest in the world. But another critical
innovation input is domestic R&D spending, which in India has never exceeded
1 percent of GDP. However, the sizable increase in R&D activity by multinational
corporations (MNCs) in India since 2002 has had a significant impact on total R&D
spending. Moreover, acquiring new technology has a stronger correlation with
productivity than does R&D spending. By far the most important channel for
absorbing knowledge is through the use of new machinery and equipment. India has
a strong record in producing basic knowledge, as proxied by internationally refereed
scientific and technical publications. It has also experienced a significant increase in
patent applications. Overall, India appears better at producing basic rather than
commercializable knowledge. Still, the efficiency of its R&D spending, as measured
6
Mark A. DutzO
by the relative costs of a scientific publication or a U.S. patent, appears higher than
in comparator countries.
India’s enabling environment for innovation consists of policies, institutions, and
capabilities that support the creation and commercialization of new knowledge, and
the diffusion and absorption of existing knowledge—for both formal and informal
sectors of the economy. India could gain from incentives that encourage stronger
competition among enterprises and a national mind-set that values innovation. Since
the 1991 liberalization, the private sector invested the most in R&D in the sectors
most open to competition. Enterprise R&D spending as a share of sales increased
more than sevenfold between 1991 and 2004. However, domestic innovation efforts,
R&D spending, and diffusion and absorption efforts remain low largely because
competition pressures—although strengthening—are not sufficiently widespread
throughout the economy. Two reforms are crucial:
• Sharpening competition among enterprises so that innovation becomes a
necessity—for example, by reducing entry and expansion barriers such as limits
on small-scale industries, and remaining restrictions on foreign direct investment
(FDI) and barriers to import competition. In addition, reallocation of capital
should be eased through bankruptcy reforms and modernization of the Industrial
Disputes Act.
• Strengthening innovation-friendly sociocultural norms. To help solidify a mind-set for
nationwide innovation, more resources are required to raise awareness about the
high social value of business and social innovation and commercial success, to dis-
seminate success stories highlighting the achievements of techno-entrepreneurs,
and to provide high-profile innovation awards and prizes—including for creative
teachers.
Creating and Commercializing Knowledge
Once characterized as producing outdated 1940s models referred to as “fossils on
wheels,” the Indian automobile industry—with FDI allowed up to 100 percent and no
minimum investment requirements for new entrants—now accounts for more than
$13.5 billion in investments and employs 500,000 workers directly and 10 million indi-
rectly. India is emerging as a global center of innovative automotive design. Mahindra
& Mahindra spent only $120 million to develop its fast-selling Scorpio model—one-fifth
of what it would cost in Detroit. Tata Motors recouped its development costs within a
year on the Ace, a small truck that costs about $2,500.
In chapter 2, authors Carl Dahlman, Mark A. Dutz, and Vinod K. Goel discuss
the tremendous potential of India’s efforts to expand knowledge and commer-
cialization through formal R&D and to move ideas from laboratories to markets.
The world has acknowledged India’s R&D potential. More than 300 MNCs have
set up R&D and technical centers in India. But despite their recent increases in
R&D spending, national corporations and other domestic enterprises are not
Overview: Toward an Action Agenda for InnovationO
7
systematically exploiting this potential to India’s advantage. Indigenous R&D
spending as a share of GDP remains low and dominated by the public sector.
Furthermore, much of the knowledge that is created—especially by the public sector—
is not commercialized. To fully exploit India’s R&D potential, the government must
take three key steps:
• increase private R&D efforts
• increase the impact of public R&D
• strengthen commercialization of knowledge.
Private R&D could be increased by enhancing support for early-stage technology
development (ESTD) programs. During 2006, R&D spending by roughly 300 MNCs
in research labs in India appears to have significantly surpassed spending by India’s
private sector. Although the growth of MNC R&D provides valuable training for
Indian scientists and engineers, possible negative externalities in the short term
include the diversion of researchers’ focus from domestic to MNC issues and
increased salaries that may make it difficult for universities and public labs to com-
pete for needed talent. India’s large demographic dividend should lead to a sharp
supply response over the longer term with appropriate incentives for the development
of higher-end skills, with likely enormous longer-term benefits to the Indian economy
from greater exposure to MNCs. Two areas need reform:
• Studying MNC spillovers and adjusting incentives. A study on the externalities of
MNC R&D centers would help indicate how best to adjust existing incentives,
including how to ensure that small and medium enterprises (SMEs) can still
employ competent technical personnel as the talent gap is being addressed.
• Consolidating and expanding ESTD programs, and developing pro-innovation public
procurement policies. To support private R&D more effectively, the government
should conduct an independent review of ESTD programs with international
benchmarking.Based on such a review,programmatic reforms could include estab-
lishing a matching grant program building on India’s Sponsored Research and
Development (SPREAD) and Small Business Innovation Research Initiative
(SBIRI) programs, targeted largely at smaller enterprises. The government also
should consider developing a national policy and action plan to more effectively use
public procurement as an effective policy instrument to promote innovation.
To improve the impact of public R&D, India should consider allocating more
resources to productive and social applications. Less than 20 percent of public sup-
port for R&D is allocated to civilian applications: 8 percent goes to the 38 labs under
the Council of Scientific and Industrial Research (CSIR), 4 percent to Indian Council
of Agricultural Research (ICAR) institutions, 4 percent to the applied research pro-
grams of the Department of Science and Technology, and 1 percent to the Indian
Council of Medical Research (ICMR). India should consider the following:
• Increasing resources for civilian research. CSIR was restructured in the 1990s to
focus on more market-driven R&D; further restructuring is ongoing. Still, the8
Mark A. DutzO
public R&D system would benefit from independent evaluation and restructur-
ing across the three main central government research agency networks (CSIR,
ICAR, ICMR). Such actions would increase cross-institutional synergies and their
focus on commercialization. A systemwide action plan would also consolidate
and transfer some R&D labs to the private sector, so that their work becomes fully
market driven.
• Providing more support for university R&D. Basic science and engineering research
of a public goods character can probably be better supported through competi-
tive grants along the lines of the U.S. National Science Foundation, as contem-
plated in the planned National Science and Engineering Foundation, as well as
through greater partnerships and researcher exchanges with international research
laboratories.
• Strengthening support for R&D for high-risk technologies through the New Millen-
nium Indian Technology Leadership Initiative (NMITLI). Though young, the
NMITLI has a number of impressive precommercialization accomplishments.
CSIR plans an independent evaluation of the program with international bench-
marking. Plans for scaling up the NMITLI include supporting pre- and post-
NMITLI activities, opening the program to international collaboration, and
giving grants to both research institutions and private enterprises, with success
royalties to be shared.
Fostering increased collaboration among R&D institutes, universities, and private
firms would help strengthen commercialization of knowledge. The Indian private
sector has little interaction with public R&D. Possible areas of reform include the
following:
• Strengthening incentives to commercialize publicly funded R&D. The U.S. Bayh-Dole
Act (1980) encouraged university professors and students to commercialize their
intellectual property. India should consider strengthening incentives to commer-
cialize publicly funded R&D by passing legislation inspired by the Bayh-Dole Act
but appropriate to the Indian context. India’s situation differs from that in the
United States in 1980 in that India has no law prohibiting patenting development
and commercialization derived from using public research funds. Still, there would
be a signaling benefit from clarifying India’s legal framework along the lines of
the CSIR and Patent Facilitation Center guidelines in force at some ministries.
Any new law should promote an entrepreneurial spirit on campuses and at research
institutes—including the freedom to negotiate deals with private partners, and
rewards for labs and individuals who contribute to revenues.
• Improving support infrastructure for India’s regime for intellectual property rights
(IPR). India’s legal framework for IPR has been modernized with the 2005
amendments that brought its patent laws into full compliance with the World
Trade Organization (WTO) Agreement on Trade-Related Aspects of Intellectual
Property Rights (TRIPS). However, India should consider addressing outstanding
IPR implementation issues. The drive to modernize India’s IPR implementation
Overview: Toward an Action Agenda for InnovationO
9
system is already under way. In addition, the government is expediting plans,
among others, to upgrade Indian Patent Offices and expand support for individ-
uals and organizations seeking to patent in India and abroad through an enhanced
patent facilitation center. For the longer term, the government is considering creat-
ing a special court of appeals for IPR. Finally, to provide country-strategic policy
advice on complex IPR-related issues such as technology advances and ensure
that they are resolved in India’s interest, the government is considering creating a
policy-oriented think tank on outstanding intellectual property (IP) issues.
• Supporting technology transfer offices and a patent management corporation.
Legislation should require government agencies that issue research grants to moti-
vate universities, research institutes, and their individual researchers to seek and
exploit patents and engage in technology transfer programs with industrial con-
cerns.A patent management corporation structured as a public-private partnership
and as a replacement for or restructuring of the National Research Development
Corporation (NRDC) could play a useful role by managing the patent portfolios
from CSIR and other public labs and universities, and facilitating their commer-
cial exploitation—as well as provide strategic down-to-earth IP guidance to SMEs.
• Promoting greater mobility. Mobility of personnel among public R&D labs,
universities, and industry should be encouraged through competitive awards
with generous stipends, both within India and within an international context.
• Expanding technology parks and incubators. Technology parks and incubators
should be expanded with government support and private finance, and manage-
ment should be based on international best practice. Spin-offs from universities
and public research labs should also be encouraged, to create new companies.
Scientists should be allowed to start spin-offs while holding their current jobs.
• Broadening SPREAD. SPREAD’s success as the first formal program to encourage
collaboration between Indian technology institutes and firms should be broad-
ened, with a likely focus on SMEs. Its expansion should be based on international
benchmarking—including the U.S. Small Business Technology Transfer program,
which provides matching grants and requires collaborative commercialization.
• Creating a Global Research and Industrial Partnership (GRIP) program. To spur
greater international collaboration, the government plans to set up a GRIP pro-
gram. Inspired by the Israeli-U.S. Binational Research and Development Fund,
India’s program will support advanced R&D and commercialization carried out
jointly by Indian enterprises and those from specific countries, such as Canada,
Israel, Russia, and the United States.
Diffusing and Absorbing Knowledge
The Central Leather Research Institute, the largest such institute in the world, imple-
ments the Mission for Leather, with the goal of spreading and sustaining a technology
culture in India’s leather sector. The institute trains workers in all areas, from flayers and10
Mark A. DutzO
those engaged in collecting raw materials to designers. The global leather industry
sources manpower from the supply of trained Indians.
In chapter 3, authors Vinod K. Goel, Carl Dahlman, and Mark A. Dutz discuss how
India stands to gain tremendously from increased diffusion and absorption of exist-
ing national and global knowledge. Reaping the large, enterprise-based productivity
returns from better knowledge diffusion and absorption requires
• spurring flows of global knowledge;
• improving the diffusion and absorption of metrology, standards, testing, and
quality (MSTQ) services; and
• strengthening the absorptive capacity of small enterprises.
A range of factors can be strengthened to enable enterprises to absorb knowledge
for increased productivity. This book focuses on enhancing global knowledge flows;
improving MSTQ services; and strengthening the absorptive capacity of small enter-
prises. A number of factors help enterprises absorb local and global knowledge. Vig-
orous competition from local and international rivals is the most important—not
only to create and commercialize new knowledge, but also to scour the world for
appropriate knowledge, buy it, adapt it for local use, and integrate it in production
processes. Other factors include ease of access for acquiring technology (wherever it
was developed); sufficient managerial, organizational, and technical capacities
within enterprises to use more advanced knowledge; dense links among MSMEs and
with dynamic larger enterprises; and sophisticated, demanding local customers. This
volume focuses on a few areas with significant scope to build on the progress that has
been made in recent years.
By building on its liberalization efforts and further facilitating global knowledge
flows, India could help enterprises better absorb knowledge of best practices. India’s
liberalization of flows of goods and services, capital, technology, and people has had
a tremendously positive impact on its economy. The spectacular development of
auto components and assembly is perhaps the best illustration of the benefits of a
more open business environment. However, India should do more on trade and FDI
openness to help its enterprises remain competitive relative to those in comparator
countries. Three action areas follow:
• Increase openness to trade and FDI. Although India has liberalized many of
its trade and FDI policies, implementation remains a problem. Recommenda-
tions for increased trade integration include expediting trade liberalization—
including the short-run priorities of extending duty drawbacks on imported
inputs for exporters, strengthening export promotion for entry into global
supply networks, and reducing procedural requirements for both exporting
and importing. Recommendations for increased FDI include opening remain-
ing eligible sectors to FDI and setting up a one-stop shop for foreign
investors. Longer-term goals should include increasing India’s attractiveness
to foreign investors by significantly enhancing the efficiency of contract
enforcement.
Overview: Toward an Action Agenda for InnovationO
11
• Ease technology transfers and set up a technology acquisition fund. Although India
has significantly liberalized its technology transfer regulations in recent years,
there is scope to further reduce barriers to technology licensing contracts. The
government also may want to consider strengthening support infrastructure for
technology licensing by setting up a technology acquisition fund on a public-
private partnership basis.
• Leverage the talents of the diaspora. Some 2 percent of India’s population lives
abroad. Their aggregate incomes are roughly equal to two-thirds of India’s
GDP. India can do a lot more to leverage its large diaspora pool of entrepre-
neurs and technologists. Initiatives could include supporting a more formal
diaspora network, building on existing groups that aggregate diaspora talent
and capital for use in India—one that locates individuals to enhance innova-
tion policy and evaluation; enrich the management of scientific institutions and
programs; provide teaching, consultancy, and mentoring resources for Indian
innovators; and help commercialize Indian intellectual property domestically
and abroad.
Improving MSTQ services would help diffuse quality standards and their absorp-
tion by enterprises. Standards and quality are closely linked to innovation and pro-
ductivity. But relative to comparator countries, the absorption of quality in India and
the use of its MSTQ system appear low. India’s standards and quality system is fairly
well developed, but it is dominated by the public sector. A key action area is to create
a world-class, demand-responsive MSTQ infrastructure. In addition to the need for
increased competition as a stimulus for quality upgrading, India should modernize
its MSTQ infrastructure, especially metrology, to international standards. Modern-
ization should start with a review of MSTQ programs—examining their governance,
management structures, and effectiveness to maximize synergies among initiatives
by various ministries and private actors.
Expanding support programs for MSMEs would help increase their absorptive
capacity. The skewed distribution of enterprise productivity by sector, with smaller
enterprises furthest from top local performers, indicates low absorption of existing
knowledge by most enterprises, especially smaller ones. But this skewed distribution
also indicates the potentially large productivity and output increases from diffusion
and absorption of available national and global knowledge. A key action area is to
strengthen knowledge upgrading initiatives, including technology support at the cluster
level and softer organizational capabilities. Key inputs to enterprises’ absorptive
capacity are sufficient managerial, organizational, and technical skills. Although the
government has a range of policies and programs to promote technology absorption
by smaller enterprises, the Ministries of Science and Technology and Small Scale
Industries have to do more analysis of how effective they have been. In particular,
support for cluster development deserves careful assessment. There is enormous
potential for enterprises to absorb knowledge from vertical links with larger, more
competitive firms and from horizontal links with enterprises facing similar chal-
lenges. The concerned ministries should thoroughly assess existing programs. Based
12
Mark A. DutzO
on this assessment, the government should strengthen and expand effective pro-
grams and discontinue or modify ineffective ones.
Promoting Inclusive Innovation
The Honey Bee Network consists of innovators (individuals, farmers, entrepreneurs),
policy makers, academics, and nongovernmental organizations (NGOs) committed to
recognizing and rewarding innovative ideas and traditional knowledge produced at the
grassroots level, using local language interfaces. The network has, in the National Inno-
vation Foundation repository, more than 50,000 innovations and traditional knowledge
practices from over 400 districts of India. The related Society for Research and Initiatives
for Sustainable Technologies and Institutions has, among other activities, organized bio-
diversity contests and supported the grassroots development of botanical pesticides and
health care products.
The authors of chapter 4, Anuja Utz and Carl Dahlman, suggest that India needs
to focus more on promoting inclusive innovation. A three-pronged strategy could
make India’s innovation system better meet the needs of the economically weaker
sections of Indian society:
• Harnessing, increasing, and redirecting formal creation efforts
• Promoting and diffusing innovations by grassroots entrepreneurs
• Helping informal enterprises better absorb existing knowledge.
The main recommendation of this chapter is to create incentives for pro-poor
early-stage technology development (ESTD) and commercialization by the formal
sector, possibly by providing more preferential matching grants to collaborations
among public R&D entities, industry, universities, NGOs, and global poverty allevi-
ation networks. In addition, grassroots innovation networks should be formally
evaluated and supported. Finally, government programs should promote knowl-
edge absorption in the productive sector and extend the reach of markets to the
common man.
Public policy needs to play a bigger role in increasing India’s innovation efforts to
address the needs of the poorer segments of the informal sector, in both urban and
rural areas. Unless more efforts are made to address the needs of the poor, the grow-
ing divergence in productivity between agriculture and knowledge-intensive manu-
facturing and services will lead to higher income inequality. Innovative activities can
play a critical role in reducing the costs of goods and services and in creating
sustainable income-earning opportunities for the poor. To bolster inclusive innova-
tions, India would benefit from a crosscutting strategy that harnesses formal creation
efforts for the poor; promotes, diffuses, and commercializes grassroots innovations;
and helps the informal sector better absorb existing knowledge.
By building on public R&D and university initiatives and encouraging private
and global initiatives, India could harness creation and commercialization efforts by
Overview: Toward an Action Agenda for InnovationO
13
the formal innovation system for poor people. Public research for development and
university initiatives have generated benefits in several pro-poor directions. These
include the preparation of more than 2,000 groundwater prospect maps, the dis-
covery of a new antituberculosis molecule, and the incubation of n-Logue Internet
rural service centers. Private initiatives include the solar power pilot program for
poor rural households in Karnataka by the United Nations Environment Program
with the Shell Foundation and ultra-low-cost mobile handsets produced by Nokia.
Still, formal R&D to meet the needs of the poor has been too low. A key action area
is to provide additional matching grants for pro-poor ESTD followed by commercial-
ization. More favorable support for pro-poor ESTD could spur a significant increase
in collaborative projects among public R&D entities, universities, NGOs, national
industry, and global networks. Approaches could include providing more preferential
matching grant terms for formal sector activities that alleviate poverty under a
consolidated ESTD program.
Deepening grassroots networks and strengthening IPR for traditional knowledge
would promote and diffuse grassroots innovation. A number of efforts support
grassroots innovation. Nongovernmental initiatives include the Honey Bee Network,
which recognizes innovative ideas produced by individuals and communities at the
grassroots level, and the Society for Research and Initiatives for Sustainable Tech-
nologies and Institutions, which provides financial and institutional backing to the
Honey Bee Network. Government initiatives include the Grassroots Innovation Aug-
mentation Network, which functions as an incubator, and the National Innovation
Foundation, set up by the Department of Science and Technology to document
grassroots innovations. The government also set up a Traditional Knowledge Digital
Library to create a database of indigenous knowledge related to medicinal plants.
These initiatives have to be independently evaluated for reach and effectiveness.
Areas requiring change follow:
• Deepen financial support for grassroots innovators. More concessional matching
grants for ESTD should be given to grassroots innovators. An example is the har-
nessing of formal creation efforts for the poor as part of a consolidated and
expanded SPREAD/SBIRI program. Once prototypes are developed, they would
become candidates for the fund-of-funds window, which considers pro-poor
grassroots innovation. Moreover, the National Innovation Foundation should be
expanded in ways that enhance and scale up measurable impact.
• Strengthen IPR for traditional knowledge. Recommendations to strengthen
IPR for traditional knowledge focus, first, on charging the policy-oriented
IPR think tank (proposed above) with completing the Traditional Knowledge
Digital Library to prevent international patenting of India-based traditional
knowledge. Second, the think tank would assess the costs and benefits associated
with moving forward with an IPR regime to leverage traditional knowledge into
revenue streams.
To help the informal sector absorb knowledge, the government should extend to
the informal and rural segments of the economy support programs to strengthen the14
Mark A. DutzO
absorptive capacity of smaller enterprises. A range of support networks—research
institutions, corporations, trader-entrepreneurs, NGOs—try to reach the poor, with
unrealized synergies. Those efforts to promote the diffusion and absorption of
knowledge in the informal sector appear ineffective, especially given the scale of the
challenge. A key action is to extend technology upgrading programs to informal and
rural sectors. As with support to strengthen the absorptive capacity of smaller formal
enterprises, it is essential to undertake a thorough assessment of the reach and effec-
tiveness of existing programs. Based on this assessment, effective programs should be
strengthened or new programs introduced to develop a more formal, programmatic
approach to this critical but underserved area.
Strengthening Skills and Education for Innovation
The National Association of Software and Service Companies (NASSCOM) has intro-
duced a national assessment of competence for IT and business process outsourcing
workers. This test (covering communication, analytical, and keyboard skills) is a market
opportunity for private training institutes, spurring them to adapt and increase the mar-
ket relevance of their courses—helping transform the trainable workforce into an
employable workforce.
In chapter 5, authors Isak Froumin, Shanthi Divakaran, Hong Tan, and Yevgeniya
Savchenko discuss that India needs to transform its immense young labor pool into
a skilled workforce able to take advantage of new and existing knowledge. To fully
unleash India’s potential as an innovation economy, the government needs to
• improve the delivery of basic skills to both the formal and informal sectors;
• strengthen enterprise-based training and vocational education and training; and
• increase the transfer of market-relevant knowledge-creation skills in higher
education, particularly by universities not in the top tier.
India must convert its youth into a skilled workforce. More than 500 million
Indians are younger than 25. By 2050 India is expected to overtake China as the
world’s most populous nation, and over the next five years will be responsible for
nearly a quarter of the increase in the world’s working-age population. Already, India
has almost a third of the available labor supply in low-cost countries.
These figures represent an enormous competitive advantage for India in its emer-
gence as an innovation economy, including as a supplier of skills to the world. How-
ever, the widespread perception that it has unlimited employable human resources
has changed. India has a growing shortage of skilled workers—caused largely by
workforce development and education systems that do not respond adequately
to the economy’s needs. To fully unleash its potential, India must address three
constraints that prevent many of its workers from acquiring the skills needed to
contribute to the innovation economy: inadequate delivery of basic skills to both
formal and informal sectors; underinvestment in enterprise-based training and
inadequate quality of vocational education and training; and insufficient transfer of
Overview: Toward an Action Agenda for InnovationO
15
market-relevant knowledge creation skills at the higher education level, particularly
by universities not in the top tier.
To increase productivity in both the formal and informal sectors, increased efforts
are needed to combat illiteracy and provide basic skills. India’s high illiteracy limits the
population’s capacity to acquire the basic skills needed for an innovation economy and
curbs the productivity potential of the informal and lower-skill sectors. Reading and
writing skills are low even among the literate population. Low worker education con-
tributes to low firm productivity. The country has taken significant steps to reach its
high enrollment rate of 94 percent in elementary education, though quality continues
to suffer. In contrast, secondary education (grades 9–12) enrollment remains low, at
38 percent. This low secondary education enrollment creates a bottleneck impeding
the supply of students for tertiary education. A focus on memorization, use of out-
dated curricula, and chronic teacher absenteeism have led to an education system that
does not prepare students for a market that increasingly rewards problem solving,
communication skills, teamwork, and self-learning. Despite a variety of programs to
develop skills in the informal sector, the resources directed to the sector are not aligned
with its size and the diversity of skills needed. Two actions needed are the following:
• Use innovative approaches to improve the quality of primary and secondary education.
The government should revamp the primary and secondary education system by
modernizing curricula and creating a more flexible, market-responsive education
system. New approaches must be experimented with to address existing problems.
• Strengthen basic skills for the informal sector. The government should continue to
invest in programs that combat illiteracy. It also should facilitate transfer of skills
to the informal sector by supporting NGOs that provide training to meet the needs
of the informal economy. These skills include training instructors, developing
curricula, and encouraging external financing of informal training programs.
Enterprises need stronger incentives to invest in worker training and in vocational
education and training that better meet market needs. Indian employers’ underin-
vestment in worker training places India at a competitive disadvantage. A firm’s
capacity to create or absorb knowledge depends on the skills and training of its
workforce. Yet only 16 percent of Indian manufacturing firms provide in-service
training, either in-house or external—compared with 92 percent in China. Two
recommendations follow:
• Strengthen enterprise-based training. The government should help ensure that the
benefits of in-service training are widely recognized by enterprises while also pro-
viding strong financial incentives—such as matching funds—for firms to invest
in such training.
• Improve vocational training. India’s vocational education and training systems
have been unsuccessful in producing graduates able to meet market needs, partic-
ularly because of a lack of interaction with industry in curriculum development.
Aligning these systems with market needs requires restructuring—including
private participation in the management of systems, curriculum development,16
Mark A. DutzO
and system financing; and stronger performance incentives for vocational educa-
tion and training institutions.
India’s higher education system needs to produce more scientists, engineers, and
other Masters and PhD graduates with skills matched to the needs of the innovation
economy. Universities are the cradle for sustained creativity and innovation. But
India’s demand for highly educated, skilled workers outstrips its supply. The high
demand is fueled partly by India’s popularity as an R&D destination for multi-
national corporations luring away domestic talent, and partly by the blossoming of
India’s IT and ITES sectors. To maintain its share of global knowledge services, India
will need 2.3 million knowledge professionals by 2010. Instead, it may face a deficit
of up to 0.5 million workers. Despite the prestigious standing of several Indian insti-
tutions of higher learning, the education system’s output remains uneven. Quality
training continues to concentrate on islands of excellence: 80 percent of doctorates
in engineering are awarded by 20 leading institutions, and 65 percent of doctorates
in sciences come from 30 institutions. India produces fewer than 7,000 PhDs a year in
the faculties of science, engineering, and technology.
The lack of skilled researchers and knowledge creators is manifested in low out-
put of high-quality scientific research. Furthermore, weak links with industry have
created a mismatch between the needs of the market and the skills of the highly edu-
cated workforce. Only 10–25 percent of general college graduates are suitable for
employment. In addition, India has a small number of high-quality management
programs, and even they are inadequate to support the growing need for manage-
ment and supervisory skills in both knowledge-intensive and lower-skills sectors.
Two key action areas follow:
• Increase private participation in higher education. To address the growing supply
constraint of high-quality education institutions, India requires stronger incen-
tives to attract domestic and foreign private participation in higher education and
its financing. The November 2006 agreement by the government to allow FDI in
higher education and foreign universities to set up campuses in India is a positive
step in this direction.
• Raise fiscal and managerial autonomy of universities and colleges. A drastic increase
in joint training programs with industry would help ensure that university cur-
ricula reflect market needs. Competitive grants for academic innovations and
performance-based incentives for professors would also foster a more dynamic
academic environment—one better aligned with India’s growth in knowledge-
intensive sectors.
Upgrading the Information Infrastructure
After mobile phones were made available to fishermen in Kerala, they were able to call
several markets and agree on selling prices before landing their fish. Within a few weeks
the dispersion in fish prices fell and there was no more wastage. The profits of fishermen
Overview: Toward an Action Agenda for InnovationO
17
increased 9 percent while the average price of fish fell 4 percent—to the delight of
customers.
In chapter 6, authors Shanthi Divakaran, Anil Srivastava, and Mark Williams con-
clude that India needs to improve the ease and cost of accessing and sharing infor-
mation and knowledge among enterprises, knowledge workers, and researchers.
Upgrading the information infrastructure for innovation requires
• making information and communication technology (ICT) more available to
both rural and urban users, and
• strengthening India’s National Research and Education Network (NREN) infra-
structure for high-end research institutions.
The creation of new ideas and dissemination of ideas between firms and countries
are strongly influenced by the availability of information, cost of obtaining it,
and ease with which it is passed on. Electronic communications systems lie at
the heart of this information transfer process. Investment in ICT services is one
way to stimulate growth in national innovation and productivity. India’s ICT
sector has grown rapidly over the past 20 years. The IT industry, for instance, is
becoming an increasingly important part of the economy. High investment in
ICT services, increased competition, and low equipment prices have raised tele-
density and driven down prices—to the point that Indian consumers now enjoy
some of the world’s lowest charges for telephones. At year-end 2006, India had
roughly 41 million wireline subscribers, 150 million wireless subscribers, and over
1.8 million broadband subscribers. Rapid growth in penetration rates has reduced
the price of information for individuals and businesses. However, this growth must
continue and reach all segments of the economy to fully support the development
of an innovation economy. To do so, the government must address a number of
policy issues.
India has made rapid progress in improving access to telecommunications
services, but urban teledensity still lags behind international comparators, and
rural access remains insufficient. Households and small enterprises worldwide
use basic ICT services to better organize their economic activities and marketing.
China’s penetration of broadband access is 30 times greater than India’s. Teleden-
sity in India in urban areas is 40 percent, compared with 2 percent in rural areas.
Only 30 percent of India’s population is covered by a mobile signal, versus more
than 90 percent in China and South Africa. The value of ICT infrastructure to
Indians and the lack of alternatives in rural areas are shown by the speed at which
phone services are taken up when made available. Using ICT can spur institu-
tional innovations to improve public service delivery in sectors such as health,
education, energy, and transport. Two recommended actions, both benefiting
from increased competition, follow:
• Expand infrastructure for rural access. By freeing more radio spectrum and mak-
ing it available to operators of voice and data services, the government can reduce
rollout costs and operators can accelerate the provision of services—including
18
Mark A. DutzO
broadband wireless services in rural areas. The government should also provide
targeted subsidies for rural mobile and broadband rollout in a way that rewards
efficiency, maximizes private investment, and does not distort competition.
• Deepen infrastructure for urban access, especially broadband services. India’s success
in expanding the supply of narrowband (that is, voice) communications infra-
structure must be replicated for high-speed data services. Increased access to
broadband networks will involve faster allocation of spectrum for wireless broad-
band rollout and revision of the policy definition of broadband to speeds higher
than 256 kilobits per second.
A high-speed national research and education network would enable Indian
scientists and researchers to work with the global scientific community and remain
at the global frontier of science. Although there is widening awareness that network-
enabled collaboration accelerates the pace of new discoveries and the expansion of
knowledge, India is significantly behind global comparators in high-speed network-
ing for research and academic institutions. NRENs have become an essential part of
national R&D infrastructure. More than 70 countries connect researchers and scien-
tists through high-speed networks, with the emerging standard for connectivity at
10 gigabits per second.
In contrast, most Indian scientists and researchers are not connected to high-
speed networks. NRENs’ main impact on an innovation economy is their potential
for more productive research through formal, high-speed mechanisms that create
and absorb knowledge by tapping into global networks. The case for NRENs also
includes improved broader access to information, increased opportunities for col-
laboration, expansion of distance education at lower cost, and opportunities to
participate in innovative research on the future of NRENs. Investment in shared
cyber infrastructure by the U.S. National Science Foundation and similar institu-
tions in Europe reflects the growing importance of NRENs. The main responsibi-
lities of a typically nonprofit NREN entity are to mobilize and aggregate demand,
manage underlying infrastructure, and deliver services—including connections to
global high-speed networks at agreed standards. No single entity in India is entrusted
with these responsibilities; the result is parallel high-speed networking efforts with
duplicated resources. Indian policy makers recognize the importance of advanced
networks for the knowledge economy. They should explore the cost of NREN infra-
structure and the appropriate organizational structure to deploy and manage the
network. A key action is to upgrade India’s NREN. India should quickly agree on
the appropriate NREN entity structure to manage the network, aggregating avail-
able infrastructure and building on it as needed. Programmatic rollout would
include a prototype phase to test the selected management model and partnership
arrangements, a decision on the right own or lease model for wider outreach, and
phasing of connectivity to user research and education institutions. Demand could
be ensured by subsidizing academic institutions for their required local network
investments and ensuring that institutional incentives foster collaboration and
network activity.
Overview: Toward an Action Agenda for InnovationO
19
Enhancing Innovation Finance
The Acumen Fund, a nonprofit venture capital fund, takes a market approach to
combat poverty, focusing on both opening markets and making goods and services
more accessible to the poor. Acumen has taken a $1 million equity stake in and
loaned $600,000 to Drishtee.com—an e-kiosk that gives rural poor people access to
Internet services—to help build more kiosks and add new services, including online
health care. However, the fund pulled out of a fluoride filtration company when the
entrepreneur changed strategy and started pursuing subsidized government
contracts.
Chapter 7, by Inderbir Singh Dhingra, discusses how India can meet the final
challenge—enhancing public finance for innovation, which is essential to enabling
more state-of-the-art innovation, increasing the use of existing knowledge by enter-
prises, and promoting inclusive innovation. Areas of support include
• providing financing for ESTD;
• deepening early-stage venture capital; and
• strengthening finance for technology absorption by MSMEs.
Among these, addressing the ESTD funding gap is the top priority because the early-
stage venture capital gap will probably narrow over time through market forces,
while the ESTD funding gap will not.
The government should expand financial support for ESTD. This requires multi-
pronged reforms to improve the enabling environment for innovation. These should
include increasing the scale and scope of public support for private R&D and
strengthening incentives for research and commercialization through more incuba-
tors, technology parks, and spin-offs. Any interventions supporting venture capital
need to be preceded or complemented by interventions that address the ESTD fund-
ing gap.
To deepen early-stage venture capital, India should consider both supply- and
demand-side reforms. On the demand side, besides increasing ESTD, more efforts
need to be undertaken to increase techno-entrepreneurship. Entrepreneurship
training should be incorporated more systematically into engineering training.
Greater incentives should be provided to young scientists, engineers, MBAs, and
other professionals to launch technology-based companies. On the supply side,
despite a significant number of major venture capital funds being created in India
in the past 12–18 months, biases remain toward larger funds, the IT sector, and
more proven business models. New efforts in seed and angel funding trying to fill
the gap are insufficient. Taking into account the amount of funding available at
the post-early-stage phase, the total funding available at the seed and early stage,
especially under $2 million, is a serious bottleneck. This lack of funding is even
more of a constraint because early-stage financiers provide not only capital but also
management support, advice, reputation, and other forms of mentoring critical to
20
Mark A. DutzO
successful commercialization. Two reforms would increase the supply of early-stage
venture capital:
• Introduce facilitating regulations. Measures should make it more attractive for
wealthy individuals to invest in venture capital funds. This can be done through
tax incentives and changes in the Securities and Exchange Board of India rules to
allow tax pass-through benefits for “accredited” angel investors. The investment
guidelines of pension and insurance funds could also be relaxed to increase their
investments in early-stage ventures.
• Create a fund of funds. Also crucial is the creation of a fund of funds, where the
government would provide leveraged returns to private investors by increasing
potential returns or reducing potential risks. The fund could cover innovations in
areas overlooked by the market, including agro-industry, rural industry, pro-poor
grassroots industries, and start-ups where companies need to advance an inno-
vation. The fund should have two distinct windows: one focused on pro-growth
innovations, the other on inclusive innovations. Governance of the fund-of-
funds is perhaps the most critical factor for success, so that selection of fund
managers and program control are professional, free from bureaucratic burdens,
and independent of political interference. The individual venture capital funds
should be managed by the private sector.
Finally, the government should implement measures to improve access to finance
for innovative MSMEs upgrading their technology. Although no official data exist on
the magnitude of the finance gap facing MSMEs wishing to absorb technology, the
general constraints that they face in financing investments suggest that it is signifi-
cant. There is evidence that access to funding for absorption of innovative practices
is a more serious problem in India than in most other developing countries in Asia
and Latin America, and more constrained for smaller enterprises and those operating
in traditional industries. India should strengthen finance for technology absorption by
MSMEs. Possible measures for government action include improving credit infor-
mation on MSMEs to reduce transaction costs—thereby lowering lending rates,
addressing the problem of collateral and reducing default risk by lenders, and estab-
lishing a policy and regulatory framework to foster the development of leasing
finance as an instrument to finance small, innovative enterprises.
Overview: Toward an Action Agenda for InnovationO
21

23
This book focuses on how to foster increased innovative activities in India to meet
the twin challenges of sustained growth and pro-poor development. India is an
extreme “dual” economy.1 At one extreme, it is the world’s fourth-largest economy in
purchasing power parity (PPP) terms, it is a nuclear and space power, and it is
increasingly becoming a top global innovation player in certain key economic
sectors––such as biotechnology, pharmaceuticals, automotive components, informa-
tion technology (IT), software, and IT-enabled services (ITES).
At the opposite extreme, India largely remains a subsistence economy. With an
average per capita income of $720 in 2005, India is still a low-income and mainly
rural, agrarian economy. About a quarter of its population lives below the national
poverty line, with significant spatial variance across and within states.2 Roughly
70 percent of its population is rural, and 60 percent of the workforce is engaged in
agriculture. Illiteracy rates are 46 percent for women and 25 percent for men.3 Given
this dual economy, it is natural to ask what can be done both to strengthen the like-
lihood of sustained high growth rates and to address the unmet needs of the informal
sector and the poor. To sustain growth and reduce poverty, India must leverage and
improve its innovation potential.
Innovation can be a critical driver of increased productivity and competitiveness
and, ultimately, poverty alleviation.4 India’s recent acceleration in growth has been
impressive. Over the 2004–06 period, real GDP has grown by over 8 percent a year.
Growth has been driven by a jump in export-oriented, skill-intensive manufacturing
(pharmaceuticals, petrochemicals, auto parts and assembly) and services (IT, busi-
ness services, finance). These have been accompanied by a jump in innovative
activities. Higher productivity and economic growth have raised living standards
and reduced the number of poor people.5 However, tremendous dispersion in
productivity levels remains, both within and across economic sectors. Most workers
The Indian Context and EnablingEnvironmentMark A. Dutz and Carl Dahlman
1Chapter
24
Mark A. Dutz and Carl Dahlman1
in the informal sector—which accounts for roughly 90 percent of the workforce—
are underemployed in low-skill, low-productivity, low-income activities.
India’s dual economic structure and wide dispersion in productivity levels call for
a broader interpretation of innovation. Innovation is defined to include both “new
to the world” creation and commercialization activities and “new to the market”
diffusion and absorption activities––the first use of existing knowledge in new
market contexts to help underperforming enterprises come closer to the global fron-
tier of knowledge. Innovative activities include products, processes, and business and
organizational models new to the local environment.
India has even more to gain from economywide productivity increases from
diffusion and absorption of existing knowledge than from creation and commer-
cialization of new knowledge. The global technological frontier is moving quickly,
simultaneously opening opportunities and posing threats. India needs to tap into
this rapidly moving frontier while expanding its comparative advantages. India can
and must do more to take advantage of its critical capabilities to enable creation of
new global knowledge. Just as important, if not more so, India must develop policies,
institutions, and capabilities to diffuse local and foreign knowledge more effectively
throughout its economy. From an economic viewpoint, India stands to gain more
from catching up to the world frontier than from pushing out the frontier. Thus, the
challenge of innovation in India combines a drive to move the global technological
frontier, an effort to increase the speed at which global innovations enter the
country, and the most pressing need—to improve prevailing practices across the
entire economy.
Structural Features of the Indian Economy
The use of knowledge for productive economic purposes varies as countries develop.
Knowledge needs are related to a country’s economic structure, and this structure
changes as a country develops. In developing countries, such as India, agriculture is
the economic sector absorbing the most labor. As countries increase agricultural
productivity through new technologies, the workers released by agriculture are
absorbed by the industrial sector—particularly manufacturing. In addition, the
service sectors expand. Initially, commerce and construction expand supported by
low skills. But eventually, these and other service sectors, such as tourism and health
services, develop and become more knowledge intensive.
Economic Dualism
India’s economic dualism is stark, with less than 3 percent of the workforce
employed in the formal private sector and the bulk of the workforce in the informal
sector. Formal versus informal employment is a very imperfect proxy for India’s
dual economic structure.6 According to available data, the formal sector accounts
for just 11 percent of a workforce of roughly 460 million; 89 percent of workers are
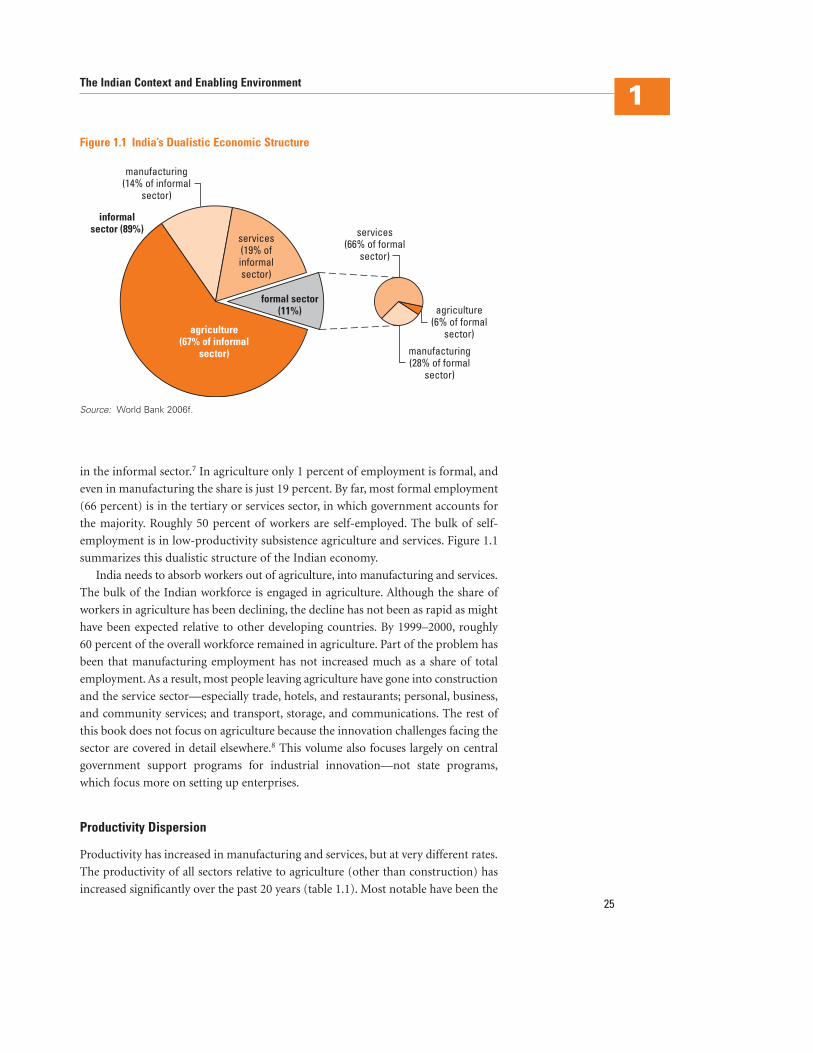
in the informal sector.7 In agriculture only 1 percent of employment is formal, and
even in manufacturing the share is just 19 percent. By far, most formal employment
(66 percent) is in the tertiary or services sector, in which government accounts for
the majority. Roughly 50 percent of workers are self-employed. The bulk of self-
employment is in low-productivity subsistence agriculture and services. Figure 1.1
summarizes this dualistic structure of the Indian economy.
India needs to absorb workers out of agriculture, into manufacturing and services.
The bulk of the Indian workforce is engaged in agriculture. Although the share of
workers in agriculture has been declining, the decline has not been as rapid as might
have been expected relative to other developing countries. By 1999–2000, roughly
60 percent of the overall workforce remained in agriculture. Part of the problem has
been that manufacturing employment has not increased much as a share of total
employment. As a result, most people leaving agriculture have gone into construction
and the service sector—especially trade, hotels, and restaurants; personal, business,
and community services; and transport, storage, and communications. The rest of
this book does not focus on agriculture because the innovation challenges facing the
sector are covered in detail elsewhere.8 This volume also focuses largely on central
government support programs for industrial innovation—not state programs,
which focus more on setting up enterprises.
Productivity Dispersion
Productivity has increased in manufacturing and services, but at very different rates.
The productivity of all sectors relative to agriculture (other than construction) has
increased significantly over the past 20 years (table 1.1). Most notable have been the
The Indian Context and Enabling Environment1
25
Figure 1.1 India’s Dualistic Economic Structure
manufacturing(14% of informal
sector)
manufacturing(28% of formal
sector)
informalsector (89%)
agriculture(67% of informal
sector)
agriculture(6% of formal
sector)
formal sector(11%)
services(19% ofinformalsector)
services(66% of formal
sector)
Source: World Bank 2006f.
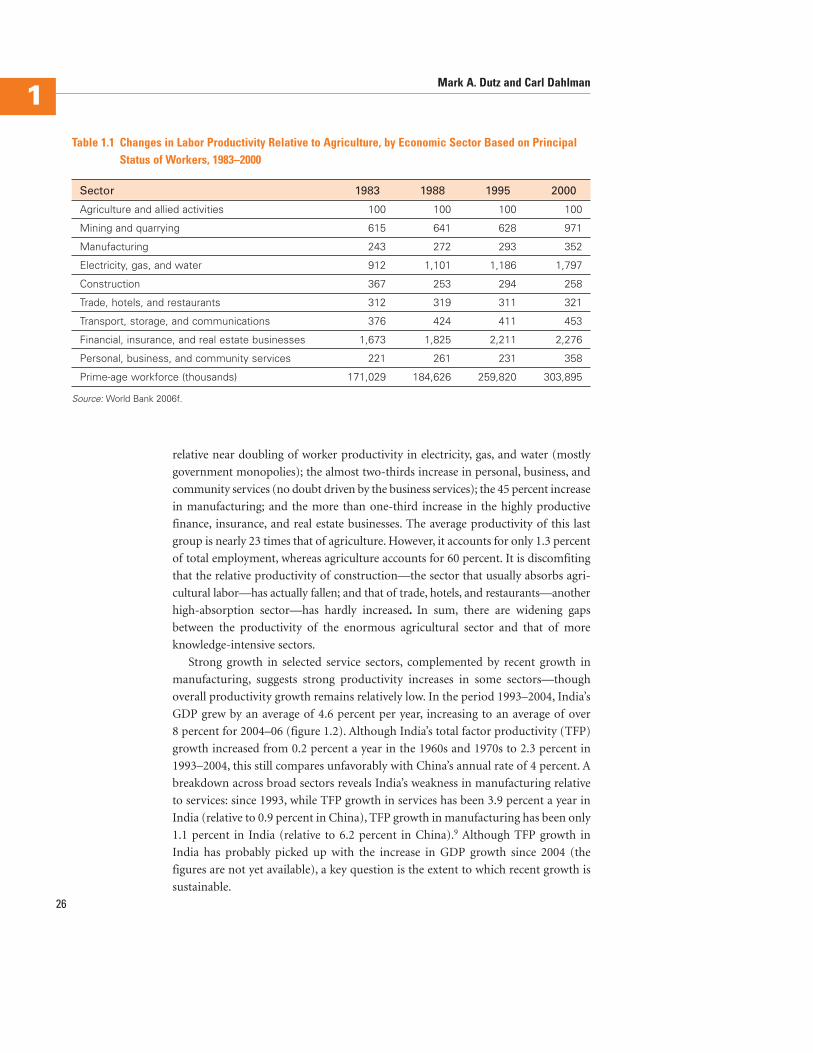
relative near doubling of worker productivity in electricity, gas, and water (mostly
government monopolies); the almost two-thirds increase in personal, business, and
community services (no doubt driven by the business services); the 45 percent increase
in manufacturing; and the more than one-third increase in the highly productive
finance, insurance, and real estate businesses. The average productivity of this last
group is nearly 23 times that of agriculture. However, it accounts for only 1.3 percent
of total employment, whereas agriculture accounts for 60 percent. It is discomfiting
that the relative productivity of construction—the sector that usually absorbs agri-
cultural labor—has actually fallen; and that of trade, hotels, and restaurants—another
high-absorption sector—has hardly increased. In sum, there are widening gaps
between the productivity of the enormous agricultural sector and that of more
knowledge-intensive sectors.
Strong growth in selected service sectors, complemented by recent growth in
manufacturing, suggests strong productivity increases in some sectors—though
overall productivity growth remains relatively low. In the period 1993–2004, India’s
GDP grew by an average of 4.6 percent per year, increasing to an average of over
8 percent for 2004–06 (figure 1.2). Although India’s total factor productivity (TFP)
growth increased from 0.2 percent a year in the 1960s and 1970s to 2.3 percent in
1993–2004, this still compares unfavorably with China’s annual rate of 4 percent. A
breakdown across broad sectors reveals India’s weakness in manufacturing relative
to services: since 1993, while TFP growth in services has been 3.9 percent a year in
India (relative to 0.9 percent in China), TFP growth in manufacturing has been only
1.1 percent in India (relative to 6.2 percent in China).9 Although TFP growth in
India has probably picked up with the increase in GDP growth since 2004 (the
figures are not yet available), a key question is the extent to which recent growth is
sustainable.
26
Mark A. Dutz and Carl Dahlman1
Table 1.1 Changes in Labor Productivity Relative to Agriculture, by Economic Sector Based on PrincipalStatus of Workers, 1983–2000
Sector 1983 1988 1995 2000
Agriculture and allied activities 100 100 100 100
Mining and quarrying 615 641 628 971
Manufacturing 243 272 293 352
Electricity, gas, and water 912 1,101 1,186 1,797
Construction 367 253 294 258
Trade, hotels, and restaurants 312 319 311 321
Transport, storage, and communications 376 424 411 453
Financial, insurance, and real estate businesses 1,673 1,825 2,211 2,276
Personal, business, and community services 221 261 231 358
Prime-age workforce (thousands) 171,029 184,626 259,820 303,895
Source: World Bank 2006f.
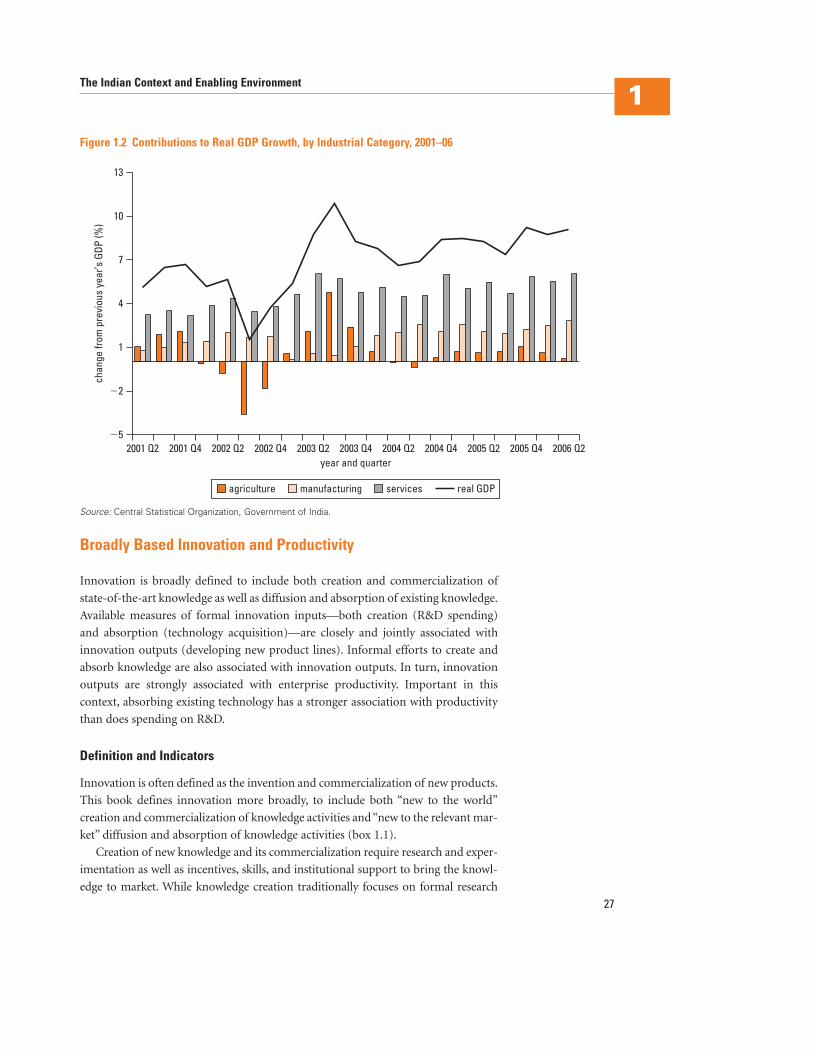
Broadly Based Innovation and Productivity
Innovation is broadly defined to include both creation and commercialization of
state-of-the-art knowledge as well as diffusion and absorption of existing knowledge.
Available measures of formal innovation inputs—both creation (R&D spending)
and absorption (technology acquisition)—are closely and jointly associated with
innovation outputs (developing new product lines). Informal efforts to create and
absorb knowledge are also associated with innovation outputs. In turn, innovation
outputs are strongly associated with enterprise productivity. Important in this
context, absorbing existing technology has a stronger association with productivity
than does spending on R&D.
Definition and Indicators
Innovation is often defined as the invention and commercialization of new products.
This book defines innovation more broadly, to include both “new to the world”
creation and commercialization of knowledge activities and “new to the relevant mar-
ket” diffusion and absorption of knowledge activities (box 1.1).
Creation of new knowledge and its commercialization require research and exper-
imentation as well as incentives, skills, and institutional support to bring the knowl-
edge to market. While knowledge creation traditionally focuses on formal research
The Indian Context and Enabling Environment1
27
�52001 Q2 2001 Q4 2002 Q2 2002 Q4 2003 Q2 2003 Q4 2004 Q2 2004 Q4 2005 Q2 2005 Q4 2006 Q2
�2
1
4
7
13
10
chan
gefro
mpr
evio
usye
ar’s
GDP
(%)
year and quarter
real GDPservicesmanufacturingagriculture
Figure 1.2 Contributions to Real GDP Growth, by Industrial Category, 2001–06
Source: Central Statistical Organization, Government of India.
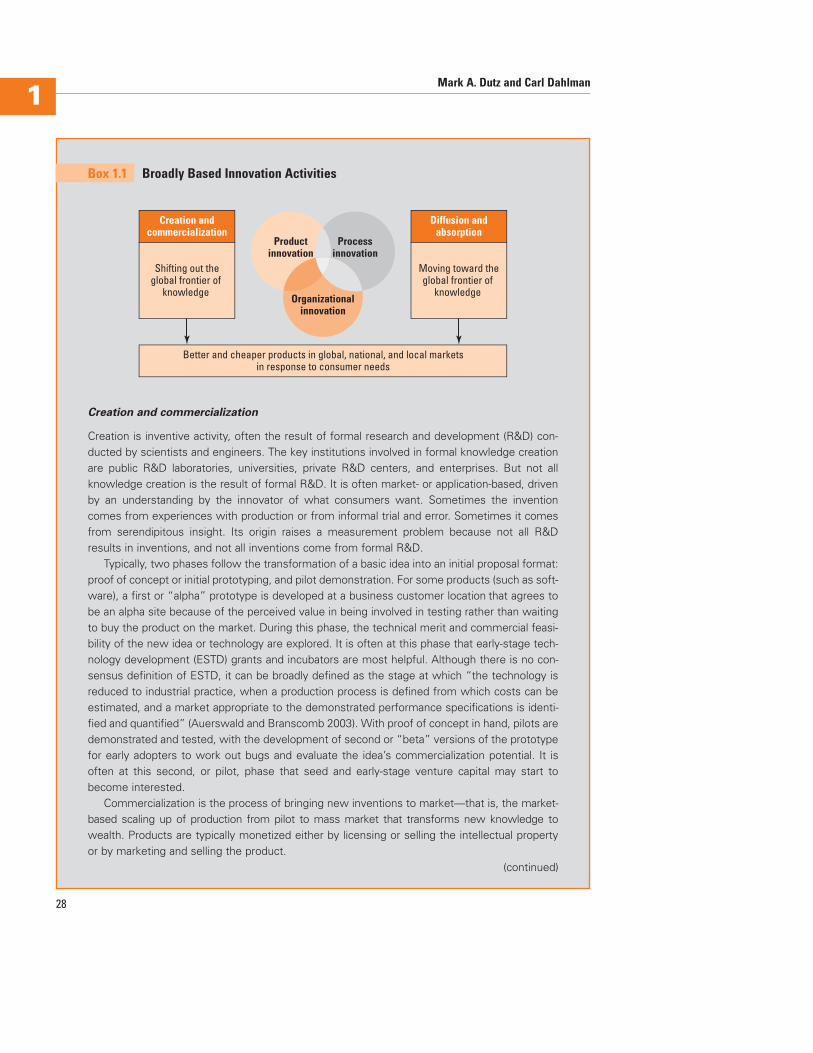
28
Mark A. Dutz and Carl Dahlman1
Creation and commercialization
Creation is inventive activity, often the result of formal research and development (R&D) con-ducted by scientists and engineers. The key institutions involved in formal knowledge creationare public R&D laboratories, universities, private R&D centers, and enterprises. But not allknowledge creation is the result of formal R&D. It is often market- or application-based, drivenby an understanding by the innovator of what consumers want. Sometimes the inventioncomes from experiences with production or from informal trial and error. Sometimes it comesfrom serendipitous insight. Its origin raises a measurement problem because not all R&Dresults in inventions, and not all inventions come from formal R&D.
Typically, two phases follow the transformation of a basic idea into an initial proposal format:proof of concept or initial prototyping, and pilot demonstration. For some products (such as soft-ware), a first or “alpha” prototype is developed at a business customer location that agrees tobe an alpha site because of the perceived value in being involved in testing rather than waitingto buy the product on the market. During this phase, the technical merit and commercial feasi-bility of the new idea or technology are explored. It is often at this phase that early-stage tech-nology development (ESTD) grants and incubators are most helpful. Although there is no con-sensus definition of ESTD, it can be broadly defined as the stage at which “the technology isreduced to industrial practice, when a production process is defined from which costs can beestimated, and a market appropriate to the demonstrated performance specifications is identi-fied and quantified” (Auerswald and Branscomb 2003). With proof of concept in hand, pilots aredemonstrated and tested, with the development of second or “beta” versions of the prototypefor early adopters to work out bugs and evaluate the idea’s commercialization potential. It isoften at this second, or pilot, phase that seed and early-stage venture capital may start tobecome interested.
Commercialization is the process of bringing new inventions to market—that is, the market-based scaling up of production from pilot to mass market that transforms new knowledge towealth. Products are typically monetized either by licensing or selling the intellectual propertyor by marketing and selling the product.
Box 1.1 Broadly Based Innovation Activities
(continued)
Productinnovation
Processinnovation
Better and cheaper products in global, national, and local marketsin response to consumer needs
Diffusion andabsorption
Moving toward theglobal frontier of
knowledge
Creation andcommercialization
Shifting out theglobal frontier of
knowledge Organizational
innovation
The Indian Context and Enabling Environment1
29
The move from basic and applied research to prototype development and pilot demonstra-tion, followed by monetization, is typically complex and nonlinear, with overlaps and feedbackbetween phases and different innovation pathways (Dosi and others 1988). It is not uncommonfor unanticipated applications to arise during the process. An important implication of the variedpathways and unpredictability of creation efforts is the desirability of fostering increased col-laboration by bringing different players together.
Diffusion and absorption
The main means of diffusion of knowledge or technology transfer are trade (technology embod-ied in capital goods, components, or products imported or purchased locally, as well as throughinteraction with foreign sellers and buyers), foreign direct investment, licensing, technical assis-tance, expansion of enterprises that have developed specific knowledge, copying and reverseengineering, foreign study, technical information in printed or electronic form (including whatcan be accessed on the Internet), twinning, and training arrangements. Proprietary technologyis usually sold or transferred on a contractual basis. Nevertheless, even proprietary technologymay leak out depending on the strength of the regime for intellectual property rights and itsenforcement, and the capability of users. But a lot of relevant technology is in the public domainor owned by governments that could put it in the public domain. There also are specialized enti-ties, such as productivity organizations and consulting firms, that focus on helping to disseminatetechnologies. These efforts usually involve training, demonstration projects, or technical assis-tance on how to use the technology.
Industrial technologies often must be adapted to local conditions—including local raw mate-rials, special characteristics, or to other idiosyncrasies such as local standards, climate, or powersources. It is important to have appropriate mechanisms to educate potential users in the ben-efits of the technology. Education often involves more than providing technical information.Moreover, use of new technologies usually requires literacy and specialized training. Finally,beyond the specific skills, using new technology often requires access to complementaryinputs and supporting industries, and access to finance to purchase new equipment or inputs—or even to buy the technology license.
Source: Authors.
Box 1.1 continued
and development (R&D), it importantly includes other market-based and application-
based experimentation efforts based on an understanding of what consumers
(enterprises, individuals, or groups) want. Creation and commercialization activities
can and do take place in both formal and informal (including rural) settings.
Diffusion and absorption of knowledge activities comprise the dissemination,
acquisition, adaptation, and use of existing knowledge by enterprises and institu-
tions. For absorption of knowledge by an enterprise to be considered innovative, the
technology transfer should be the first use in the enterprise’s relevant market. For
example, the first leather producer in a village to import and use an international
30
Mark A. Dutz and Carl Dahlman1
best practice machine and adapt it to local needs would constitute innovative
absorption, while the fifth producer in the village to acquire and use the same
machine would no longer be engaging in an innovative act. Innovative activities are
not restricted to new products (goods and services of all types)—they also include
innovations in processes (production on the shop floor, design, marketing and distri-
bution, financing) as well as innovations in business and organizational models.
Indicators of India’s capacity for innovation highlight its promising innovation
potential. Most studies on innovation focus on the inputs and immediate outputs of
formal R&D, because there is generally more such data on these efforts. Evidence on
where India stands comes from quantitative data on formal R&D—such as the stock
of scientists and engineers engaged in R&D and R&D spending on the input side,
and scientific and technical publications and patents on the output side.10 The posi-
tive perception of India’s innovation potential by the international business press
provides a useful context for the more quantitative assessment that follows.11 For
example, in 2006 the Massachusetts Institute of Technology Technology Review (MIT
2006) ranked six Indian-Americans among the top global innovators under the age
of 35. Based on respondents from Asia and the Pacific, the Indian company Infosys
is among the world’s 10 most innovative companies, with only the Republic of
Korea’s Samsung also included among comparator countries—Brazil, the Russian
Federation, China, Korea, and Mexico.12
Underpinning India’s innovation potential on the input side, its stock of scientists
and engineers engaged in R&D is among the largest in the world. India’s historically
sizable investments in higher education focused on science and engineering. Its con-
centrated stock of high-caliber human capital is a top reason it is potentially very
good at innovation, though this historic competitive advantage is being eroded
through insufficient recent and current investment in education and skills.13 Esti-
mates of India’s number of scientists and engineers that are researchers in R&D vary
widely. One estimate is 117,528, compared with 810,525 for China and 487,477 for
Russia (table 1.2). But another estimate puts India’s number of scientists and engi-
neers at 300,000.14 Of these, about a third are conducting R&D, a third are perform-
ing auxiliary services, and a third are providing administrative and support services
(Bhojwani 2006: 9). India has more than 12 million science and engineering
graduates—of which 2 million are postgraduates and 100,000 are PhDs (NCAER
2005). Though there is no doubt that India has an impressive stock of skilled talent
based on past investments in higher education, the more pressing question is the avail-
ability of qualified talent, measured by both quantity and quality (see chapter 5).
Another critical innovation input is aggregate domestic R&D spending, which in
India has never exceeded 1 percent of GDP. Over the past 20 years, India’s domestic
R&D expenditures as a share of GDP have fluctuated between 0.71 and 0.91 percent,
with the highest share recorded in 1987 (fiscal year 1987–88). In 2004, the last year
with comparable data for India and its comparator countries, India’s share stood at
0.85 percent (Department of Science and Technology 2006: 3). These numbers com-
pare unfavorably with comparator countries except Mexico—and then partly
because Mexico is relatively integrated with the R&D system in the United States,
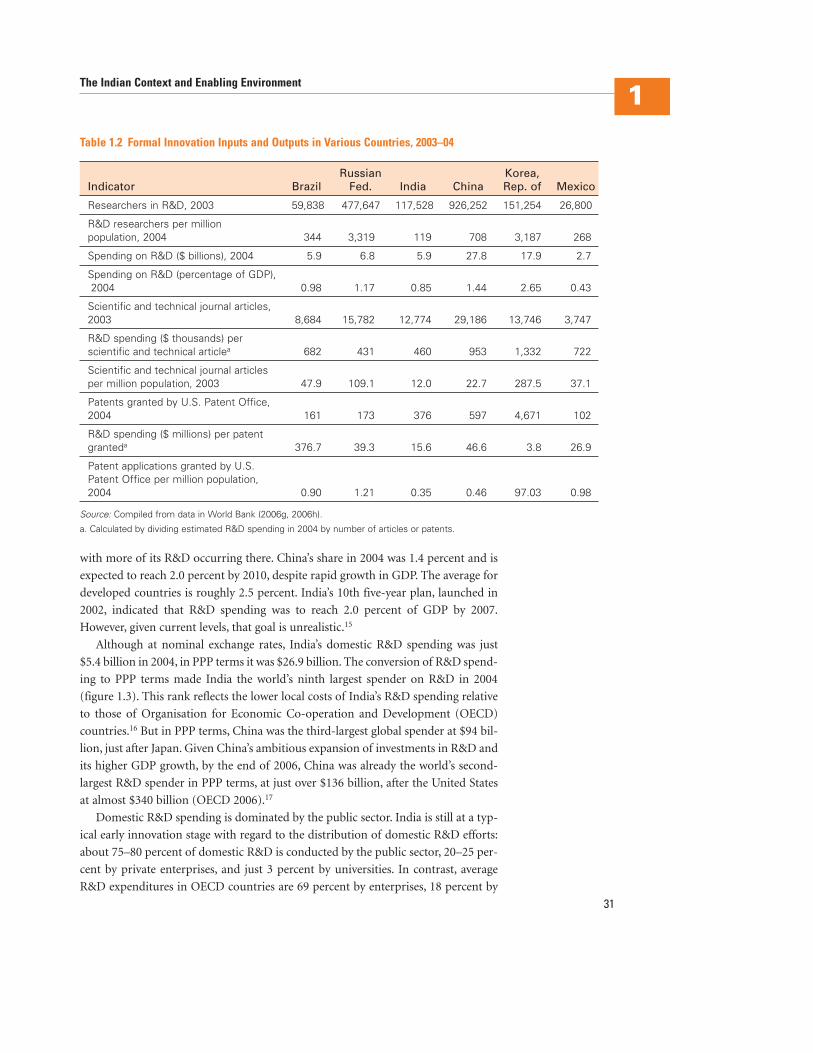
with more of its R&D occurring there. China’s share in 2004 was 1.4 percent and is
expected to reach 2.0 percent by 2010, despite rapid growth in GDP. The average for
developed countries is roughly 2.5 percent. India’s 10th five-year plan, launched in
2002, indicated that R&D spending was to reach 2.0 percent of GDP by 2007.
However, given current levels, that goal is unrealistic.15
Although at nominal exchange rates, India’s domestic R&D spending was just
$5.4 billion in 2004, in PPP terms it was $26.9 billion. The conversion of R&D spend-
ing to PPP terms made India the world’s ninth largest spender on R&D in 2004
(figure 1.3). This rank reflects the lower local costs of India’s R&D spending relative
to those of Organisation for Economic Co-operation and Development (OECD)
countries.16 But in PPP terms, China was the third-largest global spender at $94 bil-
lion, just after Japan. Given China’s ambitious expansion of investments in R&D and
its higher GDP growth, by the end of 2006, China was already the world’s second-
largest R&D spender in PPP terms, at just over $136 billion, after the United States
at almost $340 billion (OECD 2006).17
Domestic R&D spending is dominated by the public sector. India is still at a typ-
ical early innovation stage with regard to the distribution of domestic R&D efforts:
about 75–80 percent of domestic R&D is conducted by the public sector, 20–25 per-
cent by private enterprises, and just 3 percent by universities. In contrast, average
R&D expenditures in OECD countries are 69 percent by enterprises, 18 percent by
The Indian Context and Enabling Environment1
31
Table 1.2 Formal Innovation Inputs and Outputs in Various Countries, 2003–04
Russian Korea,Indicator Brazil Fed. India China Rep. of Mexico
Researchers in R&D, 2003 59,838 477,647 117,528 926,252 151,254 26,800
R&D researchers per millionpopulation, 2004 344 3,319 119 708 3,187 268
Spending on R&D ($ billions), 2004 5.9 6.8 5.9 27.8 17.9 2.7
Spending on R&D (percentage of GDP),2004 0.98 1.17 0.85 1.44 2.65 0.43
Scientific and technical journal articles,2003 8,684 15,782 12,774 29,186 13,746 3,747
R&D spending ($ thousands) perscientific and technical articlea 682 431 460 953 1,332 722
Scientific and technical journal articlesper million population, 2003 47.9 109.1 12.0 22.7 287.5 37.1
Patents granted by U.S. Patent Office,2004 161 173 376 597 4,671 102
R&D spending ($ millions) per patentgranteda 376.7 39.3 15.6 46.6 3.8 26.9
Patent applications granted by U.S.Patent Office per million population,2004 0.90 1.21 0.35 0.46 97.03 0.98
Source: Compiled from data in World Bank (2006g, 2006h).
a. Calculated by dividing estimated R&D spending in 2004 by number of articles or patents.
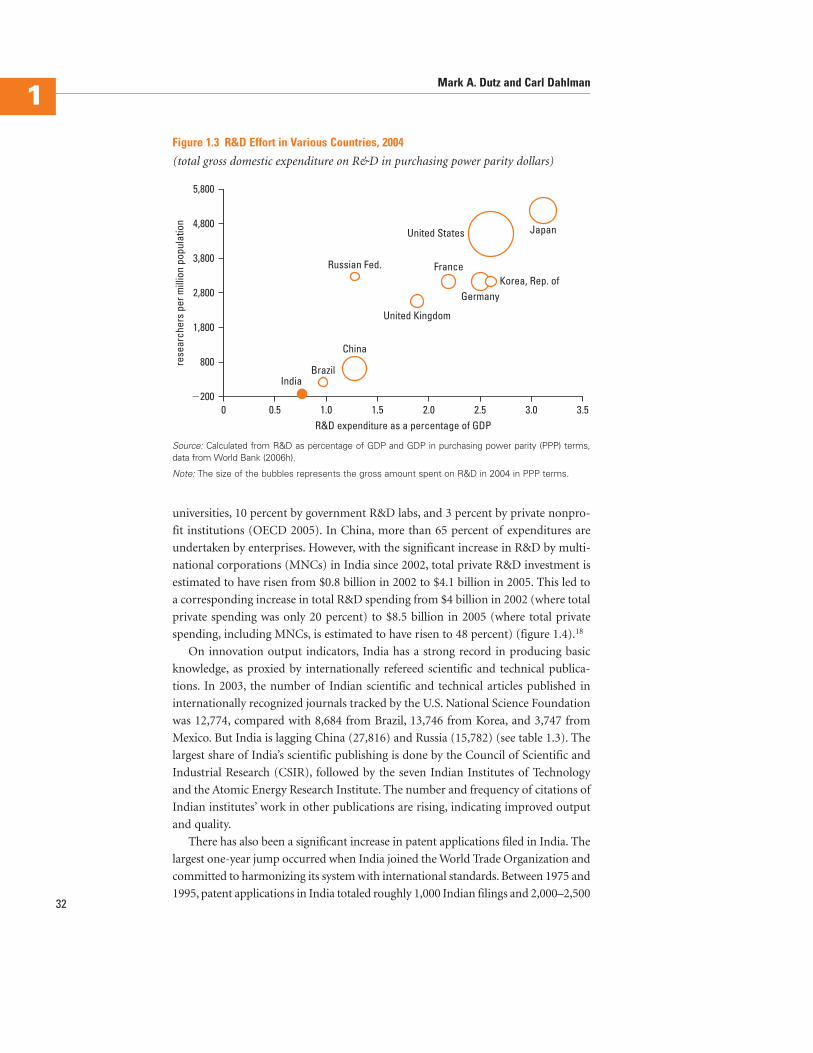
universities, 10 percent by government R&D labs, and 3 percent by private nonpro-
fit institutions (OECD 2005). In China, more than 65 percent of expenditures are
undertaken by enterprises. However, with the significant increase in R&D by multi-
national corporations (MNCs) in India since 2002, total private R&D investment is
estimated to have risen from $0.8 billion in 2002 to $4.1 billion in 2005. This led to
a corresponding increase in total R&D spending from $4 billion in 2002 (where total
private spending was only 20 percent) to $8.5 billion in 2005 (where total private
spending, including MNCs, is estimated to have risen to 48 percent) (figure 1.4).18
On innovation output indicators, India has a strong record in producing basic
knowledge, as proxied by internationally refereed scientific and technical publica-
tions. In 2003, the number of Indian scientific and technical articles published in
internationally recognized journals tracked by the U.S. National Science Foundation
was 12,774, compared with 8,684 from Brazil, 13,746 from Korea, and 3,747 from
Mexico. But India is lagging China (27,816) and Russia (15,782) (see table 1.3). The
largest share of India’s scientific publishing is done by the Council of Scientific and
Industrial Research (CSIR), followed by the seven Indian Institutes of Technology
and the Atomic Energy Research Institute. The number and frequency of citations of
Indian institutes’ work in other publications are rising, indicating improved output
and quality.
There has also been a significant increase in patent applications filed in India. The
largest one-year jump occurred when India joined the World Trade Organization and
committed to harmonizing its system with international standards. Between 1975 and
1995, patent applications in India totaled roughly 1,000 Indian filings and 2,000–2,50032
Mark A. Dutz and Carl Dahlman1
5,800
2,800
800
3,800
4,800
1,800
�2000 0.5 1.0 1.5 2.0 2.5 3.53.0
United States Japan
Germany
France
United Kingdom
Korea, Rep. ofRussian Fed.
BrazilIndia
China
R&D expenditure as a percentage of GDP
rese
arch
ers
perm
illio
npo
pula
tion
Figure 1.3 R&D Effort in Various Countries, 2004
(total gross domestic expenditure on R&D in purchasing power parity dollars)
Source: Calculated from R&D as percentage of GDP and GDP in purchasing power parity (PPP) terms,data from World Bank (2006h).
Note: The size of the bubbles represents the gross amount spent on R&D in 2004 in PPP terms.
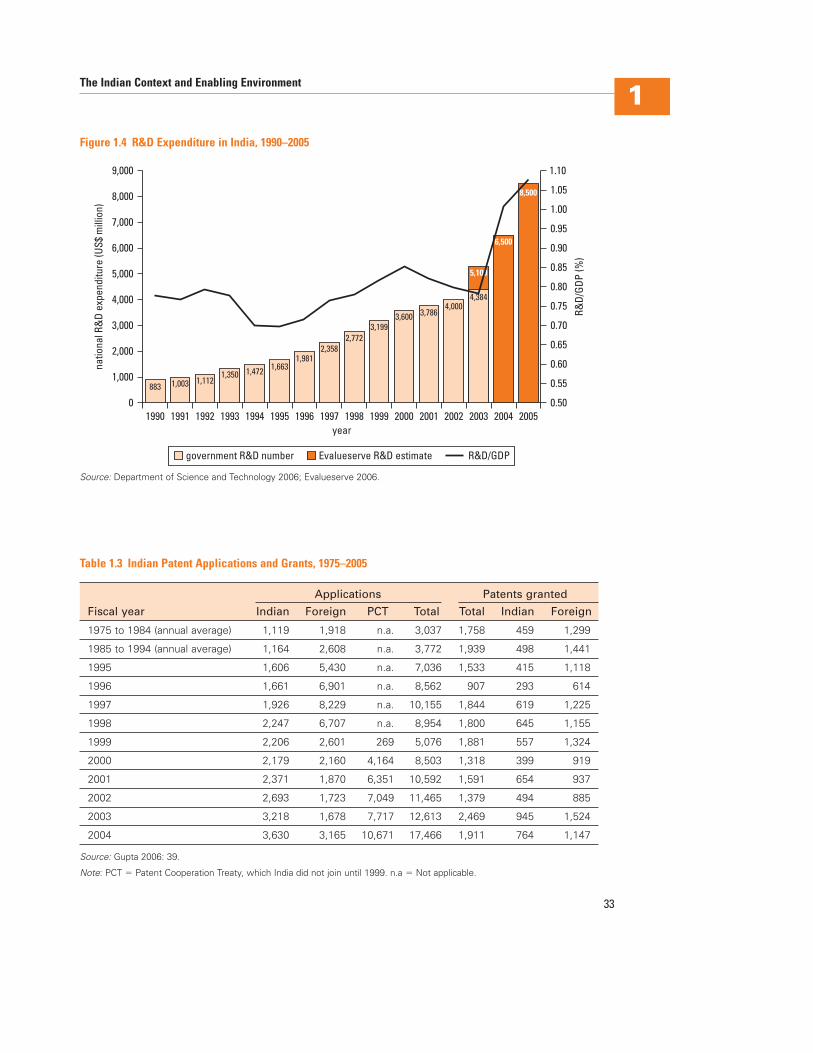
The Indian Context and Enabling Environment1
33
0
1,000
1990 1991 1992 1993 1994 1995 1996 1997 1998 1999 2000 2001 2002 2003 2004 2005
2,000
3,000
4,000
5,000
6,000
7,000
8,000
9,000
0.50
0.55
0.65
0.75
0.80
0.85
0.90
0.95
1.00
1.05
1.10
R&D/
GDP
(%)
year
natio
nalR
&D
expe
nditu
re(U
S$m
illio
n)
0.60
0.70
883 1,003 1,1121,350 1,472 1,663
1,9812,358
2,7723,199
3,600 3,7864,000
6,500
8,500
4,384
5,100
government R&D number Evalueserve R&D estimate R&D/GDP
Figure 1.4 R&D Expenditure in India, 1990–2005
Source: Department of Science and Technology 2006; Evalueserve 2006.
Table 1.3 Indian Patent Applications and Grants, 1975–2005
Applications Patents granted
Fiscal year Indian Foreign PCT Total Total Indian Foreign
1975 to 1984 (annual average) 1,119 1,918 n.a. 3,037 1,758 459 1,299
1985 to 1994 (annual average) 1,164 2,608 n.a. 3,772 1,939 498 1,441
1995 1,606 5,430 n.a. 7,036 1,533 415 1,118
1996 1,661 6,901 n.a. 8,562 907 293 614
1997 1,926 8,229 n.a. 10,155 1,844 619 1,225
1998 2,247 6,707 n.a. 8,954 1,800 645 1,155
1999 2,206 2,601 269 5,076 1,881 557 1,324
2000 2,179 2,160 4,164 8,503 1,318 399 919
2001 2,371 1,870 6,351 10,592 1,591 654 937
2002 2,693 1,723 7,049 11,465 1,379 494 885
2003 3,218 1,678 7,717 12,613 2,469 945 1,524
2004 3,630 3,165 10,671 17,466 1,911 764 1,147
Source: Gupta 2006: 39.
Note: PCT � Patent Cooperation Treaty, which India did not join until 1999. n.a � Not applicable.
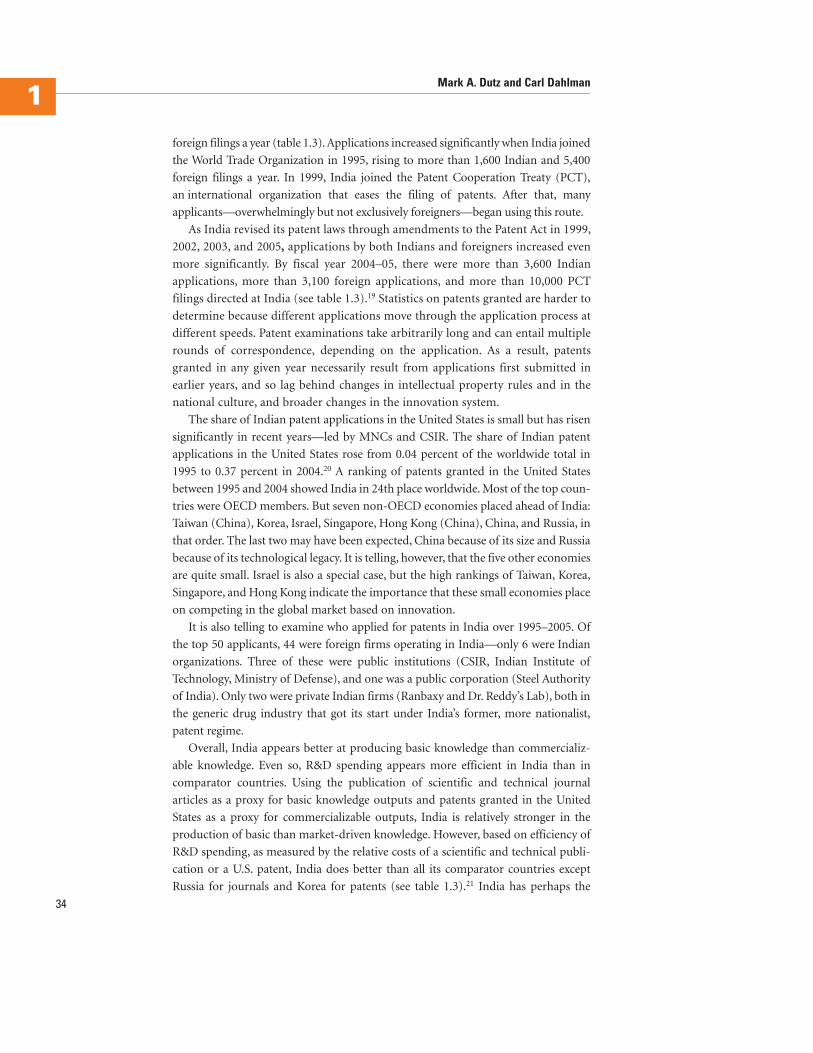
foreign filings a year (table 1.3). Applications increased significantly when India joined
the World Trade Organization in 1995, rising to more than 1,600 Indian and 5,400
foreign filings a year. In 1999, India joined the Patent Cooperation Treaty (PCT),
an international organization that eases the filing of patents. After that, many
applicants––overwhelmingly but not exclusively foreigners—began using this route.
As India revised its patent laws through amendments to the Patent Act in 1999,
2002, 2003, and 2005, applications by both Indians and foreigners increased even
more significantly. By fiscal year 2004–05, there were more than 3,600 Indian
applications, more than 3,100 foreign applications, and more than 10,000 PCT
filings directed at India (see table 1.3).19 Statistics on patents granted are harder to
determine because different applications move through the application process at
different speeds. Patent examinations take arbitrarily long and can entail multiple
rounds of correspondence, depending on the application. As a result, patents
granted in any given year necessarily result from applications first submitted in
earlier years, and so lag behind changes in intellectual property rules and in the
national culture, and broader changes in the innovation system.
The share of Indian patent applications in the United States is small but has risen
significantly in recent years––led by MNCs and CSIR. The share of Indian patent
applications in the United States rose from 0.04 percent of the worldwide total in
1995 to 0.37 percent in 2004.20 A ranking of patents granted in the United States
between 1995 and 2004 showed India in 24th place worldwide. Most of the top coun-
tries were OECD members. But seven non-OECD economies placed ahead of India:
Taiwan (China), Korea, Israel, Singapore, Hong Kong (China), China, and Russia, in
that order. The last two may have been expected, China because of its size and Russia
because of its technological legacy. It is telling, however, that the five other economies
are quite small. Israel is also a special case, but the high rankings of Taiwan, Korea,
Singapore, and Hong Kong indicate the importance that these small economies place
on competing in the global market based on innovation.
It is also telling to examine who applied for patents in India over 1995–2005. Of
the top 50 applicants, 44 were foreign firms operating in India—only 6 were Indian
organizations. Three of these were public institutions (CSIR, Indian Institute of
Technology, Ministry of Defense), and one was a public corporation (Steel Authority
of India). Only two were private Indian firms (Ranbaxy and Dr. Reddy’s Lab), both in
the generic drug industry that got its start under India’s former, more nationalist,
patent regime.
Overall, India appears better at producing basic knowledge than commercializ-
able knowledge. Even so, R&D spending appears more efficient in India than in
comparator countries. Using the publication of scientific and technical journal
articles as a proxy for basic knowledge outputs and patents granted in the United
States as a proxy for commercializable outputs, India is relatively stronger in the
production of basic than market-driven knowledge. However, based on efficiency of
R&D spending, as measured by the relative costs of a scientific and technical publi-
cation or a U.S. patent, India does better than all its comparator countries except
Russia for journals and Korea for patents (see table 1.3).21 India has perhaps the
34
Mark A. Dutz and Carl Dahlman1
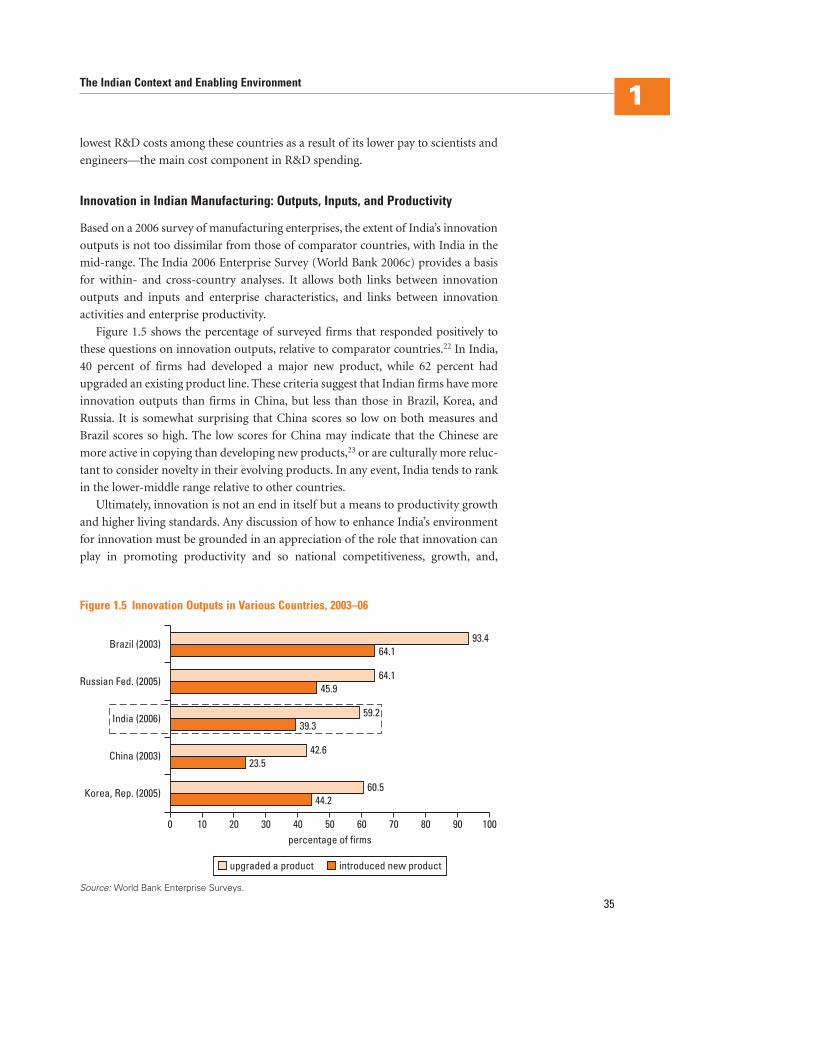
lowest R&D costs among these countries as a result of its lower pay to scientists and
engineers—the main cost component in R&D spending.
Innovation in Indian Manufacturing: Outputs, Inputs, and Productivity
Based on a 2006 survey of manufacturing enterprises, the extent of India’s innovation
outputs is not too dissimilar from those of comparator countries, with India in the
mid-range. The India 2006 Enterprise Survey (World Bank 2006c) provides a basis
for within- and cross-country analyses. It allows both links between innovation
outputs and inputs and enterprise characteristics, and links between innovation
activities and enterprise productivity.
Figure 1.5 shows the percentage of surveyed firms that responded positively to
these questions on innovation outputs, relative to comparator countries.22 In India,
40 percent of firms had developed a major new product, while 62 percent had
upgraded an existing product line. These criteria suggest that Indian firms have more
innovation outputs than firms in China, but less than those in Brazil, Korea, and
Russia. It is somewhat surprising that China scores so low on both measures and
Brazil scores so high. The low scores for China may indicate that the Chinese are
more active in copying than developing new products,23 or are culturally more reluc-
tant to consider novelty in their evolving products. In any event, India tends to rank
in the lower-middle range relative to other countries.
Ultimately, innovation is not an end in itself but a means to productivity growth
and higher living standards. Any discussion of how to enhance India’s environment
for innovation must be grounded in an appreciation of the role that innovation can
play in promoting productivity and so national competitiveness, growth, and,
The Indian Context and Enabling Environment1
35
93.464.1
64.145.9
59.239.3
42.623.5
60.544.2
0 2010 30 40 50 60percentage of firms
70 80 90 100
Korea, Rep. (2005)
China (2003)
India (2006)
Russian Fed. (2005)
Brazil (2003)
introduced new productupgraded a product
Figure 1.5 Innovation Outputs in Various Countries, 2003–06
Source: World Bank Enterprise Surveys.
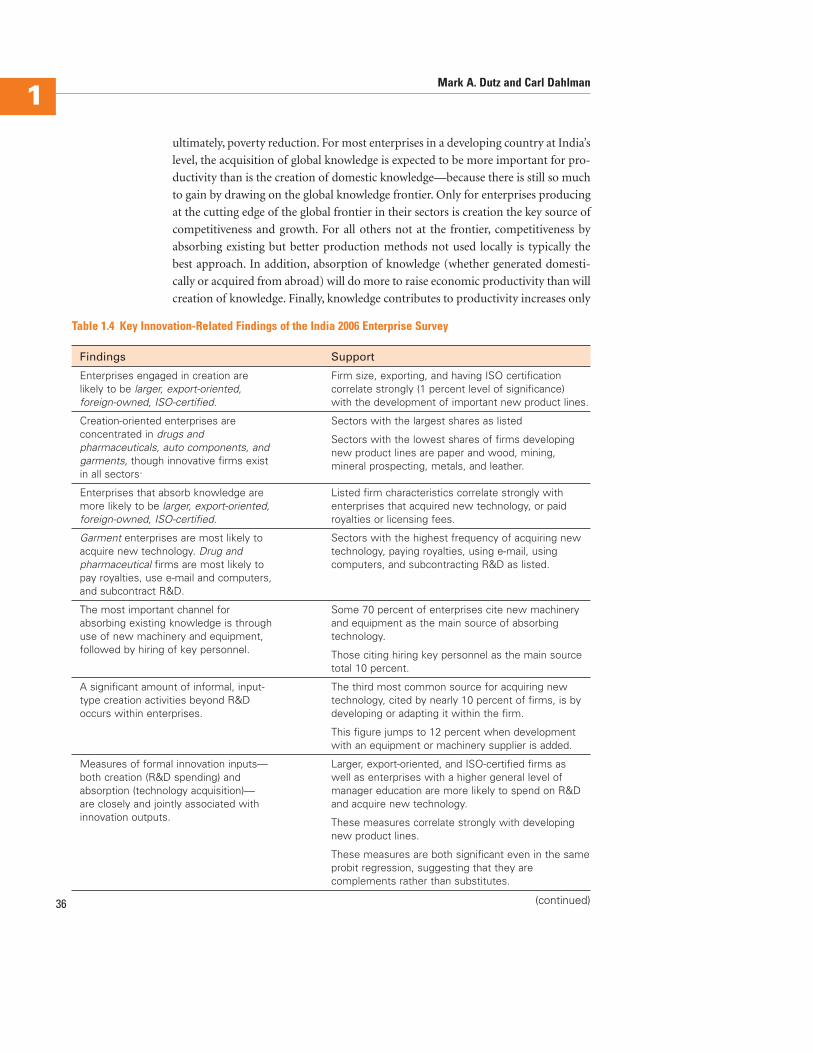
ultimately, poverty reduction. For most enterprises in a developing country at India’s
level, the acquisition of global knowledge is expected to be more important for pro-
ductivity than is the creation of domestic knowledge—because there is still so much
to gain by drawing on the global knowledge frontier. Only for enterprises producing
at the cutting edge of the global frontier in their sectors is creation the key source of
competitiveness and growth. For all others not at the frontier, competitiveness by
absorbing existing but better production methods not used locally is typically the
best approach. In addition, absorption of knowledge (whether generated domesti-
cally or acquired from abroad) will do more to raise economic productivity than will
creation of knowledge. Finally, knowledge contributes to productivity increases only
36
Mark A. Dutz and Carl Dahlman1
Table 1.4 Key Innovation-Related Findings of the India 2006 Enterprise Survey
Findings Support
Enterprises engaged in creation are Firm size, exporting, and having ISO certificationlikely to be larger, export-oriented, correlate strongly (1 percent level of significance)foreign-owned, ISO-certified. with the development of important new product lines.
Creation-oriented enterprises are Sectors with the largest shares as listedconcentrated in drugs and Sectors with the lowest shares of firms developingpharmaceuticals, auto components, and new product lines are paper and wood, mining,garments, though innovative firms exist mineral prospecting, metals, and leather.in all sectors.
Enterprises that absorb knowledge are Listed firm characteristics correlate strongly withmore likely to be larger, export-oriented, enterprises that acquired new technology, or paidforeign-owned, ISO-certified. royalties or licensing fees.
Garment enterprises are most likely to Sectors with the highest frequency of acquiring newacquire new technology. Drug and technology, paying royalties, using e-mail, usingpharmaceutical firms are most likely to computers, and subcontracting R&D as listed.pay royalties, use e-mail and computers,and subcontract R&D.
The most important channel for Some 70 percent of enterprises cite new machineryabsorbing existing knowledge is through and equipment as the main source of absorbinguse of new machinery and equipment, technology. followed by hiring of key personnel. Those citing hiring key personnel as the main source
total 10 percent.
A significant amount of informal, input- The third most common source for acquiring newtype creation activities beyond R&D technology, cited by nearly 10 percent of firms, is byoccurs within enterprises. developing or adapting it within the firm.
This figure jumps to 12 percent when developmentwith an equipment or machinery supplier is added.
Measures of formal innovation inputs— Larger, export-oriented, and ISO-certified firms asboth creation (R&D spending) and well as enterprises with a higher general level ofabsorption (technology acquisition)— manager education are more likely to spend on R&Dare closely and jointly associated with and acquire new technology.innovation outputs. These measures correlate strongly with developing
new product lines.
These measures are both significant even in the sameprobit regression, suggesting that they are complements rather than substitutes.
(continued)
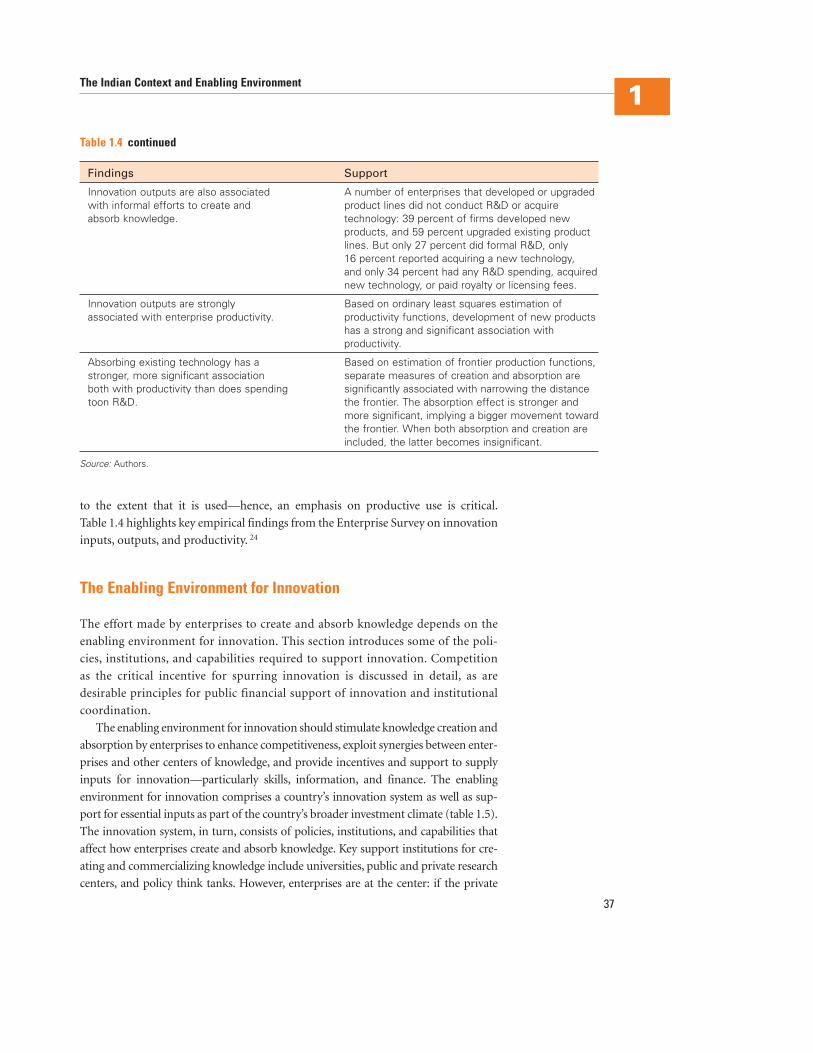
The Indian Context and Enabling Environment1
37
Table 1.4 continued
Findings Support
Innovation outputs are also associated A number of enterprises that developed or upgradedwith informal efforts to create and product lines did not conduct R&D or acquireabsorb knowledge. technology: 39 percent of firms developed new
products, and 59 percent upgraded existing productlines. But only 27 percent did formal R&D, only 16 percent reported acquiring a new technology, and only 34 percent had any R&D spending, acquirednew technology, or paid royalty or licensing fees.
Innovation outputs are strongly Based on ordinary least squares estimation ofassociated with enterprise productivity. productivity functions, development of new products
has a strong and significant association with productivity.
Absorbing existing technology has a Based on estimation of frontier production functions,stronger, more significant association separate measures of creation and absorption areboth with productivity than does spending significantly associated with narrowing the distancetoon R&D. the frontier. The absorption effect is stronger and
more significant, implying a bigger movement towardthe frontier. When both absorption and creation areincluded, the latter becomes insignificant.
Source: Authors.
to the extent that it is used—hence, an emphasis on productive use is critical.
Table 1.4 highlights key empirical findings from the Enterprise Survey on innovation
inputs, outputs, and productivity. 24
The Enabling Environment for Innovation
The effort made by enterprises to create and absorb knowledge depends on the
enabling environment for innovation. This section introduces some of the poli-
cies, institutions, and capabilities required to support innovation. Competition
as the critical incentive for spurring innovation is discussed in detail, as are
desirable principles for public financial support of innovation and institutional
coordination.
The enabling environment for innovation should stimulate knowledge creation and
absorption by enterprises to enhance competitiveness, exploit synergies between enter-
prises and other centers of knowledge, and provide incentives and support to supply
inputs for innovation––particularly skills, information, and finance. The enabling
environment for innovation comprises a country’s innovation system as well as sup-
port for essential inputs as part of the country’s broader investment climate (table 1.5).
The innovation system, in turn, consists of policies, institutions, and capabilities that
affect how enterprises create and absorb knowledge. Key support institutions for cre-
ating and commercializing knowledge include universities, public and private research
centers, and policy think tanks. However, enterprises are at the center: if the private
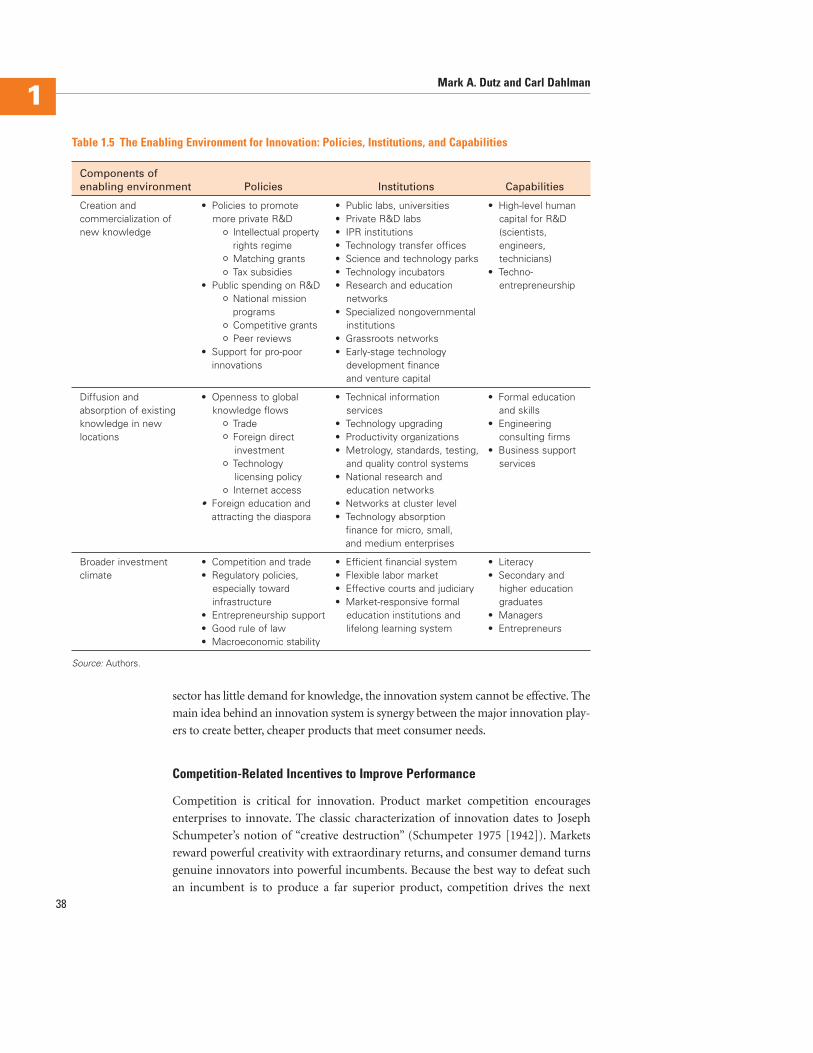
sector has little demand for knowledge, the innovation system cannot be effective. The
main idea behind an innovation system is synergy between the major innovation play-
ers to create better, cheaper products that meet consumer needs.
Competition-Related Incentives to Improve Performance
Competition is critical for innovation. Product market competition encourages
enterprises to innovate. The classic characterization of innovation dates to Joseph
Schumpeter’s notion of “creative destruction” (Schumpeter 1975 [1942]). Markets
reward powerful creativity with extraordinary returns, and consumer demand turns
genuine innovators into powerful incumbents. Because the best way to defeat such
an incumbent is to produce a far superior product, competition drives the next38
Mark A. Dutz and Carl Dahlman1
Table 1.5 The Enabling Environment for Innovation: Policies, Institutions, and Capabilities
Components ofenabling environment Policies Institutions Capabilities
Creation and • Policies to promote • Public labs, universities • High-level humancommercialization of more private R&D • Private R&D labs capital for R&Dnew knowledge Intellectual property • IPR institutions (scientists,
rights regime • Technology transfer offices engineers,Matching grants • Science and technology parks technicians)Tax subsidies • Technology incubators • Techno-
• Public spending on R&D • Research and education entrepreneurshipNational mission networksprograms • Specialized nongovernmental Competitive grants institutionsPeer reviews • Grassroots networks
• Support for pro-poor • Early-stage technologyinnovations development finance
and venture capital
Diffusion and • Openness to global • Technical information • Formal educationabsorption of existing knowledge flows services and skillsknowledge in new Trade • Technology upgrading • Engineeringlocations Foreign direct • Productivity organizations consulting firms
investment • Metrology, standards, testing, • Business supportTechnology and quality control systems serviceslicensing policy • National research andInternet access education networks
• Foreign education and • Networks at cluster levelattracting the diaspora • Technology absorption
finance for micro, small,and medium enterprises
Broader investment • Competition and trade • Efficient financial system • Literacyclimate • Regulatory policies, • Flexible labor market • Secondary and
especially toward • Effective courts and judiciary higher educationinfrastructure • Market-responsive formal graduates
• Entrepreneurship support education institutions and • Managers• Good rule of law lifelong learning system • Entrepreneurs• Macroeconomic stability
Source: Authors.
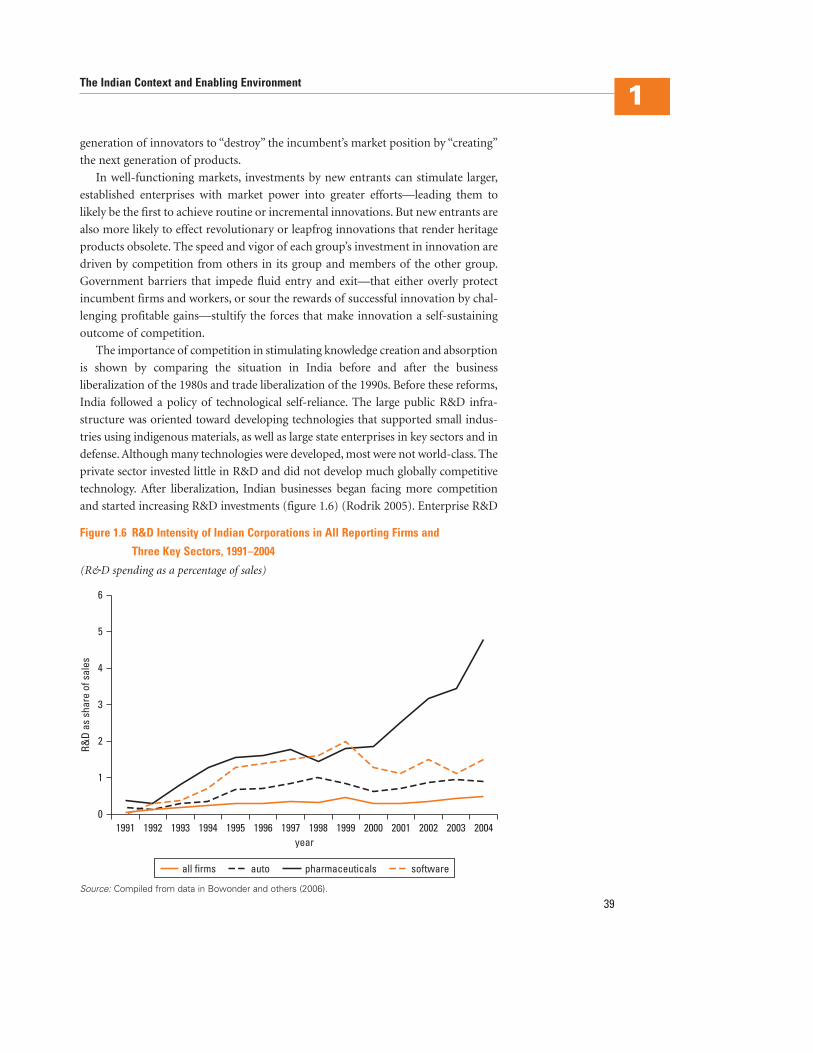
generation of innovators to “destroy” the incumbent’s market position by “creating”
the next generation of products.
In well-functioning markets, investments by new entrants can stimulate larger,
established enterprises with market power into greater efforts—leading them to
likely be the first to achieve routine or incremental innovations. But new entrants are
also more likely to effect revolutionary or leapfrog innovations that render heritage
products obsolete. The speed and vigor of each group’s investment in innovation are
driven by competition from others in its group and members of the other group.
Government barriers that impede fluid entry and exit––that either overly protect
incumbent firms and workers, or sour the rewards of successful innovation by chal-
lenging profitable gains––stultify the forces that make innovation a self-sustaining
outcome of competition.
The importance of competition in stimulating knowledge creation and absorption
is shown by comparing the situation in India before and after the business
liberalization of the 1980s and trade liberalization of the 1990s. Before these reforms,
India followed a policy of technological self-reliance. The large public R&D infra-
structure was oriented toward developing technologies that supported small indus-
tries using indigenous materials, as well as large state enterprises in key sectors and in
defense. Although many technologies were developed, most were not world-class. The
private sector invested little in R&D and did not develop much globally competitive
technology. After liberalization, Indian businesses began facing more competition
and started increasing R&D investments (figure 1.6) (Rodrik 2005). Enterprise R&D
The Indian Context and Enabling Environment1
39
01991 1992 1993 1994 1995 1996 1997 1998 1999 2000 2001 2002 2003 2004
1
2
3
4
6
5
R&D
assh
are
ofsa
les
year
softwarepharmaceuticalsautoall firms
Figure 1.6 R&D Intensity of Indian Corporations in All Reporting Firms and
Three Key Sectors, 1991–2004
(R&D spending as a percentage of sales)
Source: Compiled from data in Bowonder and others (2006).
spending as a share of sales increased more than sevenfold, from 0.07 percent in 1991
to 0.53 percent in 2004. The sectors most open to competition––pharmaceuticals,
software, auto components––have increased R&D spending the most.
In addition to sharp market incentives for competition and entrepreneurship, India
needs to strengthen sociocultural norms for innovation. Entrepreneurship-friendly
policies include ensuring that markets are open to competition from new entrants and
that bankruptcy laws facilitate rapid recovery. In addition, sociocultural norms should
place high social value on commercial success and see failure as an often indispensable
learning experience that can eventually lead to business success. Finally, an unfortunate
legacy of India’s colonial past pertains to education. The British Raj fostered learning
by memorization rather than creative problem solving, because the goal was to pro-
duce administrators who could help the British rule India more efficiently (Evalueserve
2006: 8). Recommendations to strengthen innovation-friendly sociocultural norms
center on the following:
• Campaigns to raise awareness of the importance of R&D for competitiveness and of
commercialization of ideas for wealth creation and national welfare. Mass media
(TV, movies) and champions, role models, and mentors could be used for these
efforts.
• Dissemination of success stories of techno-entrepreneurs and other innovators
through publicity, prizes, and public recognition for cases that exemplify how
knowledge has been turned into wealth or used to improve welfare.
• High-profile awards for creative teachers to encourage them to inspire creativity in
their students, from primary and secondary school through vocational training
and university education.
The most important policy change for increasing knowledge creation, commer-
cialization, diffusion, and absorption is to sharpen competition among enterprises so
that innovation becomes essential. Unencumbered entry and exit of enterprises are
perhaps the most important stimuli to innovation. Limits on small firms and other
barriers to entry and exit should be eased, imports further liberalized and firms
pushed to export more, and opening to foreign competition expanded. Enterprise
entry and expansion are also constrained by insufficient access to skilled labor,
information and communication technology, finance, and other business services,
especially power. These changes would also likely increase India’s ability to tap into
rapidly growing global knowledge (see chapters 2 and 3).
Although these are rather conventional recommendations that have been articu-
lated many times,25 they remain crucial. Such reforms will be resisted by vested inter-
ests who would be hurt by greater competition. Shorter-term recommendations,
therefore, are to continue to open the Indian economy to global competition,
encourage exports, increase domestic competition as quickly as is politically feasible,
and to do so in a way that raises awareness of longer-run benefits and creates more
support. Eventually, India should aspire to reach levels of trade and investment open-
ness comparable to those of OECD countries, as China is doing. Such openness
40
Mark A. Dutz and Carl Dahlman1
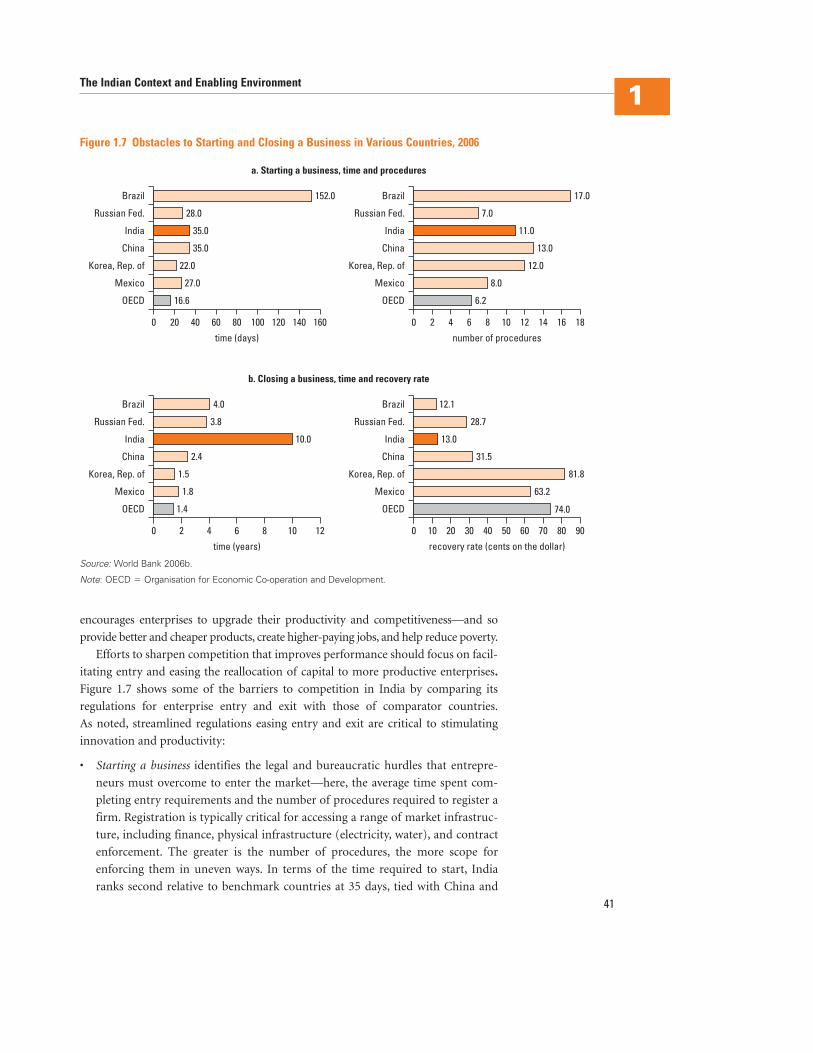
encourages enterprises to upgrade their productivity and competitiveness––and so
provide better and cheaper products, create higher-paying jobs, and help reduce poverty.
Efforts to sharpen competition that improves performance should focus on facil-
itating entry and easing the reallocation of capital to more productive enterprises.
Figure 1.7 shows some of the barriers to competition in India by comparing its
regulations for enterprise entry and exit with those of comparator countries.
As noted, streamlined regulations easing entry and exit are critical to stimulating
innovation and productivity:
• Starting a business identifies the legal and bureaucratic hurdles that entrepre-
neurs must overcome to enter the market—here, the average time spent com-
pleting entry requirements and the number of procedures required to register a
firm. Registration is typically critical for accessing a range of market infrastruc-
ture, including finance, physical infrastructure (electricity, water), and contract
enforcement. The greater is the number of procedures, the more scope for
enforcing them in uneven ways. In terms of the time required to start, India
ranks second relative to benchmark countries at 35 days, tied with China and
The Indian Context and Enabling Environment1
41
a. Starting a business, time and procedures
OECD
Mexico
Korea, Rep. of
China
India
Russian Fed.
Brazil
16014012010080
time (days)
6040200
152.0
28.0
35.0
35.0
22.0
27.0
16.6 OECD
Mexico
Korea, Rep. of
China
India
Russian Fed.
Brazil
1816141210
number of procedures
86420
17.0
7.0
11.0
13.0
12.0
8.0
6.2
b. Closing a business, time and recovery rate
OECD
Mexico
Korea, Rep. of
China
India
Russian Fed.
Brazil
1210864
time (years)
20
OECD
Mexico
Korea, Rep. of
China
India
Russian Fed.
Brazil
9080706050
recovery rate (cents on the dollar)
403020100
4.0 12.1
28.7
13.0
31.5
81.8
63.2
74.0
3.8
10.0
2.4
1.5
1.8
1.4
Figure 1.7 Obstacles to Starting and Closing a Business in Various Countries, 2006
Source: World Bank 2006b.
Note: OECD � Organisation for Economic Co-operation and Development.
ahead of Brazil, but significantly behind the OECD average of 17 days. (India is
especially behind Australia and Canada, each requiring only two procedures and
no more than 3 days.) Although India has significantly liberalized foreign direct
investment (FDI) since the early 1990s, some sectors still have restrictions—
with FDI either completely prohibited, as in retail, or sector caps added, as in
telecommunications and insurance. Moreover, 326 products in various sectors
are reserved for small industries, preventing entry by larger firms and normal
expansion by the smaller ones.
• Closing a business tracks legal, procedural, and administrative bottlenecks in the
bankruptcy process—here, the time required to complete a bankruptcy and how
many cents on the dollar that claimants (creditors, tax authorities, employees)
recover from insolvent firms. There is particular scope for facilitating exit in India
in terms of time––10 years, the longest in the world––which is in stark contrast
to China (2.4 years) and the OECD average (1.4 years). The focus on competition
problems should occur at the local level, since that is where problems occur and
pressures by vested interests are greatest. Indian authorities should recognize the
variance across cities. Time and recovery rates are 8.3 years and 17.3 cents on the
dollar in Bangalore—and 20.2 years and 5.1 cents in Kolkata (compared with an
average recovery rate of 74 cents in OECD countries).26
Reducing the stigma of failure and easing the reallocation of capital to more pro-
ductive enterprises are among India’s most important reforms. In India, capital is too
scarce not to allow its reallocation to more productive uses as quickly as possible.
Reforming exit policy reform through more efficient bankruptcy rules would help
remove the stigma of failure and contribute to increased risk-taking and experimen-
tation. The government has initiated reforms to improve the legal and regulatory
framework for insolvency. The Companies (Second Amendment) Act 2002, expected
to be presented in Parliament in 2007, removes a number of deficiencies. The
J. J. Irani Committee reviewed the Second Amendment provisions and recom-
mended further significant reforms to the Companies Act, including its insolvency
and rehabilitation provisions. Implementation of these recommendations would sig-
nificantly improve the insolvency regime.
In addition, initiatives have been launched to computerize company registries
and introduce information technology and case management tools in courts.
Authorities also need to build capacity among all participants in the process—
judges, liquidators, creditors, operating agencies, investigators, auditors, valuers, and
oversight bodies. Systematic education and certification for liquidators are also needed
to ensure professionalism and develop insolvency practices. Finally, modernizing the
Industrial Disputes Act to reduce the bias toward adjudicating disputes and increase
flexibility for employers in hiring and firing in a way that also protects worker rights
would help close less productive enterprises and enable capital to flow to more
productive ones.
Public policy must ultimately promote both competition and collaboration. A
main theme of this book is the effectiveness of market forces in inducing innovation,
42
Mark A. Dutz and Carl Dahlman1
and the need to strengthen and extend the domain of market competition so that
innovation can flourish. However, an enterprise’s ability to generate new products
and processes depends on two complementary processes—analysis and interpreta-
tion.27 On the one hand, innovation requires analysis, where alternative outcomes
can be clearly defined and distinguished from one another—an engineering and
management–based project approach of problem solving and rational decision mak-
ing. On the other hand, innovation also requires interpretation and trust, where the
possible outcomes are unknown—a more open-ended process approach that
requires drawing various actors together, initiating and guiding conversations to
allow economic actors to understand where they have the same and where they have
different interests. Both processes are necessary for successful innovation, with the
latter especially critical when the problem is not yet well defined. But while analysis
is spurred by competition, interpretation benefits from collaboration, a sheltered
space from competition where the risk of private appropriation of information is
reduced and where misunderstandings have fewer direct consequences. Accordingly,
there is a need to build an effective institutional infrastructure that allows appropri-
ate collaboration and networking. The breakdown of bureaucratic silos within the
public sector, as well as the improvement of linkages between universities, public and
private R&D labs, and private enterprise through consortia, is part of this institu-
tional infrastructure.
Principles for Pragmatic Coordination of Innovation Support Programs
Coordinating existing and new programs that support innovation would benefit
from a new approach—one that builds an effective institutional infrastructure that
helps the various elements form a coherent system.28 The main idea behind a
national innovation system is collaboration and synergy among enterprises, uni-
versities, research institutes, and government. Yet the reality in most countries,
including India, is of ivory towers––and additional silos within each––with insuffi-
cient incentive to interact.
Most innovation systems resemble a jigsaw puzzle. Many pieces of the puzzle
(a vibrant private sector, solid public research institutes, a rapidly growing venture
capital industry) already exist in India. The challenge is putting the pieces together
in a coherent whole. In designing a new national innovation program, India should
not introduce more targeted programs that, although individually useful, would
worsen the jigsaw problem. For example, a typical well-intentioned solution is to
coordinate the pieces top-down through an interministerial council. However, inter-
national experience suggests that such attempts largely fail: councils usually become
cartels of established interests, while new ministries become efficient at creating and
defending their own turf. The drive for top-down coordination is a symptom that
something is wrong with the incentives of enterprises, universities, research insti-
tutes, and government entities. In fact, as economies have become more complex,
top-down coordination has posed more of a problem.
The Indian Context and Enabling Environment1
43
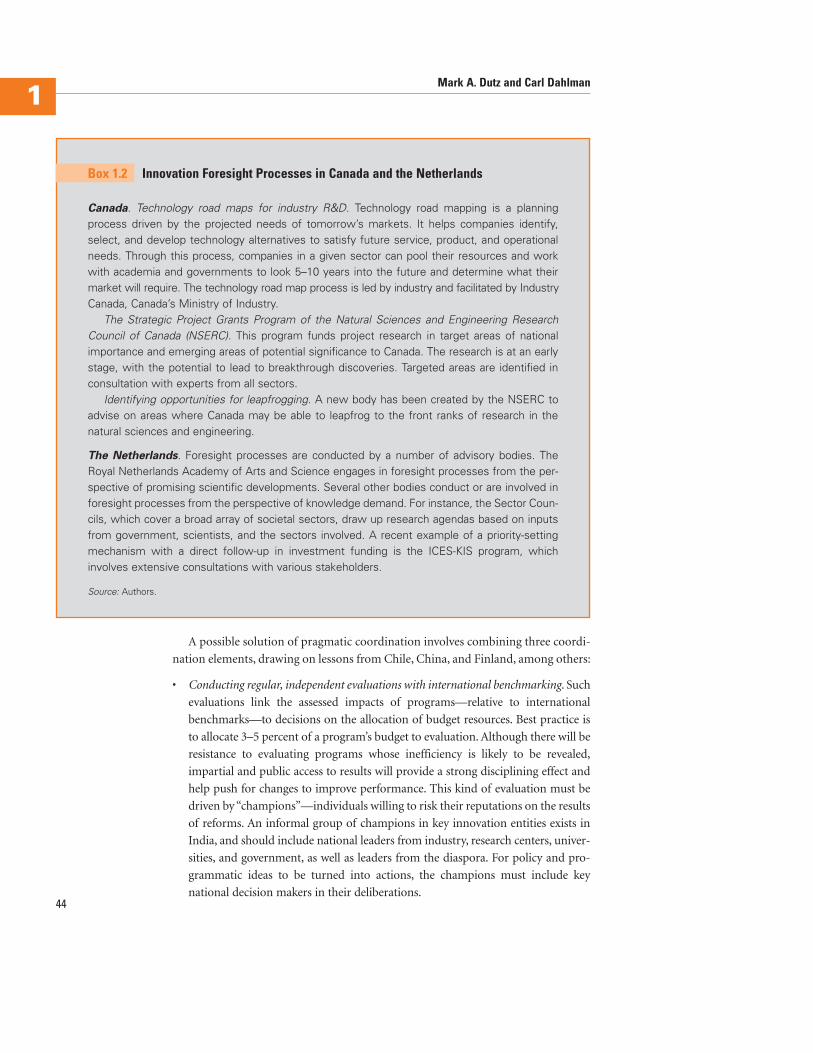
A possible solution of pragmatic coordination involves combining three coordi-
nation elements, drawing on lessons from Chile, China, and Finland, among others:
• Conducting regular, independent evaluations with international benchmarking. Such
evaluations link the assessed impacts of programs––relative to international
benchmarks—to decisions on the allocation of budget resources. Best practice is
to allocate 3–5 percent of a program’s budget to evaluation. Although there will be
resistance to evaluating programs whose inefficiency is likely to be revealed,
impartial and public access to results will provide a strong disciplining effect and
help push for changes to improve performance. This kind of evaluation must be
driven by “champions”––individuals willing to risk their reputations on the results
of reforms. An informal group of champions in key innovation entities exists in
India, and should include national leaders from industry, research centers, univer-
sities, and government, as well as leaders from the diaspora. For policy and pro-
grammatic ideas to be turned into actions, the champions must include key
national decision makers in their deliberations.44
Mark A. Dutz and Carl Dahlman1
Canada. Technology road maps for industry R&D. Technology road mapping is a planningprocess driven by the projected needs of tomorrow’s markets. It helps companies identify,select, and develop technology alternatives to satisfy future service, product, and operationalneeds. Through this process, companies in a given sector can pool their resources and workwith academia and governments to look 5–10 years into the future and determine what theirmarket will require. The technology road map process is led by industry and facilitated by IndustryCanada, Canada’s Ministry of Industry.
The Strategic Project Grants Program of the Natural Sciences and Engineering ResearchCouncil of Canada (NSERC). This program funds project research in target areas of nationalimportance and emerging areas of potential significance to Canada. The research is at an earlystage, with the potential to lead to breakthrough discoveries. Targeted areas are identified inconsultation with experts from all sectors.
Identifying opportunities for leapfrogging. A new body has been created by the NSERC toadvise on areas where Canada may be able to leapfrog to the front ranks of research in thenatural sciences and engineering.
The Netherlands. Foresight processes are conducted by a number of advisory bodies. TheRoyal Netherlands Academy of Arts and Science engages in foresight processes from the per-spective of promising scientific developments. Several other bodies conduct or are involved inforesight processes from the perspective of knowledge demand. For instance, the Sector Coun-cils, which cover a broad array of societal sectors, draw up research agendas based on inputsfrom government, scientists, and the sectors involved. A recent example of a priority-settingmechanism with a direct follow-up in investment funding is the ICES-KIS program, whichinvolves extensive consultations with various stakeholders.
Source: Authors.
Box 1.2 Innovation Foresight Processes in Canada and the Netherlands
The Indian Context and Enabling Environment1
45
• Introducing new programs through strategic pilots. Because scaling up, not piloting,
is the main goal of new programs, pilots should be selected based on their scala-
bility and diffusion, as is done in China. This is why they are called “strategic” pilots.
• Fostering innovation foresight for future societal needs to inform current decisions.
Innovation foresight links a consensus view on the future needs of society at large
with new tools of science and technology to address those needs. Early efforts at
using innovation foresight approaches were conducted in the United Kingdom in
the 1990s. The first resulted in the unexpected articulation of the widespread
ramifications of an aging population and the possibilities of innovation in meet-
ing those needs. Since then, foresight processes have been adopted elsewhere and
have proven particularly useful in defining long-term needs and developing the
creative synergies from which innovation emerges (box 1.2). A nationwide
foresight process in India with collaborative interaction of a group of industry,
government, civil society, and research community representatives could start
with a focus on thematic national challenges, such as access to clean water or road
transport congestion in cities.
Notes
For questions or further information, please contact Mark A. Dutz at [email protected] orCarl Dahlman at [email protected].
1. The term “economic dualism” is used here not in the sense of Nobel laureate Arthur Lewis’ 1954model of labor market dualism, but rather to emphasize the stark contrast between the “twoIndias.”
2. See Planning Commission (2006, Table 2) where an all-India consumption poverty head countratio of 27.8 percent is reported based on the 2004–05 National Sample Survey, with poverty inthe worst state rising to 46.5 percent.
3. See World Bank (2006h) and Planning Commission (2006, Table 2): all-India female illiteracy of46.3 percent is calculated based on information from the 2001 Census, with illiteracy in theworst state rising to 66.9 percent.
4. For economic theory and empirical bases for the linkage between competition, innovation,productivity growth, and overall economic growth, see Aghion (2006), Aghion, Bloom, and others(2005), and Aghion, Blundell, and others (2006).
5. As reported in Planning Commission (2006), the consumption poverty head count ratio hasfallen from 36.0 percent in 1993–94 to 27.8 percent in 2004–05. Although there is no establishedcausal link between innovation and poverty alleviation, it is plausible to presume that innova-tion can have a longer-term impact on poverty by increasing growth, as well as a more directimpact through pro-poor innovation efforts.
6. While informality is often deemed to be driven by high formal sector taxes and restrictive rulesand regulations, the dualism referred to here is driven by skills gaps and other impediments toknowledge creation, absorption, and use.
7. Defining formal and informal employment is difficult. The formal sector is usually more mod-ern, subject to more government regulation and taxation, and uses more updated production andorganization techniques than the informal (also known as traditional) sector. This section usesestimates from World Bank (2006f) that compare data from five-year National Statistical Officesurveys with the population censuses conducted every decade, and data from the Annual Surveyof Industries for the organized manufacturing sector (see table A.1 in the technical appendix).
In World Bank (2006d: 7), the workforce estimate is roughly 390 million for 2003, with only 8million employed in the formal private sector. According to the latest National Sample Surveydata for 2004–05, the size of India’s workforce was 457.4 million; although private formalemployment has definitely grown since 2003, an updated figure is not available.
8. See in particular World Bank (2006e).
9. See Bosworth and Collins (2006).
10. There is much less international, comparable information on the inputs and outputs of infor-mal creation and on knowledge diffusion and absorption by enterprises.
11. The rankings presented in the following paragraphs, based on quantitative measures, are moresober than, for instance, the subjective assessments of international business leaders on India’sinnovation potential in World Economic Forum (2006).
12. Inspired by the comparison of the so-called BRICs economies of Brazil, Russia, India, and Chinainitiated by reports from Goldman Sachs, this study uses a somewhat larger set of comparatorcountries wherever data are available, and reports figures in the BRICKM order: Brazil, Russia,India, China, Korea, and Mexico. See Business Week’s report (April 24, 2006) on the world’s mostinnovative companies, based on a global survey of 1,070 senior managers in early 2006.
13. These are 2 of the top 10 reasons India can innovate, according to Govindarajan (2006).
14. http://www.investmentcommission.in/human_capital.htm.
15. By including own estimates of domestic and especially multinational corporation spending onR&D for 2003 and beyond, Evalueserve (2006) estimates that total R&D spending in India was 1.08percent of GDP in 2005, and forecasts that this figure will rise to 1.75 percent of GDP by 2010.
16. A dollar of R&D spending goes further in India—or, conversely, R&D in India can be conductedat roughly one-fourth of the cost in the United States. See Evalueserve (2006).
17. Figures for 2005 and 2006 are projections based on continuation of the observed 2000–04growth.
18. See Evalueserve (2006) who have added to the Indian Department of Science and Technologyfigures for 2003–05 (fiscal years 2003–04 and 2005–06) rough estimates based on surveys ofdomestic private enterprises and MNCs in sectors such as IT services, electronics and electricalequipment, chemicals, drugs and pharmaceuticals, biotech, and automotive engineering services.
19. Based on Abramson (2007: 23).
20. To make international comparisons on patenting, it is necessary to standardize for the patentregime because of national differences in what can be patented. Thus, it is useful to examinepatents submitted to the U.S. Patent Office, because the United States represented the largestglobal market until the European Community recently overtook it.
21. These very aggregate measures are just a rough proxy because they do not control for the impor-tance of the articles or the patents. In addition, issue can be taken with the relevance of U.S.patents as the measure. Still, these measures provide a characterization of India’s broad per-formance and strengths relative to other countries.
22. The survey’s best available proxy for innovation output is whether an enterprise developed animportant new product line in the past two years. A second, broader proxy for innovation iswhether an enterprise upgraded an existing product line. Neither of these enables inferencesabout whether the products were truly new to the world or simply new to India. Most “innova-tive” products are probably not new to India but new only to the enterprise or to its market. Thelatter is more likely in cases where the relevant market is local or regional, rather than national.The extent of novelty also could vary across enterprises depending on how the question wasasked and what responding managers perceived as being “new.”
23. See, for instance, Economist (2006).
24. R&D spending (or whether any R&D is done within the firm or subcontracted) is used as aproxy for creation activities, while reporting on having “acquired new technology over the pasttwo years that either substantially changed the way that main products are produced or allowedthe production of new products” is the main proxy for absorption activities (also paying royal-ties or licensing fees, using Web sites, and the like). See technical appendix tables A.2 and A.3 forkey regression results.
46
Mark A. Dutz and Carl Dahlman1
The Indian Context and Enabling Environment1
47
25. See in particular the excellent multisector study by McKinsey Global Institute (2001), whichremains as relevant today as it was upon publication.
26. For data highlighting variations in restraints across cities in specific countries, see World Bank(2006a: 28; 2007a).
27. See, for instance, Lester and Piore (2004).
28. This section draws from, among others, Kuznetsov (2006) and World Bank (2007b). Examplesof how strengthening the institutional infrastructure becomes a key part of the action agenda forfostering innovation are provided in World Bank (2007b: 100–04).
References
Abramson, Bruce. 2007. “India’s Journey toward an Effective Patent System.” Policy Research
Working Paper 4301, South Asia Finance and Private Sector Development, World Bank,
Washington, DC.
Aghion, Philippe. 2006. “A Primer on Innovation and Growth.” Bruegel Policy Brief, Issue 6,
Brussels.
Aghion, Philippe, N. Bloom, R. Blundell, R. Griffith, and P. Howitt. 2005. “Competition and
Innovation: An Inverted U Relationship.” Quarterly Journal of Economics 120 (2): 701–28.
Aghion, Philippe, R. Blundell, R. Griffith, P. Howitt, and S. Prantl. 2006. “The Effects of Entry
on Incumbent Innovation and Productivity.” NBER Working Paper No. 12027, National
Bureau of Economic Research, Cambridge, MA.
Auerswald, Philip E., and Lewis M. Branscomb. 2003. “Valleys of Death and Darwinian Seas:
Financing the Invention to Innovation Transition in the United States.” Journal of Technol-
ogy Transfer 28 (3–4): 227–39.
Bhojwani, H. R. 2006. “Report on the Indian Civilian Public R&D System.” Background paper
commissioned by South Asia Finance and Private Sector Development, World Bank,
Washington, DC.
Bosworth, B., and S. Collins. 2006. “Accounting for Growth: Comparing India and China.”
Paper presented at Tokyo Club Foundation for Global Studies annual conference, Decem-
ber 6–7. www.tcf.or.jp/data/2006120607_B_Bosworth-S_Collins.pdf.
Bowonder, B., V. Kelkar, N. G. Satish, and J. K. Racherla. 2006. “Innovation in India: Recent
Trends.” TMTC (Tata Management Training Center) Research Paper, Pune, India.
Department of Science and Technology. 2006. Research and Development Statistics 2004–05.
New Delhi: Ministry of Science and Technology.
Dosi, G., C. Freeman, R. Nelson, G. Silverbert, and L. Soete. 1988. Technical Change and Eco-
nomic Theory. New York: Columbia University Press.
Economist. 2006. “While China’s Carmakers Copy, India’s Are Inventing.” December 16, p. 64.
Evalueserve. 2006. “Arth Karicheye Vidya: From Innovation to Commercialization.” Revised
Part 1 and Part 2. Prepared for Federation of Indian Chambers of Commerce and Indus-
try, New Delhi.
Govindarajan, Vijay. 2006. “Reasons Why India Can Innovate.” Business World, July 3.
Gupta, R. K. 2006. “The IPR System in India.” Background paper commissioned by South Asia
Finance and Private Sector Development, World Bank, Washington, DC.
Kuznetsov, Y. 2006. “Radical Transformation, Step-by-Step: Inside-Out Reform of India’s
Innovation System.” Background paper commissioned by South Asia Finance and Private
Sector Development, World Bank, Washington, DC.
Lester, Richard K., and Michael J. Piore. 2004. Innovation—The Missing Dimension. Cam-
bridge: Harvard University Press.
Lewis, W. Arthur. 1954. “Economic Development with Unlimited Supplies of Labor.” Man-
chester School of Economics and Social Studies 22: 139–91.
McKinsey Global Institute. 2001. India: The Growth Imperative. Washington, DC: McKinsey &
Company.
MIT (Massachusetts Institute of Technology). 2006. Technology Review. Cambridge, MA.
http://www.technologyreview.com/TR35/.
NCAER (National Council of Applied Economic Research). 2005. India Science Report: Science
Education, Human Resources and Public Attitudes towards Science and Technology. New
Delhi: NCAER.
OECD (Organisation for Economic Co-operation and Development). 2005. Science Technology
and Industry Scoreboard 2005. Paris.
———. 2006. Science, Technology and Industry Outlook 2006. Paris.
Planning Commission. 2006.“Towards Faster and More Inclusive Growth: An Approach to the
11th Five Year Plan.” Government of India, New Delhi.
Rodrik, Dani. 2005. “From ‘Hindu Growth’ to Productivity Surge: The Mystery of the Indian
Growth Transition.” IMF Staff Papers 52 (2): 193–228.
Schumpeter, Joseph A. 1975 [1942]. Capitalism, Socialism and Democracy. New York: Harper
and Row.
World Bank. 2006a. Doing Business in South Asia in 2006. Washington, DC.
———. 2006b. Doing Business 2007: How to Reform. Washington, DC.
———. 2006c. Enterprise Surveys. Washington, DC. www.enterprisesurveys.org.
———. 2006d. “India Inclusive Growth and Service Delivery: Building on India’s Success.”
Development Policy Review, Report No 34580-IN, Washington, DC.
———. 2006e. “India: National Agricultural Innovation Project.” Project Appraisal Docu-
ment, Report No. 34908-IN, Washington, DC.
———. 2006f. “India’s Employment Challenge: Creating Jobs, Helping Workers.” Report No.
35772-IN Draft, PREM South Asia, Washington, DC.
———. 2006g. KAM (Knowledge Assessment Methodology) database 2006. Washington, DC.
www.worldbank.org/kam.
———. 2006h. World Development Indicators 2006. Washington, DC.
———. 2007a. Doing Business in South Asia 2007. Washington, DC.
———. 2007b. Enhancing Agricultural Innovation: How to Go Beyond the Strengthening of
Research Systems. Washington, DC: World Bank.
World Economic Forum. 2006. Global Competitiveness Report 2006–07. Geneva, Switzerland.
48
Mark A. Dutz and Carl Dahlman1
49
Recognizing the economic importance of generating, commercializing, and absorb-
ing research and development (R&D), over the past 10–15 years, the government has
created a number of R&D support programs. However, the effectiveness of these
programs must be systematically evaluated and strengthened. Support has included
programs for R&D by public laboratories; joint projects between public labs and
enterprises; grants, loans, and equity participation for the creation of knowledge-
based companies; commercialization of R&D outputs; skills and quality upgrading;
support for intellectual property rights (IPR); and development of technology incu-
bators and science and technology parks.1
Although these programs have achieved significant successes, their effectiveness
has not matched the needs of the Indian economy or been commensurate with the
resources invested in them. This imbalance is not only a loss for specific programs
but, more important, represents many missed opportunities for the nation. Private
sector involvement has been minimal: most programs have been operated and
managed by government institutions. Public institutions typically suffer from
complex, overlapping structures for policy making and decision making. This
public sector approach reflects a preference for government ownership and
management of the initiatives, rather than leveraging private sector capacity to
provide investments, modern management, risk taking, and needed skills, designs,
and operational flexibility.
The rigid, bureaucratic resource allocation procedures, combined with the lack
of risk taking and clear accountability in many public institutions, may be the main
reasons for the limited effectiveness of the government’s R&D programs. Most
critically, programs should be subjected to sufficiently regular, independent,
performance-based monitoring and evaluation, with international benchmarking
of their inputs, management practices, outcomes, and impacts.2
Creating and CommercializingKnowledgeCarl Dahlman, Mark A. Dutz, and Vinod K. Goel
2Chapter
50
Carl Dahlman, Mark A. Dutz, and Vinod K. Goel2
The government is developing a new approach that leverages the strength of the
public as well as private sectors in the design and operation of all public R&D sup-
port programs. As part of this program, the government needs to provide a “light-
touch” policy and regulatory framework that encourages the private sector to
undertake initiatives with sufficient speed-to-market to benefit the country
economically. This framework should receive appropriate financial support––to
encourage private firms to take risks that they would otherwise not take. The pri-
vate sector should be called upon to manage programs with appropriate checks and
balances as well as with performance standards and monitoring.
In addition, all public R&D support programs must be periodically subjected to
thorough independent reviews and evaluations by national and international
experts. The programs should be benchmarked against relevant features of the most
effective programs of other countries. Based on these evaluations, the programs
should be expanded, restructured, or closed, to ensure maximum benefits from
government support. Efforts should also be made to consolidate the many existing
programs into a small number of simplified framework programs, coupled with a
nationwide awareness program. Although this new approach is being implemented,
it needs to be strengthened, expanded, and expedited.
Increasing Private R&D Efforts
The world has acknowledged India’s R&D potential. More than 300 multinational
corporations (MNCs) have set up R&D and technical centers in India. Despite their
recent increases in R&D spending, national corporations and other domestic enter-
prises are not systematically exploiting this potential to India’s advantage. This section
explores the role of public policy in increasing private R&D efforts.
Recent Trends in Private R&D and Assessment
Since liberalization, Indian indigenous R&D spending at the enterprise level has
grown significantly. In 1991, indigenous enterprise R&D spending as a share of sales
was less than 0.1 percent.3 By 2004 that share was more than 0.5 percent. Although
this was a significant increase in less than 15 years, it remains low by international
standards. Most indigenous Indian companies are funding little R&D on their own.
Only three Indian companies––Ranbaxy and Dr. Reddy’s Lab in pharmaceuticals
and Tata Motors––are among the world’s top 1,250 companies when it comes to
R&D investment (U.K. Department of Trade and Industry 2006).
Indigenous enterprise R&D and innovation are on the rise—and above the
Indian average in the pharmaceutical, automotive, and information technology (IT)
and software sectors. Not surprisingly, these are the sectors where India has been
facing the most competition from MNCs and a more demanding international
market, to which many domestic enterprises are beginning to expand exports.
Pharmaceuticals is the country’s most R&D-intensive sector, with the share of R&D
Creating and Commercializing Knowledge 2
51
relative to sales jumping from 0.4 percent in 1991 to 4.8 percent in 2004 (box 2.1).
India’s pharmaceutical industry has developed world-class capability and become a
major innovator. India’s three top pharmaceutical firms (Dr. Reddy’s, Sun Pharma-
ceuticals, Ranbaxy) invested 12–18 percent of sales in R&D in fiscal 2006.4 These
levels are comparable to those of some of the world’s leading pharmaceutical firms,
such as Pfizer (14.6 percent) and GlaxoSmithKline (14.0 percent).
India’s automotive firms increased R&D spending from 0.2 percent of sales in
1991 to 0.9 percent in 2004. Indian IT and software firms increased R&D spending
from almost nothing in 1991 to 1.5 percent of sales in 2004. Ramco Systems raised
R&D spending the most, by 40 percent, but large software firms such as HCL
Little R&D was conducted in-house by Indian pharmaceutical companies in the 1950s and1960s. The 1970 Patent Act created an incentive for firms to do R&D, focused on finding newprocesses for known drugs (because only processes, not products, were patentable under thelegislation) and substituting local for imported inputs wherever possible. Based on existingcapabilities and with the liberalization of the 1990s, some firms began to focus on novel drugdelivery systems. By the late 1990s, some leading companies embarked on drug productdiscovery. There has been an emergence of technologically competent medium-size firmsmanufacturing active pharmaceutical ingredients and intermediates to global standards forMNCs and large Indian generic companies. Some are undertaking custom synthesis andcontract manufacturing for patented molecules for international clients based on their ownprocess know-how.
Some of the leading firms have shifted their strategy from “business-driven innovation” to“research-driven business” aimed at developing innovative, non-infringing processes, noveldrug delivery systems, new chemical entities, and biopharmaceuticals. In 2003, Indianpharmaceutical companies accounted for the most Drug Master Files applications (126) withthe U.S. Food and Drug Administration (USFDA)—more than China, Israel, Italy, and Spaincombined—and had the largest number of USFDA-approved manufacturing facilities (60)outside the United States.
In the early 2000s, Indian pharmaceutical companies sought to license “lead molecules”that they had discovered to major global players at the preclinical stage because of the heavyinvestments and risks involved in further developing them. But the scene has since changed.India’s 10 top pharmaceutical companies are now investing heavily in R&D and developingclinical trials of lead molecules on their own, with more than 50 new drug developments in thepipeline. The rate of new drug development is accelerating rapidly, as even medium-sizecompanies are increasing R&D spending for new drug discovery. In addition, Indian companiesare entering into R&D alliances with international pharmaceutical companies. Some, likeNicholas Piramal Labs, are even buying up foreign pharmaceutical firms and expandingproduction in the United States.
Source: Authors.
Box 2.1 Private R&D in Pharmaceuticals
(2.5 percent) and Infosys (0.9 percent) had much lower increases. In 2005, Wipro,
one of India’s premier global IT service companies, generated more than $100 mil-
lion in revenues through its innovation initiative and 40 Centers of Excellence—
which have about 500 employees working on innovation-related projects. Innova-
tion at these centers has focused on process improvements, new service lines, and
R&D. Wipro’s most recent innovation is a Global Command Center that offers
shared service solutions through a remote location.
The private sector increasingly recognizes the need for further innovation. A
recent survey of 83 top executives representing all major manufacturing sectors
found that they are increasing efforts to innovate. The results are as follows:
• 82 percent believed that generating organic growth through innovation is essential
for success in their industry;
• 70 percent said that their companies would increase spending on innovation
in 2006; and
• 71 percent felt that lack of collaboration between industry and research
institutes was the main hurdle to innovation in India (CII and BCG 2005).
The survey also found that the key challenges faced by companies included mea-
suring returns to innovation, moving quickly from idea generation to initial sales
(commercialization and launch), and balancing risks, time frames, and returns
across a portfolio of new projects. These findings imply that better monitoring and
management training and tools for innovation are becoming increasingly important
for Indian firms.
MNCs have discovered that India is an excellent location for R&D. In several
international surveys, investors have ranked India as their preferred destination for
locating innovation centers. (See, for example, Silverthrone [2005], who reports
that 69 percent of firms consider India their preferred site—compared with 8 per-
cent for China.) One of the country’s advantages is that the total annual payroll cost
of an Indian scientist or engineer is roughly $22,600 a year, compared with $90,000
in the United States—or roughly a quarter of the cost.5 Global firms are using three
strategies to source innovations in India: locating innovation centers in India
through fully owned local subsidiaries, outsourcing innovations to Indian research
centers and firms, and acquiring innovative entrepreneurial firms and start-ups
(Bowonder and others 2006).
Between 1998 and 2003, MNCs made $1.3 billion in R&D investments in India.
More than 300 MNCs are setting up R&D and technical centers in India. They
employ over 80,000 scientists and engineers and spend about $4 billion a year.
Planned investment totals $4.7 billion (based on approvals by the Secretariat for
Industrial Approvals).6 The United States accounts for more than half the number
of companies and 72 percent of the investment, and 63 percent of the planned
investment. Others key countries include France, Germany, and the United Kingdom,
as well as Canada, China, Denmark, Japan, the Republic of Korea, the Netherlands,
Norway, South Africa, Sweden, and Switzerland. Almost half of the centers are in
52
Carl Dahlman, Mark A. Dutz, and Vinod K. Goel2
Bangalore, followed by New Delhi and Mumbai. The main areas are computer and
IT, R&D software, engineering design (automotive, consumer durables, aerospace),
chemical design (molecules, chemical structures), and agriculture and biotechnology
(seeds, food, enzymes). Some 415 patents from India have been filed by these firms
with the U.S. Patent Office.7
The growth of MNC R&D centers generates positive spillovers to the Indian
economy, with the demonstration effect to indigenous corporations being the most
critical. The net effect of MNC R&D investments is hard to discern, though likely
strongly positive over the longer term. It depends on the positive and negative exter-
nalities on the Indian economy, and there are little data on this.8 The most impor-
tant positive spillover is likely the new enterprises that will ultimately be set up or
supported by the scientists and engineers who gain experience in the R&D labs, in
pursuit of new ideas not directly of relevance or interest to the MNCs. Another
important positive effect is the demonstration both to the government and to
domestic firms that India has valuable assets that they should be exploiting more
effectively. India’s attractiveness is a testament to the quality and cost-effectiveness of
its current stock of scientific and engineering talent (box 2.2). Moreover, MNC-hired
scientists and engineers are likely to receive higher salaries and benefits than they
would from working for the government, universities, or domestic firms. In addi-
tion, working in MNC research centers provides valuable training for Indian scien-
tists and engineers in the increasingly important area of innovation management—
a key need for domestic firms. To the extent that these scientists and engineers
collaborate with local firms or leave MNCs to set up their own firms or work for
domestic enterprises or government labs, this training could provide India with a
large positive externality.
Creating and Commercializing Knowledge 2
53
The huge influx of foreign direct investment (FDI) in India’s electronics and IT sectors has ledto a growing number of university-industry partnerships for undertaking R&D. The IndianInstitutes of Technologies (IITs), Indian Institutes of Science (IISc), and other specialtyinstitutes are hubs for innovation fueled by investments from overseas IT companies.
The following are illustrative examples of the close association between MNCs and academiain India. The IBM India Research Laboratory, set up at IIT Delhi, is undertaking significantactivities in many IT areas, including information management, e-commerce, distributedcomputing, life sciences, user interaction, and software engineering. The Society for Innovationand Development (SID) was set up in 1991 as the industry interaction arm of the IISc, Bangalore.Since then, SID has initiated R&D programs for IT and electronics companies, including SunMicrosystems, Honeywell, Nokia, and Cookson Electronics.
Source: Authors.
Box 2.2 R&D Links between Multinational Corporations and Academia
Possible short-term negative spillovers include diverting talent away from
India-specific needs and raising the cost of talent for indigenous firms. Although
some MNC research may be focused on the needs of the domestic market, the bulk
of it is likely for the MNCs’ global operations. Thus, there could be a direct oppor-
tunity cost to India in the short term. In addition, the strong rise in demand for
Indian scientists and engineers is leading to rapidly rising salaries and strong com-
petition for their talent. This talent pool is not as large as is commonly thought
(see chapter 5), and salaries are rising very quickly. Thus, a secondary effect is that
the rise in salaries induced by the increasing demand by the MNCs may be mak-
ing it more expensive for the government, universities, and domestic firms to do
R&D. Although large domestic firms may be able to compete, that may not be pos-
sible for smaller firms, public labs, and universities. As a result they could incur a
cost and a net loss in the short term—except to the extent that they may have pos-
itive interactions and contract work from the growing research demand of the
MNCs.9
The net effect of the rapid rise of MNC research centers in India is complex and
requires careful analysis, though it is likely to be strongly positive over the longer
term. It would be useful to conduct additional surveys to better understand the
focus of the research by the MNCs and the career paths of the Indian scientists and
engineers working for them. In the meantime there are two policy implications.
First, it is not necessarily in India’s best interest for the government to offer more
incentives to MNCs to locate R&D in India, as some have proposed. A neutral
policy that does not favor foreign over domestic firms may be more appropriate
unless further analysis shows that the research by foreign firms has greater positive
externalities—for strengthening India’s overall research capability and economic
returns to the country. Second, more should be done to increase the supply of qual-
ity scientists and engineers, because there is clearly an increasing supply constraint
that will undermine the growth of R&D by Indian firms as well as by MNCs in
India. India’s large demographic dividend should lead to a sharp supply response
over the longer term with appropriate incentives for the development of higher-end
skills, with likely enormous benefits to the Indian economy from greater exposure
to MNCs.
Assessment of Government Programs to Promote Private R&D
Of government programs supporting early-stage technology development (ESTD)
by formal private enterprises, the Sponsored Research and Development (SPREAD)
program has been an early success––though other initiatives are increasingly trying
to promote public-private partnerships. The case for public support for private
innovative efforts revolves around the social returns from these investments exceed-
ing the private ones. On the financing side, the positive spillovers to the rest of the
economy from innovation do not allow inventors to capture all benefits; hence, there
will be underinvestment. In addition, there is an asymmetry in the information
available to inventors and investors evaluating innovations, with the due diligence
54
Carl Dahlman, Mark A. Dutz, and Vinod K. Goel2
Creating and Commercializing Knowledge 2
55
efforts required to close this information gap typically leading investors to wait and
see the commercial outcomes before investing.10
To help address these market failures, government programs in developed
economies typically provide support to ESTD through grants—and especially
matching grants to enterprises––that encourage public-private risk-sharing, are
additional, and orient the selection process toward outcomes with high commercial
impact. India’s SPREAD is an early ESTD program that has been directed exclu-
sively at private enterprises, with an explicit requirement for collaboration with
public research institutes, and has been independently evaluated as successful.11 The
new Small Business Innovation Research Initiative (SBIRI) program of the Depart-
ment of Biotechnology, which provides matching grants, appears to be exactly the
type of scheme needed more broadly across other sectors of the economy, with mod-
ifications as appropriate based on early independent evaluation. And existing
programs—such as the Technology Information Forecasting and Assessment
Council (TIFAC) Home Grown Technology (HGT) program, Department of Scien-
tific and Industrial Research (DSIR) Technology Development and Demonstration
Program (TDDP), Department of Science and Technology (DST) Pharmaceuticals
R&D Support Fund (PRDSF), and DSIR-TIFAC Techno-entrepreneurs Promotion
Program (TePP)—are considering moving in the direction of SBIRI-type matching
grant support (see table 2.1).
Fiscal incentives to promote R&D appear ineffective. Fiscal incentives currently
available include the following:
• Income tax relief for R&D spending by industry
• Weighted tax deductions for publicly sponsored R&D and approved in-house
R&D projects
• Customs duty exemptions on capital equipment, spare parts, accessories, and
consumables imported for R&D by approved R&D units, institutions, and
scientific and industrial research organizations (SIROs)
• Excise duty waivers on domestic items purchased by approved institutions and
SIROs for R&D
• Excise duty waivers for three years on goods produced based on domestically
developed technologies and patented in any two of the following countries:
India, Japan, the United States, or any EU member
• Accelerated depreciation allowances on plant and machinery setups based on
domestic technology
• Customs duty exemptions on imports for R&D projects supported by the
government
• A 10-year tax holiday for commercial R&D companies.
There has been a lack of monitoring and accountability of these incentives and
their outcomes. Moreover, industry has not used them to any significant degree. It is
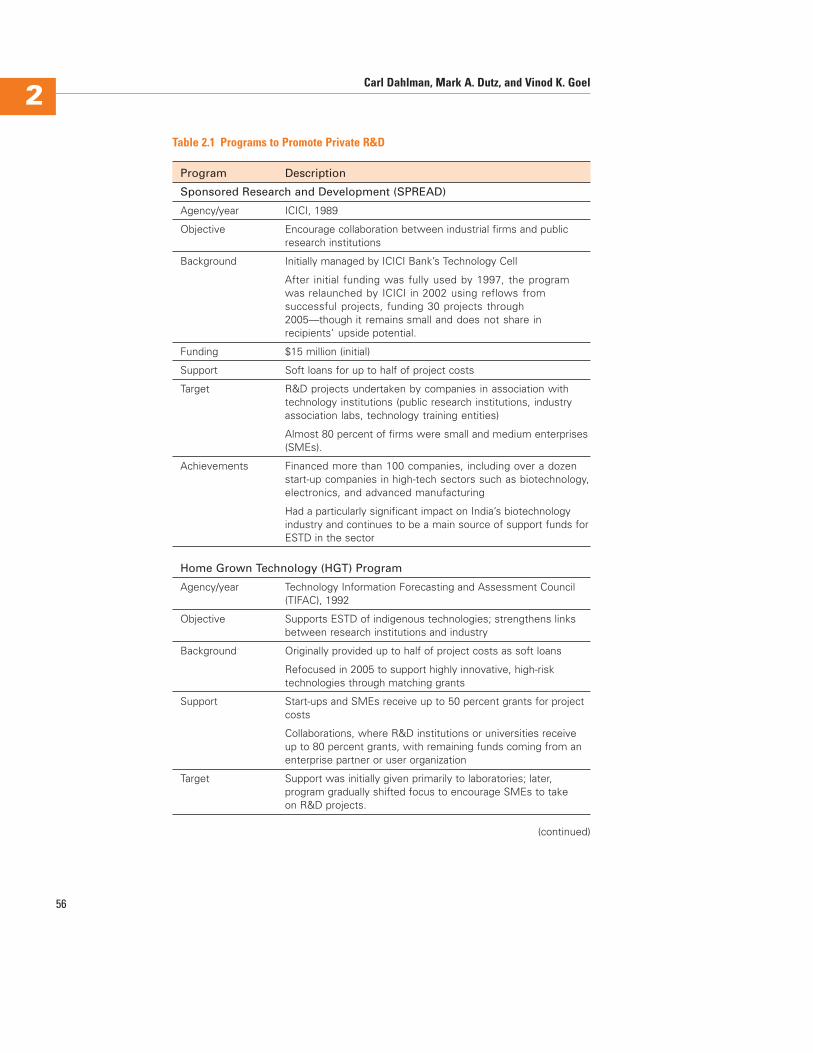
56
Carl Dahlman, Mark A. Dutz, and Vinod K. Goel2
Table 2.1 Programs to Promote Private R&D
Program Description
Sponsored Research and Development (SPREAD)
Agency/year ICICI, 1989
Objective Encourage collaboration between industrial firms and publicresearch institutions
Background Initially managed by ICICI Bank’s Technology Cell
After initial funding was fully used by 1997, the programwas relaunched by ICICI in 2002 using reflows fromsuccessful projects, funding 30 projects through2005––though it remains small and does not share inrecipients’ upside potential.
Funding $15 million (initial)
Support Soft loans for up to half of project costs
Target R&D projects undertaken by companies in association withtechnology institutions (public research institutions, industryassociation labs, technology training entities)
Almost 80 percent of firms were small and medium enterprises(SMEs).
Achievements Financed more than 100 companies, including over a dozenstart-up companies in high-tech sectors such as biotechnology,electronics, and advanced manufacturing
Had a particularly significant impact on India’s biotechnologyindustry and continues to be a main source of support funds forESTD in the sector
Home Grown Technology (HGT) Program
Agency/year Technology Information Forecasting and Assessment Council(TIFAC), 1992
Objective Supports ESTD of indigenous technologies; strengthens linksbetween research institutions and industry
Background Originally provided up to half of project costs as soft loans
Refocused in 2005 to support highly innovative, high-risktechnologies through matching grants
Support Start-ups and SMEs receive up to 50 percent grants for projectcosts
Collaborations, where R&D institutions or universities receiveup to 80 percent grants, with remaining funds coming from anenterprise partner or user organization
Target Support was initially given primarily to laboratories; later,program gradually shifted focus to encourage SMEs to takeon R&D projects.
(continued)
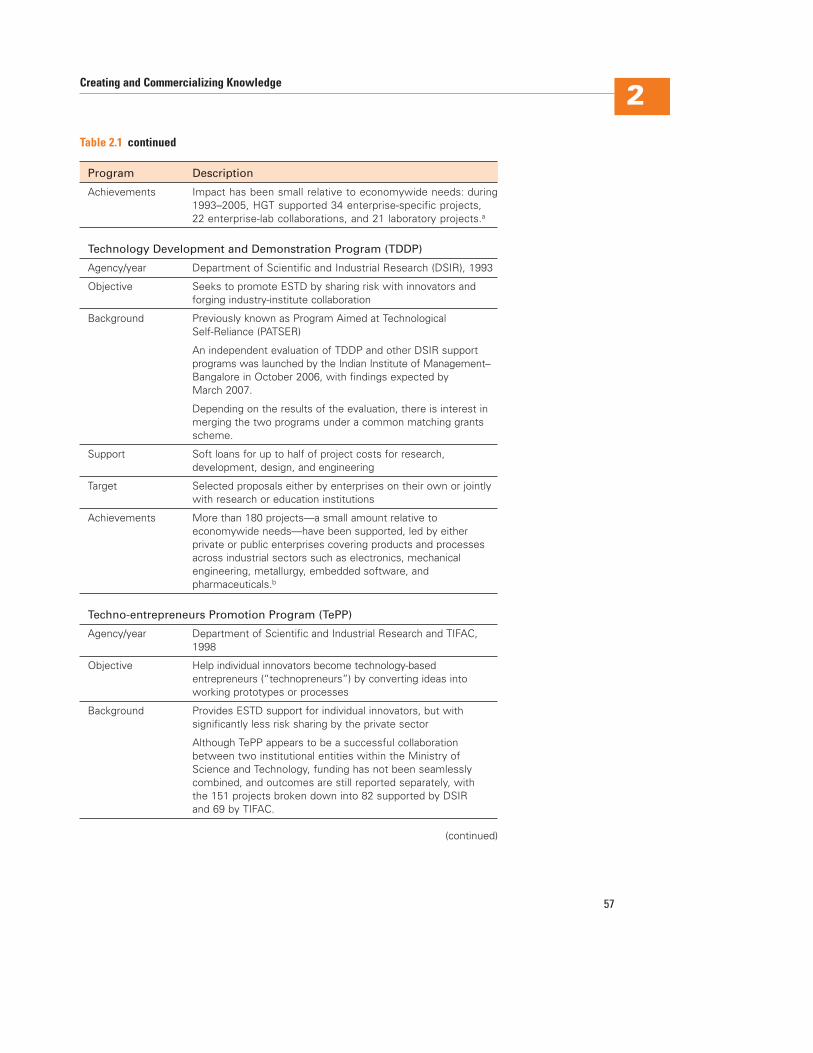
Creating and Commercializing Knowledge 2
57
Table 2.1 continued
Program Description
Achievements Impact has been small relative to economywide needs: during1993–2005, HGT supported 34 enterprise-specific projects,22 enterprise-lab collaborations, and 21 laboratory projects.a
Technology Development and Demonstration Program (TDDP)
Agency/year Department of Scientific and Industrial Research (DSIR), 1993
Objective Seeks to promote ESTD by sharing risk with innovators andforging industry-institute collaboration
Background Previously known as Program Aimed at Technological Self-Reliance (PATSER)
An independent evaluation of TDDP and other DSIR supportprograms was launched by the Indian Institute of Management–Bangalore in October 2006, with findings expected by March 2007.
Depending on the results of the evaluation, there is interest inmerging the two programs under a common matching grantsscheme.
Support Soft loans for up to half of project costs for research,development, design, and engineering
Target Selected proposals either by enterprises on their own or jointlywith research or education institutions
Achievements More than 180 projects—a small amount relative to economywide needs—have been supported, led by either private or public enterprises covering products and processesacross industrial sectors such as electronics, mechanicalengineering, metallurgy, embedded software, andpharmaceuticals.b
Techno-entrepreneurs Promotion Program (TePP)
Agency/year Department of Scientific and Industrial Research and TIFAC,1998
Objective Help individual innovators become technology-based entrepreneurs (“technopreneurs”) by converting ideas into working prototypes or processes
Background Provides ESTD support for individual innovators, but withsignificantly less risk sharing by the private sector
Although TePP appears to be a successful collaborationbetween two institutional entities within the Ministry ofScience and Technology, funding has not been seamlesslycombined, and outcomes are still reported separately, withthe 151 projects broken down into 82 supported by DSIRand 69 by TIFAC.
(continued)
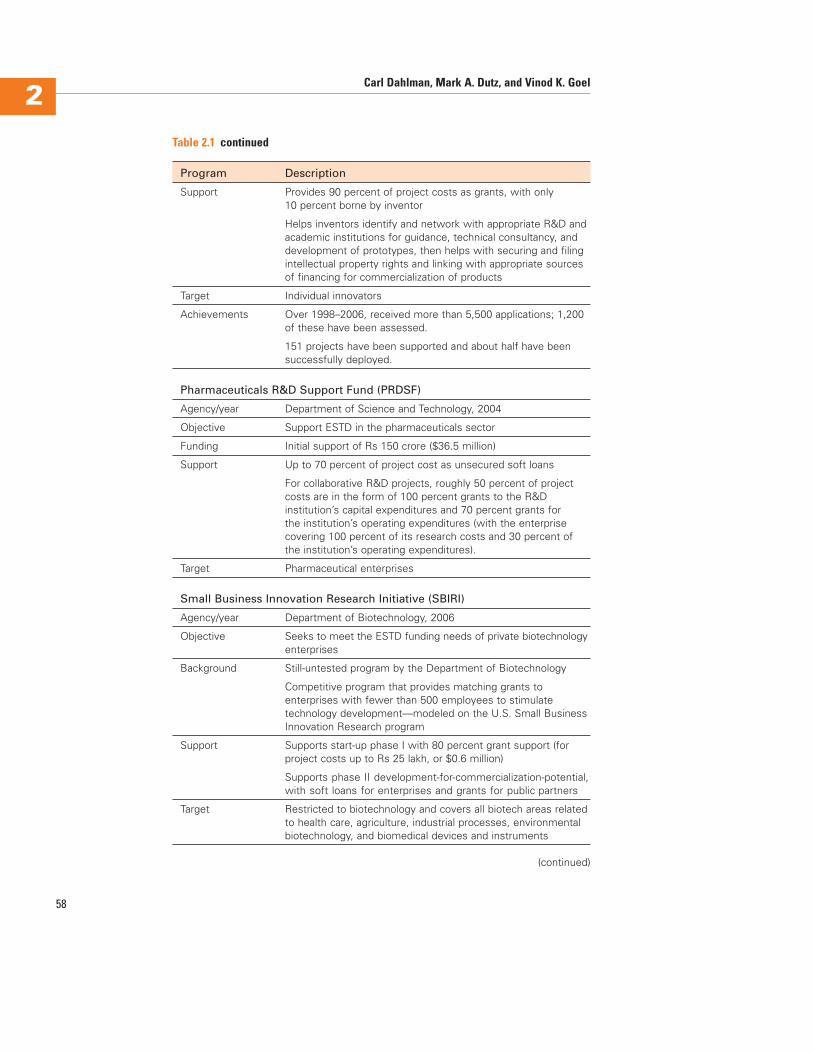
58
Carl Dahlman, Mark A. Dutz, and Vinod K. Goel2
Table 2.1 continued
Program Description
Support Provides 90 percent of project costs as grants, with only 10 percent borne by inventor
Helps inventors identify and network with appropriate R&D andacademic institutions for guidance, technical consultancy, anddevelopment of prototypes, then helps with securing and filingintellectual property rights and linking with appropriate sourcesof financing for commercialization of products
Target Individual innovators
Achievements Over 1998–2006, received more than 5,500 applications; 1,200of these have been assessed.
151 projects have been supported and about half have beensuccessfully deployed.
Pharmaceuticals R&D Support Fund (PRDSF)
Agency/year Department of Science and Technology, 2004
Objective Support ESTD in the pharmaceuticals sector
Funding Initial support of Rs 150 crore ($36.5 million)
Support Up to 70 percent of project cost as unsecured soft loans
For collaborative R&D projects, roughly 50 percent of projectcosts are in the form of 100 percent grants to the R&Dinstitution’s capital expenditures and 70 percent grants forthe institution’s operating expenditures (with the enterprisecovering 100 percent of its research costs and 30 percent ofthe institution’s operating expenditures).
Target Pharmaceutical enterprises
Small Business Innovation Research Initiative (SBIRI)
Agency/year Department of Biotechnology, 2006
Objective Seeks to meet the ESTD funding needs of private biotechnologyenterprises
Background Still-untested program by the Department of Biotechnology
Competitive program that provides matching grants toenterprises with fewer than 500 employees to stimulatetechnology development––modeled on the U.S. Small BusinessInnovation Research program
Support Supports start-up phase I with 80 percent grant support (forproject costs up to Rs 25 lakh, or $0.6 million)
Supports phase II development-for-commercialization-potential,with soft loans for enterprises and grants for public partners
Target Restricted to biotechnology and covers all biotech areas relatedto health care, agriculture, industrial processes, environmentalbiotechnology, and biomedical devices and instruments
(continued)
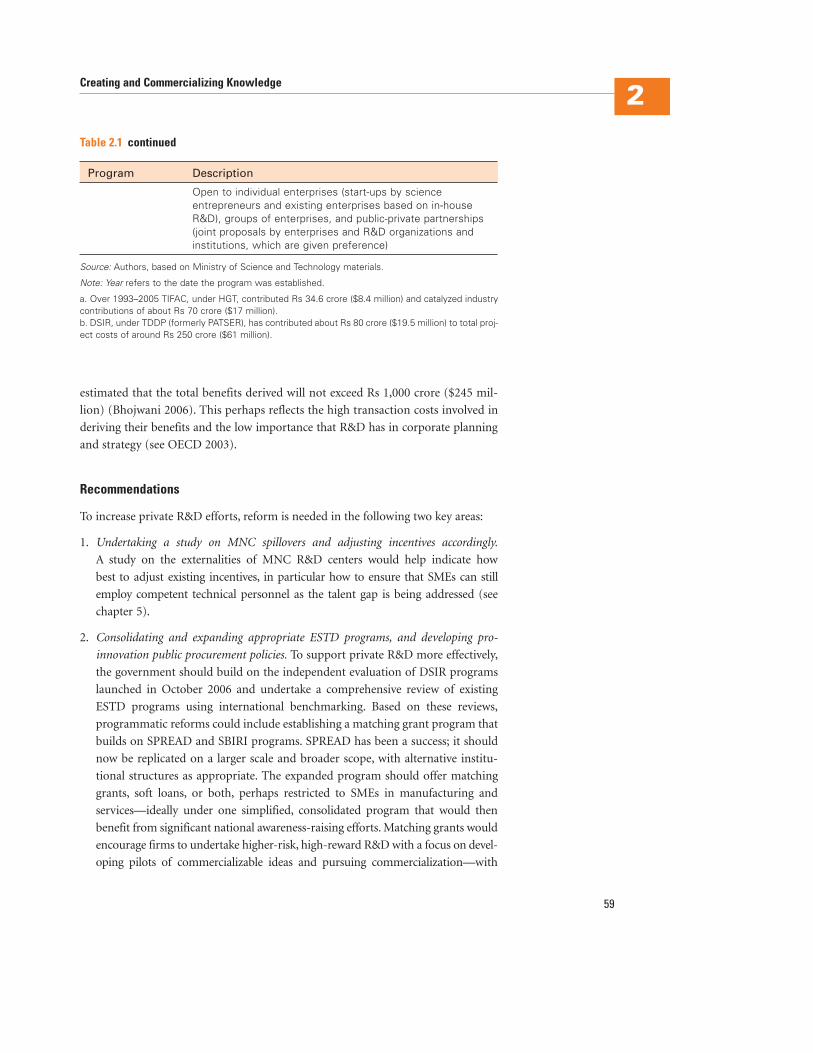
estimated that the total benefits derived will not exceed Rs 1,000 crore ($245 mil-
lion) (Bhojwani 2006). This perhaps reflects the high transaction costs involved in
deriving their benefits and the low importance that R&D has in corporate planning
and strategy (see OECD 2003).
Recommendations
To increase private R&D efforts, reform is needed in the following two key areas:
1. Undertaking a study on MNC spillovers and adjusting incentives accordingly.
A study on the externalities of MNC R&D centers would help indicate how
best to adjust existing incentives, in particular how to ensure that SMEs can still
employ competent technical personnel as the talent gap is being addressed (see
chapter 5).
2. Consolidating and expanding appropriate ESTD programs, and developing pro-
innovation public procurement policies. To support private R&D more effectively,
the government should build on the independent evaluation of DSIR programs
launched in October 2006 and undertake a comprehensive review of existing
ESTD programs using international benchmarking. Based on these reviews,
programmatic reforms could include establishing a matching grant program that
builds on SPREAD and SBIRI programs. SPREAD has been a success; it should
now be replicated on a larger scale and broader scope, with alternative institu-
tional structures as appropriate. The expanded program should offer matching
grants, soft loans, or both, perhaps restricted to SMEs in manufacturing and
services––ideally under one simplified, consolidated program that would then
benefit from significant national awareness-raising efforts. Matching grants would
encourage firms to undertake higher-risk, high-reward R&D with a focus on devel-
oping pilots of commercializable ideas and pursuing commercialization—with
Creating and Commercializing Knowledge 2
59
Table 2.1 continued
Program Description
Open to individual enterprises (start-ups by scienceentrepreneurs and existing enterprises based on in-houseR&D), groups of enterprises, and public-private partnerships(joint proposals by enterprises and R&D organizations andinstitutions, which are given preference)
Source: Authors, based on Ministry of Science and Technology materials.
Note: Year refers to the date the program was established.
a. Over 1993–2005 TIFAC, under HGT, contributed Rs 34.6 crore ($8.4 million) and catalyzed industrycontributions of about Rs 70 crore ($17 million).b. DSIR, under TDDP (formerly PATSER), has contributed about Rs 80 crore ($19.5 million) to total proj-ect costs of around Rs 250 crore ($61 million).
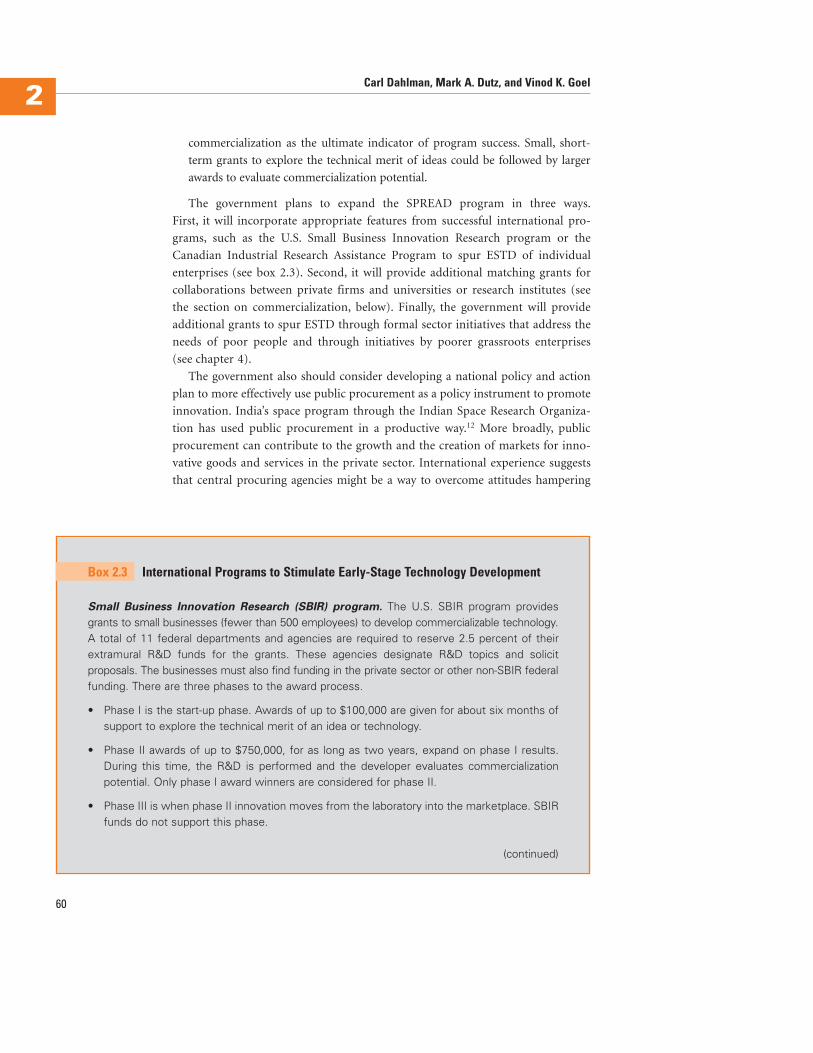
60
Carl Dahlman, Mark A. Dutz, and Vinod K. Goel2
commercialization as the ultimate indicator of program success. Small, short-
term grants to explore the technical merit of ideas could be followed by larger
awards to evaluate commercialization potential.
The government plans to expand the SPREAD program in three ways.
First, it will incorporate appropriate features from successful international pro-
grams, such as the U.S. Small Business Innovation Research program or the
Canadian Industrial Research Assistance Program to spur ESTD of individual
enterprises (see box 2.3). Second, it will provide additional matching grants for
collaborations between private firms and universities or research institutes (see
the section on commercialization, below). Finally, the government will provide
additional grants to spur ESTD through formal sector initiatives that address the
needs of poor people and through initiatives by poorer grassroots enterprises
(see chapter 4).
The government also should consider developing a national policy and action
plan to more effectively use public procurement as a policy instrument to promote
innovation. India’s space program through the Indian Space Research Organiza-
tion has used public procurement in a productive way.12 More broadly, public
procurement can contribute to the growth and the creation of markets for inno-
vative goods and services in the private sector. International experience suggests
that central procuring agencies might be a way to overcome attitudes hampering
Small Business Innovation Research (SBIR) program. The U.S. SBIR program providesgrants to small businesses (fewer than 500 employees) to develop commercializable technology.A total of 11 federal departments and agencies are required to reserve 2.5 percent of theirextramural R&D funds for the grants. These agencies designate R&D topics and solicitproposals. The businesses must also find funding in the private sector or other non-SBIR federalfunding. There are three phases to the award process.
• Phase I is the start-up phase. Awards of up to $100,000 are given for about six months ofsupport to explore the technical merit of an idea or technology.
• Phase II awards of up to $750,000, for as long as two years, expand on phase I results.During this time, the R&D is performed and the developer evaluates commercializationpotential. Only phase I award winners are considered for phase II.
• Phase III is when phase II innovation moves from the laboratory into the marketplace. SBIRfunds do not support this phase.
(continued)
Box 2.3 International Programs to Stimulate Early-Stage Technology Development
Creating and Commercializing Knowledge 2
61
The SBIR program has experienced explosive growth since its inception in 1983. In that firstyear, the program made 686 phase I awards totaling $44.5 million to small high-technologyfirms. In fiscal 2004, the program issued 4,638 phase I awards and 2,013 phase II awardsworth $1.87 billion. Case studies of 44 projects have found that social rates of return average84 percent under SBIR-funded projects, compared with 25 percent for projects without SBIRfunding. A major objective of the SBIR program is to produce new high-technology productsand services from federal R&D. In the program’s early years, it was believed that very littlefederal R&D would result in the spin-off of commercialized products and services. However,the program has produced a stream of innovations, far exceeding early expectations. It is nowestimated that nearly 40 percent of phase II projects will result in a commercialized productor service. These innovations cover the entire high-technology spectrum. For more on theprogram, including statistics, see http://www.sba.gov/sbir/indexsbir-sttr.html. For more infor-mation on the program’s guidelines, see http://www.sba.gov/sbir/SBIR-PolicyDirective.pdf. Foran evaluation of the Department of Defense Fast Track SBIR Initiative, see National ResearchCouncil (2000).
Industrial Research Assistance Program (IRAP). IRAP, sponsored by the Canadian NationalResearch Council, provides a range of technical and business-oriented advisory servicesalong with financial support to growth-oriented Canadian SMEs. The program is run by anextensive network of 260 professionals in 100 communities across the country. Workingdirectly with its clients, IRAP supports innovative R&D and commercialization of new prod-ucts and services. IRAP views SMEs as the strategic backbone of the Canadian economy andis committed to working with them while they realize their full potential and turn knowledgeand innovation into strategic opportunities, jobs, and prosperity for all Canadians. The pro-gram funds feasibility studies, precompetitive R&D, adaptation, international sourcing, and hir-ing of young talent. It funds almost 3,000 projects a year, with support totaling C$135 million(US$122 million).
Small Business Technology Transfer (STTR) program. The U.S. STTR program is a com-petitive matching grant program that encourages commercialization of R&D from public labs,nonprofit research organizations, and nonprofit universities to the marketplace. The STTRprogram requires partnerships among these entities, while the SBIR program merely encour-ages them. The STTR program follows the same three phases as the SBIR program. Fundingcomes from the R&D budgets of the Departments of Defense, Energy, and Health and HumanServices; the National Aeronautics and Space Administration; and the National Science Foun-dation. In 2001, the set-aside was increased from 0.15 percent to 0.30 percent. The STTRprogram began making awards in fiscal 1994, issuing 198 for about $19 million to small high-technology firms that collaborated with nonprofit research institutions to undertake R&D. Infiscal 2004, the program awarded 614 phase I awards and 195 phase II awards totaling justover $198 million.
Source: Authors.
Box 2.3 continued
62
Carl Dahlman, Mark A. Dutz, and Vinod K. Goel2
the procurement of innovation, either by leading the movement toward inno-
vation by a strong political mandate or by building up critical mass—and sup-
ported by a clear move away from traditional fixed procurement criteria, such as
price, toward emphasizing life-cycle costs, outcomes, and innovative solutions for
achieving them.13
Improving the Impact of Public R&D
Indigenous R&D spending as a share of GDP remains low and dominated by the
public sector. This section explores what government should do to increase the
impact of public R&D.
Organization and Selected Support Programs for the Public R&D System
The public sector dominates domestic R&D. Figure 2.1 provides an overview of the
main public institutions involved in R&D in India.14 The public sector (central and
state) accounts for 70–80 percent of India’s total R&D investment, equal to 0.8 per-
cent of GDP. The bulk of that effort is mission-oriented R&D in defense, space, and
energy by the Department of Defense Research and Development (25 percent),
Department of Space Research (17 percent), and Department of Atomic Energy
(9 percent), respectively. Less than 20 percent of public support for R&D is for civilian
applications: 8 percent goes to the 38 labs that make up the Council of Scientific and
Industrial Research (CSIR), 4 percent to Indian Council of Agricultural Research
(ICAR) institutions, 4 percent to the applied research programs of the Department
of Science and Technology (DST), and 1 percent to the Indian Council of Medical
Research (ICMR).
The bulk of applied public research has been industrial research, which India
has supported for more than 60 years through CSIR. With 38 laboratories and
more than 5,000 researchers, CSIR is one of the world’s largest collections of
industrially oriented public research labs. It is India’s main producer of scientific
and technical publications and patents. Over the past 20 years it has gone through
a major transformation—from producing technology for the domestic market to
helping Indian industry become globally competitive and to being a global player
itself. Many of the reforms it has made in its organization and management are rel-
evant for other parts of the public R&D system (box 2.4).
Patents from CSIR labs include the following (Gupta 2006):
• A drug to alleviate vascular blockages (licensed to Cadila Pharma) that led to
lower prices
• A partnership between National Chemical Labs and General Electric through
which the latter has paid the former $8.5 million and received six patents,
including one to produce high-grade polycarbonates
• A water purification process licensed to industry
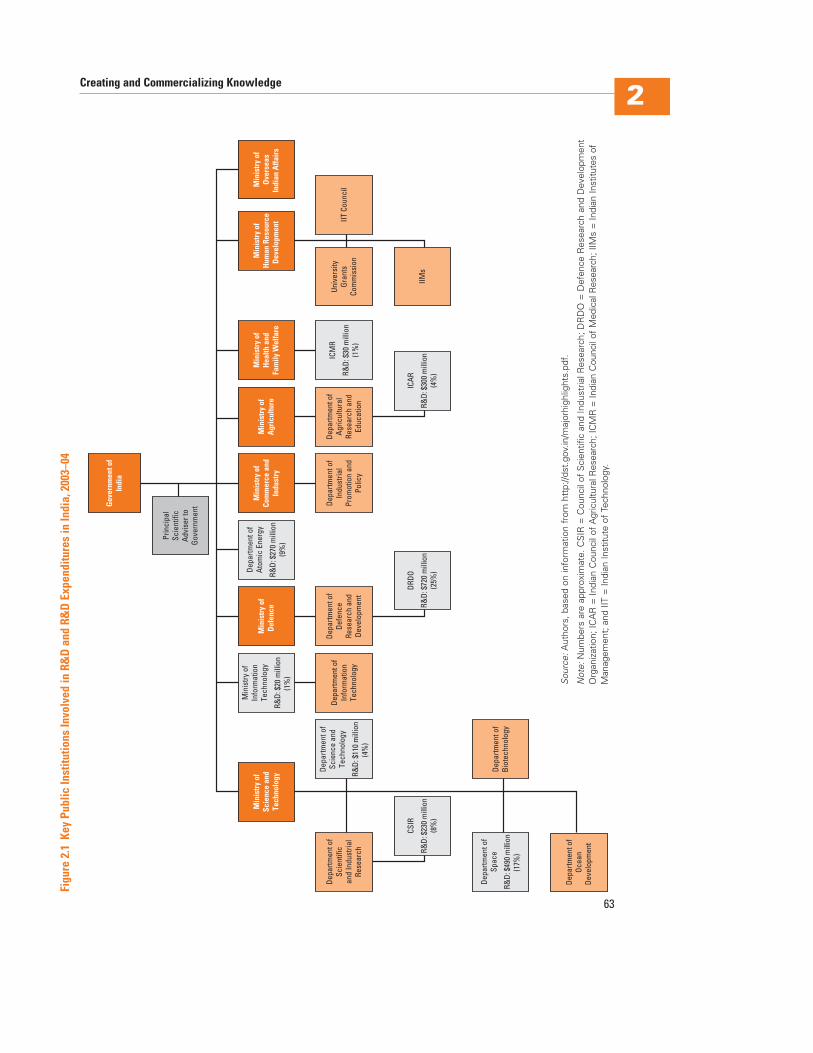
Creating and Commercializing Knowledge 2
63
Gov
ernm
ento
fIn
dia
Min
istr
yof
Scie
nce
and
Tech
nolo
gy
Min
istr
yof
Def
ence
Min
istr
yof
Com
mer
cean
dIn
dust
ry
Min
istr
yof
Agr
icul
ture
Prin
cipa
lSc
ient
ific
Advi
sert
oGo
vern
men
t
Depa
rtmen
tof
Scie
ntifi
can
dIn
dust
rial
Rese
arch
Depa
rtmen
tof
Biot
echn
olog
y
Depa
rtmen
tof
Ocea
nDe
velo
pmen
t
Depa
rtmen
tof
Info
rmat
ion
Tech
nolo
gy
Depa
rtmen
tof
Defe
nce
Rese
arch
and
Deve
lopm
ent
Depa
rtmen
tof
Indu
stria
lPr
omot
ion
and
Polic
y
Depa
rtmen
tof
Agric
ultu
ral
Rese
arch
and
Educ
atio
n
IITCo
unci
lUn
iver
sity
Gran
tsCo
mm
issi
on
IIMs
Min
istr
yof
Hea
lthan
dFa
mily
Wel
fare
Min
istr
yof
Hum
anRe
sour
ceD
evel
opm
ent
Min
istr
yof
Ove
rsea
sIn
dian
Affa
irs
DRDO
R&D:
$720
mill
ion
(25%
)
ICAR
R&D:
$300
mill
ion
(4%
)
Min
istry
ofIn
form
atio
nTe
chno
logy
R&D:
$20
mill
ion
(1%
)
Depa
rtmen
tof
Scie
nce
and
Tech
nolo
gy
R&D:
$110
mill
ion
(4%
)
ICM
R
R&D:
$30
mill
ion
(1%
)
CSIR
R&D:
$230
mill
ion
(8%
)
Depa
rtmen
tof
Spac
e
R&D:
$490
mill
ion
(17%
)
Depa
rtmen
tof
Atom
icEn
ergy
R&D:
$270
mill
ion
(9%
)
Figu
re2.
1Ke
yPu
blic
Inst
itutio
nsIn
volv
edin
R&D
and
R&D
Expe
nditu
res
inIn
dia,
2003
–04
Sou
rce:
Aut
hors
,bas
edon
info
rmat
ion
from
http
://ds
t.gov
.in/m
ajor
high
light
s.pd
f.
Not
e:N
umbe
rsar
eap
prox
imat
e.C
SIR
=C
ounc
ilof
Sci
entif
ican
dIn
dust
rialR
esea
rch;
DR
DO
=D
efen
ceR
esea
rch
and
Dev
elop
men
tO
rgan
izat
ion;
ICA
R=
Indi
anC
ounc
ilof
Agr
icul
tura
lRes
earc
h;IC
MR
=In
dian
Cou
ncil
ofM
edic
alR
esea
rch;
IIMs
=In
dian
Inst
itute
sof
Man
agem
ent;
and
IIT=
Indi
anIn
stitu
teof
Tech
nolo
gy.
64
Carl Dahlman, Mark A. Dutz, and Vinod K. Goel2
The Council of Scientific and Industrial Research (CSIR) was set up in 1942, modeled after theU.K. Department of Scientific and Industrial Research. It predated most other specialized R&Dinstitutes in India and had a wide range of functions, from promoting scientific research andestablishing R&D institutions to collecting and disseminating data on research and industry. AfterIndia’s independence in 1947, CSIR became an independent entity under the prime minister.In the first two decades after independence, it focused on building up an extensive R&D infra-structure, from metrology to R&D for a wide range of industries—with a focus on supportingemerging industry, especially SMEs.
The global energy shock of the early 1970s coincided with three years of consecutivedrought in India. In the pursuit of Indian self-reliance, CSIR concentrated on reverse engineer-ing products and process technology, primarily in pharmaceuticals, chemicals, glass, and otherimport-substituting industries, and in adding value to technologies using domestic resourcessuch as high-ash coal, small-scale cement plants, and medicinal and aromatic plants.
The process of reform was initiated in 1986 by the Abid Hussain Committee report, andwas given additional impetus when India shifted from an inward-oriented to a more outward-and market-driven development strategy as a result of the 1991 economic crisis. With the lib-eralization of trade and industrial policy, firms began facing more international competition.CSIR was criticized for being unwieldy and ineffective at transforming laboratory results totechnologies for industrial production, and for spending too much effort “reinventing thewheel” by focusing on known processes. The demands of the crisis led to self-examinationand radical change in CSIR’s role—from emphasizing technological self-reliance to viewingR&D as a business and generating world-class industrial R&D. More emphasis was placed onoutputs and performance, and on work that was relevant for productive sectors and that couldearn income. Each laboratory became a corporate subsidiary, and rewards were introduced formeeting targets. Laboratories were given autonomy in operations based on how well theydelivered on committed outputs and deliverables. In addition, there have been continuousefforts to streamline further to improve effectiveness and efficiency.
Although CSIR is still restructuring, the results to date have been quite impressive. Theyshow the kind of impact that a change in the direction and incentive regime of even a verylarge public research system can have. Between 1997 and 2002, CSIR cut its laboratories from40 to 38 and staff from 24,000 to 20,000. There was also a noticeable increase in its output.Technical and scientific publications in internationally recognized journals jumped from 1,576in 1995 to 2,900 in 2005, and their average impact factor increased from 1.5 to 2.2. Patent fil-ings in India rose from 264 in 1997–98 to 418 in 2004–05. Patent filings abroad quintupled from94 in 1997–98 to 500 in 2004–05, and CSIR accounted for 50–60 percent of U.S. patentsgranted to Indian inventors. In addition, CSIR increased earnings from outside income from Rs 180 crore in 1995–96 to Rs 310 crore in 2005–06 (about $75 million). Today it has 4,700active scientists and technologists supported by 8,500 scientific and technical personnel. Itsgovernment grant budget has roughly doubled since 1997, and is now Rs 1,500 crore ($365million), so its earnings are about 20 percent of its grant budget.
Source: Based on Bhojwani (2006).
Box 2.4 CSIR: Restructuring from Technology Development for Self-Reliance to Internationally Competitive, Market-Driven R&D
Creating and Commercializing Knowledge 2
65
• A process for producing liquid fertilizer and other products from fresh seaweed
that is promoting seaweed cultivation among poor farmers
• A process for biodiesel production
• A process for converting calcium carbonate–rich inorganic byproducts to indus-
trial products, with benefits for environmental amelioration and job creation
• The development and patenting of several varieties of mint plants, which have
made India a major player in the international mint market and created new
jobs in agriculture
• Various medical patents licensed to Indian and foreign companies.
A number of public sector–driven research programs, such as those of the
Technology Development and Transfer (TDT) program, would benefit from an
increased focus on market-led commercialization. A key characteristic of these pro-
grams is that they do not require private enterprises to be the initiators of funding
requests, so most requests come from national R&D organizations and their sub-
sidiaries. Most of the programs are operated by government bodies, with insuffi-
cient private participation in their management and operations. Furthermore,
most of the programs have not been subjected to independent evaluation and
international benchmarking. The TDT is an initiative by DST to consolidate several
programs, including the State Science and Technology Program (SSTP, known as
State Councils), Technology Systems Program (which, among other things, aims to
strengthen indigenous capability for research, development, design, and production
of instruments, including sensor and medical instrumentation), and the Pharma-
ceuticals R&D Support Fund (PRDSF).
For any project under TDT to receive public funding support, industry must
commit at least 10 percent of costs––a requirement that is in the right direction but
insufficient. The SSTP (formerly known as the Scheme for Assistance for Develop-
ment of State Science & Technology Councils) is the only central scheme focused on
promoting science and technology in states. Implemented in 1981, the scheme sup-
ports State Councils in formulating and implementing science and technology
activities, including demonstration projects. During 1998–2005, roughly 175 proj-
ects were supported, including micro hydroelectric projects in Arunachal Pradesh,
Manipur, Nagaland, and Sikkim; reverse osmosis water treatment plants in Gujarat,
Rajasthan, and Tamil Nadu; and low-cost sewage technology in Punjab. Although
TDT programs have led to a number of technology development success stories in
the areas of energy, water, waste management, and drug development, there has to be
mass commercialization—crucial to meet the needs of the country as a whole.
With the New Millennium Indian Technology Leadership Initiative (NMITLI)
fully launched only in 2003, it is early to expect market successes––though it has a
number of impressive precommercialization accomplishments. Piloted in 2001 and
fully launched in 2003 by CSIR, NMITLI is a prestigious, unique public-private part-
nership program designed to catalyze innovation-led development and achieve global
leadership positions in a few high-risk technology niches. The program aims to
66
Carl Dahlman, Mark A. Dutz, and Vinod K. Goel2
turn sound technological ideas into reality through systematic development of inno-
vative projects. Since its inception, NMITLI has supported 42 projects involving more
than 65 industry partners and 222 R&D institutions, with an estimated outlay of
about Rs 300 crore ($65 million). NMITLI’s precommercialization successes include
Biosuite (software for conducting diverse bioanalysis), a tuberculosis treatment
breakthrough involving 1 industrial and 12 institutional partners, and a psoriasis
treatment involving 2 institutional and 1 industrial partner. While impressive accom-
plishments, most have not had much market success—partly because a few projects
have been slow to get to market and been beaten by competitors.
Assessment of the Public R&D System
Relative to India’s economic size and the international context, the amount of pub-
lic research is low. The effectiveness of public R&D spending is also low—as shown
by the stronger record in scientific and technical publications than in patenting,
and by the limited commercialization of technology generated in the public R&D
system. Still, India has seen a dramatic increase in patent filings in recent years.
Nearly 800 Indian companies submitted applications to the World Intellectual
Property Office in 2004, more than twice the number in 2000. Similarly, the cost per
patent application and per scientific and technical publication in India is among the
lowest relative to comparator (BRICKM) countries (Brazil, Russia, China, Korea,
and Mexico) (Gupta 2006). Hence, India needs to increase R&D spending and
boost efficiency and effectiveness. Key issues that need to be addressed include the
following:
• Fragmentation. The public R&D system is extremely fragmented. A plethora of
central government structures, organizations, instruments, and programs has
emerged in response to specific needs and challenges. There has to be a deliber-
ate effort to develop a national governance structure for innovation. This will
avoid an overlapping and exceedingly complex structure that has undermined the
system’s effectiveness.
• Bureaucracy. Processes are slow, bureaucratic, and hierarchical. An innovation
system needs to function and perform much faster and be responsive. Even the
more application-oriented parts of the system—such as CSIR, ICAR, and
ICMR—would benefit from a more pragmatic, real-time orientation.
• Lack of coordination. Little advantage is taken of potential synergies across pro-
grams even within ministries, and much less across ministries.
• A focus on financial inputs rather than outcomes and impacts. With few exceptions,
the focus is on getting more funds for each program. More attention needs to be
paid to monitoring and evaluation of effectiveness and systematic international
benchmarking of programs.
• A narrow definition of innovation. R&D is given more emphasis over innovation.
R&D may be the easiest and most visible indicator for pursuing innovation, but
Creating and Commercializing Knowledge 2
67
it does not constitute innovation. In fact, this approach may discourage other,
more cost-effective innovation—such as adopting and adapting existing technol-
ogy from other domestic locations or abroad.
• Too much focus on frontier technologies. Public R&D has focused on frontier and
priority sector innovations, though some efforts have been made to prioritize
traditional knowledge and rural innovations. However, these latter efforts seem
to have the quality and implementation rigor of add-ons. Stronger efforts are
needed to harness formal innovation efforts for the needs of the informal sector
and the poor (see chapter 4).
• Insufficient focus on more commercial and applied areas of public goods such as
industry, agriculture, and health. India should consider putting more effort into
more economically relevant public goods such as precompetitive research, and
socially relevant innovations such as preventive medicine, public health, tech-
nologies for sustainable livelihoods for the poor, and environmentally friendly
technologies.
• Focused effort to orient public research to the needs of the economy. Most public
research labs need to have clearer mission statements or clearly monitorable
objectives. Although the goals of research institutes in different areas and the con-
duct of different functions (basic versus applied research) will differ in how they
are organized and against what criteria they are evaluated, in general there is not
a clear orientation toward results or accountability.
• Insufficient effort to increase interaction among public research institutes, universi-
ties, and the productive sector. Public research institutes should not work in
isolation—from other public research institutes, universities, and the productive
sector. Global experience shows that greater interaction among these three main
research performers improves the quality and relevance of research.
Recommendations
To improve the impact of public R&D, India should consider allocating more
resources to productive and social applications. Reforms should be considered in
three areas:
1. Increasing resources for civilian research. Although CSIR has been restructured
to focus on more market-driven R&D, and further restructuring is under way,
the public R&D system as a whole would benefit from an independent evalu-
ation and restructuring across the three main central civilian research agency
networks (CSIR, ICAR, ICMR), to take greater advantage of cross-institution
synergies and increase their focus on commercialization—with a systemwide
action plan to consolidate and transfer some R&D labs to the private sector so
that their work programs are fully market-driven. A relevant political economy
consideration is that in most countries, it is quite difficult to cut budgets
68
Carl Dahlman, Mark A. Dutz, and Vinod K. Goel2
and programs. A possible strategy would be to gradually reduce budget alloca-
tions to poorly performing institutions and programs by making them com-
pete for at least part of their usual allocations. In addition, most growth in
public funding should be offered competitively to programs and institutions
that meet prespecified criteria and win the funds in peer-reviewed competi-
tions. Similarly, all matching funding to private research groups should be
made available only through competitive allocations.
2. Increasing support for R&D in universities. Basic science and engineering research
of a public goods character can probably be better supported through competi-
tive research grants for university research and public labs, along the lines of
the U.S. National Science Foundation (as contemplated in the planned National
Science and Engineering Foundation).
3. Strengthening support for R&D of high-risk technologies through NMITLI. CSIR
plans an independent evaluation of the NMITLI program using international
benchmarking, to assess options for programmatic strengthening—including
adoption of the entrepreneurial program management and agile decision making
exhibited by the U.S. Defense Advanced Research Projects Agency (DARPA) and
the industry-driven, cost-sharing approach of the U.S. Advanced Technology
Program (ATP) (see box 2.5). Current plans for scaling up NMITLI include
providing support for pre- and post-NMITLI activities, opening the program
Defense Advanced Research Projects Agency (DARPA)
DARPA is the central R&D organization for the U.S. Department of Defense. It manages anddirects selected basic and applied R&D projects for the department, and pursues R&D whererisks and payoffs are both very high and success may provide dramatic advances for traditionalmilitary roles and missions. DARPA was established in 1958 in response to the challenge posedto the United States by the launch of the Soviet Sputnik in 1957. Its explicit objective was to keepthe United States ahead of its enemies by developing superior, disruptive military technology.
DARPA is reputed to have about 240 staff and an annual budget of $3.2 billion. In addition tosignificant military technology breakthroughs such as space programs and ballistic missiledefense (1960s), stealth aircraft (1970s), and unmanned aerial vehicles (1980s), DARPA hasbeen credited with developing many technologies that have had a major impact on the techno-logical underpinnings of current society—such as the computer network that eventually devel-oped into the Internet and important advances in materials, information technology, andbiosciences. DARPA programs seek to go beyond the R&D being conducted by the U.S. armedforces, exploit more fundamental research and radical new concepts, and bridge the gapbetween research and use.
Box 2.5 International Examples of Supporting High-Risk Technologies: DARPA and ATP
(continued)
Creating and Commercializing Knowledge 2
69
Some key elements of DARPA’s management strategy are to have limited overhead andno laboratories or research facilities, to minimize institutional interests that might distractthe agency from its imperative for innovation. It brings in experts—entrepreneurial programmanagers—empowers and protects them from red tape, and quickly makes decisions aboutstarting, continuing, or stopping research projects. It typically hires program managers for fourto six years. It seeks to create synergies by hiring experts with similar interests. In most of itsprograms DARPA invests 98 percent of its funds at external organizations, primarily universitiesand industry. This approach leads to the development of new capabilities in industry andreduces the risk of the underlying technology to the point where companies are sufficiently con-fident in its capability, value, and technical maturity to try to commercialize it. For more infor-mation on DARPA, see http://www.darpa.mil/body/mission.html.
Advanced Technology Program (ATP)
The ATP, under the National Institute of Standards and Technology (NIST), was created as partof the Omnibus Trade and Competitiveness Act of 1988. Its objective is to benefit the U.S. econ-omy by conducting cost-sharing research with industry to foster new, innovative technologies.ATP projects are proposed not by the U.S. government but by industry. The ATP project selec-tion process includes both government and private experts. Projects are selected based ontechnical and economic merit, and demonstrated need for ATP funding. The ATP requires thatprojects have well-defined goals and sunset provisions. The ATP does not fund product devel-opment. It only funds R&D to develop high-risk technologies to the point where it is feasible forcompanies to begin product development. It has included program evaluation from its outset.
The ATP can fund up to $2 million a year in direct project costs for up to three years for indi-vidual companies and up to half of project costs for up to five years for joint ventures. It does notlimit the size of the companies involved. It encourages R&D partnerships and consortia with aca-demia and research institutes. Companies control the intellectual property rights to the results oftheir research. The overall performance of ATP-funded projects has been positive. Benefit-coststudies for 40 projects estimated more than $18 billion in expected present value social bene-fits—far more than the $2.3 billion spent on the projects through September 2004. It is alsoalleged that 40 percent of the projects would not have been undertaken, that 40 percent wouldhave proceeded much more slowly, and that the programs foster high rates of collaborationamong firms and between them and universities and research institutes. For more information,see http://www.atp.nist.gov/index.html. For more on the evaluation methodology, see Rueggand Feller (2003) and National Research Council (2001).
Source: Authors.
Box 2.5 continued
up to international collaboration, and providing grants to both research insti-
tutions and private enterprises, with sharing of royalties. It would also be desir-
able to consider providing research management training to NMITLI staff to
help them better identify and manage promising Indian technology leadership
opportunities.
70
Carl Dahlman, Mark A. Dutz, and Vinod K. Goel2
Strengthening Commercialization of Knowledge
India’s efforts to move ideas from laboratories to markets have tremendous poten-
tial. To date, however, much of the knowledge that is created—especially by the pub-
lic sector—is not commercialized. This final section explores the role of public pol-
icy in strengthening the commercialization of knowledge.
Assessment of the Environment Spurring Commercialization
India’s private sector has little interaction with public sector R&D. In 1987, the
Ministry of Science and Technology’s DSIR introduced the National R&D Awards
Scheme to recognize the achievements of in-house R&D units. Since then 150 units
have received the awards. A study of 88 of these units found that less than 15 percent
had interacted with or used the services of public sector R&D units in developing the
award-winning technologies (Bhojwani 2006).
Government entities responsible for commercialization—particularly the Technol-
ogy Development Board (TDB) and National Research Development Corporation
(NRDC)—have had limited success in meeting their mandates. The government cre-
ated the TDB in 1996 to facilitate the commercialization of indigenous technology.
Between 2001 and 2006, the TDB supported more than 100 entrepreneurial ventures.
One of TDB’s initiatives is to provide seed funding to technology-based companies.
Its assistance is about 80 percent loans, 13 percent grants, 5 percent participation in
the India Technology Venture Unit Scheme, and just 1 percent equity.
The TDB recently collaborated with two private equity firms to invest equity in
start-ups: Andhra Pradesh Industrial Development Corporation–Venture Capital
Fund, VCF, contributing Rs 30 crore ($7.3 million) to the Biotechnology Venture
Fund; and UTI Ventures, contributing Rs 75 crore ($18.3 million) to UTI Ascent
India Fund. Since its inception the TDB has signed 141 agreements—137 with com-
mercial enterprises and 4 with other agencies, committing Rs 663 crore ($162 million)
and disbursing Rs 526 crore ($129 million) as of March 31, 2005, with total project
costs of $454 million. Its main beneficiaries have been health and medical, air and
road transport, and engineering firms. However, given the constraints typically
accompanying a government-run program (such as risk aversion), the TDB has
mostly granted assistance in the form of unsecured debt. Such debt does not have an
upside and offers no potential for leveraging and cross-subsidizing the pool of debt
to address a larger market. There is a need to look into the operational and organi-
zational systems and the intended role TDB is supposed to play in the emerging eco-
nomic environment, keeping in view the experience gained over the last decade.
Although the NRDC is a profitable public enterprise, it has not been successful as
measured by the low overall commercialization of publicly supported R&D. The
NRDC, established under DSIR, is the only public enterprise wholly dedicated to
transferring technologies from R&D labs to industry. It is mandated to commercial-
ize technologies developed with government support, upgrade laboratory know-
how, set up pilot plants, and provide risk finance to development projects. The
Creating and Commercializing Knowledge 2
71
NRDC has executed projects worth $6.7 million and is negotiating contracts with
several countries in Southeast Asia, Europe, Latin America, and Africa to execute
projects worth about $24 million. The NRDC has licensed 2,000 technologies for
commercial application. Of these, 1,000 are in production, with an annual turnover
of Rs 1,200 crore ($293 million). These results are much too low relative to the
potential of commercialization of publicly supported R&D. Although the NRDC
continued to earn profits in 2004–05,15 its systems are too oriented to expenditure
management and not sufficiently oriented to risk management.
A lack of strong incentives inhibits both a stronger orientation toward applied
research in public institutes and the commercialization of technology created in the
public sector. Although no law or regulation prohibits a commercial orientation,
there is also no strong support for it. A significant event with respect to the com-
mercialization of innovations that originated in U.S. academia was the passage of the
Bayh-Dole Act of 1980. This act allowed U.S. universities to file for patents on any
research undertaken using federal, state, or local government money. This encour-
aged professors and students to pursue applied research, to develop intellectual
property, and even to start their own companies or find other means of commer-
cializing intellectual property (such as licensing it to interested companies). Today,
most U.S. research universities have well-developed licensing programs. Many have
technology transfer offices that support university researchers in patenting and licens-
ing technologies with commercial potential. In 2002, U.S. universities filed 7,750 new
patent applications, and about 3,700 patents were approved (Evalueserve 2006).
Other national IPR systems have also experimented with mechanisms designed to
increase incentives for innovators laboring outside the confines of the large corpo-
rate environments responsible for most patent applications. Australia, for example,
introduced an “innovation patent” system in 2001 to provide simple, inexpensive
protection for inventions deemed insufficiently inventive to meet the threshold
required for standard patents. Most such experiments are too recent to have gener-
ated meaningful data capable of assessing the extent to which they have achieved
their objectives, but India should leverage the inquiries and recommendations lead-
ing to such experiments when considering their propriety in the Indian context.16
A modern regime for IPR is critical to promoting innovation and facilitating
technology commercialization. Intellectual property rights are an important incen-
tive for encouraging greater innovative effort. This is becoming increasingly impor-
tant now that India has critical mass and greater capability for creating cutting-edge
knowledge. This is also demonstrated by the recent significant increase in foreign
investment in R&D centers—in contrast to their traditional concerns about the ade-
quacy of intellectual property (IP) investment to protect their knowledge. However,
India must protect its knowledge dissemination interests at the lowest possible costs,
especially in areas of public concern such as health, and defend its interests in new
technologies not yet fully regulated by international agreements.
Although India has a modern legal framework for IPR, institutions that handle
IPR issues need to be strengthened. India’s accession to the World Trade Organiza-
tion (WTO) in 1995—and specifically its signing of the WTO’s Agreement on
72
Carl Dahlman, Mark A. Dutz, and Vinod K. Goel2
Trade-Related Aspects of Intellectual Property Rights (TRIPS)—obligated it to har-
monize many aspects of its patent system with standards prevalent in the developed
world. In 2005, India introduced amendments that brought its patent laws into full
compliance with TRIPS. These amendments have had dramatic effects. India has
done the following:
• Extended the life of its patents from 5–14 years to a TRIPS-mandated 20 years.
• Started granting product patents on a range of pharmaceutical and therapeutic
innovations, including exclusive marketing rights on drugs. Previously only
process patents and weak rights were available.
• Preserved its right to turn normally exclusive patent rights into compulsory
licenses—but accepted TRIPS limitations in cases where such actions are required.
• Introduced limited patentability for software. The new law retains existing
patents on stand-alone computer programs, mathematics, algorithms, and busi-
ness methods. But for the first time, it permits patents on applied software or soft-
ware embedded in, or combined with, hardware.
The recent amendments also allowed India to avail itself of TRIPS’ flexible mar-
gins. India’s patent laws now incorporate various provisions to protect public health
from capricious exercises of patent rights on important drugs; require patentees to
disclose the sources of the knowledge underpinning their applications (pursuant to
the Convention on Biodiversity), although not necessarily all prior art; and allow
both pre- and postgrant challenges to patents.
The government should consider further legal strengthening for IT, software,
pharmaceuticals, and chemicals. Although the 2005 amendments to its patent laws
maintained the prohibition on patenting computer programs, mathematics, and
business methods, they expanded the scope of patentability to include software
applied to specific industrial problems and software incorporated with hardware as
part of a single innovation. These changes are part of a global debate about the best
ways to protect software within modern IP systems. Around the world, all IPR pro-
tecting software remain controversial. The lack of international norms on software
IPR means that India retains considerable flexibility in tailoring its system to its
needs. Simultaneously, the country can monitor both international developments in
this area and potential changes that its domestic IT industry may undergo now that
some of its innovations are patentable.
Unlike software, where India has made its statutory choices and must now mon-
itor them as they unfold, its treatment of pharmaceutical and chemical patents
remains incomplete. Three issues are outstanding. Would it be compatible with
TRIPS to limit pharmaceutical patents to new chemical entities, rather than to all
advances in pharmaceuticals? Would it be compatible with TRIPS to exclude
microorganisms from patenting? And can the government share data––which it
obtained from branded chemical companies seeking regulatory clearance to sell their
products––with generic competitors seeking to develop products to launch upon
expiration of applicable patents? On these issues the government will have to decide,
Creating and Commercializing Knowledge 2
73
first, which policies best serve India’s needs; second, whether these policies are con-
sistent with India’s international obligations; and third, regardless of whether they
are inconsistent with those obligations, whether they confer enough benefits on
India to warrant adopting them.17 In December 2006, a government-appointed
panel of experts on patent issues, headed by Dr. Mashelkar, reported its conclusions
with respect to the first two issues: rules limiting patentability solely to new chemi-
cal entities or excluding microorganisms from patenting would violate India’s obli-
gations under TRIPS (Mashelkar 2006). The government must now decide how to
incorporate this advice into law.
The main challenge for India’s IPR system is its implementation. India has already
taken significant steps to modernize and professionalize its Patent Office. The gov-
ernment needs to complete this process. The program could include the following:
• Modernizing the IPR infrastructure with expanded physical facilities, modernized
process and data collection and dissemination, online application filing and pro-
cessing, better search and examination, and increased staff training and skills
development. The support should include upgrading Indian Patent Offices as
well as the Indian Patent Training Institute (located in Nagpur, Maharashtra).
• Stimulating patenting and patent exploitation among individual inventors, SMEs,
R&D labs, and universities. India could consider reducing domestic filing fees for
individuals and SMEs by subsidizing them on a needs basis. It could also consider
government-sponsored or -subsidized loans and clinics to facilitate the filing of
patent applications abroad. This could be a focus of expanded support to the
Patent Facilitation Center of the Technology Information Forecasting and Assess-
ment Council (TIFAC).18 In addition, the center or a new patent management
corporation (see below), operated as a public-private partnership, should provide
practical strategic and down-to-earth IP advice to firms, especially SMEs and
grassroots innovators, in optimizing their patent strategies for innovations. This
would include analyses of patenting benefits relative to expenses as well as sug-
gestions on timing and location of patent filings, alternatives to patenting, and so
on. They could help figure out which legal firm or person is the right one for the
technology and sometimes serve as the initial interface with the lawyer. Finally,
the government needs to support the development of domestic IPR capability in
the legal and consulting professions by supporting training institutions, training
fellowships, or both.
• Creating a court of appeals for IPR, as in the United States, as a longer-term
consideration as awareness about IPR and the number of patent cases grows.
To deal with complex IPR issues as technology advances and India’s industries
and innovation system evolve, the government should set up an independent IPR
policy think tank. Expert advice is needed on how to deal with new country-strategic
IPR issues as they arise. The think tank’s primary job should be to ensure that all gov-
ernment decisions about its IP policy conform to the needs of Indian society. To do
so, the think tank should get input from leading Indian researchers, businesspeople,
74
Carl Dahlman, Mark A. Dutz, and Vinod K. Goel2
policy makers, and lawyers to study what is in India’s best interests. The think tank
should also work with researchers in other countries, because decisions on these
issues will have global repercussions once put into international law.
There is insufficient mobility of researchers between universities, public research
labs, and enterprises. Most Indian PhDs in science work in public research institutes
or universities. Few work in private industry. It is rare for researchers from the pri-
vate sector to work at universities or public research labs, and vice versa. In addition,
there is little exchange between Indian and foreign researchers. Public sector
researchers rarely consider the potential for commercializing their innovations, par-
ticularly in ways capable of generating the revenues necessary to sustain a private
venture. India’s public sector laboratories and universities need to expand their con-
sideration of these issues.
India would benefit from increased spin-offs from universities or public research
centers to create new high-technology companies. Unlike in the United States,
where many researchers at universities or public research labs leave to set up new
high-technology companies, such spin-offs are not common in India. This is in
great contrast to China, where more than 2,000 high-technology companies have
been spun off from universities and public R&D centers. Some of these, such as the
computer maker Lenovo, have gone on to become among the largest companies in
the Chinese stock market.
Goals for science and technology parks and technology incubators are to promote
technology commercialization, transfer, and diffusion—fostering links between uni-
versities, R&D labs, and industry and promoting the formation and growth of
knowledge-based companies. The rationale for science and technology parks is that
there are economies of scale and agglomeration in providing common infrastructure
facilities (such as transport, power, information and communication technology
connectivity, office and production space, and waste treatment) and technical
services (such as recruitment, training, mentoring, financing, networking, and legal
and IPR counseling) and in locating near universities and research institutes, to build
bridges between the scientific and business communities. One of the best examples
of a science and technology park is the Hsinchu Science Park in Taiwan, China
(box 2.6).
The rationale for technology incubators is to give business support to technopre-
neurs who may have a technology business idea but lack the know-how and access
to facilities to make it a reality. Technology incubators typically have two basic fea-
tures. First, they offer a nurturing environment for resident companies—providing
assistance in forming a company, training and mentoring, management, business
planning and market analysis, and technical and legal assistance; and facilitating
access to finance, networking, IPR-related assistance, equipment and infrastructure
facilities of the host institution, and other shared services such as fax machines,
conference rooms, and libraries. Second, they are home to 20–30 resident
companies, which are generally graduated out after two to three years.
India needs to build on its experience with science and technology parks and
technology incubators. In 1985 the government—through the National Science and
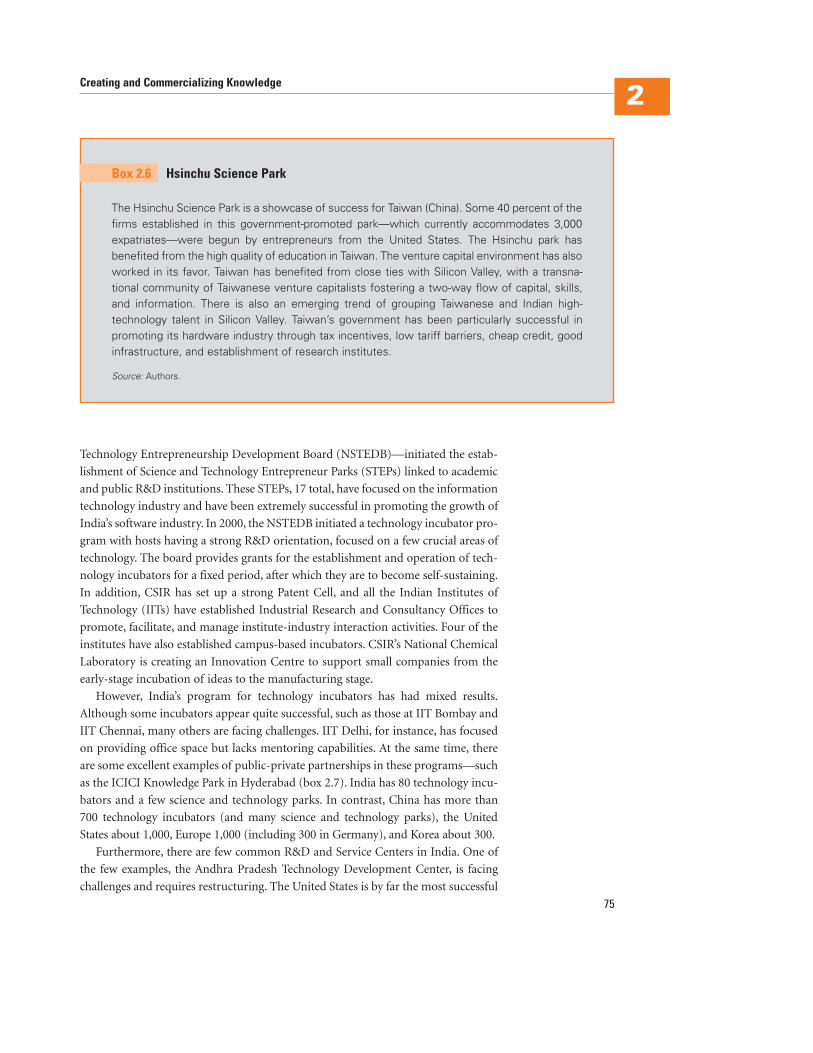
Creating and Commercializing Knowledge 2
75
Technology Entrepreneurship Development Board (NSTEDB)—initiated the estab-
lishment of Science and Technology Entrepreneur Parks (STEPs) linked to academic
and public R&D institutions. These STEPs, 17 total, have focused on the information
technology industry and have been extremely successful in promoting the growth of
India’s software industry. In 2000, the NSTEDB initiated a technology incubator pro-
gram with hosts having a strong R&D orientation, focused on a few crucial areas of
technology. The board provides grants for the establishment and operation of tech-
nology incubators for a fixed period, after which they are to become self-sustaining.
In addition, CSIR has set up a strong Patent Cell, and all the Indian Institutes of
Technology (IITs) have established Industrial Research and Consultancy Offices to
promote, facilitate, and manage institute-industry interaction activities. Four of the
institutes have also established campus-based incubators. CSIR’s National Chemical
Laboratory is creating an Innovation Centre to support small companies from the
early-stage incubation of ideas to the manufacturing stage.
However, India’s program for technology incubators has had mixed results.
Although some incubators appear quite successful, such as those at IIT Bombay and
IIT Chennai, many others are facing challenges. IIT Delhi, for instance, has focused
on providing office space but lacks mentoring capabilities. At the same time, there
are some excellent examples of public-private partnerships in these programs––such
as the ICICI Knowledge Park in Hyderabad (box 2.7). India has 80 technology incu-
bators and a few science and technology parks. In contrast, China has more than
700 technology incubators (and many science and technology parks), the United
States about 1,000, Europe 1,000 (including 300 in Germany), and Korea about 300.
Furthermore, there are few common R&D and Service Centers in India. One of
the few examples, the Andhra Pradesh Technology Development Center, is facing
challenges and requires restructuring. The United States is by far the most successful
The Hsinchu Science Park is a showcase of success for Taiwan (China). Some 40 percent of thefirms established in this government-promoted park—which currently accommodates 3,000expatriates—were begun by entrepreneurs from the United States. The Hsinchu park hasbenefited from the high quality of education in Taiwan. The venture capital environment has alsoworked in its favor. Taiwan has benefited from close ties with Silicon Valley, with a transna-tional community of Taiwanese venture capitalists fostering a two-way flow of capital, skills,and information. There is also an emerging trend of grouping Taiwanese and Indian high-technology talent in Silicon Valley. Taiwan’s government has been particularly successful inpromoting its hardware industry through tax incentives, low tariff barriers, cheap credit, goodinfrastructure, and establishment of research institutes.
Source: Authors.
Box 2.6 Hsinchu Science Park
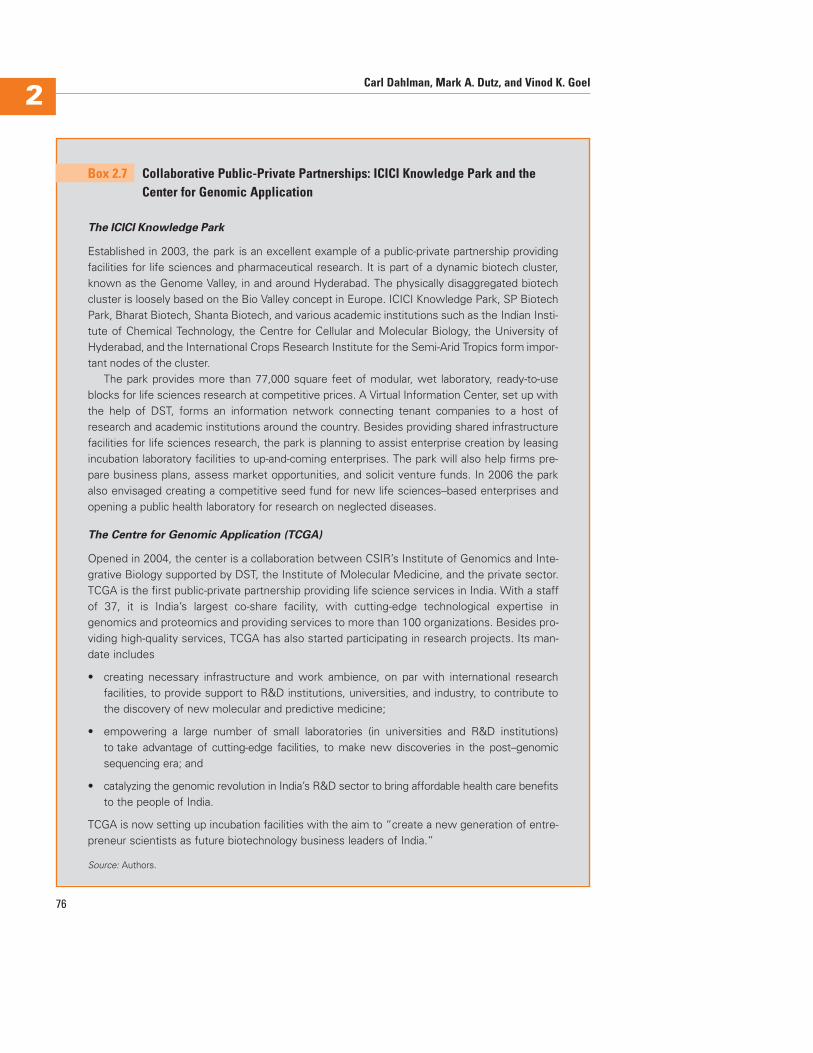
76
Carl Dahlman, Mark A. Dutz, and Vinod K. Goel2
The ICICI Knowledge Park
Established in 2003, the park is an excellent example of a public-private partnership providingfacilities for life sciences and pharmaceutical research. It is part of a dynamic biotech cluster,known as the Genome Valley, in and around Hyderabad. The physically disaggregated biotechcluster is loosely based on the Bio Valley concept in Europe. ICICI Knowledge Park, SP BiotechPark, Bharat Biotech, Shanta Biotech, and various academic institutions such as the Indian Insti-tute of Chemical Technology, the Centre for Cellular and Molecular Biology, the University ofHyderabad, and the International Crops Research Institute for the Semi-Arid Tropics form impor-tant nodes of the cluster.
The park provides more than 77,000 square feet of modular, wet laboratory, ready-to-useblocks for life sciences research at competitive prices. A Virtual Information Center, set up withthe help of DST, forms an information network connecting tenant companies to a host ofresearch and academic institutions around the country. Besides providing shared infrastructurefacilities for life sciences research, the park is planning to assist enterprise creation by leasingincubation laboratory facilities to up-and-coming enterprises. The park will also help firms pre-pare business plans, assess market opportunities, and solicit venture funds. In 2006 the parkalso envisaged creating a competitive seed fund for new life sciences–based enterprises andopening a public health laboratory for research on neglected diseases.
The Centre for Genomic Application (TCGA)
Opened in 2004, the center is a collaboration between CSIR’s Institute of Genomics and Inte-grative Biology supported by DST, the Institute of Molecular Medicine, and the private sector.TCGA is the first public-private partnership providing life science services in India. With a staffof 37, it is India’s largest co-share facility, with cutting-edge technological expertise ingenomics and proteomics and providing services to more than 100 organizations. Besides pro-viding high-quality services, TCGA has also started participating in research projects. Its man-date includes
• creating necessary infrastructure and work ambience, on par with international researchfacilities, to provide support to R&D institutions, universities, and industry, to contribute tothe discovery of new molecular and predictive medicine;
• empowering a large number of small laboratories (in universities and R&D institutions)to take advantage of cutting-edge facilities, to make new discoveries in the post–genomicsequencing era; and
• catalyzing the genomic revolution in India’s R&D sector to bring affordable health care benefitsto the people of India.
TCGA is now setting up incubation facilities with the aim to “create a new generation of entre-preneur scientists as future biotechnology business leaders of India.”
Source: Authors.
Box 2.7 Collaborative Public-Private Partnerships: ICICI Knowledge Park and theCenter for Genomic Application
Creating and Commercializing Knowledge 2
77
model of holistic entrepreneurship-driven technology enterprise creation. Its expe-
rience with the development of science and technology parks around the universities
of MIT (Massachusetts Institute of Technology), Stanford, and Harvard has been
quite successful, and the parks have created a large pool of internationally renowned
technology companies. Similar structures have been created in the United Kingdom,
where Microsoft worked with Cambridge University to create research facilities and
provide venture financing for new software and networking technologies.
Recommendations
To strengthen commercialization of knowledge, India should foster increased col-
laboration between R&D institutes, universities, and private firms. Seven areas of
reform follow:
1. Strengthening incentives for commercialization of publicly funded R&D. The U.S.
Bayh-Dole Act of 1980 encouraged university professors and students to com-
mercialize their intellectual property. India should consider strengthening incen-
tives for commercialization of publicly funded R&D in India by passing similar
legislation appropriate to the Indian context. While the situation in India today is
different from that in the United States in 1980—there is no Indian law prohibit-
ing patenting development and commercialization derived from using public
research funds—there would still be a signaling benefit from clarifying India’s
legal framework along the lines of the CSIR–Patent Facilitation Center guidelines
currently in force at some ministries. Any new law should promote the emergence
of an entrepreneurial spirit on all campuses and research institutes, with freedom
to negotiate flexible deals with partners in the private sector, and rewards flowing
back to the labs and individuals who contributed to the revenues.
2. Improving support infrastructure for India’s IPR regime. India’s legal framework for
IPR has been modernized. Still, outstanding IPR implementation issues remain.
The drive to modernize the country’s IPR implementation system is already under
way. In addition, the government is expediting plans to upgrade the Indian Patent
Office and expand support for individuals and organizations seeking to patent in
India and abroad through an upgraded Patent Facilitation Center. Over the longer
term, the government is considering creating a special court of appeals for IPR.
Finally, to provide country-strategic policy advice on complex IPR-related issues
such as technology advances and ensure that they are resolved in India’s interest,
the government is considering creating a policy-oriented think tank on outstand-
ing IP issues.
3. Supporting technology transfer offices and a patent management corporation. Leg-
islation should go further in requiring all government agencies issuing research
grants to motivate universities, research institutes, and their individual researchers
to seek and exploit patents and engage in technology transfer programs with
industrial concerns. In this context, a patent management corporation, structured
78
Carl Dahlman, Mark A. Dutz, and Vinod K. Goel2
as a public-private partnership and as a replacement and restructuring of NRDC,
could play a useful role in managing patent portfolios from CSIR and other pub-
lic labs and universities, and assist in their commercial exploitation—as well as
provide strategic IP guidance to SMEs.
4. Promoting greater mobility. Mobility of personnel between public R&D labs, uni-
versities, and industry should be encouraged through competitive awards with
generous stipends.
5. Expanding science and technology parks and technology incubators. Technology
parks and incubators should be expanded with government support and pri-
vate finance and management, based on international best practice––including
the experiences of Israel, Taiwan (China), the United Kingdom, and the United
States. Managing these parks and incubators is a specialized job and requires
intensive capacity building, training, and apprenticeship for mentors and finan-
ciers. Spin-offs also should be encouraged from universities or public research
labs to create new companies. Scientists should be allowed to start spin-offs
while holding their current jobs. The public support program should focus on
the following:
• Creating a few high-quality science and technology parks near a cluster of
research universities and public labs (such as Lucknow, Pune, Hyderabad,
Bangalore, New Delhi, Vadodara, and Chandigarh) where companies would set
up their R&D labs and help create synergies between the industry and scientists.
• Expanding the technology incubator program to most public R&D labs,
IITs, Indian Institutes of Management (IIMs), and research universities with
adequate facilities, including proper capacity for strategic mentoring for such
units following a professional approach and adequate nurturing of firms.
• Expanding common research and service center programs like CSIR’s
TCGA––a novel public-private partnership approach creating an excellent
research and service lab. All these activities should include a strong public-
private partnership element.
• Promoting a “Technology Spin-Off Fund” to spur formation of new compa-
nies from R&D generated in labs and universities. This should provide seed
and working capital, as well as business mentoring for such units.
6. Broadening SPREAD and creating an appropriate “fund of funds.” The govern-
ment must develop better policies and mechanisms to strengthen the interaction
among private firms and the public and university research infrastructure. With
regard to public grant support for ESTD, the success of SPREAD as the first for-
mal program in India for encouraging collaboration between technology insti-
tutes and firms should be broadened based on international benchmarking—
including the U.S. Small Business Technology Transfer program, a competitive
matching grant program that requires collaborative commercialization (see
box 2.3). The TDB, however, should possibly be restructured as a public-private
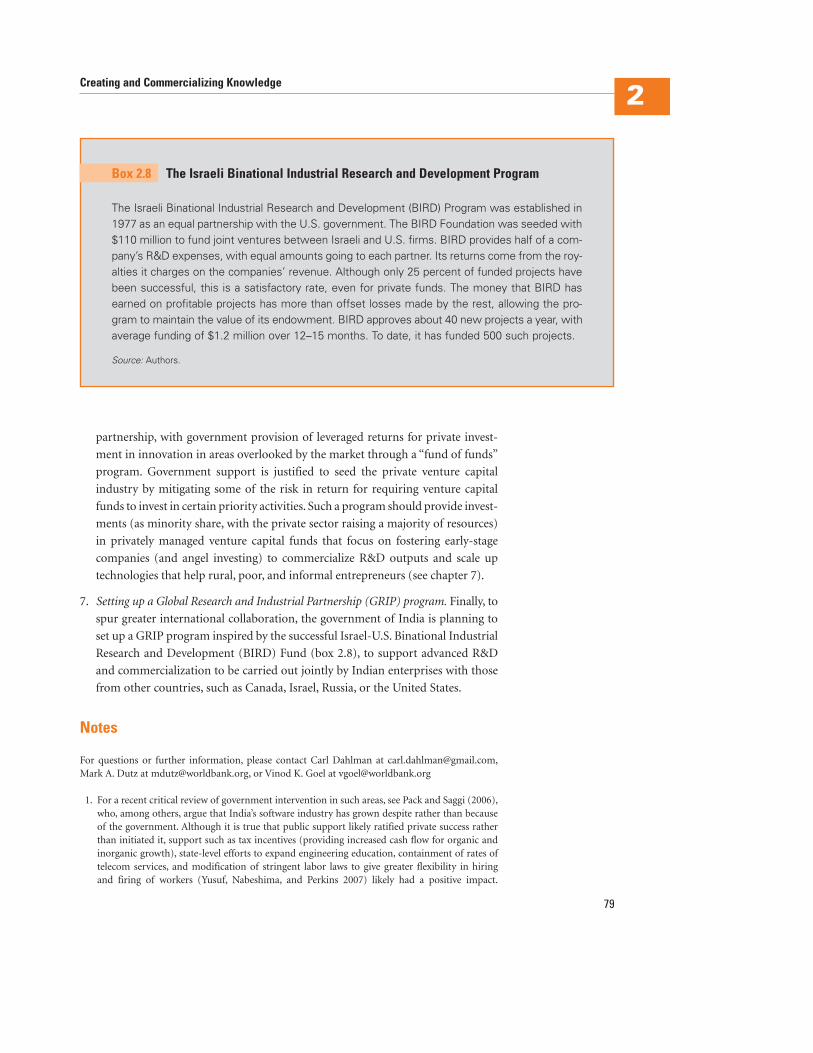
Creating and Commercializing Knowledge 2
79
partnership, with government provision of leveraged returns for private invest-
ment in innovation in areas overlooked by the market through a “fund of funds”
program. Government support is justified to seed the private venture capital
industry by mitigating some of the risk in return for requiring venture capital
funds to invest in certain priority activities. Such a program should provide invest-
ments (as minority share, with the private sector raising a majority of resources)
in privately managed venture capital funds that focus on fostering early-stage
companies (and angel investing) to commercialize R&D outputs and scale up
technologies that help rural, poor, and informal entrepreneurs (see chapter 7).
7. Setting up a Global Research and Industrial Partnership (GRIP) program. Finally, to
spur greater international collaboration, the government of India is planning to
set up a GRIP program inspired by the successful Israel-U.S. Binational Industrial
Research and Development (BIRD) Fund (box 2.8), to support advanced R&D
and commercialization to be carried out jointly by Indian enterprises with those
from other countries, such as Canada, Israel, Russia, or the United States.
Notes
For questions or further information, please contact Carl Dahlman at [email protected],Mark A. Dutz at [email protected], or Vinod K. Goel at [email protected]
1. For a recent critical review of government intervention in such areas, see Pack and Saggi (2006),who, among others, argue that India’s software industry has grown despite rather than becauseof the government. Although it is true that public support likely ratified private success ratherthan initiated it, support such as tax incentives (providing increased cash flow for organic andinorganic growth), state-level efforts to expand engineering education, containment of rates oftelecom services, and modification of stringent labor laws to give greater flexibility in hiringand firing of workers (Yusuf, Nabeshima, and Perkins 2007) likely had a positive impact.
The Israeli Binational Industrial Research and Development (BIRD) Program was established in1977 as an equal partnership with the U.S. government. The BIRD Foundation was seeded with$110 million to fund joint ventures between Israeli and U.S. firms. BIRD provides half of a com-pany’s R&D expenses, with equal amounts going to each partner. Its returns come from the roy-alties it charges on the companies’ revenue. Although only 25 percent of funded projects havebeen successful, this is a satisfactory rate, even for private funds. The money that BIRD hasearned on profitable projects has more than offset losses made by the rest, allowing the pro-gram to maintain the value of its endowment. BIRD approves about 40 new projects a year, withaverage funding of $1.2 million over 12–15 months. To date, it has funded 500 such projects.
Source: Authors.
Box 2.8 The Israeli Binational Industrial Research and Development Program
80
Carl Dahlman, Mark A. Dutz, and Vinod K. Goel2
Furthermore, biotechnology and pharmaceutical research seem to have benefited more directlyfrom government support. For a review of some key policy instruments to support commercialinnovation, see World Bank (2006).
2. See Jaffe (2002) on how to build evaluation into the design of public research–support programs.
3. In 1991, the private sector invested very little in R&D. The little R&D done was dominated bystate enterprises.
4. Business World, December 25, 2006.
5. See Evalueserve (2006) for a detailed breakdown of the loaded cost for typical R&D with andwithout laboratory infrastructure in the United States versus India. The bulk of the total cost andcost differential is accounted for by payroll costs.
6. Based on Evalueserve (2006) estimates, total private spending on R&D over the two years 2004and 2005 amounted to $6.75 billion, though no breakdown is available between MNCs, domes-tic firms, and high tech start-ups.
7. See Bowonder and others (2006) and TIFAC (2005).
8. For a review of the existing literature on this subject, and evidence consistent with positive pro-ductivity spillovers from contacts between foreign affiliates and their local suppliers in upstreamsectors, see Javorcik (2004). These data from Lithuania indicate that such vertical spillovers areassociated with projects with shared domestic and foreign ownership but not with fully ownedforeign investment.
9. Similar concerns have arisen in Israel, where the benefits of the rapid growth of the high-techsector have eluded the rest of the economy, giving rise to a “dual economy” and slow growth forthe economy as a whole. See Trajtenberg (2005) who argues that the notion of spillovers shouldbe reexamined in view of globalization, which makes the actual benefits depend on the relativeintensity of inward versus outward flows.
10. Academic research cites “partial appropriability of returns” and “information asymmetry” as themost important reasons for underinvestment in R&D and making the rationale for public sup-port to commercial R&D. For a summary of these constraints, see World Bank (2006). For amore detailed discussion, see De Ferranti and others (2003) and Baumol (2002).
11. SPREAD was launched in the early 1990s as a part of the $200 million World Bank–supportedIndustrial Technology Development Project.
12. See Sankar (2003), who shows that the Indian Space Research Organization is internationallycompetitive in output and quality.
13. See in particular Fraunhofer Institute for Systems and Innovation Research (2006), which ana-lyzes existing rules and current practices of public innovation procurement in 15 EuropeanUnion member states, Australia, Canada, Norway, and the United States, and provides examplesof good practices for concrete procurement activities.
14. Although there is also a science and technology structure at the state level, it is not very large andis not covered in this report.
15. During 2004–05 the NRDC earned a gross profit of Rs 12.6 lakh ($30,000), with lump-sum pre-miums and royalties on the licensing of technologies to industry of Rs 326.2 lakh ($795,000)being its main source of revenue.
16. See Australian Government, IP Australia,“The Innovation Patent,” http://www.ipaustralia.gov.au/patents/what_innovation.shtml.
17. India’s choices can have significant implications. The introduction of patents on incrementalimprovements, making microorganisms eligible for patent protection, and prohibitions on datasharing will all make India a more attractive venue for MNCs and biotech firms. Narrowerconcepts of patentability and weak data protection laws will serve the interests of low-cost drugproducers. Thus, India’s policy decisions and eventual legislation in these areas can shape thedevelopment of India’s pharmaceutical industry, affecting the cost and availability of drugs toconsumers, number and types of domestic research opportunities, number and types of drugmanufacturing facilities that MNCs choose to locate in India, and consequent shape of employ-ment throughout the sector.
Creating and Commercializing Knowledge 2
81
18. TIFAC is an autonomous agency under the Department of Science and Technology. TIFACworks on technology forecasting, technology assessment, and technology information, and runsa patent facilitation center. As part of its functions, the patent facilitation center not only pro-vides information on patents but also helps individuals and organizations patent in India andabroad.
References
Baumol, William. 2002. The Free-Market Innovation Machine: Analyzing the Growth Miracle
of Capitalism. Princeton and Oxford: Princeton University Press.
Bhojwani, H. R. 2006. “Report on the Indian Civilian Public R&D System.” Background paper
commissioned by South Asia Finance and Private Sector Development, World Bank,
Washington, DC.
Bowonder, B., V. Kelkar, N. G. Satish, and J. K. Racherla. 2006. “Innovation in India: Recent
Trends.” TMTC (Tata Management Training Center) Research Paper, Pune, India.
CII (Confederation of Indian Industry) and BCG (Boston Consulting Group). 2005.
“Manufacturing Innovation: A Senior Executive Survey.” CII, Mumbai.
De Ferranti, D., G. E. Perry, I. Gill, J. L. Guasch, and N. Schady, with W. Maloney and C.
Sánchez-Páramo. 2003. Closing the Gap in Education and Technology. Latin American and
Caribbean Studies. Washington, DC: World Bank.
Evalueserve. 2006. “Is the Venture Capital Market in India Getting Overheated?” Evalueserve,
Saratoga, CA.
Fraunhofer Institute for Systems and Innovation Research. 2006. “Innovation and Public Pro-
curement: Review of Issues at Stake.” www.cordis.europa.eu/innovation-policy/studies/
gen_study13.htm.
Gupta, R. K. 2006.“The IPR System in India.” Background paper commissioned by South Asia
Finance and Private Sector Development, World Bank, Washington, DC.
Jaffe, Adam B. 2002. “Building Programme Evaluation into Design of Public Research–
Support Programmes.” Oxford Review of Economic Policy 18 (1): 22–34.
Javorcik, Beata S. 2004. “Does Foreign Direct Investment Increase the Productivity of Domestic
Firms? In Search of Spillovers through Backward Linkages.”American Economic Review 94 (3):
605–27.
Mashelkar, R. A. 2006. “Report of the Technical Expert Group on Patent Law Issues.”
Chairman, Technical Expert Group set up by Department of Industrial Policy and
Promotion.
National Research Council. 2000. SBIR: An Assessment of the Department of Defense Fast Track
Initiative. Washington, DC: National Academy Press.
———. 2001. The Advanced Technology Program: Assessing Outcomes. Washington, DC:
National Academies Press.
OECD (Organisation for Economic Co-operation and Development). 2003. Governance of
Public Research: Toward Better Practices. Paris: OECD Publications.
Pack, Howard, and Kamal Saggi. 2006. “Is There a Case for Industrial Policy? A Critical
Survey.” The World Bank Research Observer 21 (2): 267–97.
82
Carl Dahlman, Mark A. Dutz, and Vinod K. Goel2
Ruegg, Rosalie, and Irwin Feller. 2003. “A Toolkit for Evaluating Public R&D Investment:
Models, Methods, and Findings from ATP’s First Decade.” Advanced Technology Program,
Washington, DC.
Sankar, U. 2003. “Economic Analysis of Indian Space Programme: An Exploratory Study.”
Madras School of Economics, Chennai.
Silverthrone, S. 2005. “The Rise of Innovation in Asia.” Working Knowledge Series, Harvard
University Business School, Cambridge, MA.
TIFAC (Technology Information Forecasting and Assessment Council). 2005. “FDI in the
R&D Sector in 1998–2003.” New Delhi.
Trajtenberg, Manuel. 2005. “Innovation Policy for Development: An Overview.” Unpublished,
Tel Aviv University, November 21.
U.K. Department of Trade and Industry. 2006. The R&D Scoreboard 2006: The Top 800 UK &
1250 Global Companies by R&D Investment. London.
World Bank. 2006. Public Financial Support for Commercial Innovation: Europe and Central
Asia Knowledge Economy Study Part I. Washington, DC: World Bank.
Yusuf, Shahid, Kaoru Nabeshima, and Dwight H. Perkins. 2007. “China and India Reshape Global
Industrial Geography.” In Dancing with Giants: China, India and the Global Economy, ed.
L. Alan Winters and S. Yusuf. Washington, DC: World Bank and Institute of Policy Studies
(Singapore).
83
India could reap enormous productivity benefits if local and global knowledge were
better dispersed to and absorbed by domestic enterprises. Since independence, India
has invested heavily in creating an excellent science and technology infrastructure by
emphasizing public research and development (R&D) institutions. But it has not
done as well in absorbing the knowledge generated by this domestic R&D system.
Moreover, India has not taken sufficient advantage of the potential diffusion of inter-
nationally available knowledge and technology resources, as well as local knowledge.
As a result, the absorption of knowledge by most Indian enterprises has been low.
Most of the knowledge that India needs to boost productivity has already been dis-
covered and is being used elsewhere in the country or the world, but remains under-
used by domestic enterprises. The potential productivity gains from better diffusion
and absorption are particularly promising among small firms, especially those in the
informal sector—given that they typically are the least connected to knowledge
about prevailing best practices.1 The low productivity of most Indian enterprises rel-
ative to top local performers indicates the large potential gains from making better
use of existing knowledge.
The skewed distribution of enterprise productivity by sector—with small enter-
prises lagging far behind top local performers—reflects the low absorption of exist-
ing knowledge by most, and especially small, enterprises. Productivity is a good
proxy for how well enterprises use existing knowledge. Firms with higher productiv-
ity presumably have absorbed or developed superior production and management
technology. As discussed in chapter 1, productivity dispersion across formal enter-
prises in Indian manufacturing is wide relative to comparator countries. However,
given India’s stark economic heterogeneity—with formal sector employment
accounting for no more than 11 percent of total employment—productivity disper-
sion across both formal and informal enterprises is likely much wider.
Figure 3.1 shows the frequency distributions of all formal enterprises and small for-
mal enterprises according to value added per worker in six of the sectors covered by the
World Bank’s 2006 Enterprise Survey. These sectors represent a typical mix of the
Diffusing and Absorbing KnowledgeVinod K. Goel, Carl Dahlman, and Mark A. Dutz
3Chapter
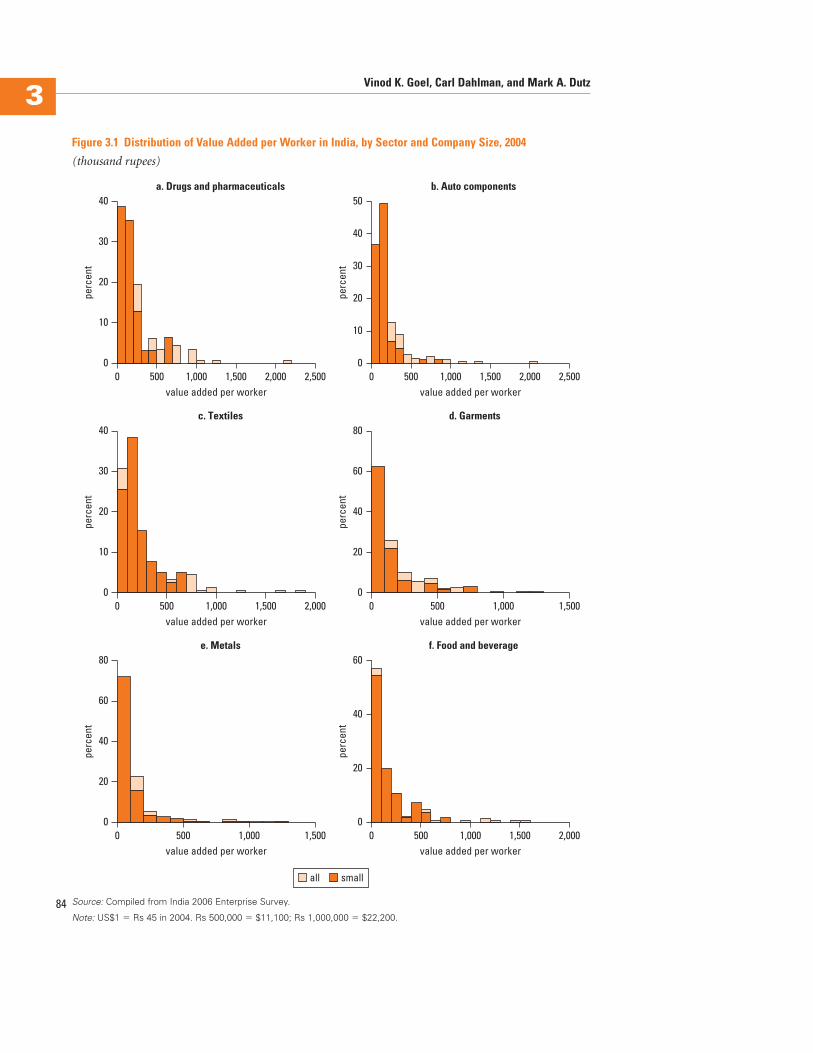
84
Vinod K. Goel, Carl Dahlman, and Mark A. Dutz 3
Figure 3.1 Distribution of Value Added per Worker in India, by Sector and Company Size, 2004
(thousand rupees)
a. Drugs and pharmaceuticals
0
10
20
0 500 1,000 1,500 2,000 2,500
30
40
perc
ent
value added per worker
b. Auto components
0
10
20
0 500 1,000 1,500 2,000 2,500
30
50
40
perc
ent
value added per worker
c. Textiles
0
10
20
0 500 1,000 1,500 2,000
30
40
perc
ent
value added per worker
d. Garments
0
20
0 500 1,000 1,500
80
60
40
perc
ent
value added per worker
f. Food and beverage
0
20
0 500 1,000 2,000
60
40
perc
ent
value added per worker1,500
e. Metals
0
20
0 500 1,000 1,500
80
60
40
perc
ent
value added per worker
all small
Source: Compiled from India 2006 Enterprise Survey.
Note: US$1 � Rs 45 in 2004. Rs 500,000 � $11,100; Rs 1,000,000 � $22,200.
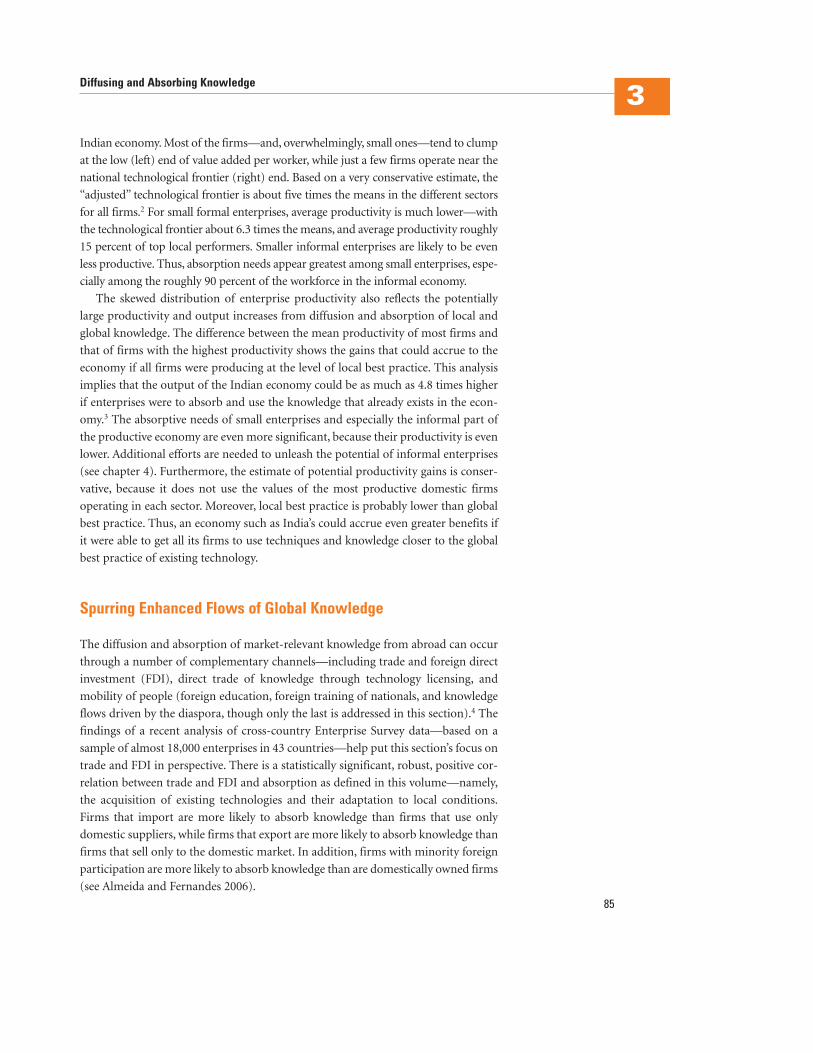
Indian economy. Most of the firms—and, overwhelmingly, small ones—tend to clump
at the low (left) end of value added per worker, while just a few firms operate near the
national technological frontier (right) end. Based on a very conservative estimate, the
“adjusted” technological frontier is about five times the means in the different sectors
for all firms.2 For small formal enterprises, average productivity is much lower—with
the technological frontier about 6.3 times the means, and average productivity roughly
15 percent of top local performers. Smaller informal enterprises are likely to be even
less productive. Thus, absorption needs appear greatest among small enterprises, espe-
cially among the roughly 90 percent of the workforce in the informal economy.
The skewed distribution of enterprise productivity also reflects the potentially
large productivity and output increases from diffusion and absorption of local and
global knowledge. The difference between the mean productivity of most firms and
that of firms with the highest productivity shows the gains that could accrue to the
economy if all firms were producing at the level of local best practice. This analysis
implies that the output of the Indian economy could be as much as 4.8 times higher
if enterprises were to absorb and use the knowledge that already exists in the econ-
omy.3 The absorptive needs of small enterprises and especially the informal part of
the productive economy are even more significant, because their productivity is even
lower. Additional efforts are needed to unleash the potential of informal enterprises
(see chapter 4). Furthermore, the estimate of potential productivity gains is conser-
vative, because it does not use the values of the most productive domestic firms
operating in each sector. Moreover, local best practice is probably lower than global
best practice. Thus, an economy such as India’s could accrue even greater benefits if
it were able to get all its firms to use techniques and knowledge closer to the global
best practice of existing technology.
Spurring Enhanced Flows of Global Knowledge
The diffusion and absorption of market-relevant knowledge from abroad can occur
through a number of complementary channels—including trade and foreign direct
investment (FDI), direct trade of knowledge through technology licensing, and
mobility of people (foreign education, foreign training of nationals, and knowledge
flows driven by the diaspora, though only the last is addressed in this section).4 The
findings of a recent analysis of cross-country Enterprise Survey data—based on a
sample of almost 18,000 enterprises in 43 countries—help put this section’s focus on
trade and FDI in perspective. There is a statistically significant, robust, positive cor-
relation between trade and FDI and absorption as defined in this volume—namely,
the acquisition of existing technologies and their adaptation to local conditions.
Firms that import are more likely to absorb knowledge than firms that use only
domestic suppliers, while firms that export are more likely to absorb knowledge than
firms that sell only to the domestic market. In addition, firms with minority foreign
participation are more likely to absorb knowledge than are domestically owned firms
(see Almeida and Fernandes 2006).
Diffusing and Absorbing Knowledge3
85
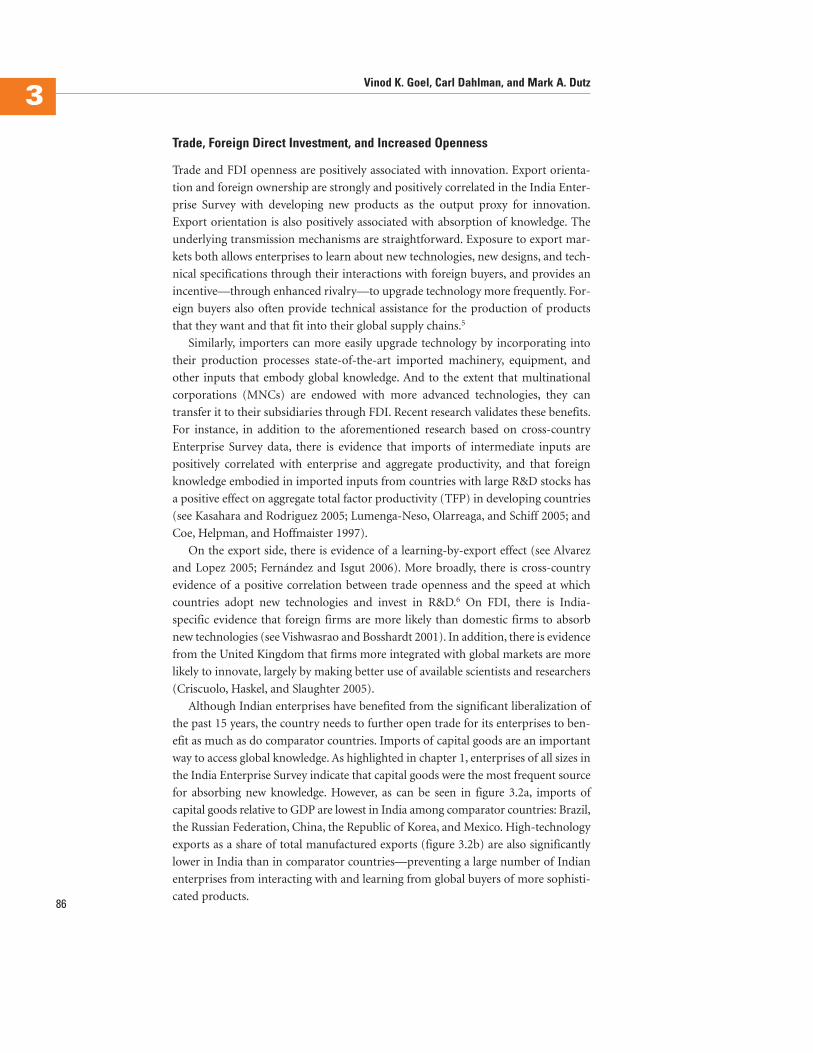
Trade, Foreign Direct Investment, and Increased Openness
Trade and FDI openness are positively associated with innovation. Export orienta-
tion and foreign ownership are strongly and positively correlated in the India Enter-
prise Survey with developing new products as the output proxy for innovation.
Export orientation is also positively associated with absorption of knowledge. The
underlying transmission mechanisms are straightforward. Exposure to export mar-
kets both allows enterprises to learn about new technologies, new designs, and tech-
nical specifications through their interactions with foreign buyers, and provides an
incentive—through enhanced rivalry—to upgrade technology more frequently. For-
eign buyers also often provide technical assistance for the production of products
that they want and that fit into their global supply chains.5
Similarly, importers can more easily upgrade technology by incorporating into
their production processes state-of-the-art imported machinery, equipment, and
other inputs that embody global knowledge. And to the extent that multinational
corporations (MNCs) are endowed with more advanced technologies, they can
transfer it to their subsidiaries through FDI. Recent research validates these benefits.
For instance, in addition to the aforementioned research based on cross-country
Enterprise Survey data, there is evidence that imports of intermediate inputs are
positively correlated with enterprise and aggregate productivity, and that foreign
knowledge embodied in imported inputs from countries with large R&D stocks has
a positive effect on aggregate total factor productivity (TFP) in developing countries
(see Kasahara and Rodriguez 2005; Lumenga-Neso, Olarreaga, and Schiff 2005; and
Coe, Helpman, and Hoffmaister 1997).
On the export side, there is evidence of a learning-by-export effect (see Alvarez
and Lopez 2005; Fernández and Isgut 2006). More broadly, there is cross-country
evidence of a positive correlation between trade openness and the speed at which
countries adopt new technologies and invest in R&D.6 On FDI, there is India-
specific evidence that foreign firms are more likely than domestic firms to absorb
new technologies (see Vishwasrao and Bosshardt 2001). In addition, there is evidence
from the United Kingdom that firms more integrated with global markets are more
likely to innovate, largely by making better use of available scientists and researchers
(Criscuolo, Haskel, and Slaughter 2005).
Although Indian enterprises have benefited from the significant liberalization of
the past 15 years, the country needs to further open trade for its enterprises to ben-
efit as much as do comparator countries. Imports of capital goods are an important
way to access global knowledge. As highlighted in chapter 1, enterprises of all sizes in
the India Enterprise Survey indicate that capital goods were the most frequent source
for absorbing new knowledge. However, as can be seen in figure 3.2a, imports of
capital goods relative to GDP are lowest in India among comparator countries: Brazil,
the Russian Federation, China, the Republic of Korea, and Mexico. High-technology
exports as a share of total manufactured exports (figure 3.2b) are also significantly
lower in India than in comparator countries—preventing a large number of Indian
enterprises from interacting with and learning from global buyers of more sophisti-
cated products.86
Vinod K. Goel, Carl Dahlman, and Mark A. Dutz 3
Diffusing and Absorbing Knowledge3
87
Figure 3.2 Openness to Global Flows of Products and Capital in Various Countries
Imports of capital goods/GDP, 2004
MexicoKorea, Rep. of
ChinaIndia
Russian Fed.Brazil
1614121086420
3.84.5
3.113.1
11.114.2
Time to import, 2006 Time to export, 2006
OECDMexico
Korea, Rep. ofChinaIndia
Russian Fed.Brazil
4540353020 2510 1550
24.038.0
41.022.0
12.026.0
12.2
a. Cross-border trade
b. Trade barriersa
c. Time to import and export
d. Foreign investment and contract enforcement
High-tech exports/manufacturing trade, 2003
MexicoKorea, Rep. of
ChinaIndia
Russian Fed.Brazil
35302520151050
12.018.9
4.827.1
32.221.3
Tariff barriers, 2002–04 (weighted average forall products)
Mexico (2004)Korea, Rep. of (2002)
China (2004)India (2004)
Russian Fed. (2002)Brazil (2004)
302520151050
7.68.7
6.010.0
3.7
Tariff and nontariff barriers, 2006
MexicoKorea, Rep. of
ChinaIndia
Russian Fed.Brazil
6543210
3.53.5
5.03.0
3.52.5
28.0
OECDMexico
Korea, Rep. ofChinaIndia
Russian Fed.Brazil
4540353020 2510 1550
18.039.0
27.018.0
12.017.0
10.5
Gross foreign investment/GDP1994–2003 average
Time to enforce contracts, 2006
MexicoKorea, Rep. of
ChinaIndia
Russian Fed.Brazil
4.54.03.53.02.0 2.51.0 1.50.50
3.71.4
0.73.9
1.02.8 OECD
MexicoKorea, Rep. of
ChinaIndia
Russian Fed.Brazil
1,600400 800 1,2000
616178
1,420292
230415
351
percent percent
percent ordinal index
days days
percent days
Source: World Bank 2006a, 2006b.
Note: OECD � Organisation for Economic Co-operation and Development.
a. For the graphs in this section, the lower the number, the more open the trade regime to imports and exports.
88
Vinod K. Goel, Carl Dahlman, and Mark A. Dutz 3
The low share of imports is closely related to trade barriers that, while having
been ratcheted down from liberalization efforts, remain higher relative to com-
parator countries. Although India has been liberalizing its trade barriers, comparator
countries have been liberalizing theirs even more—giving their enterprises a compet-
itive advantage relative to Indian enterprises in accessing global knowledge. As shown
in figure 3.2c, tariffs in India remain three to almost eight times higher than in com-
parator countries, while combined tariff and nontariff barriers (figure 3.2d) are
significantly higher.
India’s low openness to foreign trade is also driven by procedural requirements
and implementation obstacles for exporting and importing (figures 3.2e and 3.2f).
Trading across borders is slow and complex in India, which is ranked 139th of 175
countries in trade costs for exporting and importing a standardized cargo of goods.
In particular, India needs to improve the time needed to comply with import proce-
dures, which at 41 days (requiring 15 separate documents for imports) stands in
stark contrast to 22 days in China, 24 in Brazil, 38 in Russia, and 12 on average in
OECD countries (World Bank 2006a).
India also needs to build on its increasing openness to FDI so that enterprises can
benefit as much as possible from FDI-related knowledge flows. Reforms since the
mid-1980s, and particularly since 1991, have liberalized India’s FDI regime, with
most sectors falling under the automatic route of 100 percent FDI being allowed
since 2000. In recent years most FDI has gone to electrical equipment (electronics
and information technology), telecommunications, transport (automobiles and
automotive components), chemicals and pharmaceuticals, and the service sector
(financial, information technology, and business process outsourcing services), with
most recently a focus on the R&D side of these sectors.
Despite these inflows, however, India continues to attract little FDI relative to
comparator countries (figure 3.2g). Among the most prominent deterrents are infra-
structure bottlenecks and cumbersome bureaucratic processes—including weak
contract enforcement, which the government recognizes. Slow contract enforcement
and inefficient courts are inimical to FDI because they create an uneven playing
field and unpredictable environment that inhibit new entrants such as foreign
investors and small businesses.7 Of the 10 areas of everyday business measured by the
World Bank’s annual Doing Business report, this is where India lags behind. It is
among the four countries worldwide with the longest court delays, at 1,420 days to
enforce a contract (figure 3.2h). This is at least partly linked to India’s abnormally
high number of related procedures, at 56—compared with 31 in Russia and China,
and 22 on average in OECD countries.
Further opening to trade and FDI would allow enterprises to gain more from
global knowledge flows. A national innovation program and the opportunity for
more Indian enterprises to benefit from global knowledge through greater openness
in trade and FDI could provide a constructive context for further liberalization. A
good starting point would be raising awareness of the economywide benefits from
liberalization so far. Among the clearest of these benefits are the productivity
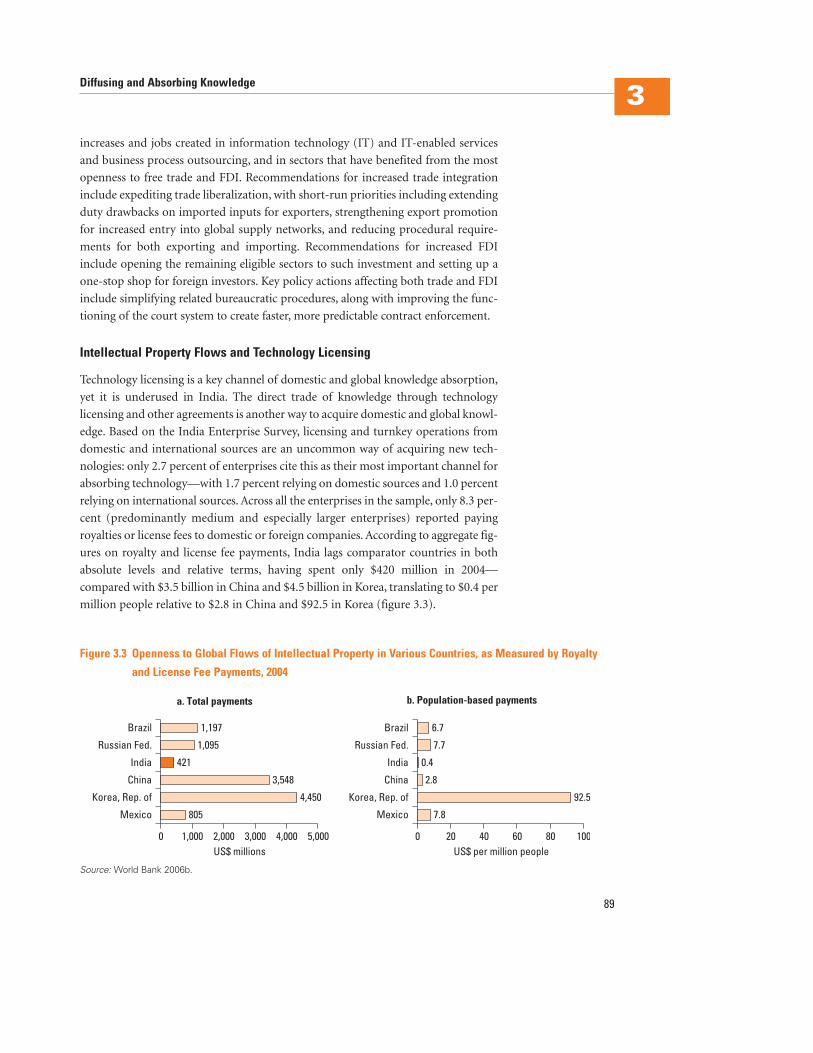
Diffusing and Absorbing Knowledge3
89
Figure 3.3 Openness to Global Flows of Intellectual Property in Various Countries, as Measured by Royalty
and License Fee Payments, 2004
a. Total payments
Mexico
Korea, Rep. of
China
India
Russian Fed.
Brazil
5,0000 1,000 2,000 3,000US$ millions US$ per million people
4,000
1,197
1,095
421
3,548
4,450
805
b. Population-based payments
Mexico
Korea, Rep. of
China
India
Russian Fed.
Brazil
100806040200
6.7
7.7
0.4
2.8
92.5
7.8
increases and jobs created in information technology (IT) and IT-enabled services
and business process outsourcing, and in sectors that have benefited from the most
openness to free trade and FDI. Recommendations for increased trade integration
include expediting trade liberalization, with short-run priorities including extending
duty drawbacks on imported inputs for exporters, strengthening export promotion
for increased entry into global supply networks, and reducing procedural require-
ments for both exporting and importing. Recommendations for increased FDI
include opening the remaining eligible sectors to such investment and setting up a
one-stop shop for foreign investors. Key policy actions affecting both trade and FDI
include simplifying related bureaucratic procedures, along with improving the func-
tioning of the court system to create faster, more predictable contract enforcement.
Intellectual Property Flows and Technology Licensing
Technology licensing is a key channel of domestic and global knowledge absorption,
yet it is underused in India. The direct trade of knowledge through technology
licensing and other agreements is another way to acquire domestic and global knowl-
edge. Based on the India Enterprise Survey, licensing and turnkey operations from
domestic and international sources are an uncommon way of acquiring new tech-
nologies: only 2.7 percent of enterprises cite this as their most important channel for
absorbing technology—with 1.7 percent relying on domestic sources and 1.0 percent
relying on international sources. Across all the enterprises in the sample, only 8.3 per-
cent (predominantly medium and especially larger enterprises) reported paying
royalties or license fees to domestic or foreign companies. According to aggregate fig-
ures on royalty and license fee payments, India lags comparator countries in both
absolute levels and relative terms, having spent only $420 million in 2004—
compared with $3.5 billion in China and $4.5 billion in Korea, translating to $0.4 per
million people relative to $2.8 in China and $92.5 in Korea (figure 3.3).
Source: World Bank 2006b.
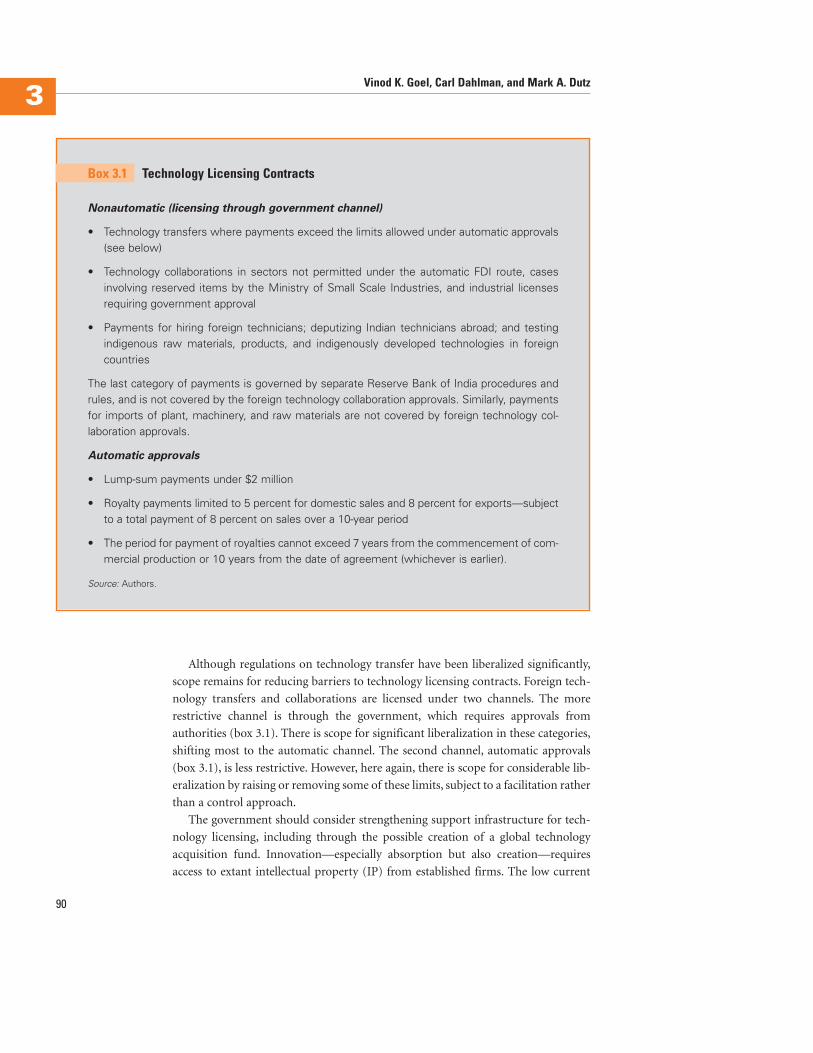
Although regulations on technology transfer have been liberalized significantly,
scope remains for reducing barriers to technology licensing contracts. Foreign tech-
nology transfers and collaborations are licensed under two channels. The more
restrictive channel is through the government, which requires approvals from
authorities (box 3.1). There is scope for significant liberalization in these categories,
shifting most to the automatic channel. The second channel, automatic approvals
(box 3.1), is less restrictive. However, here again, there is scope for considerable lib-
eralization by raising or removing some of these limits, subject to a facilitation rather
than a control approach.
The government should consider strengthening support infrastructure for tech-
nology licensing, including through the possible creation of a global technology
acquisition fund. Innovation—especially absorption but also creation—requires
access to extant intellectual property (IP) from established firms. The low current
90
Vinod K. Goel, Carl Dahlman, and Mark A. Dutz 3
Nonautomatic (licensing through government channel)
• Technology transfers where payments exceed the limits allowed under automatic approvals(see below)
• Technology collaborations in sectors not permitted under the automatic FDI route, casesinvolving reserved items by the Ministry of Small Scale Industries, and industrial licensesrequiring government approval
• Payments for hiring foreign technicians; deputizing Indian technicians abroad; and testingindigenous raw materials, products, and indigenously developed technologies in foreigncountries
The last category of payments is governed by separate Reserve Bank of India procedures andrules, and is not covered by the foreign technology collaboration approvals. Similarly, paymentsfor imports of plant, machinery, and raw materials are not covered by foreign technology col-laboration approvals.
Automatic approvals
• Lump-sum payments under $2 million
• Royalty payments limited to 5 percent for domestic sales and 8 percent for exports—subjectto a total payment of 8 percent on sales over a 10-year period
• The period for payment of royalties cannot exceed 7 years from the commencement of com-mercial production or 10 years from the date of agreement (whichever is earlier).
Source: Authors.
Box 3.1 Technology Licensing Contracts
reliance by Indian enterprises on technology licensing, while partly due to weak local
“innovate or perish” competition-type incentives, may also be due to market failures
associated with information asymmetries, lack of knowledge of what technologies
are available for licensing, where to tap them, how best to negotiate licensing terms,
synergies from joint purchase and use of intellectual property, and the learning-by-
doing nature of purchasing such technology rights or know-how.
As part of efforts to strengthen support infrastructure for technology licensing
(including expansion of TIFAC’s patent facilitation program, discussed in chapter 2),
the government may wish to explore establishing a public-private technology acqui-
sition fund (with minority public share) to support the acquisition of patents and
other rights to early-stage technologies and related know-how to fill gaps in India’s
knowledge base. Such a fund could expedite commercialization of products where
a particular piece of IP is missing locally but available internationally, reduce costs
of acquiring the IP, and otherwise help create better (and cheaper) products for sale
on global markets. By focusing on filling gaps in IP, this approach would not be
picking winners but rather building on what IP is already locally known and avail-
able. By being structured as an autonomous public-private partnership, the fund
would incite motivations parallel to those of the private sector. The fund would be
a repository of both the skills to negotiate reasonable licensing and know-how
acquisition terms from international holders of IP and the skills to devise appro-
priate payment structures for acquirers of it.8
Talent Flows and the Diaspora
India’s diaspora provides an important opportunity for further tapping into global
knowledge flows. About 2 percent of India’s population (20 million people of
Indian origin) lives abroad, earning roughly two-thirds of India’s GDP (Kuznetsov
2006). India’s high-tech diaspora is a unique, well-documented network that can
take credit for some of India’s high-tech success. Indians are among the most suc-
cessful immigrant communities in U.S. history, with more than 2 million currently
living in the United States. Some 200,000 Indian-American families are headed by
millionaires, and the median annual income of U.S. residents of Indian origin is
$60,093—much higher than the median U.S. income of $38,885 (Ministry of
External Affairs 2004). Two-thirds of foreign-born Indian-Americans have univer-
sity degrees—three times the figure for Americans as a whole. More than 20 percent
of U.S. information technology firms were started by Indian immigrants, and about
44 percent of these immigrants hold managerial or professional positions. The dias-
pora has been active in helping India through remittances, networks, access to
knowledge and markets, and other resources. The old “brain drain” problem has
become a great “brain gain” opportunity.
The diaspora has had a significant impact as investors and mentors, catalysts for
policy change, and direct sources of returning talent. Indian expatriates have played
a critical role in spurring India’s software and business process outsourcing boom.
Diffusing and Absorbing Knowledge3
91
These developments have led to a second crucial expatriate role, with Indian expa-
triates becoming senior executives at many major U.S. corporations—such as IBM,
General Electric, Intel, Microsoft, Cisco, and American Express. In nearly every
instance where these companies invested in or outsourced work to India, a well-
placed expatriate executive crucially influenced the decision. In part, the individual’s
own success supported the emerging positive reputation of Indian engineers. And in
part, the individual’s direct experience with India gave that individual credibility in
vouching that India’s infrastructure and bureaucracy problems could be overcome.
In addition,some expatriates have returned to India for one to two years to super-
vise U.S. investments or outsourcing contracts, helping to train and manage to U.S.
performance standards.Kanwal Rekhi,one of the founders of TiE (The IndUs Entre-
preneurs, a global nonprofit network dedicated to advancing entrepreneurship),
embarked on a well-publicized series of speeches and interviews in India in which
he challenged the government and locals to pursue modernizing reforms. With the
increasing FDI in India’s IT and electronics industries, many Indian technology
professionals have returned home. More than 30,000 technology professionals have
returned to India since 2004 (Rai 2005). Their inducements include Western man-
agement practices and work cultures, liberal pay packages, and good career prospects,
reinforced by a weak IT job market in the United States during 2001–04. Fresh
Indian talent in many U.S. universities is also lured back to India. In 2005, of the 2,300
employees at General Electric’s John F. Welch R&D Center in Bangalore, 700 were
Indians who had returned in recent years. Most significantly, returning Indians rou-
tinely establish their own firms, rather than return to work for big multinational
corporations or local firms.
The government could play a catalyzing role by strengthening the support infra-
structure for diaspora knowledge initiatives. To help unleash the benefits of India’s
innovation potential, the government of India may wish to explore new initiatives
that exploit the huge talent of the Indian diaspora. The public policy rationale of
these initiatives is based on information asymmetries and uncaptured synergies
from activities whose social benefits exceed their private ones. Activities could
include joint research projects; spin-offs; short visits and seminars; assistance in
formulating innovation strategies and methodologies; program design, implemen-
tation, and evaluation; institutional reviews; participation in teaching at manage-
ment bodies of key institutions; mentoring; and liaisons with technology institutions
and markets. To deliver on the promise of a diaspora-facilitated circle of economic
growth and reform, a new generation of diaspora initiatives may be desirable. This
could include establishing a more formal diaspora network (following the highly
successful Global Scot, a network of 850 influential Scots abroad managed by the
Scottish Enterprise), and building on existing groups that aggregate this popula-
tion’s talent and capital for use in India through a dedicated fund that could, among
other activities, enrich innovation policy program and institutional design; enrich
the management of scientific institutions and programs; provide teaching, consul-
tancy, and mentoring resources for Indian innovators; and assist in the commer-
cialization of Indian IP within India and abroad.
92
Vinod K. Goel, Carl Dahlman, and Mark A. Dutz 3
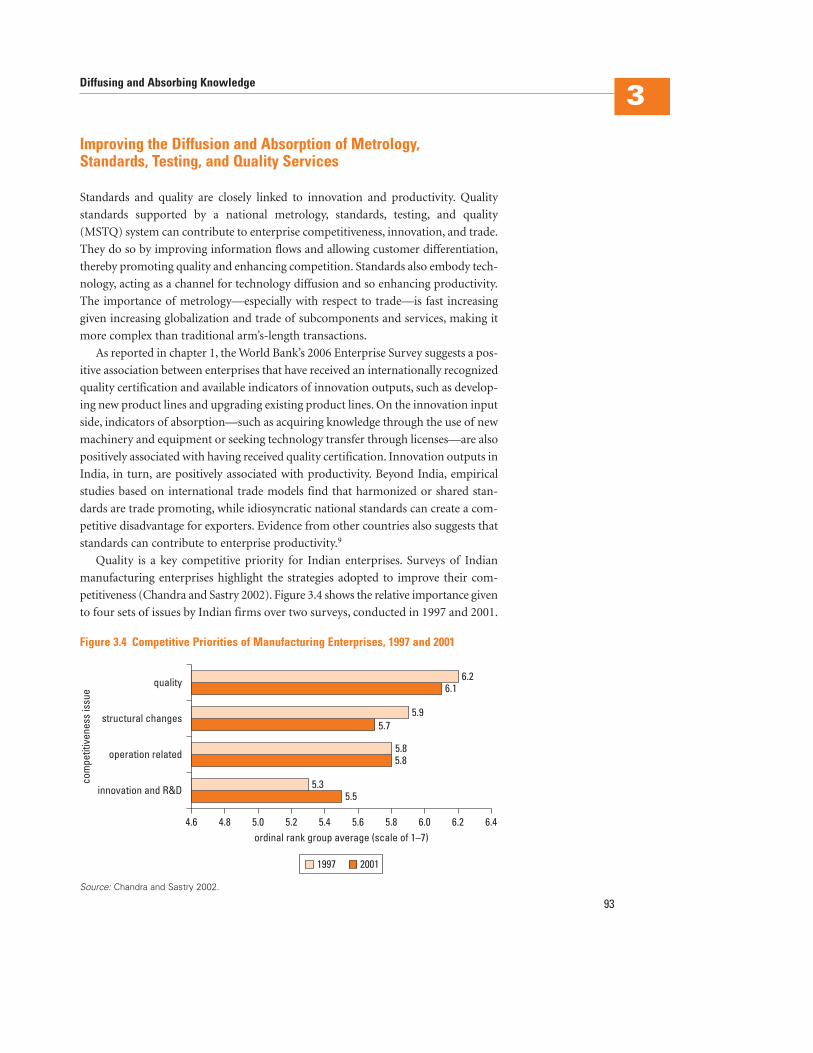
Improving the Diffusion and Absorption of Metrology, Standards, Testing, and Quality Services
Standards and quality are closely linked to innovation and productivity. Quality
standards supported by a national metrology, standards, testing, and quality
(MSTQ) system can contribute to enterprise competitiveness, innovation, and trade.
They do so by improving information flows and allowing customer differentiation,
thereby promoting quality and enhancing competition. Standards also embody tech-
nology, acting as a channel for technology diffusion and so enhancing productivity.
The importance of metrology—especially with respect to trade—is fast increasing
given increasing globalization and trade of subcomponents and services, making it
more complex than traditional arm’s-length transactions.
As reported in chapter 1, the World Bank’s 2006 Enterprise Survey suggests a pos-
itive association between enterprises that have received an internationally recognized
quality certification and available indicators of innovation outputs, such as develop-
ing new product lines and upgrading existing product lines. On the innovation input
side, indicators of absorption—such as acquiring knowledge through the use of new
machinery and equipment or seeking technology transfer through licenses—are also
positively associated with having received quality certification. Innovation outputs in
India, in turn, are positively associated with productivity. Beyond India, empirical
studies based on international trade models find that harmonized or shared stan-
dards are trade promoting, while idiosyncratic national standards can create a com-
petitive disadvantage for exporters. Evidence from other countries also suggests that
standards can contribute to enterprise productivity.9
Quality is a key competitive priority for Indian enterprises. Surveys of Indian
manufacturing enterprises highlight the strategies adopted to improve their com-
petitiveness (Chandra and Sastry 2002). Figure 3.4 shows the relative importance given
to four sets of issues by Indian firms over two surveys, conducted in 1997 and 2001.
Diffusing and Absorbing Knowledge3
93
Figure 3.4 Competitive Priorities of Manufacturing Enterprises, 1997 and 2001
4.6 5.04.8 5.2 5.4 5.6ordinal rank group average (scale of 1–7)
5.8 6.0 6.2 6.4
innovation and R&D
operation related
structural changes
com
petit
iven
ess
issu
e
quality
1997 2001
5.5
5.8
5.7
6.1
5.3
5.8
5.9
6.2
Source: Chandra and Sastry 2002.
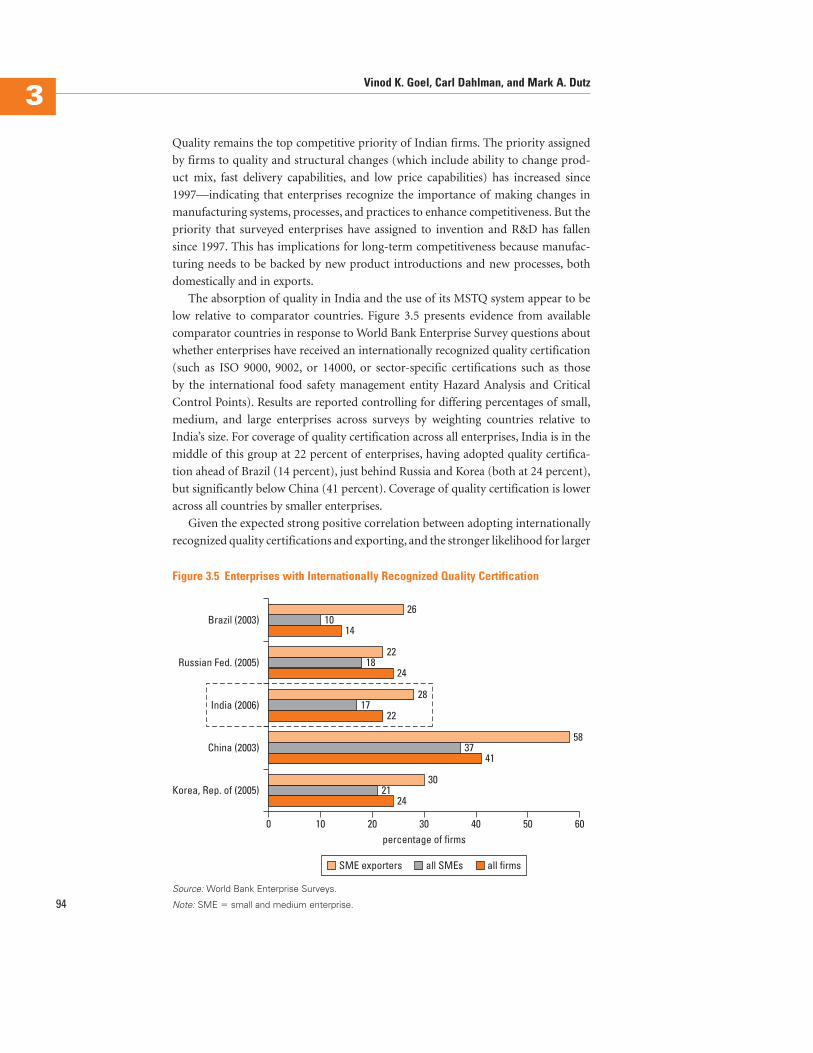
Quality remains the top competitive priority of Indian firms. The priority assigned
by firms to quality and structural changes (which include ability to change prod-
uct mix, fast delivery capabilities, and low price capabilities) has increased since
1997—indicating that enterprises recognize the importance of making changes in
manufacturing systems, processes, and practices to enhance competitiveness. But the
priority that surveyed enterprises have assigned to invention and R&D has fallen
since 1997. This has implications for long-term competitiveness because manufac-
turing needs to be backed by new product introductions and new processes, both
domestically and in exports.
The absorption of quality in India and the use of its MSTQ system appear to be
low relative to comparator countries. Figure 3.5 presents evidence from available
comparator countries in response to World Bank Enterprise Survey questions about
whether enterprises have received an internationally recognized quality certification
(such as ISO 9000, 9002, or 14000, or sector-specific certifications such as those
by the international food safety management entity Hazard Analysis and Critical
Control Points). Results are reported controlling for differing percentages of small,
medium, and large enterprises across surveys by weighting countries relative to
India’s size. For coverage of quality certification across all enterprises, India is in the
middle of this group at 22 percent of enterprises, having adopted quality certifica-
tion ahead of Brazil (14 percent), just behind Russia and Korea (both at 24 percent),
but significantly below China (41 percent). Coverage of quality certification is lower
across all countries by smaller enterprises.
Given the expected strong positive correlation between adopting internationally
recognized quality certifications and exporting, and the stronger likelihood for larger
94
Vinod K. Goel, Carl Dahlman, and Mark A. Dutz 3
Figure 3.5 Enterprises with Internationally Recognized Quality Certification
26
22
1014
2418
0 10 20percentage of firms
30 40 50 60
Korea, Rep. of (2005)
China (2003)
India (2006)
Russian Fed. (2005)
Brazil (2003)
SME exporters all SMEs all firms
58
4137
28
2217
30
2421
Source: World Bank Enterprise Surveys.
Note: SME � small and medium enterprise.
Diffusing and Absorbing Knowledge3
95
firms to adopt such standards, results are also reported for small and medium
exporters. Here, India’s position at 28 percent of enterprises being certified is
insignificantly different from those of Brazil (26 percent), Russia (22 percent), and
Korea (30 percent)—but significantly below that of China (58 percent). Informal
interviews conducted in preparing this volume support the implication of low
absorption of quality in India—namely, that the use of MSTQ services, especially by
smaller enterprises, is quite low. The reasons cited for low use include a lack of incen-
tives in an insufficiently competitive environment in many sectors, low awareness
about the benefits of MSTQ services, relative high costs and low availability of ser-
vices economywide, outdated facilities, and a poor customer service orientation of
main providers.
India’s standards and quality system is serviceable but dominated by the public
sector—and use by private enterprises is low. India has a fairly well-developed system
of MSTQ institutions and regulations, meeting most international requirements. But
some of its facilities are old (such as metrology and testing labs), and others lack ade-
quate capacity (such as for accreditation and conformity assessments) to meet the
needs of fast-growing, modernizing Indian enterprises:
• The National Physical Laboratory is the apex body in metrology and has good
coverage in physical metrology. However, its labs are scattered in many old build-
ings, and in most cases have old equipment and lack adequate skilled staff.
• The Quality Council of India is an autonomous body responsible for establishing
and operating the National Accreditation Structure for conformity assessment
bodies. It also handles registration of quality management personnel and train-
ing organizations. But its coverage is not widespread: many testing and confor-
mation bodies set up by various ministries are outside its mandate.
• The National Accreditation Board of Testing and Calibration Laboratories has
more than 650 accredited calibration and testing laboratories in the public and
private sectors.
• The Bureau of Indian Standards is engaged in the formulation of Indian stan-
dards, certification, and product testing. It is the inquiry point for the World
Trade Organization (WTO) and training. Under the WTO, health, safety, and
environmental regulations are the government’s responsibility. However, several
sectors are not under such regulation in India, such as telecommunications, toys,
and fire safety equipment.
Taking into account the high potential for growth of smaller enterprises, as
measured by productivity, output, employment, and exports, in 1999 the govern-
ment created a special ministry that in 2001 was split into the Ministry of Small
Scale Industries and the Ministry of Agro and Rural Industries. Box 3.2 presents
some of the initiatives to promote quality supported by the Ministry of Small Scale
Industries. However, as with government programs seeking to foster absorptive
capacity, there is insufficient evidence on the reach, use, and effectiveness of these
programs.
96
Vinod K. Goel, Carl Dahlman, and Mark A. Dutz 3
Many countries have designated a nodal agency to coordinate government interventions to sup-port small and medium enterprises (SMEs). In India, a separate “medium enterprises” sectoris not defined. The Small Industries Development Organization, under the Ministry of SmallScale Industries, serves as India’s nodal development agency for small enterprises. It focuseson providing support in the following areas:
• Technology and promotion, including MSTQ support and technology upgrading (see box 3.3)
• Marketing, including subcontracting exchanges, vendor development, bar coding, andparticipation in international fairs
• Entrepreneurship development, including training at national institutes and entrepreneurshipdevelopment courses
• Promotion of self-employment, including a program for unemployed youth sponsored by theMinistry of Agro and Rural Industries
• Infrastructure, including upgrading of industrial estates
• Facilitation, including product reservation, SENET (Small Enterprise Information andResources Network for Electronic Information support), incentives for backward areas, andnational awards for entrepreneurship and quality.
Quality-related support and promotion schemes by the Small Industries Development Orga-nization include the following:
• Testing centers. Four regional testing centers (New Delhi, Mumbai, Kolkata, Chennai) andseven field testing stations (Jaipur, Hyderabad, Kolhapur, Pondicherry, Bhopal, Bangalore,Chenganacherry) provide enterprises with quality-related testing services, calibration services(including those covered under ISO 9000, to meet their mandatory requirements), andassistance in meeting export-related quality requirements. The centers and stations also pro-vide training in testing and calibration to strengthen worker skills, and coordinate with theBureau of Indian Standards and other technical testing and inspection organizations on mat-ters related to standardization of products for small enterprises. The four regional testingcenters have been accredited by the National Accreditation Board of Testing and CalibrationLaboratories. Their performance over the past five years has been relatively stable, achiev-ing 65–70 percent self-sufficiency each year. The performance of the field testing stationsimproved during this period, with the self-sufficiency ratio rising from 67 percent in 2001–02to 88 percent in 2005–06 (and reaching 93 percent in 2004–05).
• Testing laboratories run by associations of the Ministry of Small Scale Industries. A schemeinitiated in 2001 helps establish testing centers for industry associations and modernize andexpand quality marking centers for state governments. The scheme provides matchinggrants of 50 percent (up to Rs 50 lakh, about $120,000) to set up the centers.
(continued)
Box 3.2 Ministry of Small Scale Industries: Selected Metrology, Standards, Testing,and Quality Initiatives
India should modernize its MSTQ infrastructure to international standards to
meet the needs of its growing economy. The government should undertake the
following:
• Review the functioning of all MSTQ programs, including their governance and
management structures and effectiveness—with a view to improving their oper-
ational effectiveness and maximizing synergies between initiatives sponsored by
various line ministries, with a focus on the Ministry of Small Scale Industries.
• Increase industry awareness of MSTQ services and their importance, including
through better interaction with industry organizations and incentives (such as
matching grants) for SMEs to use MSTQ services and obtain national and ISO
certifications.
• Create a world-class metrology infrastructure (separating it from the National
Physical Laboratory) with state-of-the-art metrology laboratories, including
modern buildings and equipment, and upgraded staff skills. This move should
be accompanied by specialized metrology capabilities developed in existing
national labs—such as food-related metrology at the Central Food Technological
Research Institute and biology metrology at the Centre for Cellular and Molecu-
lar Biology.
• Strengthen other MSTQ institutions such as the Quality Council of India, accred-
itation boards, and other bodies.
Diffusing and Absorbing Knowledge3
97
• ISO 9000 awareness program. This is a one-day program of awareness and five-daymotivational and educational program on total quality management and the ISO 9000 totalquality system, organized by Training Resource Centers and Small Industries Service Insti-tutes (see box 3.3). As a result of the programs, the number of small enterprises availingthemselves of the benefits of reimbursement increased from 122 through the end of EighthPlan to 1,384 through March 2001.
• Incentive scheme for ISO 9000 and ISO 14001 certifications. This scheme reimbursescharges for acquiring ISO quality management and environmental management certification,covering 75 percent of the costs (up to Rs 75,000, about $1,800).
• National awards for quality products. Annual awards are given to encourage small-scaleentrepreneurs to upgrade the quality of their products, develop new technologies anddesigns, and deliver technological improvements. The first, second, and third prizes carry(besides a trophy and certificate) cash awards of Rs 25,000, Rs 20,000, and Rs 15,000,respectively, or between $350 and $600. The awards are given to entrepreneurs in eachapplicant state or Union Territory.
Source: Authors, based on information at http://ssi.nic.in/.
Box 3.2 continued
• Increase private participation in testing and accreditation labs. Most government
accreditation and testing labs should be considered for privatization or at least
private management.
• Review areas under regulation to identify uncovered sectors—for example, toys
and health services have almost no standards regulations, yet affect a huge part of
the Indian population.
• Consider bringing under the purview of the Quality Council of India many
accreditation programs set up and managed by various ministries, to foster
national consistency and avoid conflicts of interest.
• Encourage and support participation by Indian scientists and MSTQ personnel
(public and private) in international technical committees, working groups,
workshops, and seminars.
Strengthening the Absorptive Capacity of Micro, Small, andMedium Enterprises
A useful way to help less-productive enterprises better absorb knowledge is to create an
environment where they can learn from more productive firms. Larger firms tend to
be better at absorbing knowledge and are more likely to have innovative outputs (see
chapter 1). Of course, it is not realistic to expect all Indian firms to operate at the level
of more efficient, typically larger firms. Constraints include the skills and education of
managers; skills of workers; age and technological vintage of firm equipment and
processes; access to capital, information, and other inputs; and access to customers and
marketing strategies. Enterprises need to have the capacity to search for appropriate
knowledge, evaluate different technologies, modify off-the-shelf technologies for use,
and integrate these new technologies into their production processes.
These are not easy tasks, especially for smaller enterprises lacking established
buyer-seller networks. Among other factors, a dense network of links to larger (for-
eign or domestic) enterprises may be a critical prerequisite for the emergence of
dynamic smaller enterprises. A business environment that facilitates commercial
transactions for all firms—large and small—and helps build links with other smaller
enterprises and with dynamic larger enterprises as qualified suppliers appears
important for promoting better economywide knowledge absorption.
Although the government has introduced a range of programs to promote tech-
nology absorption by smaller enterprises, including support for cluster develop-
ment, no quantitative analysis exists on their effectiveness. The policies, programs,
and schemes administered by the Ministry of Small Scale Industries to help small
enterprises link up with large ones—to increase productivity and competitiveness—
include a number of technology initiatives to help them assess options and receive
support for upgrading technology.10 As a key strategy for enhancing the productivity
and competitiveness of small enterprises, the ministry is supporting cluster
development as part of its new Small Industries Cluster Development Program. The
98
Vinod K. Goel, Carl Dahlman, and Mark A. Dutz 3
Diffusing and Absorbing Knowledge3
99
The ministry’s technology support includes a variety of mechanisms to provide enterprises withinformation and support about technology options:
• Tool rooms and tool design institutes. To help enterprises upgrade their technology, theSmall Industries Development Organization has set up 10 facilities equipped with the latestimported equipment—such as for computer-aided design (CAD), computer-aided manufac-turing (CAM), and computer numerically controlled (CNC)—as well as other tools meetinginternational standards.
• Product and process development centers. Six facilities for different industries (such as fra-grance and flavor development, glass, electronics, and design of electrical measurementinstruments) advise enterprises on how to improve quality and productivity through R&D,product design, product and process improvements, and common facilities.
Technology promotion schemes include the following:
• Small Industries Cluster Development Program. Launched in 2005, this program (formerlythe Integrated Technology Upgrading and Management Program) addresses the productiv-ity concerns of small enterprises, and applies to any cluster where there are commonproduction methods among enterprises. The program includes a technology diagnostics andneeds study, scouting for appropriate technologies, facilitation of research to adapt availabletechnology, intervention at one enterprise so nearby enterprises can see and feel the impactof technology upgrading, training, and dissemination. The Ministry of Small Scale Industriesdoes not contribute more than 80 percent of the total cost of any cluster project, up to a
Box 3.3 Ministry of Small Scale Industries: Selected Technology Upgrading Initiatives
(continued)
idea behind the cluster approach is not to pick winners but rather to support enter-
prises that show market potential. Thus, the selection of clusters requires evidence
on the viability of the cluster and the vibrancy of local support institutions, together
with the existence of gaps in technology, product quality, common facilities, skills
upgrading, and marketing support. Although this program—and a range of others
described in box 3.3—seem to be addressing relevant needs, spending by the Small
Industries Development Organization on technology upgrading seems small relative
to economywide needs. More important, systematic and independent assessments of
each program should be undertaken to offer recommendations for scaling up or
downsizing.
The absorptive capacity of smaller enterprises should be further strengthened,
among other ways, by expanding support programs—but only after their effective-
ness has been ascertained. TIFAC and the Ministry of Small Scale Industries recently
initiated a joint, cross-ministerial program for upgrading selected SME clusters, with
100
Vinod K. Goel, Carl Dahlman, and Mark A. Dutz 3
ceiling of Rs 10 crore ($240,000) per project. The pioneering enterprise has to bear 50 per-cent of the costs of setting up the demonstration plant.
• Technology Resource Centers. In 2001, 21 Small Industries Service Institutes were con-verted into technology resource centers to help enterprises that want to upgrade their tech-nology, by providing information about state-of-the-art technology, lists of machine suppliers,quality standards and consultants, and Internet access to electronic journals, catalog down-loads, and advanced search facilities, as well as organizing technical training programs.
• Mini tool rooms and training centers. The central government assists state governmentsthrough 90 percent grants for machinery and equipment costs for new mini tool rooms and75 percent grants for upgrading existing mini tool rooms. Mini tool rooms and training cen-ters help enterprises gain access to required tools to absorb new technologies, provide train-ing in tool design, provide consultancy and information to solve problems related to tooling,and act as common facilities to assist enterprises in product and prototype development.
• Technology Bureau for Small Enterprises. This bureau provides technology information(online databases on technology options), match-making (networking and assistance in draft-ing agreements and preparing business plans), finance syndication (loans, venture capital,and interest-free loans to meet initial expenditures in the pretechnology absorption stage),and business collaboration (support for exporting technologies), as well as support services(arranging consultancy services and visits of overseas experts, and coordinating buyer-sellermeetings). The bureau is a joint initiative between the United Nations Asian and Pacific Cen-ter for Transfer of Technology, the Small Industries Development Bank of India, and the SmallIndustries Development Organization.
• Credit-Linked Capital Subsidy Scheme for technology upgrading. This scheme aims to facil-itate technology upgrading by providing upfront capital subsidies to small enterprises formodernizing their production equipment and techniques. The ceiling on loans is Rs 1 crore($24,000), and the subsidy rate is 15 percent. The Small Industries Development Bank ofIndia and the National Bank for Agriculture and Rural Development are the nodal agenciesfor the scheme’s implementation.
Source: Authors, based on information at http://ssi.nic.in/.
Box 3.3 continued
the goal of making them globally competitive.11 One direction for further program-
matic reform is to explore collaboration through public-private partnerships with
universities, labs, and private corporations, to help ensure that knowledge provided
to local SME clusters is constantly refreshed, reflects international best practice, and
is as market-driven as possible. Such programmatic support should also be linked
with complementary initiatives to build appropriate skills and education, to ensure
more effective absorption.12 However, when deciding which programs to expand
and which to downsize or close, quantitative assessments of their reach, use, and
Diffusing and Absorbing Knowledge3
101
effectiveness are essential. This should be a short-term priority. Based on such eval-
uations, programs that appear effective could be candidates for expansion, while
ineffective programs should be discontinued, with funds reallocated flexibly across
programs depending on periodic reassessments of their effectiveness.
Notes
For questions or further information, please contact Vinod K. Goel ([email protected]), MarkA. Dutz ([email protected]), or Carl Dahlman ([email protected])
1. To be aligned as closely as possible with “small-scale industrial undertakings”; as defined by theMinistry of Small Scale Industries, small enterprises are defined here as those employing 15 orfewer workers. Although small-scale industries are defined according to assets (for example,where investment in fixed assets in plants and machinery does not exceed Rs 10 million), aver-age employment per unit in urban areas is 10 staff, with urban beverage and tobacco producersleading with 31, followed by textile producers at 18, and basic metal industries at 13.
2. To reduce false readings from poor data, the top and the bottom 1 percent have been droppedfrom the sample. An “adjusted” maximum was then calculated for each sector, at the point wherethe distribution begins to look more like a normal distribution; these “adjusted” frontiers areroughly 60 percent of the actual maximums.
3. This point is just to illustrate the importance of using existing knowledge. It is unrealistic toexpect that all firms could operate even at the level of the better domestic firms. Getting to thosehigher levels would require investments in physical, human, and management capital that arenot costless. In addition, it cannot be assumed that output could be almost quintupled and thatit could be sold, or that all workers would remain employed if there were such tremendousincreases in productivity.
4. This section focuses on direct knowledge flows to enterprises engaged in international activities,not the subsequent spillovers to other local enterprises through demonstration effects, laborturnover, or copying and reverse engineering.
5. See Westphal, Rhee, and Purcell (1981) on how important this was for upgrading technology forfirms in the Republic of Korea.
6. See Comin and Hobijn (2004) on the former, Lederman and Maloney (2003) on the latter.
7. Figure 10.1 in Doing Business 2007 (World Bank 2006a) shows the negative correlation betweenFDI and time to enforce a contract. Qian and Strahan (2006) find that small businesses get betterfinancial terms on loans when contracts can be enforced quickly and cheaply. Cooley, Marimon,and Quadrini (2004) find that new technologies are adopted faster when courts are efficient,because new businesses—as the predominant innovators—do not have the clout that largerfirms do to resolve disputes outside the courts.
8. For instance, rather than structuring payments as burdensome upfront, prelaunch start-up costs,allow payments through equity or from future revenue streams from use of the technology.
9. Swann, Temple, and Shurmer (1996) find that standards have a positive effect on intra-industrytrade exports and imports between Germany and the United Kingdom. Adopting 100 additionalBritish standards raises the U.K. export/import trade ratio by roughly 14 percent. Blind andJungmittag (2005) find that specifically harmonized standards enhance German trade. Regard-ing the productivity link, DTI (2005) reports that standards contributed to roughly 13 percentof the growth in labor productivity in the United Kingdom between 1948 and 2002.
10. See www.smallindustryindia.com/thrustareas/technology.htm.
11. Seven sectors have been identified for initial detailed assessments: casting, sporting goods(Jalandhar, Punjab), scientific instruments (Ambala, Haryana), rural pottery, low-end surgicalinstruments (Kolkata), diesel pumps and electrical motors (Rajkot, Gujarat), and agriculturaltools (Karnal, Haryana). The studies will assess technology products and processes in each
102
Vinod K. Goel, Carl Dahlman, and Mark A. Dutz 3
sector relative to international best practice, identify gaps (use of new materials, skill deficien-cies, market requirements and competition, and availability and use of existing programs andinitiatives), and suggest possible interventions to bridge identified gaps, including involvementof academia or R&D institutions.
12. See complementary recommendations in chapter 5.
References
Almeida, R., and A. M. Fernandes. 2006. “Openness and Technological Innovations in Devel-
oping Countries: Evidence from Firm-Level Surveys.” Policy Research Working Paper No.
3985, World Bank, Washington, DC.
Alvarez, R., and R. Lopez. 2005. “Exporting and Performance: Evidence from Chilean Plants.”
Canadian Journal of Economics 38 (4): 1384–400.
Blind, K., and A. Jungmittag. 2005. “Trade and the Impact of Innovations and Standards: The
Case of Germany and the UK.” Applied Economics 37: 1385–98.
Chandra, Pankaj, and Trilochan Sastry. 2002. “Competitiveness of Indian Manufacturing:
Findings of the 2001 National Manufacturing Survey.” Indian Institute of Management,
Ahmedabad.
Coe, D., E. Helpman, and A. Hoffmaister. 1997. “North-South Spillovers.” Economic Journal
107 (440): 134–49.
Comin, D., and B. Hobijn. 2004. “Cross-Country Technology Adoption: Making the Theories
Face the Facts.” Journal of Monetary Economics 51 (1): 39–83.
Cooley, Thomas, Ramon Marimon, and Vincenzo Quadrini. 2004.“Aggregate Consequences of
Limited Contract Enforceability.” Journal of Political Economy 112 (4): 817–47.
Criscuolo, Chiara, Jonathan E. Haskel, and Matthew J. Slaughter. 2005. “Global Engagement
and the Innovation Activities of Firms.” NBER Working Paper No. 11479, National Bureau
of Economic Research, Cambridge, MA.
DTI (Department of Trade and Industry). 2005.“The Empirical Economics of Standards.” DTI
Economic Paper No. 12, London.
Fernández, A., and A. Isgut. 2006. “Learning-by-Exporting Effects: Are They for Real?” Unpub-
lished, World Bank, Washington, DC.
Kasahara, Hiroyuki, and Joel Rodriguez. 2005. “Does the Use of Imported Intermediates
Increase Productivity? Plant-Level Evidence.” University of Western Ontario, RBC Finan-
cial Group Economic Policy Research Institute Working Paper No. 20057, London,
Ontario.
Kuznetsov, Y. 2006. “Diaspora Networks and the International Migration of Skills: How Coun-
tries Can Draw on Their Talent Abroad.” WBI Development Studies, World Bank Institute,
Washington, DC.
Lederman, D., and W. Maloney. 2003. “R&D and Development.” Policy Research Working
Paper No. 3024, World Bank, Washington, DC.
Lumenga-Neso, Olivier, Marcelo Olarreaga, and Maurice Schiff. 2005. “On Indirect Trade-
Related R&D Spillovers.” European Economic Review 49 (7): 1785–98.
Ministry of External Affairs. 2004. “Report of the High Level Committee on the Indian Dias-
pora.” New Delhi (http://indiandiaspora.nic.in/contents.htm, Chapter 13).
Qian, June, and Philip Strahan. 2006. “How Laws and Institutions Shape Financial Contracts.”
Wharton Financial Institutions Center, Philadelphia.
Rai, Sarita. 2005. “Indians Find They Can Go Home Again.” New York Times, December 26.

Diffusing and Absorbing Knowledge3
103
Swann, P., P. Temple, and M. Shurmer. 1996. “Standards and Trade Performance: The UK
Experience.” Economic Journal 106: 1297–313.
Vishwasrao, S., and W. Bosshardt. 2001. “Foreign Ownership and Technology Adoption: Evi-
dence from Indian Firms.” Journal of Development Economics 65 (2): 367–87.
Westphal, Larry, W. Y. Rhee, and Gary Purcell. 1981. “Korean Industrial Competence: Where It
Came From.” Staff Working Paper No. 469, World Bank, Washington, DC.
World Bank. 2006a. Doing Business 2007: How to Reform. Washington, DC.
———. 2006b. World Development Indicators 2006. Washington, DC.

105
A cross-cutting, multipronged strategy is needed to make India’s innovation system
better meet the needs of the common people. Most discussion on India’s innovation
system focuses on formal research and development (R&D) efforts and the formal
part of the economy. However, India is an extremely heterogeneous economy, and
most of its population operates in the informal sector. Given the rising divergence
between productivity in agriculture and in knowledge-intensive professional sectors
such as information and communication technology (ICT) and finance, and the
economy’s inability to sufficiently absorb migrants from the agricultural sector and
new entrants to the labor force, income inequality will likely increase. This has been
the trend in most other economies—especially fast-growing ones. Inequality is also
likely to worsen unless special efforts are made to address the needs of the poor.
This chapter outlines some mechanisms to support innovation efforts that can
help improve the productivity and livelihoods of people in India’s vast informal
economy. Much of the knowledge and technology needed to achieve the Millennium
Development Goals (MDGs) already exists. Much is known about basic nutri-
tion, sanitation, preventive medicine, environmentally friendly technologies, cheap
mobile phones, and the like. But poor people’s needs are broader than the few listed
and monitored as part of the MDGs, and further innovation is required to improve
delivery of a wide range of public services. Far more needs to be done on preventive
medicine, clean water, education, and other public services that can benefit from
harnessing collaborative efforts of formal creation efforts for the poor. What is
needed is not only to reduce the costs and increase the availability of goods and
services needed by the poor, but more important, to open up sustainable livelihood
and productive income-generating opportunities for the poor.
Poor people’s innovative ability is constrained by, among other things, insuffi-
ciently developed skills, inadequate public services, and an inability to access markets
and assets on fair terms and handle associated risks. Enhancing skills through better
Promoting Inclusive InnovationAnuja Utz and Carl Dahlman
Chapter 4
106
Anuja Utz and Carl Dahlman4
delivery of basic training for the informal sector is discussed in chapter 5. How inno-
vation through access to new and existing technology can help create more and
better-paying jobs for enterprises that the poor work in or run has not received
enough attention, and is a major focus of this chapter. In addition to strengthening
poor people’s capabilities, solutions will involve strengthening incentives, policies,
and institutions. Part of the solution will be in stronger institutional infrastructure.
In addition to closer collaboration between public R&D entities, industry, universi-
ties, nongovernmental organizations (NGOs), and global networks to better meet the
needs of the poor, the poor could gain by organizing themselves in groups. In
Andhra Pradesh, community-based development initiatives have led self-help
groups to develop mutual insurance schemes, lending and savings operations, and
marketing strategies for new agricultural products. Although this chapter illustrates
the potential of new and existing technologies in opening up some of these oppor-
tunities, a lot more needs to be done.
Harnessing Formal Creation Efforts for the Poor
A first approach to promoting inclusive innovation is for India to harness, increase,
and redirect formal creation efforts to better meet the needs of the economically
weaker sections of Indian society. The main recommendation of this section is to
create incentives for pro-poor early-stage technology development (ESTD) and
commercialization by the formal sector, possibly by providing more preferential
matching grants to collaborations among public R&D entities, industry, universities,
NGOs, and global poverty alleviation networks.
Agricultural R&D as Inspiration
India’s green revolution is the foremost example of harnessing formal creation
efforts for achieving national self-sufficiency in food grains. Over the past four
decades, the green revolution has significantly improved India’s food security and
reduced rural poverty. It has included investments in technology, largely comprising
high-yielding seed varieties (initially of wheat and later rice), chemical fertilizers, and
agricultural research and extension—aided by public investments in supporting
infrastructure (irrigation, roads, market institutions) and price incentives that have
encouraged wheat and rice production.
Although India’s agriculture faces many challenges, it also has great technological
opportunities. There is huge untapped potential for augmenting value chains in
agriculture through crop diversification and forward and backward linkages, includ-
ing post-harvest handling and processing. First, the rich diversity of agro-ecosystems
is a source of sustainable growth for the sector. Second, joint ventures between pub-
lic research institutes and the private sector are seen more favorably today. Such part-
nerships could considerably augment R&D efforts. Third, agriculture can develop
value chain processing activities in rural areas to meet the changing pattern of food
demand in the country and to tap international markets. Fourth, crop diversification
has become a potential source of agricultural growth, creating new export and
employment opportunities. Fifth, livestock, fishery, and horticulture are emerging as
important sunrise sectors. Because most livestock is owned by small and marginal
farmers and landless households in rural areas, the rapid growth of these sectors
benefits poor households.
Agricultural R&D is crucial to generating additional income and employment for
the poor. Given the limited scope for expanding agricultural areas, increases in pro-
ductivity, profitability, and competitiveness will be the main sources of agricultural
growth—led or triggered by innovations and applications of science in agriculture. In
other words, Indian agriculture will shift from resource- and input-based growth to
knowledge- and science-based growth. Flows of knowledge and innovations play a
critical role in this paradigm shift. R&D assumes more importance because it is a cost-
effective way of promoting sustainability and increasing competitiveness. To attain
global competitiveness, more attention should be given to harnessing advances in fron-
tier sciences in priority areas. Thus, support for basic and strategic research is critical.
The consortia emerging between research entities and the private sector being pro-
moted by the National Agricultural Innovation Project are a direction worth pursuing.
Building on Public R&D and University-Enabled Initiatives
India’s large, diverse public R&D infrastructure has the potential to address more of
the problems of the poor. As noted in chapter 2, the bulk of India’s public R&D infra-
structure is mission oriented to defense, space, and energy, with much less applied to
problems of agriculture, industry, and health. Much more can be done to orient the
considerable capabilities of this large public research system to address the needs and
problems of the poor. Some of this harnessing is occurring in mission-oriented pro-
grams such as space, and a number of initiatives are under way in biotechnology,
medicine, and industrial R&D (box 4.1).
The Council of Scientific and Industrial Research’s (CSIR’s) development of tech-
nology applications for rural India is a candidate for expansion, with the need for
greater emphasis on commercialization (CSIR 2004). CSIR has been increasingly
concentrating on a people-oriented development and delivery approach. CSIR labs,
for example, have been instrumental in reviving India’s world-famous handmade
blue pottery, with research leading to product and quality improvements and prod-
uct diversification—enabling this ailing traditional industry to find new life and
extended markets outside India. Another example is technology to desalinate water
using reverse osmosis. CSIR labs have also been designing multichannel ceramic
membrane with optimum channel configuration to upgrade technology for purify-
ing arsenic contamination in groundwater. CSIR has also been working on herbal
products, mint oil (from the Central Institute of Medicinal and Aromatic Plants,
Lucknow), food processing technologies, leather processing technology, and more.
Although it has developed many pro-poor products and technologies, its transfer
and commercialization have been weak.
Promoting Inclusive Innovation4
107
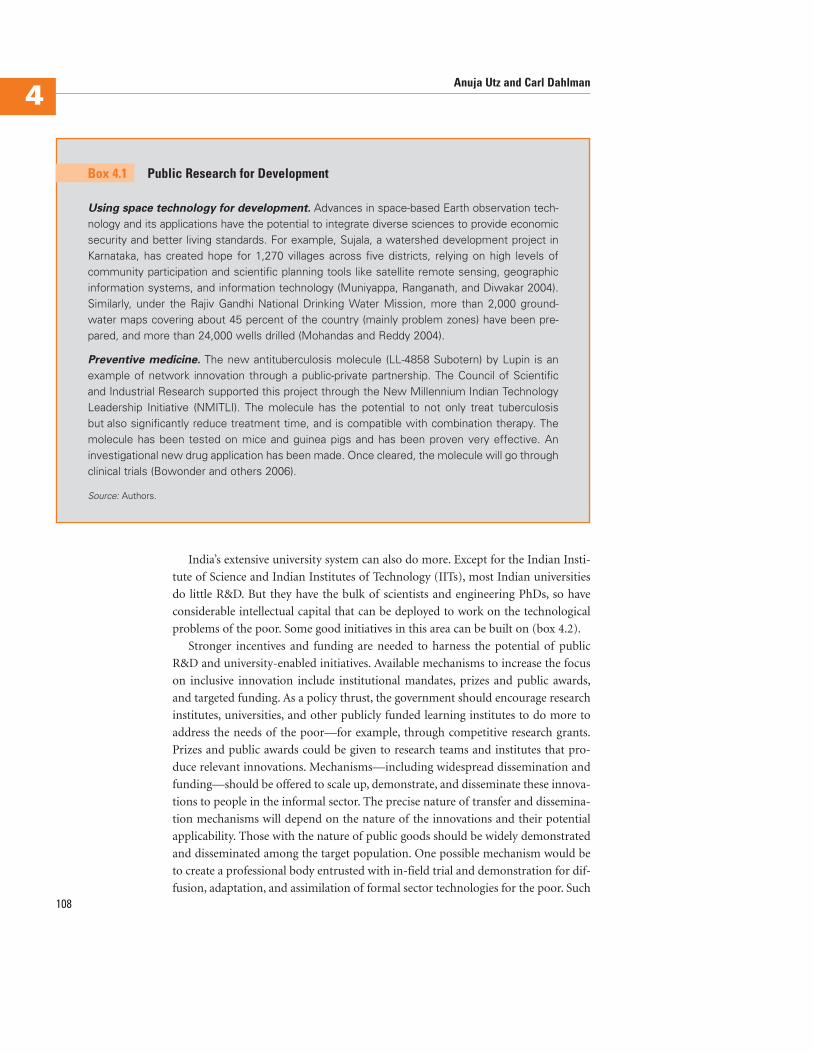
India’s extensive university system can also do more. Except for the Indian Insti-
tute of Science and Indian Institutes of Technology (IITs), most Indian universities
do little R&D. But they have the bulk of scientists and engineering PhDs, so have
considerable intellectual capital that can be deployed to work on the technological
problems of the poor. Some good initiatives in this area can be built on (box 4.2).
Stronger incentives and funding are needed to harness the potential of public
R&D and university-enabled initiatives. Available mechanisms to increase the focus
on inclusive innovation include institutional mandates, prizes and public awards,
and targeted funding. As a policy thrust, the government should encourage research
institutes, universities, and other publicly funded learning institutes to do more to
address the needs of the poor—for example, through competitive research grants.
Prizes and public awards could be given to research teams and institutes that pro-
duce relevant innovations. Mechanisms—including widespread dissemination and
funding—should be offered to scale up, demonstrate, and disseminate these innova-
tions to people in the informal sector. The precise nature of transfer and dissemina-
tion mechanisms will depend on the nature of the innovations and their potential
applicability. Those with the nature of public goods should be widely demonstrated
and disseminated among the target population. One possible mechanism would be
to create a professional body entrusted with in-field trial and demonstration for dif-
fusion, adaptation, and assimilation of formal sector technologies for the poor. Such108
Anuja Utz and Carl Dahlman4
Using space technology for development. Advances in space-based Earth observation tech-nology and its applications have the potential to integrate diverse sciences to provide economicsecurity and better living standards. For example, Sujala, a watershed development project inKarnataka, has created hope for 1,270 villages across five districts, relying on high levels ofcommunity participation and scientific planning tools like satellite remote sensing, geographicinformation systems, and information technology (Muniyappa, Ranganath, and Diwakar 2004).Similarly, under the Rajiv Gandhi National Drinking Water Mission, more than 2,000 ground-water maps covering about 45 percent of the country (mainly problem zones) have been pre-pared, and more than 24,000 wells drilled (Mohandas and Reddy 2004).
Preventive medicine. The new antituberculosis molecule (LL-4858 Subotern) by Lupin is anexample of network innovation through a public-private partnership. The Council of Scientificand Industrial Research supported this project through the New Millennium Indian TechnologyLeadership Initiative (NMITLI). The molecule has the potential to not only treat tuberculosisbut also significantly reduce treatment time, and is compatible with combination therapy. Themolecule has been tested on mice and guinea pigs and has been proven very effective. Aninvestigational new drug application has been made. Once cleared, the molecule will go throughclinical trials (Bowonder and others 2006).
Source: Authors.
Box 4.1 Public Research for Development
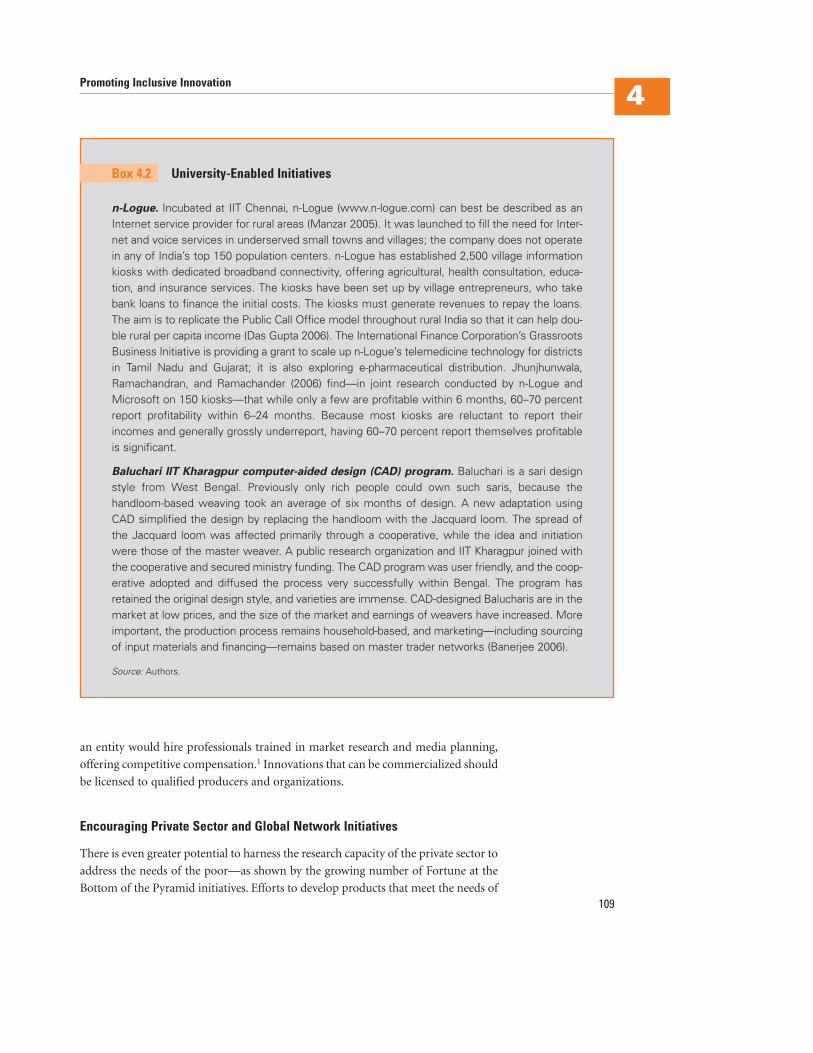
an entity would hire professionals trained in market research and media planning,
offering competitive compensation.1 Innovations that can be commercialized should
be licensed to qualified producers and organizations.
Encouraging Private Sector and Global Network Initiatives
There is even greater potential to harness the research capacity of the private sector to
address the needs of the poor—as shown by the growing number of Fortune at the
Bottom of the Pyramid initiatives. Efforts to develop products that meet the needs of
Promoting Inclusive Innovation4
109
n-Logue. Incubated at IIT Chennai, n-Logue (www.n-logue.com) can best be described as anInternet service provider for rural areas (Manzar 2005). It was launched to fill the need for Inter-net and voice services in underserved small towns and villages; the company does not operatein any of India’s top 150 population centers. n-Logue has established 2,500 village informationkiosks with dedicated broadband connectivity, offering agricultural, health consultation, educa-tion, and insurance services. The kiosks have been set up by village entrepreneurs, who takebank loans to finance the initial costs. The kiosks must generate revenues to repay the loans.The aim is to replicate the Public Call Office model throughout rural India so that it can help dou-ble rural per capita income (Das Gupta 2006). The International Finance Corporation’s GrassrootsBusiness Initiative is providing a grant to scale up n-Logue’s telemedicine technology for districtsin Tamil Nadu and Gujarat; it is also exploring e-pharmaceutical distribution. Jhunjhunwala,Ramachandran, and Ramachander (2006) find—in joint research conducted by n-Logue andMicrosoft on 150 kiosks—that while only a few are profitable within 6 months, 60–70 percentreport profitability within 6–24 months. Because most kiosks are reluctant to report theirincomes and generally grossly underreport, having 60–70 percent report themselves profitableis significant.
Baluchari IIT Kharagpur computer-aided design (CAD) program. Baluchari is a sari designstyle from West Bengal. Previously only rich people could own such saris, because thehandloom-based weaving took an average of six months of design. A new adaptation usingCAD simplified the design by replacing the handloom with the Jacquard loom. The spread ofthe Jacquard loom was affected primarily through a cooperative, while the idea and initiationwere those of the master weaver. A public research organization and IIT Kharagpur joined withthe cooperative and secured ministry funding. The CAD program was user friendly, and the coop-erative adopted and diffused the process very successfully within Bengal. The program hasretained the original design style, and varieties are immense. CAD-designed Balucharis are in themarket at low prices, and the size of the market and earnings of weavers have increased. Moreimportant, the production process remains household-based, and marketing—including sourcingof input materials and financing—remains based on master trader networks (Banerjee 2006).
Source: Authors.
Box 4.2 University-Enabled Initiatives
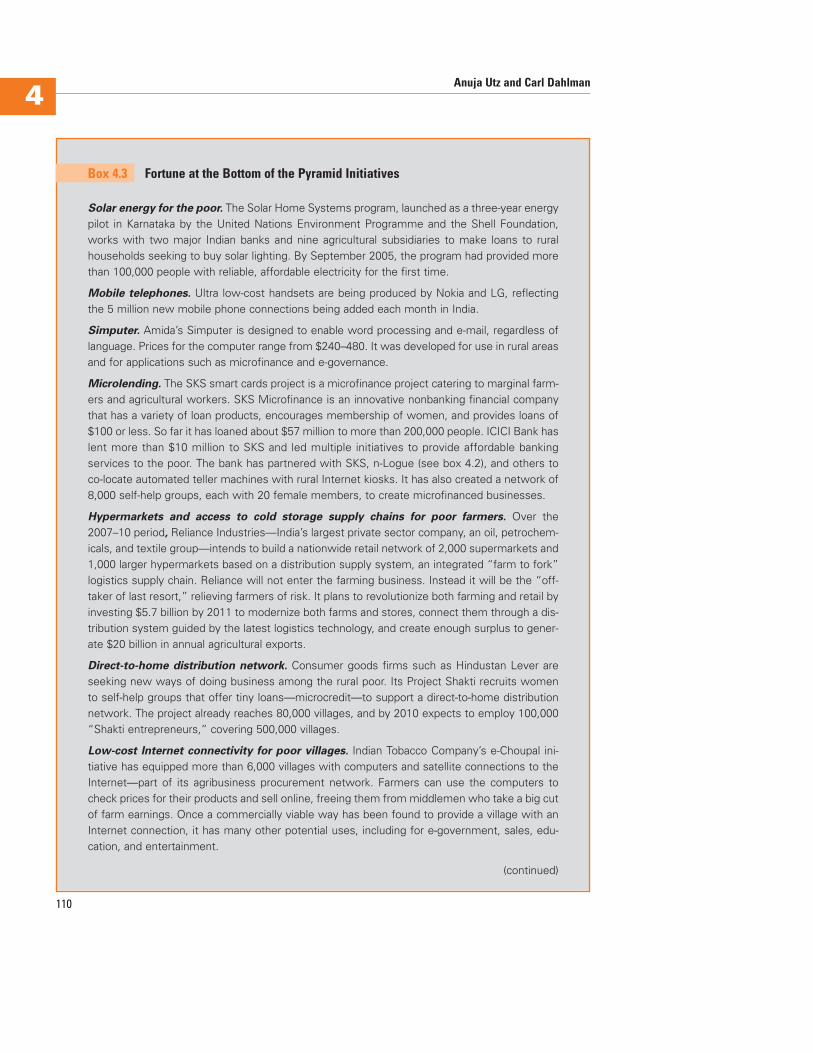
Solar energy for the poor. The Solar Home Systems program, launched as a three-year energypilot in Karnataka by the United Nations Environment Programme and the Shell Foundation,works with two major Indian banks and nine agricultural subsidiaries to make loans to ruralhouseholds seeking to buy solar lighting. By September 2005, the program had provided morethan 100,000 people with reliable, affordable electricity for the first time.
Mobile telephones. Ultra low-cost handsets are being produced by Nokia and LG, reflectingthe 5 million new mobile phone connections being added each month in India.
Simputer. Amida’s Simputer is designed to enable word processing and e-mail, regardless oflanguage. Prices for the computer range from $240–480. It was developed for use in rural areasand for applications such as microfinance and e-governance.
Microlending. The SKS smart cards project is a microfinance project catering to marginal farm-ers and agricultural workers. SKS Microfinance is an innovative nonbanking financial companythat has a variety of loan products, encourages membership of women, and provides loans of$100 or less. So far it has loaned about $57 million to more than 200,000 people. ICICI Bank haslent more than $10 million to SKS and led multiple initiatives to provide affordable bankingservices to the poor. The bank has partnered with SKS, n-Logue (see box 4.2), and others toco-locate automated teller machines with rural Internet kiosks. It has also created a network of8,000 self-help groups, each with 20 female members, to create microfinanced businesses.
Hypermarkets and access to cold storage supply chains for poor farmers. Over the2007–10 period, Reliance Industries—India’s largest private sector company, an oil, petrochem-icals, and textile group—intends to build a nationwide retail network of 2,000 supermarkets and1,000 larger hypermarkets based on a distribution supply system, an integrated “farm to fork”logistics supply chain. Reliance will not enter the farming business. Instead it will be the “off-taker of last resort,” relieving farmers of risk. It plans to revolutionize both farming and retail byinvesting $5.7 billion by 2011 to modernize both farms and stores, connect them through a dis-tribution system guided by the latest logistics technology, and create enough surplus to gener-ate $20 billion in annual agricultural exports.
Direct-to-home distribution network. Consumer goods firms such as Hindustan Lever areseeking new ways of doing business among the rural poor. Its Project Shakti recruits womento self-help groups that offer tiny loans—microcredit—to support a direct-to-home distributionnetwork. The project already reaches 80,000 villages, and by 2010 expects to employ 100,000“Shakti entrepreneurs,” covering 500,000 villages.
Low-cost Internet connectivity for poor villages. Indian Tobacco Company’s e-Choupal ini-tiative has equipped more than 6,000 villages with computers and satellite connections to theInternet—part of its agribusiness procurement network. Farmers can use the computers tocheck prices for their products and sell online, freeing them from middlemen who take a big cutof farm earnings. Once a commercially viable way has been found to provide a village with anInternet connection, it has many other potential uses, including for e-government, sales, edu-cation, and entertainment.
(continued)
Box 4.3 Fortune at the Bottom of the Pyramid Initiatives
110
Anuja Utz and Carl Dahlman4
the poor and underserved—while also creating viable business propositions—need
to be pursued more systematically. As argued by Prahalad (2004), large companies
can use their considerable technological, organizational, and marketing capabilities
to create and deliver products and services for people at the bottom of the economic
pyramid—those with incomes of less than $2 a day—and make a profit doing so
(box 4.3).2
Global networks provide another source of formal R&D to meet the needs of
the poor. The best known of international public goods R&D efforts is the Consul-
tative Group for International Agricultural Research (CGIAR), which was behind the
green revolution. There are also major initiatives in medicine and pharmaceuticals,
environment, and other areas in which India should continue to participate, such as
in the Global Research Alliance (box 4.4).
The government should consider allocating more funds to encourage formal cre-
ation and commercialization efforts that focus on the challenges facing the poor. It
could establish a pilot Inclusive Innovation Fund to support formal R&D by public
R&D entities, the private sector, universities, and NGOs aimed at the needs of the
informal sector, on a matching grant basis. These initiatives should be subject to con-
tinuous monitoring and evaluation. If successful, in the long term the government
should earmark a small percentage of the federal public R&D budget to support an
Inclusive Innovation Fund on a recurring basis—the funding should cover scaling
up, piloting, testing, and taking to the market. Competition for scarce funds would
be driven by transparent eligibility and evaluation criteria.
Initiatives should focus on the underserved community—the more than 800
million Indians living on less than $2 a day. An additional incentive is that many
solutions developed for poor Indians would also be applicable for the 4–5 billion
poor people worldwide. Thus, firms can develop and pilot in India products and
services that then may be marketed globally. In addition, the government could pro-
vide financial incentives and awards to research teams, institutes, and universities
that produce relevant innovations, as well as dissemination and funding mecha-
nisms to scale up, demonstrate, and disseminate innovations to people in the infor-
mal sector.
Promoting Inclusive Innovation4
111
Drishtee.com. This initiative delivers fee-based e-governance, education, commerce, andinsurance services to rural populations in northern and northeastern India. These services aredelivered through more than 700 kiosks owned and operated by local entrepreneurs. The Inter-national Finance Corporation’s Grassroots Business Initiative is providing Drishtee with a grantto establish 50 new kiosks in Meerut, Uttar Pradesh.
Sources: Usher 2003; Shell Foundation 2003; Tata 2007; Economist 2005a, 2005b, 2005c, 2006; Sharma 2004;Bellman 2006; Prahalad 2004; Moreau and Mazumdar 2006.
Box 4.3 continued
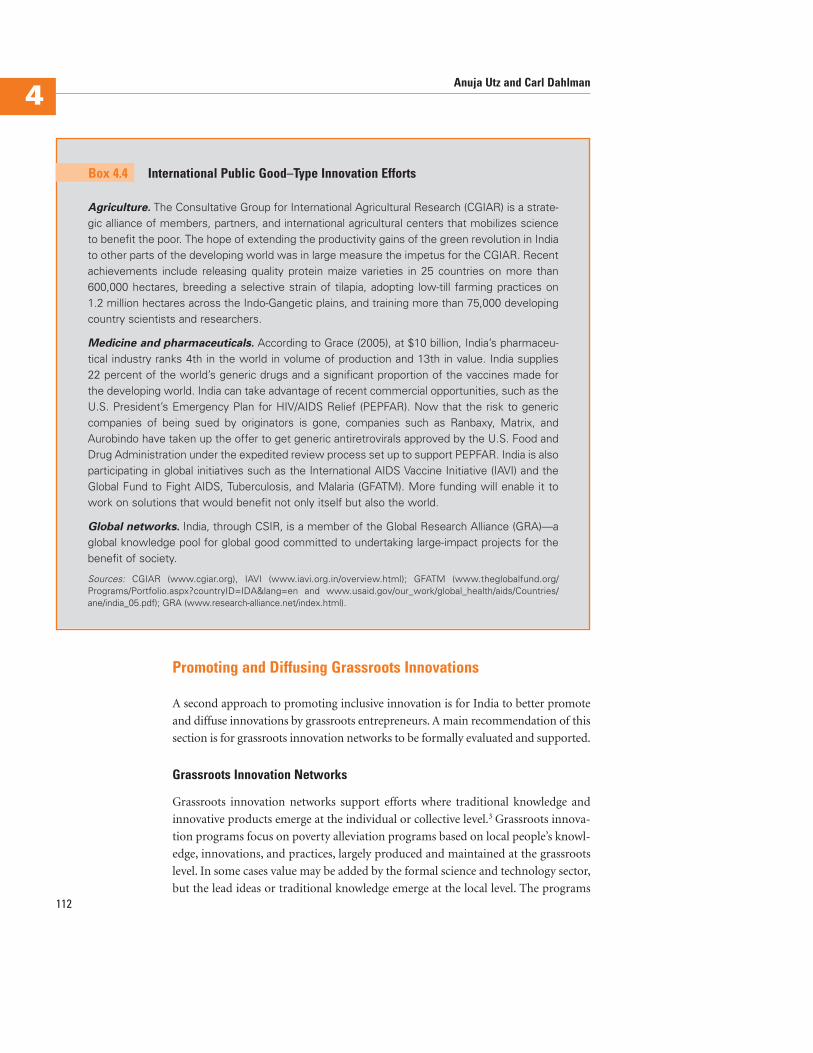
Promoting and Diffusing Grassroots Innovations
A second approach to promoting inclusive innovation is for India to better promote
and diffuse innovations by grassroots entrepreneurs. A main recommendation of this
section is for grassroots innovation networks to be formally evaluated and supported.
Grassroots Innovation Networks
Grassroots innovation networks support efforts where traditional knowledge and
innovative products emerge at the individual or collective level.3 Grassroots innova-
tion programs focus on poverty alleviation programs based on local people’s knowl-
edge, innovations, and practices, largely produced and maintained at the grassroots
level. In some cases value may be added by the formal science and technology sector,
but the lead ideas or traditional knowledge emerge at the local level. The programs112
Anuja Utz and Carl Dahlman4
Agriculture. The Consultative Group for International Agricultural Research (CGIAR) is a strate-gic alliance of members, partners, and international agricultural centers that mobilizes scienceto benefit the poor. The hope of extending the productivity gains of the green revolution in Indiato other parts of the developing world was in large measure the impetus for the CGIAR. Recentachievements include releasing quality protein maize varieties in 25 countries on more than600,000 hectares, breeding a selective strain of tilapia, adopting low-till farming practices on1.2 million hectares across the Indo-Gangetic plains, and training more than 75,000 developingcountry scientists and researchers.
Medicine and pharmaceuticals. According to Grace (2005), at $10 billion, India’s pharmaceu-tical industry ranks 4th in the world in volume of production and 13th in value. India supplies22 percent of the world’s generic drugs and a significant proportion of the vaccines made forthe developing world. India can take advantage of recent commercial opportunities, such as theU.S. President’s Emergency Plan for HIV/AIDS Relief (PEPFAR). Now that the risk to genericcompanies of being sued by originators is gone, companies such as Ranbaxy, Matrix, andAurobindo have taken up the offer to get generic antiretrovirals approved by the U.S. Food andDrug Administration under the expedited review process set up to support PEPFAR. India is alsoparticipating in global initiatives such as the International AIDS Vaccine Initiative (IAVI) and theGlobal Fund to Fight AIDS, Tuberculosis, and Malaria (GFATM). More funding will enable it towork on solutions that would benefit not only itself but also the world.
Global networks. India, through CSIR, is a member of the Global Research Alliance (GRA)—aglobal knowledge pool for global good committed to undertaking large-impact projects for thebenefit of society.
Sources: CGIAR (www.cgiar.org), IAVI (www.iavi.org.in/overview.html); GFATM (www.theglobalfund.org/Programs/Portfolio.aspx?countryID=IDA&lang=en and www.usaid.gov/our_work/global_health/aids/Countries/ane/india_05.pdf); GRA (www.research-alliance.net/index.html).
Box 4.4 International Public Good–Type Innovation Efforts
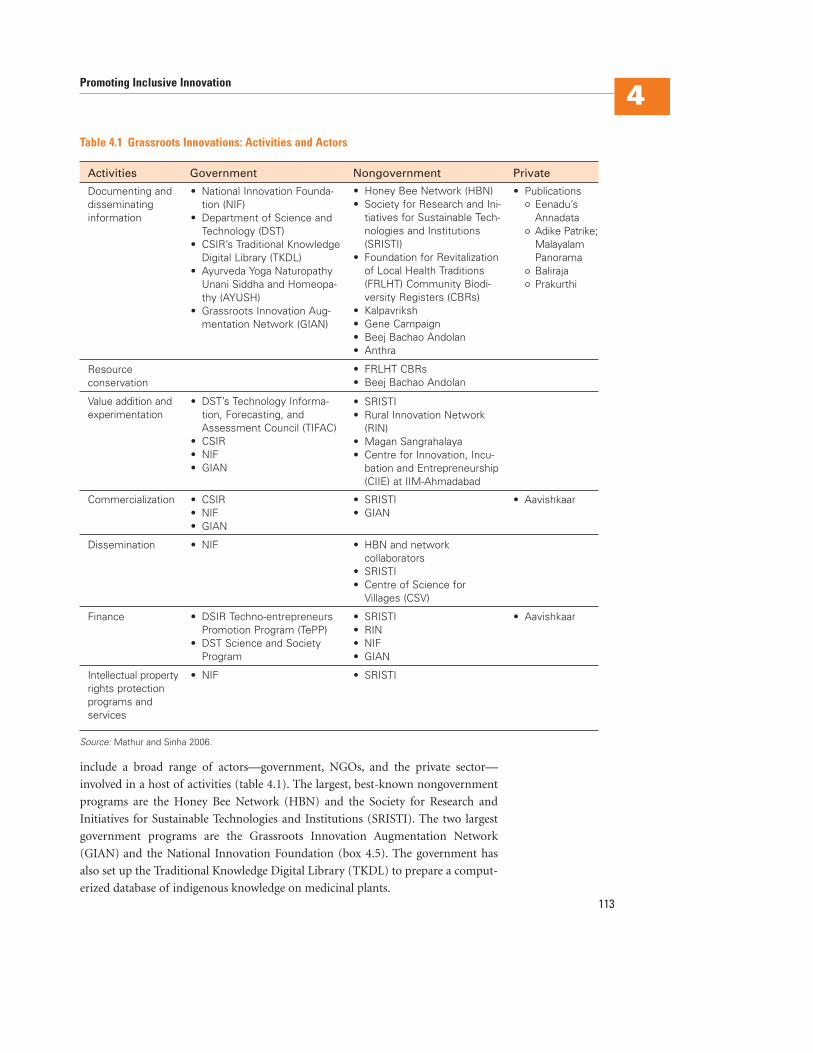
include a broad range of actors—government, NGOs, and the private sector—
involved in a host of activities (table 4.1). The largest, best-known nongovernment
programs are the Honey Bee Network (HBN) and the Society for Research and
Initiatives for Sustainable Technologies and Institutions (SRISTI). The two largest
government programs are the Grassroots Innovation Augmentation Network
(GIAN) and the National Innovation Foundation (box 4.5). The government has
also set up the Traditional Knowledge Digital Library (TKDL) to prepare a comput-
erized database of indigenous knowledge on medicinal plants.
Promoting Inclusive Innovation4
113
Table 4.1 Grassroots Innovations: Activities and Actors
Activities Government Nongovernment Private
Documenting anddisseminatinginformation
Resourceconservation
Value addition andexperimentation
• National Innovation Founda-tion (NIF)
• Department of Science andTechnology (DST)
• CSIR’s Traditional KnowledgeDigital Library (TKDL)
• Ayurveda Yoga NaturopathyUnani Siddha and Homeopa-thy (AYUSH)
• Grassroots Innovation Aug-mentation Network (GIAN)
• DST’s Technology Informa-tion, Forecasting, andAssessment Council (TIFAC)
• CSIR• NIF• GIAN
• Honey Bee Network (HBN)• Society for Research and Ini-
tiatives for Sustainable Tech-nologies and Institutions(SRISTI)
• Foundation for Revitalizationof Local Health Traditions(FRLHT) Community Biodi-versity Registers (CBRs)
• Kalpavriksh• Gene Campaign• Beej Bachao Andolan• Anthra
• FRLHT CBRs• Beej Bachao Andolan
• SRISTI• Rural Innovation Network
(RIN)• Magan Sangrahalaya• Centre for Innovation, Incu-
bation and Entrepreneurship(CIIE) at IIM-Ahmadabad
• PublicationsEenadu’s AnnadataAdike Patrike;MalayalamPanoramaBalirajaPrakurthi
Commercialization
Dissemination
Finance
Intellectual propertyrights protectionprograms and services
• CSIR• NIF• GIAN
• NIF
• DSIR Techno-entrepreneursPromotion Program (TePP)
• DST Science and SocietyProgram
• NIF
• SRISTI• GIAN
• HBN and network collaborators
• SRISTI• Centre of Science for
Villages (CSV)
• SRISTI• RIN• NIF• GIAN
• SRISTI
• Aavishkaar
• Aavishkaar
Source: Mathur and Sinha 2006.
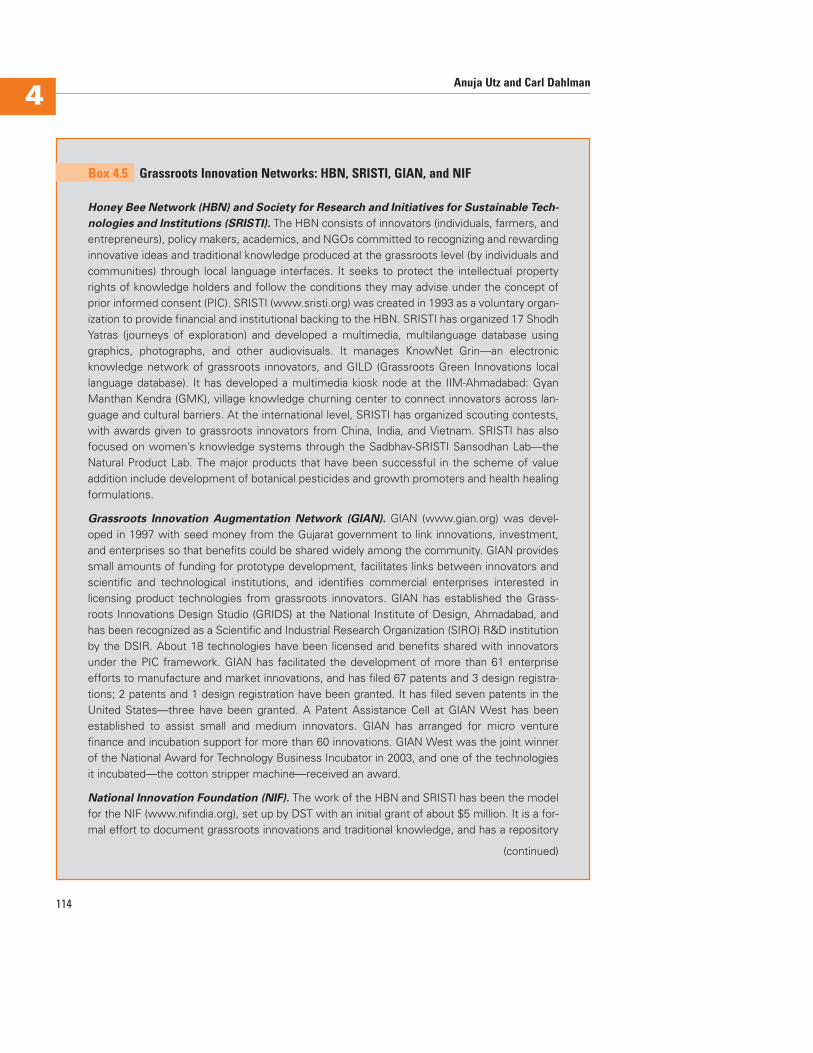
114
Anuja Utz and Carl Dahlman4
Honey Bee Network (HBN) and Society for Research and Initiatives for Sustainable Tech-
nologies and Institutions (SRISTI). The HBN consists of innovators (individuals, farmers, andentrepreneurs), policy makers, academics, and NGOs committed to recognizing and rewardinginnovative ideas and traditional knowledge produced at the grassroots level (by individuals andcommunities) through local language interfaces. It seeks to protect the intellectual propertyrights of knowledge holders and follow the conditions they may advise under the concept ofprior informed consent (PIC). SRISTI (www.sristi.org) was created in 1993 as a voluntary organ-ization to provide financial and institutional backing to the HBN. SRISTI has organized 17 ShodhYatras (journeys of exploration) and developed a multimedia, multilanguage database usinggraphics, photographs, and other audiovisuals. It manages KnowNet Grin—an electronicknowledge network of grassroots innovators, and GILD (Grassroots Green Innovations locallanguage database). It has developed a multimedia kiosk node at the IIM-Ahmadabad: GyanManthan Kendra (GMK), village knowledge churning center to connect innovators across lan-guage and cultural barriers. At the international level, SRISTI has organized scouting contests,with awards given to grassroots innovators from China, India, and Vietnam. SRISTI has alsofocused on women’s knowledge systems through the Sadbhav-SRISTI Sansodhan Lab—theNatural Product Lab. The major products that have been successful in the scheme of valueaddition include development of botanical pesticides and growth promoters and health healingformulations.
Grassroots Innovation Augmentation Network (GIAN). GIAN (www.gian.org) was devel-oped in 1997 with seed money from the Gujarat government to link innovations, investment,and enterprises so that benefits could be shared widely among the community. GIAN providessmall amounts of funding for prototype development, facilitates links between innovators andscientific and technological institutions, and identifies commercial enterprises interested inlicensing product technologies from grassroots innovators. GIAN has established the Grass-roots Innovations Design Studio (GRIDS) at the National Institute of Design, Ahmadabad, andhas been recognized as a Scientific and Industrial Research Organization (SIRO) R&D institutionby the DSIR. About 18 technologies have been licensed and benefits shared with innovatorsunder the PIC framework. GIAN has facilitated the development of more than 61 enterpriseefforts to manufacture and market innovations, and has filed 67 patents and 3 design registra-tions; 2 patents and 1 design registration have been granted. It has filed seven patents in theUnited States—three have been granted. A Patent Assistance Cell at GIAN West has beenestablished to assist small and medium innovators. GIAN has arranged for micro venturefinance and incubation support for more than 60 innovations. GIAN West was the joint winnerof the National Award for Technology Business Incubator in 2003, and one of the technologiesit incubated—the cotton stripper machine—received an award.
National Innovation Foundation (NIF). The work of the HBN and SRISTI has been the modelfor the NIF (www.nifindia.org), set up by DST with an initial grant of about $5 million. It is a for-mal effort to document grassroots innovations and traditional knowledge, and has a repository
Box 4.5 Grassroots Innovation Networks: HBN, SRISTI, GIAN, and NIF
(continued)
Promoting Inclusive Innovation4
115
Although there has been a lot of activity on grassroots innovations, there has not
been much assessment or quantification of how they have contributed to improving
the livelihoods of people in the informal sector. What little evaluation has been done
mostly lists activities and number of innovations. There is virtually no information
on costs or impacts of the innovations, though there have been many and some have
even been licensed in India and abroad. Conceptually there are some models for pro-
moting inclusive innovations (box 4.6).
Grassroots innovations face five main challenges: high transaction costs of scout-
ing and documentation, need for value addition, need for commercialization, need
for finance, and unclear intellectual property rights (IPR). High transaction costs
of more than 50,000 practices. It received a Micro Venture Innovation Fund (MVIF) of about$1 million with the help of SIDBI (Small Industries Development Bank of India), but so far it hasdisbursed only about $54,000. The MVIF has made availability of risk capital a bit easier, butthere remains a gap with the lack of the establishment of a dedicated fund for product devel-opment. Of the tens of thousands of grassroots innovations and traditional knowledge prod-ucts scouted by NIF, few have been incubated. Ideally, NIF should plan to incubate at least2,000 projects to obtain 20–30 major products—of which 2 or 3 may achieve major success.
Source: Mathur and Sinha 2006.
Box 4.5 continued
• Grants can be provided for technical assistance to support scouting and documentation,value addition, prototype development, and diffusion.
• For commercialization, government could provide matching grants. This could be part of thewindow of the fund of funds (see chapter 7), where the government can require certainactivities (such as investing in pro-poor innovations, spin-offs from R&D labs, and so on) inexchange for the funding.
• The government could also use procurement to promote inclusive innovations—for exam-ple, by specifying goods and services for the poor and encouraging competitive bidding toproduce them, thereby generating a market.
• Finally, Bottom of the Pyramid initiatives already under way should be encouraged to achievethe right scale.
Source: Authors.
Box 4.6 Models for Promoting Inclusive Innovations
are inevitable in programs that support a large number of widely scattered informal
innovators who have accumulated knowledge from years of trial and error, or incre-
mental innovations in existing tools or agricultural practices. What is needed is good
monitoring and evaluation to support grassroots innovations considered to be mak-
ing positive contributions by a new pilot-inclusive innovation fund.
High Transaction Costs of Scouting and Documentation
Possible remedies, relying mainly on existing networks, include the following:
• Developing special campaigns through microcredit associations, innovator asso-
ciations, and GIAN to scout traditional knowledge, pool best practices, and take
products to the market
• Using radio and other media to expand the reach of the HBN and institutional-
izing Village Knowledge Registers (such as plant breeders’ rights) that would not
be restricted to biodiversity knowledge
• Replicating the Shodh Yatras, Shodh Sankals, and Prayog Pariwar networks
throughout the country
• Building more multimedia, multilanguage databases (like that developed by
SRISTI; see box 4.5) on innovations and traditional knowledge in local languages.
Need for Value Addition
Most grassroots innovations are still at an early stage of indicating that something
might work (such as in herbal medicine) or a minor improvement might emerge—
both of which require much more analysis and testing to improve the value of the
innovations. However, there are few facilities or labs to do such analysis, validation,
and testing.4 Even where available, they are most likely beyond the financial means of
grassroots innovators. Furthermore, as with most innovations, there is a need not
only to make technical improvements, but also to do demonstrations and test mar-
keting to evaluate the market potential of the innovations, which requires additional
steps and resources and can be expensive. What is needed is the following:
• Develop a nationwide strategic plan to add value in local knowledge, innovations,
and practices through contractual arrangements with public and private R&D
institutions. This includes support for SRISTI’s think tank—the Academy for
Augmenting Sustainable Technological Inventions, Innovations, and Traditional
Knowledge.
• Establish community farms where traditional knowledge holders can do experi-
ments and demonstrate their technologies.
• Build national and regional technology networks for specific problems. Invest-
ments are needed to identify experts willing to offer their services at different
terms (ranging from voluntary to deferred or upfront payments). Incentives must
be created for their time-bound availability at the sites of innovators.
116
Anuja Utz and Carl Dahlman4
• Use ICT to facilitate communication among network members. A revamped por-
tal like www.Indiainnovates.com can provide an online value addition and incu-
bation platform.
• Develop common fabrication laboratories and testing centers for faster validation.
• Link up with the 100,000 Internet-enabled Common Services Centers being set
up by the Department of Information Technology to extend the reach of grass-
roots innovations.
Need for More Effective Commercialization
Two types of diffusion and dissemination efforts are required for commercialization.
Most innovations are simple and low cost (such as a pulley that locks a rope in place
so that the object does not slide back, or a simple agricultural tool), and take the
drudgery out of some work. The cost of diffusing such products is often higher than
the cost of the product itself. But because they are simple, low cost, and easy to repli-
cate, such products can have large social impacts on the livelihoods and quality of life
of marginalized sections of society. Diffusion of these types of innovations requires
the following:
• Creating awareness of them through the media, and publicizing results of trials
and demonstrations
• Networking with NGOs and other actors with outreach to communities, build-
ing feedback loops for adoption
• Creating a national fund to acquire rights to such technologies
• Contributing resources to support diffusion of open source public domain tech-
nologies (social technologies), governed by the prior informed consent (PIC) of
the knowledge holders, communities, and individuals.
Other types of innovations are more complex and expensive, but they can raise
productivity and increase competitiveness (such as a cotton-stripping motorcycle,
cycle-based plow, or bamboo-splitting machine). Diffusing these will require
explicit efforts to scale up for industrial production and significant marketing and
commercialization efforts. Such efforts will require developing technology clearing-
houses and exchanges to link grassroots innovators, investors, and entrepreneurs, as
well as incubators such as GIAN to do market research, develop business plans, and
source micro venture capital or risk capital to support innovators in becoming
entrepreneurs. This could lead to a global GIAN that provides incubation support
to people across the world.
Need for Financing Commercialization
Finally, even for innovations sufficiently developed to be commercialized, their
industrial production and distribution need financing. This can be more expensive
than the earlier stages, and it is difficult for grassroots innovators to get financing for
this step (see chapter 7). Recommendations include establishing a fund for new
Promoting Inclusive Innovation4
117
grassroots products and processes ready for commercialization, the terms of which
could be softer than regular commercial financing. It is important that grassroots
innovators learn about commercial principles. It is also important to learn from
e-Choupal, Drishtee.com, and other initiatives on sharing information among
potential private investors to set up venture funds or extend credit facilities for such
commercialization (see box 4.3).
Pro-Poor Intellectual Property Rights
How can India deliver the benefits of IPR to poor citizens living traditional
lifestyles? Any attempt to craft a traditional knowledge IPR framework that rewards
functional knowledge from traditional communities will require revolutionary
thinking and bold experimentation in both legislation and administration. Advo-
cates of traditional knowledge are often split between their desire to protect secret
knowledge in ways that preserve traditional communities and their desire to lever-
age that knowledge in ways that increase the resources and opportunities available
to those communities. These goals, while both arguably worthy, are mutually exclu-
sive. A pragmatic consideration suggests that preservation is unlikely to succeed.
Commercially valuable secrets are notoriously difficult to preserve. Corporations
that have done so successfully have developed complex, often expensive, proce-
dures. Nothing comparable is possible at the level of traditional knowledge. If India
wants to lead the world in addressing the intellectual property inherent in tradi-
tional knowledge, it must begin by explicitly adopting the goal of compensation.
IPR for traditional knowledge could offer solutions—and challenges. Professor
Anil Gupta, the Executive Vice Chairperson of India’s National Innovation Founda-
tion (NIF), has clearly articulated the challenge of protecting functional IPR for tra-
ditional knowledge (Gupta 2002). Introducing new IPR for traditional knowledge
will both impose immediate administrative costs and increase restrictions on the use
of such knowledge. Thus, a proper analysis of such IPR must justify the system as gen-
erating internal benefits that exceed its costs. Neither India nor the world should
reward possessors of functional traditional knowledge merely for possessing it—but
they should reward those possessors for sharing their knowledge. The basis for the
proposed IPR system for traditional knowledge must thus parallel the basis of the
patent system: possessors of traditional knowledge must put their knowledge into full
public view in exchange for temporary rights, revenues, or both. When that tempo-
rary period ends, the traditional knowledge will become part of the global knowledge
base, freely appropriable by anyone who grasps it—and no longer subject to anyone’s
IPR. Box 4.7 examines possible system structures for traditional knowledge IPR.
Consideration should be given to creating an IPR policy think tank. The govern-
ment of India should charge the proposed policy-oriented think tank with assessing
the costs and benefits associated with individual IPR for traditional knowledge, a
blanket TKDL license, and a voluntary fund. Adoption of any of these approaches,
concurrent with or shortly after the launch of the TKDL, will establish India’s
leadership on this issue, and reinforce its image as a country taking bold, novel
approaches to developing its innovation system, and its burgeoning role as a leading118
Anuja Utz and Carl Dahlman4
player in the global knowledge economy. Recommendations here include complet-
ing work on the library to prevent international patenting of traditional knowledge,
and soliciting further analyses of various approaches toward leveraging traditional
knowledge into revenue streams.
Helping the Informal Sector Better Absorb Knowledge
A third approach to promoting inclusive innovation is for India to help informal
enterprises better absorb existing knowledge. A main recommendation of this sec-
tion is for government programs to more effectively promote knowledge absorption
in the productive sector and extend the reach of markets to the common man.
Promoting Inclusive Innovation4
119
Possibility 1. Develop a direct national traditional knowledge analog to the patent system. This“equitable” proposal places possessors of traditional and nontraditional knowledge on footingsas equal as possible. This proposal raises many challenges, including establishing rules for pub-lishing traditional knowledge to share knowledge with the world, circumscribing classes ofideas that qualify as traditional knowledge, defining “items” of traditional knowledge, deter-mining an appropriate length for IPR for traditional knowledge (beyond which the publishedknowledge enters the public domain), identifying “owners” for each item of traditional knowl-edge, setting and publishing “reasonable and nondiscriminatory” licensing terms (includingboth prices and rights), designating conservators, specifying appropriate outlays for moneys col-lected, designating enforcers, and defining penalties for noncompliance or infringement, anddrafting international cooperation treaties in the likely event of noncompliant multinational cor-porations (MNCs). A variant is an international direct traditional knowledge analog to the patentsystem. This proposal eases many coordination problems, but risks holding the entire venturehostage to international intransigence.
Possibility 2. Institute a blanket license for traditional knowledge IPR. This reduces the com-plexity of systemic administration and eliminates many direct incentives for innovation, but it mayleave enough to spur volunteer or NGO efforts on collection and cataloging. However, it does notreally address challenges in international coordination, enforcement, and distribution.
Possibility 3. Establish a voluntary fund and encourage MNCs to contribute funds related tothe value that they extract from the TKDL. This raises standard problems of free-ridership andthe general limitations of applying moral suasion to business decisions. It is easier to establishand begin quickly, and could lead to larger short-term pools of disbursable money than theother alternatives. It is likely to present the fewest problems of international coordination andparticipation.
Source: Abramson 2007.
Box 4.7 Approaches to Designing Intellectual Property Rights for Traditional Knowledge
Agricultural and Rural Extension Reforms Offer Examples
Traditional, supply-driven public extension systems in agriculture have been
replaced by more flexible, market-sensitive support mechanisms. The green revolu-
tion in India was successful in increasing agricultural output, but by the 1990s the
increased supply of wheat and rice had reduced commodity prices and farm
incomes, and India’s supply-driven extension system could no longer respond effec-
tively to new challenges in agriculture. India’s traditional training and visitation
extension system stopped being effective at roughly the time the country achieved
food security. The system worked well when relatively uniform technological pack-
ages had to be diffused rapidly to large numbers of producers in a short time, as
with improved rice production technologies for irrigation farming. But the
approach was abandoned with changing needs, given its inadequate interaction
with the agricultural research system, inability to attribute benefits, weak account-
ability, and lack of fiscal sustainability (see Anderson, Feder, and Ganguly 2005).
There is a growing realization that a rural development strategy is needed to focus
on increasing farm incomes and rural nonfarm employment. China’s successful
program for developing rural nonfarm opportunities is premised on providing a
flexible, demand-driven package of services—not just technology, but also infor-
mation, technical assistance, marketing, and developing supply networks and sup-
ply chains (box 4.8).
The recent National Agricultural Technology Project has piloted a more market-
oriented extension approach built around demand-driven market assessments,
farmer organizations, and bottom-up governance. In particular, the extension com-
ponent has successfully piloted farmer-centered, market-driven extension services
with close links to researchers and farmers known as Agriculture Technology Man-
agement Agencies (ATMAs). ATMAs improve coordination among line depart-
ments, encourage public-private partnerships for technology testing and extension,
and strengthen institutions for monitoring and evaluation at the state and national
levels (box 4.9).
Extending Support to Markets and Networks at the Cluster Level
Support networks can help low-income workers raise productivity and incomes by
teaching more efficient production methods. Informal enterprise, formal micro
enterprise, and SME production chains of goods and services suffer from low-quality
inputs, stock seasonality and accumulation, weak capital machinery, unavailability of
prototyping and facilities for experimentation, lack of information on and exchange
with markets—including for exports—and poor knowledge of how to manufacture
goods. An illustration is provided by the plethora of roadside motor mechanic shops
all over India. Millions of mechanics do all kinds of repairing, and their problem-
solving abilities and novel solutions show that their talents can be harnessed to
increase productivity and achieve business ends. However, most mechanics lack
basic education and have no access to formal engineering or science training.120
Anuja Utz and Carl Dahlman4
Promoting Inclusive Innovation4
121
With the emergence of rapidly growing, dynamic rural nonstate enterprises in the early 1980s,and with the Chinese government’s determination to be more active in using science and tech-nology developed in China in the real sector, in 1986 the Ministry of Science and Technology ini-tiated the nationwide Spark Program. (Its name came from the Chinese proverb “A single sparkcan start a prairie fire,” meaning that the spark of science and technology will extend over thevast rural areas of China.) Its overall objective was to help transfer technological and manage-rial knowledge from more advanced sectors to rural enterprises to support continued growthand development in nonstate rural enterprises—mostly town and village enterprises (TVEs)—and to help increase output and employment.
The program has spread to virtually every province in the country and has helped develop66,700 projects and many more individual enterprises within them. As a result, some 20 millionpeople have found employment in rural areas. Due to a TVE in Jingyang County in Shaanxi, percapita income in the county has almost tripled in five years. The Spark Program has achieved oneof the primary objectives of China’s agricultural policy: to stimulate and modernize the rural econ-omy and improve the living standards of farmers and their families. Many factors have con-tributed to the program’s success, such as the following:
• Flexibility. Farmers can select from a wide range of well-developed technologies (projects)to suit their districts.
• Demand driven. Participants choose from the projects within the program.
• Income driven. Joining the program provides the prospect of higher income.
• Diffusion of known knowledge. Technologies used in the program are generally alreadyproven.
• Local accountability. Selection of the leader of a Spark Program project is in the hands of par-ticipants (subject to approval).
• Support from local institutes. The state provides financial support for training participants andfor technical advice.
• Sustainability. Enterprises are funded almost entirely from bank loans and from capital raisedby participants, not from government grants.
• Market responsiveness. Considerable effort is made to ensure that market outlets are avail-able for the products of participating enterprises, with the program linked to local agriculturaland industrial market systems.
One of Spark’s main lessons is that successful execution of technical assistance requires fullcommitment and participation by all stakeholders. National ownership is important, and soundorganizational setup and dynamic leadership for implementation are essential to projectsuccess.
Sources: World Bank 1998; Huang and others 2004; IDRC (www.idrc.ca/en/ev-55213-201-1-DO_TOPIC.html).
Box 4.8 China’s Spark Program
Creating a network of such entrepreneurs and giving them better access to modern
training, knowledge, quality assurance, and quality control training and finance
could lead to them providing high value to customers—increasing productivity as
well as incomes (Banerjee 2006).
A broad range of support networks have unrealized synergies, including
research firms, enterprises, trade-entrepreneur networks, and NGOs. Formal
researcher-academic networks typically do not have enough incentives to provide
knowledge inputs to this bottom layer of producers. However, CSIR is building
new innovation models by forging local partnerships, reaching out to the remote
corners of India. A village called Athaoni, on the border of Maharashtra and Kar-
nataka, is where Kolhapuri chappals (sandals) were until recently made using tra-
ditional techniques. Scientists from the Central Leather Research Institute helped
reduce the processing time of producing the sandals—the stamping process was
standardized and certain innovative changes were made in the design, based on122
Anuja Utz and Carl Dahlman4
India’s ATMAs provide for decentralized, participatory, farmer-driven extension services andhave institutionalized bottom-up planning processes through the preparation of StrategicResearch and Extension Plans—based on participatory rural appraisals and Block Action Plans.The program relies on a group approach based on village groups, as well as training of volun-teer farmers. ATMAs support private extension initiatives by contracting NGOs to conductextension responsibilities in selected areas, using farmer-to-farmer extension services providedby individuals or through farmer organizations, and forming partnerships with input providers (ofseeds, fertilizers, crop protection chemicals) for demonstrations and farmer training. In mostdistricts, farmers and other stakeholders have a sense of program ownership.
ATMA successes include diversification of production systems for higher income (for exam-ple, cultivation of high-value crops including flowers, fruits, vegetables, and medicinal plants),better natural resource management, integrated pest management, organic farming, wellrecharging, integrated plant nutrient management, resource conservation technologies, anddevelopment of new enterprises such as cashew processing, beekeeping, dairying, value addi-tion through processing, and group marketing. Farmer interest groups have mobilized men,women, and young people to join common interest groups, such as producer groups for flow-ers, fruit, milk, and other products, as well as marketing groups for seed.
Training farm leaders in technology and leadership skills is important. Strong farmer organi-zations can be a positive link in the cost-effective provision of extension support to small andmarginal farming communities, as well as an alternative to privatization of extension service.Farmer Advisory Committees are operational in most project blocks and are recognized by gov-ernment line departments. However, internal conflicts between ATMA priorities and depart-mental responsibilities persist, and extension staff require considerable motivation to work in afarm advisory role with multiple funding sources.
Source: Janssen 2006.
Box 4.9 The Experiences of Agriculture Technology Management Agencies
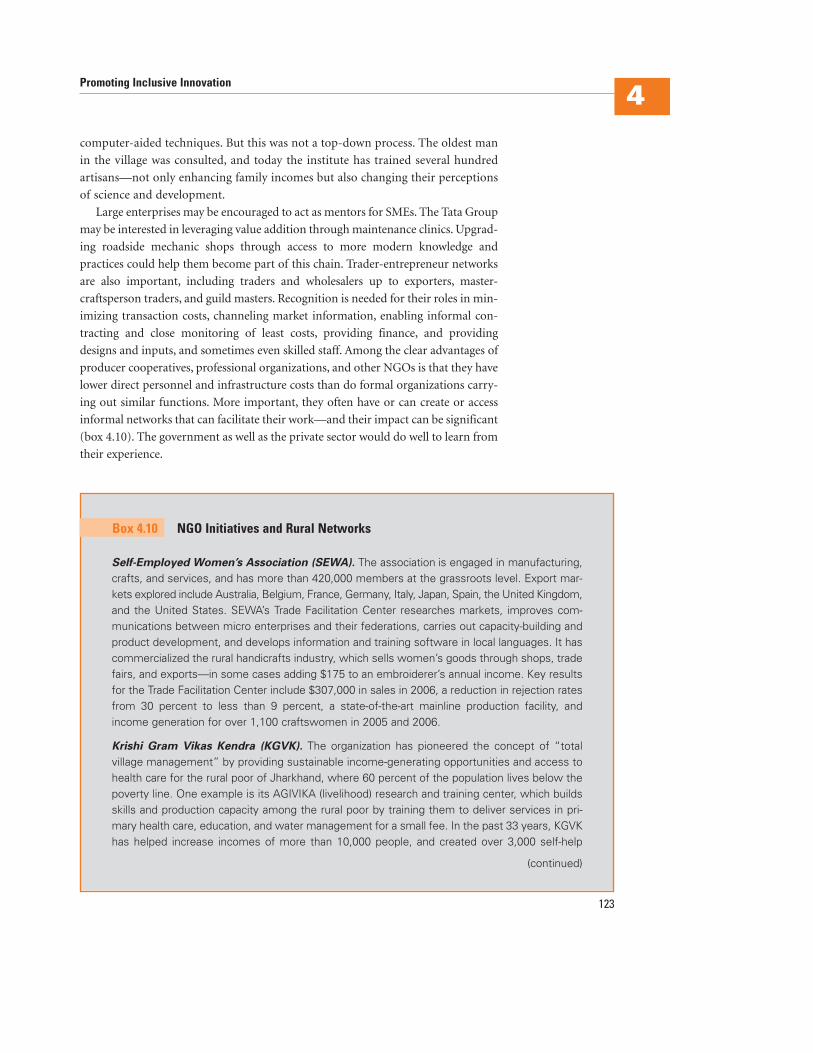
computer-aided techniques. But this was not a top-down process. The oldest man
in the village was consulted, and today the institute has trained several hundred
artisans—not only enhancing family incomes but also changing their perceptions
of science and development.
Large enterprises may be encouraged to act as mentors for SMEs. The Tata Group
may be interested in leveraging value addition through maintenance clinics. Upgrad-
ing roadside mechanic shops through access to more modern knowledge and
practices could help them become part of this chain. Trader-entrepreneur networks
are also important, including traders and wholesalers up to exporters, master-
craftsperson traders, and guild masters. Recognition is needed for their roles in min-
imizing transaction costs, channeling market information, enabling informal con-
tracting and close monitoring of least costs, providing finance, and providing
designs and inputs, and sometimes even skilled staff. Among the clear advantages of
producer cooperatives, professional organizations, and other NGOs is that they have
lower direct personnel and infrastructure costs than do formal organizations carry-
ing out similar functions. More important, they often have or can create or access
informal networks that can facilitate their work—and their impact can be significant
(box 4.10). The government as well as the private sector would do well to learn from
their experience.
Promoting Inclusive Innovation4
123
Self-Employed Women’s Association (SEWA). The association is engaged in manufacturing,crafts, and services, and has more than 420,000 members at the grassroots level. Export mar-kets explored include Australia, Belgium, France, Germany, Italy, Japan, Spain, the United Kingdom,and the United States. SEWA’s Trade Facilitation Center researches markets, improves com-munications between micro enterprises and their federations, carries out capacity-building andproduct development, and develops information and training software in local languages. It hascommercialized the rural handicrafts industry, which sells women’s goods through shops, tradefairs, and exports—in some cases adding $175 to an embroiderer’s annual income. Key resultsfor the Trade Facilitation Center include $307,000 in sales in 2006, a reduction in rejection ratesfrom 30 percent to less than 9 percent, a state-of-the-art mainline production facility, andincome generation for over 1,100 craftswomen in 2005 and 2006.
Krishi Gram Vikas Kendra (KGVK). The organization has pioneered the concept of “totalvillage management” by providing sustainable income-generating opportunities and access tohealth care for the rural poor of Jharkhand, where 60 percent of the population lives below thepoverty line. One example is its AGIVIKA (livelihood) research and training center, which buildsskills and production capacity among the rural poor by training them to deliver services in pri-mary health care, education, and water management for a small fee. In the past 33 years, KGVKhas helped increase incomes of more than 10,000 people, and created over 3,000 self-help
Box 4.10 NGO Initiatives and Rural Networks
(continued)
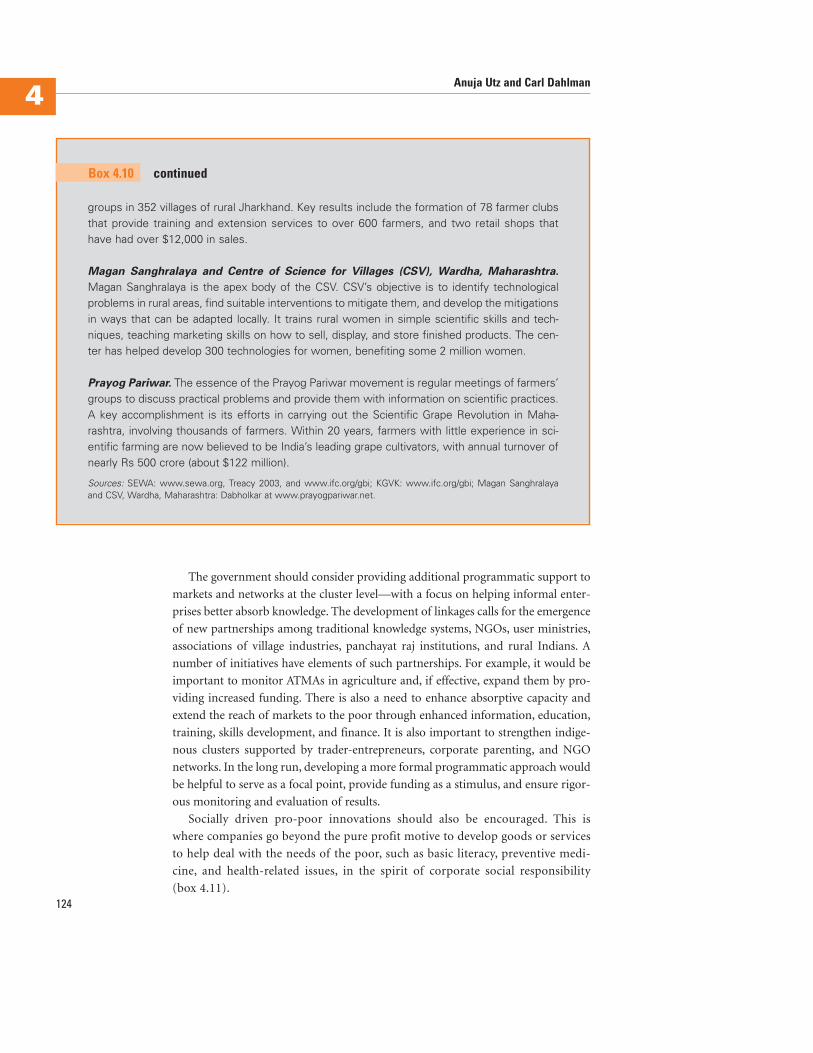
124
Anuja Utz and Carl Dahlman4
groups in 352 villages of rural Jharkhand. Key results include the formation of 78 farmer clubsthat provide training and extension services to over 600 farmers, and two retail shops thathave had over $12,000 in sales.
Magan Sanghralaya and Centre of Science for Villages (CSV), Wardha, Maharashtra.
Magan Sanghralaya is the apex body of the CSV. CSV’s objective is to identify technologicalproblems in rural areas, find suitable interventions to mitigate them, and develop the mitigationsin ways that can be adapted locally. It trains rural women in simple scientific skills and tech-niques, teaching marketing skills on how to sell, display, and store finished products. The cen-ter has helped develop 300 technologies for women, benefiting some 2 million women.
Prayog Pariwar. The essence of the Prayog Pariwar movement is regular meetings of farmers’groups to discuss practical problems and provide them with information on scientific practices.A key accomplishment is its efforts in carrying out the Scientific Grape Revolution in Maha-rashtra, involving thousands of farmers. Within 20 years, farmers with little experience in sci-entific farming are now believed to be India’s leading grape cultivators, with annual turnover ofnearly Rs 500 crore (about $122 million).
Sources: SEWA: www.sewa.org, Treacy 2003, and www.ifc.org/gbi; KGVK: www.ifc.org/gbi; Magan Sanghralayaand CSV, Wardha, Maharashtra: Dabholkar at www.prayogpariwar.net.
Box 4.10 continued
The government should consider providing additional programmatic support to
markets and networks at the cluster level—with a focus on helping informal enter-
prises better absorb knowledge. The development of linkages calls for the emergence
of new partnerships among traditional knowledge systems, NGOs, user ministries,
associations of village industries, panchayat raj institutions, and rural Indians. A
number of initiatives have elements of such partnerships. For example, it would be
important to monitor ATMAs in agriculture and, if effective, expand them by pro-
viding increased funding. There is also a need to enhance absorptive capacity and
extend the reach of markets to the poor through enhanced information, education,
training, skills development, and finance. It is also important to strengthen indige-
nous clusters supported by trader-entrepreneurs, corporate parenting, and NGO
networks. In the long run, developing a more formal programmatic approach would
be helpful to serve as a focal point, provide funding as a stimulus, and ensure rigor-
ous monitoring and evaluation of results.
Socially driven pro-poor innovations should also be encouraged. This is
where companies go beyond the pure profit motive to develop goods or services
to help deal with the needs of the poor, such as basic literacy, preventive medi-
cine, and health-related issues, in the spirit of corporate social responsibility
(box 4.11).
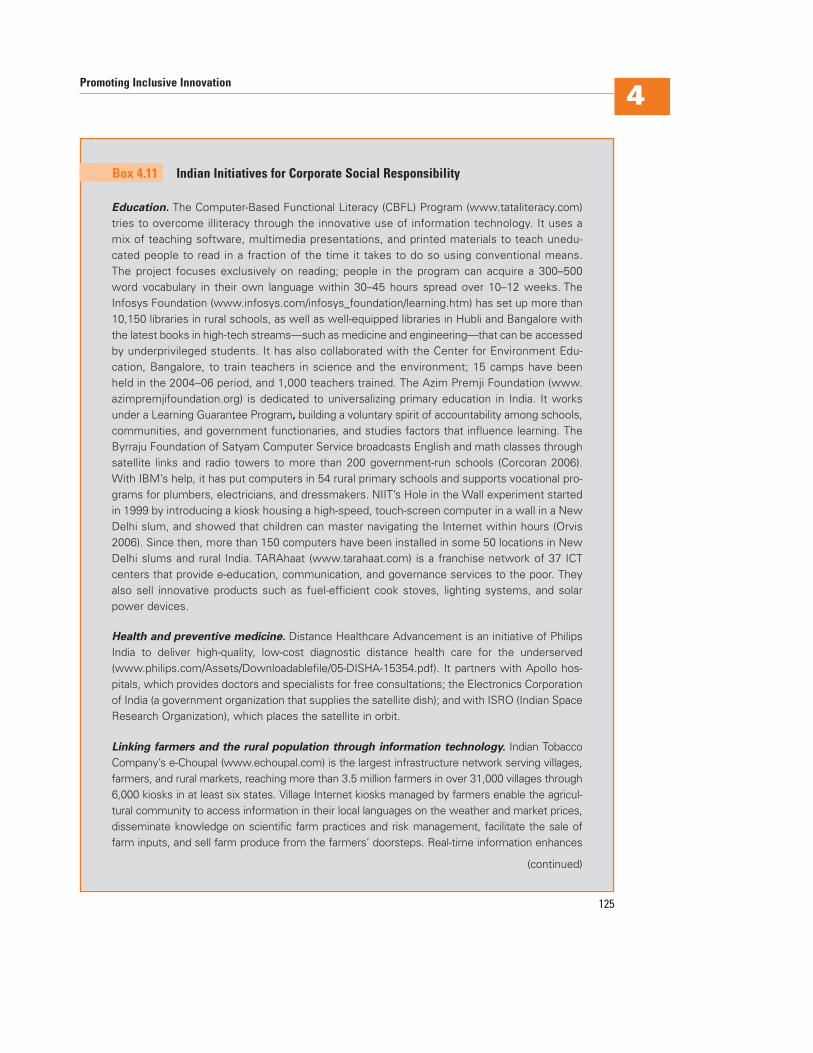
Education. The Computer-Based Functional Literacy (CBFL) Program (www.tataliteracy.com)tries to overcome illiteracy through the innovative use of information technology. It uses amix of teaching software, multimedia presentations, and printed materials to teach unedu-cated people to read in a fraction of the time it takes to do so using conventional means.The project focuses exclusively on reading; people in the program can acquire a 300–500word vocabulary in their own language within 30–45 hours spread over 10–12 weeks. TheInfosys Foundation (www.infosys.com/infosys_foundation/learning.htm) has set up more than10,150 libraries in rural schools, as well as well-equipped libraries in Hubli and Bangalore withthe latest books in high-tech streams—such as medicine and engineering—that can be accessedby underprivileged students. It has also collaborated with the Center for Environment Edu-cation, Bangalore, to train teachers in science and the environment; 15 camps have beenheld in the 2004–06 period, and 1,000 teachers trained. The Azim Premji Foundation (www.azimpremjifoundation.org) is dedicated to universalizing primary education in India. It worksunder a Learning Guarantee Program, building a voluntary spirit of accountability among schools,communities, and government functionaries, and studies factors that influence learning. TheByrraju Foundation of Satyam Computer Service broadcasts English and math classes throughsatellite links and radio towers to more than 200 government-run schools (Corcoran 2006).With IBM’s help, it has put computers in 54 rural primary schools and supports vocational pro-grams for plumbers, electricians, and dressmakers. NIIT’s Hole in the Wall experiment startedin 1999 by introducing a kiosk housing a high-speed, touch-screen computer in a wall in a NewDelhi slum, and showed that children can master navigating the Internet within hours (Orvis2006). Since then, more than 150 computers have been installed in some 50 locations in NewDelhi slums and rural India. TARAhaat (www.tarahaat.com) is a franchise network of 37 ICTcenters that provide e-education, communication, and governance services to the poor. Theyalso sell innovative products such as fuel-efficient cook stoves, lighting systems, and solarpower devices.
Health and preventive medicine. Distance Healthcare Advancement is an initiative of PhilipsIndia to deliver high-quality, low-cost diagnostic distance health care for the underserved(www.philips.com/Assets/Downloadablefile/05-DISHA-15354.pdf). It partners with Apollo hos-pitals, which provides doctors and specialists for free consultations; the Electronics Corporationof India (a government organization that supplies the satellite dish); and with ISRO (Indian SpaceResearch Organization), which places the satellite in orbit.
Linking farmers and the rural population through information technology. Indian TobaccoCompany’s e-Choupal (www.echoupal.com) is the largest infrastructure network serving villages,farmers, and rural markets, reaching more than 3.5 million farmers in over 31,000 villages through6,000 kiosks in at least six states. Village Internet kiosks managed by farmers enable the agricul-tural community to access information in their local languages on the weather and market prices,disseminate knowledge on scientific farm practices and risk management, facilitate the sale offarm inputs, and sell farm produce from the farmers’ doorsteps. Real-time information enhances
Box 4.11 Indian Initiatives for Corporate Social Responsibility
(continued)
Promoting Inclusive Innovation4
125
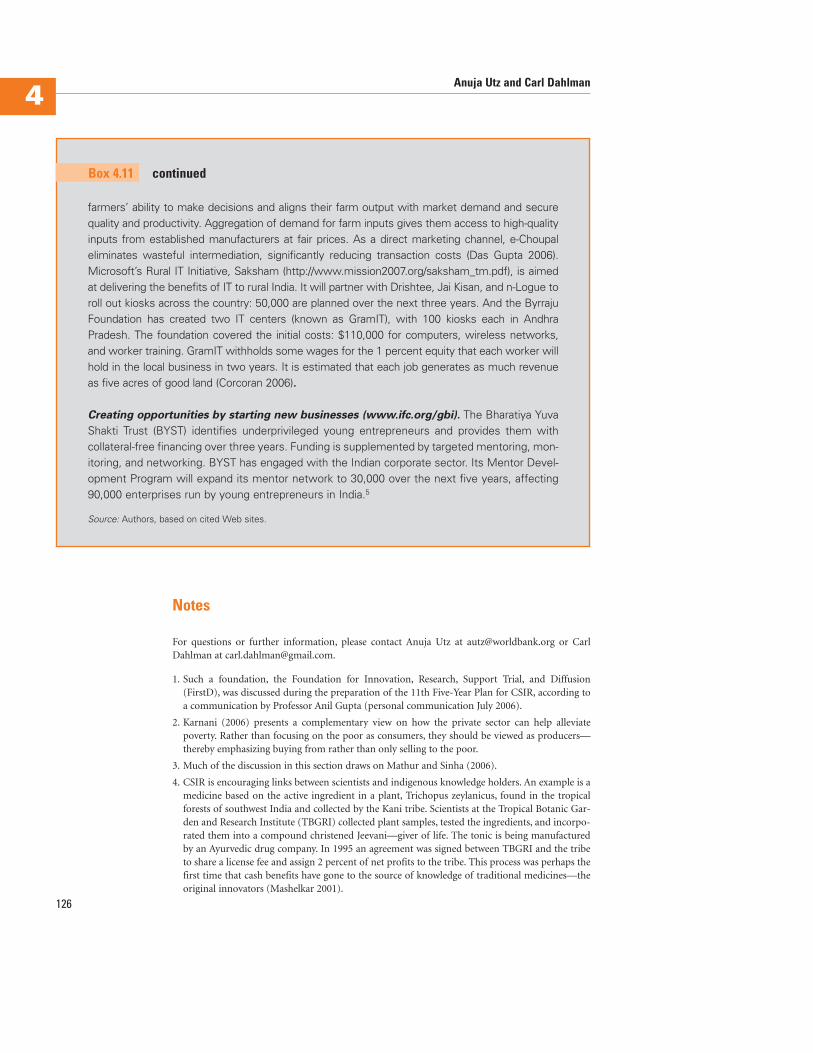
126
Anuja Utz and Carl Dahlman4
Notes
For questions or further information, please contact Anuja Utz at [email protected] or CarlDahlman at [email protected].
1. Such a foundation, the Foundation for Innovation, Research, Support Trial, and Diffusion(FirstD), was discussed during the preparation of the 11th Five-Year Plan for CSIR, according toa communication by Professor Anil Gupta (personal communication July 2006).
2. Karnani (2006) presents a complementary view on how the private sector can help alleviatepoverty. Rather than focusing on the poor as consumers, they should be viewed as producers—thereby emphasizing buying from rather than only selling to the poor.
3. Much of the discussion in this section draws on Mathur and Sinha (2006).
4. CSIR is encouraging links between scientists and indigenous knowledge holders. An example is amedicine based on the active ingredient in a plant, Trichopus zeylanicus, found in the tropicalforests of southwest India and collected by the Kani tribe. Scientists at the Tropical Botanic Gar-den and Research Institute (TBGRI) collected plant samples, tested the ingredients, and incorpo-rated them into a compound christened Jeevani—giver of life. The tonic is being manufacturedby an Ayurvedic drug company. In 1995 an agreement was signed between TBGRI and the tribeto share a license fee and assign 2 percent of net profits to the tribe. This process was perhaps thefirst time that cash benefits have gone to the source of knowledge of traditional medicines—theoriginal innovators (Mashelkar 2001).
farmers’ ability to make decisions and aligns their farm output with market demand and securequality and productivity. Aggregation of demand for farm inputs gives them access to high-qualityinputs from established manufacturers at fair prices. As a direct marketing channel, e-Choupaleliminates wasteful intermediation, significantly reducing transaction costs (Das Gupta 2006).Microsoft’s Rural IT Initiative, Saksham (http://www.mission2007.org/saksham_tm.pdf), is aimedat delivering the benefits of IT to rural India. It will partner with Drishtee, Jai Kisan, and n-Logue toroll out kiosks across the country: 50,000 are planned over the next three years. And the ByrrajuFoundation has created two IT centers (known as GramIT), with 100 kiosks each in AndhraPradesh. The foundation covered the initial costs: $110,000 for computers, wireless networks,and worker training. GramIT withholds some wages for the 1 percent equity that each worker willhold in the local business in two years. It is estimated that each job generates as much revenueas five acres of good land (Corcoran 2006).
Creating opportunities by starting new businesses (www.ifc.org/gbi). The Bharatiya YuvaShakti Trust (BYST) identifies underprivileged young entrepreneurs and provides them withcollateral-free financing over three years. Funding is supplemented by targeted mentoring, mon-itoring, and networking. BYST has engaged with the Indian corporate sector. Its Mentor Devel-opment Program will expand its mentor network to 30,000 over the next five years, affecting90,000 enterprises run by young entrepreneurs in India.5
Source: Authors, based on cited Web sites.
Box 4.11 continued
Promoting Inclusive Innovation4
127
5. Since its inception, BYST has established a network of 3,000 volunteer business mentors anddeveloped more than 1,100 enterprises. Key results over the past 13 years include creation of10,000 new jobs, 10-fold wealth generation (Rs 10 in enterprise revenue for every Rs 1 invested),counseling of 55,000 young entrepreneurs, 1,000 new jobs a year created by overseas organizationsmentored by BYST, and a loan recovery rate of 95 percent (on total loans of $750,000). Informa-tion is from www.ifc.org/gbi.
References
Abramson, Bruce. 2007. “India’s Journey toward an Effective Patent System.” Policy Research
Working Paper 4301, South Asia Finance and Private Sector Development, World Bank,
Washington, DC.
Anderson, J. R., G. Feder, and S. Ganguly. 2005. The Rise and Fall of Training and Visit Exten-
sion: An Asian Mini-drama with an African Epilogue. Washington, DC: World Bank.
Banerjee, Parthasarathi. 2006. “Innovation in Informal, Small and Tiny Industries.” Back-
ground paper commissioned by South Asia Finance and Private Sector Development,
World Bank, Washington, DC.
Bellman, Eric. 2006. “Invisible Hand: Entrepreneur Gets Big Banks to Back Very Small Loans.”
Wall Street Journal, May 15.
Bowonder, B., V. Kelkar, N. G. Satish, and J. K. Racherla. 2006. “Innovation in India: Recent
Trends.” TMTC (Tata Management Training Center) Research Paper, Pune, India.
Corcoran, Elizabeth. 2006. “Back-Office Charity: An Indian Outsourcer Is Outsourcing His
Business—and Helping the Rural Poor.” Forbes, July 24.
CSIR (Council of Scientific and Industrial Research). 2004. “Making Technology Work for Rural
India: A Step towards Rural Transformation.”New Delhi. http://www.csir.res.in/csir/External/
Utilities/Frames/achievements/main_page.asp?a=topframe.htm&b=leftcon.htm&c=/csir/
external/ Heads/achievements/rural_technologies.htm.
Dabholkar, S. 2001. “Prosperity with Equity.” Lecture at Seminar on Ideas That Have Worked,
New Delhi. www.prayogpariwar.net.
Das Gupta, Surajeet. 2006. “How IT Is Changing Rural India.” http://in.rediff.com/cms/
print.jsp?docpath=/money/2006/apr/07spec.htm.
Economist. 2005a. “Calling Across the Divide.” July 7.
———. 2005b. “Calling for an End to Poverty.” July 7.
———. 2005c. “Less Is More.” July 7.
———. 2006. “From Top to Bottom: A Survey of Business in India.” June 3.
Grace, Cheri. 2005. “A Briefing Paper for DFID: Update on China and India and Access to
Medicines.” Department for International Development, Health Resource Centre, London.
www.dfidhealthrc.org/what_new/Final percent20India percent20China percent20Report.pdf.
Gupta, Anil K. 2002.“Making IPR Regime Responsive to the Needs of Small, Scattered, and Dis-
advantaged Innovators and Traditional Knowledge Holders: Agenda for Policy and Institu-
tional Change.” Presented at the Workshop on Traditional Knowledge, London, January 24.
Huang, Can, Celeste Amorim, Mark Spinoglio, Borges Gouveia, and Augusto Medina. 2004.
“Organization, Program, and Structure: An Analysis of the Chinese Innovation Policy
Framework.” Department of Economics, Universidade de Aveiro, Aveiro, Portugal.
128
Anuja Utz and Carl Dahlman4
Janssen, Willem. 2006. “Description of the ATMA Concept.” World Bank, Washington, DC.
Jhunjhunwala, Ashok, Anuradha Ramachandran, and Sangamitra Ramachander. 2006. “Con-
necting Rural India: Taking a Step Back for Two Forward.” Information Technology in Devel-
oping Countries 16 (1). http://www.is-watch.net/node/306.
Karnani, Aneel. 2006. “Fortune at the Bottom of the Pyramid: A Mirage.” Ross School of Busi-
ness Working Paper No. 1035, University of Michigan.
Manzar, Osama. 2005. “A New Model Walks the Ramp.” Small Change, July. http://www.
smallchange.in.
Mashelkar, R. A. 2001. “The Indian Innovation System.” Development Outreach, World Bank,
Washington, DC.
Mathur, Kuldeep, and Riya Sinha. 2006. “Pro-Poor Innovations.” Background paper commis-
sioned by South Asia Finance and Private Sector Development, World Bank, Washington, DC.
Mohandas, Palat, and P. R. Reddy. 2004. “Earth Observation Support for National Drinking
Water Mission in India.” India-United States Conference on Space Science, Applications
and Commerce, Bangalore, June 21–25. www.aiaa.org/indiaus2004/Earth-observation.pdf.
Moreau, Ron, and Sudip Mazumdar. 2006. “Bigger, Faster, Better.” Newsweek International,
July 17. http://msnbc.msn.com/id/13773308/site/newsweek/.
Muniyappa, N. C., B. K. Ranganath, and P. G. Diwakar. 2004. “Remote Sensing and GIS in Par-
ticipatory Watershed Development in Rural Karnataka.” India-United States Conference on
Space Science, Applications and Commerce, Bangalore, June 21–25. www.aiaa.org/
indiaus2004/Earth-observation.pdf.
Orvis, Pat. 2006. “A ‘Hole in the Wall’ Helps Educate India.” The Christian Science Monitor,
June 1.
Prahalad, C. K. 2004. Fortune at the Bottom of the Pyramid: Eradicating Poverty through Profits.
Upper Saddle River, NJ: Wharton School Publishing.
Sharma, Dinesh C. “Linux-Based Handheld Debuts in India.” Cnet News.com March 29, 2004.
news.com.com/Linux-based+handheld+debuts+in+India/2100-1041_3-5181303.html.
Shell Foundation. 2003. “The Future Is Bright for India’s Energy Poor.” London. www.shell-
foundation.org/index.php?newsID=196.
Tata. 2007. “Tata BP Solar India.” Bangalore. www.tata.com/tata_bp_solar/index.htm.
Treacy, Mary. 2003. “In India, Integrating the Informal Sector into the Global Economy.” Inter-
national Trade Forum, Issue 4 (October).
Usher, Eric. 2003.“UNEP Sees the Dividend in Market Making for the Poor.” Shell Foundation.
http://www.shellfoundation.org/index.php?newsID=194.
World Bank. 1998. “China: Rural Industrial Technology (Spark) Project.” Implementation
Completion Report, Report No. 18126, World Bank, Washington, DC.
129
More than half of India’s population—over 500 million people—are younger than
25. By 2050 India is expected to overtake China as the world’s most populous
nation, and over the next five years will be responsible for nearly a quarter of the
increase in the world’s working-age population. Already India has almost a third
of the available labor supply in low-cost countries (NASSCOM and McKinsey
2005). These figures, pointing to India’s “demographic dividend,” represent an
enormous competitive advantage for India in its emergence as an innovation econ-
omy, and as a potential world-class supplier of skills to the world. However, the
widespread perception that India has unlimited employable human resources has
changed. India has a growing shortage of skilled workers—caused largely by work-
force development and education systems that do not respond adequately to the
economy’s needs.
To contribute effectively to the innovation economy and capitalize on the
growing opportunities of globalization, India’s young workforce must develop
skills that are more market-driven. Given expanding trade and globalization,
India’s workforce must have skills that are aligned with its transforming econ-
omy and can support the country’s continued economic growth. India’s ongoing
but incomplete transformation from an agriculture- to a manufacturing- and
services-based economy requires training a workforce with distinct skills for
a market that increasingly rewards problem solving, communication skills,
teamwork, and self-learning. Skills are needed not only by high-skill sectors
but also by labor-intensive industries, which require technological developments
to be absorbed by a workforce adept in basic technological literacy and key
competencies.
Strengthening Skills and Educationfor InnovationIsak Froumin, Shanthi Divakaran, Hong Tan, and Yevgeniya Savchenko
5Chapter
130
Isak Froumin, Shanthi Divakaran, Hong Tan, and Yevgeniya Savchenko5
Improving Basic Skills in the Formal and Informal Sectors
Although enrollment in primary schools has increased to 93 percent (Pratham
2007),1 the quality of primary education continues to be uneven. Since the announce-
ment of the National Policy on Education in 1986, several initiatives have been
launched to prepare Indians for the demands of the 21st century. The Sarva Shiksha
Abhiyan (Education for All) Movement, for instance, is a government program that
seeks to universalize elementary education (grades 1–8) of sufficient quality by 2010.
Under this initiative, more than 100,000 new elementary schools have been opened
and approximately 500,000 additional teachers have been appointed as of December
2005 (Ministry of Human Resource Development 2006). However, reading, writing,
and arithmetic skills remain low among the literate population: 44 percent of stu-
dents in grades 2–5 in government schools cannot read short paragraphs with short
sentences, and 28 percent of students in grade 5 cannot do two-digit subtraction
problems (Pratham 2006).2
The quality of education at state-run schools needs to be improved. A Harvard
University study found that there were instances of absenteeism and no teaching
among primary school teachers: one in four teachers was absent and, of those pres-
ent, half were not teaching (Kremer and others 2006). Only 40 percent of primary
school teachers have college degrees and 30 percent have not completed higher sec-
ondary school. Some 72 percent of schools did not have electricity in 2005 (Planning
Commission 2006). High student drop-out rates, given such conditions, are not sur-
prising. The average drop-out rate in primary schools was approximately 31 percent
in 2003–04 (Planning Commission 2006). Between 1990 and 2002, the average years
of education among adult Indians increased only a little—from three years to almost
five years—much lower than in East Asian, Latin American, and Organisation for
Economic Co-operation and Development countries (Dar 2006: 7). Fewer than
60 percent of children who were born in 1997 and attended grade 1 reached grade 5
(Wu 2006). Regional disparities in education also contribute to India’s uneven
economic growth—literacy and enrollment rates vary across India, with southern
and western states generally faring better than states such as Bihar and others in
the north.
Gross enrollment rate3 in secondary schools and the quality of secondary educa-
tion remain bottlenecks. India continues to have an unbalanced pattern of enroll-
ment growth, with enrollment in secondary education growing insufficiently relative
to tertiary education. The gross enrollment rate in upper secondary education
(grades 11–12) remains low, at 40 percent (see figure 5.1), despite studies showing
the high returns to secondary education, especially for women. Between the early
1990s and 2004, returns to upper secondary school in India rose from 11 to 16 percent
and returns to tertiary education from 12 to 19 percent.4 The relatively small pool of
secondary school graduates creates a bottleneck, impeding the supply of students for
tertiary education. Secondary education in India is often of low quality, character-
ized by rote learning targeted to examinations and outdated curricula that preclude
innovative methods of teaching. Although one of the comparative advantages most
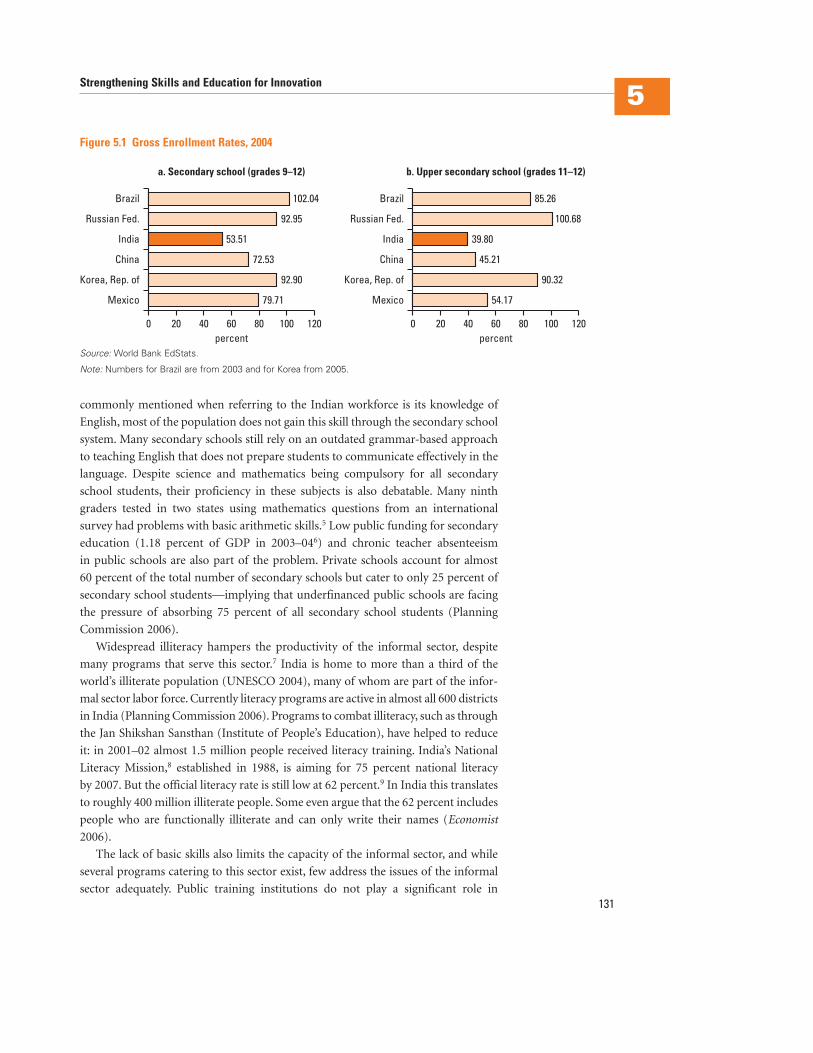
commonly mentioned when referring to the Indian workforce is its knowledge of
English, most of the population does not gain this skill through the secondary school
system. Many secondary schools still rely on an outdated grammar-based approach
to teaching English that does not prepare students to communicate effectively in the
language. Despite science and mathematics being compulsory for all secondary
school students, their proficiency in these subjects is also debatable. Many ninth
graders tested in two states using mathematics questions from an international
survey had problems with basic arithmetic skills.5 Low public funding for secondary
education (1.18 percent of GDP in 2003–046) and chronic teacher absenteeism
in public schools are also part of the problem. Private schools account for almost
60 percent of the total number of secondary schools but cater to only 25 percent of
secondary school students—implying that underfinanced public schools are facing
the pressure of absorbing 75 percent of all secondary school students (Planning
Commission 2006).
Widespread illiteracy hampers the productivity of the informal sector, despite
many programs that serve this sector.7 India is home to more than a third of the
world’s illiterate population (UNESCO 2004), many of whom are part of the infor-
mal sector labor force. Currently literacy programs are active in almost all 600 districts
in India (Planning Commission 2006). Programs to combat illiteracy, such as through
the Jan Shikshan Sansthan (Institute of People’s Education), have helped to reduce
it: in 2001–02 almost 1.5 million people received literacy training. India’s National
Literacy Mission,8 established in 1988, is aiming for 75 percent national literacy
by 2007. But the official literacy rate is still low at 62 percent.9 In India this translates
to roughly 400 million illiterate people. Some even argue that the 62 percent includes
people who are functionally illiterate and can only write their names (Economist
2006).
The lack of basic skills also limits the capacity of the informal sector, and while
several programs catering to this sector exist, few address the issues of the informal
sector adequately. Public training institutions do not play a significant role in
Strengthening Skills and Education for Innovation5
131
Figure 5.1 Gross Enrollment Rates, 2004
a. Secondary school (grades 9–12)
Mexico
Korea, Rep. of
China
India
Russian Fed.
Brazil
1201008060percent
40200
102.04
92.95
53.51
72.53
92.90
79.71
b. Upper secondary school (grades 11–12)
Mexico
Korea, Rep. of
China
India
Russian Fed.
Brazil
1201008060percent
40200
85.26
100.68
39.80
45.21
90.32
54.17
Source: World Bank EdStats.
Note: Numbers for Brazil are from 2003 and for Korea from 2005.
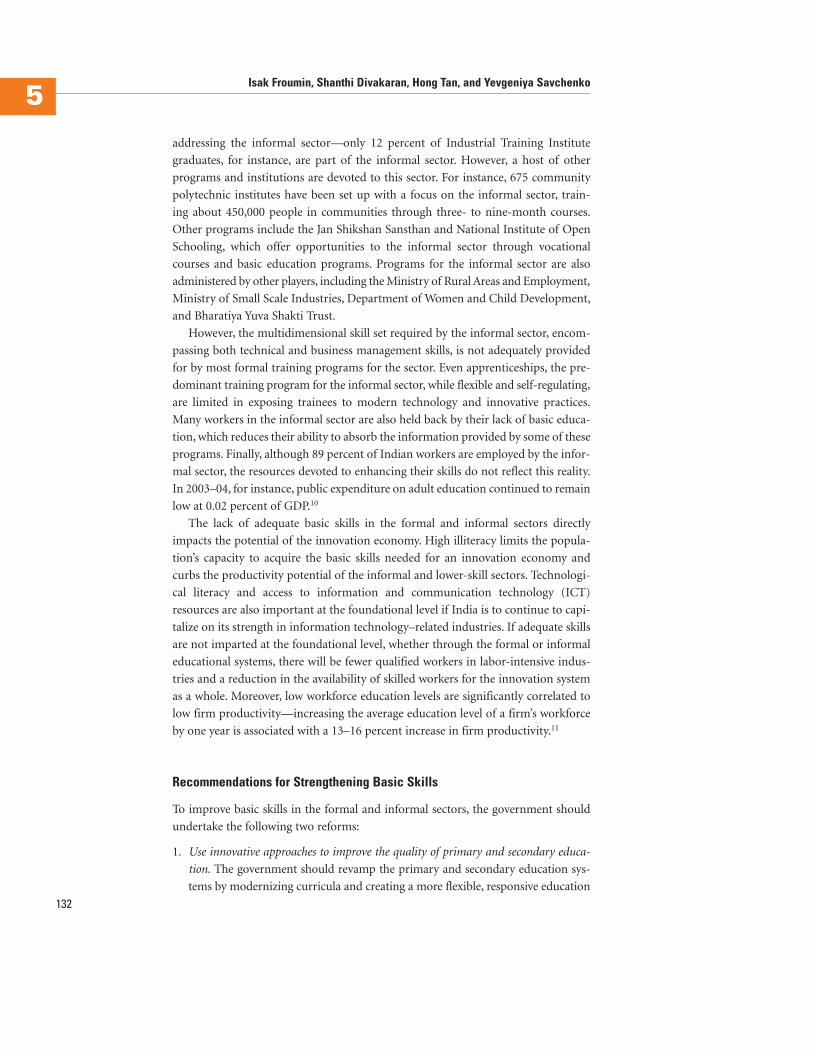
addressing the informal sector—only 12 percent of Industrial Training Institute
graduates, for instance, are part of the informal sector. However, a host of other
programs and institutions are devoted to this sector. For instance, 675 community
polytechnic institutes have been set up with a focus on the informal sector, train-
ing about 450,000 people in communities through three- to nine-month courses.
Other programs include the Jan Shikshan Sansthan and National Institute of Open
Schooling, which offer opportunities to the informal sector through vocational
courses and basic education programs. Programs for the informal sector are also
administered by other players, including the Ministry of Rural Areas and Employment,
Ministry of Small Scale Industries, Department of Women and Child Development,
and Bharatiya Yuva Shakti Trust.
However, the multidimensional skill set required by the informal sector, encom-
passing both technical and business management skills, is not adequately provided
for by most formal training programs for the sector. Even apprenticeships, the pre-
dominant training program for the informal sector, while flexible and self-regulating,
are limited in exposing trainees to modern technology and innovative practices.
Many workers in the informal sector are also held back by their lack of basic educa-
tion, which reduces their ability to absorb the information provided by some of these
programs. Finally, although 89 percent of Indian workers are employed by the infor-
mal sector, the resources devoted to enhancing their skills do not reflect this reality.
In 2003–04, for instance, public expenditure on adult education continued to remain
low at 0.02 percent of GDP.10
The lack of adequate basic skills in the formal and informal sectors directly
impacts the potential of the innovation economy. High illiteracy limits the popula-
tion’s capacity to acquire the basic skills needed for an innovation economy and
curbs the productivity potential of the informal and lower-skill sectors. Technologi-
cal literacy and access to information and communication technology (ICT)
resources are also important at the foundational level if India is to continue to capi-
talize on its strength in information technology–related industries. If adequate skills
are not imparted at the foundational level, whether through the formal or informal
educational systems, there will be fewer qualified workers in labor-intensive indus-
tries and a reduction in the availability of skilled workers for the innovation system
as a whole. Moreover, low workforce education levels are significantly correlated to
low firm productivity—increasing the average education level of a firm’s workforce
by one year is associated with a 13–16 percent increase in firm productivity.11
Recommendations for Strengthening Basic Skills
To improve basic skills in the formal and informal sectors, the government should
undertake the following two reforms:
1. Use innovative approaches to improve the quality of primary and secondary educa-
tion. The government should revamp the primary and secondary education sys-
tems by modernizing curricula and creating a more flexible, responsive education
132
Isak Froumin, Shanthi Divakaran, Hong Tan, and Yevgeniya Savchenko5
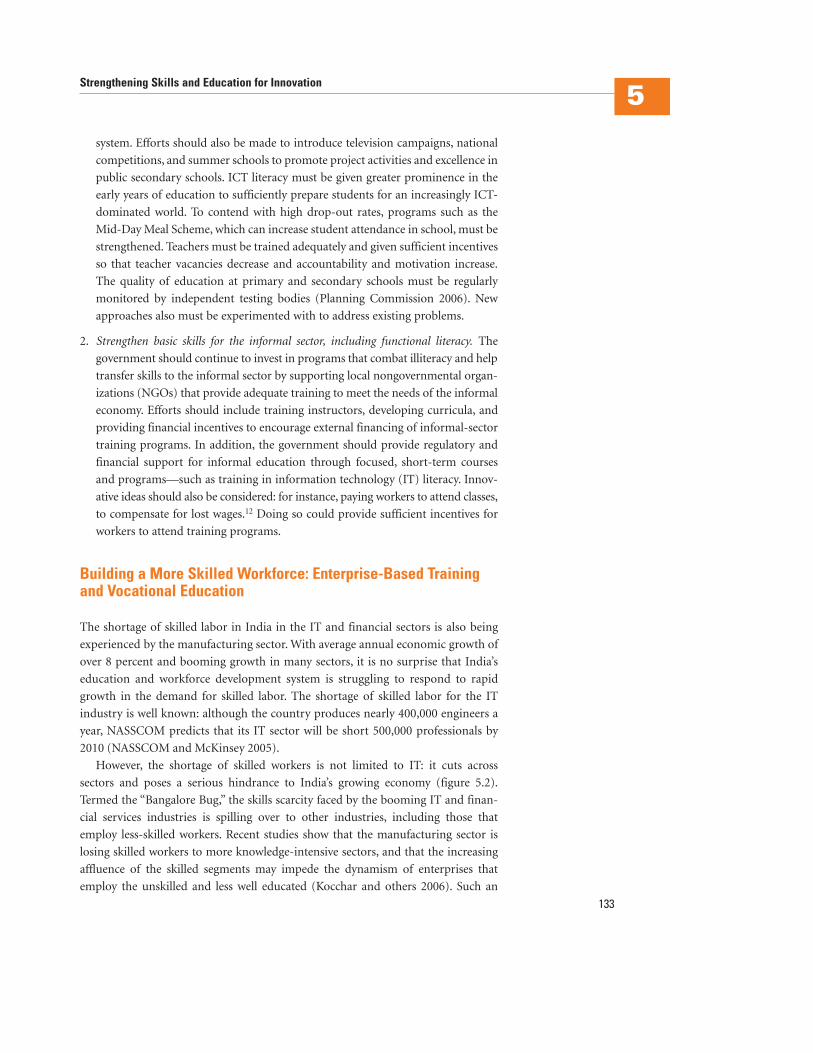
system. Efforts should also be made to introduce television campaigns, national
competitions, and summer schools to promote project activities and excellence in
public secondary schools. ICT literacy must be given greater prominence in the
early years of education to sufficiently prepare students for an increasingly ICT-
dominated world. To contend with high drop-out rates, programs such as the
Mid-Day Meal Scheme, which can increase student attendance in school, must be
strengthened. Teachers must be trained adequately and given sufficient incentives
so that teacher vacancies decrease and accountability and motivation increase.
The quality of education at primary and secondary schools must be regularly
monitored by independent testing bodies (Planning Commission 2006). New
approaches also must be experimented with to address existing problems.
2. Strengthen basic skills for the informal sector, including functional literacy. The
government should continue to invest in programs that combat illiteracy and help
transfer skills to the informal sector by supporting local nongovernmental organ-
izations (NGOs) that provide adequate training to meet the needs of the informal
economy. Efforts should include training instructors, developing curricula, and
providing financial incentives to encourage external financing of informal-sector
training programs. In addition, the government should provide regulatory and
financial support for informal education through focused, short-term courses
and programs—such as training in information technology (IT) literacy. Innov-
ative ideas should also be considered: for instance, paying workers to attend classes,
to compensate for lost wages.12 Doing so could provide sufficient incentives for
workers to attend training programs.
Building a More Skilled Workforce: Enterprise-Based Trainingand Vocational Education
The shortage of skilled labor in India in the IT and financial sectors is also being
experienced by the manufacturing sector. With average annual economic growth of
over 8 percent and booming growth in many sectors, it is no surprise that India’s
education and workforce development system is struggling to respond to rapid
growth in the demand for skilled labor. The shortage of skilled labor for the IT
industry is well known: although the country produces nearly 400,000 engineers a
year, NASSCOM predicts that its IT sector will be short 500,000 professionals by
2010 (NASSCOM and McKinsey 2005).
However, the shortage of skilled workers is not limited to IT: it cuts across
sectors and poses a serious hindrance to India’s growing economy (figure 5.2).
Termed the “Bangalore Bug,” the skills scarcity faced by the booming IT and finan-
cial services industries is spilling over to other industries, including those that
employ less-skilled workers. Recent studies show that the manufacturing sector is
losing skilled workers to more knowledge-intensive sectors, and that the increasing
affluence of the skilled segments may impede the dynamism of enterprises that
employ the unskilled and less well educated (Kocchar and others 2006). Such an
Strengthening Skills and Education for Innovation5
133
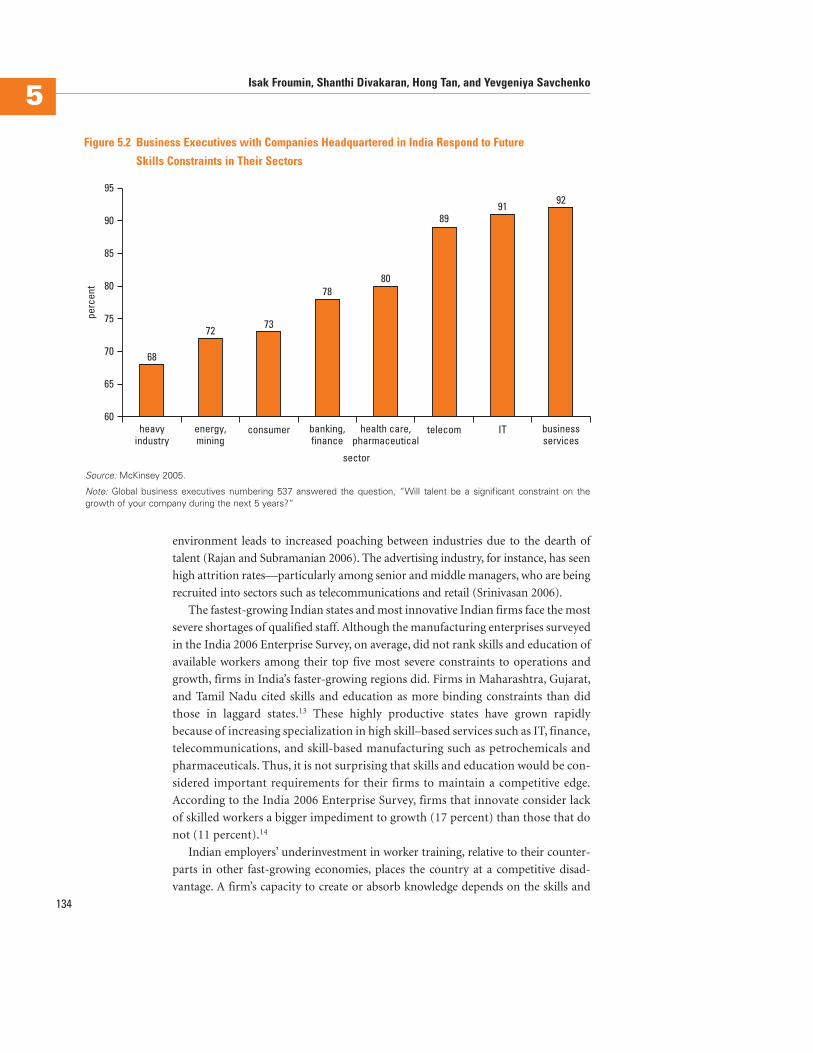
environment leads to increased poaching between industries due to the dearth of
talent (Rajan and Subramanian 2006). The advertising industry, for instance, has seen
high attrition rates—particularly among senior and middle managers, who are being
recruited into sectors such as telecommunications and retail (Srinivasan 2006).
The fastest-growing Indian states and most innovative Indian firms face the most
severe shortages of qualified staff. Although the manufacturing enterprises surveyed
in the India 2006 Enterprise Survey, on average, did not rank skills and education of
available workers among their top five most severe constraints to operations and
growth, firms in India’s faster-growing regions did. Firms in Maharashtra, Gujarat,
and Tamil Nadu cited skills and education as more binding constraints than did
those in laggard states.13 These highly productive states have grown rapidly
because of increasing specialization in high skill–based services such as IT, finance,
telecommunications, and skill-based manufacturing such as petrochemicals and
pharmaceuticals. Thus, it is not surprising that skills and education would be con-
sidered important requirements for their firms to maintain a competitive edge.
According to the India 2006 Enterprise Survey, firms that innovate consider lack
of skilled workers a bigger impediment to growth (17 percent) than those that do
not (11 percent).14
Indian employers’ underinvestment in worker training, relative to their counter-
parts in other fast-growing economies, places the country at a competitive disad-
vantage. A firm’s capacity to create or absorb knowledge depends on the skills and
134
Isak Froumin, Shanthi Divakaran, Hong Tan, and Yevgeniya Savchenko5
Figure 5.2 Business Executives with Companies Headquartered in India Respond to Future
Skills Constraints in Their Sectors
60
65
70
75
80
perc
ent
85
90
959291
89
8078
7372
68
heavyindustry
energy,mining
consumer banking,finance
health care,pharmaceutical
telecom IT businessservices
sector
Source: McKinsey 2005.
Note: Global business executives numbering 537 answered the question, “Will talent be a significant constraint on thegrowth of your company during the next 5 years?”
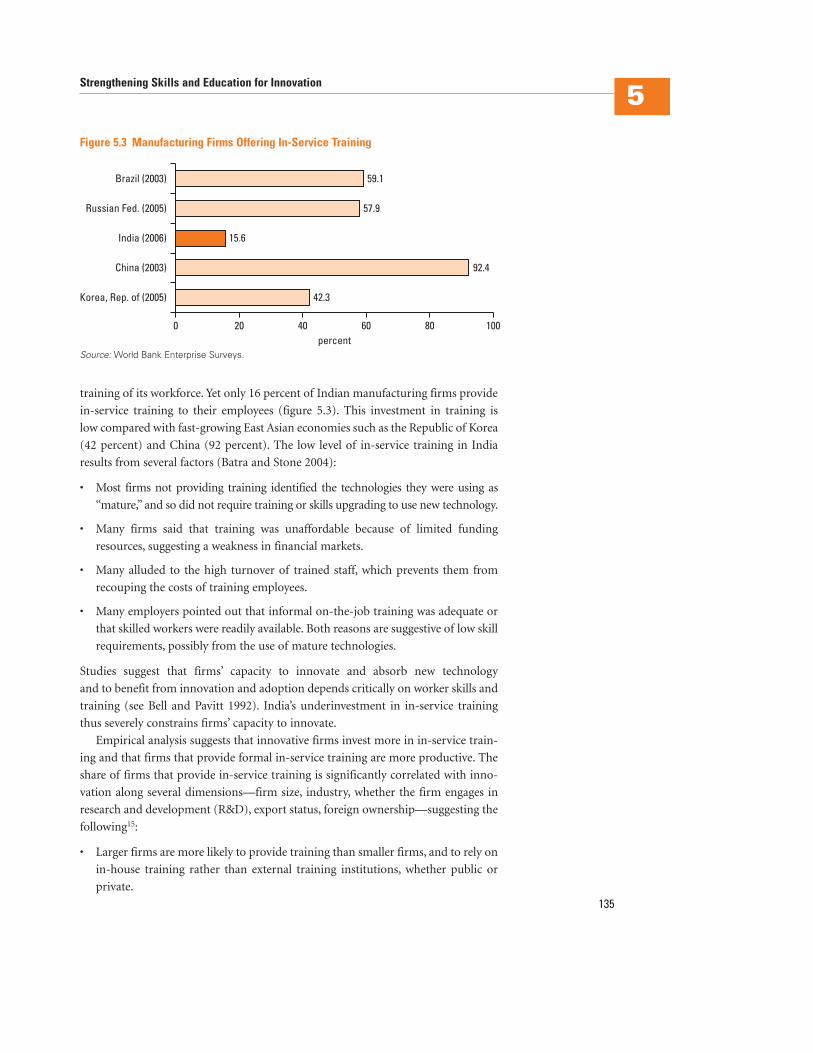
training of its workforce. Yet only 16 percent of Indian manufacturing firms provide
in-service training to their employees (figure 5.3). This investment in training is
low compared with fast-growing East Asian economies such as the Republic of Korea
(42 percent) and China (92 percent). The low level of in-service training in India
results from several factors (Batra and Stone 2004):
• Most firms not providing training identified the technologies they were using as
“mature,” and so did not require training or skills upgrading to use new technology.
• Many firms said that training was unaffordable because of limited funding
resources, suggesting a weakness in financial markets.
• Many alluded to the high turnover of trained staff, which prevents them from
recouping the costs of training employees.
• Many employers pointed out that informal on-the-job training was adequate or
that skilled workers were readily available. Both reasons are suggestive of low skill
requirements, possibly from the use of mature technologies.
Studies suggest that firms’ capacity to innovate and absorb new technology
and to benefit from innovation and adoption depends critically on worker skills and
training (see Bell and Pavitt 1992). India’s underinvestment in in-service training
thus severely constrains firms’ capacity to innovate.
Empirical analysis suggests that innovative firms invest more in in-service train-
ing and that firms that provide formal in-service training are more productive. The
share of firms that provide in-service training is significantly correlated with inno-
vation along several dimensions—firm size, industry, whether the firm engages in
research and development (R&D), export status, foreign ownership—suggesting the
following15:
• Larger firms are more likely to provide training than smaller firms, and to rely on
in-house training rather than external training institutions, whether public or
private.
Strengthening Skills and Education for Innovation5
135
Figure 5.3 Manufacturing Firms Offering In-Service Training
Korea, Rep. of (2005)
China (2003)
India (2006)
Russian Fed. (2005)
Brazil (2003)
10080percent
6040
59.1
57.9
15.6
42.3
92.4
200
Source: World Bank Enterprise Surveys.
• Firms in technology-intensive industries—such as automotive components,
drugs and pharmaceuticals, and machinery—are more likely to provide in-
service training.
• Firms that conduct R&D have a three-times-higher incidence of training than
those that do not.
• Export orientation can have a salutary effect on training that produces high-
quality products meeting the exacting standards of foreign buyers, and that
increases labor productivity to meet competitive pressures (Tan and Batra 1995).
• Firms with foreign equity (possibly because of their embodied foreign technology
and know-how) are more likely to provide training than domestic firms.
A key question is whether innovation is possible without a highly skilled and trained
workforce. A bivariate probit model was jointly estimated for the decision of whether
to innovate and the decision of whether to train. The results suggest that innovating
firms tend to be larger, are managed by more educated general managers, employ a
more educated workforce, and export; and that firms that train are larger, have some
foreign ownership, and export. Most important, the correlation between the two
equations is positive and statistically significant, confirming that firms’ training
and innovation decisions are made jointly (technical appendix table A.5). Finally,
the India 2006 Enterprise Survey allows an econometric assessment of the produc-
tivity effects of training. Firms that provide in-service training are 23–28 percent
more productive than firms that do not.16
India’s vocational education and training system needs to be better aligned to
market needs to meet the preservice training requirements of enterprises. Vocational
education and training are distinct streams in India, with vocational education pro-
vided as part of the upper secondary school system (grades 11–12) and vocational
training provided outside the formal schooling system. However, the relevance and
quality of these vocational education training programs are questionable. Only 3 per-
cent of rural youth and 6 percent of urban youth have been vocationally trained
(Planning Commission 2006). Fewer than 3 percent of students in grades 11–12 are
enrolled in vocational education, and students who enter vocational education pro-
grams are believed to be those who performed poorly in 10th grade. Of these, most
graduates pursue further education, reinforcing the insignificance of secondary
school programs. The irrelevance of these programs to market needs can partly be
explained by the lack of private sector involvement in running vocational education
and training programs. Although the government seems eager to expand the voca-
tional education system, it is not clear that such an expansion would be useful given
the irrelevance of current courses to the labor market and the market’s increasing
trend to reward general rather than specialized skills (Dar 2006).
Outside the formal schooling system, the main vocational educational program is
the Craftsmen Training Scheme, which operates through 1,895 government Indus-
trial Training Institutions that enroll 400,000 students and 3,358 private Industrial
Training Centers that train 340,000 students. These institutions are accredited by
136
Isak Froumin, Shanthi Divakaran, Hong Tan, and Yevgeniya Savchenko5
government agencies and provide programs lasting from six months to three years.
Vocational training is also provided at the tertiary level, varying in duration from
one to three years. But the India 2006 Enterprise Survey found that the training
offered by external providers of vocational education and training, public and pri-
vate, does not contribute to higher enterprise productivity. Besides the uncertain
quality of the education offered at these institutes, there is not enough information
about the effectiveness of vocational training programs due to a lack of evaluation at
both the central and state levels. The government also does not have enough infor-
mation about private providers of vocational education and training, which could
mean that private players are being crowded out by the public sector.
In addition, apprenticeship training programs are administered by the Ministry
of Human Resource Development and the Directorate General of Employment
and Training under the Ministry of Labour and Employment. But only 158,000
apprentices were trained through these programs in 2001, and most are focused on
engineering (Dar 2006). Besides, a 2003 study of graduates in apprenticeship train-
ing programs found that these training programs were not relevant to the labor
market.17
Better management and supervision skills are also needed to deal with India’s
fast-track technological environment, which requires skills channeled toward higher
productivity. Good management is required not only in skill-intensive sectors but
also in the labor-intensive, unskilled manufacturing sector. Management has a criti-
cal role to play in modernizing the labor-intensive sector, especially in less-developed
Indian states. Successful technology absorption, for instance, is possible only if man-
agers and supervisors in service firms and industry are willing to introduce new
technologies and organizational innovations and have appropriate skills. Good man-
agers should recognize the need for in-service training and for appropriate incentives
to motivate employees to generate innovative ideas. The growing modernization
of the manufacturing sector will increase the demand for well-educated, trained
workers and technicians as well as managers. Although international business lead-
ers rank the quality of Indian management schools very high,18 a small number of
excellent Indian Institutes of Management and other Indian business schools cannot
supply sufficient managers—especially for small and medium enterprises (SMEs).
And current innovative programs, such as for Masters of Small Business Adminis-
tration, are insufficient to fill the informal sector’s need for entrepreneurship skills.
Recommendations for Building Worker and Manager Skills
There are three important recommendations for building worker and management
skills. They are the following:
1. Strengthen enterprise-based training. The government should help ensure that the
benefits of in-service training are widely recognized by enterprises, while simul-
taneously providing strong financial incentives—such as matching funds—for
firms that invest in training. Existing SME-targeted training programs should be
evaluated, and improvements in program design, such as payroll levy training
Strengthening Skills and Education for Innovation5
137
funds and matching grants (Malaysia Human Resource Development Fund, for
instance; box 5.1), should be considered. Financial incentives should be provided
to employers that encourage worker training (Dar 2006: viii). And based on
results, enterprise-based training should be expanded at the national level.
2. Improve vocational training. India’s vocational education and training systems
have thus far been unsuccessful in preparing graduates to meet market needs,
particularly because of a lack of interaction with industry. Aligning these systems
with market needs requires restructuring—including private participation—
in the management of institutions, curriculum development, and system financ-
ing; upgrading infrastructure and instructor capabilities; stronger performance
incentives for vocational education and training institutions; and regulatory
reform to give training institutions greater autonomy to respond to market
skill needs and incentives, to change course offerings, and both charge and retain
fees. The abilities of public and private vocational education and training
providers should be strengthened to make them more responsive to demand in
their offerings. Curricula should be updated to reflect modern technologies and
improve flexibility by mapping the supply of and demand for skills and by
ensuring that the private sector is involved in curriculum design (Dar 2006).138
Isak Froumin, Shanthi Divakaran, Hong Tan, and Yevgeniya Savchenko5
Malaysia established the Human Resource Development Fund (HRDF) in 1993 to promote enter-prise-based training among firms—first in manufacturing and more recently in services. HRDFschemes are administered by a council, with representatives from the private sector and variousgovernment agencies, and a secretariat. Eligible employers with 50 or more employees arerequired to contribute 1 percent of payroll to the fund, making them eligible to claim training fund-ing up to the limit of their levy payments in any given year. The HRDF council sets rates of reim-bursement, varying by type of training and size of firm (rates are higher for smaller firms). TheHRDF also requires firms to spend a minimum amount on training or lose their levy contributions,creating incentives for firms to train rather than poach skilled workers from other employers.
The HRDF offers different schemes that give employers flexibility in training in-house orusing public and private providers, including second-tier public-private intermediaries such asstate-level skill development centers. HRDF funding has created a vibrant training market, withpublic and private providers competing for resources. It addresses information constraintsthrough public information campaigns, subsidized delivery of training need assessments forSMEs, certification of training providers and wide dissemination of their offerings, and elec-tronic billing to keep employers informed of their levy use status. Recognizing the funding con-straints of SMEs, the HRDF council enlists certified providers to act as its agents, collectingfrom users the fees for which firms are responsible and claiming the reimbursable balance fromthe HRDF, thus reducing up-front cash outlays for SMEs.
Source: Tan 2005.
Box 5.1 Malaysia’s Human Resource Development Fund
Strengthening Skills and Education for Innovation5
139
Incentives should be in place for public-private partnerships to provide voca-
tional education and training. Certification programs that provide a signal of
candidate quality would also be helpful. The government, working with the World
Bank, has recently launched initiatives to address these issues and improve voca-
tional training.
3. Strengthen business and management education, including the management of
research and commercialization. Business and management education should be
strengthened through public-private partnerships. Innovative management
courses should be introduced in engineering and science education through a
strong policy push from center (from the All India Council for Technical
Education and other quality assurance and accreditation bodies). To strengthen
grassroots innovation skills, skills upgrading programs should be matched with
technology transfer programs—possibly through small grants for small-scale
technology projects involving universities. Stronger incentives are needed to
strengthen the entrepreneurial culture at universities and colleges by involving
students and professors in real businesses.
Strengthening Engineer and Researcher Skills: TransferringMarket-Relevant Skills in Higher Education
India’s demand for highly educated and skilled knowledge workers outstrips the
supply. The high demand is fueled partly by India’s popularity as an R&D destina-
tion for multinational corporations luring away domestic talent, and partly by the
blossoming of India’s IT and IT-enabled services sectors.19 The higher education
system’s ability to contend with the supply constraint will thus play a major role in
India’s competitiveness as a knowledge economy.
Universities are the cradle for sustained creativity and innovation. Yet despite the
global standing of several Indian institutions of higher learning, the higher education
system’s output is uneven. India’s higher education system has two subsystems: excel-
lent institutions, such as the Indian Institutes of Technology (IITs), Management
(IIMs), and Science (IISc); and second-tier and other institutions. Excellent institu-
tions, however, are few compared to the multitude of institutions that make up India’s
large higher education system (box 5.2). Since independence, the number of Indian
universities has increased by a factor of 13, the number of colleges by a factor of 24,
and enrollment by more than a factor of 10. Selectivity at the top-tier institutions is
extremely rigorous. Acceptance rates at IITs are approximately 3 percent. While the
seven Indian Institutes of Technology churn out just 3,000 graduates annually, the
second tier had 207,000 graduates in 2005 (Puliyenthuruthel 2005). Second-tier insti-
tutions, with 2,240 engineering colleges, of which 45 percent are privately managed,
are increasingly supporting the growing need for engineers. However, quality training
continues to concentrate in “islands of excellence”: 80 percent of doctorates in engi-
neering are awarded by 20 leading institutions, while 65 percent of doctorates in
sciences come from 30 leading institutions. In addition, rigid curriculum policies and
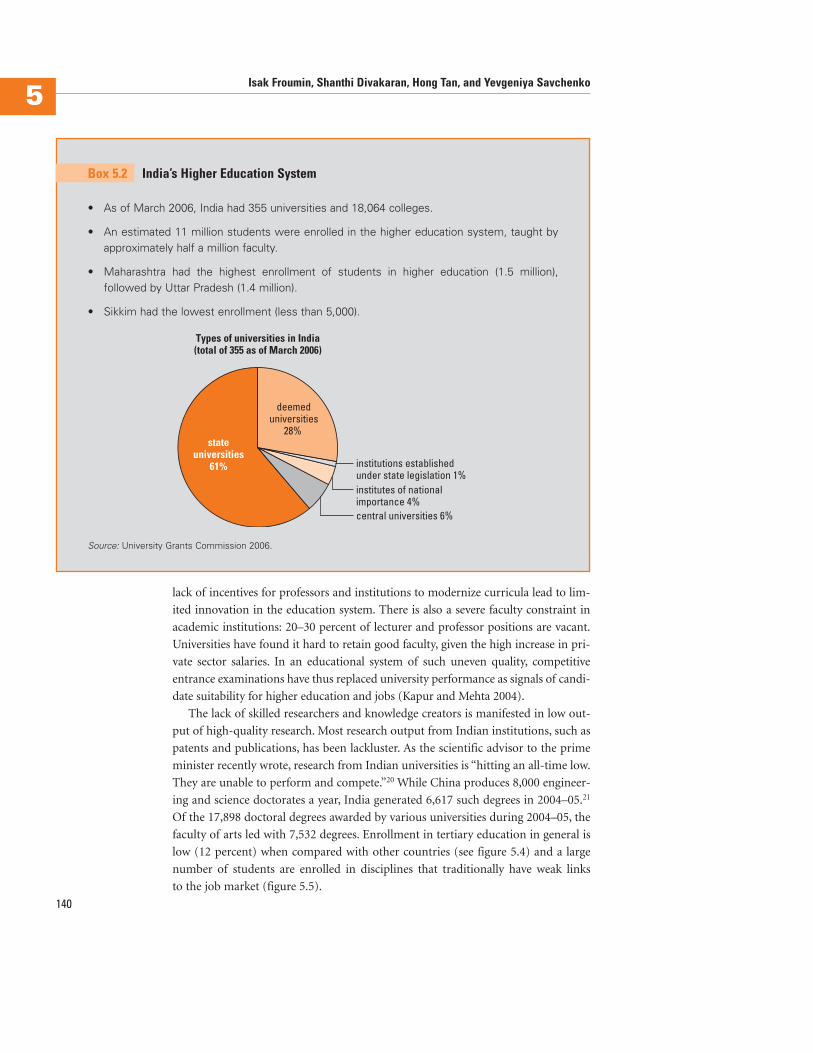
140
Isak Froumin, Shanthi Divakaran, Hong Tan, and Yevgeniya Savchenko5
lack of incentives for professors and institutions to modernize curricula lead to lim-
ited innovation in the education system. There is also a severe faculty constraint in
academic institutions: 20–30 percent of lecturer and professor positions are vacant.
Universities have found it hard to retain good faculty, given the high increase in pri-
vate sector salaries. In an educational system of such uneven quality, competitive
entrance examinations have thus replaced university performance as signals of candi-
date suitability for higher education and jobs (Kapur and Mehta 2004).
The lack of skilled researchers and knowledge creators is manifested in low out-
put of high-quality research. Most research output from Indian institutions, such as
patents and publications, has been lackluster. As the scientific advisor to the prime
minister recently wrote, research from Indian universities is “hitting an all-time low.
They are unable to perform and compete.”20 While China produces 8,000 engineer-
ing and science doctorates a year, India generated 6,617 such degrees in 2004–05.21
Of the 17,898 doctoral degrees awarded by various universities during 2004–05, the
faculty of arts led with 7,532 degrees. Enrollment in tertiary education in general is
low (12 percent) when compared with other countries (see figure 5.4) and a large
number of students are enrolled in disciplines that traditionally have weak links
to the job market (figure 5.5).
• As of March 2006, India had 355 universities and 18,064 colleges.
• An estimated 11 million students were enrolled in the higher education system, taught byapproximately half a million faculty.
• Maharashtra had the highest enrollment of students in higher education (1.5 million),followed by Uttar Pradesh (1.4 million).
• Sikkim had the lowest enrollment (less than 5,000).
Box 5.2 India’s Higher Education System
Source: University Grants Commission 2006.
Types of universities in India(total of 355 as of March 2006)
central universities 6%
stateuniversities
61%
deemeduniversities
28%
institutions establishedunder state legislation 1% institutes of nationalimportance 4%
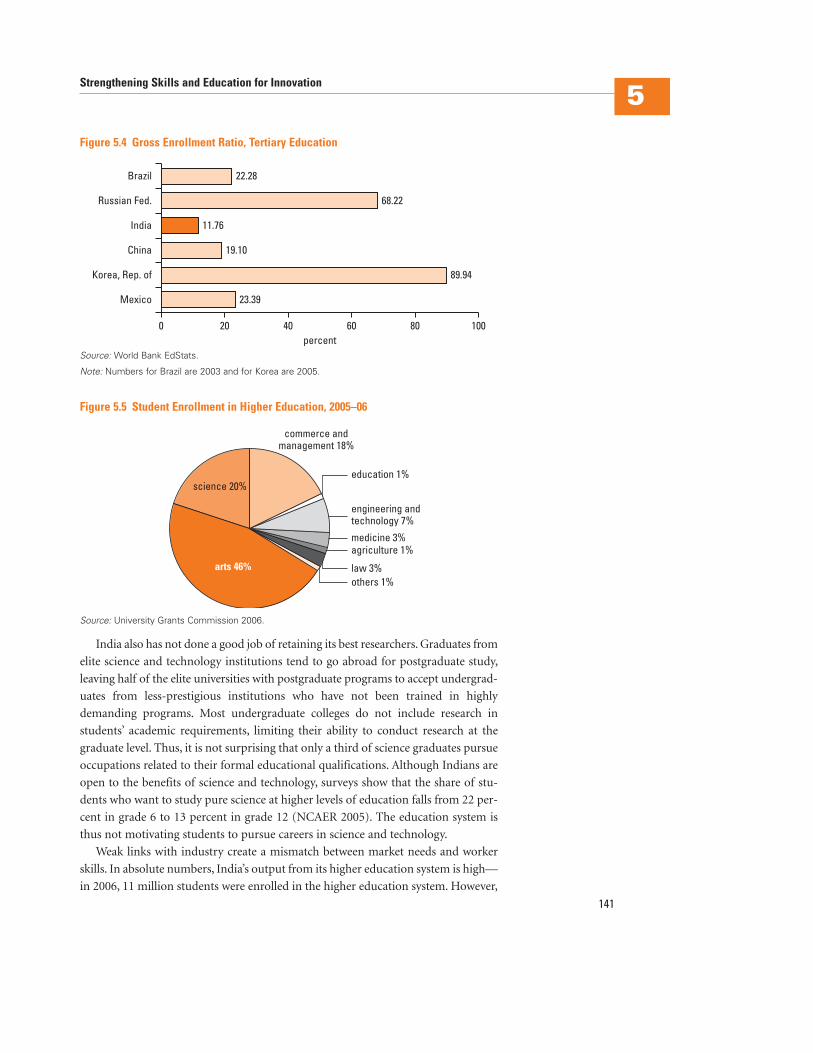
Strengthening Skills and Education for Innovation5
141
India also has not done a good job of retaining its best researchers. Graduates from
elite science and technology institutions tend to go abroad for postgraduate study,
leaving half of the elite universities with postgraduate programs to accept undergrad-
uates from less-prestigious institutions who have not been trained in highly
demanding programs. Most undergraduate colleges do not include research in
students’ academic requirements, limiting their ability to conduct research at the
graduate level. Thus, it is not surprising that only a third of science graduates pursue
occupations related to their formal educational qualifications. Although Indians are
open to the benefits of science and technology, surveys show that the share of stu-
dents who want to study pure science at higher levels of education falls from 22 per-
cent in grade 6 to 13 percent in grade 12 (NCAER 2005). The education system is
thus not motivating students to pursue careers in science and technology.
Weak links with industry create a mismatch between market needs and worker
skills. In absolute numbers, India’s output from its higher education system is high—
in 2006, 11 million students were enrolled in the higher education system. However,
Figure 5.4 Gross Enrollment Ratio, Tertiary Education
Korea, Rep. of
Mexico
China
India
Russian Fed.
Brazil
10080percent
6040200
22.28
68.22
11.76
19.10
89.94
23.39
Source: World Bank EdStats.
Note: Numbers for Brazil are 2003 and for Korea are 2005.
Figure 5.5 Student Enrollment in Higher Education, 2005–06
others 1%arts 46%
science 20%
commerce andmanagement 18%
education 1%
medicine 3%agriculture 1%
law 3%
engineering andtechnology 7%
Source: University Grants Commission 2006.
142
Isak Froumin, Shanthi Divakaran, Hong Tan, and Yevgeniya Savchenko5
McKinsey studies show that only 10–25 percent of general college graduates in India
are suitable for employment (Farrell, Kaka, and Sturze 2005). India is likely produc-
ing many graduates whose skill sets make them unemployable. One of the main
reasons is that links with industry are low in most education institutions, leading to
curricula that do not reflect modern technological developments and do not include
industrial practices. Universities update training programs without real involvement
from advanced industry or the R&D sector. Moreover, since the 1970s university
students have not been required to train or do project work in conjunction with
industry—leading to student projects being prepared in laboratories that do not
reflect existing conditions of technology use. Some initiatives have collaborated with
the private sector to correct the labor market mismatch with India’s education
system. The government’s Mission REACH program is creating Centers of Relevance
and Excellence in a network of universities to strengthen industry-university links in
a diverse set of disciplines. The program’s mandate is to produce top-quality gradu-
ates with skills directly relevant to industry needs.22 Similarly, companies like Infosys,
Tata Consultancy, and Wipro provide course materials to some institutions and
train teachers, enabling them to invest in shorter training times for their employees
(box 5.3) (Puliyenthuruthel 2005). However, such initiatives are not representative of
the majority of India’s higher education institutions.
Rigid centralized control of the education system leads to insufficient capacity
for higher education institutions to be innovative and responsive to the needs of
students or the labor market. The University Grants Commission is the central body
that funds government-recognized universities and colleges and provides accredita-
tion for higher learning through 12 autonomous institutions. Heavy regulation of
India’s higher education system has limited the ability of institutions to innovate
in their curricula, leading to a widely held perception that the system encourages
Certain players in India’s private sector have tried to correct the misalignment in skills providedthrough the education system and strengthen the skills required for competence in the work-force. These initiatives are probably most pronounced in the IT sector. Players such as Infosys,Tata Consultancy, Wipro, and Satyam Computer Services, which hired a total of 40,000 engi-neers in 2004, have collaborated with universities to supply course materials and train lecturerson developments in topics most relevant to their business—such as chip design and radio fre-quency identification. Although these collaborations require investments from the privatefirms, they pay off almost immediately, because graduates from colleges that partner withthese companies require shorter in-house training once hired. For instance, over three yearsTata Consultancy reduced its training program from 76 to 52 days as a result of these trainingcollaborations.
Source: Puliyenthuruthel 2005.
Box 5.3 Training Offered by the Private Sector in India
Strengthening Skills and Education for Innovation5
143
rote learning rather than creativity or self-learning. Public institutions have not,
for instance, been allowed to mobilize private funds (Kapur and Mehta 2004). Uni-
versities have low fiscal, managerial, and curriculum autonomy.23 There also is insuf-
ficient industry involvement in governing the education system and institutions.
Low public funding for higher education institutions has constrained their ability
to offer quality education. For many years, financing of higher education has been
the responsibility of the central and state governments. The central government pro-
vides only 25 percent of public financing for higher education; the rest comes from
states. Public spending on higher education is low, at approximately 0.7 percent of
GDP.24 Moreover, India provides free education to a relatively large number of stu-
dents, leading to underfinanced higher education programs. Spending on higher
education is estimated to be about 40 percent less than the desired level (Agarwal
2006). This shortage affects the quality of education. The deficit cannot be filled by
the government alone—innovative solutions are needed to bring in private funds.
Although the private sector has become active in providing higher education, the
quality of private institutions varies, and too much regulation makes private players
reluctant to invest enough in education. About half of higher education spending
is borne by private sources. Although in many countries private higher education
has grown in “soft” areas such as humanities, economics, management, and law, in
India the private sector has moved to “hard” professional areas. For example, about
85 percent of undergraduate engineering education is under private management.
One of the most dynamic parts of private participation is exam preparation courses
(private tutoring). Between 20 and 40 percent of applicants for higher education use
private preparation courses.
Private players must surmount significant entry barriers posed by regulatory con-
trols. To grant degrees, private colleges have to be affiliated with state universities,
unless they are “deemed” universities. Private colleges are guided by some of the same
curriculum restrictions that confine public ones (Kapur and Mehta 2004). In the past,
entry barriers were also high for foreign universities, though a November 2006 gov-
ernment agreement to clear foreign direct investment (FDI) in higher education and
allow foreign universities to set up campuses in India is a positive initiative. Every year
100,000 Indian students leave to attend foreign universities, at an average annual cost
of $4 billion (Lakshman 2006). Allowing foreign universities to set up shop in India
could both curb the brain drain and save money for many Indian families. It could
also help transform India into a global platform for supplying quality education.
Recommendations for Making Higher Education More Relevant to Market Needs
There are two recommendations for promoting the relevance of higher education to
market needs. They are the following:
1. Increase private participation in higher education. To address the growing supply
constraint of high-quality education institutions, India’s higher education system
144
Isak Froumin, Shanthi Divakaran, Hong Tan, and Yevgeniya Savchenko5
needs stronger incentives to attract domestic and foreign private participation in
higher education and its financing. Private institutions must be able to charge rea-
sonable fees if they are to be encouraged to invest in education. The November 2006
government agreement to allow both FDI in higher education and foreign univer-
sities to set up campuses in India is an appropriate step in this direction. Stronger
incentives are also needed for private provision and financing of formal and infor-
mal education—in particular, encouraging large corporations to establish new
universities through public-private partnerships.
2. Increase fiscal and managerial autonomy of universities and colleges. An increase
in joint training programs with industry—including courses such as small busi-
ness administration programs for SMEs—would help ensure that university cur-
ricula reflect market needs. Joint in-service training programs with university
participation should be promoted, possibly through matching grants (to
strengthen links with industry). Competitive grant programs for academic inno-
vations and performance-based incentives for professors would also foster a more
vibrant academic environment better aligned with the dynamic growth in India’s
knowledge-intensive sectors. Selected higher education institutions should be
upgraded to the highest levels, coupled with the provision of competitive grant
programs for academic innovations and the introduction of joint training
programs with industry and with top foreign universities and multinational
corporations. Systematic analysis of qualification exams should be conducted to
review the performance of higher education institutions. In addition, the quality
of higher education faculty should be improved by using leading institutions as
training centers for other faculty, introducing more performance-based incen-
tives for professors, and expanding grant programs for mobility between profes-
sors and industry. Efforts should also be made to move to systemwide quality
improvement, with a goal of two or three leading universities in each state.
Finally, a national testing system should be established to ensure high, uniform
performance standards for higher education graduates.
Notes
For questions or further information, please contact Isak Froumin at [email protected],Shanthi Divakaran at [email protected], Hong Tan at [email protected], or YevgeniyaSavchenko at [email protected].
1. This number refers to net primary enrollment rate, or the number of pupils in the theoreticalage group for primary education enrolled in primary education as a percentage of the total pop-ulation in that age group.
2. Figures for private schools are not much better.
3. Gross enrollment rate is defined as the total enrollment in a specific level of education (regard-less of age) as a percentage of the official school-age population corresponding to the same levelof education in a given school year.
4. Riboud, Savchenko, and Tan (2006) used earnings data from two decades of household surveysin India to estimate the private returns to an additional year of schooling, and how returns havechanged for different educational groups.
Strengthening Skills and Education for Innovation5
145
5. According to the TIMSS (Trends in International Mathematics and Science Study) survey. SeeWu (2006).
6. Selected Educational Statistics 2003–04, Ministry of Human Resource Development.
7. This section is drawn from Dar (2006).
8. The program aims to provide functional literacy to nonliterates in the age group 15–35 throughits principal strategy, the Total Literacy Campaign.
9. World Bank, EdStats, September 2006, http://devdata.worldbank.org/edstats/.
10. Department of Elementary Education and Literacy: Proposed Scheme-wise Break-up of AnnualPlan Allocation for 2005–06.
11. Based on 2006 India Enterprise Survey analysis. See technical appendix table A.6.
12. Conversation with Mr. Jawahar Sircar, Additional Secretary and Deputy Commissioner, Ministryof Small Scale Industries, December 2006.
13. According to the India 2006 Enterprise Survey, the proportion of manufacturing firms indicat-ing that skills and education of workers are a major or severe constraint to business and opera-tion is 26.2 percent for Tamil Nadu, 18.3 percent for Maharashtra, and 17.3 percent for Gujarat,versus 13.6 percent for Bihar, 13.3 percent for Uttar Pradesh, and 10.5 percent for Rajasthan.
14. For this finding, an “innovative” firm is defined as having positive spending on R&D, on royal-ties or license fees, or having acquired new technology.
15. See technical appendix table A.4.
16. See technical appendix table A.6. This finding is consistent with other cross-sectional studies thathave found a strong positive association between in-service training and productivity and wagelevels of firms (Batra and Stone 2004; Tan and Batra 1995), and panel studies that have foundevidence that training, especially when repeated, leads to higher productivity growth and wages(Tan 2005 for Malaysia; Tan and Lopez-Acevedo 2003 for Mexico).
17. Dar (2006), referring to the study by the Directorate General of Employment and Training.
18. See, for instance, World Economic Forum (2006).
19. According to Global Sourcing Now, the global knowledge process outsourcing industry isexpected to reach $17 billion by 2010, of which $12 billion would go to India.
20. C. N. R. Rao in a letter to the prime minister, in Seethalakshmi and Seshagiri (2006).
21. University Grants Commission Annual Report, 2005–06.
22. http://www.missionreach.org.
23. C. N. R. Rao in a letter to the prime minister, in Seethalakshmi and Seshagiri (2006).
24. Ministry of Human Resource and Development, Selected Educational Statistics 2003–04.
References
Agarwal, P. 2006.“Higher Education in India: The Need for a Change.” Working Paper No. 179,
ICRIER, New Delhi.
Batra, Geeta, and Andrew Stone. 2004. “Investment Climate, Capabilities and Firm Perfor-
mance: Evidence from the World Business Environment Surveys.” Investment Climate
Department, World Bank, Washington, DC.
Bell, Martin, and Keith Pavitt. 1992. “Accumulating Technological Capability in Developing
Countries.” In Proceedings of the World Bank Annual Conference on Development Econom-
ics 1992. Washington, DC: World Bank.
Dar, A. 2006. “Skill Development in India: The Vocational Education and Training System.”
World Bank, Washington, DC.
Economist. 2006. “Few Hands Make Light Work.” June 3.
Farrell, Diana, Noshir Kaka, and Sascha Sturze. 2005. “Ensuring India’s Offshoring Future.”
McKinsey Quarterly 2005: Fulfilling India’s Promise, online publication.
146
Isak Froumin, Shanthi Divakaran, Hong Tan, and Yevgeniya Savchenko5
Kapur, D., and P. Mehta. 2004. “Indian Higher Education Reform: From Half-Baked Socialism
to Half-Baked Capitalism.” CID Working Paper No. 108, Center for International Devel-
opment, Harvard University.
Kocchar, Kalpana, Utsav Kumar, Raghuram Rajan, Arvind Subramian, and Ioannis Tokatlidis.
2006. “India’s Pattern of Development: What Happened, What Follows?” Working Paper
WP/06/22, International Monetary Fund, Washington, DC.
Kremer, Michael, Nazmul Chaudhury, Jeffrey Hammer, Karthik Muralidharan, and F. Halsey
Rogers. 2006. “Missing in Action: Teacher and Health Worker Absence in Developing
Countries.” Journal of Economic Perspectives 1: 91–116.
Lakshman, Nandini. 2006. “Will Foreign Universities Come to India?” BusinessWeek, October 9.
McKinsey. 2005. “How India’s Executives See the World.” McKinsey Quarterly online journal.
Ministry of Human Resource Development. 2006. Annual Report 2004–05. New Delhi.
NASSCOM (National Association of Software and Service Companies) and McKinsey Com-
pany. 2005. The NASSCOM-McKinsey Report, 2005: Extending India’s Leadership of the
Global IT and BPO Industries. New Delhi.
NCAER (National Council of Applied Economic Research). 2005. India Science Report: Science
Education, Human Resources and Public Attitudes towards Science and Technology. New
Delhi: NCAER.
Planning Commission. 2006.“Towards Faster and More Inclusive Growth: An Approach to the
11th Five Year Plan.” Government of India, New Delhi.
Pratham. 2006. “Annual Status of Education Report (Rural) 2005.” (ASER05), Pratham
Resource Center, Mumbai. http://pratham.org/whatnew/default.php#aser05.
———. 2007. “Annual Status of Education Report (Rural) 2006.” (ASER06), Pratham Resource
Center, Mumbai. http://pratham.org/aser2006.php.
Puliyenthuruthel, Josey. 2005. “The Other MIT.” Business Week, August 22. http://www.
businessweek.com/magazine/content/05_34/b3948482.htm.
Rajan, Raghuram, and Arvind Subramanian. 2006. “India Needs Skill to Solve the ‘Bangalore
Bug’.” Financial Times, March 17.
Riboud, Michelle, Yevgeniya Savchenko, and Hong Tan. 2007. “The Knowledge Economy and
Education and Training in South Asia: A Mapping Exercise of Available Survey Data.”
South Asia Human Development Department, World Bank, Washington, DC.
Seethalakshmi, S., and Mathang Seshagiri. 2006. “Science Is on Its Deathbed.” Times of India,
July 21. http://timesofindia.indiatimes.com/articleshow/1784139.cms.
Srinivasan, Sriram. 2006. “Brain Drain.” Outlook, July 20.
Tan, Hong. 2005. The Skills Challenge of New Technology: Training, Technology, and Productivity
Growth in Malaysian Manufacturing in the 1990s. Washington, DC: World Bank, United
Nations Development Programme, and Economic Planning Unit (Malaysia).
Tan, Hong, and Geeta Batra. 1995. “Enterprise Training in Developing Countries: Incidence,
Productivity Effects, and Policy Implications.” Private Sector Development Department
Monograph, World Bank, Washington, DC.
Tan, Hong, and Gladys Lopez-Acevedo. 2003. “Mexico: In-firm Training for the Knowledge
Economy.” Policy Research Working Paper 2957, World Bank, Washington, DC.
UNESCO. 2004. EFA Global Monitoring Report 2005: The Quality Imperative. Geneva.
University Grants Commission (Government of India). 2006. “Annual Report 2005–2006.”
http://www.ugc.ac.in/pub/index.html#annual.
World Economic Forum. 2006. Global Competitiveness Report 2006–07. Geneva, Switzerland.
Wu, Kim. 2006. “Secondary Education in India.” World Bank, Washington, DC.
147
Obtaining and applying information lies at the heart of the innovation process.
Thus, the availability of information is a key driver of firms’ ability to create and
absorb new ideas. The creation of ideas and dissemination of ideas between firms
and countries are strongly influenced by the availability of information, the cost
of obtaining it, and the ease of sharing it. Electronic communication systems are
at the center of this information transfer process, so investment in information
and communication technology (ICT) infrastructure is one way of stimulating
growth in national innovation and economic productivity. International evidence
shows a clear link between investment in ICT and productivity (Röller and
Waverman 2001; Qiang and Pitt 2004). At the firm level, research shows that use
of ICT can result in higher productivity and profitability. A recent World Bank
study concluded that “enterprises that use ICT more intensively are more pro-
ductive, grow faster, invest more, and are more profitable” (Qiang, Clarke, and
Halewood 2006: 57).
India’s ICT sector has progressed rapidly—but challenges remain if it is to con-
tinue to create and enable innovation. India’s ICT sector has grown quickly over the
past 20 years, but this growth must continue and reach all segments of the economy
to fully support the development of an innovation economy. To achieve this, the gov-
ernment must address a number of policy and regulatory issues to ensure the sec-
tor’s continued growth and its extension into underserved areas.
The availability and quality of ICT infrastructure accessible by research institutes
will be increasingly important in fostering innovation. Collaboration between uni-
versities and research institutes—both within and outside India—requires invest-
ment in high-speed communications networks.
Upgrading Information InfrastructureShanthi Divakaran, Anil Srivastava, and Mark Williams
6Chapter
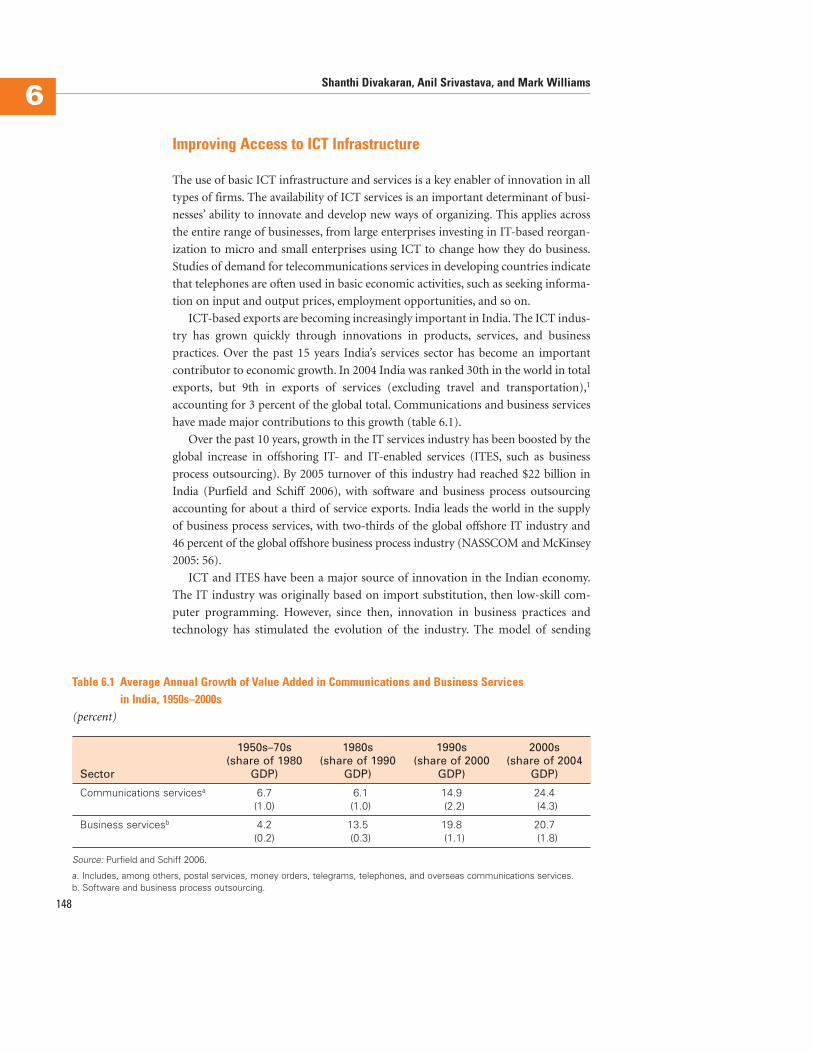
148
Shanthi Divakaran, Anil Srivastava, and Mark Williams6
Improving Access to ICT Infrastructure
The use of basic ICT infrastructure and services is a key enabler of innovation in all
types of firms. The availability of ICT services is an important determinant of busi-
nesses’ ability to innovate and develop new ways of organizing. This applies across
the entire range of businesses, from large enterprises investing in IT-based reorgan-
ization to micro and small enterprises using ICT to change how they do business.
Studies of demand for telecommunications services in developing countries indicate
that telephones are often used in basic economic activities, such as seeking informa-
tion on input and output prices, employment opportunities, and so on.
ICT-based exports are becoming increasingly important in India. The ICT indus-
try has grown quickly through innovations in products, services, and business
practices. Over the past 15 years India’s services sector has become an important
contributor to economic growth. In 2004 India was ranked 30th in the world in total
exports, but 9th in exports of services (excluding travel and transportation),1
accounting for 3 percent of the global total. Communications and business services
have made major contributions to this growth (table 6.1).
Over the past 10 years, growth in the IT services industry has been boosted by the
global increase in offshoring IT- and IT-enabled services (ITES, such as business
process outsourcing). By 2005 turnover of this industry had reached $22 billion in
India (Purfield and Schiff 2006), with software and business process outsourcing
accounting for about a third of service exports. India leads the world in the supply
of business process services, with two-thirds of the global offshore IT industry and
46 percent of the global offshore business process industry (NASSCOM and McKinsey
2005: 56).
ICT and ITES have been a major source of innovation in the Indian economy.
The IT industry was originally based on import substitution, then low-skill com-
puter programming. However, since then, innovation in business practices and
technology has stimulated the evolution of the industry. The model of sending
Table 6.1 Average Annual Growth of Value Added in Communications and Business Services in India, 1950s–2000s
(percent)
1950s–70s 1980s 1990s 2000s(share of 1980 (share of 1990 (share of 2000 (share of 2004
Sector GDP) GDP) GDP) GDP)
Communications servicesa 6.7 6.1 14.9 24.4(1.0) (1.0) (2.2) (4.3)
Business servicesb 4.2 13.5 19.8 20.7(0.2) (0.3) (1.1) (1.8)
Source: Purfield and Schiff 2006.
a. Includes, among others, postal services, money orders, telegrams, telephones, and overseas communications services.b. Software and business process outsourcing.
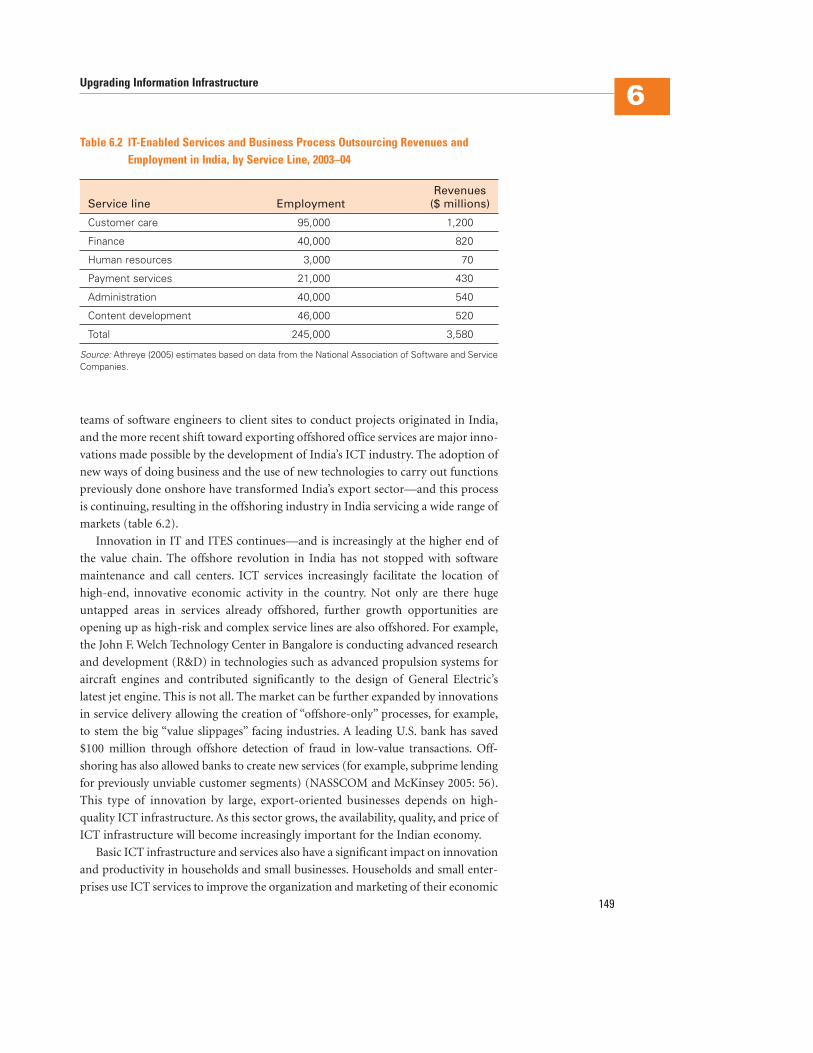
teams of software engineers to client sites to conduct projects originated in India,
and the more recent shift toward exporting offshored office services are major inno-
vations made possible by the development of India’s ICT industry. The adoption of
new ways of doing business and the use of new technologies to carry out functions
previously done onshore have transformed India’s export sector—and this process
is continuing, resulting in the offshoring industry in India servicing a wide range of
markets (table 6.2).
Innovation in IT and ITES continues—and is increasingly at the higher end of
the value chain. The offshore revolution in India has not stopped with software
maintenance and call centers. ICT services increasingly facilitate the location of
high-end, innovative economic activity in the country. Not only are there huge
untapped areas in services already offshored, further growth opportunities are
opening up as high-risk and complex service lines are also offshored. For example,
the John F. Welch Technology Center in Bangalore is conducting advanced research
and development (R&D) in technologies such as advanced propulsion systems for
aircraft engines and contributed significantly to the design of General Electric’s
latest jet engine. This is not all. The market can be further expanded by innovations
in service delivery allowing the creation of “offshore-only” processes, for example,
to stem the big “value slippages” facing industries. A leading U.S. bank has saved
$100 million through offshore detection of fraud in low-value transactions. Off-
shoring has also allowed banks to create new services (for example, subprime lending
for previously unviable customer segments) (NASSCOM and McKinsey 2005: 56).
This type of innovation by large, export-oriented businesses depends on high-
quality ICT infrastructure. As this sector grows, the availability, quality, and price of
ICT infrastructure will become increasingly important for the Indian economy.
Basic ICT infrastructure and services also have a significant impact on innovation
and productivity in households and small businesses. Households and small enter-
prises use ICT services to improve the organization and marketing of their economic
Upgrading Information Infrastructure6
149
Table 6.2 IT-Enabled Services and Business Process Outsourcing Revenues andEmployment in India, by Service Line, 2003–04
Revenues Service line Employment ($ millions)
Customer care 95,000 1,200
Finance 40,000 820
Human resources 3,000 70
Payment services 21,000 430
Administration 40,000 540
Content development 46,000 520
Total 245,000 3,580
Source: Athreye (2005) estimates based on data from the National Association of Software and ServiceCompanies.
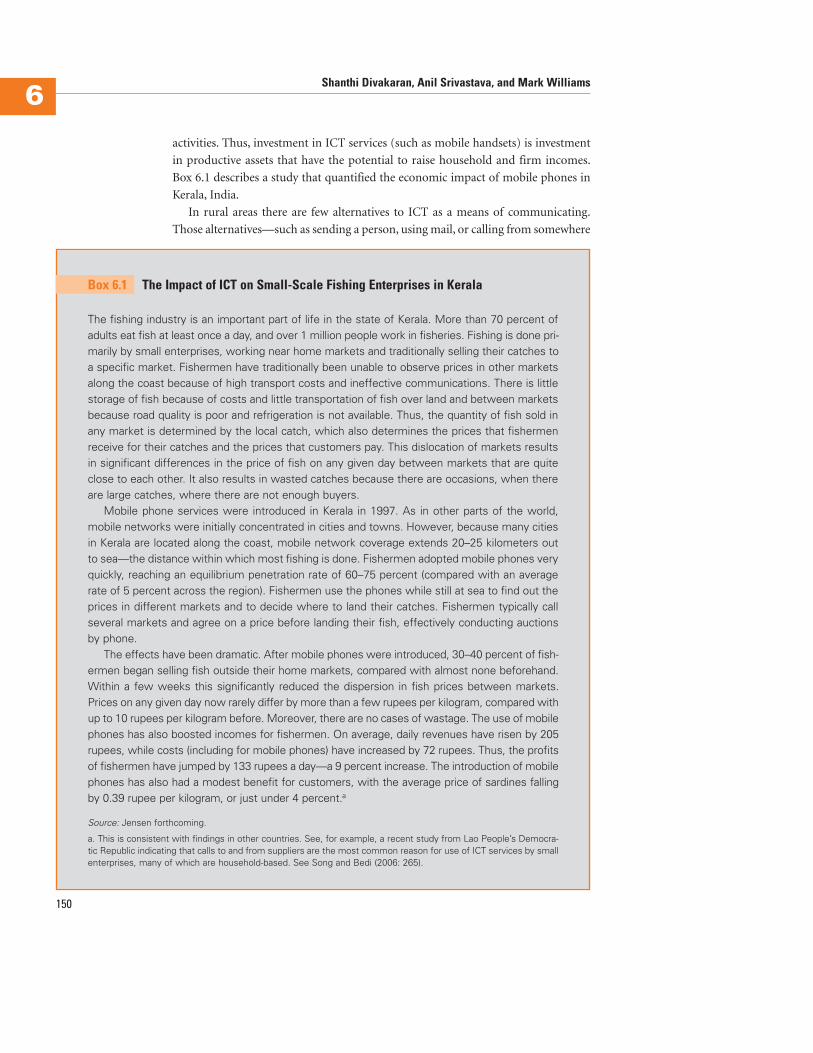
activities. Thus, investment in ICT services (such as mobile handsets) is investment
in productive assets that have the potential to raise household and firm incomes.
Box 6.1 describes a study that quantified the economic impact of mobile phones in
Kerala, India.
In rural areas there are few alternatives to ICT as a means of communicating.
Those alternatives—such as sending a person, using mail, or calling from somewhere
150
Shanthi Divakaran, Anil Srivastava, and Mark Williams6
The fishing industry is an important part of life in the state of Kerala. More than 70 percent ofadults eat fish at least once a day, and over 1 million people work in fisheries. Fishing is done pri-marily by small enterprises, working near home markets and traditionally selling their catches toa specific market. Fishermen have traditionally been unable to observe prices in other marketsalong the coast because of high transport costs and ineffective communications. There is littlestorage of fish because of costs and little transportation of fish over land and between marketsbecause road quality is poor and refrigeration is not available. Thus, the quantity of fish sold inany market is determined by the local catch, which also determines the prices that fishermenreceive for their catches and the prices that customers pay. This dislocation of markets resultsin significant differences in the price of fish on any given day between markets that are quiteclose to each other. It also results in wasted catches because there are occasions, when thereare large catches, where there are not enough buyers.
Mobile phone services were introduced in Kerala in 1997. As in other parts of the world,mobile networks were initially concentrated in cities and towns. However, because many citiesin Kerala are located along the coast, mobile network coverage extends 20–25 kilometers outto sea—the distance within which most fishing is done. Fishermen adopted mobile phones veryquickly, reaching an equilibrium penetration rate of 60–75 percent (compared with an averagerate of 5 percent across the region). Fishermen use the phones while still at sea to find out theprices in different markets and to decide where to land their catches. Fishermen typically callseveral markets and agree on a price before landing their fish, effectively conducting auctionsby phone.
The effects have been dramatic. After mobile phones were introduced, 30–40 percent of fish-ermen began selling fish outside their home markets, compared with almost none beforehand.Within a few weeks this significantly reduced the dispersion in fish prices between markets.Prices on any given day now rarely differ by more than a few rupees per kilogram, compared withup to 10 rupees per kilogram before. Moreover, there are no cases of wastage. The use of mobilephones has also boosted incomes for fishermen. On average, daily revenues have risen by 205rupees, while costs (including for mobile phones) have increased by 72 rupees. Thus, the profitsof fishermen have jumped by 133 rupees a day—a 9 percent increase. The introduction of mobilephones has also had a modest benefit for customers, with the average price of sardines fallingby 0.39 rupee per kilogram, or just under 4 percent.a
Source: Jensen forthcoming.
a. This is consistent with findings in other countries. See, for example, a recent study from Lao People’s Democra-tic Republic indicating that calls to and from suppliers are the most common reason for use of ICT services by smallenterprises, many of which are household-based. See Song and Bedi (2006: 265).
Box 6.1 The Impact of ICT on Small-Scale Fishing Enterprises in Kerala
farther away—usually have high monetary or nonmonetary costs. The value of elec-
tronic communication networks and the cost of alternatives usually mean that
uptake of these services is rapid when they become available. In Kerala, when mobile
phones became available, the telecommunications penetration rate among fisher-
men went from zero to an equilibrium rate of 60–75 percent in just a few months.
This effect is also seen at the national level, where the uptake of telecommunications
services grew 24 percent a year between 1995 and 2005.
Much of India’s population could benefit from ICT-driven innovation. The effect
on fishermen incomes described in box 6.1 could apply to any small enterprise
involved in producing and distributing perishable goods such as fish, fruit, vegeta-
bles, and livestock products. Nearly three-quarters of India’s population is rural.2 In
2005, agriculture (including fishing, logging, and forestry) accounted for 19 percent
of GDP and employed 60 percent of the workforce, making it the biggest sector of
the Indian economy. Agriculture is dominated by small-scale firms and household
enterprises. Thus, innovation brought about through ICT could positively affect a
huge portion of India’s population.
The availability of ICT infrastructure and services has increased dramatically
in recent years. High investment in ICT infrastructure and services, increased
competition, and lower equipment prices have raised teledensity and driven down
prices. As a result, Indian consumers now enjoy some of the world’s lowest
charges for mobile telecommunications. By September 2006 there were 41 million
wireline subscribers, 130 million wireless subscribers, and more than 1.8 million
broadband subscribers (Telecommunications Regulatory Authority of India
2006). The number of wireless subscribers is continuing to grow rapidly, increas-
ing by 55 percent in 2006, with an average of 6.5 million subscribers added in each
of the last three months of the year, for a total of roughly 150 million wireless sub-
scribers by end 2006—making India the world’s fastest-growing market for
mobile phones (Economist 2007). This rapid growth in penetration rates has
reduced the price of information for individuals and businesses, making it easier
to obtain information on, for example, prices of inputs and products. It has also
allowed companies to introduce innovations in how they run their businesses,
making it easier to stay in touch with staff, customers, and the various compo-
nents of the supply chain.
Still, despite the recent rapid increases in mobile and broadband subscribers,
India continues to lag behind some countries, and there is a large and growing gap
in teledensity between urban and rural areas (table 6.3). This gap is particularly
stark in broadband access. For example, penetration in China, a country of com-
parable size, is 30 times that in India. Average penetration rates also hide major
disparities in access between rural and urban areas. Teledensity in India is 40 per-
cent in urban areas, but just 4 percent in rural areas (figure 6.1). Only 45 percent
of India’s population is covered by a mobile signal—compared with more than
90 percent in China and South Africa. Thus, a priority for India is to increase the
availability of voice services in rural areas and ensure that broadband networks
are developed as quickly as possible.
Upgrading Information Infrastructure6
151
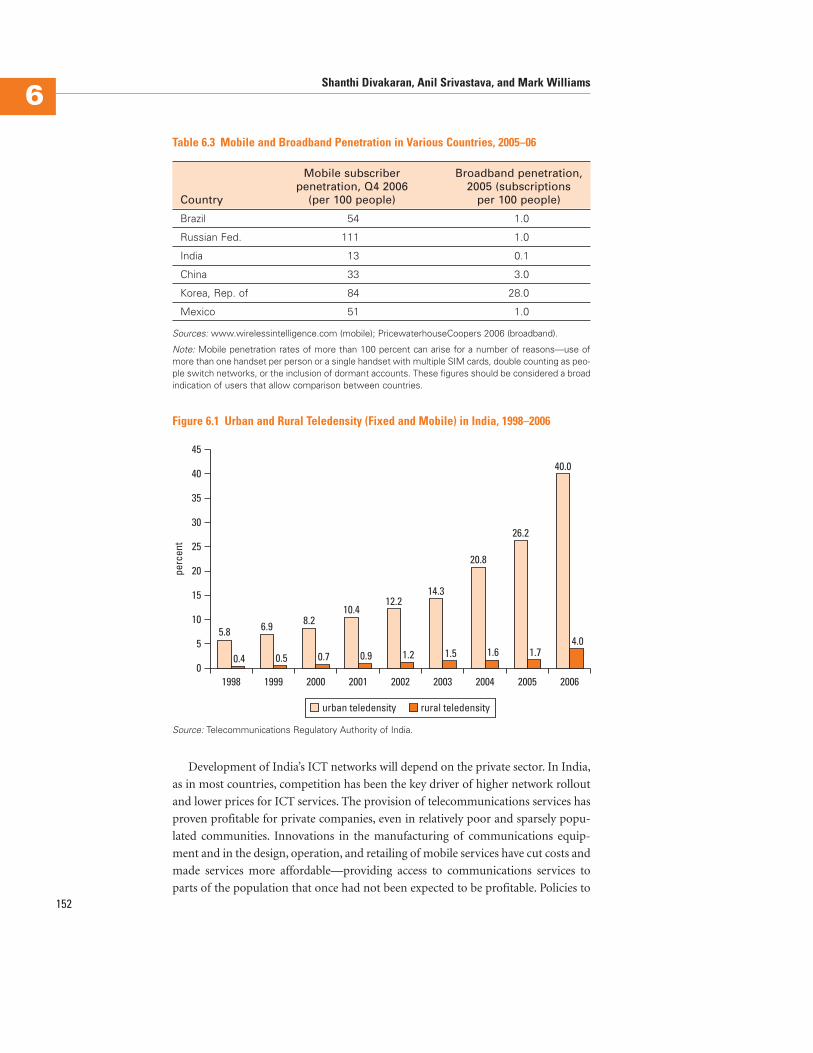
Development of India’s ICT networks will depend on the private sector. In India,
as in most countries, competition has been the key driver of higher network rollout
and lower prices for ICT services. The provision of telecommunications services has
proven profitable for private companies, even in relatively poor and sparsely popu-
lated communities. Innovations in the manufacturing of communications equip-
ment and in the design, operation, and retailing of mobile services have cut costs and
made services more affordable—providing access to communications services to
parts of the population that once had not been expected to be profitable. Policies to152
Shanthi Divakaran, Anil Srivastava, and Mark Williams6
Table 6.3 Mobile and Broadband Penetration in Various Countries, 2005–06
Mobile subscriber Broadband penetration,penetration, Q4 2006 2005 (subscriptions
Country (per 100 people) per 100 people)
Brazil 54 1.0
Russian Fed. 111 1.0
India 13 0.1
China 33 3.0
Korea, Rep. of 84 28.0
Mexico 51 1.0
Sources: www.wirelessintelligence.com (mobile); PricewaterhouseCoopers 2006 (broadband).
Note: Mobile penetration rates of more than 100 percent can arise for a number of reasons—use ofmore than one handset per person or a single handset with multiple SIM cards, double counting as peo-ple switch networks, or the inclusion of dormant accounts. These figures should be considered a broadindication of users that allow comparison between countries.
01998 1999 2000 2001 2002 2003 2004 2005 2006
5
10
15
20
25
30
35
40
45
perc
ent
5.8 6.9 8.210.4
12.214.3
20.8
26.2
40.0
0.4 0.5 0.7 0.9 1.2 1.5 1.6 1.74.0
urban teledensity rural teledensity
Figure 6.1 Urban and Rural Teledensity (Fixed and Mobile) in India, 1998–2006
Source: Telecommunications Regulatory Authority of India.
ensure that networks reach deeper into rural areas should build on this success by
encouraging competition and private investment in ICT. Looking ahead, there will be
increased emphasis on the availability of broadband to businesses and households.
Thus, policies should encourage the private sector to invest in innovative broadband
infrastructure—particularly in areas not currently served, such as rural communities.
Recommendations for Improving Access to ICT
The recent improvements in India’s communications infrastructure must continue. But
the emphasis should increasingly be on providing rural ICT infrastructure and ensur-
ing that high-speed data services are more widely available, particularly in underserved
areas. A multifaceted approach to improving access to telecommunications services in
both urban and rural areas is required. Key action areas include the following:
• Reducing network costs to make marginal areas more commercially viable. This
could be done through measures such as reducing domestic roaming tariffs, pro-
moting infrastructure sharing between operators, and facilitating access to land
and building space at low cost and access to existing backhaul networks.
• Expediting allocation of spectrum for wireless broadband rollout. Freeing up more
radio spectrum and making it available to operators of voice and data services
would reduce rollout costs and enable operators to accelerate the provision of
services, including broadband wireless services in rural areas. The government
has de-licensed the 5.15–5.35 gigahertz (GHz) and 5.725–5.875 GHz bands for
indoor use, and should de-license them for outdoor usage as well. De-licensing
would allow users to deploy wireless networks at much lower cost and provide
opportunities for innovation in wireless systems. Spectrum in other bands (such
as 2.3, 2.5, and 3.5 GHz) should be reallocated for broadband wireless access.
Spectrum in the 3.3–3.4 GHz band has been allocated to Internet service
providers on a citywide basis. The government should consider allocating this
spectrum in smaller geographic units to make more effective use of the resource.
• Cutting taxes. The government imposes various fees, levies, and taxes on tele-
com services. These include annual license fees of 6–12 percent, spectrum
charges of 2–5 percent, and service taxes of 8–12 percent. For an industry grow-
ing so quickly, these taxes and fees should be reduced. In a high-volume busi-
ness, lower taxes create a win-win situation for everyone. The government also
imposes an 8 percent tax on Internet service providers. Reducing or waiving
this tax would lower the cost of broadband access. In addition, some Indian
states levy a 30 percent entertainment tax on broadband subscriptions. The
central government should encourage state governments to waive this tax.
• Revising policies. The government should revise its policy definition of broad-
band, now defined as a minimum “always on” 256 kilobits per second (Kbps)
connection. Comparator countries (Brazil, China, the Republic of Korea, the
Russian Federation) have much higher definitions for broadband speeds.
Upgrading Information Infrastructure6
153
• Lowering network costs. Network costs could be lowered by facilitating the rollout
of backbone networks, encouraging competition in the provision of leased lines,
and facilitating access to the networks of operators in dominant economic posi-
tions. Access to last-mile connectivity should also be facilitated, because its
absence inhibits competition in backhaul and leased-line networks.
• Providing targeted subsidies for rural mobile and broadband rollout. This should be
done in a way that rewards efficiency, maximizes private investment, and does not
distort competition. Subsidies should be linked to the sharing of infrastructure
and be for a limited period—say, five years—to avoid distorting competition.
Developing ICT Infrastructure for Universities and High-EndResearch Institutes
There is growing awareness that high-speed research and education networks accel-
erate the pace of new discoveries and the expansion of knowledge by enabling col-
laboration. Around the world, national research and education networks (NRENs)
have become an essential part of R&D infrastructure (box 6.2). More than 70 coun-
tries connect researchers and scientists through high-speed networks with an emerg-
ing standard connectivity of 10 gigabits per second (Gbps), capable of transmitting
data at 1 trillion bits a second—the equivalent of transmitting a two-hour DVD in
154
Shanthi Divakaran, Anil Srivastava, and Mark Williams6
National research and education networks (NRENs) were conceived to meet the needs of high-end users through a dedicated infrastructure that restricts data traffic to high-end purposes.Although the Internet is a sufficient data transfer vehicle for the average user, the target clien-tele of NRENs is high-end users—such as research scientists—who need to transmit andaccess images and large amounts of data for computationally intensive problems.
NRENs typically operate as a layered hierarchy of national backbone, state or provincial net-works, and metropolitan area networks connecting individual campus networks. Institutions caneither connect directly to a point of presence on the backbone or to a regional or metropolitanarea network run by the NREN or a third party. Given the high capacity of the typical NREN back-bone network, traffic congestion usually occurs at the local area network level. Thus, regardlessof how much capacity the core has, the connectivity that researchers experience at each insti-tute is limited by the connectivity of their local area networks.
NRENs integrate scientists into a wider research community and provide easier access tonetworked resources and equipment than would otherwise be available to users in differentregions. Given the dedicated infrastructure and selective membership of NRENs, scientists arealso assured better security for data transfer and can authenticate their collaborators.
Source: http://internet2.edu; www.geant2.net; Seth 2006.
Box 6.2 What Are National Research and Education Networks?
Upgrading Information Infrastructure6
155
High energy and nuclear physics (HENP). Worldwide, HENP scientists have been leadingadopters of high-speed networking. Bandwidth use in the field is 1,000 times that of 10 yearsago, enabling huge datasets to be shared and processed by collaborators studying heavy-ioncollisions. The HENP network grew by 70 percent a year between 1992 and 1999, and sincethen by 100 percent a year. But the digital divide that prevents a number of HENP scientists indifferent regions from having access to high-performance networks has meant that theseresearchers cannot collaborate as equal partners in pushing out the HENP frontier.
Transmitting high-resolution images in real time. In October 2006, high-level specialists atthe National AIDS Research Institute (NARI) in Pune participated in an interactive clinical edu-cation program on HIV/AIDS with counterparts at the Johns Hopkins University in Baltimore,Maryland (United States). The program was unusual in that neither group of scientists had lefttheir home countries. Instead, clinical demonstrations were conveyed from Baltimore to Puneusing a high-resolution, multipoint video conference in real time.
During one of the demonstrations Dr. Sanjay Kedhkar, a Johns Hopkins clinical instructor ofophthalmology, talked NARI scientists through his examination of an HIV-positive patient’sretina while the scientists observed a three-dimensional image of the retina live onscreen. Theimage was transmitted through high-resolution video from Dr. Kedhkar’s equipment to JohnsHopkins University’s area network, which conveyed it to the European transnational network,GÉANT2, through the U.S. network, Internet2. GÉANT2 transmitted the data to India’s network,Education and Research Network (ERNET), allowing NARI scientists to observe the imagethrough the institute’s connection to ERNET—all in real time. A year ago such an event wouldnot have happened, simply because ERNET was not linked to GÉANT2.
Sources: Newman 2004; Johns Hopkins 2006.
Box 6.3 Applications by National Research and Education Networks
four seconds.3 These networks generally connect almost all the universities in their
countries and foster scientific and technological innovation. Their main impact on
the innovation economy is through the potential for higher academic and research
productivity using a high-speed mechanism to create and absorb knowledge by tap-
ping into a global network. NRENs facilitate international collaboration through
sharing of research data, joint experiments, conferences, building of databases, set-
ting of standards, and sharing of equipment, and provide a motivating force for solv-
ing global problems such as climate change and infectious disease control (Wagner
and others 2001: 102). The networks are also important for conducting frontier
research in next generation networking technology that can lead to even higher-
performance networks, and applications in health and education through the use of
imaging and telepresence—such as distance medical diagnostics and operating pro-
cedures, and interactive distance education (box 6.3).
Although the United States and Western Europe are global leaders in high-speed
research and education networking, many other regions are also investing in this
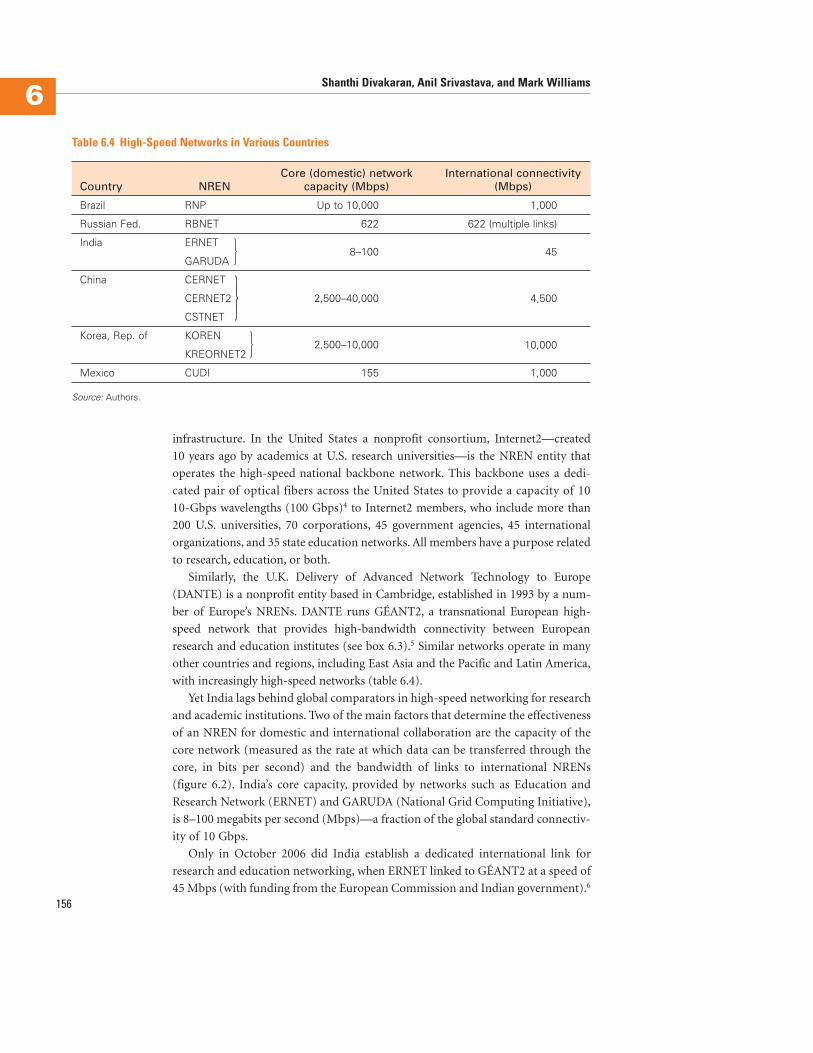
infrastructure. In the United States a nonprofit consortium, Internet2—created
10 years ago by academics at U.S. research universities—is the NREN entity that
operates the high-speed national backbone network. This backbone uses a dedi-
cated pair of optical fibers across the United States to provide a capacity of 10
10-Gbps wavelengths (100 Gbps)4 to Internet2 members, who include more than
200 U.S. universities, 70 corporations, 45 government agencies, 45 international
organizations, and 35 state education networks. All members have a purpose related
to research, education, or both.
Similarly, the U.K. Delivery of Advanced Network Technology to Europe
(DANTE) is a nonprofit entity based in Cambridge, established in 1993 by a num-
ber of Europe’s NRENs. DANTE runs GÉANT2, a transnational European high-
speed network that provides high-bandwidth connectivity between European
research and education institutes (see box 6.3).5 Similar networks operate in many
other countries and regions, including East Asia and the Pacific and Latin America,
with increasingly high-speed networks (table 6.4).
Yet India lags behind global comparators in high-speed networking for research
and academic institutions. Two of the main factors that determine the effectiveness
of an NREN for domestic and international collaboration are the capacity of the
core network (measured as the rate at which data can be transferred through the
core, in bits per second) and the bandwidth of links to international NRENs
(figure 6.2). India’s core capacity, provided by networks such as Education and
Research Network (ERNET) and GARUDA (National Grid Computing Initiative),
is 8–100 megabits per second (Mbps)—a fraction of the global standard connectiv-
ity of 10 Gbps.
Only in October 2006 did India establish a dedicated international link for
research and education networking, when ERNET linked to GÉANT2 at a speed of
45 Mbps (with funding from the European Commission and Indian government).6
156
Shanthi Divakaran, Anil Srivastava, and Mark Williams6
Table 6.4 High-Speed Networks in Various Countries
Core (domestic) network International connectivityCountry NREN capacity (Mbps) (Mbps)
Brazil RNP Up to 10,000 1,000
Russian Fed. RBNET 622 622 (multiple links)
India ERNET
GARUDA8–100 45
China CERNET
CERNET2
CSTNET
2,500–40,000 4,500
Korea, Rep. of KOREN
KREORNET22,500–10,000 10,000
Mexico CUDI 155 1,000
Source: Authors.
}
}
}
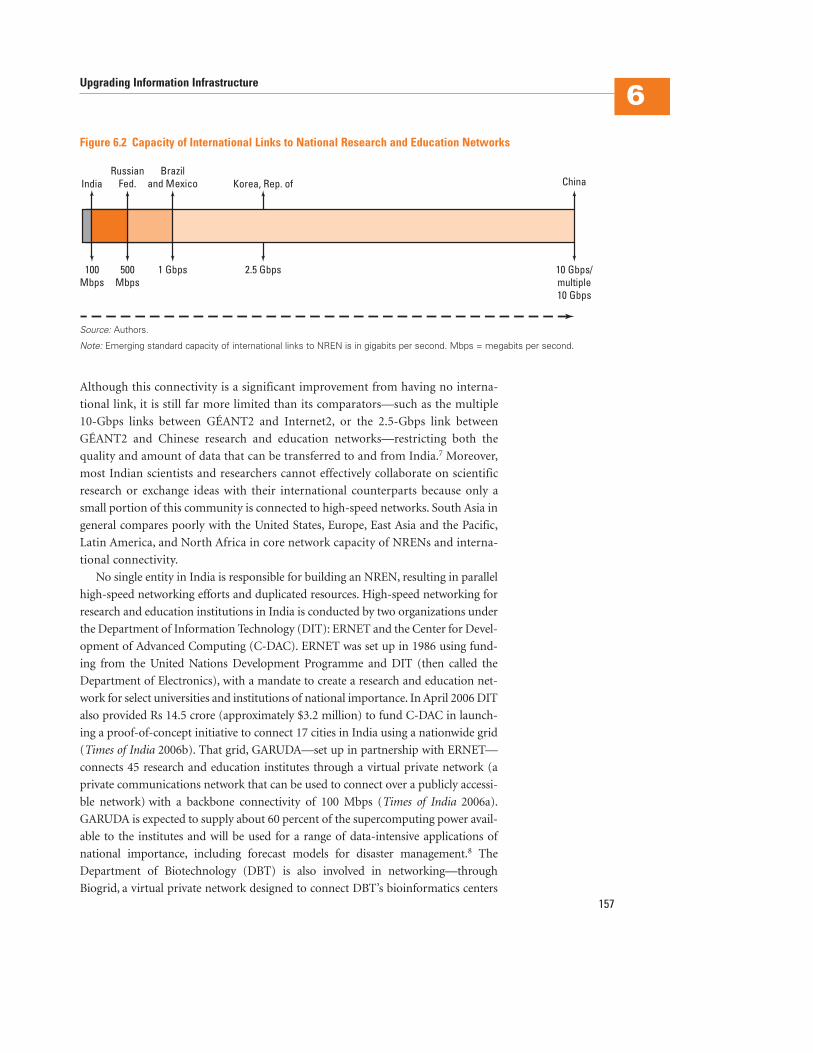
Although this connectivity is a significant improvement from having no interna-
tional link, it is still far more limited than its comparators—such as the multiple
10-Gbps links between GÉANT2 and Internet2, or the 2.5-Gbps link between
GÉANT2 and Chinese research and education networks—restricting both the
quality and amount of data that can be transferred to and from India.7 Moreover,
most Indian scientists and researchers cannot effectively collaborate on scientific
research or exchange ideas with their international counterparts because only a
small portion of this community is connected to high-speed networks. South Asia in
general compares poorly with the United States, Europe, East Asia and the Pacific,
Latin America, and North Africa in core network capacity of NRENs and interna-
tional connectivity.
No single entity in India is responsible for building an NREN, resulting in parallel
high-speed networking efforts and duplicated resources. High-speed networking for
research and education institutions in India is conducted by two organizations under
the Department of Information Technology (DIT): ERNET and the Center for Devel-
opment of Advanced Computing (C-DAC). ERNET was set up in 1986 using fund-
ing from the United Nations Development Programme and DIT (then called the
Department of Electronics), with a mandate to create a research and education net-
work for select universities and institutions of national importance. In April 2006 DIT
also provided Rs 14.5 crore (approximately $3.2 million) to fund C-DAC in launch-
ing a proof-of-concept initiative to connect 17 cities in India using a nationwide grid
(Times of India 2006b). That grid, GARUDA—set up in partnership with ERNET—
connects 45 research and education institutes through a virtual private network (a
private communications network that can be used to connect over a publicly accessi-
ble network) with a backbone connectivity of 100 Mbps (Times of India 2006a).
GARUDA is expected to supply about 60 percent of the supercomputing power avail-
able to the institutes and will be used for a range of data-intensive applications of
national importance, including forecast models for disaster management.8 The
Department of Biotechnology (DBT) is also involved in networking—through
Biogrid, a virtual private network designed to connect DBT’s bioinformatics centers
Upgrading Information Infrastructure6
157
Figure 6.2 Capacity of International Links to National Research and Education Networks
1 Gbps
India
500Mbps
RussianFed. ChinaKorea, Rep. of
100Mbps
2.5 Gbps
Braziland Mexico
10 Gbps/multiple10 Gbps
Source: Authors.
Note: Emerging standard capacity of international links to NREN is in gigabits per second. Mbps = megabits per second.
(Kolaskar 2006). Currently, the network connects 11 of the 62 bioinformatics centers
through 2-Mbps dedicated leased circuit lines.
The Council of Scientific and Industrial Research (CSIR) recently proposed
setting up a grid to connect its 38 labs using a backbone network of 155 Mbps,
providing 2 Mbps connectivity to each (Seth 2006). However, with technology for
high-performance networking progressing rapidly, most of these are examples of past
technologies and capacities no longer being used by leading NRENs. In addition, the
National Knowledge Commission, a high-level body created by the Indian govern-
ment in 2005, has proposed building a National Knowledge Network that would
connect 5,000 universities and research institutes all over India at a connectivity of
100 Mbps (National Knowledge Commission 2007). The lack of a single entity
aggregating high-end user demand is possibly unattractive to international NRENs
seeking to co-fund links to Indian networks.
The main responsibilities of entities that operate NRENs are to mobilize and
aggregate demand for high-speed networking, manage underlying infrastructure
through owned or leased models, and deliver services—including connections to
high-speed global networks—at agreed standards. To ensure independence from the
government in network operations, NRENs are typically designed as separate legal
entities (usually nonprofit organizations) controlled by the research and education
community, though they can be government funded. NREN funding arrangements
vary by country. Internet2, for instance, receives no federal funding: it is supported
entirely by corporate, university, and affiliate members.9 GÉANT2, however, is
co-funded by the European Commission, with 93 million euros (or roughly $120 mil-
lion) for a four-year period that started in September 2004. Partnering NRENs con-
nected to the network provide the remaining funding through subscription fees. For
more information, see box 6.4 and table 6.5.
158
Shanthi Divakaran, Anil Srivastava, and Mark Williams6
• The most common capacity among NRENs in 28 European Union/European Free TradeAgreement (EU/EFTA) countries is 10 Gbps.
• In 2006, only three EU/EFTA NRENs did not have a capacity of at least 1 Gbps.
• Primary and secondary schools are increasingly being connected by NRENs in many coun-tries, with connections mainly funded by ministries of education.
• More NRENs are switching to dark fiber—unlit fiber put in place for future use—which givesthem more control over network infrastructure and makes upgrading capacity easier.
• Developments in fiber optic technology are increasingly allowing NRENs to leapfrog to higher-capacity networks. (See table 6.5.)
Source: TERENA Compendium of National Research and Education Networks in Europe (www.terena.nl/compendium/).
Box 6.4 Trends among National Research and Education Networks in Europe
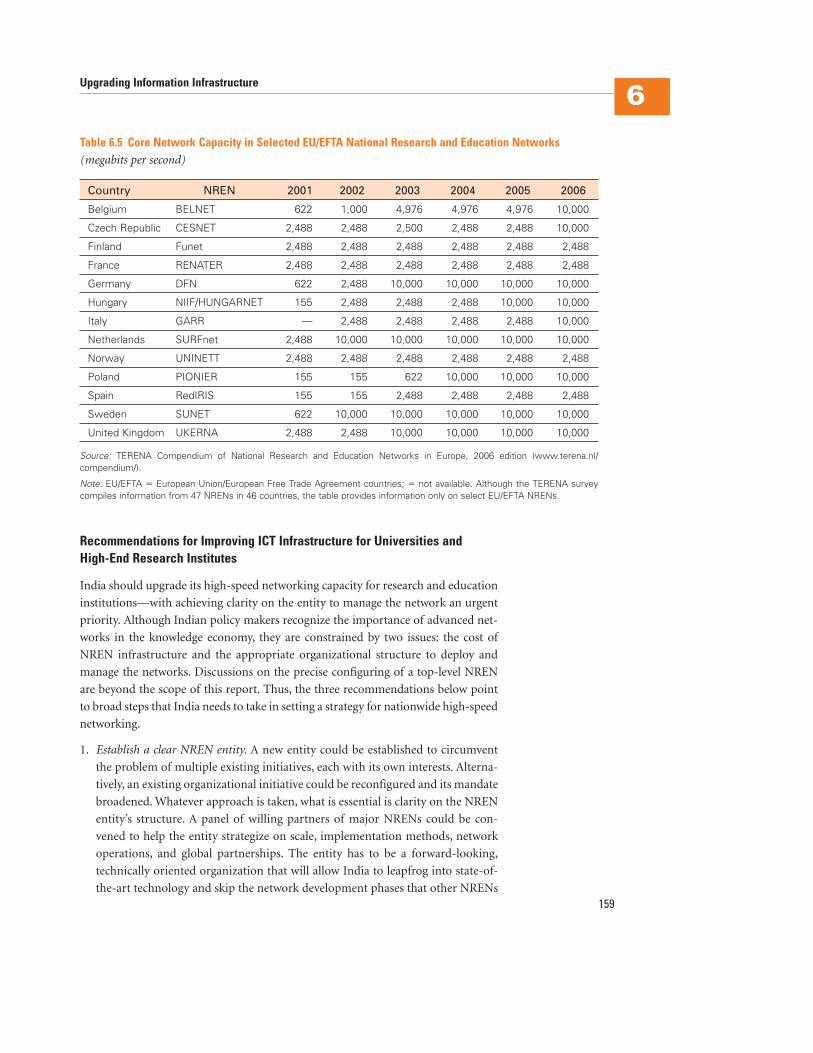
Recommendations for Improving ICT Infrastructure for Universities and High-End Research Institutes
India should upgrade its high-speed networking capacity for research and education
institutions—with achieving clarity on the entity to manage the network an urgent
priority. Although Indian policy makers recognize the importance of advanced net-
works in the knowledge economy, they are constrained by two issues: the cost of
NREN infrastructure and the appropriate organizational structure to deploy and
manage the networks. Discussions on the precise configuring of a top-level NREN
are beyond the scope of this report. Thus, the three recommendations below point
to broad steps that India needs to take in setting a strategy for nationwide high-speed
networking.
1. Establish a clear NREN entity. A new entity could be established to circumvent
the problem of multiple existing initiatives, each with its own interests. Alterna-
tively, an existing organizational initiative could be reconfigured and its mandate
broadened. Whatever approach is taken, what is essential is clarity on the NREN
entity’s structure. A panel of willing partners of major NRENs could be con-
vened to help the entity strategize on scale, implementation methods, network
operations, and global partnerships. The entity has to be a forward-looking,
technically oriented organization that will allow India to leapfrog into state-of-
the-art technology and skip the network development phases that other NRENs
Upgrading Information Infrastructure6
159
Table 6.5 Core Network Capacity in Selected EU/EFTA National Research and Education Networks(megabits per second)
Country NREN 2001 2002 2003 2004 2005 2006
Belgium BELNET 622 1,000 4,976 4,976 4,976 10,000
Czech Republic CESNET 2,488 2,488 2,500 2,488 2,488 10,000
Finland Funet 2,488 2,488 2,488 2,488 2,488 2,488
France RENATER 2,488 2,488 2,488 2,488 2,488 2,488
Germany DFN 622 2,488 10,000 10,000 10,000 10,000
Hungary NIIF/HUNGARNET 155 2,488 2,488 2,488 10,000 10,000
Italy GARR — 2,488 2,488 2,488 2,488 10,000
Netherlands SURFnet 2,488 10,000 10,000 10,000 10,000 10,000
Norway UNINETT 2,488 2,488 2,488 2,488 2,488 2,488
Poland PIONIER 155 155 622 10,000 10,000 10,000
Spain RedIRIS 155 155 2,488 2,488 2,488 2,488
Sweden SUNET 622 10,000 10,000 10,000 10,000 10,000
United Kingdom UKERNA 2,488 2,488 10,000 10,000 10,000 10,000
Source: TERENA Compendium of National Research and Education Networks in Europe, 2006 edition (www.terena.nl/compendium/).
Note: EU/EFTA � European Union/European Free Trade Agreement countries; � not available. Although the TERENA surveycompiles information from 47 NRENs in 46 countries, the table provides information only on select EU/EFTA NRENs.
have undergone. The entity must also oversee the engineering and operation of
NRENs, as well as drive the community that participates in developing it.10
2. Foster programmatic rollout. Any NREN entity would need to take into account
international best practices when setting up a prototype high-speed network
model before phasing into a larger-scale network—aggregating unused infra-
structure and building on it as needed. The prototype phase would be used to test
the selected management model, partnership arrangements, and forecasted
demand, and to incorporate lessons from other national and international infra-
structure management models. The NREN entity would also need to decide
whether to use an own or lease model for wider outreach and the type of telecom
carriers (public or private, and by region) that would be the best partners. Finally,
the entity should provide connectivity for end-user research and education insti-
tutions in phases—for instance, first to high-demand areas and clusters with a
concentration of universities and research institutes, then to institutes of national
importance and secondary and primary schools.
3. Encourage demand. The high capital investment required to establish a top-level
NREN implies higher risks if the infrastructure is underused. The business model
used to operate the NREN (including aspects such as the business arrangement
with partnering telecom carriers and internal fee structure) can have enormous
implications for its success. Making the NREN affordable in the early stage can be
an effective way of demonstrating the many uses of high bandwidth (Hindu
2006). Ensuring that NRENs are used also means subsidizing academic institu-
tions in their cyber infrastructure investments at the campus and local levels.
Given the high capacity of the typical NREN backbone network, traffic conges-
tion usually occurs at the local area network level. Thus, regardless of how much
capacity the core has, the connectivity that researchers experience at each insti-
tute is limited by the connectivity of their local area networks, which can be a bar-
rier to adoption. Government grants could circumvent this dilemma and increase
the use of NRENs. The National Science Foundation, for instance, provided crit-
ical funding to U.S. universities in the three to four years following Internet2’s
inception to subsidize their connections to the national backbone network. In
addition, if the culture and incentive regimes in academic and research institu-
tions do not demand the quality of research that requires the use of an NREN,
nationwide connectivity of these institutes could result in the infrastructure being
underused. Thus, the success of a top-level NREN partly depends on institutional
conditions that create demand for its use.
Notes
For questions or further information, please contact Shanthi Divakaran at [email protected], Anil Srivastava at [email protected], or Mark Williams at [email protected].
1. WTO data cited in Fernandez and Gupta (2006).
2. India census, 2001.160
Shanthi Divakaran, Anil Srivastava, and Mark Williams6
3. http://internet2.edu
4. Internet2 recently started to migrate its traffic to a new backbone that offers connectivity 10times that of the previous one, Abilene, which had a capacity of 10 Gbps. The first 10 10-Gbpslinks connected Washington, DC, New York, and Chicago in late 2006. Full migration is expectedto be complete in summer 2007.
5. More information is available at http://www.geant.net/.
6. At the time of writing, Internet2 was negotiating a 45-Mbps link with ERNET that would pro-vide a dedicated connection from Chennai to Singapore. This link would be cofunded by theU.S. National Science Foundation.
7. Johns Hopkins University 2006; informal communications with Heather Boyles, Director,Member and Partner Relations, Internet2 (January 2007) and Michael Foley, Consultant, SouthAsia Region, World Bank (January 2007).
8. Hindustan Times 2006. (See also www.hindustantimes.com and http://www.garudaindia.in/press_release.htm.)
9. Internet2 universities have made more than $80 million a year in investments on their own cam-puses and corporate members have committed more than $30 million over the life of the project.
10. Personal communication with Prof. Harvey Newman, California Institute of Technology,January 13, 2007.
References
Athreye, Suma S. 2005. “The Indian Software Industry.” In Information and Communication
Technologies for Development and Poverty Reduction: The Potential of Telecommunications,
eds. Maximo Torero and Joachim von Braun. Baltimore: Johns Hopkins University Press
and International Food Policy Research Institute.
Economist. 2007. “Indian Telecoms.” January 13.
Fernandez, Enric, and Poonam Gupta. 2006. “Understanding the Growth Momentum in
India’s Services.” In India Goes Global: Its Expanding Role in the World Economy, eds.
Catriona Purfield and Jerald Schiff. Washington, DC: International Monetary Fund.
Hindu. 2006. “India Must Quickly ‘Light Up’ for Science.” February 17.
Hindustan Times. 2006. “MNIT, HRI Set to Fly High on ‘GARUDA’ Wings.” April 12.
Jensen, Robert. Forthcoming. “The Digital Provide: Information (Technology), Market Perfor-
mance and Welfare in the South Indian Fisheries Sector.” Quarterly Journal of Economics.
Johns Hopkins University. 2006. Press release, September 28, Baltimore, MD.
Kannan, Gopika, and Jibanananda Khuntia. 2006. “High Performance Computing Networks
for Research, Education, Science, and Technology in India.” GARUDA India, Pune.
Kolaskar, A. S. 2006. “Research and Education Networks in India.” Background paper
commissioned by South Asia Finance and Private Sector Development, World Bank,
Washington, DC.
NASSCOM (National Association of Software and Service Companies) and McKinsey. 2005.
“Extending India’s Leadership of the Global IT and BPO Industries.” Mumbai.
National Knowledge Commission. 2007. Report to Nation 2006. New Delhi.
Newman, Harvey B. 2004. “Networking for High Energy and Nuclear Physics as Global
E-Science.” Unpublished, California Institute of Technology, Pasadena, CA.
PricewaterhouseCoopers. 2006. “Global Entertainment and Media Outlook: 2006–2010.”
Purfield, Catriona, and Jerald Schiff, eds. 2006. India Goes Global: Its Expanding Role in the
World Economy. Washington, DC: International Monetary Fund.
Qiang, Christine Zhen-Wei, George R. Clarke, and Naomi Halewood. 2006. Information and
Communications for Development: Global Trends and Policies. Washington, DC: World Bank.
Upgrading Information Infrastructure6
161
Qiang, Christine Zhen-Wei, and Alexander Pitt. 2004. “Contribution of Information and Com-
munication Technologies to Growth.”Working Paper No. 24, World Bank, Washington, DC.
Röller, Lars-Hendrik, and Leonard Waverman. 2001. “Telecommunications Infrastructure and
Economic Development: A Simultaneous Approach.” American Economic Review 91 (4):
909–23.
Seth, D. P. S. 2006. “A Report on National Knowledge Network.” National Knowledge Com-
mission, New Delhi. http://knowledgecommission.gov.in.
Song, Gi-Soon, and Arjun S. Bedi. 2006.“The Benefits of Rural Telecommunications: The Case
of Laos.” In Information and Communication Technologies for Development and Poverty
Reduction: The Potential of Telecommunications, eds. Maximo Torero and Joachim von
Braun. Baltimore: Johns Hopkins University Press and International Food Policy Research
Institute.
Telecommunications Regulatory Authority of India. 2006. Press Release 97/2006. October 12.
Times of India. 2006a. “GARUDA Ready for Take-off in April.” March 29.
———. 2006b.“GARUDA to Link Many Institutes” and “GARUDA Set to Take Wing.” June 15.
Wagner, Caroline, Irene Brahmakulam, Brian Jackson, Anny Wong, and Tatsuro Yoda. 2001.
“Science and Technology Collaboration: Building Capacity in Developing Countries?”
Document Number MR-1357.0-WB, RAND Corporation, Santa Monica, CA.
162
Shanthi Divakaran, Anil Srivastava, and Mark Williams6
163
Accessing finance for innovation is a challenge, even in economies with well-developed
financial markets. Although access to finance does not pose as big a challenge for large
and even medium firms, it is a severe constraint for smaller enterprises, start-ups, and
innovative grassroots projects. Access to finance for innovation is an important link in
the innovation cycle—covering innovation costs, supporting incubation, and financ-
ing commercialization—making innovation sustainable and rewarding. Around the
world, constraints in financing innovative enterprises include the following:
• Actual and perceived risks arising from the higher failure rates of innovative
micro, small, and medium enterprises (MSMEs), and unproven products and
business models
• Lack of management and operational capabilities among technopreneurs and
scarce mentoring resources
• Information asymmetries—given that entrepreneurs and innovators are more
comfortable with innovation than are financiers, partly because of lack of techni-
cal expertise among financiers
• High transaction costs of dealing with start-ups and MSMEs given the small size
of seed and early-stage investment relative to investment efforts (due diligence)
and the time required in hand-holding and mentoring start-up management
teams.
• Difficulties in attracting experienced investment professionals as fund managers
in seed and early-stage funds as a result of the long gestation period for returns
on such investment and the lower remuneration—the 2.0–2.5 percent manage-
ment fee from managing small funds ($10 million–$30 million) is less than that
from managing larger, later-stage, and private equity funds.
Enhancing Innovation FinanceInderbir Singh Dhingra
7Chapter
164
Inderbir Singh Dhingra7
• Lack of reliable, adequate track records and financial information (adverse selec-
tion challenge).
• Lack of adequate collateral and the intangible nature of the assets of the
enterprises.
• Institutional and legal factors, including competition-related distortions and
inefficiencies in the banking sector, an underdeveloped legal system and enforce-
ment, and inadequate information infrastructure.1
These constraints are also present in India, which has a well-developed public and
private equity market relative to most other emerging markets.2
Government funding has played an important role in India’s early-stage technol-
ogy development (ESTD), but has not achieved the desired scale and quality of
research and development (R&D) investment and commercialization. As discussed
in earlier chapters, there is considerable scope for strengthening India’s performance
in knowledge creation and commercialization, raising R&D, increasing the effective-
ness of public R&D, and deepening interactions among R&D labs, universities, and
the private sector by, among other things, restructuring or scaling up grant-based
initiatives. Furthermore, new initiatives are needed to stimulate knowledge creation
(see chapter 2).
Although venture capital and private equity have been expanding in India in
recent years, funding of seed and early-stage finance remains a key challenge. In
2005, early-stage funding accounted for just 13 percent of the deals by the venture
capital and private equity industry. In dollar terms, early-stage deals account for 4–6
percent of investment by the venture capital and private equity industry.3 Despite a
significant number of major funds being created in India in the past 12–18 months,
there remains a bias toward larger funds, information technology (IT), and proven
business models. New efforts in seed and angel funding that are trying to fill the gap
still have insufficient capital to meet the needs of early-stage finance.
The supply of early-stage venture capital could be increased by creating incentives
for domestic liquidity from wealthy individuals and allowing insurance and pension
funds to provide early-stage venture capital. In addition, a fund of funds could be
created to spur public-private venture capital funds, with the goal of attracting pri-
vate capital and international and domestic expertise and fund management experi-
ence in early-stage venture capital. Finally, to address the demand side for the venture
capital industry, the flow of deals must be enhanced through multipronged reforms
to improve the overall innovation climate as well as the governance, incentives, and
design of India’s innovation system, as discussed in previous chapters. This involves
restructuring and enhancing public support for ESTD and incentives for R&D com-
mercialization in labs and universities—promoting a culture of entrepreneurship
and social support, providing complementary infrastructure and an enabling envi-
ronment for innovation and entrepreneurship, and improving the overall invest-
ment climate for firms.
The magnitude of the financing gap for technology absorption by MSMEs is
unknown, but the constraints facing MSMEs in financing new investments suggest
its significance. Credit to Indian micro and small enterprises (MSEs), which includes
financing for upgrading technology, fell as a share of net bank credit between 2003
and 2006. Government schemes to spur technology financing for MSEs, such as the
Credit Linked Capital Subsidy Scheme for upgrading technology in small-scale
industries, have also not allocated enough capital to support knowledge absorption
by firms. Enterprise surveys suggest that funding for absorption of innovative prac-
tices is more constrained for smaller enterprises and traditional industries. Measures
to improve access to finance for MSMEs would improve access to finance for inno-
vative MSMEs wishing to upgrade technology. Possible government actions include
providing matching grants for technology absorption as well as addressing con-
straints to MSME finance—including improving credit information on MSMEs,
strengthening collateral and mortgage registries, reforming the bankruptcy frame-
work, and facilitating leasing.
Financial Support for Early-Stage Technology Development
The higher risks associated with seed capital for ESTD result in fewer sources of pri-
vate funding. The literature cites two key reasons the market for funding ESTD,4 and
even early-stage business operations, may not be efficient—making the case for pub-
lic intervention.5 The first is the partial appropriability of returns from investment
in R&D—due to positive spillovers—which does not allow original inventors
or investors to capture all the benefits of their inventions and innovations. This
results in lower spending on ESTD than would be socially optimal. The second rea-
son is information asymmetry, arising from the gap between the information avail-
able to inventors and investors. Most investors are poorly equipped to quantify the
risks and technical and market uncertainties associated with most inventions. More-
over, the due diligence required to close this information gap discourages investors
(angel investors, venture capitalists), who prefer to wait to see the business case for a
new technology at least partly demonstrated before investing.
The role of government and angel investors is more important in ESTD. Informal
sources and grant-based government programs play a larger role in ESTD funding,
injecting capital into a company’s product concept stage—when the idea is being con-
ceptualized. ESTD funding can continue to the seed stages of a company’s develop-
ment. In the United States, for example, federal and state governments provide 23–30
percent of ESTD finance, while angel investors contribute 24–27 percent. Venture
capital contributes only 3–8 percent.6 In India, government programs have played a
larger role in funding early-stage finance than have angel investors and university-
funded incubators. Formal groups of angel investors, such as the Band of Angels, have
been created only recently. University-funded incubators have played an important
role in giving initial support, but venture capital is not always available through these
incubators. Moreover, many of these incubators are not adequately funded and lack
facilities to support a large number of entrepreneurs. Government support for ESTD
has mainly been in the form of grants, soft loans, and government-funded incubators.
Enhancing Innovation Finance7
165
The main government programs have varied in their goals—from promoting high-
technology ventures, as with the New Millennium Indian Technology Leadership Ini-
tiative (NMITLI) (though not funding start-ups), to funding indigenous technology,
as with the Technology Development Board (TDB). Although these programs have
targeted early-stage funding, some seem not to have been managed well, and the
funds have not been used (see chapter 2).
Although data are lacking on the demand for early-stage financing in India, the
vibrant innovation environment signals high potential for entrepreneurial activity
(Dossani and Desai 2006). A growing number of graduates, the boom in IT and
IT-related sectors, and the rise in business-savvy young professionals with the
potential to create spin-off ventures create a rich entrepreneurial environment
in India. The risk in ignoring the financing needs of these potential entrepreneurs
at the conceptualization and proof-of-concept stage is that the economy loses by
allowing only a small portion of its entrepreneurs to achieve their potential. As
discussed in chapter 2 and shown in figure 7.1, a number of government programs
target ESTD finance.
ESTD efforts are not creating a sufficient level and quality of demand for the ven-
ture capital industry. As discussed in earlier chapters, anecdotal evidence and indi-
cators of India’s performance in knowledge creation and commercialization through
R&D are poor. Low overall R&D, dominance of public R&D, limited interaction
between R&D labs, universities, and productive sectors of the economy—all point to
a need to restructure and scale up grant-based initiatives.
Recommendations for Improving ESTD Financing
The various ESTD financing schemes were discussed in chapter 2, and three recom-
mendations based on that analysis are summarized here.
1. An independent evaluation of government programs is needed. The first step in
correcting the mismatch between the need to promote entrepreneurial ventures
and the shortage of capital in ESTD is to assess government spending on ESTD
programs, with a view to improving governance, correcting design flaws, and
addressing funding gaps:
• The evaluation should review the roles, goals, governance structures, costs,
performance, outcomes, and impacts of such programs.
• The programs, including government-supported business incubators, should
be assessed to gain a broad understanding of which sectors of ESTD the gov-
ernment currently finances and the impacts and returns of this financing.
• Based on these reviews, changes should be made in the programs—including
their expansion, consolidation, and closing, as appropriate.
2. Efforts should be made to create new initiatives and build on existing programs. As
recommended in chapter 2, efforts should be made to develop initiatives that166
Inderbir Singh Dhingra7
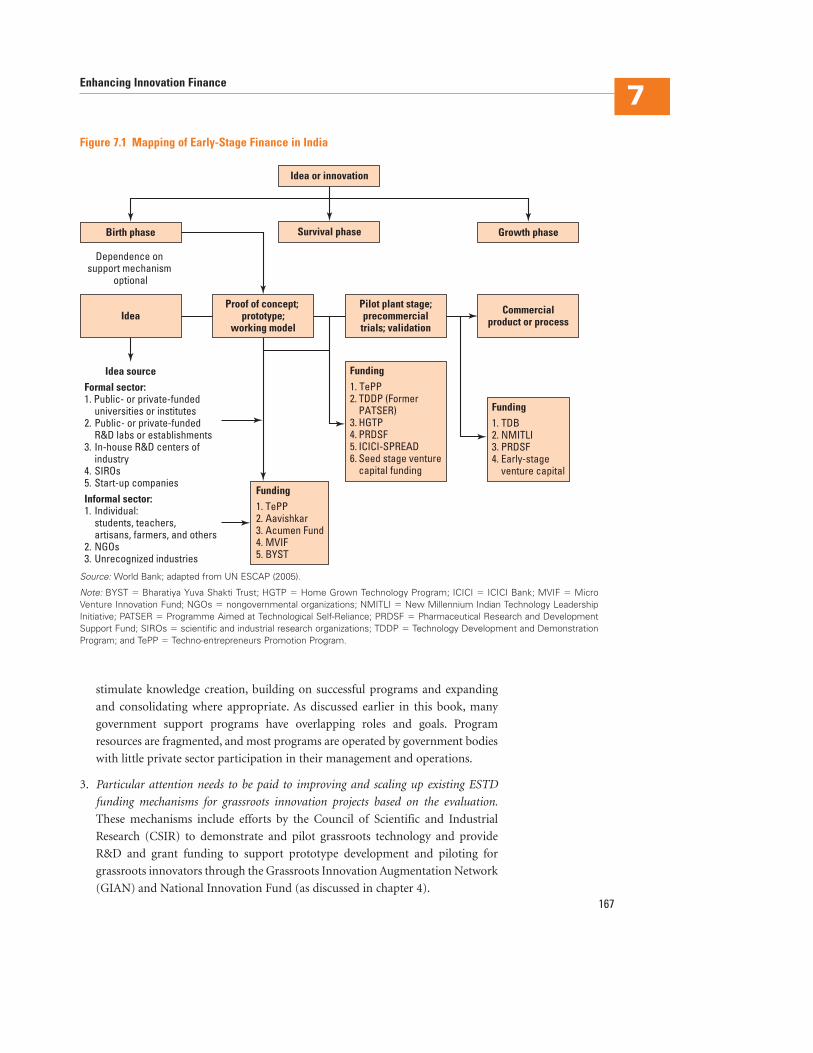
stimulate knowledge creation, building on successful programs and expanding
and consolidating where appropriate. As discussed earlier in this book, many
government support programs have overlapping roles and goals. Program
resources are fragmented, and most programs are operated by government bodies
with little private sector participation in their management and operations.
3. Particular attention needs to be paid to improving and scaling up existing ESTD
funding mechanisms for grassroots innovation projects based on the evaluation.
These mechanisms include efforts by the Council of Scientific and Industrial
Research (CSIR) to demonstrate and pilot grassroots technology and provide
R&D and grant funding to support prototype development and piloting for
grassroots innovators through the Grassroots Innovation Augmentation Network
(GIAN) and National Innovation Fund (as discussed in chapter 4).
Enhancing Innovation Finance7
167
Survival phase
Idea or innovation
Growth phaseBirth phase
Funding1. TePP2. TDDP (Former PATSER)3. HGTP4. PRDSF5. ICICI-SPREAD6. Seed stage venture capital funding
Funding1. TDB2. NMITLI3. PRDSF4. Early-stage venture capital
Dependence on support mechanism
optional
Formal sector:1. Public- or private-funded universities or institutes2. Public- or private-funded R&D labs or establishments3. In-house R&D centers of
industry4. SIROs5. Start-up companiesInformal sector:1. Individual: students, teachers,
artisans, farmers, and others 2. NGOs3. Unrecognized industries
Funding1. TePP2. Aavishkar3. Acumen Fund4. MVIF5. BYST
IdeaPilot plant stage;precommercial
trials; validation
Proof of concept; prototype;
working model
Commercialproduct or process
Idea source
Figure 7.1 Mapping of Early-Stage Finance in India
Source: World Bank; adapted from UN ESCAP (2005).
Note: BYST � Bharatiya Yuva Shakti Trust; HGTP � Home Grown Technology Program; ICICI � ICICI Bank; MVIF � MicroVenture Innovation Fund; NGOs � nongovernmental organizations; NMITLI � New Millennium Indian Technology LeadershipInitiative; PATSER � Programme Aimed at Technological Self-Reliance; PRDSF � Pharmaceutical Research and DevelopmentSupport Fund; SIROs � scientific and industrial research organizations; TDDP � Technology Development and DemonstrationProgram; and TePP � Techno-entrepreneurs Promotion Program.
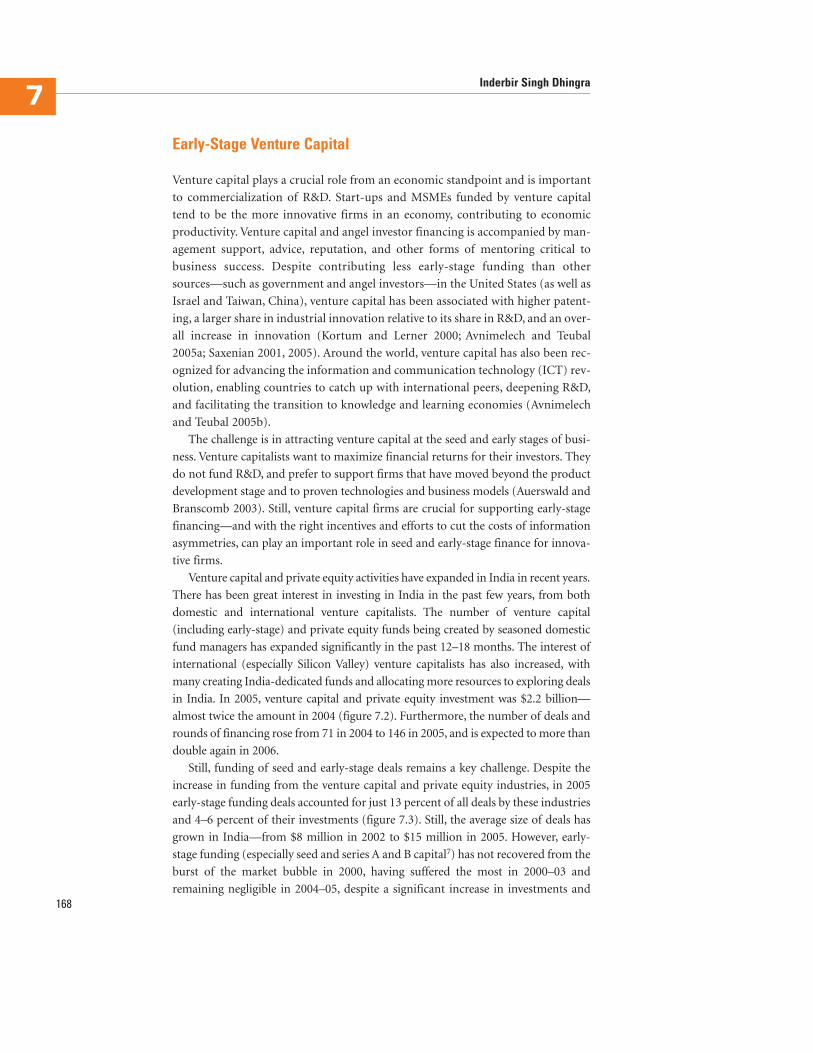
Early-Stage Venture Capital
Venture capital plays a crucial role from an economic standpoint and is important
to commercialization of R&D. Start-ups and MSMEs funded by venture capital
tend to be the more innovative firms in an economy, contributing to economic
productivity. Venture capital and angel investor financing is accompanied by man-
agement support, advice, reputation, and other forms of mentoring critical to
business success. Despite contributing less early-stage funding than other
sources—such as government and angel investors—in the United States (as well as
Israel and Taiwan, China), venture capital has been associated with higher patent-
ing, a larger share in industrial innovation relative to its share in R&D, and an over-
all increase in innovation (Kortum and Lerner 2000; Avnimelech and Teubal
2005a; Saxenian 2001, 2005). Around the world, venture capital has also been rec-
ognized for advancing the information and communication technology (ICT) rev-
olution, enabling countries to catch up with international peers, deepening R&D,
and facilitating the transition to knowledge and learning economies (Avnimelech
and Teubal 2005b).
The challenge is in attracting venture capital at the seed and early stages of busi-
ness. Venture capitalists want to maximize financial returns for their investors. They
do not fund R&D, and prefer to support firms that have moved beyond the product
development stage and to proven technologies and business models (Auerswald and
Branscomb 2003). Still, venture capital firms are crucial for supporting early-stage
financing—and with the right incentives and efforts to cut the costs of information
asymmetries, can play an important role in seed and early-stage finance for innova-
tive firms.
Venture capital and private equity activities have expanded in India in recent years.
There has been great interest in investing in India in the past few years, from both
domestic and international venture capitalists. The number of venture capital
(including early-stage) and private equity funds being created by seasoned domestic
fund managers has expanded significantly in the past 12–18 months. The interest of
international (especially Silicon Valley) venture capitalists has also increased, with
many creating India-dedicated funds and allocating more resources to exploring deals
in India. In 2005, venture capital and private equity investment was $2.2 billion—
almost twice the amount in 2004 (figure 7.2). Furthermore, the number of deals and
rounds of financing rose from 71 in 2004 to 146 in 2005, and is expected to more than
double again in 2006.
Still, funding of seed and early-stage deals remains a key challenge. Despite the
increase in funding from the venture capital and private equity industries, in 2005
early-stage funding deals accounted for just 13 percent of all deals by these industries
and 4–6 percent of their investments (figure 7.3). Still, the average size of deals has
grown in India—from $8 million in 2002 to $15 million in 2005. However, early-
stage funding (especially seed and series A and B capital7) has not recovered from the
burst of the market bubble in 2000, having suffered the most in 2000–03 and
remaining negligible in 2004–05, despite a significant increase in investments and168
Inderbir Singh Dhingra7
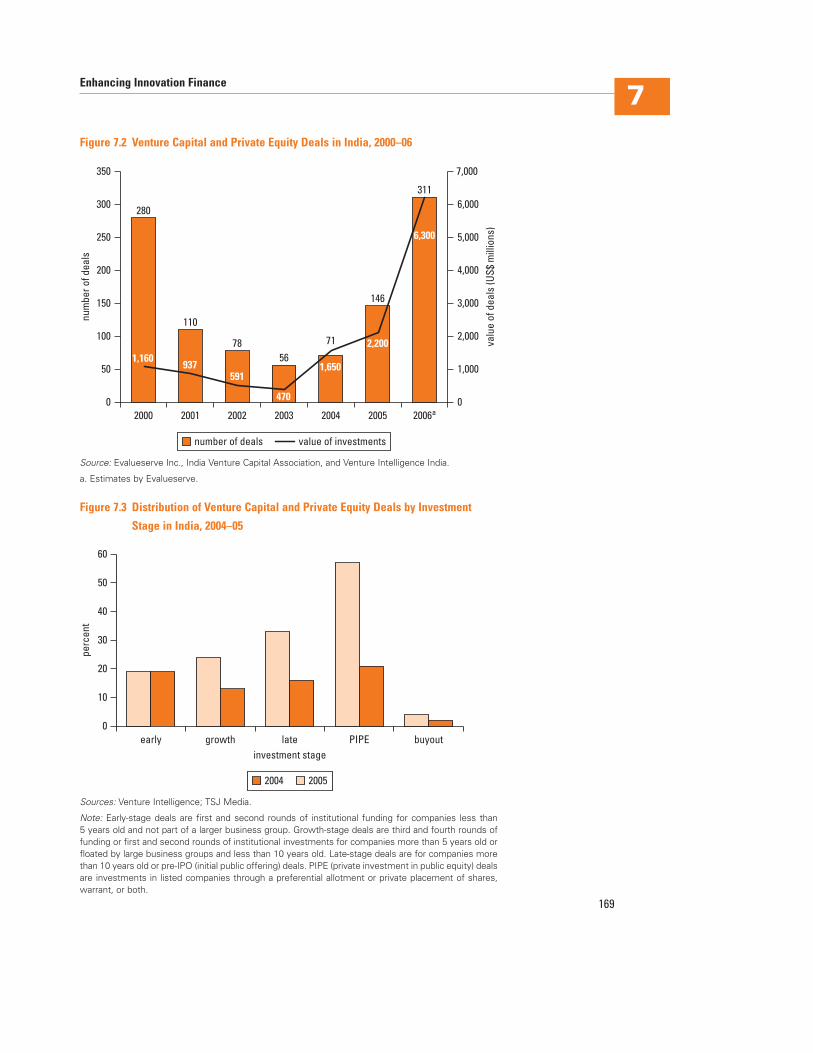
Enhancing Innovation Finance7
169
311
6,300
02000
50
100
150
200
250
300
350
0
1,000
2,000
3,000
4,000
5,000
6,000
7,000
valu
eof
deal
s(U
S$m
illio
ns)
num
bero
fdea
ls
2001 2002 2003 2004 2005 2006a
number of deals value of investments
280
1,160
110
937
78
591
56
470
146
2,20071
1,650
Figure 7.2 Venture Capital and Private Equity Deals in India, 2000–06
Source: Evalueserve Inc., India Venture Capital Association, and Venture Intelligence India.
a. Estimates by Evalueserve.
early0
10
20
30
40
50
60
growth lateinvestment stage
PIPE buyout
perc
ent
2004 2005
Figure 7.3 Distribution of Venture Capital and Private Equity Deals by Investment
Stage in India, 2004–05
Sources: Venture Intelligence; TSJ Media.
Note: Early-stage deals are first and second rounds of institutional funding for companies less than 5 years old and not part of a larger business group. Growth-stage deals are third and fourth rounds offunding or first and second rounds of institutional investments for companies more than 5 years old orfloated by large business groups and less than 10 years old. Late-stage deals are for companies morethan 10 years old or pre-IPO (initial public offering) deals. PIPE (private investment in public equity) dealsare investments in listed companies through a preferential allotment or private placement of shares,warrant, or both.
deals in other venture capital and private equity categories (table 7.1). Most growth
has been in the mid-market segment of the venture capital industry (under $10 mil-
lion). The challenge is greatest for start-ups requiring investments of less than
$2 million–$3 million, especially investments in the seed-stage range of $0.5 mil-
lion–$1.0 million.8
Venture capital biases have resulted in disproportionate funding for certain early-
stage ventures. The bias toward later-stage ventures often results in “overfunding” of
start-ups by venture capital firms reluctant to do smaller transactions—an approach
that is not always in the interests of efficiency and discipline of the start-ups. Another
key feature of the venture capital–private equity scenario is the bias toward funding
IT and IT-enabled service companies, which received 61 percent of the funding from
the venture capital–private equity industry in 2005 (though there was more sectoral
diversification in 2006). Most of these resources and efforts are directed toward early-
to-growth-stage start-ups and those with cross-border business models (either
addressing the international—especially U.S.—market or U.S. firms planning to off-
shore operations or R&D in India).
Despite the significant number of major “India dedicated” funds raised in the
past 12–18 months, there remains a bias toward larger funds, IT, and proven business
models. Silicon Valley venture capitalists interested in India are inclined to take min-
imum exposures in the $10 million–$15 million range to justify the transaction costs
associated with doing deals. Some, such as Bessemer Ventures, have drastically
shifted their business models for India, taking equity exposures in large private
equity transactions in non-IT firms instead of the Silicon Valley model of being
early-stage technology investors. Even “early-stage” funds such as Helion Venture
Partners prefer cross-border business models. The government-supported venture
capitalists created in the early 1990s—the Small Industries Development Bank of
India (SIDBI), Gujarat Venture Finance Ltd. (GVFL), and Andhra Pradesh Industrial
Development Corporation (APIDC)9—along with Westbridge-Sequoia, remain the
only major players for $0.5 million–$3.0 million investments (figure 7.4).
New efforts in seed and angel funding (Seed Fund, Band of Angels, Nadathur
Holdings) trying to fill the gap have insufficient capital. Funds are also being provided
(mostly in the form of grants) to some leading technology incubators by the Depart-
ment of Science and Technology (see chapter 2). Estimates by the Seed Fund indicate
that existing money for seed financing in India, including from government-
sponsored funds and private sector efforts, is much less than is required.10 Total
cumulative start-up capital available in this segment is $25 million–$35 million—
enough to help 75–100 start-ups get off the ground. But available series A and B170
Inderbir Singh Dhingra7
Table 7.1 Number of Early-Stage Deals in India, 2000–05
Type 2000 2001 2002 2003 2004 2005
Seed 74 14 7 5 6 5
Series A and B 68 22 9 8 23 14
Source: Venture Intelligence, TSJ Media, and Evalueserve Inc.
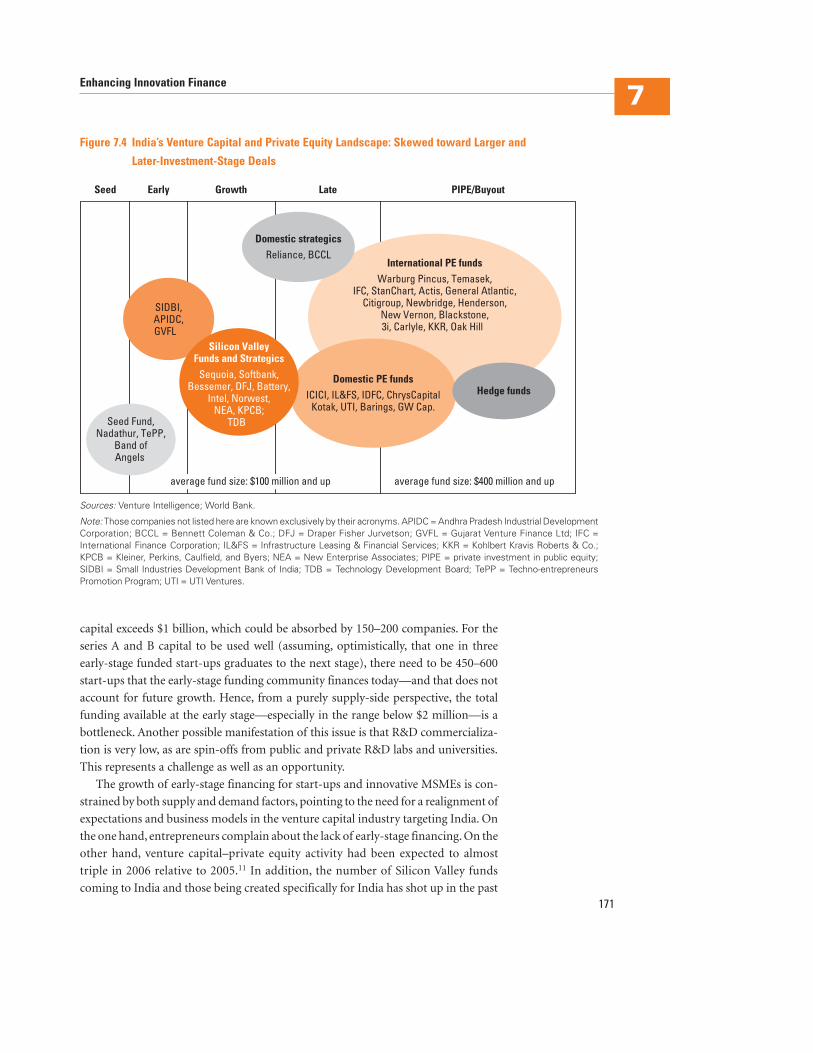
capital exceeds $1 billion, which could be absorbed by 150–200 companies. For the
series A and B capital to be used well (assuming, optimistically, that one in three
early-stage funded start-ups graduates to the next stage), there need to be 450–600
start-ups that the early-stage funding community finances today—and that does not
account for future growth. Hence, from a purely supply-side perspective, the total
funding available at the early stage—especially in the range below $2 million—is a
bottleneck. Another possible manifestation of this issue is that R&D commercializa-
tion is very low, as are spin-offs from public and private R&D labs and universities.
This represents a challenge as well as an opportunity.
The growth of early-stage financing for start-ups and innovative MSMEs is con-
strained by both supply and demand factors, pointing to the need for a realignment of
expectations and business models in the venture capital industry targeting India. On
the one hand, entrepreneurs complain about the lack of early-stage financing. On the
other hand, venture capital–private equity activity had been expected to almost
triple in 2006 relative to 2005.11 In addition, the number of Silicon Valley funds
coming to India and those being created specifically for India has shot up in the past
Enhancing Innovation Finance7
171
PIPE/BuyoutLateEarly Growth
average fund size: $400 million and upaverage fund size: $100 million and up
Seed
International PE fundsWarburg Pincus, Temasek,
IFC, StanChart, Actis, General Atlantic,Citigroup, Newbridge, Henderson,
New Vernon, Blackstone,3i, Carlyle, KKR, Oak Hill
Domestic PE fundsICICI, IL&FS, IDFC, ChrysCapital
Kotak, UTI, Barings, GW Cap.
SIDBI,APIDC,GVFL
Silicon ValleyFunds and Strategics
Sequoia, Softbank,Bessemer, DFJ, Battery,
Intel, Norwest,NEA, KPCB;
TDB
Domestic strategicsReliance, BCCL
Hedge funds
Seed Fund,Nadathur, TePP,
Band ofAngels
Figure 7.4 India’s Venture Capital and Private Equity Landscape: Skewed toward Larger and
Later-Investment-Stage Deals
Sources: Venture Intelligence; World Bank.
Note: Those companies not listed here are known exclusively by their acronyms. APIDC = Andhra Pradesh Industrial DevelopmentCorporation; BCCL = Bennett Coleman & Co.; DFJ = Draper Fisher Jurvetson; GVFL = Gujarat Venture Finance Ltd; IFC =International Finance Corporation; IL&FS = Infrastructure Leasing & Financial Services; KKR = Kohlbert Kravis Roberts & Co.;KPCB = Kleiner, Perkins, Caulfield, and Byers; NEA = New Enterprise Associates; PIPE = private investment in public equity;SIDBI = Small Industries Development Bank of India; TDB = Technology Development Board; TePP = Techno-entrepreneursPromotion Program; UTI = UTI Ventures.
12–18 months. Venture capital fund managers complain about the lack of deal flows
and idea generation. This is arguably the result of different expectations on both sides.
Most Silicon Valley and other new venture capital funds planning to invest in India
are based on expectations of a pool of a U.S- or Israeli-type start-up base—with
international business models, product companies, and the like. Furthermore, they
seem to want to invest in sectors that they are more comfortable with—IT, telecom-
munications, and Internet products and services. Much of the entrepreneur base
coming out of India may be predicated on a domestic market, consumer-based
model, from first-time entrepreneurs with experience in service businesses and not
necessarily the intellectual property–led product model that Silicon Valley venture
capitalists are used to. Moreover, the levels of evolution and sophistication of these
entrepreneurs are unlikely to meet the expectations of Silicon Valley venture capital-
ists (Evalueserve 2006). Finally, as noted, the deal-size filter of the new entrants still
would not address the seed and series A and B needs of Indian entrepreneurs. A
realignment of expectations and business models in India’s venture capital industry is
highly likely in the coming years.
On the supply side, a more rapid scaling up of early-stage financing would be
facilitated by addressing the following issues:
• Lack of adequate, relevant expertise among venture capitalists and perceived unat-
tractiveness of the effort required relative to the returns in investing in early-stage
companies—which explains the inclination of India’s venture capital–private
equity industry to invest in later-stage companies needing growth capital or early-
stage businesses adopting variants of demonstrated business models. In addition,
the domestic and foreign financial sector and nonresident Indian dominance of
venture capital have led to a venture capital–private equity industry that shies away
from riskier, more innovative, and business-building venture capital and favors
less labor-intensive, less risky, and more finance- and business-restructuring,
later-stage investment. The larger share of private equity transactions is a mani-
festation, at least in part, of this phenomenon.
• Difficulty in attracting experienced professionals in seed and early-stage fund man-
agement. Three problems exist here: first, the significant effort and cost involved
in continual hand-holding and mentoring management of a start-up; second,
the long gestation period for returns in seed and early-stage investment relative
to late-stage and private equity investment; and third, the lower remuneration
arising from the fact that the 2.0–2.5 percent management fee from managing
small funds ($10 million–$30 million) is less than that from managing larger,
later-stage, and private equity funds.
• Inability to channel domestic market liquidity into early-stage funding. The neg-
ligible funding from wealthy individuals and the virtual absence of funding
from pension and insurance funds have deprived the industry of stable, long-
term sources of capital available in more developed markets. Restrictive
investment guidelines constrain the ability of pension and insurance funds to172
Inderbir Singh Dhingra7
invest in venture capital. Venture capital funding was once classified as man-
dated lending for banks, but no longer. Moreover, the Reserve Bank of India
has increased the risk weighting for venture capital funding for banks. The tax
treatment and absence of incentives for venture capital relative to other asset
classes—especially public equity, debt, and real estate—has made venture
capital unattractive to rich people.
• Inadequate legal, regulatory, and tax environment (see Dossani and Desai 2006).
India’s policy and regulatory environment for venture capital can generally be
considered pro-investor and has been improving, moving toward international
best practice. Although the legal, regulatory, and tax environment has not been
a binding constraint in attracting large and medium funds, bureaucratic hurdles
need to be eased for domestic and foreign venture capitalists looking to operate
in India—particularly for smaller, niche funds. For example, rules need to be
clearer about the taxation of ventures, investors, and funds, as do the implica-
tions for the legal and institutional structures of venture capital firms. In addi-
tion, there are multiple regulations and little harmonization of guidelines across
government agencies (Securities and Exchange Board of India, Reserve Bank of
India, Central Board of Direct Taxes, Ministry of Company Affairs). There are
also sectoral and security restrictions on investments by venture capitalists.
Finally, investor rights are unclear as well.
On the demand side, the early-stage venture capital environment would be more
attractive if the following issues were addressed:
• A limited number of deals are bankable. India has been relatively unsuccessful in
nurturing a culture of entrepreneurship—especially of start-ups spinning off
from R&D labs, education institutions, and large corporations. In 2003, the
number of registered firms in India grew by 4.4 percent, compared with 8.6 per-
cent in China, 9.7 percent in Ireland, 19.4 percent in the United Kingdom, and
23.4 percent in Germany (Klapper and others 2006). This may be due to a vari-
ety of factors, such as the incentives for public R&D and education institutions
(as discussed in previous chapters), the lack of a social safety net, sociocultural
attitudes toward failure, and the legal framework for business entry, operations,
and exit.12 In addition, the gap in precommercial financing and ESTD—typically
supported by public institutions to spur R&D investment—results in too few
spin-offs; in India such funding could come from the venture capital industry.
Moreover, financiers often complain about the limited number of “big” ideas
with the potential to provide returns as high as 200–500 percent, to satisfy port-
folio diversification criteria.
• Although Indian entrepreneurs typically possess technical and domain expertise on
par with their Western counterparts, they lack skills in marketing, sales, business
development, and financial planning and processes. With such skills, the expected
effects of venture capital in nurturing early-stage business would be much higher.
The lack of such skills discourages venture capitalists from investing in very
Enhancing Innovation Finance7
173
early-stage businesses headed by inexperienced entrepreneurs with new business
models, but also presents a chicken-and-egg situation—whereby the venture cap-
ital industry itself lacks sufficient personnel with operating experience that could
nurture “raw” investments.
• The risk perception associated with start-ups and MSMEs is higher in India due to
investment climate bottlenecks. Surveys by the World Bank and others point to the
difficulties facing Indian firms relative to those in developed and other emerg-
ing markets. These difficulties stem from three issues. The first is the lack of
adequate, reliable infrastructure. The second is the burden of business regula-
tions, which result in significant management time being spent dealing with
government regulations. And the third is the cumbersome legal system, which
makes contract enforcement and business exit tedious, expensive, and time-
consuming.13 In addition, corporate governance and financial transparency
standards are lower in Indian firms than in more developed markets, further
increasing the risk perception of deals.
Recommendations for Improving Early-Stage Venture Capital Financing
Governments can increase the supply of venture capital by investing public funds in
these companies or by making it more attractive for nongovernment sources to do so.
Investors seek to generate the highest risk-adjusted returns on their capital. In many
countries they believe that the potential returns from venture investments do not jus-
tify the risks. Thus, government support programs that seek to encourage private
investment must either enhance potential returns or increase the supply of funds to
early-stage projects. Specific interventions include direct participation, or“seeding”of
venture funds; tax credits, as a direct offset of a share of investors’ capital investment;
government loans or loan guarantees to licensed venture funds; leveraged equity par-
ticipation by government in private equity funds to increase the potential returns to
private investors; and partial guarantees against losses for investors in venture funds—
only up to certain levels, to ensure that investors take sufficient risks themselves.
First, the supply of early-stage venture capital can be increased by extending
incentives for providing domestic liquidity to the industry. Changes in tax, Securities
and Exchange Board of India, and insurance and pension fund guidelines could
attract domestic investment in early-stage venture capital by doing the following:
• Making it more attractive for wealthy individuals to invest in venture capital funds.
Fiscal incentives could encourage wealthy individuals—including those with
domain knowledge and an appetite for risk—to plug the gap in angel investment.
Investments in eligible funds and ventures could be given tax credits. In addi-
tion, the Securities and Exchange Board of India could permit “accredited”
wealthy individuals’ investments in eligible venture capital funds to enjoy the
same tax benefits (tax pass-through) available to registered funds under current
regulations. This could provide a useful way to connect domestic and foreign
angel investors to Indian start-ups, especially because the costly and complex174
Inderbir Singh Dhingra7
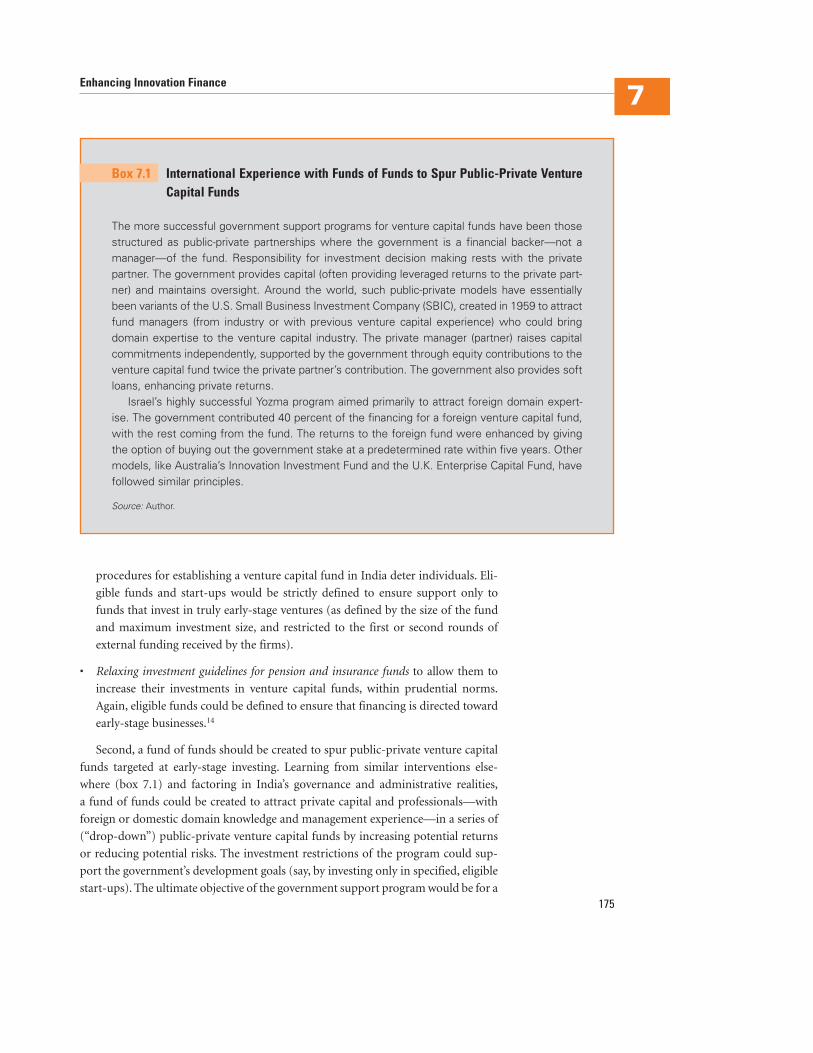
procedures for establishing a venture capital fund in India deter individuals. Eli-
gible funds and start-ups would be strictly defined to ensure support only to
funds that invest in truly early-stage ventures (as defined by the size of the fund
and maximum investment size, and restricted to the first or second rounds of
external funding received by the firms).
• Relaxing investment guidelines for pension and insurance funds to allow them to
increase their investments in venture capital funds, within prudential norms.
Again, eligible funds could be defined to ensure that financing is directed toward
early-stage businesses.14
Second, a fund of funds should be created to spur public-private venture capital
funds targeted at early-stage investing. Learning from similar interventions else-
where (box 7.1) and factoring in India’s governance and administrative realities,
a fund of funds could be created to attract private capital and professionals—with
foreign or domestic domain knowledge and management experience—in a series of
(“drop-down”) public-private venture capital funds by increasing potential returns
or reducing potential risks. The investment restrictions of the program could sup-
port the government’s development goals (say, by investing only in specified, eligible
start-ups). The ultimate objective of the government support program would be for a
Enhancing Innovation Finance7
175
The more successful government support programs for venture capital funds have been thosestructured as public-private partnerships where the government is a financial backer—not amanager—of the fund. Responsibility for investment decision making rests with the privatepartner. The government provides capital (often providing leveraged returns to the private part-ner) and maintains oversight. Around the world, such public-private models have essentiallybeen variants of the U.S. Small Business Investment Company (SBIC), created in 1959 to attractfund managers (from industry or with previous venture capital experience) who could bringdomain expertise to the venture capital industry. The private manager (partner) raises capitalcommitments independently, supported by the government through equity contributions to theventure capital fund twice the private partner’s contribution. The government also provides softloans, enhancing private returns.
Israel’s highly successful Yozma program aimed primarily to attract foreign domain expert-ise. The government contributed 40 percent of the financing for a foreign venture capital fund,with the rest coming from the fund. The returns to the foreign fund were enhanced by givingthe option of buying out the government stake at a predetermined rate within five years. Othermodels, like Australia’s Innovation Investment Fund and the U.K. Enterprise Capital Fund, havefollowed similar principles.
Source: Author.
Box 7.1 International Experience with Funds of Funds to Spur Public-Private VentureCapital Funds
successful drop-down fund to subsequently raise funds based on its record, without
government support, to be free of regulation. By supporting the first fund, therefore,
the government would facilitate much more private capital for venture investments in
the future. Considerations in designing the fund of funds include the following:
• The government provides leveraged returns to private investors in drop-down funds.
To form the base of venture investment funds, private fund managers (experi-
enced individuals, institutions, or both) would secure investment commitments
from unrelated private sources. The government would provide a certain amount
and limit its share of the profits to a certain interest rate plus a certain share of
cash distributions from the funds. The remaining profits would be paid to the
private investors and fund managers, increasing (or leveraging) their returns.
These enhanced returns would make venture capital funds attractive investments
for private investors and individuals with domain expertise and mentoring skills.
• Government support (or a separate window of government support) could be used to
reduce risk for risk-averse investors such as Indian institutions. In this case, private
investors would put up all the money for venture capital funds by purchasing
units that are, as an illustration, one-third equity and two-thirds 10-year debt.
The government would guarantee repayment of any debt not repaid from cash
distributions from the fund. Because accrued interest will normally be greater
than investors’ equity investment, investors would know that, at the very worst,
they will recover the full cost of their investment. At best, investors will realize the
high returns that the funds expect to earn.
• The extent and nature of government contributions would need to vary depending on
the segment being targeted. For example, to fund industrial start-ups, the govern-
ment could provide equity contributions with leveraged upside to private
investors, as mentioned in the first option. In addition, this fund of funds could
have separate windows, with different investment terms, for creating funds—such
as seed funds, early-stage funds, sector-specific funds (biotech, for instance), grass-
roots innovations, and MSMEs. For rural industry funds or pro-poor and grass-
roots innovations, government contributions could be in the form of low-cost
loans. Expected returns for these funds would be lower than for traditional venture
capital funds. In addition, the government may need to provide grants to defray
staffing and due diligence costs, especially for seed stage and pro-poor innovation
funds, to attract talent with investment and operational experience who can add
value through intensive mentoring to rural and grassroots entrepreneurs.
• It is critical that administration of the fund of funds be professional, free of bureau-
cratic burdens, and independent of political interference. Hence, a small, inde-
pendent institution could be created. Administration of the fund of funds could
conceivably be a joint venture between the government and the private sector.
The two main functions of the administrative body would be to select fund
managers and funds to be supported, and to monitor the program once under
way. The fund of funds could initially be created by consolidating some existing176
Inderbir Singh Dhingra7
government schemes administered by the Technology Development Board
(TDB), Technology Information Forecasting and Assessment Council (TIFAC),
and Department of Scientific and Industrial Research (DSIR)—with individual
venture funds to be majority-owned and managed by the private sector.
Support for pro-poor innovation will likely require a higher grant element, because
the business model for “commercial” capital to support grassroots innovations is still
evolving.15 Still, principles of professional venture capital and equity investment
should be institutionalized even in venture capital funds that support grassroots inno-
vations. Government contributions could be a mix of grants and soft equity. The
grants could defray staffing and due diligence costs, since attracting the right kind of
management and due diligence experience for grassroots investment is even more dif-
ficult than for early-stage investing in the formal sector (as mentioned above). The soft
equity could provide leveraged returns to private partners while trying to demonstrate
a viable business model. Aavishkar and Acumen Fund are pioneering efforts that could
shape the design of support programs for grassroots innovations. For example, Acu-
men Fund is targeting at least a return on capital invested, and Aavishkar is targeting a
positive internal rate of return (though not as high as in traditional venture capital).
“Social venture capital” may need to use a different mix of instruments than is ordi-
narily used—for example, a small equity investment with disproportionate voting
rights in certain cases combined with conditional, sales- and royalty-based loans.
There are examples in India of venture capital funds with partial public equity
contributions, being managed by private managers—such as the Gujarat Venture
Finance Ltd. (GVFL) and Andhra Pradesh Industrial Development Corporation
(APIDC) venture capital funds. Moreover, the collaboration between APIDC and
TDB involves TDB co-investing with the APIDC fund and being entitled to “soft”
returns, while APIDC investors profit from any upside potential from the invest-
ments. Lessons from these and other experiences of government support to venture
capital in India over the past two decades would need to be incorporated in the
design of the fund of funds.
On the demand side, it is crucial that any intervention supporting venture capital
be preceded or complemented by interventions addressing the ESTD funding gap.
Thus, for a venture capital instrument to work effectively, there must be a pipeline or
deal flow of companies with commercial potential.A venture capital program is there-
fore likely to work best where support for R&D through a grants program provides
critical funding at early stages to advance companies to the level that they can be sup-
ported by venture capital firms.Venture capital measures should also be coupled with
reforms that improve conditions for developing a venture capital industry, including
revisions to venture capital legislation and capital market reforms that increase stock
market liquidity. Countries with some of the most robust venture capital industries—
the United States, Israel, Canada, Australia—have active programs at all stages of the
innovation life cycle, from grants through venture capital support programs. For
example, Australia’s R&D Start program provides grants for commercializing inno-
vations by MSMEs and is complemented by its Innovation Funds program, which
encourages venture capital investment in innovative MSMEs (World Bank 2006b).
Enhancing Innovation Finance7
177
Improving deal flow requires multipronged reforms to improve the overall inno-
vation climate as well as the governance, incentives, and design of India’s innovation
system, as discussed in previous chapters. Recommendations for increasing the qual-
ity and quantity of deal flow for the venture capital industry include the following:
• Increasing the scale and scope of public support for business R&D and incentives for
research and commercialization. As noted in chapters 2 and 4 and in the preceding
section on ESTD finance, this involves improving governance and scaling up or
restructuring existing R&D grant schemes. It also requires, where relevant, intro-
ducing cooperative and horizontal R&D grant elements in these schemes. Equally
important are incentives for R&D labs and universities that encourage commer-
cialization of R&D and industry linkages. These can be achieved through legislation
similar to the U.S. Bayh-Dole Act, which provided incentives for universities to
invest in research (see chapter 2), and the U.S. Stevenson-Wydler Act, which
encouraged the transfer of technology from labs to industry through cooperative
research. Such legislation is not necessarily aimed at addressing binding constraints,
but is intended more as a signaling tool to encourage R&D commercialization.
• Fostering an entrepreneurial culture and social support. This involves promoting
social norms encouraging entrepreneurship—especially becoming more forgiving
of failure and placing a high social value on commercial success. The literature on
innovation and entrepreneurship worldwide emphasizes tough bankruptcy laws
and procedures as key impediments to greater entry of firms (and hence start-ups)
and competition. A more entrepreneurial culture could be achieved by conduct-
ing media campaigns (for example, highlighting the success of first-generation
entrepreneurs in IT and manufacturing), promoting innovation and entrepre-
neurship awards, and creating entrepreneurship funds and technology spin-off
funds (for spin-offs from corporations, R&D labs, and universities).
• Developing complementary infrastructure and an enabling environment for innova-
tion and entrepreneurship—such as technology incubators, science and technology
parks, university linkages, and business development services (see chapter 2).
• Improving the investment climate and the enabling environment for business entry,
operations, and exit (see chapter 1). Needed are entrepreneur-friendly policies
that encourage competition from new entrants, bankruptcy laws that permit
quick recovery, and a strong intellectual property regime that creates incentives
for invention and encourages research and diffusion.
Finance for Technology Absorption by Small and Medium Enterprises
Although no official data exist on the size of the finance gap facing MSMEs wishing
to upgrade technology, constraints facing MSMEs in financing new investments sug-
gest that it is large. In India, financing the adoption of innovation by MSMEs is as178
Inderbir Singh Dhingra7
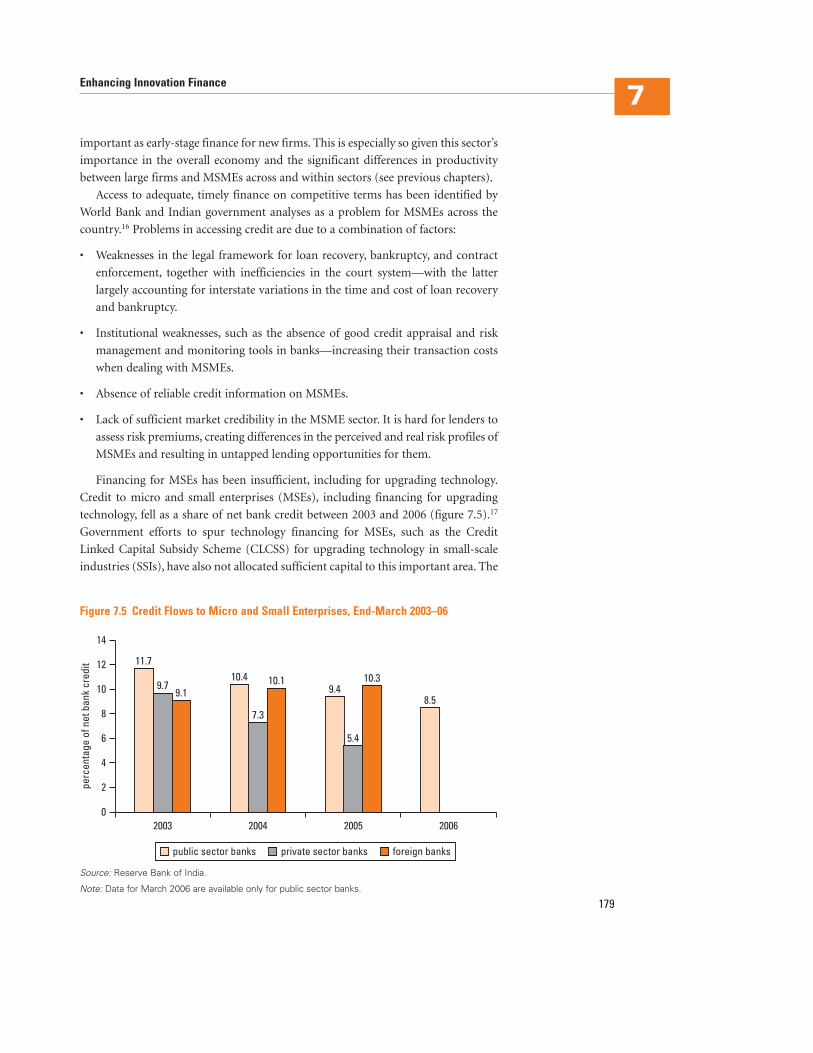
important as early-stage finance for new firms. This is especially so given this sector’s
importance in the overall economy and the significant differences in productivity
between large firms and MSMEs across and within sectors (see previous chapters).
Access to adequate, timely finance on competitive terms has been identified by
World Bank and Indian government analyses as a problem for MSMEs across the
country.16 Problems in accessing credit are due to a combination of factors:
• Weaknesses in the legal framework for loan recovery, bankruptcy, and contract
enforcement, together with inefficiencies in the court system—with the latter
largely accounting for interstate variations in the time and cost of loan recovery
and bankruptcy.
• Institutional weaknesses, such as the absence of good credit appraisal and risk
management and monitoring tools in banks—increasing their transaction costs
when dealing with MSMEs.
• Absence of reliable credit information on MSMEs.
• Lack of sufficient market credibility in the MSME sector. It is hard for lenders to
assess risk premiums, creating differences in the perceived and real risk profiles of
MSMEs and resulting in untapped lending opportunities for them.
Financing for MSEs has been insufficient, including for upgrading technology.
Credit to micro and small enterprises (MSEs), including financing for upgrading
technology, fell as a share of net bank credit between 2003 and 2006 (figure 7.5).17
Government efforts to spur technology financing for MSEs, such as the Credit
Linked Capital Subsidy Scheme (CLCSS) for upgrading technology in small-scale
industries (SSIs), have also not allocated sufficient capital to this important area. The
Enhancing Innovation Finance7
179
0
2
4
6
perc
enta
geof
netb
ank
cred
it
8
10
12
2003
11.7
9.79.1
10.4
7.3
10.1
14
2004 2005 2006
9.4
5.4
10.3
8.5
public sector banks private sector banks foreign banks
Figure 7.5 Credit Flows to Micro and Small Enterprises, End-March 2003–06
Source: Reserve Bank of India.
Note: Data for March 2006 are available only for public sector banks.
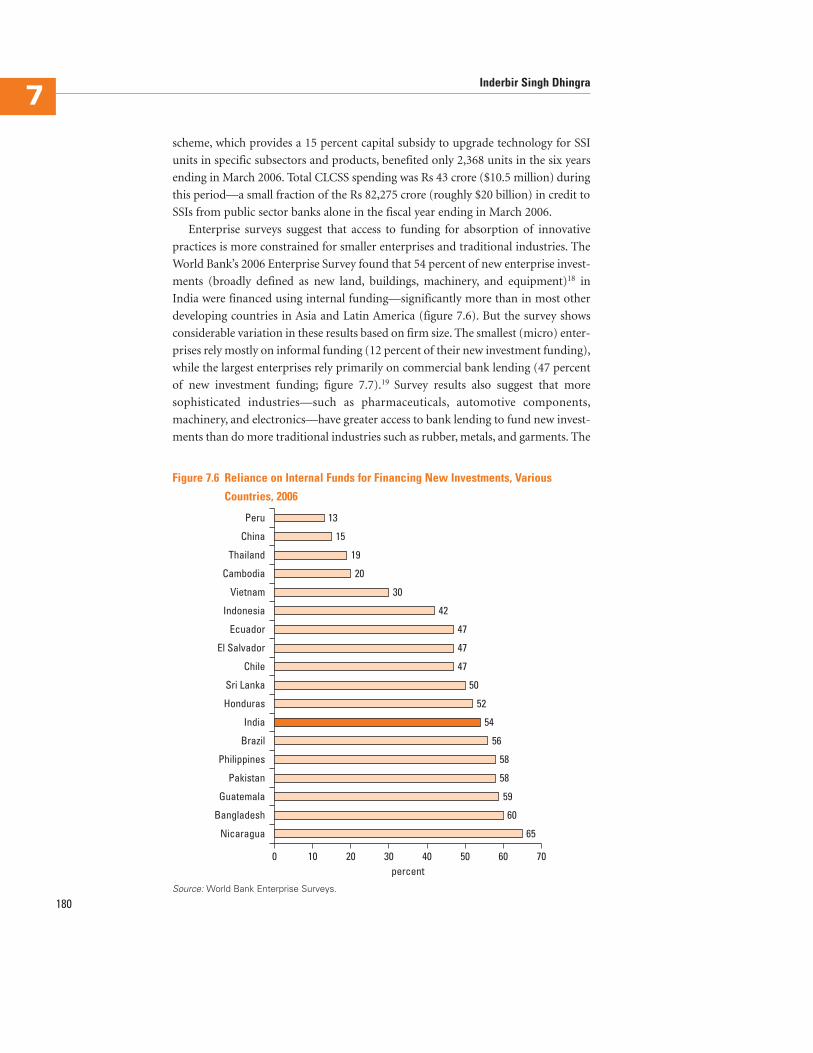
180
Inderbir Singh Dhingra7
13
15
19
20
30
42
47
47
47
50
52
54
56
58
58
59
60
65
0
Peru
10 20 30 40percent
50 60 70
China
Thailand
Cambodia
Vietnam
Indonesia
Ecuador
El Salvador
Chile
Sri Lanka
Honduras
India
Brazil
Philippines
Pakistan
Guatemala
Bangladesh
Nicaragua
Figure 7.6 Reliance on Internal Funds for Financing New Investments, Various
Countries, 2006
Source: World Bank Enterprise Surveys.
scheme, which provides a 15 percent capital subsidy to upgrade technology for SSI
units in specific subsectors and products, benefited only 2,368 units in the six years
ending in March 2006. Total CLCSS spending was Rs 43 crore ($10.5 million) during
this period—a small fraction of the Rs 82,275 crore (roughly $20 billion) in credit to
SSIs from public sector banks alone in the fiscal year ending in March 2006.
Enterprise surveys suggest that access to funding for absorption of innovative
practices is more constrained for smaller enterprises and traditional industries. The
World Bank’s 2006 Enterprise Survey found that 54 percent of new enterprise invest-
ments (broadly defined as new land, buildings, machinery, and equipment)18 in
India were financed using internal funding—significantly more than in most other
developing countries in Asia and Latin America (figure 7.6). But the survey shows
considerable variation in these results based on firm size. The smallest (micro) enter-
prises rely mostly on informal funding (12 percent of their new investment funding),
while the largest enterprises rely primarily on commercial bank lending (47 percent
of new investment funding; figure 7.7).19 Survey results also suggest that more
sophisticated industries—such as pharmaceuticals, automotive components,
machinery, and electronics—have greater access to bank lending to fund new invest-
ments than do more traditional industries such as rubber, metals, and garments. The
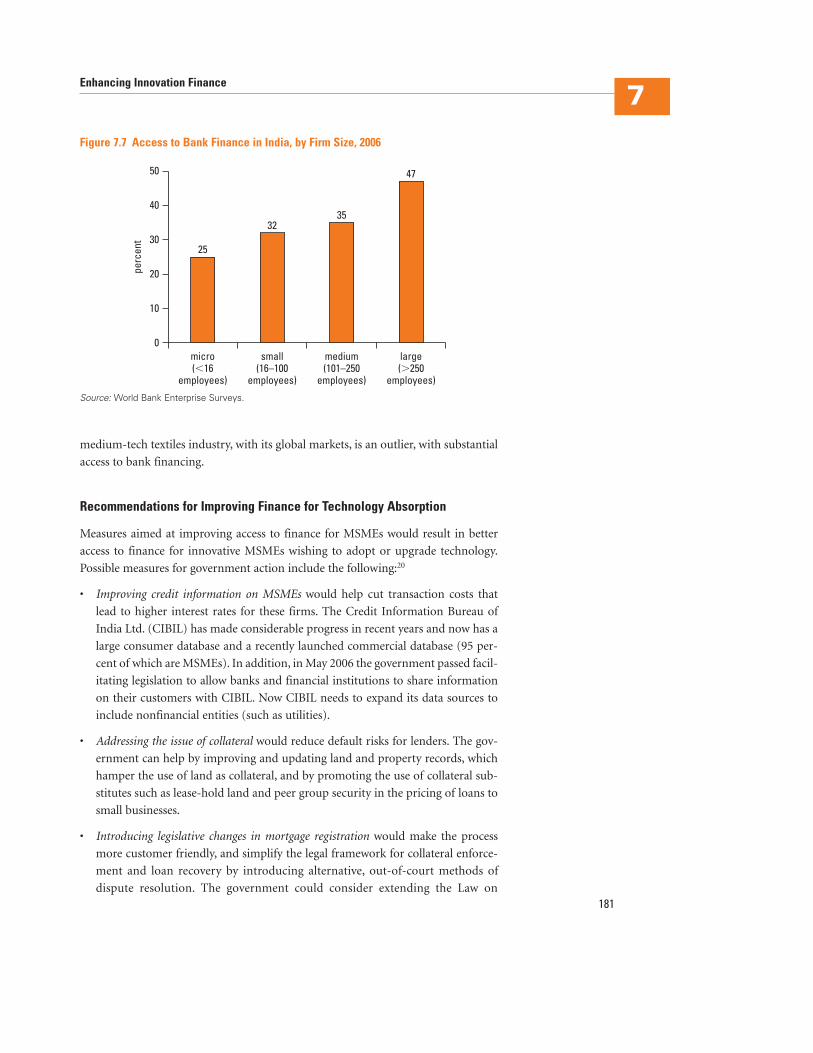
medium-tech textiles industry, with its global markets, is an outlier, with substantial
access to bank financing.
Recommendations for Improving Finance for Technology Absorption
Measures aimed at improving access to finance for MSMEs would result in better
access to finance for innovative MSMEs wishing to adopt or upgrade technology.
Possible measures for government action include the following:20
• Improving credit information on MSMEs would help cut transaction costs that
lead to higher interest rates for these firms. The Credit Information Bureau of
India Ltd. (CIBIL) has made considerable progress in recent years and now has a
large consumer database and a recently launched commercial database (95 per-
cent of which are MSMEs). In addition, in May 2006 the government passed facil-
itating legislation to allow banks and financial institutions to share information
on their customers with CIBIL. Now CIBIL needs to expand its data sources to
include nonfinancial entities (such as utilities).
• Addressing the issue of collateral would reduce default risks for lenders. The gov-
ernment can help by improving and updating land and property records, which
hamper the use of land as collateral, and by promoting the use of collateral sub-
stitutes such as lease-hold land and peer group security in the pricing of loans to
small businesses.
• Introducing legislative changes in mortgage registration would make the process
more customer friendly, and simplify the legal framework for collateral enforce-
ment and loan recovery by introducing alternative, out-of-court methods of
dispute resolution. The government could consider extending the Law on
Enhancing Innovation Finance7
181
micro(�16
employees)
25
0
10
20
30
40
50
small(16–100
employees)
32
medium(101–250
employees)
35
large(�250
employees)
47
perc
ent
Figure 7.7 Access to Bank Finance in India, by Firm Size, 2006
Source: World Bank Enterprise Surveys.
Securitization, Reconstruction of Financial Assets, and Enforcement of Secu-
rity Interest—which allows for out-of-court settlement of bad loans—to cover
smaller loans.
• Establishing a bankruptcy framework that facilitates the easy exit of small firms
would be beneficial given their relatively high mortality rate. As noted, there is a
direct, positive correlation between the ease of exit for firms and the rate of new
entry and level of competition in industry. India’s tedious, cumbersome bank-
ruptcy and closure regime discourages entrepreneurship. It is common for bank-
ruptcy proceedings to take more than 2 years—and over 60 percent of
liquidation cases before High Courts have been in process for more than
10 years. Not surprisingly, when looking at the share of firms that go bankrupt,
India has a much lower share (0.04 percent) than do other emerging markets,
such as Thailand. This could change once the envisaged amendments to the
Companies Act are implemented, providing a new framework for liquidating
firms outside the court process.
• Establishing a policy and regulatory framework that fosters the development of
leasing finance would be effective for financing small, innovative businesses, which
face collateral constraints and equity capital shortages. The growth of leasing
finance is stifled by an inhospitable tax and accounting framework, introduced
after a major leasing finance scam in 1997. As a result of government policy, India’s
leasing finance industry has shrunk from some 400 firms in the early 1990s to just
about 10 today. To revitalize the leasing industry, efforts must be made to improve
the tax and accounting framework. Clear rules are needed to help tax officers dis-
tinguish between genuine leases and garbed financial transactions. Currently,
assessing officers and appellate commissioners create their own rules. Rules are
also needed to allow leasing companies to deduct depreciation from lease pay-
ments for tax purposes. Finally, the service tax on rentals needs to be reduced, and
state governments should revisit their policy of equating a lease with a sale—
resulting in taxes on leases ranging from 4 percent to 14 percent.
Notes
For questions or further information, please contact Inderbir Singh Dhingra at [email protected].
1. For discussions of these issues, see Ben-Ari and Vonortas (2005), UNCTAD Secretariat (2002),Dossani and Kenney (2003), and Bank of England (2001).
2. After the United States, India has the second-highest number of publicly listed firms. Althoughthe shares of many of these firms are not actively traded on the stock exchanges, their liquidityhas improved considerably in recent years.
3. Early-stage finance includes seed capital as well as initial finance required for start-up operationsto commercialize an innovation. Although there is no clear definition, early-stage finance is usu-ally classified by amount (say, less than $3 million), the life of the firm (say, less than five years),or the sequence of external funding available to the firm (say, first two rounds of external finance).
182
Inderbir Singh Dhingra7
4. Although there is no consensus definition of ESTD, it can be broadly defined as the stage where“the technology is reduced to industrial practice, a production process is defined from whichcosts can be estimated, and a market appropriate to the demonstrated performance specifica-tions is identified and quantified” (Auerswald and Branscomb 2003: 229).
5. For a summary of these constraints, see World Bank (2006a). For a more detailed discussion, seeDe Ferranti and others (2003) and Baumol (2002).
6. Based on lower-case and upper-case modeling by Auerswald and Branscomb (2003).
7. These definitions vary, but seed is usually the first round of funding in the life of a firm, andseries A and B are subsequent rounds. In the above-mentioned analysis, Evalueserve definesthese terms based on amounts invested in the Indian context. Seed is up to $900,000, series A is$1 million–$3 million, and series B is $3.5 million–$8.0 million.
8. It has been argued that seed and early-stage financing in India implies investments of less than$1 million given the lower cost structure for Indian start-ups relative to their Silicon Valleycounterparts.
9. APIDC’s management was privatized in the mid-1990s.
10. The Seed Fund, recently created with $10 million from the former promoters of the InfinityFund, is one of India’s few successful early-stage venture capital firms.
11. Evalueserve estimates venture capital and private equity investment at more than $6 billion in2006. But again, most of this increase is unlikely to be for seed and early-stage funding.
12. India ranks poorly on the World Bank–International Finance Corporation’s Doing Businessindicators; see chapter 1.
13. For a more detailed discussion on investment climate issues facing Indian businesses, see WorldBank (2002, 2004, 2005, 2006a), National Manufacturing Competitiveness Council (2006),National Investment Commission of India (2006), and India Today (2005).
14. Current investment guidelines for pension and insurance funds allow for investment in defined“unapproved” securities; these guidelines can be modified to include or increase the allowablelimit for venture capital funds.
15. For further discussion of the evolving “social venture capital” industry, see World EconomicForum (2006).
16. Among government documents, see the Abid Hussain Committee on Small Enterprises (Min-istry of Industry 1997), S. L. Kapur High Level Credit Committee on SMEs (Reserve Bank ofIndia 1998), and S. P. Gupta Study Group on Development of Small Enterprises (Planning Com-mission 2001). See also World Bank (2002, 2003, 2004).
17. Until recently the Reserve Bank of India required banks to submit data only for micro and smallenterprises (MSEs), which became classified as a priority sector for bank lending. With enact-ment of MSME legislation in May 2006, data for medium enterprises are now being collectedas well.
18. Used as an approximation for innovation absorption financing, which is related to machineryand equipment.
19. For the purpose of this particular analysis, micro enterprises employ fewer than 16 people, smallenterprises between 16 and 100, medium enterprises between 101 and 250, and large enterprisesmore than 250.
20. Although many of these recommendations apply to MSME financing in general, constraintstend to be greater for upgrading technology and innovative MSMEs, as discussed earlier. Hence,these recommendations are extremely relevant for upgrading technology for MSMEs.
References
Auerswald, Philip E., and Lewis M. Branscomb. 2003. “Valleys of Death and Darwinian Seas:
Financing the Invention to Innovation Transition in the United States.” Journal of Technol-
ogy Transfer 28 (3–4): 227–39.
Enhancing Innovation Finance7
183
Avnimelech, Gil, and Morris Teubel. 2005a. “Evolutionary Innovation and High Tech Policy:
What Can We Learn from Israel’s Targeting of Venture Capital?” Working Paper No. 25,
Ben-Gurion University of the Negev, School of Management, Be’er Sheva, and Hebrew
University of Jerusalem, Department of Economics.
———. 2005b. “From Direct Support of Business Sector R&D/Innovation to Targeting Ven-
ture Capital/Private Equity: A Catching-up Innovation and Technology Policy Life Cycle
Perspective.” Ben-Gurion University of the Negev, School of Management, Be’er Sheva,
and Hebrew University of Jerusalem, Department of Economics.
Bank of England. 2001.“Financing of Technology-Based Small Firms.” Domestic Finance Divi-
sion, London.
Baumol, William. 2002. The Free-Market Innovation Machine: Analyzing the Growth Miracle of
Capitalism. Princeton and Oxford: Princeton University Press.
Ben-Ari, Guy, and Nicholas S. Vonortas. 2005. “Risk Financing for Knowledge-Based Enter-
prises: Mechanisms and Policy Options.” Department of Economics, George Washington
University, Washington, DC.
De Ferranti, D., G. E. Perry, I. Gill, J. L. Guasch, and N. Schady, with W. Maloney and C.
Sánchez-Páramo. 2003. Closing the Gap in Education and Technology. Latin American and
Caribbean Studies. Washington, DC: World Bank.
Dossani, Rafiq, and Asawari Desai. 2006. “Accessing Early Stage Risk Capital in India.” The
South Asia Initiative, Shorenstein APARC, and The Indus Initiative.
Dossani, Rafiq, and Martin Kenney. 2003. “Providing Financing for Technology-Based SMEs.”
Paper delivered at the UNCTAD Expert Meeting on Improving the Competitiveness of
SMEs through Enhancing Productive Capacity: Financing Technology, Geneva, October
28–30.
Evalueserve. 2006. “Is the Venture Capital Market in India Getting Overheated?” Saratoga,
California.
India Today. 2005. “State of the States Report.” September 1.
Klapper, Leora, and others. 2006. “World Bank Entrepreneurship Survey.” World Bank, Wash-
ington, DC.
Kortum, Samuel, and Josh Lerner. 2000. “Assessing the Contribution of Venture Capital to
Innovation.” NBER Working Paper No. 11475, National Bureau of Economic Research,
Cambridge, MA.
Ministry of Industry. 1997. “Report of the Expert Committee on Small Enterprises, Abid
Hussain, Chariman.” Government of India, New Delhi.
National Investment Commission of India. 2006. “Investment Strategy for India: Investment
Commission Report.” Ministry of Finance, New Delhi.
National Manufacturing Competitiveness Council. 2006. The National Strategy for Manufac-
turing. New Delhi.
Planning Commission. 2001. “Report of the Study Group on Small Scale Enterprises.” Chair-
man S. P. Gupta, New Delhi.
Reserve Bank of India. 1998. “Report of the S. L. Kapur High Level Credit Committee on
SMEs.” New Delhi.
Saxenian, AnnaLee. 2001. “Taiwan’s Hsinchu Region: Imitator and Partner for Silicon Valley.”
Stanford Institute for Economic Policy Research, Palo Alto, CA, and University of California
at Berkeley.
———. 2005. “From Brain Drain to Brain Circulation: Transnational Communities and
Regional Upgrading in India and China.” School of Information Management and Sys-
tems, University of California at Berkeley.184
Inderbir Singh Dhingra7
UNCTAD (United Nations Conference on Trade and Development) Secretariat. 2002.
“Financing Technology for SMEs.” Issues Note, Geneva.
UN ESCAP (United Nations Economic and Social Commission for Asia and the Pacific). 2005.
“National Innovation System in the Asia-Pacific Region.” Bangkok, Thailand.
World Bank. 2002. “India Investment Climate Assessment.” Washington, DC.
———. 2003. “Small and Medium Enterprises Financing in India: Issues, Challenges, and
Opportunities.” Policy Note. Washington, DC.
———. 2004. “India Investment Climate Assessment.” Washington, DC.
———. 2005. Doing Business in India. Washington, DC: World Bank.
———. 2006a. Doing Business 2007: How to Reform. Washington, DC: World Bank.
———. 2006b. Public Financial Support for Commercial Innovation: Europe and Central Asia
Knowledge Economy Study Part I. Washington, DC: World Bank.
World Economic Forum. 2006. “Blended Value Investing: Capital Opportunities for Social and
Environment Impact.” Geneva, Switzerland.
Enhancing Innovation Finance7
185

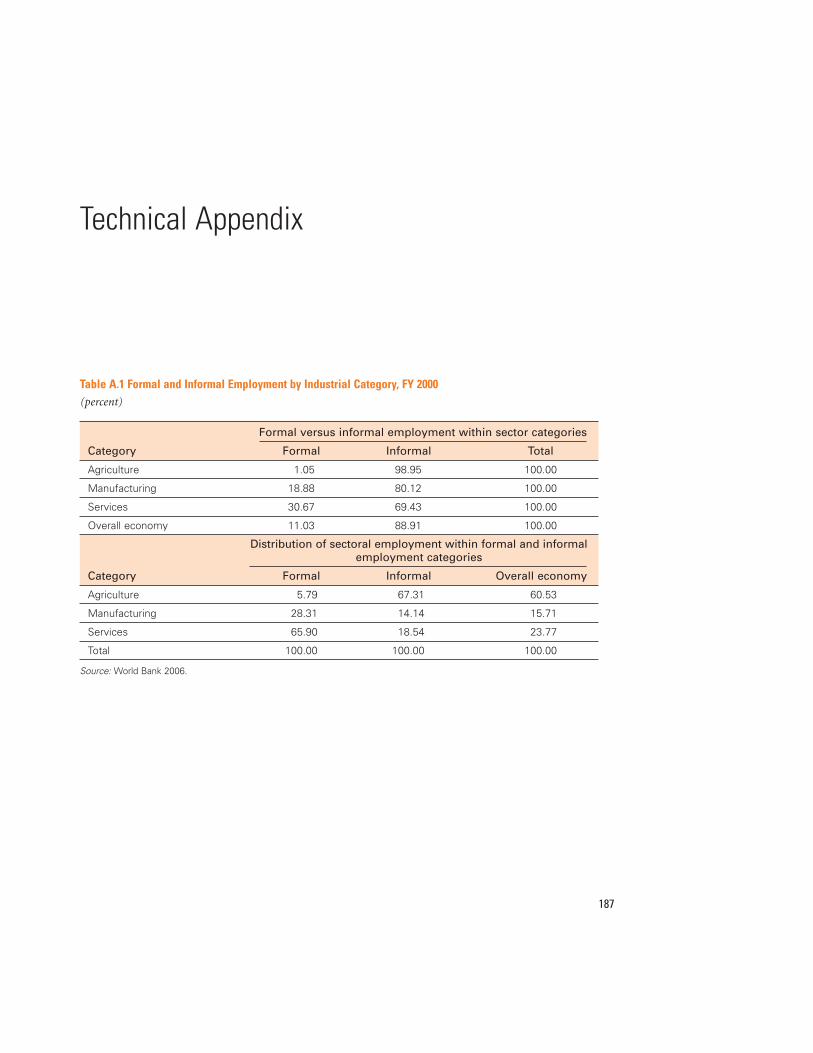
187
Technical Appendix
Table A.1 Formal and Informal Employment by Industrial Category, FY 2000 (percent)
Formal versus informal employment within sector categories
Category Formal Informal Total
Agriculture 1.05 98.95 100.00
Manufacturing 18.88 80.12 100.00
Services 30.67 69.43 100.00
Overall economy 11.03 88.91 100.00
Distribution of sectoral employment within formal and informal employment categories
Category Formal Informal Overall economy
Agriculture 5.79 67.31 60.53
Manufacturing 28.31 14.14 15.71
Services 65.90 18.54 23.77
Total 100.00 100.00 100.00
Source: World Bank 2006.
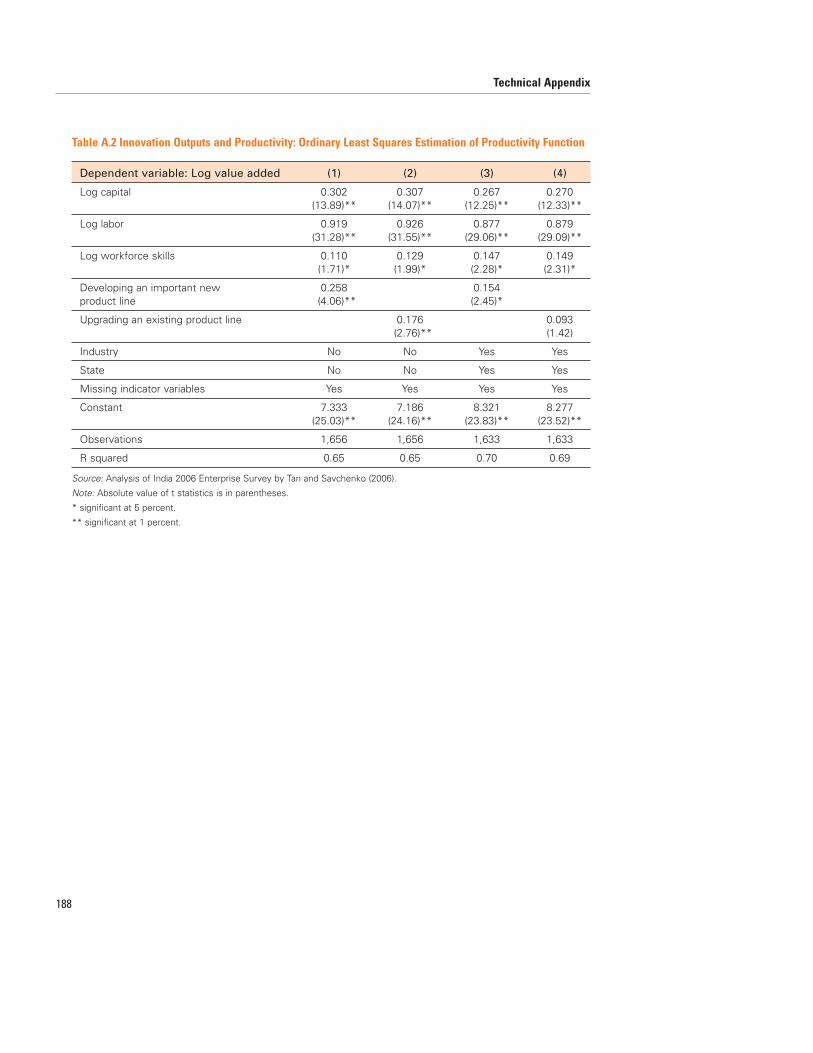
188
Technical Appendix
Table A.2 Innovation Outputs and Productivity: Ordinary Least Squares Estimation of Productivity Function
Dependent variable: Log value added (1) (2) (3) (4)
Log capital 0.302 0.307 0.267 0.270(13.89)** (14.07)** (12.25)** (12.33)**
Log labor 0.919 0.926 0.877 0.879(31.28)** (31.55)** (29.06)** (29.09)**
Log workforce skills 0.110 0.129 0.147 0.149(1.71)* (1.99)* (2.28)* (2.31)*
Developing an important new 0.258 0.154product line (4.06)** (2.45)*
Upgrading an existing product line 0.176 0.093(2.76)** (1.42)
Industry No No Yes Yes
State No No Yes Yes
Missing indicator variables Yes Yes Yes Yes
Constant 7.333 7.186 8.321 8.277(25.03)** (24.16)** (23.83)** (23.52)**
Observations 1,656 1,656 1,633 1,633
R squared 0.65 0.65 0.70 0.69
Source: Analysis of India 2006 Enterprise Survey by Tan and Savchenko (2006).
Note: Absolute value of t statistics is in parentheses.
* significant at 5 percent.
** significant at 1 percent.
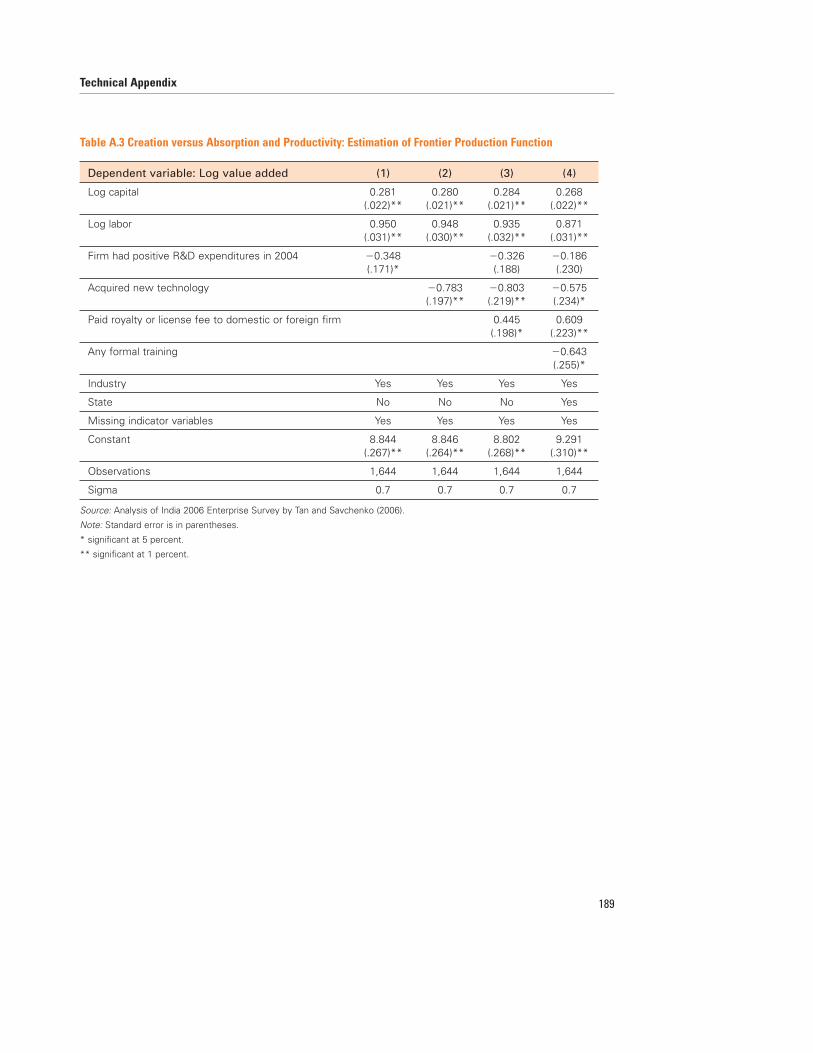
Technical Appendix
189
Table A.3 Creation versus Absorption and Productivity: Estimation of Frontier Production Function
Dependent variable: Log value added (1) (2) (3) (4)
Log capital 0.281 0.280 0.284 0.268(.022)** (.021)** (.021)** (.022)**
Log labor 0.950 0.948 0.935 0.871(.031)** (.030)** (.032)** (.031)**
Firm had positive R&D expenditures in 2004 �0.348 �0.326 �0.186(.171)* (.188) (.230)
Acquired new technology �0.783 �0.803 �0.575(.197)** (.219)** (.234)*
Paid royalty or license fee to domestic or foreign firm 0.445 0.609(.198)* (.223)**
Any formal training �0.643(.255)*
Industry Yes Yes Yes Yes
State No No No Yes
Missing indicator variables Yes Yes Yes Yes
Constant 8.844 8.846 8.802 9.291(.267)** (.264)** (.268)** (.310)**
Observations 1,644 1,644 1,644 1,644
Sigma 0.7 0.7 0.7 0.7
Source: Analysis of India 2006 Enterprise Survey by Tan and Savchenko (2006).
Note: Standard error is in parentheses.
* significant at 5 percent.
** significant at 1 percent.
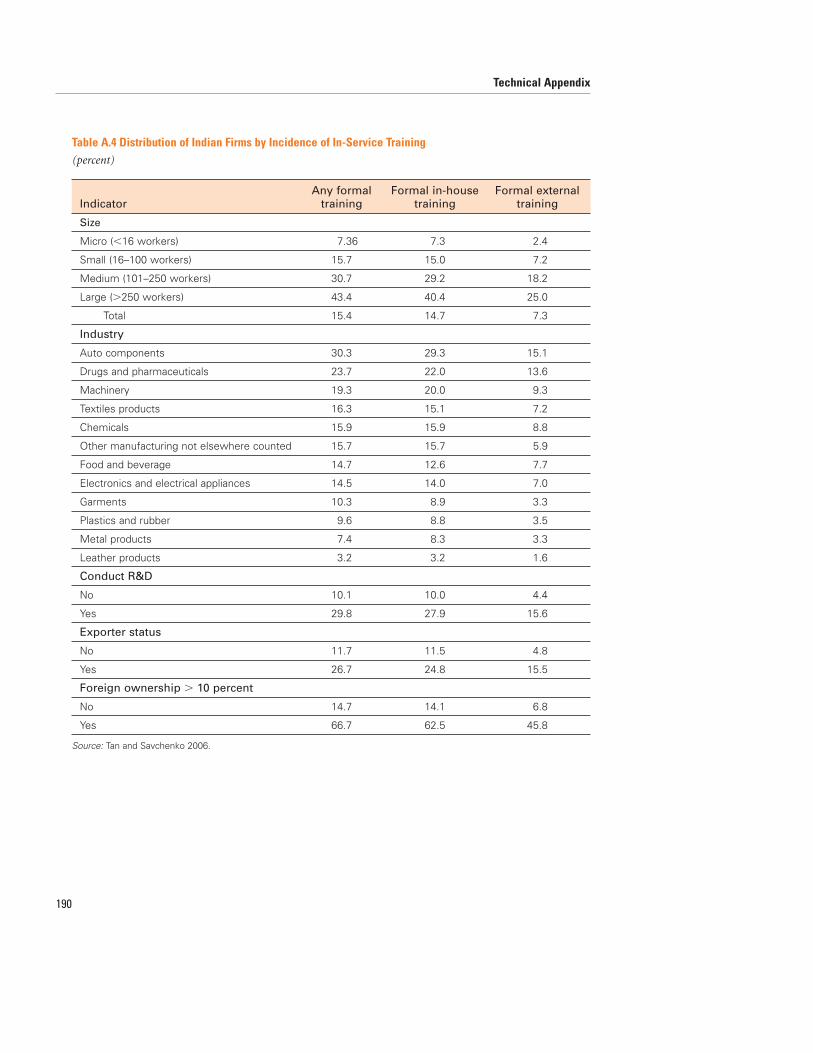
190
Technical Appendix
Table A.4 Distribution of Indian Firms by Incidence of In-Service Training (percent)
Any formal Formal in-house Formal externalIndicator training training training
Size
Micro (�16 workers) 7.36 7.3 2.4
Small (16–100 workers) 15.7 15.0 7.2
Medium (101–250 workers) 30.7 29.2 18.2
Large (�250 workers) 43.4 40.4 25.0
Total 15.4 14.7 7.3
Industry
Auto components 30.3 29.3 15.1
Drugs and pharmaceuticals 23.7 22.0 13.6
Machinery 19.3 20.0 9.3
Textiles products 16.3 15.1 7.2
Chemicals 15.9 15.9 8.8
Other manufacturing not elsewhere counted 15.7 15.7 5.9
Food and beverage 14.7 12.6 7.7
Electronics and electrical appliances 14.5 14.0 7.0
Garments 10.3 8.9 3.3
Plastics and rubber 9.6 8.8 3.5
Metal products 7.4 8.3 3.3
Leather products 3.2 3.2 1.6
Conduct R&D
No 10.1 10.0 4.4
Yes 29.8 27.9 15.6
Exporter status
No 11.7 11.5 4.8
Yes 26.7 24.8 15.5
Foreign ownership � 10 percent
No 14.7 14.1 6.8
Yes 66.7 62.5 45.8
Source: Tan and Savchenko 2006.
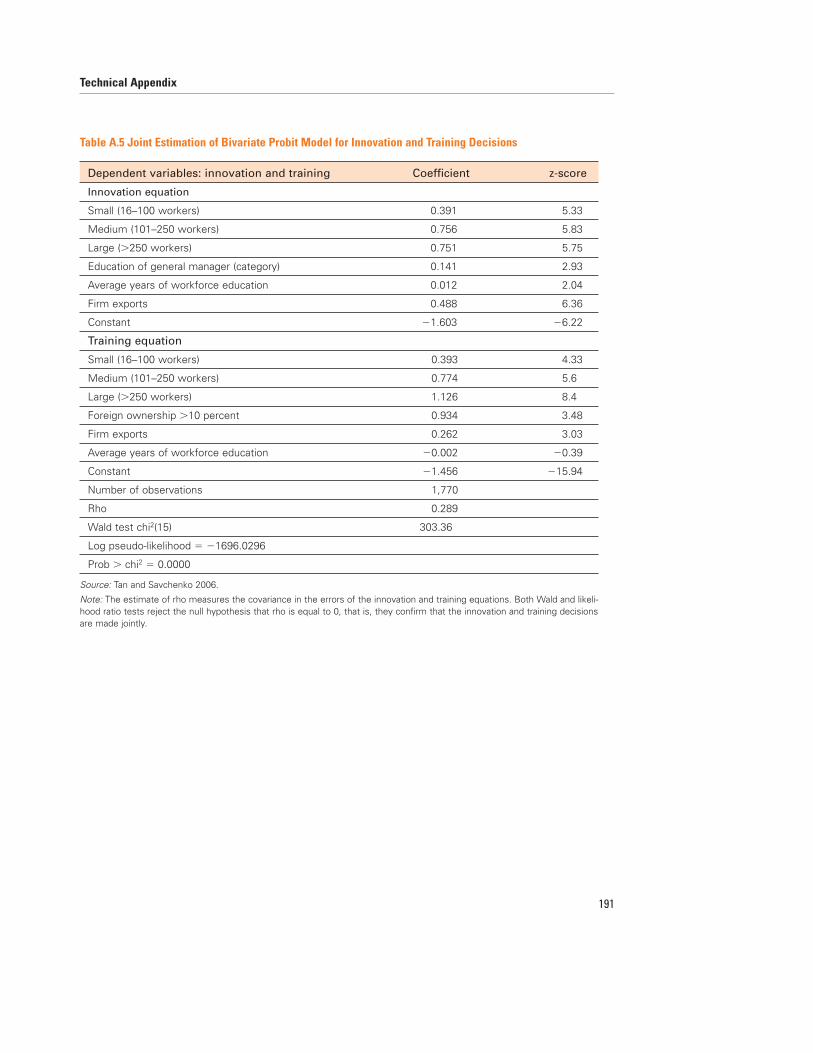
Technical Appendix
191
Table A.5 Joint Estimation of Bivariate Probit Model for Innovation and Training Decisions
Dependent variables: innovation and training Coefficient z-score
Innovation equation
Small (16–100 workers) 0.391 5.33
Medium (101–250 workers) 0.756 5.83
Large (�250 workers) 0.751 5.75
Education of general manager (category) 0.141 2.93
Average years of workforce education 0.012 2.04
Firm exports 0.488 6.36
Constant �1.603 �6.22
Training equation
Small (16–100 workers) 0.393 4.33
Medium (101–250 workers) 0.774 5.6
Large (�250 workers) 1.126 8.4
Foreign ownership �10 percent 0.934 3.48
Firm exports 0.262 3.03
Average years of workforce education �0.002 �0.39
Constant �1.456 �15.94
Number of observations 1,770
Rho 0.289
Wald test chi2(15) 303.36
Log pseudo-likelihood � �1696.0296
Prob � chi2 � 0.0000
Source: Tan and Savchenko 2006.
Note: The estimate of rho measures the covariance in the errors of the innovation and training equations. Both Wald and likeli-hood ratio tests reject the null hypothesis that rho is equal to 0, that is, they confirm that the innovation and training decisionsare made jointly.
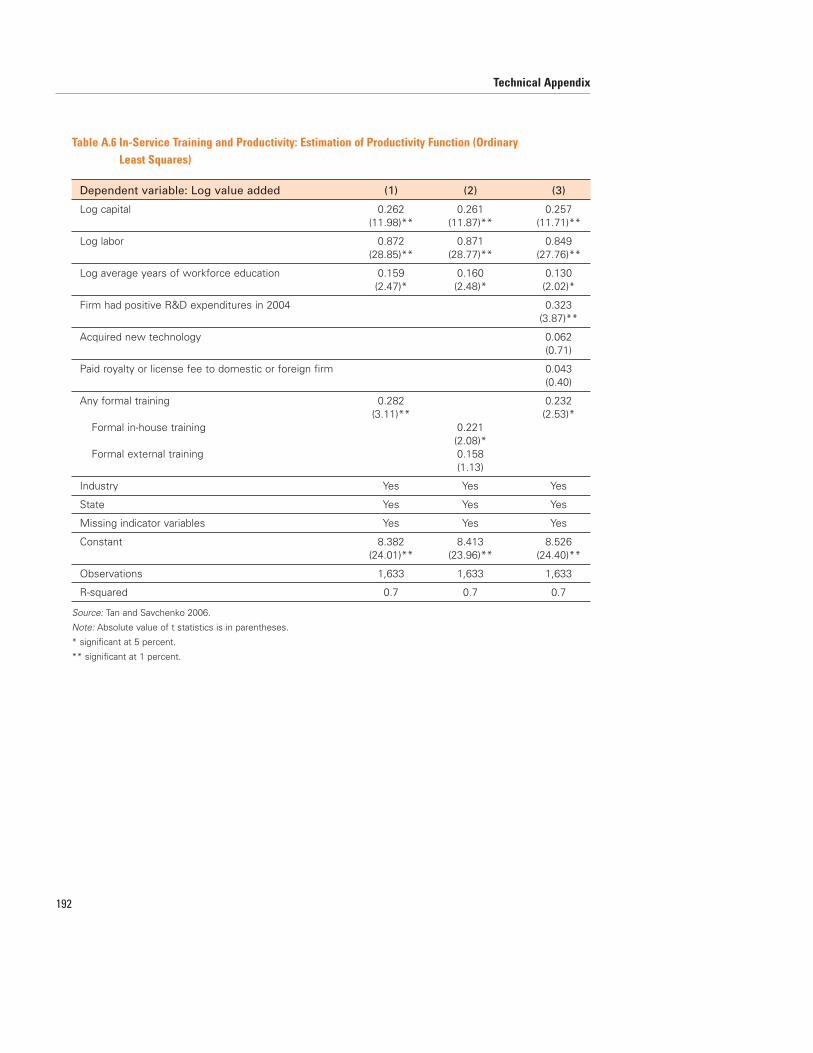
192
Technical Appendix
Table A.6 In-Service Training and Productivity: Estimation of Productivity Function (Ordinary Least Squares)
Dependent variable: Log value added (1) (2) (3)
Log capital 0.262 0.261 0.257(11.98)** (11.87)** (11.71)**
Log labor 0.872 0.871 0.849(28.85)** (28.77)** (27.76)**
Log average years of workforce education 0.159 0.160 0.130(2.47)* (2.48)* (2.02)*
Firm had positive R&D expenditures in 2004 0.323(3.87)**
Acquired new technology 0.062(0.71)
Paid royalty or license fee to domestic or foreign firm 0.043(0.40)
Any formal training 0.282 0.232(3.11)** (2.53)*
Formal in-house training 0.221(2.08)*
Formal external training 0.158(1.13)
Industry Yes Yes Yes
State Yes Yes Yes
Missing indicator variables Yes Yes Yes
Constant 8.382 8.413 8.526(24.01)** (23.96)** (24.40)**
Observations 1,633 1,633 1,633
R-squared 0.7 0.7 0.7
Source: Tan and Savchenko 2006.
Note: Absolute value of t statistics is in parentheses.
* significant at 5 percent.
** significant at 1 percent.

193
Additional Background PapersThese studies were commissioned by South Asia Finance and Private Sector Development, World
Bank, Washington, DC.
Evalueserve. 2006. “FDI and Its Spillover Effects in India.”
Gupta, A. C. 2006. “Metrology, Standards, Testing, and Quality System of India.”
Gupta, Paritosh. 2006.“Diffusion and Absorption: Technology and Skills Upgrading for Formal
SMEs.”
Jha, C. S. 2006. “Higher Education in India: Restructuring for Increased Innovation.”
Kuznetsov, Y. 2006. “Radical Transformation, Step-by-Step: Inside-out Reform of India’s Inno-
vation System.”
Sinha, Riya, and Kuldeep Mathur. 2006. “Pro-Poor Innovations.”
Srivastava, Anil, Ashok Kolaskar, Gopika Kannan, and Jiban Khuntia. 2006. “RENs as Part of
Innovation and Knowledge Creation in India.”
Additional SourcesAdvisory Committee on Venture Capital. 2000. “Report of K. B. Chandrasekhar Committee on
Venture Capital.” Securities and Exchange Board of India, Mumbai.
Aghion, Philippe, and P. Howitt. 2006. “Appropriate Growth Policy: A Unifying Framework.”
Journal of the European Economic Association 4 (2–3): 269–314.
Auerswald, Philip E., Lewis M. Branscomb, Nicholas Demos, and Brian K. Min. 2005. “Under-
standing Private-Sector Decision Making for Early-Stage Technology Development.” Pre-
pared for National Institute of Standards and Technology, Advanced Technology Program,
Economic Assessment Office, Gaithersburg, MD.
Avnimelech, Gil, and Morris Teubal. 2004. “From Direct Government Support of Innovative
SMEs to Targeting Venture Capital/Private Equity (VC/PE) & Innovative Clusters: An
Innovation and Technology Policy (ITP) Cycle Model for Industrializing Economies.”
Ben-Gurion University of the Negev, School of Management, Be'er Sheva, and Hebrew
University of Jerusalem, Department of Economics.
Basant, Rakesh, and Pankaj Chandra. 2005. “Role of Educational and R&D Institutions in City
Clusters: An Exploratory Study of Bangalore and Pune Regions in India.” Unpublished,
Indian Institute of Management, Ahmedabad.
Berger, Allen N., and Gregory F. Udell. “A More Complete Conceptual Framework for Financ-
ing of Small and Medium Enterprises.” Policy Research Working Paper No. 3795, World
Bank, Washington, DC.
Bibliography
194
Bibliography
Bhorat, H. 2005. “Links between Education and the Labor Market.” In Skill Formation and
Globalization, ed. M. Powell. Aldershot, UK: Ashgate.
Carnoy, M. 2003. Background paper prepared for D. De Ferranti and others, Closing the Gap
in Innovation and Technology. Washington, DC: World Bank.
Chen, D. 2001. “Restructuring through Amalgamation in China.” International Higher Educa-
tion Fall.
Christensen, Clayton M., and Michael E. Raynor. 2003. The Innovator's Solution: Creating and
Sustaining Successful Growth. Boston: Harvard Business School Press.
Clarke, B. R. 1998. Creating Entrepreneurial Universities: Organizational Pathways of Transfor-
mation. Oxford, UK: IAU Press, Pergamon.
Dahlman, Carl, and Anuja Utz. 2005. India and the Knowledge Economy: Leveraging Strengths
and Opportunities. Washington, DC: World Bank.
Deloitte. 2006. “Venture Capital Goes Global: Key Findings from the 2005 Global Venture
Capital Survey.” Deloitte Touche Tomahtsu, London.
Department of Scientific and Industrial Research. 2003. “Research and Development in Indus-
try: An Overview.” Ministry of Science and Technology, New Delhi.
Department of Secondary and Higher Education. 2004–2006. Annual Reports 2004–05 and
2005–06. New Delhi: Ministry of Human Resource Development. www.education.nic.in.
Dossani, Rafiq. 1999.“Accessing Venture Capital in India.” Report from a conference on Access-
ing Venture Capital in India, Stanford University, June 1.
Elzkowitz, H., and L. Leydesdorff, eds. 1997. Universities and the Global Knowledge Economy: A
Triple Helix of University-Industry-Government Relations. London: Cassell Academic.
European Venture Capital Association. 2003. “Private Equity and Venture Capital Incentives in
Europe.” Brussels, Belgium.
Georghiou, Luke, Keith Smith, Otto Toivanen, and Pekka Ylä-Anttila. 2003. “Evaluation of
the Finnish Innovation Support System.” Ministry of Trade and Industry, Helsinki,
Finland.
Goel, Vinod. 2006. “India: An Assessment of the Industrial Technology Development Project.”
World Bank, Washington, DC.
Goel, Vinod K., Mohini Bhatia, and Ekaterina Koryukin. 2004. “World Bank Science, Technol-
ogy and Innovation Projects: Toolkit for Task Managers.” World Bank, Washington, DC.
Goel, Vinod K., Ekaterina Koryukin, Mohini Bhatia, and Priyanka Agarwal. 2004. “Innovation
Systems: World Bank Support of Science and Technology Development.” Working Paper
No. 32, World Bank, Washington, DC.
Hanushek, E. A., and D. D. Kimko. 2000. “Schooling, Labor Force Quality, and the Growth of
Nations.” American Economic Review 90 (5): 1184–208.
HM Treasury and SBS Consultation. 2003. “Bridging the Finance Gap: Next Steps in Improv-
ing Access to Growth Capital for Small Businesses.” London. www.hm-treasury.gov.uk.
IFC (International Finance Corporation). 2005. “India’s Issues and Challenges for Future Pri-
vate Investment in Higher Education.” Unpublished presentation, IFC, Washington, DC.
Jaffe, Adam B. 1998. “The Importance of ‘Spillovers’ in the Policy Mission of the Advanced
Technology Program.” Journal of Technology Transfer 23 (2): 11–19.
Johanson, R., and A. V. Adams. 2004. Skills Development in Sub-Saharan Africa. World Bank
Regional and Sectoral Studies. Washington, DC: World Bank.
Kenney, Martin, and Rafiq Dossani. 2001. “Creating an Environment: Developing Venture
Capital in India.” Working Paper No. 143, Berkeley Roundtable on the International Econ-
omy, University of California at Berkeley.
Kwak, Sungshin. 2002. “Venture Capital Support Program in Korea.” Presentation in Beijing.
Lee, Y-H. 2005. “Economic Restructuring and Human Resource Development Strategies in
Korea.” In Skill Formation and Globalization, ed. M. Powell. Aldershot, UK: Ashgate.
Lerner, Josh. 1996. “The Government as Venture Capitalist: The Long-run Impact of the
SBIR Program.” NBER Working Paper No. 5753, National Bureau of Economic Research,
Cambridge, MA.
———. 1999. “Small Businesses, Innovation and Public Policy.” In Are Small Firms Important?
Their Role and Impact, ed. Zoltan J. Acs. Boston, Dordrecht, and London: Kluwer Academic
in association with U.S. Small Business Administration.
Lester, R. 2005. “Universities, Innovations, and the Competitiveness of Local Economies.” MIT
Industrial Performance Center Working Paper 05-010, Cambridge, MA.
———. 2006. “Universities, Innovations, and the Competitiveness of Local Economies.” Pre-
sentation at the World Bank, February, Washington, DC.
Levy, F., and R. Murname. 2004. The New Division of Labor: How Computers Are Creating the
Next Job Market. Princeton, NJ: Princeton University Press.
Luce, Edward. 2006. In Spite of the Gods: The Strange Rise of Modern India. Great Britain: Little,
Brown.
Mani, S., and N. Kumar. 2001. “Role of Government in Promoting Innovation in the Enter-
prise Sector: An Analysis of the Indian Experience.” Discussion Paper No. 3, United
Nations University, Institute for New Technologies.
McGregor, Jena, Michael Arndt, and Robert Berne. 2006. “Report on the World’s Most Innov-
ative Companies.” Business Week, April 24.
Ministry of Small Scale Industries. 2006. Annual Reports 2005–06. New Delhi. http.//ssi.gov.in.
Mitra, Raja. 2006a. “India’s Emergence as a Global R&D Center.” Unpublished, Swedish Insti-
tute for Growth Policy Studies, Stockholm.
———. 2006b. “India’s Potential as a Global R&D Power.” In The Internationalization of Cor-
porate R&D: Leveraging the Changing Geography of Innovation, ed. Magnus Karlsson.
Stockholm: Institute for Growth Policy Studies.
Momaya, K. 2003. “Sources of Funding for Startups in India.” Indian Institute of Technology,
Foundation of Innovation and Technology Transfer, New Delhi, and ICICI Knowledge
Park, Hyderabad.
Nabeshima, K. 2006. “University-Industry Linkages in Asia.” World Bank, Washington, DC.
Nagarajan, S., V. K. Dadhwal, and R. N. Sahoo. 2004.“Role of Earth Observation Technology and
Applications in India’s Food Security Concerns.” India-United States Conference on Space
Science, Applications and Commerce, Bangalore, June 21. www.aiaa.org/indiaus2004/
Earth-observation.pdf.
National Knowledge Commission. 2007. Innovation in India. New Delhi. www.
knowledgecommission.gov.in
National Research Council. 2004. SBIR Program Diversity and Assessment Challenges.
Washington, DC: National Academies Press.
———. 2007a. India’s Changing Innovation System: Achievements, Challenges, and Opportu-
nities for Cooperation. Washington, DC: National Academies Press.
———. 2007b. Innovation Policies for the 21st Century. Washington, DC: National Academies
Press.
Phillips, David A. 2000. “Implementing the Market Approach to Enterprise Support: A Com-
parative Evaluation of Matching Grant Schemes.” Europe and Central Asia Region, Private
and Financial Sector Department, World Bank, Washington, DC.
Planning Commission. 2001. “India as a Knowledge Superpower: Strategy for Transforma-
tion.” Task Force Report, Government of India.
Bibliography
195
———. 2006. “Report of the Committee on Technology Innovation and Venture Capital.”
Chairman Nitin Desai, New Delhi.
Prahalad, C. K. 2003. “Serving the Bottom of the Pyramid.” University of Michigan, Ross
School of Business. http://www.bus.umich.edu/FacultyResearch/ResearchCenters/
ProgramsPartnerships/IT-Champions/default.htm#XMAP.
Rao, C. 2006. “Science on Deathbed.” Times of India, July 12.
Rhines Cheney, Gretchen, Betsy Brown Ruzzi, and Karthik Muralidharan. 2006. “A Profile
of the Indian Education System.” National Center on Education and the Economy,
Washington, DC.
Rychen, D., and L. Salganik, eds. 2001. Defining and Selecting Key Competencies. Cambridge,
MA: Hogrefe & Huber.
Sahlberg, P. 2006. “Education Reform for Raising Economic Competitiveness.” Journal of Edu-
cational Change 7 (4): 259–87.
SBIC Reinvention Council. 1995. “An Examination of Issues and Alternatives Regarding a
Restructuring of the SBIC Program.” U.S. Small Business Administration, Working Study
Group, Washington, DC.
Sengupta, S. 2006. “Skills Gap Hurts Technology Boom in India.” New York Times, October 17.
Singh, Manmohan. 2006. Prime Minister’s Speech while dedicating the Bharti School of
Telecommunication Technology and Management, IIT Delhi on March 20, 2006, at
www.pib.nic.in/releases.
Smith, Steve. 2007. “The Other Internet: The Hyper-Fast Backbone We’ll Never Use.” Caught
in the Web 7 (2): 84–86.
Soete, L. 2000. “Technology, Globalization and Employment.” In Education and Training in a
Knowledge-Based Economy, ed. H. Heijke and J. Muyksen. New York: St. Martin’s Press.
Sternberg, R. J., and T. I. Lubart. 1995. Defying the Crowd: Cultivating Creativity in a Culture of
Conformity. New York: The Free Press.
Stiglitz, Joseph E. 2002. “Information and the Change in the Paradigm in Economics.” Abbre-
viated version of Nobel Lecture, The American Economic Review 92 (3): 460–501.
———. 2006. Making Globalization Work. New York: W.W. Norton.
Stillman, Robert D. 2002. Presentation made at IndiaSoft 2002. New Delhi.
Tan, Hong, and Yevgeniya Savchenko. 2006. “In-Service Training in India: Evidence from India
Firm-Level Investment Climate Survey.” Unpublished, World Bank, Washington, DC.
Trachtenberg, Stephen Joel. 1999. “The New Entrepreneurial University.” Delivered to a con-
ference of American Association of University Administrators, June. www.gwu.edu/
~gwpres/speeches12.html.
Udwadia, Udeshi, and Berjis Desai. 2002. “Tax-free Foreign Venture Capital Investment.”
AltAssets. http://www.altassets.com/casefor/countries/2002/nz2873.php.
UN ESCAP (United Nations Economic and Social Commission for Asia and the Pacific). 2006.
Literacy for Life: EFA Global Monitoring Report 2006. Geneva.
United Nations. 2005. “UN Global E-Government Readiness Report 2005: From E-govern-
ment to E-Inclusion.” New York. www.lidec.futuro.usp.br/downloads/egovUN.pdf.
World Bank. 1998. “India: Industrial Technology Development Project.” Implementation
Completion Report, World Bank, Washington, DC.
———. 2000. “Scientific and Technical Manpower Development in India.” Report No. 20416-
IN, Education Sector Unit, South Asia Region, Washington, DC.
———. 2006.“India’s Employment Challenge: Creating Jobs, Helping Workers.” Report 35772
(draft), Poverty Reduction and Economic Management, South Asia Region, World Bank,
Washington, DC.196
Bibliography
197
Boxes, figures, notes, and tables are indicated by b, f, n, and t, respectively.
Index
“brain drain,” 141. See also diaspora, makingbetter use of
Brazilinformation infrastructure in, 152t,
156t, 157finnovation inputs and outputs, 31t, 32IPR flows and technology licensing, 89fMSME reliance on internal funding, 180fMSTQ services, 94f, 95productivity and innovation outputs, 35fproductivity dispersion in, 6public R&D costs, 66skills and training, 135fstarting up and closing businesses, 41f, 42trade and FDI, openness to, 86, 87f
BRIC and BRICKM economies, 46n12.See also Brazil; China; Korea, Republicof; Mexico; Russian Federation
Britain. See United KingdomBYST (Bharatiya Yuva Shakti Trust),
126b, 127n2
CCAD (computer-aided design) program for
Baluchari saris, 109bCambodia, 180fCanada, 42, 44b, 52, 61b, 177CBFL (Computer-Based Functional Literacy)
Program, 125bCentral Leather Research Institute, 10–11,
124–125Centre of Science for Villages (CSV), 124bCGIAR (Consultative Group for International
Agricultural Research), 111, 112bChile, 44, 180fChina
information infrastructure, xvi, 18, 151,152t, 156t, 157f
innovation inputs and outputs, 31t, 32IPR flows and technology licensing, 89fMNCs with R&D investments in India, 52MSME reliance on internal funding, 180f
Aabsorption of knowledge. See diffusion and
absorption of knowledgeacademia. See universitiesAcumen Fund, 20Advanced Technology Program (ATP), US, 69bagriculture
dualism between high-tech sector and, 105employment in, xvi–xvii, 23, 25, 187tgreen revolution, 106, 120inclusive innovation and R&D in, 106–107,
120, 121b, 122bpublic good R&D efforts, 111, 112b
Agriculture Technology Management Agencies(ATMAs), 120, 122b, 124
Amida’s Simputer, xviiiAndhra Pradesh Industrial Development
Corporation (APIDC), 170, 177angel investors, 164, 165, 168, 170, 174APIDC (Andhra Pradesh Industrial
Development Corporation), 170, 177apprenticeship training programs, 137ATMAs (Agriculture Technology Management
Agencies), 120, 122b, 124ATP (Advanced Technology Program),
US, 69bAustralia, 42, 177automobile industry in India, 1, 7, 50, 51, 53
BBaluchari IIT Kharagpur computer-aided
design (CAD) program, 109bBand of Angels, 165, 170Bangladesh, 180fbankruptcy and insolvency, xv, 7, 40, 42, 165,
168, 179, 182Bayh-Dole Act (US), 9, 71Belgium, 159tbenchmarking, 44Bharatiya Yuva Shakti Trust (BYST), 126b,
127n2Bharti Televentures, 1
198
Index
China (continued)MSTQ services, 94f, 95patent applications in US, 34pharmaceuticals industry, 51bproductivity and innovation outputs, 35fproductivity dispersion in, 6, 26program coordination and foresight
processes, 44, 45public R&D costs, 66science and technology parks/incubators, 75skills and training in, xvi, 135fSpark program, 120, 121bstarting up and closing businesses, 41f, 42trade and FDI, openness to, 86, 87f, 88trade and investment openness in, 40university education in, 141
closing and starting up businesses, 41–42, 41fcolonialism, effects of, 40commercialization of innovations. See creation
and commercialization of knowledgeCompanies (Second Amendment) Act 2002, 42competition
importance of increasing, xv–xvi, 2, 7Indian context, competition-related
incentives in, 38–43, 39f, 41fcomputer-aided design (CAD) program for
Baluchari saris, 109bComputer-Based Functional Literacy (CBFL)
Program, 125bConsultative Group for International
Agricultural Research (CGIAR),111, 112b
context. See Indian contextcoordination of innovation programs,
43–45, 44bcorporate social responsibility for inclusive
innovation, 124, 125–126bCouncil of Scientific and Industrial Research
(CSIR), xviii, 8–9, 10creating and commercializing knowledge,
60, 64b, 65, 67, 75inclusive innovation, 107, 126n4information infrastructure, 158innovation finance, 167innovation inputs and outputs, 32, 34
Craftsman Training Scheme, 136creation and commercialization of knowledge,
xvi–xvii, 2, 3f, 7–10, 49–82commercialization process, 70–79
assessment of, 70–77grassroots inclusive innovation, 117–118management skills, 139recommendations, 77–79
competition, role of, 39Indian context, 27–29, 28–29b, 34IPR, 71–74, 77mobility of personnel, 74, 78
partnerships, public/private, 75, 76bprivate R&D (See private R&D, increasing)productivity and, 189tpublic R&D (See public R&D, improving)public support for, value of, 79–80n1science and technology parks/incubators,
74–77, 75b, 76b, 78CSV (Centre of Science for Villages), 124bCzech Republic, 159t
DDabbawala (lunchbox-carrier) system, 5Dahlman, Carl, 5, 7, 11, 13, 23–48, 49–82,
83–103, 105–128Defense Advanced Research Projects Agency
(DARPA), US, 68–69bdemographics in India, xv, 6, 129Denmark, 52development, R&D and new technology for,
108b. See also inclusive innovationDhingra, Inderbir Singh, 20, 163–185diaspora, making better use of, xvii, 12, 44,
91–92, 141diffusion and absorption of knowledge,
xvi–xvii, 2, 3f, 10–13, 83–103competition, role of, 39diaspora and talent flows, 91–92global knowledge, 85–92, 87f, 89fIndian context, 27, 28–28b, 29–30IPR flows and technology licensing, 89–91,
89f, 90bby MSMEs, 11, 12, 98–101, 99–100b,
178–182MSTQ services, 11, 12, 93–98, 93f, 94f,
96–97bproductivity and, 83–85, 189tSmall Industries Development Organization,
97–98b, 99–100btrade and FDI, openness to, 85–89, 87fvalue added per worker, 83–85, 84f
Divakaran, Shanthi, 15, 18, 129–146,147–162
Dr. Reddy’s Lab, 1, 34, 50, 51dualism of Indian economy, 2, 5–6, 24–25,
25f, 45n1, 105Dutz, Mark A., 1–21, 23–48, 49–82, 83–103
Ee-Choupal, xviii, 125–126bearly-stage technology development (ESTD)
defined, 183n4financing for, 20, 164, 165–167, 167fgovernment programs supporting, 55inclusive innovation and, 13–14international programs to stimulate, 60–61bneed to increase spending on, xvi–xviii, 8recommendations for, 59–62
early-stage venture capital. See underinnovation financing
economics of innovation. See innovationfinancing
economy of India. See Indian contextEcuador, 180feducation. See skills and training; universitiesEl Salvador, 180femigrant Indians, making better use of, xvii,
12, 44, 91–92, 141enabling environment, 7, 37–45, 38t, 39f, 41f.
See under Indian contextEngland. See United Kingdomenterprise-based and vocational training,
16–17, 133–139, 134f, 135f, 138b,190t, 192t
ERNET, 155b, 156–157, 156t, 161n6ESTD. See early-stage technology developmentEuropean Union, xvi, 75, 156–158, 158bevaluating innovation programs, 44expatriates, making better use of, xvii, 12, 44,
91–92, 141
FFDI. See foreign direct investmentfinancing innovation. See innovation financingFinland, 44, 159tfishing industry and ICT access, 17–18,
150b, 151foreign direct investment (FDI)
in higher education, 143need to increase openness to, 11, 40, 42,
85–89, 87frestrictions on, xv, 7, 42
foresight processes, 43–45, 44bformal and informal employment by
industrial category, 187t. See alsoinformal sector
Fortune at the Bottom of the Pyramid initiatives, 109, 110–111b
France, 52, 159tFroumin, Isak, 15, 129–146funding innovation. See innovation financing
GGARUDA, 156–157, 156tGÉANT2, 155b, 156–158General Electric’s John F. Welch R&D Center,
Bangalore, 92, 149Germany, 52, 75, 159t, 173GIAN (Grassroots Innovation Augmentation
Network), 14, 113, 114b, 167global networks and inclusive innovation,
111, 112bGlobal Research and Industrial Partnership
(GRIP) program, xvii, 10, 79,111, 112b
Index
199
globalization, 2Goel, Vinod K., 7, 11, 49–82, 83–103Grassroots Innovation Augmentation Network
(GIAN), 14, 113, 114b, 167grassroots innovations, promoting and
diffusing, 112–119, 113t, 114–115b,119b. See also inclusive innovation
Great Britain. See United Kingdomgreen revolution, 106, 120GRIP (Global Research and Industrial
Partnership) program, xvii, 10, 79,111, 112b
gross domestic product (GDP) in India,xvii, 1, 6, 8, 23, 26, 26f
Guatemala, 180fGujarat Venture Finance Ltd. (GVFL),
170, 177
HHBN (Honey Bee Network), 13, 14, 113, 114bHCL, 51HENP (high energy and nuclear physics)
NREN, 155bHGT (Home Grown Technology) Program,
55, 56thigh energy and nuclear physics (HENP)
NREN, 155bhigh-risk technologies, R&D support for, 9, 65,
68–69bhigher education. See universitiesHome Grown Technology (HGT) Program,
55, 56tHonduras, 180fHoney Bee Network (HBN), 13, 14, 113, 114bHong Kong (China), 34HRDF (Human Resource Development Fund),
Malaysia, 138bHsinchu Science Park, Taiwan (China), 75bHuman Resource Development Fund (HRDF),
Malaysia, 138bHungary, 159t
IICICI Knowledge Park, 76bICT. See information and communications
technologyilliteracy in India, 16, 131inclusive innovation, xv, xviii, 2, 3f, 13–15,
105–128in agriculture, 106–107, 120, 121b, 122bcommercialization of grassroots projects,
117–118corporate social responsibility and, 124,
125–126bdevelopment, R&D and new technology
for, 108bformal creation efforts, 106–112
inclusive innovation (continued)Fortune at the Bottom of the Pyramid
initiatives, 109, 110–111bfunding issues, 116, 117–118global networks and public good R&D
efforts, 111, 112bgrassroots innovations, promoting and
diffusing, 112–119, 113t,114–115b, 119b
for informal sector, 119–124, 121–126bIPR needs, 118–119, 119bmodels for promoting, 115bNGO involvement in, 13–15, 106, 122,
123–124b, 124private sector initiatives, 109–111, 110–111bpublic and university R&D, 107–109,
108b, 109brural nonfarm development, 120, 121bsupport networks, 120–124, 123–126bvalue addition for, 116–117
income inequality in India, 105Indian context, 5–7
competition-related incentives, 38–43,39f, 41f
creation and commercialization ofknowledge, 27–29, 28–29b, 34
dualism of economy, 2, 5–6, 24–25,25f, 45n
enabling environment, 7, 37–45, 38t, 39f, 41fGDP, xvii, 1, 6, 8, 23, 26, 26finnovation inputs and outputs, 27–35, 31t,
32f, 33f, 33t, 35f, 36–37tpatent applications, 32–34, 33tpopulation and demographics, xv, 6, 129productivity and innovation outputs, 35–37,
35f, 36–37t, 188tproductivity dispersion, 6, 25–26, 26tprogram coordination and foresight
processes, 43–45, 44bR&D expenditures, 30–32, 31t, 32f, 33fsociocultural norms friendly to innovation,
strengthening, 7, 40–42, 178starting up and closing businesses,
41–42, 41fIndonesia, 180fIndustrial Disputes Act, xvIndustrial Research Assistance Program
(IRAP), Canada, 61binformal sector
basic skills for, 130–133defining, 45–46n7employment in, xv, 1, 6, 24–25, 105, 187tinclusive innovation for, 119–124,
121–126binclusive innovation in, xviii, 2, 5, 13–15productivity dispersion in, 6skills and training in, 15–16
200
Index
information and communications technology (ICT)
corporate social responsibility for inclusiveinnovation in, 125–126b
dualism between agricultural sector ofIndian economy and, 105
globalization spurred by, 2IPR for, 72ITES (IT-enabled services), 148–149, 149tprivate R&D investment in, 51–52, 53productivity and use of, 147–150, 148t, 149tskills and training in, 132, 133, 142btrade and FDI, openness to, 89venture capital for, 168
information infrastructure, xvi, 17–19,147–162
access to, increasing, 18, 148–154, 152f, 152tinclusive innovation for, 110–111b, 112bKerala fishermen, mobile phones for, 17–18,
150b, 151teledensity in India, 151, 152f, 152tfor universities and R&D institutes
(NRENs), 18, 19, 154–160, 154b, 155b,156t, 157f, 158b, 159t
Infosys, 51, 142binnovation, ix–x, 1–21
action-oriented strategies for, xv–xviii, 1–5context for (See Indian context)creating and commercializing (See creation
and commercialization of knowledge)defining, 2, 6, 27diffusing and absorbing (See diffusion and
absorption of knowledge)financing for (See innovation finance)inclusive (See inclusive innovation)information infrastructure for
(See information and communicationstechnology; information infrastructure)
recent growth in, 1skills and training required for (See skills
and training)innovation finance, xvi, 20–21, 163–185
angel investors, 164, 165, 168, 170, 174definitions pertinent to, 182–183n3–4,
183n7early-stage finance, defining, 182n3early-stage venture capital, 164, 168–178
amount, number of deals, anddistribution in India, 168–170,169f, 170t
demand-side issues, 173–174recommendations for improving, 174–178skewing of investments toward later and
larger deals, 170, 171fsupply-side issues, 172–173
ESTD (early-stage technology development),20, 164, 165–167, 167f
fund of funds, 21, 78–79, 175–176, 175b,176–177
grassroots inclusive innovation, 116, 117–118higher education and, 142–143, 144MSMEs, 163–165
bank finance, access to, 180–181, 181fcredit flows for, 179–180, 179fearly-stage venture capital, 168, 171,
174, 177internal funding levels, 180frecommendations for, 181–182technology absorption, 178–182
public vs. private supportESTD funding, 165–167venture capital and private equity funding
(See subhead “early-stage venture capital,” this entry)
R&D, 164, 168recommendations for improving
early-stage venture capital, 174–178ESTD funding, 166–167MSME access to funds, 181–182
regulatory issues, 21, 173, 182skills and training issues, 173–174universities and, 164–166, 171, 178
insolvency and bankruptcy, xv, 7, 40, 42, 165,168, 179, 182
intellectual property rights (IPR) in India,9–10, 14, 71–74, 77
creation and commercialization ofknowledge, 71–74, 77
diffusion and absorption of knowledge,89–91, 89f
inclusive innovation and, 118–119, 119bInternet2, 155b, 156–158, 160, 161n4,
161n5–6, 161n9IPR. See intellectual property rights (IPR)
in IndiaIRAP (Industrial Research Assistance
Program), Canada, 61bIsrael
patent applications in US, 34pharmaceuticals industry, 51bscience and technology parks/incubators, 78venture capital industry, 168, 172, 177
Italy, 51b, 159tITES (IT-enabled services), 148–149, 149t
JJapan, 52Jaquard looms, 109b
KKedhkar, Sanjay, 155bKerala fishermen, mobile phones for, 17–18,
150b, 151KGVK (Krishi Gram Vikas Kendra), 123–124b
Index
201
Klein, Michael U., xknowledge. See creation and commercialization
of knowledge; diffusion and absorptionof knowledge
Korea, Republic ofinformation infrastructure, xviinformation infrastructure in, 152t,
156t, 157finnovation inputs and outputs, 31t, 32IPR flows and technology licensing, 89fMNCs with R&D investments in India, 52MSTQ services, 94f, 95patent applications in US, 34productivity and innovation outputs, 35fproductivity dispersion in, 6public R&D costs, 66science and technology parks/incubators, 75skills and training in, xvi, 135fstarting up and closing businesses, 41ftrade and FDI, openness to, 86, 87f
Krishi Gram Vikas Kendra (KGVK),123–124b
Lleather industry, 10–11, 124–125lunchbox-carrier (Dabbawala) system, 5
MMagan Sanghralaya, 124bMahindra & Mahindra, 7Malaysia, 138bmanagement skills, 137–139MDG (Millennium Development Goals), 105medium-size enterprises. See micro, small, and
medium enterprise (MSME) supportmetrology, standards, testing, and quality
(MSTQ) services, 11, 12, 93–98, 93f,94f, 96–97b
Mexicoinformation infrastructure in, 152t,
156t, 157finnovation inputs and outputs, 31t, 32IPR flows and technology licensing, 89fproductivity dispersion in, 6public R&D costs, 66starting up and closing businesses, 41ftrade and FDI, openness to, 86, 87f
micro, small, and medium enterprise (MSME)support, 11, 12
defining small industries, 101n1diffusion and absorption of knowledge by,
11, 12, 98–101, 99–100b, 178–182finance issues (See under innovation finance)innovation financing for, 21
Millennium Development Goals (MDG), 105MNCs (multinational corporations) and R&D
centers in India, 52–54, 53b, 59
MSEs (micro and small enterprises). See micro,small, and medium enterprise (MSME)support
MSMEs. See micro, small, and medium enterprise (MSME) support
multinational corporations (MNCs) and R&Dcenters in India, 52–54, 53b, 59
Nn-Logue, 14, 109b, 110b, 126bNadathur Holdings, 170NARI (National AIDS Research Institute), 155bNASSCOM (National Association of
Software and Service Companies),15, 129, 133
National AIDS Research Institute (NARI), 155bNational Association of Software and Service
Companies (NASSCOM), 15, 129, 133National Innovation Foundation, xviii, 13, 14,
113, 114–115bNational Research and Education Networks
(NRENs), 18, 19, 154–160, 154b, 155b,156t, 157f, 158b, 159t
National Research Development Corporation(NRDC), 70–71
National Science and Technology Entrepre-neurship Development Board(NSTEDB), 75
Netherlands, 44b, 52, 159tNew Millennium Indian Technology
Leadership Initiative (NMITLI),xvii, 9, 65–66, 68–69
NGOs (non-governmental organizations) andinclusive innovation, 13–15, 106, 122,123–124b, 124
Nicaragua, 180fNicholas Piramal Labs, 51bNMITLI (New Millennium Indian Technology
Leadership Initiative), xvii, 9, 65–66,68–69
non-governmental organizations (NGOs) andinclusive innovation, 13–15, 106, 122,123–124b, 124
Norway, 52, 159tNRDC (National Research Development
Corporation), 70–71NRENs (National Research and Education
Networks), 18, 19, 154–160, 154b, 155b,156t, 157f, 158b, 159t
NSTEDB (National Science and TechnologyEntrepreneurship Development Board), 75
OOrganisation for Economic Co-operation and
Development (OECD) countries, 31,34, 41f, 42, 88
202
Index
PPakistan, 180fpartnerships, public/private
for creating and commercializing knowledge, 75, 76b
for innovation finance, 175bPatel, Praful, xPatent Act, 34patent applications in India, 32–34, 33tPatent Cooperation Treaty (PCT), 34patent management corporation, need for,
xvii, 10, 73, 77–78PCT (Patent Cooperation Treaty), 34Peru, 180fpharmaceuticals industry, 1, 34, 50, 51b, 72,
80n17, 108b, 112b, 125bPharmaceuticals R&D Support Fund (PRDSF),
55, 58t, 65Philippines, 180fpilot programs, 44Poland, 159tpoor, innovation for. See inclusive innovationpopulation of India, xv, 6, 129Prayog Pariwar, 124bPRDSF (Pharmaceuticals R&D Support Fund),
55, 58t, 65preventive medicine, 108b, 125bprivate R&D, increasing, 50–62
automotive industry, 51, 53government programs promoting, 54–59,
56–59tICT industry, 51–52, 53inclusive innovation, 109–111, 110–111binteraction with public sector, 70international programs, 60–61bby MNCs in India, 52–54, 53b, 59pharmaceuticals industry, 51brecommendations for, 59–62
private sector, 3–4innovation finance
ESTD funding, 165–167venture capital and private equity funding
(See subhead “early-stage venturecapital” under innovation finance)
public/private partnershipsfor creating and commercializing
knowledge, 75, 76bfor innovation finance, 175b
skills and training offered by, 142b, 143–144productivity
creativity and, 189tdiffusion and absorption of knowledge, as
indicator of, 83–85, 189tICT use and, 147–150, 148t, 149tinnovation outputs and, 35–37, 35f,
36–37t, 188tskills and training, relationship to, 192t
productivity dispersion in India, 6, 25–26, 26tprogram coordination, 43–45, 44bpublic funding
innovation financeESTD funding, 165–167venture capital and private equity funding
(See subhead “early-stage venturecapital” under innovation finance)
universities, public funding and control of,142–143, 144
public good R&D efforts, 111, 112bpublic/private partnerships
for creating and commercializingknowledge, 75, 76b
for innovation finance, 175bpublic R&D, improving, 60–69
assessment of, 66–67commercialization recommendations, 77inclusive innovation, 107–109, 108b, 109binteraction with public sector, 70international examples of support for
high-risk technologies, 68–69borganization and programs, 60–66, 63f, 64brecommendations for, 67–69valuation of public support, 79–80n1
public sector programs, 3–4
Qquality (metrology, standards, testing, and
quality or MSTQ services), 11, 12,93–98, 93f, 94f, 96–97b
RRamco Systems, 51Ranbaxy, 34, 50, 51R&D. See research and developmentRekhi, Kanwal, 92research and development (R&D)
in agriculture, 106–107competition and investment in, xv,
39–40, 39fdevelopment, R&D and new technology
for, 108bfinancing for, 164, 168inclusive innovation and, 13–14information infrastructure for, 18, 19,
154–160, 154b, 155b, 156t, 157f,158b, 159t
innovation inputs and outputs, 30–32,31t, 32f, 33f
management skills, 139by MNCs in India, 7–8, 17, 52–54, 53bprivate (See private R&D, increasing)public (See public R&D, improving)public good R&D efforts, 111, 112bskills and training for, 139–144, 140b, 141fspending on, xvii, 6–7, 7–9
Index
203
technology road mapping, 44buniversities and MNCs, R&D links
between, 52brural nonfarm development, 120, 121bRussian Federation
information infrastructure in, 152t,156t, 157f
innovation inputs and outputs, 31t, 32IPR flows and technology licensing, 89fMSTQ services, 94f, 95patent applications in US, 34productivity and innovation outputs, 35fproductivity dispersion in, 6public R&D costs, 66skills and training in, xvi, 135fstarting up and closing businesses, 41ftrade and FDI, openness to, 86, 87f, 88
Ssaris, computer-aided design (CAD) program
for, 109bsatellite/space technology used for
development, 108bSavchenko, Yevgeniya, 15, 129–146SBIR (Small Business Innovation Research)
Program, US, 60–61bSBIRI (Small Business Innovation Research
Initiative), xvii, 8, 55, 58–59t, 59schools. See skills and training; universitiesSchumpeter, Joseph, 38Science and Technology Entrepreneur
Parks (STEPs), 75science and technology parks/incubators,
74–77, 75b, 76b, 78seed capital. See innovation financeSeed Fund, 170, 183n10Self-Employed Women’s Association
(SEWA), 123bSIDBI (Small Industries Development Bank
of India), 170Silicon Valley venture capital, 168, 170,
171, 172Simputer, xviiiSingapore, 34skills and training, xvi, 15–17. See also
universitiesacademia and MNCs, R&D links
between, 52bbasic skills, 130–133British rule, effects of, 40dependent variables for innovation and
training, 136, 191tenterprise-based and vocational training,
16–17, 133–139, 134f, 135f, 138b,190t, 192t
gross enrollment rates in secondary schools,130–131, 131f
204
Index
skills and training (continued)ICT, 132, 133illiteracy, 16, 131innovation finance and, 173–174management skills, 137–139private sector offerings, 142b, 143–144productivity and, 192tuniversity education, 139–144, 140b, 141f
Small Business Innovation Research Initiative(SBIRI), xvii, 8, 55, 58–59t, 59
Small Business Innovation Research (SBIR)Program, US, 60–61b
Small Business Technology Transfer (STTR)Program, US, 61b
small enterprises. See micro, small, andmedium enterprise (MSME) support
Small Industries Development Bank of India(SIDBI), 170
Small Industries Development Organization,97–98b, 99–100b
Society for Research and Initiatives forSustainable Technologies andInstitutions (SRISTI), 13, 14,113, 114b
sociocultural norms friendly to innovation,strengthening, 7, 40–42, 178
South Africa, 18, 52, 151space/satellite technology used for
development, 108bSpain, 51b, 159tSpark program, China, 120, 121bSponsored Research and Development
(SPREAD) program, xvii, 8, 10, 14,56t, 59–60
Sri Lanka, 180fSRISTI (Society for Research and Initiatives
for Sustainable Technologies andInstitutions), 13, 14, 113, 114b
Srivastava, Anil, 18, 147–162standards (metrology, standards, testing, and
quality or MSTQ services), 11, 12,93–98, 93f, 94f, 96–97b
starting up and closing businesses,41–42, 41f
STEPs (Science and Technology EntrepreneurParks), 75
strategic pilot programs, 44STTR (Small Business Technology Transfer)
Program, US, 61bSun Pharmaceuticals, 51Sweden, 52, 159tSwitzerland, 52
TTaiwan (China), 34, 75b, 78, 168Tan, Hong, 15, 129–146Tata, 1, 7, 50, 123, 142b
TCGA (The Centre for Genomic Application), 76b
TDB (Technology Development Board),70, 177
TDDP (Technology Development andDemonstration Program), 55, 57t
TDT (Technology Development and Transfer)program, 65
Techno-entrepreneurs Promotion Program(TePP), 55, 57t
Technology Development and DemonstrationProgram (TDDP), 55, 57t
Technology Development and Transfer (TDT)program, 65
Technology Development Board (TDB),70, 177
Technology Information Forecasting andAssessment Council (TIFAC), 55, 73,81n18, 91, 177
technology licensing, 89–91, 89f, 90btechnology road mapping, 44btechnology transfers, 10, 12, 61b, 77–78, 90TePP (Techno-entrepreneurs Promotion
Program), 55, 57ttertiary education. See universitiesThailand, 180fThe Centre for Genomic Application
(TCGA), 76bTIFAC (Technology Information Forecasting
and Assessment Council), 55, 73,81n18, 91, 177
TKDL (Traditional Knowledge DigitalLibrary), 14, 113
trade, need to increase openness to, 11, 40,85–89, 87f
Traditional Knowledge Digital Library(TKDL), 14, 113
traditional knowledge, promoting anddiffusing. See inclusive innovation
training. See skills and trainingtuberculosis, 108b
UUnited Kingdom
effects of British rule in India, 40information infrastructure and NRENs,
156, 159tMNCs with R&D investments in India, 52program coordination and foresight
processes, 45science and technology parks/incubators, 78
United StatesATP, 69bBayh-Dole Act, 9, 71DARPA, 68–69bESTD finance in, 165Indian-Americans in, 91
Index
205
Indian patent applications in, 34Indian pharmaceuticals Drug Master Files
applications, 51binformation infrastructure, xviinnovation inputs and outputs, 31MNCs with R&D investments in India, 52NRENs, 156SBIR Program, 60–61bscience and technology parks/incubators,
75–77, 78STTR Program, 61bventure capital industry, 168, 170,
172, 177universities
Bayh-Dole Act (US), 9, 71enrollment rates, 141fFDI and, 143inclusive innovation, 107–109, 109bIndian system of higher education,
139–140, 140binformation infrastructure for, 18, 19,
154–160, 154b, 155b, 156t, 157f,158b, 159t
innovation finance and, 164–166, 171, 178MNCs, R&D links to, 52bpublic funding and control of,
142–143, 144
public/private R&D and, 68, 74, 78skills and training, improving, 139–144,
140b, 141fUtz, Anuja, 13, 105–128
Vvalue added per worker, 83–85, 84fvalue addition for grassroots inclusive
innovations, 116–117venture capital, early-stage. See under
innovation financingVietnam, 180fvocational and enterprise-based training,
16–17, 133–139, 134f, 135f, 138b,190t, 192t
WWestbridge-Sequoia, 170Williams, Mark, 18, 147–162Wipro, 52, 142bWorld Trade Organization (WTO)
Agreement on Trade-Related Aspects ofIntellectual Property Rights (TRIPS),9, 71–72
MSTQ services, 95patent applications and Indian membership
in, 34

ECO-AUDIT
Environmental Benefits Statement
The World Bank is committed to preservingendangered forests and natural resources. TheOffice of the Publisher has chosen to printUnleashing India’s Innovation on recycledpaper with 30 percent postconsumer fiber inaccordance with the recommended standardsfor paper usage set by the Green Press Initia-tive, a nonprofit program supporting pub-lishers in using fiber that is not sourced fromendangered forests. For more information,visit www.greenpressinitiative.org.
Saved:• 9 trees• 6 million Btu of
total energy• 963 lb. of CO2
equivalent greenhousegases
• 3,158 gal. of waste water• 523 lb. of solid waste