UNL Climate Change Presentation
46
Keeping “Green” Buildings From Turning “Brown” Marcel Harmon, Ph.D., P.E., LEED-AP
description
Presentation given at the Sept. 18th/19th, 2008 Climate Change and the Physical Environment Seminar, College of Architecture, University of Nebraska, Lincoln. Title: Keeping "Green" Buildings From Turning "Brown"
Transcript of UNL Climate Change Presentation
Keeping “Green” Buildings From Turning
“Brown”
Marcel Harmon, Ph.D., P.E., LEED-AP

M.E. Group, Inc.M.E. Group, Inc.Building Systems Design DivisionBuilding Systems Design Division Mechanical/Electrical/Plumbing/Lighting Mechanical/Electrical/Plumbing/Lighting
DesignDesign High-Performance Building DesignHigh-Performance Building Design CommissioningCommissioning Feasibility StudiesFeasibility Studies
Green Services DivisionGreen Services Division LEED Documentation & ConsultingLEED Documentation & Consulting Green Building PlanningGreen Building Planning Existing Building Evaluations/Retro-Existing Building Evaluations/Retro-
CommissioningCommissioning CommissioningCommissioning Energy AuditsEnergy Audits Energy ModelingEnergy Modeling
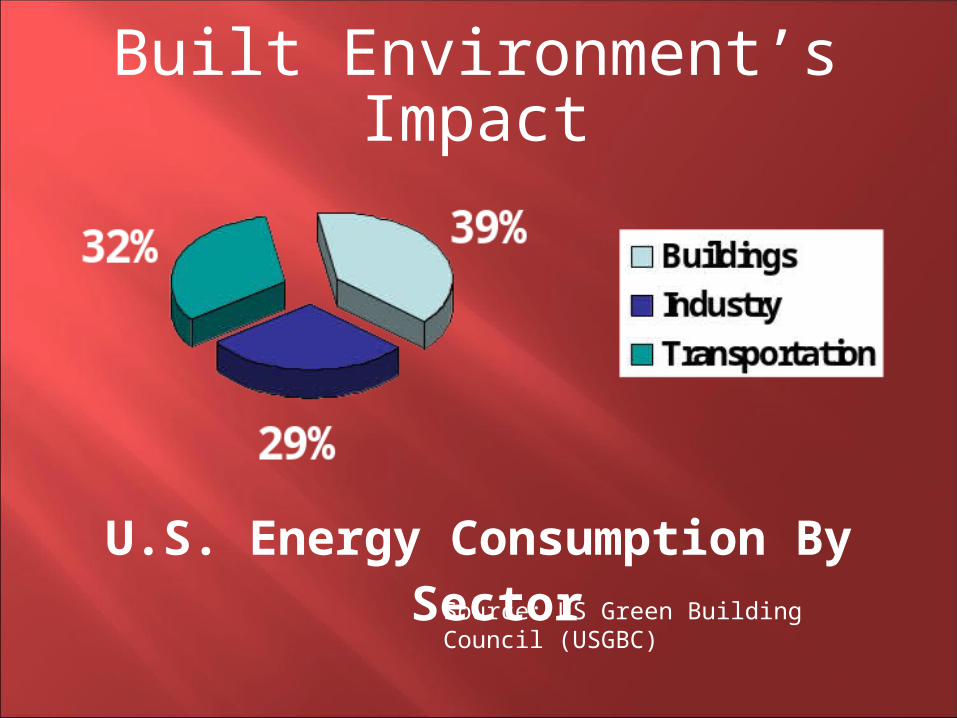
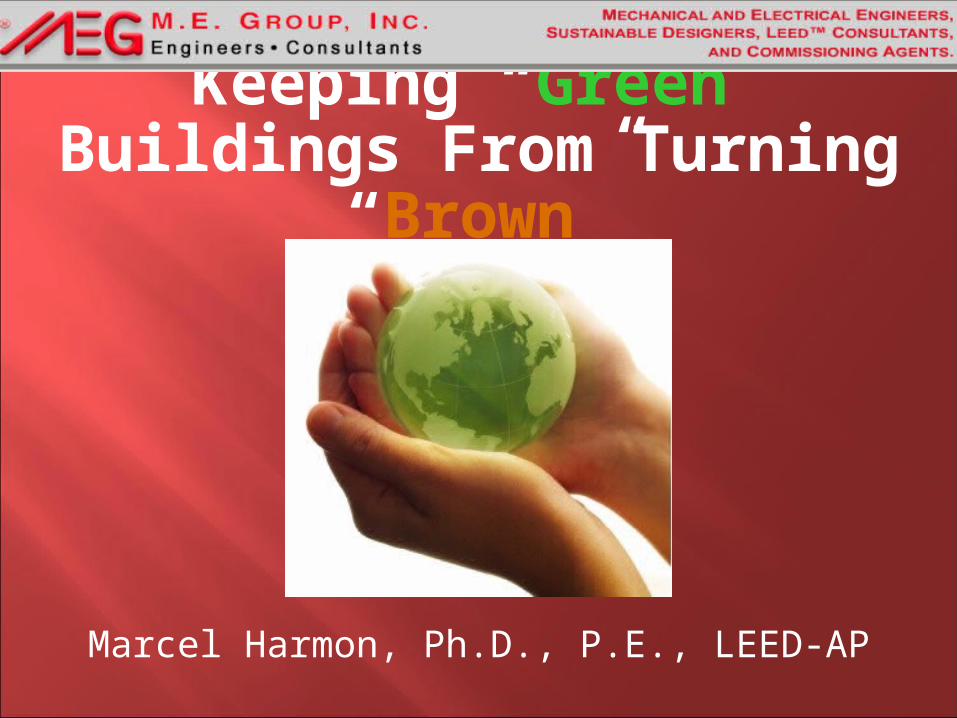
Built Environment’s Impact
Source: US Green Building Council (USGBC)
U.S. Energy Consumption By Sector
Built Environment’s Impact
Source: US Green Building Council (USGBC)
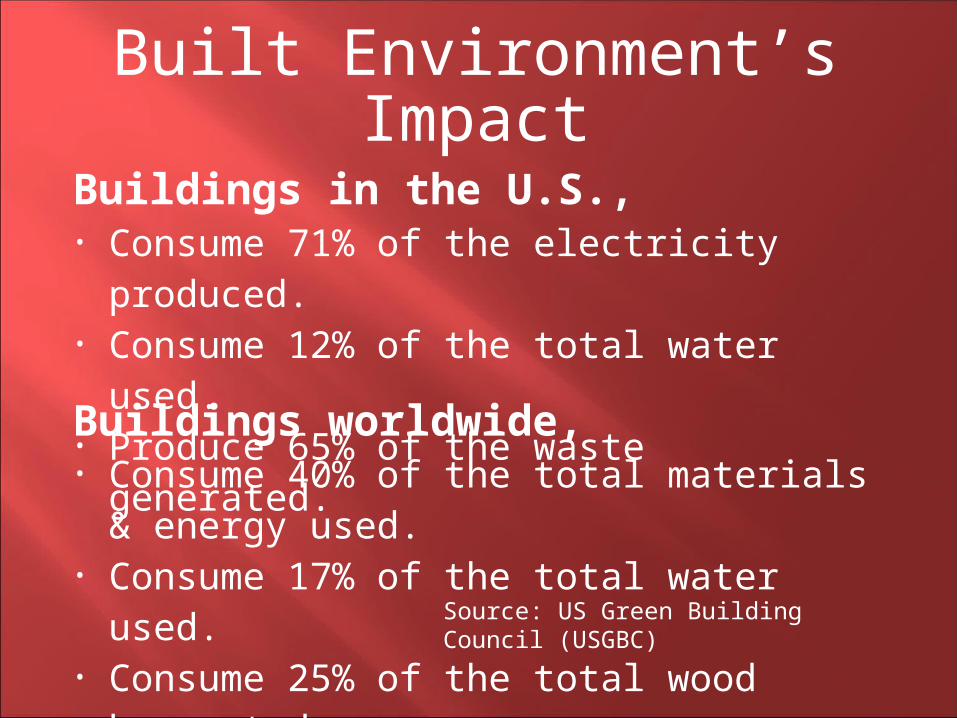
Buildings in the U.S.,• Consume 71% of the electricity
produced.• Consume 12% of the total water used.• Produce 65% of the waste generated.Buildings worldwide,• Consume 40% of the total materials &
energy used.• Consume 17% of the total water used.• Consume 25% of the total wood
harvested.
Built Environment’s Impact
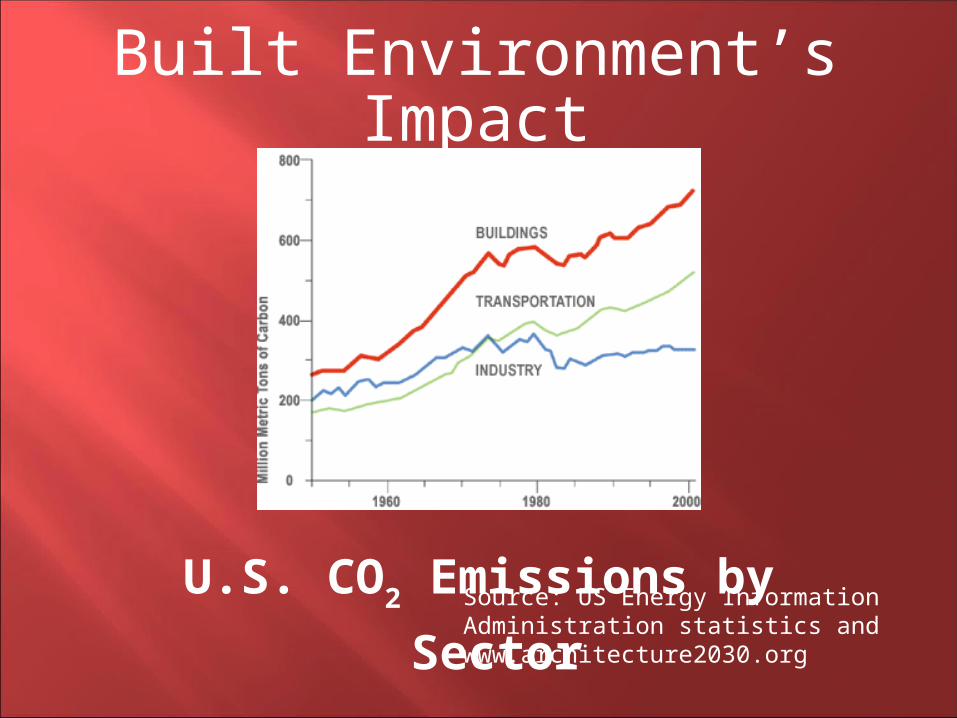
Source: US Energy Information Administration statistics and www.architecture2030.org
U.S. CO2 Emissions by
Sector
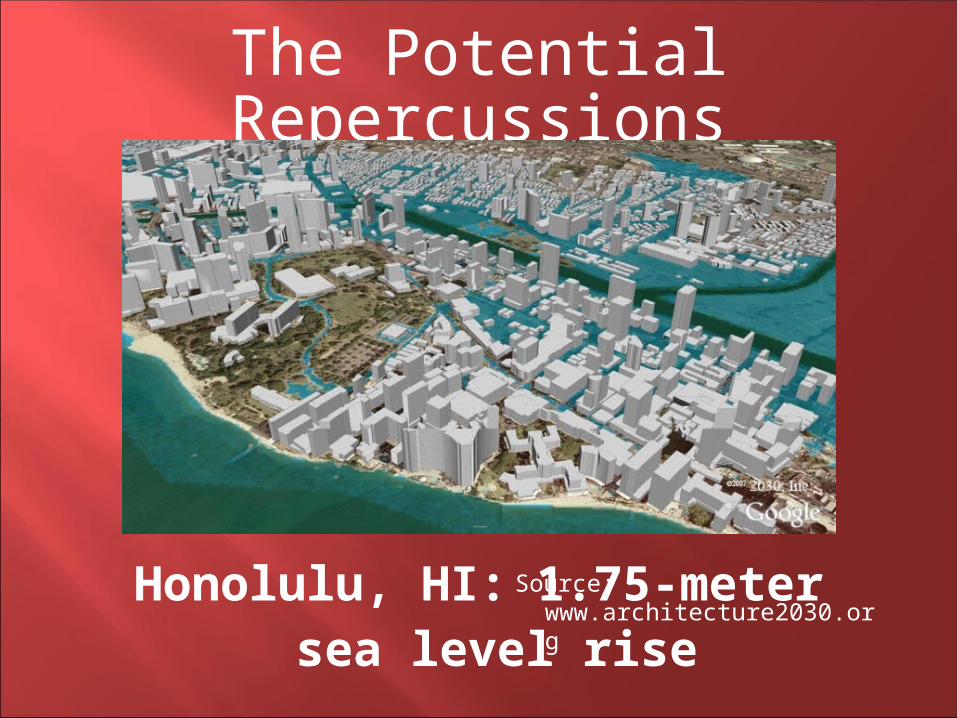
The Potential Repercussions
Honolulu, HI: 1.75-meter sea level rise
Source: www.architecture2030.org
LEED Building Performance
Source: Turner, C. and M. Frankel 2008. Energy Performance of LEED for New Construction Buildings. New Buildings Institute.
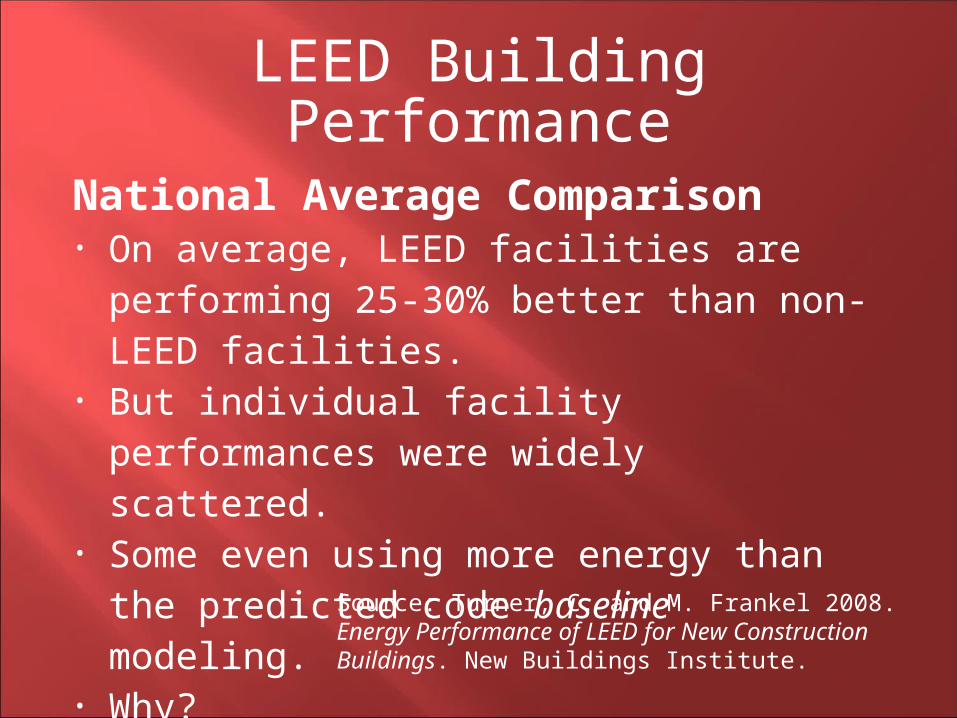
National Average Comparison• On average, LEED facilities are
performing 25-30% better than non-LEED facilities.
• But individual facility performances were widely scattered.
• Some even using more energy than the predicted code baseline modeling.
• Why?
Green to Brown
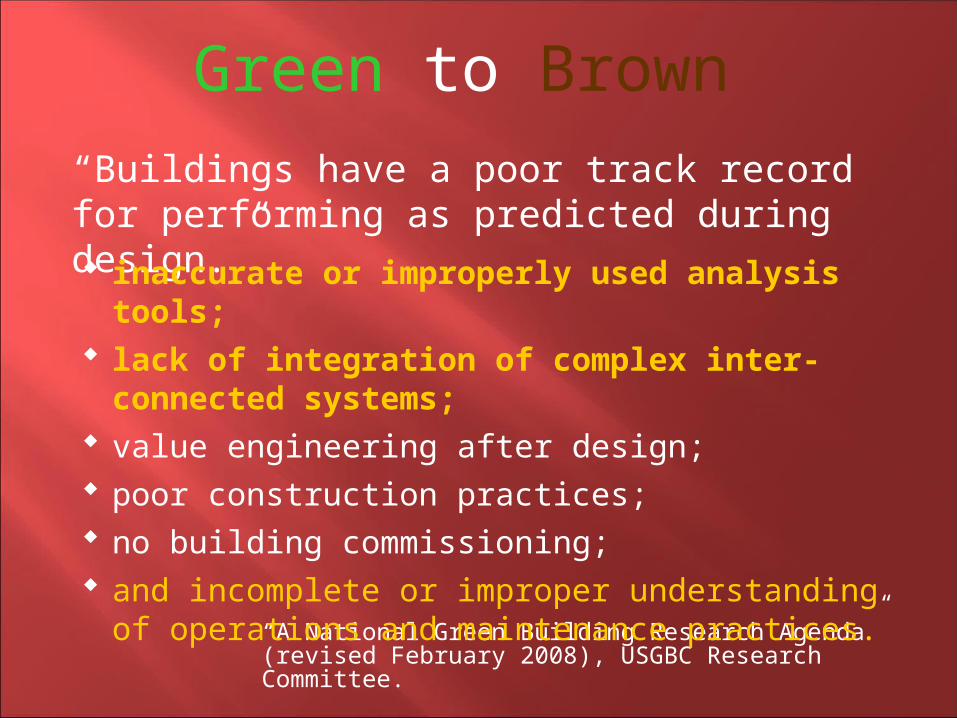
“Buildings have a poor track record for performing as predicted during design.”
“A National Green Building Research Agenda” (revised February 2008), USGBC Research Committee.
inaccurate or improperly used analysis tools;
lack of integration of complex inter-connected systems;
value engineering after design; poor construction practices; no building commissioning; and incomplete or improper understanding of
operations and maintenance practices.
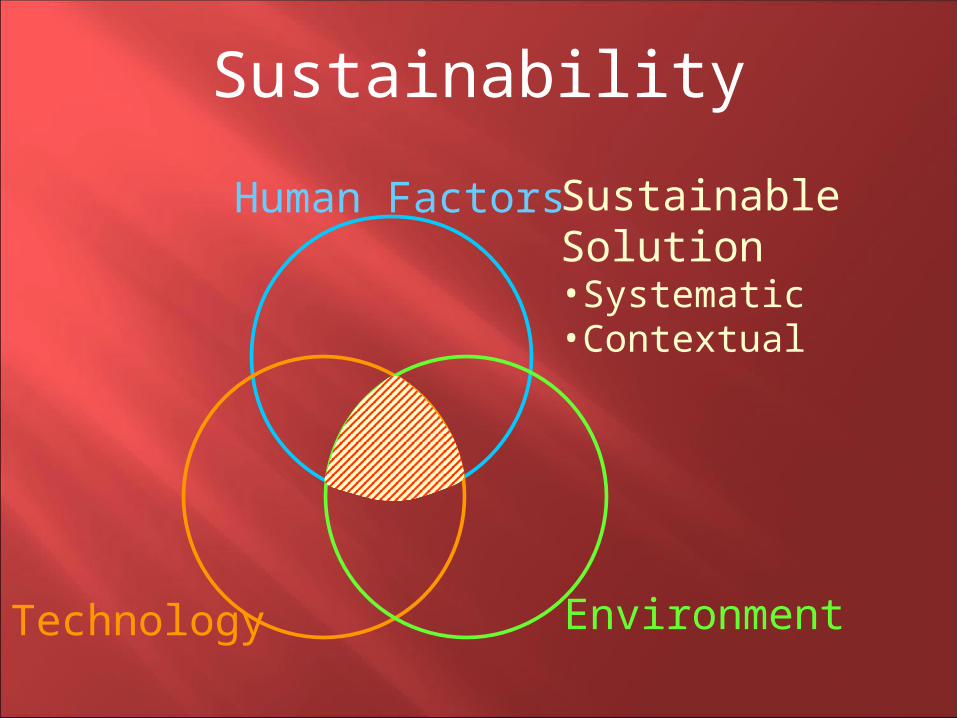
Sustainability
Sustainable Solution•Systematic•Contextual
Human Factors
Technology Environment
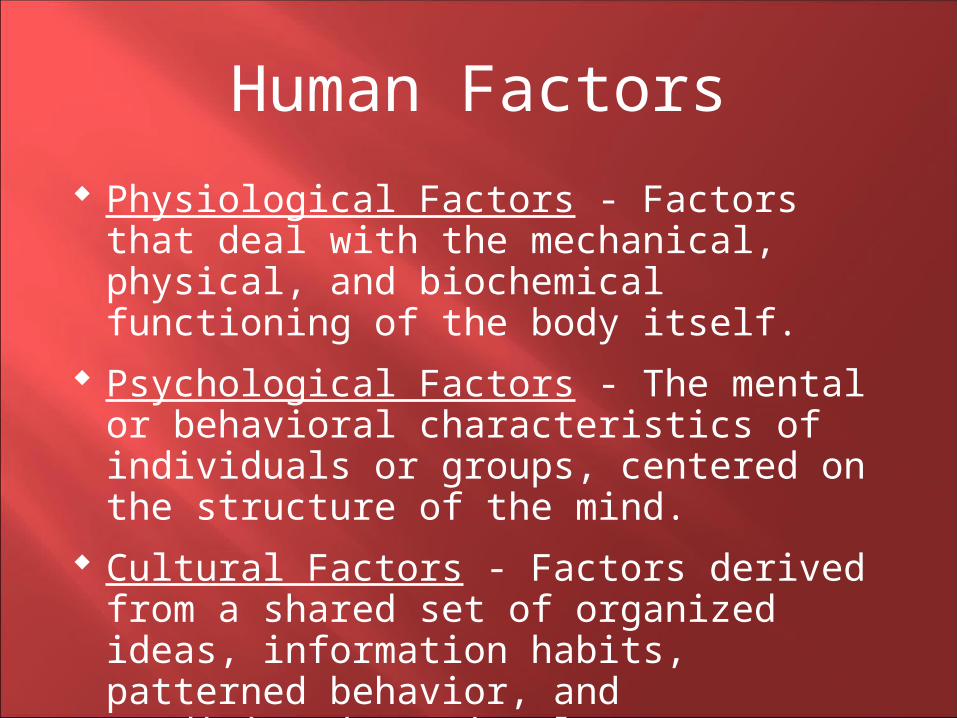
Human Factors
Physiological Factors - Factors that deal with the mechanical, physical, and biochemical functioning of the body itself.
Psychological Factors - The mental or behavioral characteristics of individuals or groups, centered on the structure of the mind.
Cultural Factors - Factors derived from a shared set of organized ideas, information habits, patterned behavior, and conditioned emotional responses, consisting of knowledge, belief, art, morals, law, and custom.
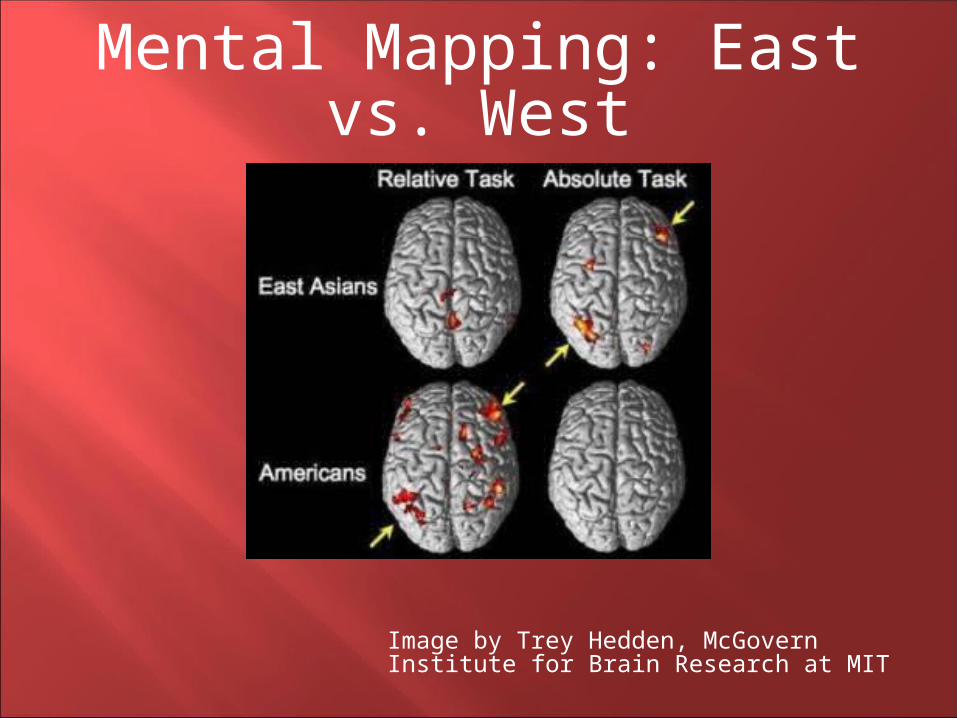
Mental Mapping: East vs. West
Image by Trey Hedden, McGovern Institute for Brain Research at MIT

Cultural Scripts
By providing a lens through which to view and interpret the world, it helps generate the specific experience.
Its what help me tell the difference between being comfortable and uncomfortable.
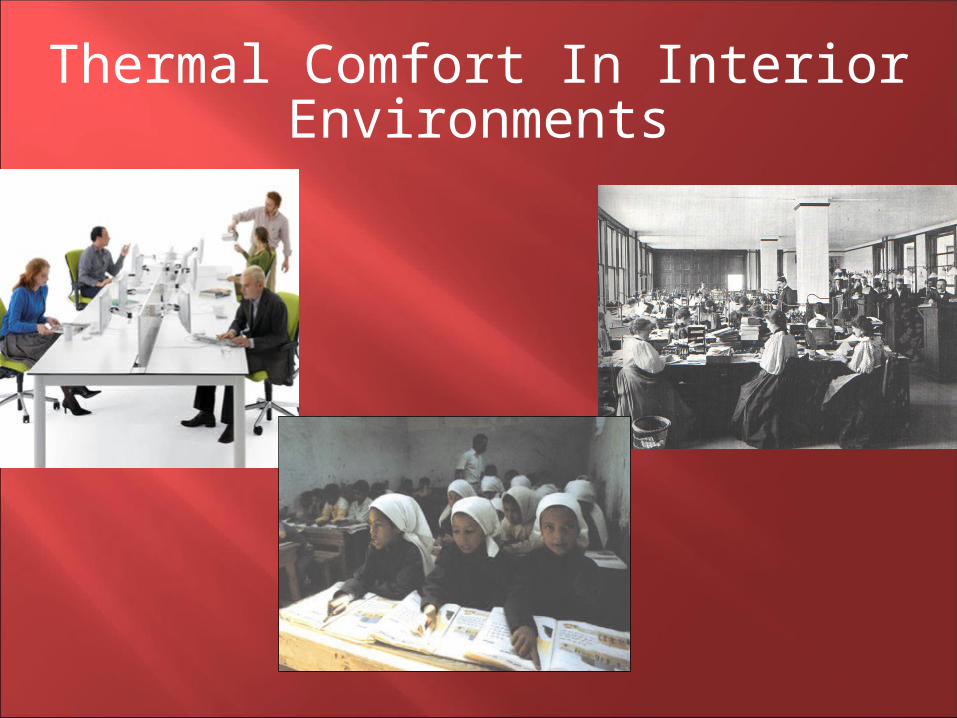
Thermal Comfort In Interior Environments
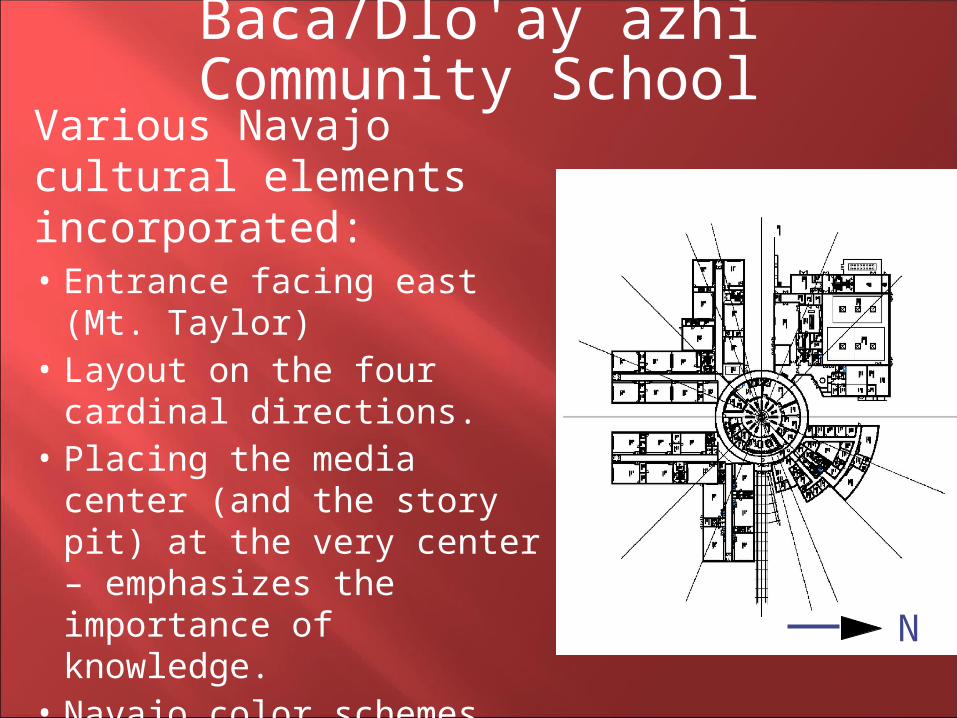
Baca/Dlo'ay azhi Community School
N
• Entrance facing east (Mt. Taylor)
• Layout on the four cardinal directions.
• Placing the media center (and the story pit) at the very center – emphasizes the importance of knowledge.
• Navajo color schemes.• Cultural Conflict w/
LEED
Various Navajo cultural elements incorporated:
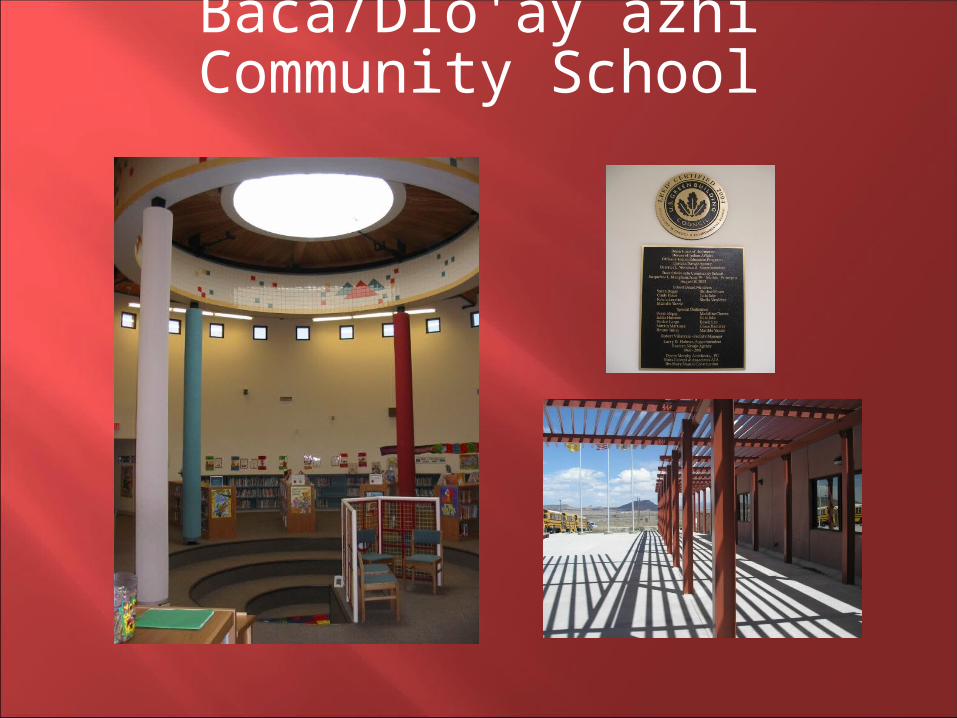
Baca/Dlo'ay azhi Community School

We are designing 21st century facilities for our stone-age minds and bodies, with physiologies and psychologies adapted to operating within a much different physical environment, and in a socio/cultural environment of low variability.
Stone-Age Minds & Bodies
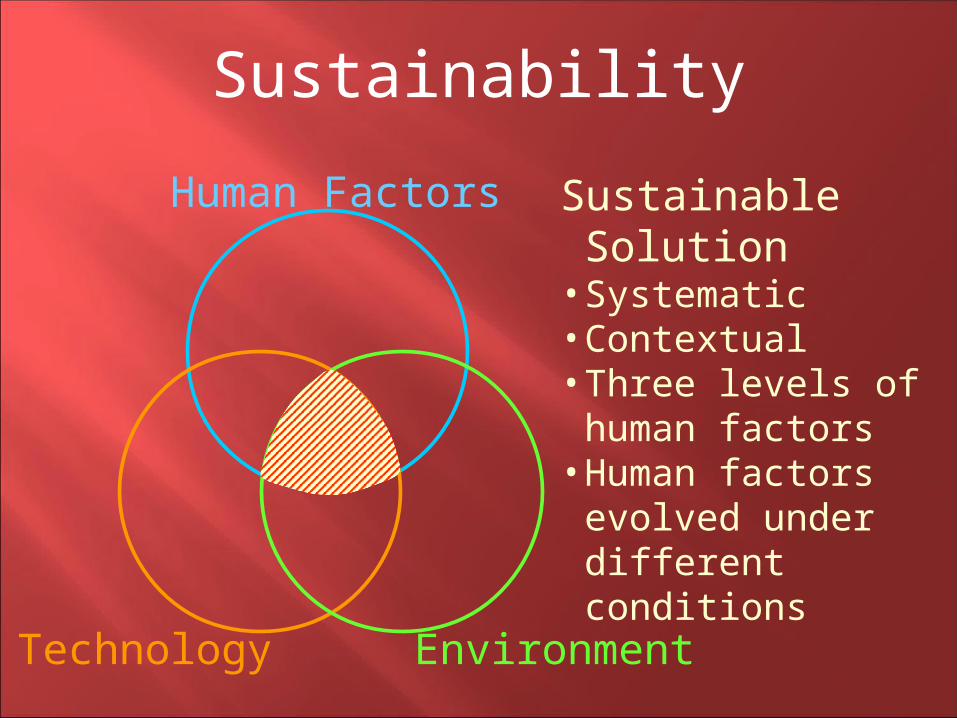
Sustainability
Sustainable Solution
• Systematic• Contextual• Three levels of
human factors• Human factors
evolved under different conditions
Human Factors
Technology Environment
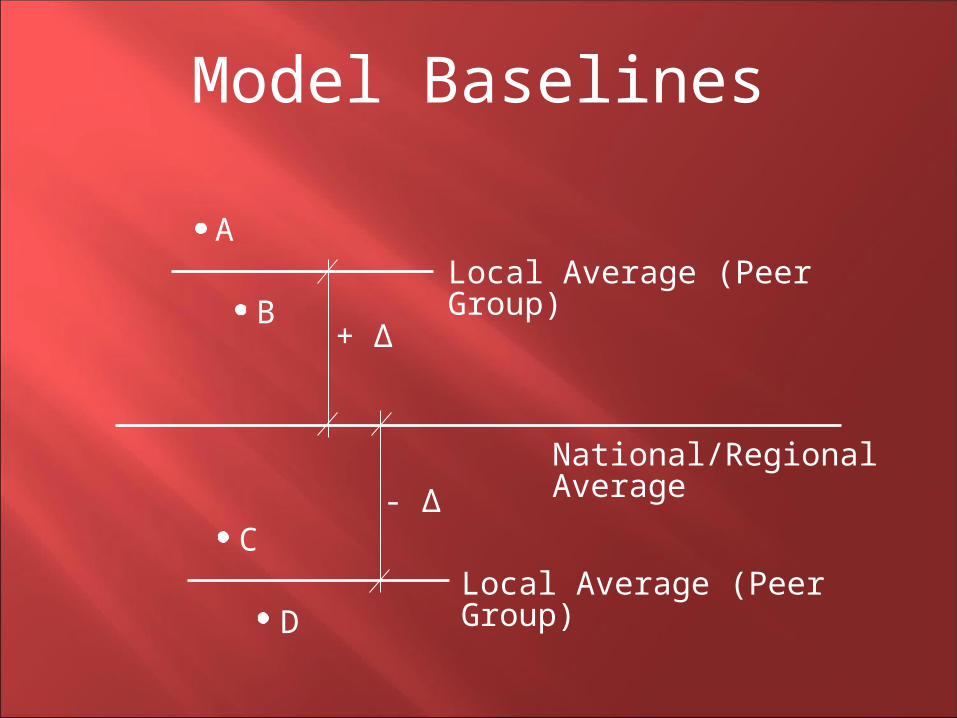
National/Regional Average
Local Average (Peer Group)
Local Average (Peer Group)
A
B
C
D
+ ∆
- ∆
Model Baselines
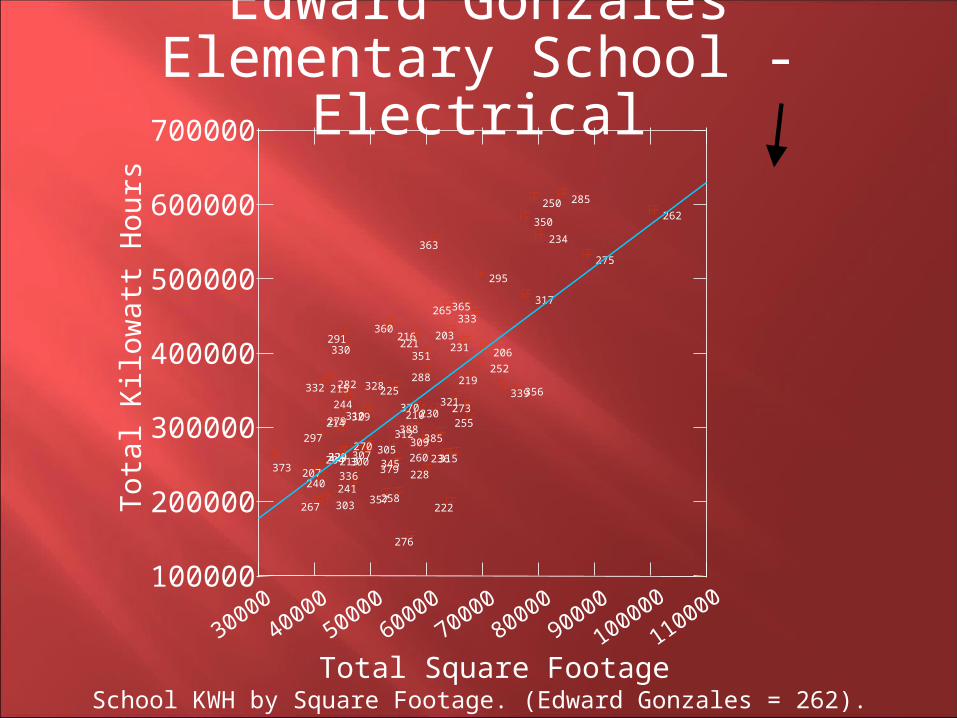
School KWH by Square Footage. (Edward Gonzales = 262).
3000040000
5000060000
7000080000
90000
100000
110000
Total Square Footage
100000
200000
300000
400000
500000
600000
700000T
otal
Kilo
wat
t Hou
rs
373
267
207
297
332
240
303
282
204
214279
291
262
275
285
234
250
317
350
356339
206
252
295
219
333
255273
365
231
321
315
203
222
265
236
385
230
363
351
288
228
309
260
210370
221
388
216
276
312
258
345
225
379
305
360
357
328
270307
329
300
310
213336241
244
330
215
324229
Edward Gonzales Elementary School -
Electrical
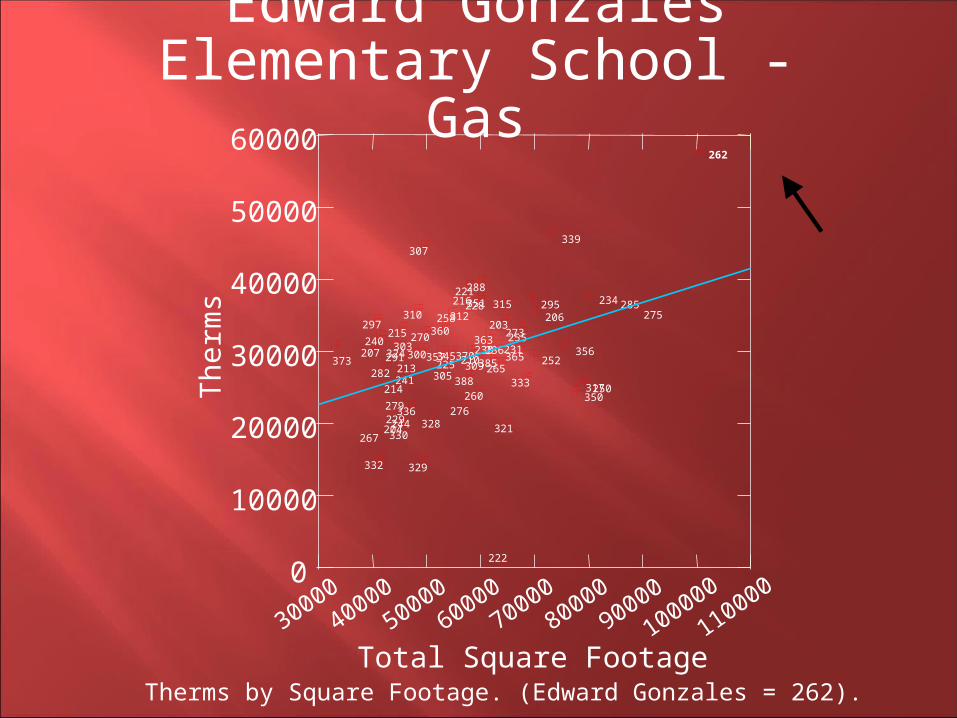
Therms by Square Footage. (Edward Gonzales = 262).
Edward Gonzales Elementary School - Gas
3000040000
5000060000
7000080000
90000
100000
110000
Total Square Footage
0
10000
20000
30000
40000
50000
60000
The
rms
373
267
207
297
332
240 303
282
204
214
279
291
262
275285234
250317350
356
339
206
252
295
333
255273
365231
321
315
203
222
265
236385
230363
351
288
228
309
260
210370
221
388
216
276
312
345
258
225305
360
357
328
270
307
329
300
310
213
336
241
244330
215
324
229
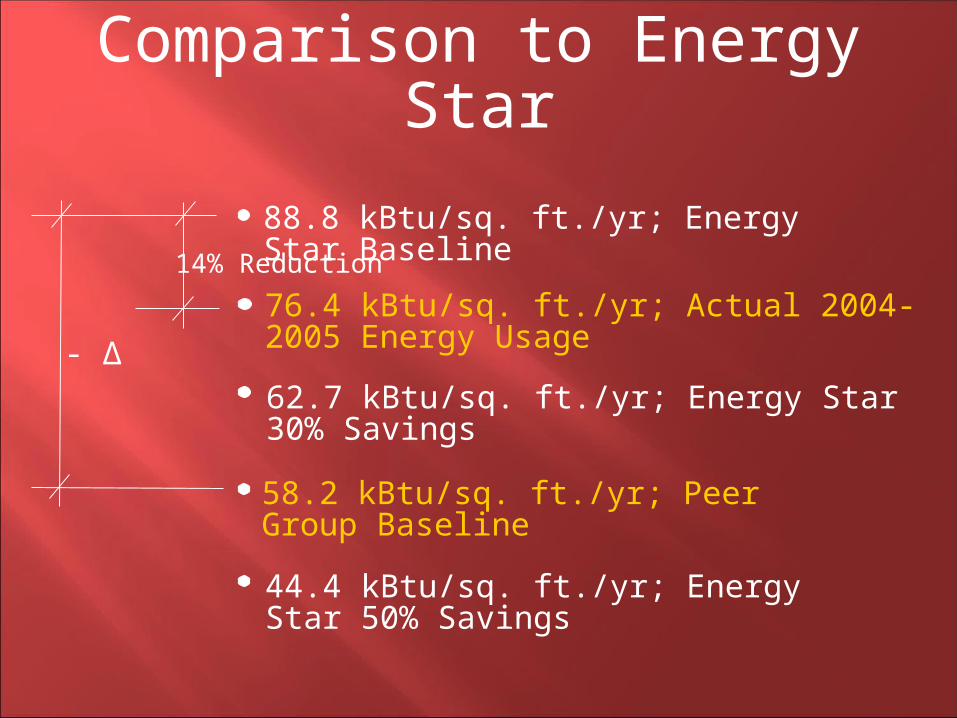
58.2 kBtu/sq. ft./yr; Peer Group Baseline
14% Reduction
- ∆
Comparison to Energy Star
88.8 kBtu/sq. ft./yr; Energy Star Baseline
76.4 kBtu/sq. ft./yr; Actual 2004-2005 Energy Usage
62.7 kBtu/sq. ft./yr; Energy Star 30% Savings
44.4 kBtu/sq. ft./yr; Energy Star 50% Savings
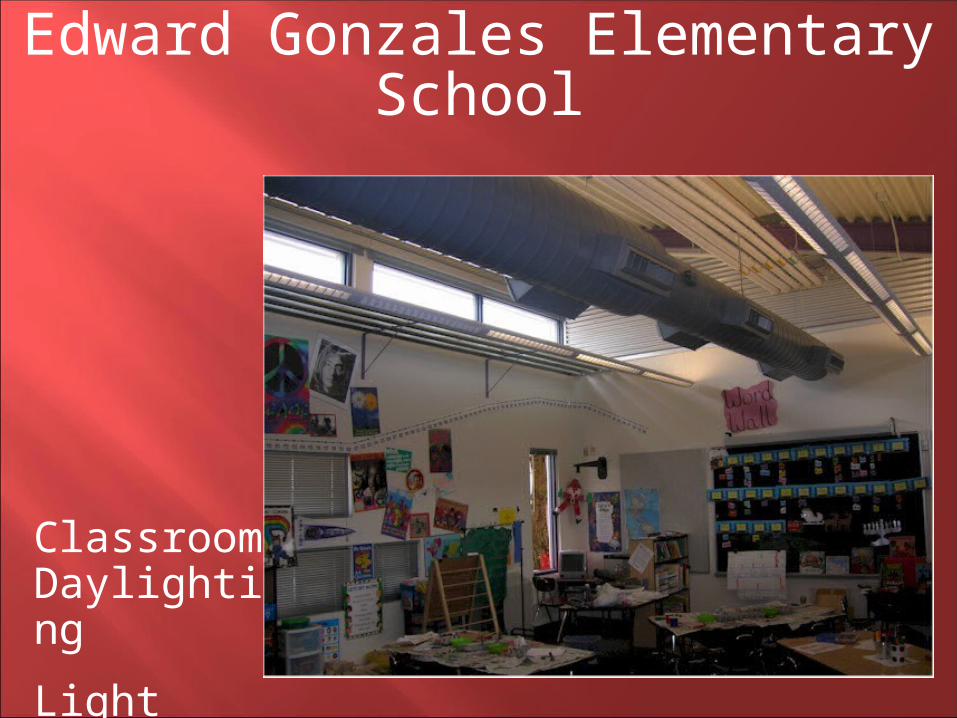
Edward Gonzales Elementary School
Classroom Daylighting
Light Sweep
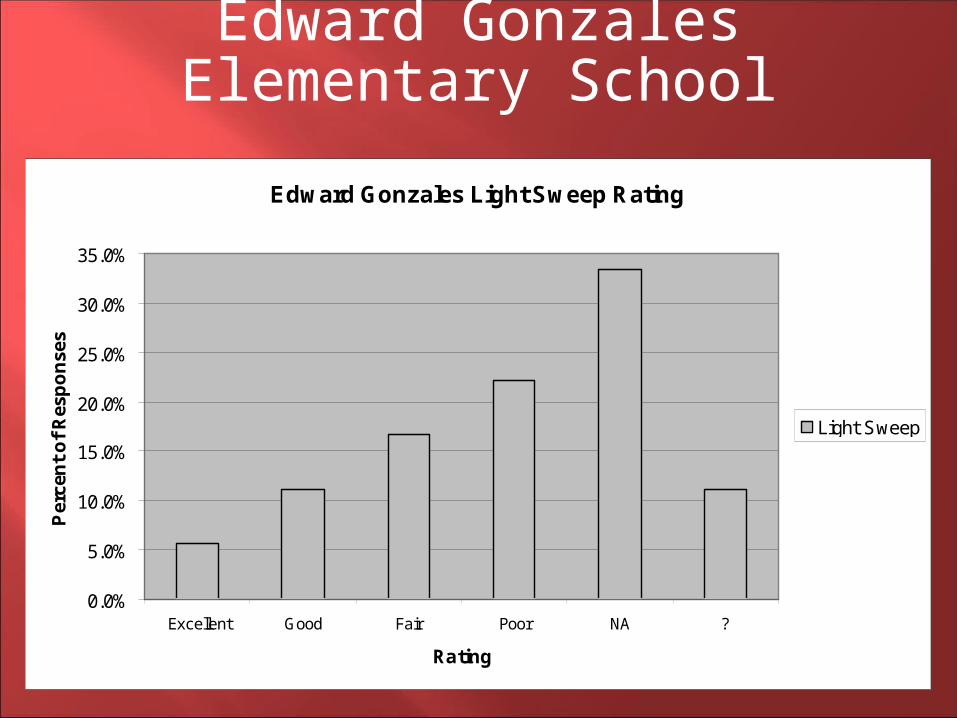
Edward Gonzales Elementary School
Edward Gonzales Light Sweep Rating
0.0%
5.0%
10.0%
15.0%
20.0%
25.0%
30.0%
35.0%
Excellent Good Fair Poor NA ?
Rating
Per
cen
t o
f R
esp
on
ses
Light Sweep
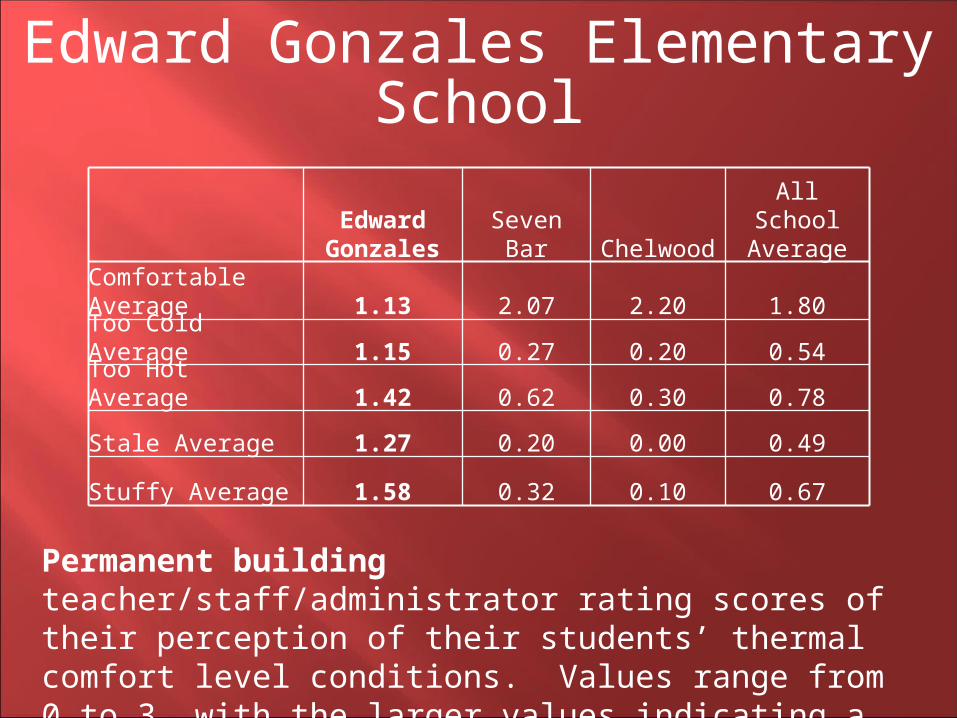
Edward Gonzales Elementary School
Permanent building teacher/staff/administrator rating scores of their perception of their students’ thermal comfort level conditions. Values range from 0 to 3, with the larger values indicating a greater degree of that particular condition present.
Edward
Gonzales Seven Bar ChelwoodAll School Average
Comfortable Average 1.13 2.07 2.20 1.80
Too Cold Average 1.15 0.27 0.20 0.54
Too Hot Average 1.42 0.62 0.30 0.78
Stale Average 1.27 0.20 0.00 0.49
Stuffy Average 1.58 0.32 0.10 0.67
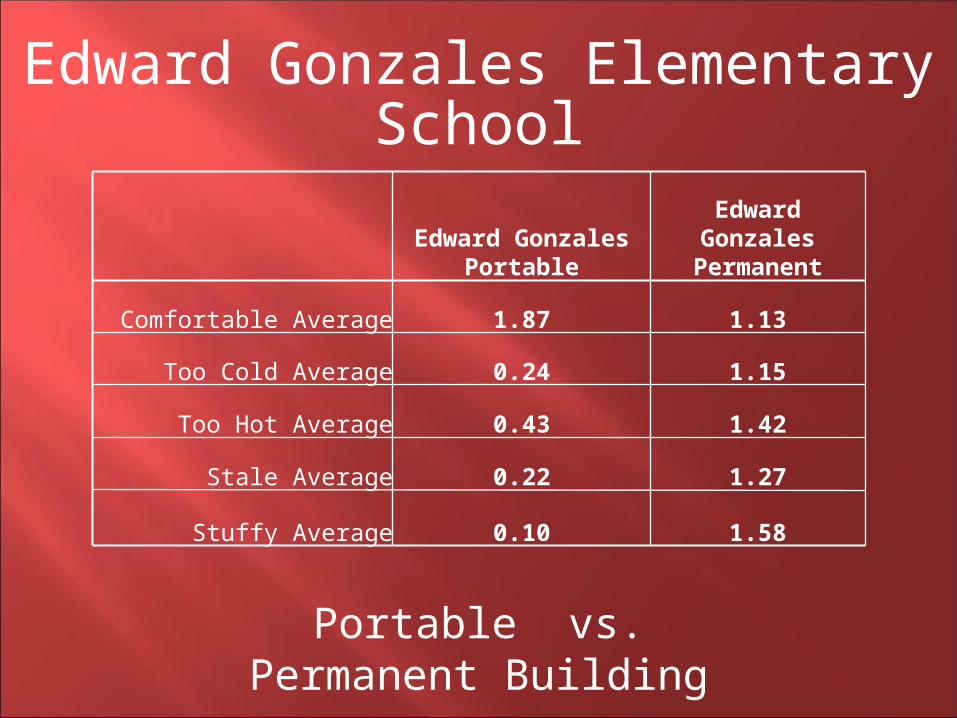
Edward Gonzales Elementary School
Portable vs. Permanent Building
Edward Gonzales
Portable
Edward Gonzales
Permanent
Comfortable Average 1.87 1.13
Too Cold Average 0.24 1.15
Too Hot Average 0.43 1.42
Stale Average 0.22 1.27
Stuffy Average 0.10 1.58
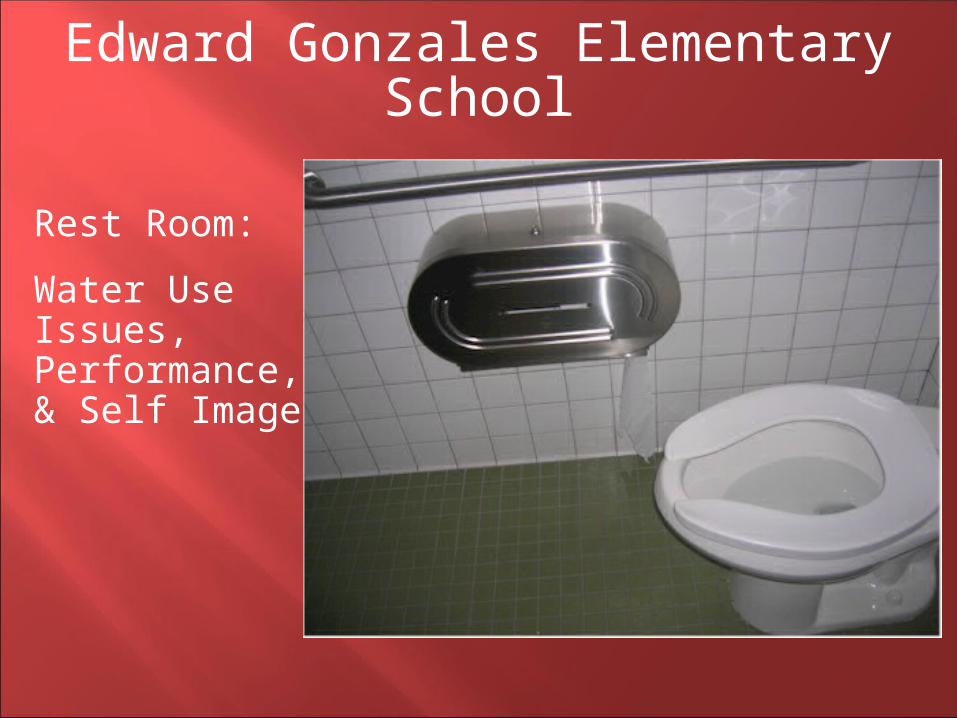
Edward Gonzales Elementary School
Rest Room:
Water Use Issues, Performance, & Self Image
KEEPING GREEN BUILDINGS GREEN
How?
More affectively account for human factors
Build better energy models that more accurately reflect local conditions
EVALUATE, EVALUATE, EVALUATE
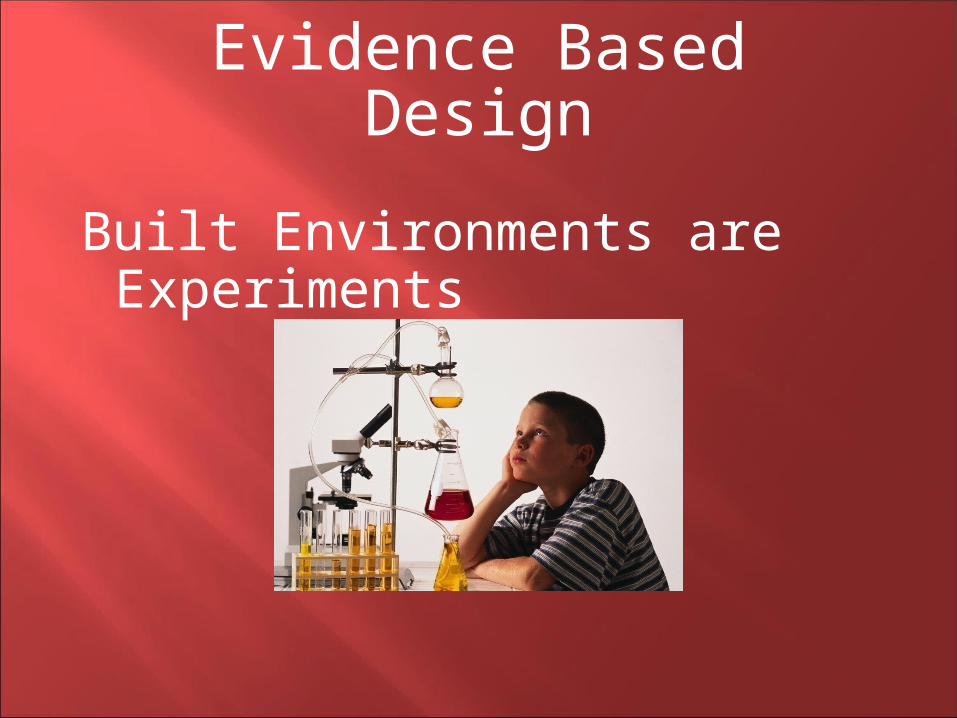
Evidence Based Design
Built Environments are Experiments
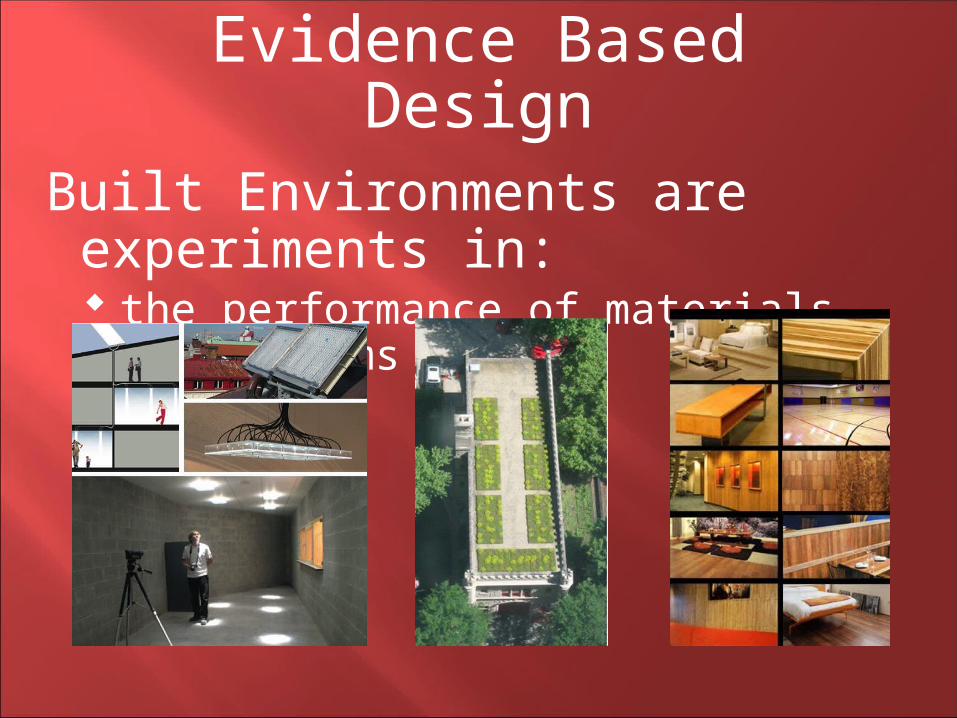
Evidence Based Design
Built Environments are experiments in: the performance of materials and
systems
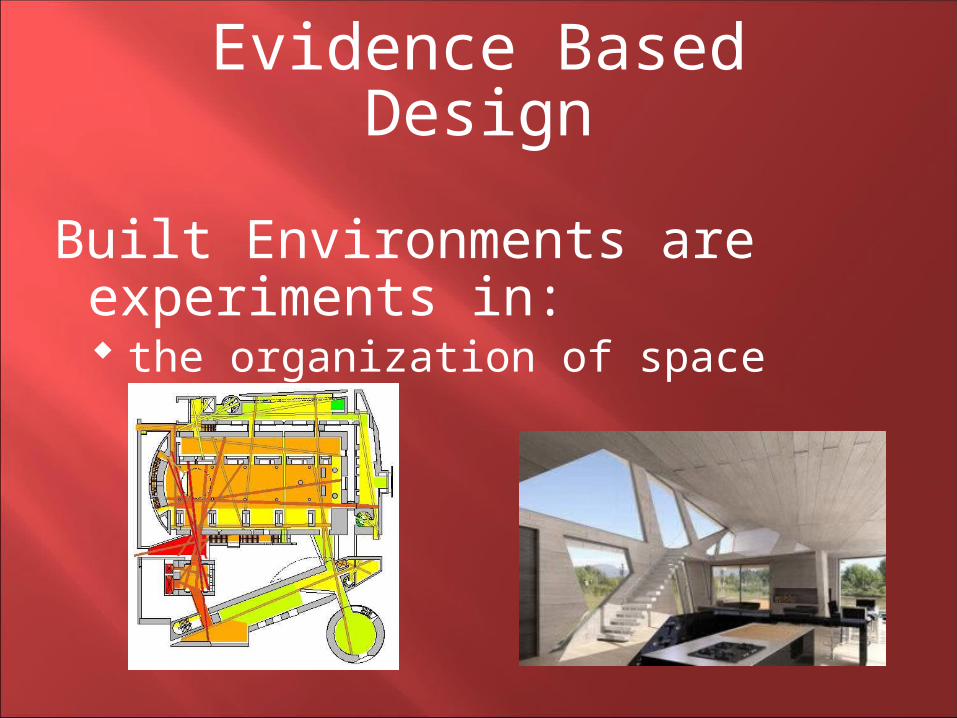
Evidence Based Design
Built Environments are experiments in: the organization of space
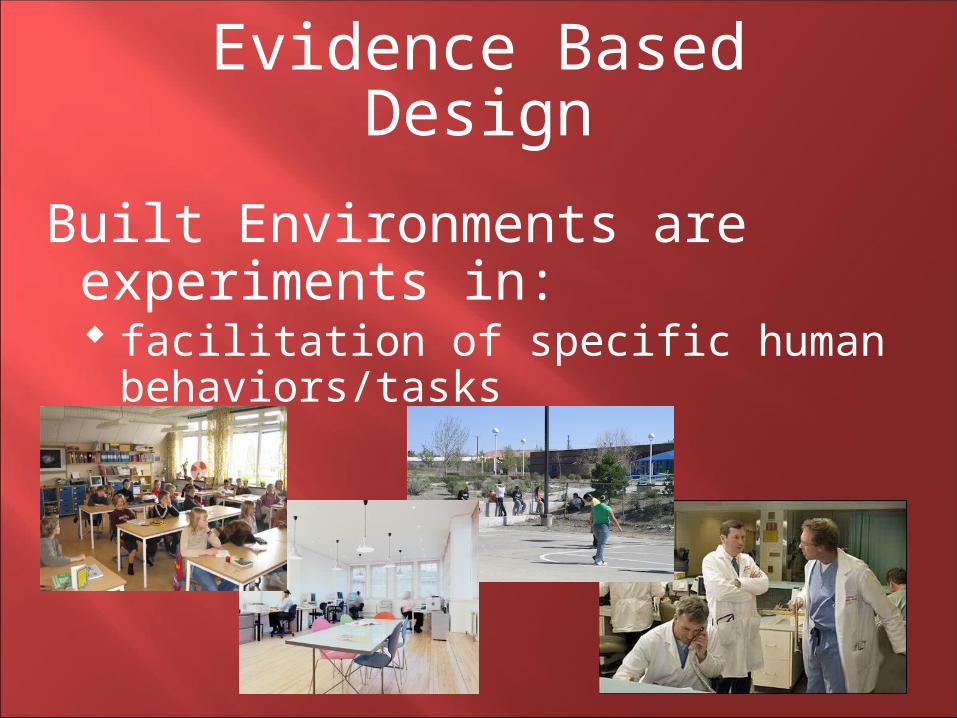
Evidence Based Design
Built Environments are experiments in: facilitation of specific human
behaviors/tasks
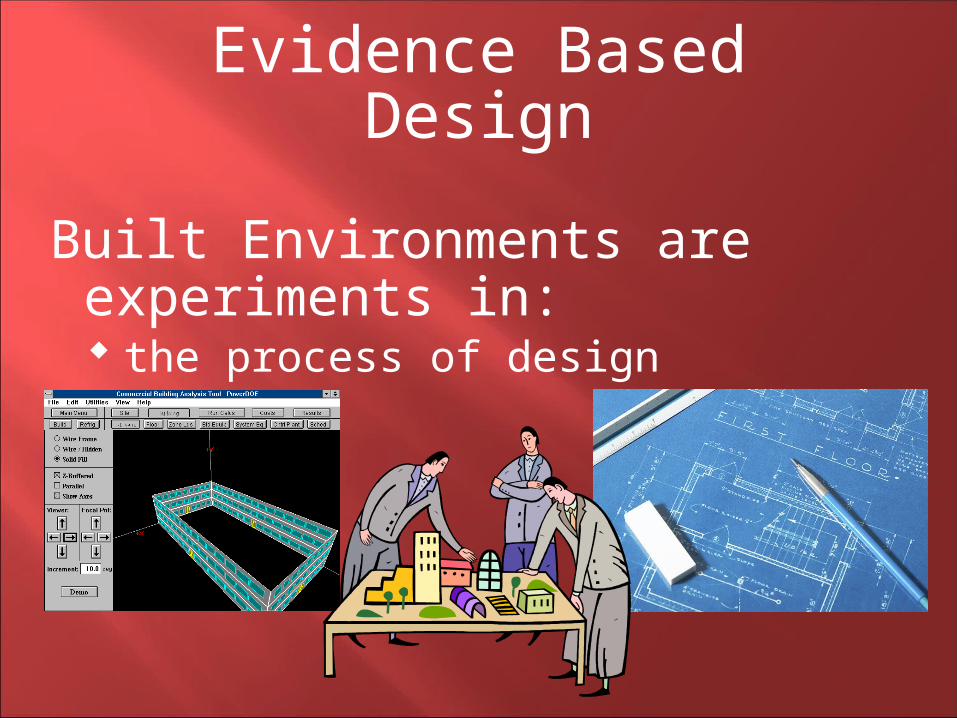
Evidence Based Design
Built Environments are experiments in: the process of design

Evidence Based Design
Built Environments are experiments in: construction methodologies, etc.
Evidence Based Design
If we do not evaluate the experiments, we do not learn what works, what doesn’t work, and why.
We repeat mistakes, waste resources and money, and minimize the quality of the human experience within the built environment.
Evidence Based Design
We must “… better relate design strategies to actual performance and benefit ... [and build] a more thorough dataset as well as more robust metrics ...”
- “A National Green Building Research Agenda” (revised February 2008), USGBC Research Committee.
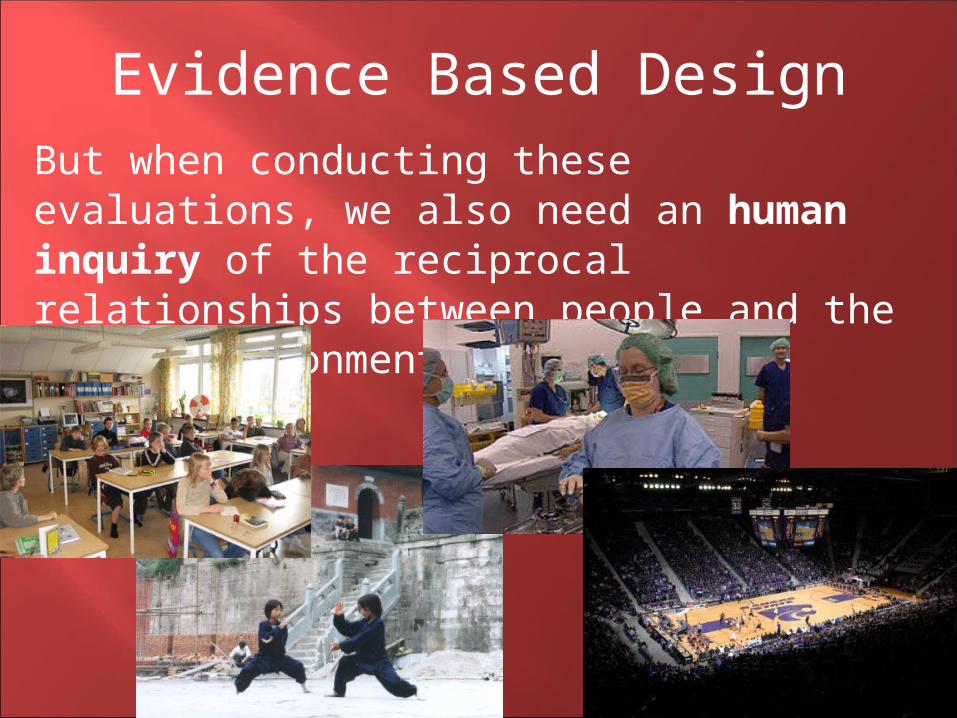
But when conducting these evaluations, we also need an human inquiry of the reciprocal relationships between people and the built environment.
Evidence Based Design
Goal: Correlate behavior, productivity/ performance metrics, health metrics, etc., with specific building elements (technologies, layouts, materials, etc.), for a specific social/cultural and physical environmental context.
Results: Informative knowledge for a specific project/facility; Knowledge added to a continually expanding database of information.
Human Inquiry Process
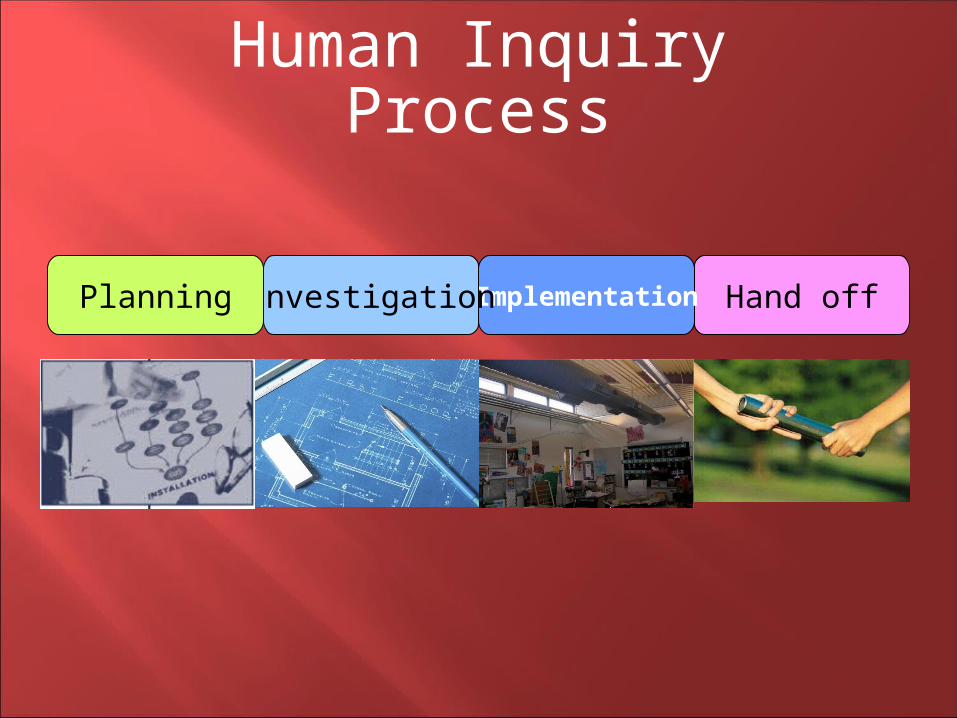
Human Inquiry Process
Hand offImplementationInvestigationPlanning
Further assurance for clients and the design/build team that the green/sustainable design goals will be successfully implemented.
Verification for clients that they are getting what they paid for, as well as assistance in keeping their “green” facility from turning brown.
Increase in productivity, performance, and health.
Decrease in employee turnover. Decrease in tenant turnover & increased
occupancy rates.
Evaluation/Human Inquiry Benefits
Performance/Productivity
IAQ Improvements: save up to $58 billion in lost sick
time save additional $200 billion in
worker performance.
- Fisk, W. G. 2000, Health and Productivity Gains from Better Indoor Environments and Their Relationship with Building Energy Efficiency. Annual Review of Energy and Environment 25(1):537-566. Later updated for 2002 dollars.
Performance/Productivity
Increased tenant environmental control have been found to provide average measured workforce productivity gains of:
7.1% with lighting control, 1.8% with ventilation control, and 1.2% with thermal control.
- Kats, G., L. Alevantis, A. Berman, E. Mills, and J. Perlman, 2003. The Costs and Financial Benefits of Green Building: A Report to California’s Sustainable Building Task Force.
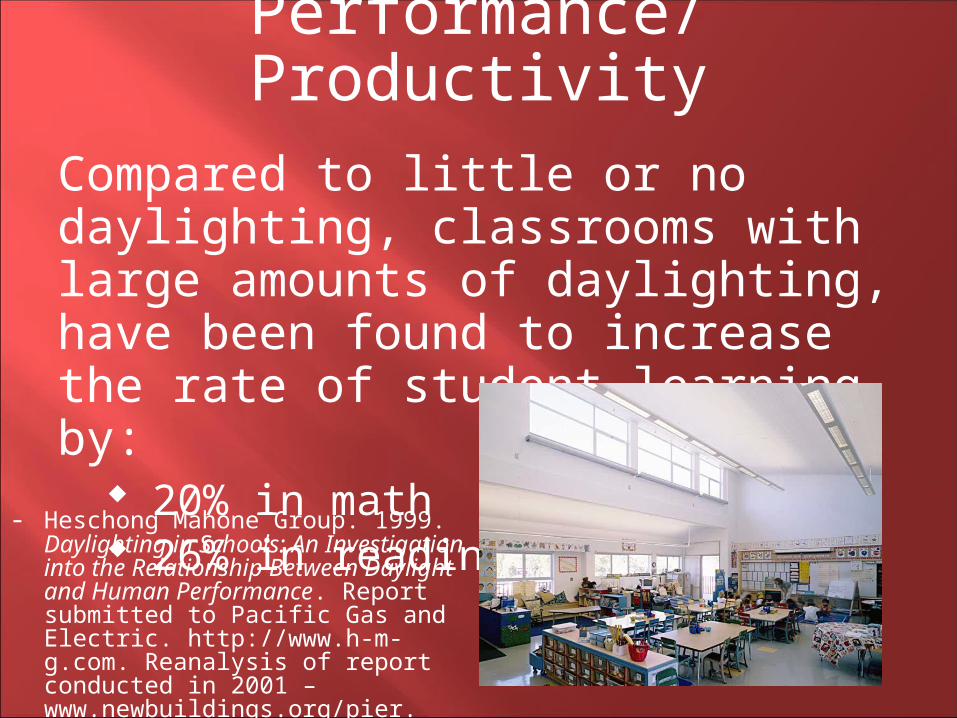
Performance/Productivity
Compared to little or no daylighting, classrooms with large amounts of daylighting, have been found to increase the rate of student learning by:
20% in math 26% in reading- Heschong Mahone Group. 1999.
Daylighting in Schools: An Investigation into the Relationship Between Daylight and Human Performance. Report submitted to Pacific Gas and Electric. http://www.h-m-g.com. Reanalysis of report conducted in 2001 – www.newbuildings.org/pier.
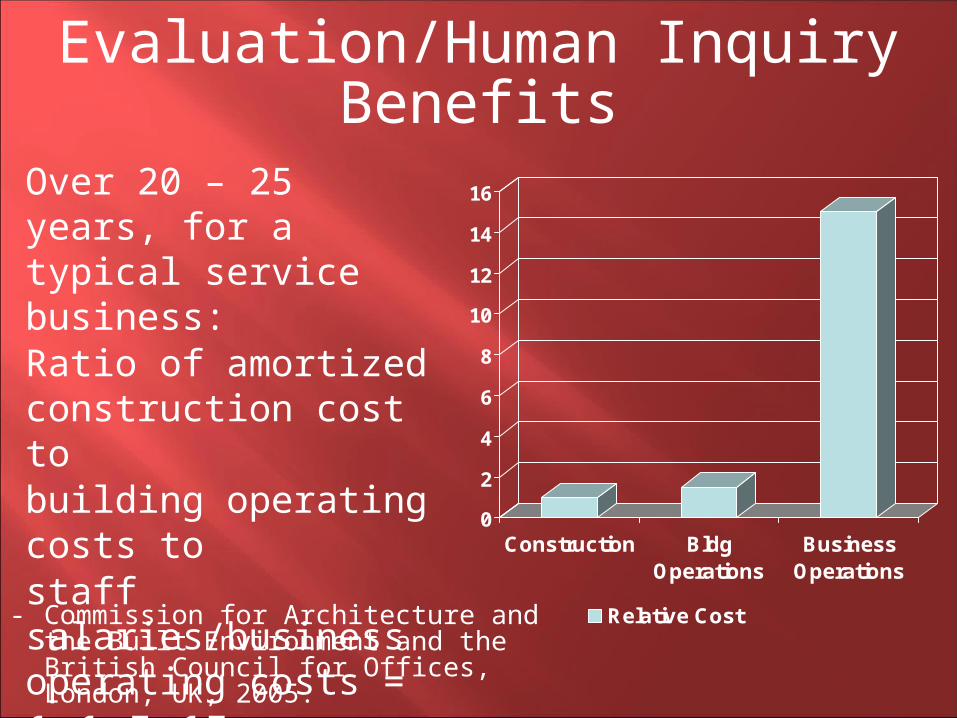
Over 20 – 25 years, for a typical service business:Ratio of amortized construction cost to building operating costs to staff salaries/business operating costs =1:1.5:15- Commission for Architecture and the
Built Environment and the British Council for Offices, London, UK, 2005.
0
2
4
6
8
10
12
14
16
Construction BldgOperations
BusinessOperations
Relative Cost
Evaluation/Human Inquiry Benefits
Brown facilities can result when human factors, technology, and/or the environment are not adequately accounted for initially, or change after the fact.
Green buildings (and all buildings in general) are experiments that require evaluation to verify they’re performing as designed.
Brown facilities will negatively impact the spread and success of green design, with negative global consequences.
Concluding Thoughts

"We have not inherited the world from our forefathers -- we have borrowed it from our children."
- Kashmiri proverb