University of Zurich - zora.uzh.ch fileMonitoring pulse rate . Case 1. A 16-year-old boy with severe...
19
University of Zurich Zurich Open Repository and Archive Winterthurerstr. 190 CH-8057 Zurich http://www.zora.uzh.ch Year: 2007 Clinical applications of photoplethysmography in paediatric intensive care Frey, B; Waldvogel, K; Balmer, C Frey, B; Waldvogel, K; Balmer, C (2007). Clinical applications of photoplethysmography in paediatric intensive care. Intensive Care Medicine, 34(3):578-582. Postprint available at: http://www.zora.uzh.ch Posted at the Zurich Open Repository and Archive, University of Zurich. http://www.zora.uzh.ch Originally published at: Intensive Care Medicine 2007, 34(3):578-582.
Transcript of University of Zurich - zora.uzh.ch fileMonitoring pulse rate . Case 1. A 16-year-old boy with severe...
University of ZurichZurich Open Repository and Archive
Winterthurerstr. 190
CH-8057 Zurich
http://www.zora.uzh.ch
Year: 2007
Clinical applications of photoplethysmography in paediatricintensive care
Frey, B; Waldvogel, K; Balmer, C
Frey, B; Waldvogel, K; Balmer, C (2007). Clinical applications of photoplethysmography in paediatric intensivecare. Intensive Care Medicine, 34(3):578-582.Postprint available at:http://www.zora.uzh.ch
Posted at the Zurich Open Repository and Archive, University of Zurich.http://www.zora.uzh.ch
Originally published at:Intensive Care Medicine 2007, 34(3):578-582.

Clinical applications of photoplethysmography in paediatricintensive care
Abstract
Objective: The photoplethysmographic wave is displayed by most pulse oximeters. It may be used as anon-invasive alternative to invasive arterial blood pressure trace analysis for continuous haemodynamicmonitoring in selected situations. Patients and setting: Four cardiac patients treated in a tertiaryneonatal-paediatric intensive care unit. Measurements: Simultaneous monitoring of thephotoplethysmographic wave, ECG, and invasive blood pressure. Results and conclusions:Photoplethysmography allows for monitoring pulse rate in patients with (possible) heart rate/pulse ratedissociation (pacemaker dependency, pulsatile ventricular assist device); monitoring sudden changes inheart beat volume, which are unrelated to respiration (pulseless electrical activity, pulsus alternans); andmonitoring respiratory-dependent fluctuations of the plethysmographic wave (heart failure,hypovolaemia, asthma, upper airway obstruction, pericardial effusion). Deterioration, slowly evolvingover time, may be detected by this method.

1
Clinical applications of photoplethysmography in
paediatric intensive care
Bernhard Frey, Katharina Waldvogel, Christian Balmer
Bernhard Frey (Correspondent) and Katharina Waldvogel: Department of Intensive
Care and Neonatology, University Children’s Hospital, CH-8032 Zurich, Switzerland
Tel: +41 44 266 73 59
Fax: +41 44 266 71 68
E-mail: [email protected]
Christian Balmer: Department of Cardiology, University Children’s Hospital, CH-8032
Zurich, Switzerland
Number of words: abstract 104. Body of the text (excluding abstract, legends,
references): 1600
Descriptor: 34. Cardiovascular monitoring
Key words: Paediatrics, Pulse oximetry, Photoplethysmography, Cardiovascular
monitoring

2
Abstract
Objective: The photoplethysmographic wave is displayed by most pulse oximeters. It
may be used as a non-invasive alternative to invasive arterial blood pressure trace
analysis for continuous haemodynamic monitoring in selected situations.
Patients and setting: Four cardiac patients treated in a tertiary neonatal-paediatric
intensive care unit.
Measurements: Simultaneous monitoring of the photoplethysmographic wave, ECG,
and invasive blood pressure.
Results and conclusions: Photoplethysmography allows for monitoring pulse rate in
patients with (possible) heart rate/pulse rate dissociation (pacemaker dependency,
pulsatile ventricular assist device); monitoring sudden changes in heart beat volume,
which are unrelated to respiration (pulseless electrical activity, pulsus alternans); and
monitoring respiratory-dependent fluctuations of the plethysmographic wave (heart
failure, hypovolaemia, asthma, upper airway obstruction, pericardial effusion).
Deterioration, slowly evolving over time, may be detected by this method.

3
Introduction
Pulse oximetry has become one of the most valuable monitoring techniques in
intensive care for continuous evaluation of arterial haemoglobin oxygen saturation. In
addition to the digital read-out of oxygen saturation, most pulse oximeters display a
plethysmographic waveform, which can help clinicians to distinguish an artefactual
signal from the true signal [1]. However, there may be further clinical applications of
the plethysmographic waveform. Photoplethysmography detects changes in blood
volume in the tissue under where the probe is applied. The displayed pulse waves
arise from heart beat dependent volume changes in the terminal arterial bed. The
slower respiratory waves are caused by blood volume changes in the venous bed.
These characteristics make the plethysmographic wave a useful tool for non-invasive
haemodynamic monitoring in some clinical settings in the paediatric intensive care
unit.
Methods
We present examples recorded from children we cared for in our tertiary neonatal
and paediatric intensive care unit. A Solar 8000M Modular Patient Monitor was used

4
(GE Medical Systems, Freiburg, Germany) with in-built Nellcor N-100 pulse oximeter
(Nellcor, Pleasanton, Calif., USA).
Monitoring pulse rate
Case 1. A 16-year-old boy with severe cardiomyopathy was put on a pulsatile
ventricular assist device (Berlin Heart, Berlin, Germany). He was non-invasively
monitored by pulse oximetry and ECG. While the plethysmographic wave shows the
ventricular assist device frequency of 60/min, the ECG shows the electrical activity of
the own heart (atrio-ventricular pacing, 129/min) (Fig. 1).
Similarly, in the cardiac pacemaker dependent child, ECG monitoring alone may not
trigger an alarm in the case of cardiac arrest. In the presence of cardiac arrest, the
ECG monitor may continue to count pacemaker artefact. Pulse rate monitoring by
pulse oximetry is also useful in arrhythmias such as bigeminus. Analysis of the
plethysmographic wave may be helpful in distinguishing arrhythmia from artefact on
the ECG and may give clues to the haemodynamic relevance of the arrhythmia.
The pulse rate display of the pulse oximeter is useful for two main reasons. First, the
pulse rate value should correlate with the measured heart rate, before the saturation
reading is accepted. Second, related to cardiac output, pulse rate is relevant and not
heart-/ECG rate. Therefore, whenever dissociation between heart-/ECG rate and
pulse rate is anticipated, as in case 1 or in a pacemaker-dependent child who is at

5
risk of respiratory failure or loss of pacemaker capture, plethysmography becomes an
important monitoring tool [2].
Monitoring respiratory dependent fluctuations of the plethysmographic wave
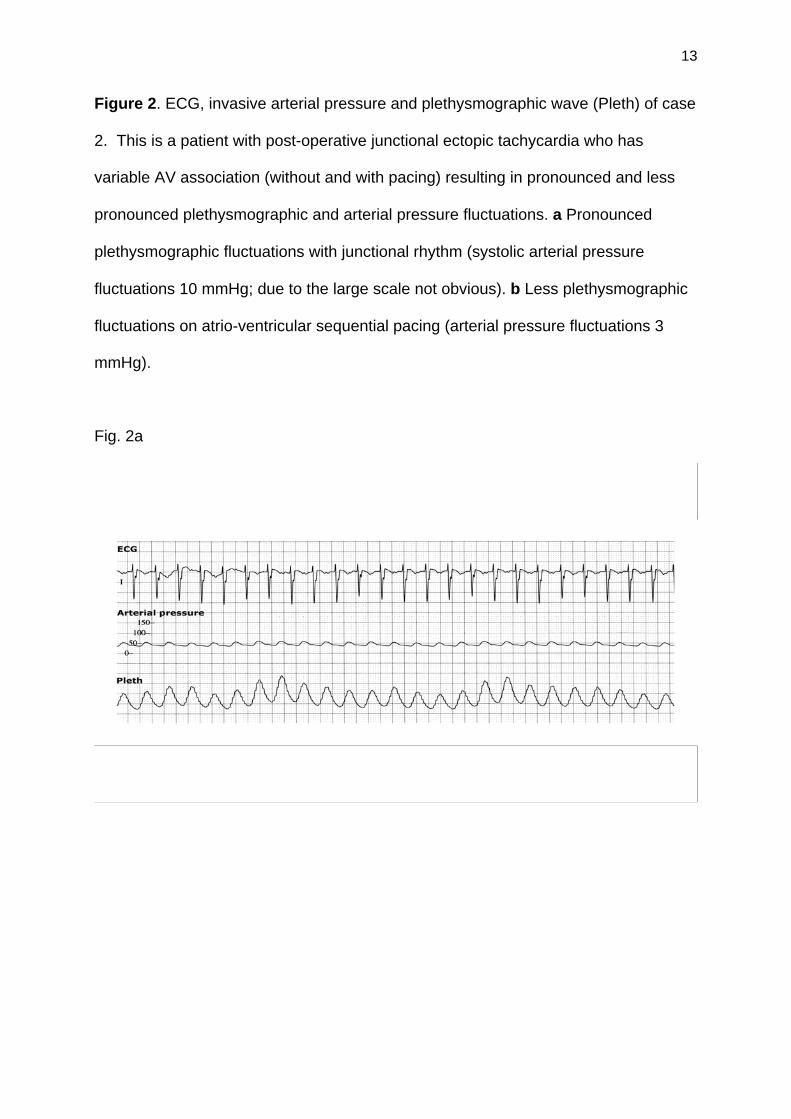
Case 2: A five-month-old boy with junctional ectopic tachycardia after heart surgery
(tetralogy of Fallot repair) was first treated with cooling and amiodarone. Heart rate
decreased from 210 to 157/min. Analysis of the plethysmographic wave revealed
pronounced (ventilation dependent) fluctuations (Fig. 2a). The ventilation related
systolic arterial pressure fluctuations (pulsus paradoxus) were 10 mmHg. With
sequential atrio-ventricular pacing (176/min) and unchanged ventilation parameters
(peak inspiratory pressure 24 cm H2O, PEEP 4 cm H2O, frequency 34/min, muscle
paralysis), the plethysmographic fluctuations were less pronounced (Fig. 2b, five
minutes after the start of pacing). The systolic arterial pressure fluctuations
decreased to 3 mmHg. The mean arterial blood pressure remained unchanged. No
volume was infused. Cardiac output was not measured.
We assume that restoration of AV synchrony by pacing resulted in improved cardiac
output and that the decrease in respiratory dependent blood pressure fluctuations
was related to the improved cardiac performance.
In cardiac patients with stable respiratory state, variations in respiratory dependent
blood pressure fluctuations (pulsus paradoxus) may indicate variations in cardiac
performance [3]. In mechanical ventilation, the cyclic, constant intrathoracic pressure

6
variations induce cyclic changes of arterial systolic blood pressure (reversed pulsus
paradoxus) which are related to cyclic changes in left ventricular stroke volume [4]. In
mechanically ventilated patients, a strong correlation and a good agreement between
respiratory variation in arterial pulse pressure and respiratory variation in pulse
oximetry plethysmographic waveform amplitude has been shown [5]. Lacking
invasive arterial blood pressure monitoring or in the case of technical problems (e.g.
damped wave), analysis of the photoplethysmographic wave may facilitate
demonstrating successful therapy or titrating therapy, as shown in case 2 and
recently demonstrated for volume dependency in adult patients [6]. Pulsus paradoxus
due to heart failure in paroxysmal supraventricular tachycardia (SVT) is also
detectable by pulse oximetry [7]. High respiratory dependent fluctuations of the
plethysmographic wave in an infant with SVT almost completely disappeared after
conversion to a regular sinus rhythm [7].
Increasing respiratory dependent fluctuations of the plethysmographic wave (pulsus
paradoxus) may alert the clinician in other situations too: status asthmaticus [8],
upper airway obstruction [9] and pericardial effusion [10]. In children at risk of
pericardial tamponade, increasing respiratory dependent fluctuations of the
plethysmographic wave may be an early sign of aggravation, before appearance of
the classical signs such as tachycardia, hypotension and distension of the external
jugular vein [10].
There is scarce information regarding the physiologic principles underlying these
clinical observations. Two types of photoplethysmographic waves can be recognized:
the pulse waves and the slower respiratory waves. The respiratory waves are caused

7
by blood volume changes in the venous bed. Respiration dependent intrathoracic
pressure changes produce variations in venous return to the right side of the heart
and thus in blood volume mainly in the venous bed, since the venous compliance is
10 times greater than the arterial [11]. These respiratory dependent volume changes
of the venous bed are detected by the amplitude of the plethysmographic respiratory
wave. The amplitude changes of the plethysmographic pulse wave are significantly
influenced by the distensibility of the arterial wall, which is controlled by the
autonomic nervous system [11]. The amplitude of the plethysmographic respiratory
wave seems to reflect variation in intrathoracic pressure more reliably [8]. In non-
intubated children with or without respiratory disorders, it has been shown, that the
photoplethysmographic fluctuations of the upper peak (mm) correlated with invasively
measured pulsus paradoxus (mmHg) (r=0.85) [8]. The degree of pulsus paradoxus
reflects the severity of the underlying disorder. In patients receiving mechanical
ventilation, reversed pulsus paradoxus can be monitored (inspiratory increase in
systolic blood pressure) [12].
Monitoring sudden changes in heart beat volume, which are unrelated to
respiration
Case 3. A nine-year-old boy with arrhythmias related to long QT-syndrome was
monitored in the ICU. The recording on figure 3 shows an episode of ventricular
tachycardia (torsades de pointe), induced by an electrical impulse on the T wave via
a newly implanted cardioverter/defibrillator (ICD) to test the device. During the

8
ventricular tachycardia arterial pressure and plethysmographic waves are flat. CVP is
increased.
Case 4. This is the same patient as case 1, before Berlin Heart implantation. He was
spontaneously breathing and treated with dobutamine, captopril and diuretics.
(ejection fraction 30%, central venous oxygen saturation 54%). The
photoplethysmographic wave shows diminutions of the amplitude on alternate beats
(Fig. 4).
In case 3, photoplethysmographic waveform duplicates arterial pressure waveform
morphological abnormalities. Activation of the „plethysmograph non-pulsatile“ alarm
may be the first alert to the occurrence of pulseless electrical activity in a non-
invasively monitored patient [2]. Pulsus alternans (case 4) is due to an alternating
strength of contraction from one beat to the next (not attributable to bigeminal
rhythms) seen in more severe forms of cardiac failure (e.g. cardiomyopathies, aortic
stenosis). Plethysmography clearly demonstrates this phenomenon (case 4) [13].
Early detection of this abnormality may be useful in guiding diagnosis and treatment.
The patient with cardiomyopathy and subsequent Berlin Heart support (case 1 and 4)
clearly shows the benefits of photoplethysmography. First, when the patient had not
yet an arterial line, the pulse oximeter tracing pointed to the severity of the
myocardial dysfunction and more invasive monitoring was started. Subsequently,
after the mechanical support had been implanted, invasive arterial monitoring has
been stopped and non-invasive monitoring by plethysmography has been continued.

9
Limitations
Although we previously showed, that photoplethysmography can be used
quantitatively for estimation of the degree of pulsus paradoxus [8], the cases
presented here clearly show qualitative applications of photoplethysmography. There
are numerous manufacturers for pulse oximeters and photoplethysmographic probes.
Thus, the photoplethysmographic characteristics from each model and/or different
manufacturers may differ. This applies to movement artefacts, ambient lighting,
individual tissue characteristics and auto-gain features. Pulse oximeters with auto-
gain features are less useful in depicting a persisting reduction in perfusion, but they
remain valid in representing short cyclic variations in pulse volume, such as in pulsus
paradoxus [8, 13]. Furthermore, in situations of peripheral vascular constriction (low
cardiac output, catecholamine therapy and hypothermia) the probe (especially if in
perfusion mode) may not work appropriately [1]. However, the qualitative features
shown in this study may be present even in these circumstances. In fact, some of the
presented patients were in low cardiac output and/or had catecholamine therapy. In
the present case series, repeatability has not been tested. However repeatability has
been shown at least for airway obstruction [9], pericardial effusion [10] and pulsus
paradoxus in spontaneously breathing [8] and ventilated patients [5]. Most
importantly, this electronic device should not replace careful clinical monitoring, such
as capillary refill, skin temperature and ECHO and it may only be used as an adjunct
to complete the clinical picture. Finally, this technique is another, but electronic form
of „feeling the pulse“. So far, this tool is without proven significance with regard to
monitoring adverse events. Prospective investigations should be performed,

10
identifying how many of all patients can be monitored, how many artefacts do occur
and whether therapy changes according to the readings.
Conclusion
The photoplethysmographic wave which is displayed by most pulse oximeters may
be used for additional haemodynamic information in some selected situations when
an arterial blood pressure monitoring is not available. The advantages of this method
are its widespread use, non-invasiveness and continuity. Haemodynamic
deterioration, suddenly occurring or slowly evolving over time, may be detected by
this method. A problem with using photoplethysmography is movement artefact.
There is only minimal reference to photoplethysmography monitoring, except for case
series for assessment of pulsus paradoxus in obstructive airway disease [8, 9].
References
1. Jubran A (2004) Pulse oximetry. Intensive Care Med 30:2017-2020
2. Brownlee JR, Serwer GA, Dick M, Bauld T, Rosenthal A (1989) Failure of
electrocardiographic monitoring to detect cardiac arrest in patients with
pacemakers. AJDC 143:105-107

11
3. Pizov R, Ya’ari Y, Perel A (1989) The arterial pressure waveform during acute
ventricular failure and synchronized external chest compression. Anesth Analg
68:150-156
4. Michard F, Teboul JL (2000) Using heart-lung interactions to assess fluid
responsiveness during mechanical ventilation. Crit Care 4:282-289
5. Cannesson M, Besnard C, Durand PG, Bohé J, Jacques D (2005) Relation
between respiratory variations in pulse oximetry plethysmographic waveform
amplitude and arterial pulse pressure in ventilated patients. Critical Care 9:R562-
R568
6. Feissel M, Teboul JL, Merlani P, Badie J, Faller JP, Bendjelid K (2007)
Plethysmographic dynamic indices predict fluid responsiveness in septic
ventilated patients. Intensive Care Med DOI 10.1007/s00134-007-0602-6
7. Frey B (1999) Pulsus paradoxus indicating heart failure in paroxysmal
supraventricular tachycardia: easy detection by pulse oximetry. Intensive Care
Med 25:333-334
8. Frey B, Butt W (1998) Pulse oximetry for assessment of pulsus paradoxus: a
clinical study in children. Intensive Care Med 24:242-246
9. Arnold DH, Spiro DM, Desmond RA, Hagood JS (2005) Estimation of airway
obstruction using oximeter plethysmograph waveform data. Respiratory Research
6:65
10. Tamburro RF, Ring JC, Womback K (2002) Detection of pulsus paradoxus
associated with large pericardial effusions in pediatric patients by analysis of
pulse-oximetry waveform. Pediatrics 109:673-677
11. Dorlas JC, Nijboer JA (1985) Photoelectric plethysmography as a monitoring
device in anaesthesia. Br J Anaesth 57:524-530

12
12. Jardin F, Farcot JC, Gueret P, Prost JF, Ozier Y, Bourdarias JP (1983) Cyclic
changes in arterial pulse during respiratory support. Circulation 68:266-274
13. Dennis MJ (2000) Plethysmography: the new wave in haemodynamic monitoring
– a review of clinical applications. Aust Crit Care 13:14-20
Figure 1. ECG and plethysmographic wave (Pleth) of case 1. The patient’s heart rate
is 129/min on the ECG tracing (atrio-ventricular pacing), while the completely
dissociated pulse generated by the mechanical assist device is seen at 60/min.
13
Figure 2. ECG, invasive arterial pressure and plethysmographic wave (Pleth) of case
2. This is a patient with post-operative junctional ectopic tachycardia who has
variable AV association (without and with pacing) resulting in pronounced and less
pronounced plethysmographic and arterial pressure fluctuations. a Pronounced
plethysmographic fluctuations with junctional rhythm (systolic arterial pressure
fluctuations 10 mmHg; due to the large scale not obvious). b Less plethysmographic
fluctuations on atrio-ventricular sequential pacing (arterial pressure fluctuations 3
mmHg).
Fig. 2a

14
Fig. 2b

15
Figure 3. ECG, plethysmographic wave (Pleth), invasive arterial pressure and central
venous pressure (CVP) of case 3. During ventricular tachycardia, the blood pressure
and pleth tracings are flat. This example shows an invasively monitored patient with a
disorder that typically is seen in patients without invasive monitoring.

16
Figure 4. ECG and plethysmographic wave (Pleth) of case 4: a spontaneously
breathing patient with severe dilated cardiomyopathy. The pleth wave shows
diminutions of the amplitude on alternate beats (pulsus alternans).

17