
University of Toronto Department of Computer Science...
10
1 University of Toronto Department of Computer Science © 2008 Steve Easterbrook. This presentation is available free for non-commercial use with attribution under a creative commons license. 1 Lecture 22: Software Quality Understanding Quality Importance of Process Quality tools for improving process quality Software Quality Attributes University of Toronto Department of Computer Science © 2008 Steve Easterbrook. This presentation is available free for non-commercial use with attribution under a creative commons license. 2 Challenge Problem Context You built some software You tested it You shipped it But: Is it any good? How would you know? Can you do a better job next time?
Transcript of University of Toronto Department of Computer Science...

1
University of Toronto Department of Computer Science
© 2008 Steve Easterbrook. This presentation is available free for non-commercial use with attribution under a creative commons license. 1
Lecture 22:Software Quality
Understanding QualityImportance of Process Quality
tools for improving process quality
Software Quality Attributes
University of Toronto Department of Computer Science
© 2008 Steve Easterbrook. This presentation is available free for non-commercial use with attribution under a creative commons license. 2
Challenge ProblemContext
You built some softwareYou tested itYou shipped it
But:Is it any good?How would you know?Can you do a better job next time?

2
3
University of Toronto Department of Computer Science
© 2008 Steve Easterbrook. This presentation is available free for non-commercial use with attribution under a creative commons license.
“Quality is value to some person”
“Quality is fitness to purpose”
“Quality is exceeding the customer’sexpectations”
University of Toronto Department of Computer Science
© 2008 Steve Easterbrook. This presentation is available free for non-commercial use with attribution under a creative commons license. 4
4 Views of Quality
Quality in Use(What’s the end-user’s experience?)
External Quality Attributes(Does it pass all the tests?)
Internal Quality Attributes(Is it well-designed?)
Process Quality(Is it assembled correctly?)

3
University of Toronto Department of Computer Science
© 2008 Steve Easterbrook. This presentation is available free for non-commercial use with attribution under a creative commons license. 5
Importance of Process QualityCannot test-in software quality
testing or inspection cannot improve the quality of a software product(by that stage it is too late)
Defect removalTwo ways to remove defects:
fix the defects in each product (i.e patch the product)fix the process that leads to defects (i.e. prevent them occurring)
The latter is cost effective as it affects all subsequent projects
Defect prevention (from Humphrey)Programmers must evaluate their own errorsfeedback is essential for defect preventionthere is no single cure-all for defects (must eliminate causes one by one)process improvement must be an integral part of the processprocess improvement takes time to learn
University of Toronto Department of Computer Science
© 2008 Steve Easterbrook. This presentation is available free for non-commercial use with attribution under a creative commons license. 6
Managing Quality (Background)Industrial Engineering
Product Inspection (1920s)examine intermediate and final products to detect defects
Process Control (1960s)monitor defect rates to identify defective process elements & control the process
Design Improvement (1980s)engineering the process and the product to minimize the potential for defects
Deming and TQMUse statistical methods to analyze industrial production processesIdentify causes of defects and eliminate themBasic principles are counter-intuitive:
in the event of a defect (sample product out of bounds)……don’t adjust the controller or you’ll make things worse.Instead, analyze the process and improve it
Adapted to SoftwareNo variability among individual product instancesAll defects are design errors (no manufacturing errors)Process improvement principles still apply (to the design process!)
Source: Adapted from Blum, 1992, p473-479. See also van Vliet, 1999, sections 6.3 and 6.6
4
University of Toronto Department of Computer Science
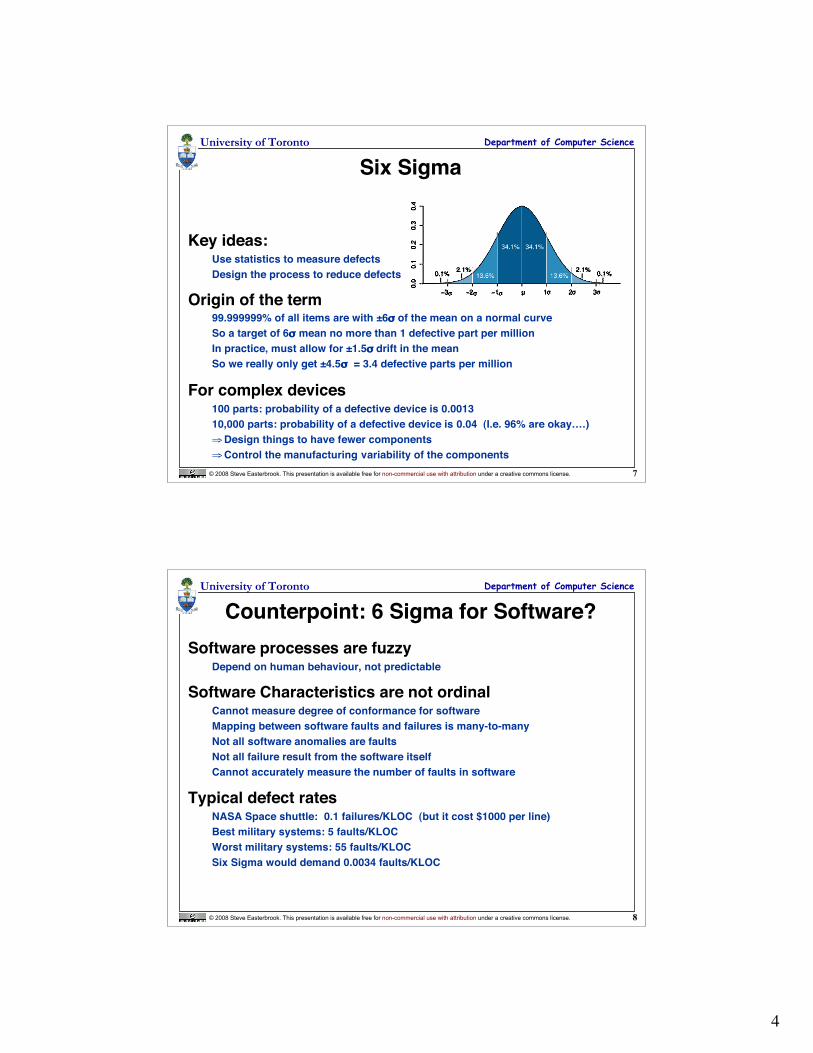
© 2008 Steve Easterbrook. This presentation is available free for non-commercial use with attribution under a creative commons license. 7
Six Sigma
Key ideas:Use statistics to measure defectsDesign the process to reduce defects
Origin of the term99.999999% of all items are with ±6σ of the mean on a normal curveSo a target of 6σ mean no more than 1 defective part per millionIn practice, must allow for ±1.5σ drift in the meanSo we really only get ±4.5σ = 3.4 defective parts per million
For complex devices100 parts: probability of a defective device is 0.001310,000 parts: probability of a defective device is 0.04 (I.e. 96% are okay….)⇒Design things to have fewer components⇒Control the manufacturing variability of the components
University of Toronto Department of Computer Science
© 2008 Steve Easterbrook. This presentation is available free for non-commercial use with attribution under a creative commons license. 8
Counterpoint: 6 Sigma for Software?Software processes are fuzzy
Depend on human behaviour, not predictable
Software Characteristics are not ordinalCannot measure degree of conformance for softwareMapping between software faults and failures is many-to-manyNot all software anomalies are faultsNot all failure result from the software itselfCannot accurately measure the number of faults in software
Typical defect ratesNASA Space shuttle: 0.1 failures/KLOC (but it cost $1000 per line)Best military systems: 5 faults/KLOCWorst military systems: 55 faults/KLOCSix Sigma would demand 0.0034 faults/KLOC

5
University of Toronto Department of Computer Science
© 2008 Steve Easterbrook. This presentation is available free for non-commercial use with attribution under a creative commons license. 9
Ishikawa (Fishbone) Diagram
University of Toronto Department of Computer Science
© 2008 Steve Easterbrook. This presentation is available free for non-commercial use with attribution under a creative commons license. 10
Pareto Chart
Root Causes
Measure frequency of each cause
“20% of the problem cause 80% of the defects”
Plot causes in order of frequency
Plot percentage contributions
Identify the top causes

6
University of Toronto Department of Computer Science
© 2008 Steve Easterbrook. This presentation is available free for non-commercial use with attribution under a creative commons license. 11
Refresher: Capability Maturity Model
Level Characteristic Key Challenges
5. OptimizingImprovement fed back
into process
Identify process indicators
“Empower” individuals
4. Managed(Quantitative)
measured process
Automatic collection of process data
Use process data to analyze and
modify the process
3. Defined(Qualitative)
process defined and
institutionalized
Process measurement
Process analysis
Quantitative Quality Plans
2. Repeatable(Intuitive)
process dependent on
individuals
Establish a process group
Identify a process architecture
Introduce SE methods and tools
1. InitialAd hoc / Chaotic
No cost estimation,
planning, management.
Project Management
Project Planning
Configuration Mgmnt, Change Control
Software Quality Assurance
Source: Adapted from Humphrey, 1989, chapter 1. See also van Vliet, 1999, section 6.6.
University of Toronto Department of Computer Science
© 2008 Steve Easterbrook. This presentation is available free for non-commercial use with attribution under a creative commons license. 12
Four Key Quality ConceptsReliability
designer must be able to predict how the system will behave:completeness - does it do everything it is supposed to do? (e.g. handle all possible
inputs)consistency - does it always behave as expected? (e.g. repeatability)robustness - does it behave well under abnormal conditions? (e.g. resource failure)
EfficiencyUse of resources such as processor time, memory, network bandwidth
This is less important than reliability in most cases
MaintainabilityHow easy will it be to modify in the future?
perfective, adaptive, corrective
UsabilityHow easy is it to use?
Source: Budgen, 1994, pp65-7

7
University of Toronto Department of Computer Science
© 2008 Steve Easterbrook. This presentation is available free for non-commercial use with attribution under a creative commons license. 13
Measuring QualityWe have to turn our vague ideas about quality into
measurables
The Quality Concepts(abstract notions ofquality properties)
Measurable Quantities(define some metrics)
Counts taken fromDesign Representations
(realization of the metrics)
usability
minutestaken forsome usertask???
time takento learn
how to use?
maintainability
countprocedurecalls???
informationflow between
modules?
reliability
run it andcount crashesper hour???
mean timeto failure?
examples...
Source: Budgen, 1994, pp60-1
University of Toronto Department of Computer Science
© 2008 Steve Easterbrook. This presentation is available free for non-commercial use with attribution under a creative commons license. 14
Boehm’s NFR list
General utility
portability
As-is utility
Maintainability
reliability
efficiency
usability
testability
understandability
modifiability
device-independence
self-containedness
accuracy
completeness
robustness/integrity
consistency
accountability
device efficiency
accessibility
communicativeness
self-descriptiveness
structuredness
conciseness
legibility
augmentability
Source: See Blum, 1992, p176

8
University of Toronto Department of Computer Science
© 2008 Steve Easterbrook. This presentation is available free for non-commercial use with attribution under a creative commons license. 15
McCall’s NFR list
Product operation
usability
Product revision
Product transition
integrity
maintainability
testability
reusability
portability
interoperability
operabilitytraining
I/O volume
Access controlAccess auditStorage efficiency
consistency
instrumentationexpandabilitygeneralitySelf-descriptivenessmodularitymachine independences/w system independencecomms. commonality
efficiency
correctness
reliability
flexibility
communicatativeness
I/O rate
execution efficiency
Source: See van Vliet 2000, pp111-3
traceabilitycompletenessaccuracyerror tolerance
simplicityconciseness
data commonality
University of Toronto Department of Computer Science
© 2008 Steve Easterbrook. This presentation is available free for non-commercial use with attribution under a creative commons license. 16
ISO/IEC 9126
FunctionalitySuitability
Reliability
Usability
Accuracy
Fault Tolerance
Recoverability
Learnability
Operability
Attractiveness
Interoperability
Security
Maturity
Understandability
Source: See Spinellis 2006, pp5-6
Efficiency
Maintainability
Portability
Time behaviour
Resource Utilization
Analyzability
Changeability
Stability
Testability
Adaptability
Installability
Co-existance
Replaceability

9
University of Toronto Department of Computer Science
© 2008 Steve Easterbrook. This presentation is available free for non-commercial use with attribution under a creative commons license. 17
Conflicts between Quality factors
Maturity
Testability
Fault Tolerance
Accuracy
Efficiency
Maintainability Functionality
Portability
Reliability Usability
Security
Stability
University of Toronto Department of Computer Science
© 2008 Steve Easterbrook. This presentation is available free for non-commercial use with attribution under a creative commons license. 18
More abstractly…
Resource Utilization(“Space”)
Quality
Cost Schedule
Time behaviour(“Time”)
“Better, Faster, Cheaper - pick any two”

10
University of Toronto Department of Computer Science
© 2008 Steve Easterbrook. This presentation is available free for non-commercial use with attribution under a creative commons license. 19
Measurable Predictors of QualitySimplicity
the design meets its objectives and has no extra embellishmentscan be measured by looking for its converse, complexity:
control flow complexity (number of paths through the program)information flow complexity (number of data items shared)name space complexity (number of different identifiers and operators)
Modularitydifferent concerns within the design have been separatedcan be measured by looking at:
cohesion (how well components of a module go together)coupling (how much different modules have to communicate)
Source: Budgen, 1994, pp68-74
University of Toronto Department of Computer Science
© 2008 Steve Easterbrook. This presentation is available free for non-commercial use with attribution under a creative commons license. 20
Wasserman’s Steps to MaturityAbstraction
Allows you to focus on the essence of aproblem
Analysis and Design methodsand notations
A shared language for expressing ideasabout software
User Interface PrototypingUnderstand the user and evaluate theuser’s experience
Software ArchitectureIdentify architectural styles and patterns
Software ProcessIdentify appropriate processes andassess their effectiveness
ReuseSystematic ways to reuse pastexperience and products
MeasurementBetter metrics to understand and managesoftware development
Tools and IntegratedEnvironments
Automate mundane tasks, keep track ofwhat we have done


