University of Szeged Faculty of Pharmacy Department of...
83
University of Szeged Faculty of Pharmacy Department of Pharmaceutical Technology Head: Prof. Dr. Habil. Piroska Szabó-Révész DSc PhD Thesis Amorphization of a crystalline active agent with the aim of pharmaceutical technological formulation By Orsolya Jójárt-Laczkovich Pharmacist Supervisor: Prof. Dr. Habil. Piroska Szabó-Révész DSc Szeged 2012
-
Upload
phungduong -
Category
Documents
-
view
219 -
download
2
Transcript of University of Szeged Faculty of Pharmacy Department of...
University of Szeged
Faculty of Pharmacy
Department of Pharmaceutical Technology
Head: Prof. Dr. Habil. Piroska Szabó-Révész DSc
PhD Thesis
Amorphization of a crystalline active agent with the aim of
pharmaceutical technological formulation
By
Orsolya Jójárt-Laczkovich Pharmacist
Supervisor:
Prof. Dr. Habil. Piroska Szabó-Révész DSc
Szeged 2012
2
LIST OF PUBLICATIONS
1. Révész P., Laczkovich O., Erős I.: Amorfizálás a gyógyszertechnológiában, Acta
Pharm. Hung. (2004), 74, 39-44.
IF:-, Citations:-
2. P. Szabó-Révész, O. Laczkovich, R. Ambrus, A. Szűts, Z. Aigner: Protocols for
amorphization of crystalline solids through the application of pharmaceutical
technological processes, Eur. J. Pharm. Sci. (2007), 32, Suppl. S18.
IF: 3.127, Citations: -
3. O. Jójárt-Laczkovich, P. Szabó-Révész: Amorphization of a crystalline active
pharmaceutical ingredient and thermoanalytical measurements on this glassy form, J.
Therm. Anal. Cal. (2010), 102, 243-247.
IF(2009): 1.752, Citations: 5
4. Jójártné Laczkovich O. és Szabóné Révész P.: Kristályos vagy amorf forma?
Magyar Kémiai Folyóirat (2010), 116, 101-104.
IF:-, Citations:-
5. O. Jójárt-Laczkovich, P. Szabó-Révész: Formulation of tablets containing an 'in-
process' amorphized active pharmaceutical ingredient, Drug Dev. Ind. Pharm. (2011),
37, 1272-1281.
IF: 1.396, Citations: 1
3
LIST OF OTHER PUBLICATIONS
1. Laczkovich O., Révész P., Pallagi E., Erős I.: Vas(II)-szulfát hőstabilitásának
vizsgálata gyógyszerformulálási céllal, Acta Pharm. Hung. (2003), 73, 243-248.
IF: -, Citations: -
2. Pallagi, E., P. Szabó-Révész, T. Haasner, M. Pásztor-Turák, O. Laczkovich, J. Ulrich,
I. Erős: Entwicklung von Eisen(II)-Sulfat enthaltenden Einbettungspartikeln, Pharm.
Ind. (2004), 66, 112-117.
IF: 0.349, Citations: -
3. Szűts A., Laczkovich O., Nassab N. R., Aigner Z., Szabóné Révész P.: Cukorészterek
alkalmazhatósága az olvadéktechnológiában, Acta Pharm. Hung. (2007), 77, 97-102.
IF: -, Citations: -
4
ABSTRACTS
1. Laczkovich O., Szabóné Révész P.: Kristályos anyagok amorfizálása
gyógyszerformulálási céllal: Műszaki Kémiai Napok, Veszprém, β00γ. április 8-10.
(oral presentation)
2. Laczkovich O., Szabóné Révész P., Erős I.: Hatóanyagok amorf formájának
gyógyszer-technológiai előállítási lehetőségei: Congressus Pharmaceuticus
Hungaricus XII, Budapest, β00γ. május 8-10. (poster presentation)
3. O. Laczkovich, P. Szabó-Révész, M. Hasznos-Nezdei, I. Erős: Amorphization of
crystalline substances with the aim of pharmaceutical technological formulation:
International Meeting on Pharmaceutics, Biopharmaceutics and Pharmaceutical
Technology 2004, Nürnberg, Germany, 15-18 March 2004 (poster presentation)
4. P. Szabó-Révész, O. Laczkovich, R. Ambrus, A. Szűts, Z. Aigner: Protocols for
amorphization of crystalline solids through the application of pharmaceutical
technological processes: 2nd BBBB Conference on Pharmaceutical Sciences, Tallin-
Tartu, Estonia, 13-15 September 2007 (oral presentation)
5. Jójártné Laczkovich O., Szabóné Révész P.: Kristályos hatóanyag amorfizálása és az
amorf forma termoananlitikai vizsgálata: A Magyar Kémikusok Egyesülete
Termoanalitikai szakcsoport és a Magyar Tudományos Akadémia Termoanalitikai
Munkabizottság közös szervezésében megrendezett ülése, Budapest, β009. április β0.
(oral presentation)
6. Jójártné Laczkovich O., Szabóné Révész P.: Kristályos hatóanyag amorfizálása és az
amorf forma vizsgálata: Műszaki Kémiai Napok, Veszprém, β009. április β1-23. (oral
presentation)
7. Mártha Cs., Jójártné Laczkovich O., Ambrus R., Szabóné Révész P.: Hatóanyagok
amorfizálhatóságának vizsgálata: Congressus Pharmaceuticus Hungaricus XIV.,
Budapest, 2009. november 13-15. (poster presentation)
5
8. Jójártné Laczkovich O., Mártha Cs., Szabóné Révész P.: Kristályos vagy amorf? Az
amorfizálhatóság vizsgálata.: XVI. Országos Gyógyszertechnológiai Konferencia és
VIII. Gyógyszer az Ezredfordulón Konferencia, Siófok, β010. október 20-22. (oral
presentation)
9. Cs. Mártha, O. Jójárt-Laczkovich, P. Szabó-Révész: Amorphous form in
pharmaceutical technological research: Pharmaceutical Sciences for the Future of
Medicines and Young Scientists Meeting, Prague, Czech Republic, 13-17 June 2011
(poster presentation)
10. Cs. Mártha, O. Jójárt-Laczkovich, P. Szabó-Révész: Amorphization of co-ground
clopidogrel hydrogensulphate: 8th World Meeting on Pharmaceutics,
Biopharmaceutics and Pharmaceutical Technology, Istambul, Turkey, 19-22 March
2012 (poster presentation)

6
CONTENTS
LIST OF PUBLICATIONS __________________________________________________ 2
LIST OF OTHER PUBLICATIONS __________________________________________ 3
ABSTRACTS _____________________________________________________________ 4
CONTENTS ______________________________________________________________ 6
1 INTRODUCTION _______________________________________________________ 8
2 AIMS _________________________________________________________________ 10
3 LITERATURE BACKGROUND ___________________________________________ 11
3.1 Amorphization in pharmaceutical technology __________________________________ 11 3.1.1 Increase of dissolution rate and solubility _____________________________________________11 3.1.2 Protection from polymorphic transformation ___________________________________________12 3.1.3 Improvement of processibility ______________________________________________________12 3.1.4 Taking out a new patent ___________________________________________________________13
3.2 Amorphization processes in pharmaceutical technology __________________________ 13 3.2.1 Solvent method __________________________________________________________________14 3.2.2 Hot-melt technology ______________________________________________________________15 3.2.3 Milling technology _______________________________________________________________17
3.3 Classification of materials from the aspect of amorphization ______________________ 18
3.4 Investigations of amorphous materials ________________________________________ 19
4 MATERIALS AND METHODS ___________________________________________ 21
4.1 Materials _______________________________________________________________ 21 4.1.1 Clopidogrel hydrogensulfate (CLP) __________________________________________________21 4.1.2 Solvents and additives ____________________________________________________________22
4.2 Methods of preparation ____________________________________________________ 23 4.2.1 Preparation of pure amorphous CLP _________________________________________________23 4.2.2 Selection of a crystallization inhibitor ________________________________________________23 4.2.3 Amorphization in scaling-up processes _______________________________________________23 4.2.4 Tablet-making___________________________________________________________________24
4.3 Methods of investigations___________________________________________________ 24 4.3.1 Differential scanning calorimetry (DSC) ______________________________________________24 4.3.2 X-ray powder diffraction (XRPD) ___________________________________________________25 4.3.3 FT-IR analysis __________________________________________________________________25 4.3.4 Investigation of tablet parameters ____________________________________________________25 4.3.5 Investigation of stability of products _________________________________________________25
5 RESULTS _____________________________________________________________ 26
5.1 Confirmation of amorphous form ____________________________________________ 26
5.2 Measurement of Tg ________________________________________________________ 29
5.3 Preliminary stability testing ________________________________________________ 30
5.4 Selection of a crystallization inhibitor _________________________________________ 31
5.5 Amorphization in scaling-up processes ________________________________________ 34
5.6 Preparation and investigation of tablets _______________________________________ 37
6 PRACTICAL ASPECTS __________________________________________________ 40

7
7 SUMMARY ____________________________________________________________ 42
8 REFERENCES_________________________________________________________ 44
8
1 INTRODUCTION
The two forms of solids are the crystalline form and the amorphous form (Cui, 2007).
Solid materials are usually processed in their crystalline form, but application of the
amorphous form is increasing. Glassy materials are used in many industrial fields glassy
materials are used such as the plastics industry, the textile industry, the food industry, and for
the production of semiconductors, ceramics and optical glasses, and naturally in the
pharmaceutical industry.
In pharmaceutical formulations, most drug materials are processed in their crystalline
form. This is a thermodynamically stable state that exhibits both short-range and long-range
order (Hancock & Zografi, 1997; Aaltonen et al., 2009). Unlike a crystalline solid, an
amorphous solid has no long-range order of molecular packing, so the molecules are
conformationally flexible (Yu, 2001). The application of an active pharmaceutical ingredient
(API) in amorphous form is increasingly common in the development of pharmaceutical solid
formulations, with all its risks and benefits (Craig et al., 1999; Pokharkar et al., 2006).
What are the most important advantages of the application of the amorphous drugs?
Amorphous forms of APIs have many useful properties. Among the most important ones are a
higher dissolution rate and a sometimes higher water solubility relative to that of the
crystalline form (Rodríguez-Spong et al.,2004; Zhang et al, 2004; Takeuchi et al., 2005;
Hancock & Parks, 2000) as there is no lattice energy, which is a thermodynamic barrier to
dissolution (Singhal & Curatolo, 2004).
It must be mentioned that there are disadvantages to the use of this form. Amorphous
solids generally have lower stability than the corresponding crystals because of the higher
energy level (Chadha et al., 2005, Craig et al., 1999, Pokharkar et al., 2006). Crystallization
inhibitors therefore have to be used in most cases in amorphous pharmaceutical technological
formulations. A wide range of auxiliary agents are available to stabilize this form and to
prepare a suitable glassy dosage form.
In this way, two possibilities to achieve an amorphous phase can be differentiated: the
first is when an amorphous material is prepared alone, as a pure glassy drug; and the second is
when auxiliary agents (crystallization inhibitors) are used to prepare the amorphous systems.
9
The latter preparation methods result in solid dispersions. From the aspect of stability, this
latter possibility is more appropriate and more applicable industrially.
The pharmaceutical industry is highly interested in amorphous formulations because
amorphization techniques are very innovative, thanks to the advances in the analytical
methods. The detection of amorphous forms is currently a widely investigated field of
pharmaceutical technology, as concern both deliberate amorphization and when an unwanted
glassy form appears spontaneously during formulation or storage.
In connection with the amorphous form in pharmaceutical technology, the most
important reviews have been written by in this scientific field. They are Craig, Hancock,
Zografi, Kerč, Srčič, Yu etc. Kerč and Srčič published the first results relating to the
amorphous form of APIs in 1995, in Thermochimia Acta. The first significant review article,
connected with amorphous materials in pharmaceutical technology (Yu, 2001), discussed
preparation methods, characterization techniques and possibilities for the stabilization of
glassy drugs. From a Hungarian aspect, our team first reported the advantages of
amorphization in 2003 and used different methods in the industrial research and development
work.

10
2 AIMS
The primary aim of this study was to establish the literature background of
pharmaceutical amorphization. We wanted to know what methods are available to produce
this special solid form, and how amorphous materials can be investigated and characterized
with different analytical techniques.
The secondary aim was to investigate clopidogrel hydrogensulfate (CLP) as model
drug from the aspect of pharmaceutical amorphization. The steps of this work were as
follows:
- Characterization of the glassy property of CLP: determination of the investigation
methods that can be used to classify CLP according to its glass formability (a poor
or a good glass-former).
- Choice of a preparation method which results in pure amorphous CLP without use
of an auxiliary agent.
- Investigation of the stability of pure amorphous CLP because of its tendency to
undergo recrystallization during storage.
- Identification of a suitable recrystallization inhibitor and determination of its
amount which can stabilize the amorphous form of CLP.
- Use of the amorphized product in a scaling-up process.
- Development of tablets as final dosage form that is appropriately stable as concern
the recrystallization of CLP.
- Devising a protocol of amorphization in general, as a practical consideration.
It should be mentioned that the experimental part of this thesis was carried out in
2002-2004. In that period, the pharmaceutical industry was greatly in the amorphization of
APIs. The amorphous form remains important nowadays but the approach has changed
appreciably. Deliberate amorphization is still of great interest industrially, but in the scientific
field, a new issue has arisen and has been subject to considerable development. This is when
an amorphous form arises spontaneously during the pharmaceutical formulation or during
storage. This can give rise to different properties which may cause problems in the processing
technology or in the application of drugs.
11
3 LITERATURE BACKGROUND
3.1 Amorphization in pharmaceutical technology
The amorphous or glassy form is one of the two solid subphases; the other is the
crystalline form (Cui, 2007). In pharmaceutical technology, this solid form is well known and
widely studied because of its advantageous properties (Forster et al., 2002; Franks, 2002). The
applications of amorphization can be divided into three groups:
- the amorphization of inorganic crystalline materials (Ziewiec et al., 2009);
- the amorphization of organic materials consisting of small molecules (most
APIs can be classified in this group) (Panchagnula & Bhardwaj, 2008); and
- the amorphization of large polymer molecules (Casas et al., 2009).
The present work is concerned with the second point, using a model API for amorphization.
Amorphization can be applied in pharmaceutical technology for four reasons:
- to increase the dissolution rate and solubility of a poorly water-soluble API
(Hancock & Parks, 1999; Leuner & Dressman, 2000; Forster et al., 2001;
Kinoshita et al., 2002),
- to protect active agents from a polymorphous transformation (Zhang et al., 2004),
- to revise the processibility of the corresponding crystalline drug (Bozic et al.,
2008), and
- to take out a new patent relating to the amorphous form of a given API (Lifshitz et
al., 2004).
3.1.1 Increase of dissolution rate and solubility
In practice, many APIs are applied that display poor solubility in water. New drug
materials are nowadays rarely classified into Biopharmaceutics Classification System groups
II and IV. Because of their poor solubility in water, these active agents do not have sufficient
bioavailability (Singhal & Curatolo, 2004).
This point is also important in the development of generic formulations. When an
original drug product contains a crystalline API, with a better dissolution profile than that of
the amorphous formulation, a new generic formulation method may be started.

12
It is a great problem that many API candidates exhibit poor solubility in water. In
preclinical studies, when a high concentration is needed in the serum, amorphization may
increase the solubility of an API.
There are examples, where the goal of amorphization was to achieve better solubility.
Indomethacin (Hédoux et al., 2009), piroxicam (Tantishaiyakul et al., 1999) and curcumin
(Paradkar et al., 2004) were amorphized with this aim. It should be mentioned that there is an
example of amorphization not increasing but decreasing the solubility of a drug material. This
API is rifampicin (Panchagnula & Bhardwaj, 2008).
3.1.2 Protection from polymorphic transformation
Numerous applied APIs have several polymorphic forms, with different physical
and/or physico-chemical properties. These forms can be interconverted during the formulation
process. In this way, the API can display changes in solubility, melting point, processibility
and (not least) physiological effects. Such a polymorphic conversion may be prevented
through amorphization (Singhal & Curatolo, 2004). For example, carbamazepine has different
polymorphic forms, with different dissolution properties. However, the amorphous form of
this API can also be prepared.
3.1.3 Improvement of processibility
Most of the work in this field deals with the polymorphic transformation of crystalline
drug substances, but several studies have paid attention to the mechanical properties of non-
crystalline APIs (Hancock et al., 2002). When the processing of crystalline drug substances
lead runs into difficulties, it is possible that the amorphous form can be treated easily. In
many cases, for example, the compressibility of the amorphous form is better than that of the
crystalline form (Trasi et al., 2011). In Trasi et al. investigated the dehydration of glucose,
during which the amorphous content of the glucose increased and hence the mechanical
properties (e.g. the compressibility) of glucose improved. Bozic et al. (2008) investigated a
macrolide antibiotic, which is a perfect example from the literature of how the compressibility
of a drug can be revised by amorphization. In their work, the capping problem during tablet
compression was reduced by amorphization.

13
3.1.4 Taking out a new patent
When the aim of amorphization is a new patent relating to the amorphous form,
economic aspects are also involved. Patents concerning amorphous formulations are taken out
with a wide range of aims. At the end of the 1990s and the beginning of the 2000s, years
numerous inventors dealt with the compressibility (Sherwood et al., 2003) and tabletability
(Chen & Chou, 1998) of amorphous APIs and at that time hot-melt technologies were very
innovative techniques (Ghebre-Sellassie et al., 2004). Later, special preparation methods for
came to the forefront of amorphous patents, e.g. amorphization with electrospininng
(Ignatious et al., 2006), the preparation of coated implantable medical devices by a solvent-
free method (Maryanoff et al., 2008) or the amorphization of pure API (esomeprazole)
(Reddy et al., 2009) and stabilization (Yu et al., 2008). Nowadays, glassy drugs often feature
in patents because of the better dissolution rate (Marom & Rubnov, 2012), or in patents
relating to crystalline formulations, to solve problems that arise during preparation methods.
3.2 Amorphization processes in pharmaceutical technology
In pharmaceutical formulations, it is necessary to differentiate two possibilities: when
an amorphous form of the API is produced alone, without the use of any auxiliary agents (Fix
& Steffens, 2004; Ambike et al., 2005), when a composition involves both the amorphized
API and an auxiliary material(s) as crystallization inhibitor(s). A product made in this way
can be a solid dispersion (Rupprecht & Kindl, 1974) or a solid solution or some other multiple
system (Bettinetti et al., 2006).
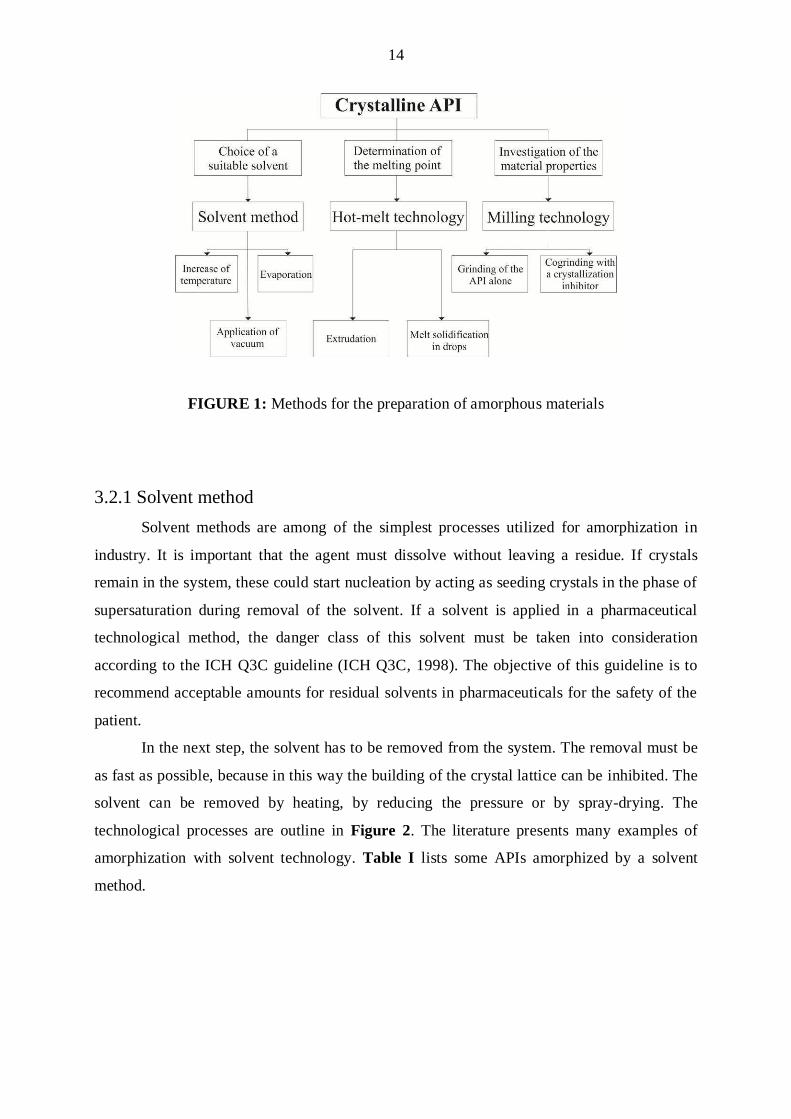
The technologies applied to make an amorphous form in pharmaceutical technology,
are a solvent method (Panchagnula & Bhardwaj, 2008), hot-melt technology (Kinoshita et al.,
2003) and milling processes (Delogu et al., 2004). Figure 1 summarizes the possibilities.
14
FIGURE 1: Methods for the preparation of amorphous materials
3.2.1 Solvent method
Solvent methods are among of the simplest processes utilized for amorphization in
industry. It is important that the agent must dissolve without leaving a residue. If crystals
remain in the system, these could start nucleation by acting as seeding crystals in the phase of
supersaturation during removal of the solvent. If a solvent is applied in a pharmaceutical
technological method, the danger class of this solvent must be taken into consideration
according to the ICH Q3C guideline (ICH Q3C, 1998). The objective of this guideline is to
recommend acceptable amounts for residual solvents in pharmaceuticals for the safety of the
patient.
In the next step, the solvent has to be removed from the system. The removal must be
as fast as possible, because in this way the building of the crystal lattice can be inhibited. The
solvent can be removed by heating, by reducing the pressure or by spray-drying. The
technological processes are outline in Figure 2. The literature presents many examples of
amorphization with solvent technology. Table I lists some APIs amorphized by a solvent
method.

15
FIGURE 2: Methods of solvent technology
Table I: Amorphization of APIs with solvent technology
Amorphized API Applied technology Applied additive(s)
Literature reference
Atrovastatin Spray-drying SAS process
- Kim et al. , 2008
Carbamazepine Solvent evaporation PVP Sethia & Squillante, 2004
Fenofibrate Spray-drying Lactose and SLS Vogt et al., 2008
Indomethacin Spray-drying Nonporous or porous silica
Takeuchi et al., 2005
Ketoprofen Solvent evaporation under reduced pressure at 40 °C
PVP Martino et al., 2004
Loperamide Spray-drying PVP Weuts et al., 2004
Paracetamol SAS process - Rossmann et al., 2012
Piroxicam RESS Benzoic acid Vemavarapu et al., 2009
Piroxicam Solvent removal by reduced pressure at 40 °C
PVP Tantishaiyakul et al., 1999
Tacrolimus Solvent evaporation PEG 6000 or PVP or HPMC
Yamashita et al., 2003
Tolbutamide Spray-drying nonporous or porous silica
Takeuchi et al., 2004
PVP: poly(vinyl pyrrolidone), RESS: rapid expansion of supercritical solution, SAS: supercritical antisolvent,
PEG: poly(ethylene glycol), HPMC: hydroxypropylmethylcellulose, SLS: sodium laurylsulfate
3.2.2 Hot-melt technology
Hot-melt technologies are currently popular in the pharmaceutical industry because
these methods are free from solvents. This is also important environmentally and additionally
residual solvent will not be present in the product. For the applicability of this route, first of
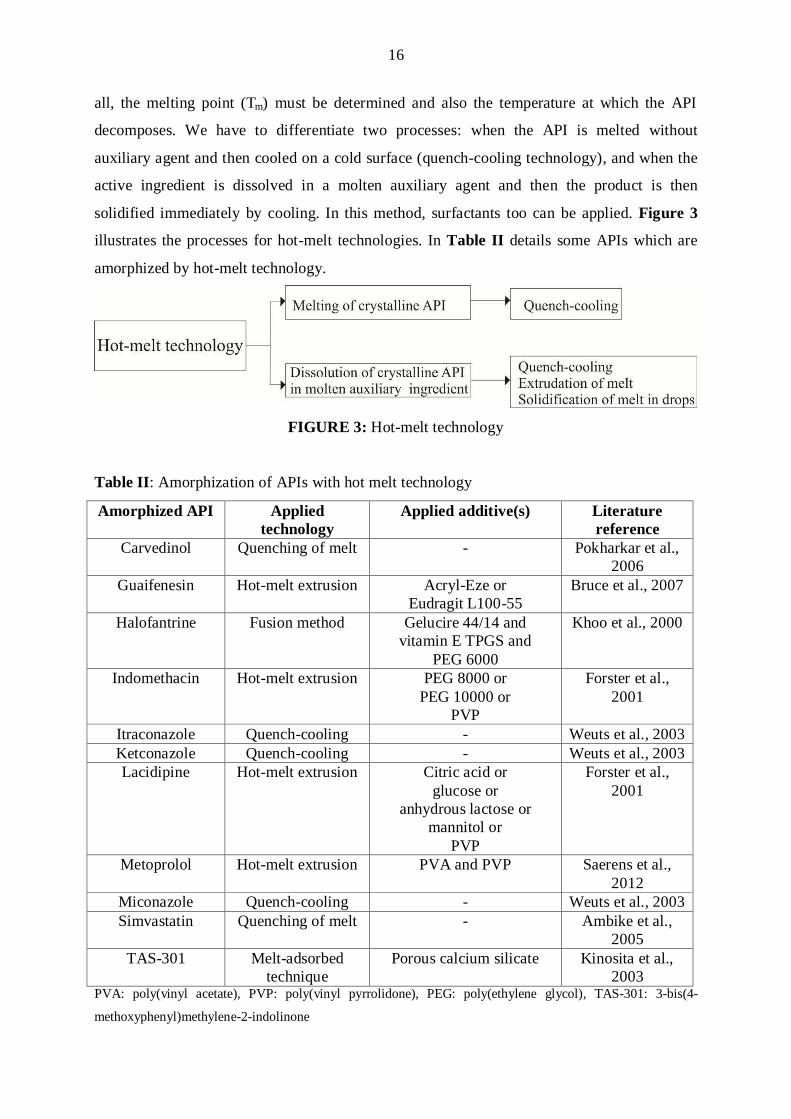
16
all, the melting point (Tm) must be determined and also the temperature at which the API
decomposes. We have to differentiate two processes: when the API is melted without
auxiliary agent and then cooled on a cold surface (quench-cooling technology), and when the
active ingredient is dissolved in a molten auxiliary agent and then the product is then
solidified immediately by cooling. In this method, surfactants too can be applied. Figure 3
illustrates the processes for hot-melt technologies. In Table II details some APIs which are
amorphized by hot-melt technology.
FIGURE 3: Hot-melt technology
Table II: Amorphization of APIs with hot melt technology
Amorphized API Applied technology
Applied additive(s) Literature reference
Carvedinol Quenching of melt -
Pokharkar et al., 2006
Guaifenesin Hot-melt extrusion Acryl-Eze or Eudragit L100-55
Bruce et al., 2007
Halofantrine Fusion method Gelucire 44/14 and vitamin E TPGS and
PEG 6000
Khoo et al., 2000
Indomethacin Hot-melt extrusion PEG 8000 or PEG 10000 or
PVP
Forster et al., 2001
Itraconazole Quench-cooling - Weuts et al., 2003 Ketconazole Quench-cooling - Weuts et al., 2003 Lacidipine Hot-melt extrusion Citric acid or
glucose or anhydrous lactose or
mannitol or PVP
Forster et al., 2001
Metoprolol Hot-melt extrusion PVA and PVP Saerens et al., 2012
Miconazole Quench-cooling - Weuts et al., 2003 Simvastatin Quenching of melt - Ambike et al.,
2005 TAS-301 Melt-adsorbed
technique Porous calcium silicate Kinosita et al.,
2003 PVA: poly(vinyl acetate), PVP: poly(vinyl pyrrolidone), PEG: poly(ethylene glycol), TAS-301: 3-bis(4-
methoxyphenyl)methylene-2-indolinone
17
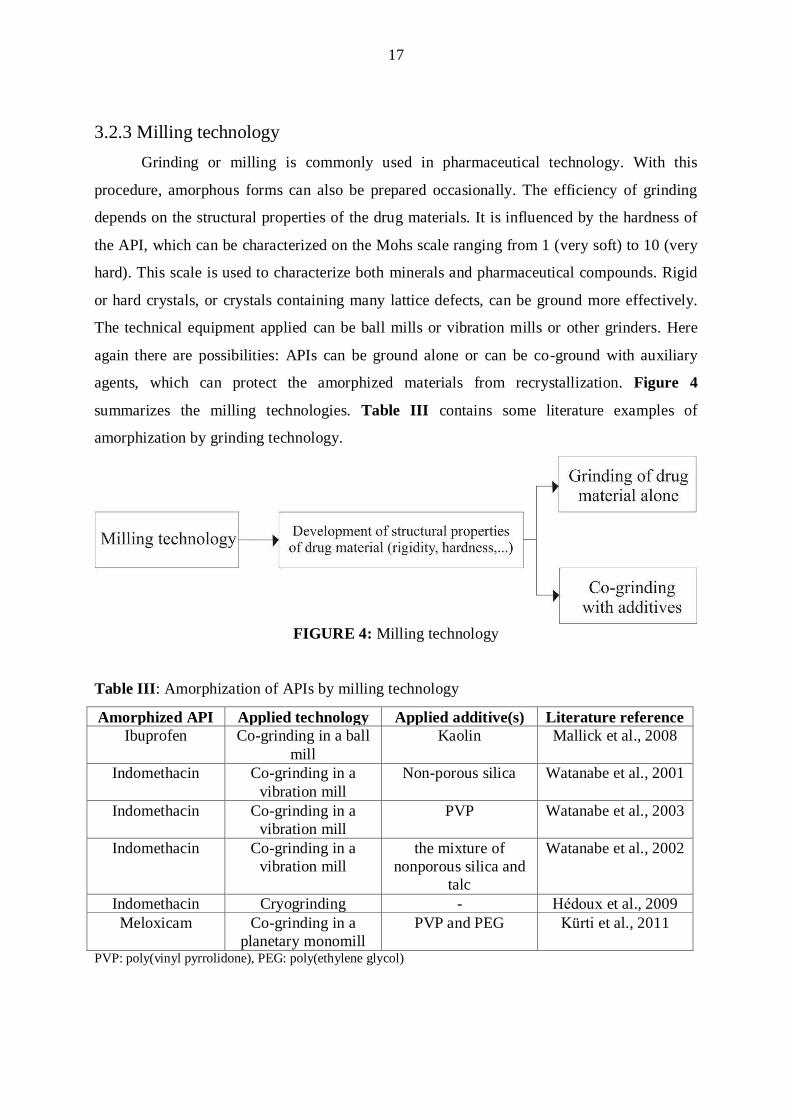
3.2.3 Milling technology
Grinding or milling is commonly used in pharmaceutical technology. With this
procedure, amorphous forms can also be prepared occasionally. The efficiency of grinding
depends on the structural properties of the drug materials. It is influenced by the hardness of
the API, which can be characterized on the Mohs scale ranging from 1 (very soft) to 10 (very
hard). This scale is used to characterize both minerals and pharmaceutical compounds. Rigid
or hard crystals, or crystals containing many lattice defects, can be ground more effectively.
The technical equipment applied can be ball mills or vibration mills or other grinders. Here
again there are possibilities: APIs can be ground alone or can be co-ground with auxiliary
agents, which can protect the amorphized materials from recrystallization. Figure 4
summarizes the milling technologies. Table III contains some literature examples of
amorphization by grinding technology.
FIGURE 4: Milling technology
Table III: Amorphization of APIs by milling technology
Amorphized API Applied technology Applied additive(s) Literature reference Ibuprofen Co-grinding in a ball
mill Kaolin Mallick et al., 2008
Indomethacin Co-grinding in a vibration mill
Non-porous silica Watanabe et al., 2001
Indomethacin Co-grinding in a vibration mill
PVP Watanabe et al., 2003
Indomethacin Co-grinding in a vibration mill
the mixture of nonporous silica and
talc
Watanabe et al., 2002
Indomethacin Cryogrinding - Hédoux et al., 2009 Meloxicam Co-grinding in a
planetary monomill PVP and PEG Kürti et al., 2011
PVP: poly(vinyl pyrrolidone), PEG: poly(ethylene glycol)
18
3.3 Classification of materials from the aspect of amorphization
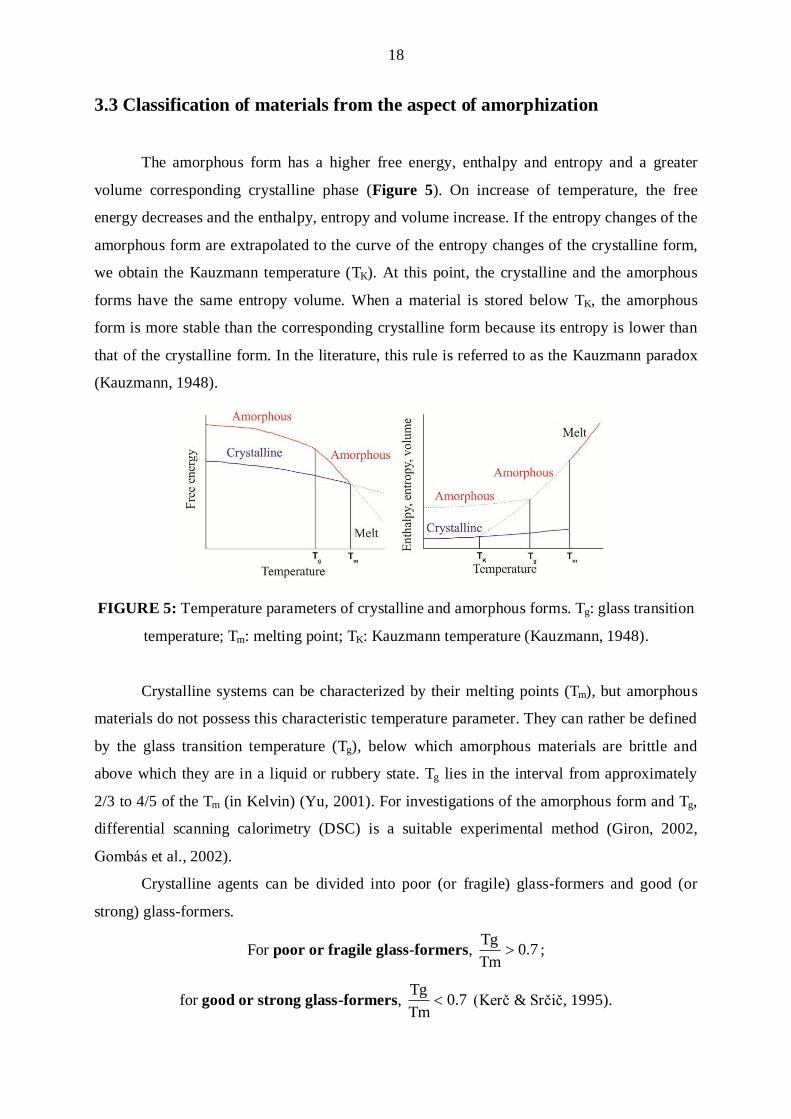
The amorphous form has a higher free energy, enthalpy and entropy and a greater
volume corresponding crystalline phase (Figure 5). On increase of temperature, the free
energy decreases and the enthalpy, entropy and volume increase. If the entropy changes of the
amorphous form are extrapolated to the curve of the entropy changes of the crystalline form,
we obtain the Kauzmann temperature (TK). At this point, the crystalline and the amorphous
forms have the same entropy volume. When a material is stored below TK, the amorphous
form is more stable than the corresponding crystalline form because its entropy is lower than
that of the crystalline form. In the literature, this rule is referred to as the Kauzmann paradox
(Kauzmann, 1948).
FIGURE 5: Temperature parameters of crystalline and amorphous forms. Tg: glass transition
temperature; Tm: melting point; TK: Kauzmann temperature (Kauzmann, 1948).
Crystalline systems can be characterized by their melting points (Tm), but amorphous
materials do not possess this characteristic temperature parameter. They can rather be defined
by the glass transition temperature (Tg), below which amorphous materials are brittle and
above which they are in a liquid or rubbery state. Tg lies in the interval from approximately
2/3 to 4/5 of the Tm (in Kelvin) (Yu, 2001). For investigations of the amorphous form and Tg,
differential scanning calorimetry (DSC) is a suitable experimental method (Giron, 2002,
Gombás et al., 2002).
Crystalline agents can be divided into poor (or fragile) glass-formers and good (or
strong) glass-formers.
For poor or fragile glass-formers, 7.0Tm
Tg;
for good or strong glass-formers, 7.0Tm
Tg (Kerč & Srčič, 1995).
19
(In other publications, the limit is given as 1.5 for Tm/Tg: when Tm/Tg>1.5, the material is a
good glass-former (Craig et al., 1999, Hancock & Zografi, 1997.) This allows a prediction of
the amorphization properties of APIs. Good glass-formers exhibit minimal molecular mobility
changes at Tg, and hence the shift in heat capacity tends to be small. However, this
complicates the determination of this characteristic parameter of the glassy form.
In an amorphous system containing several amorphous components, we can define
Tg(mix) through the Gordon-Taylor equation. 21
2211)(
K
TKTmixT gg
g ,
where 22
11
g
g
T
TK
,
mass of components,
gT glass transition temperatures of components,
amorphous densities of components (Gordon & Taylor, 1952).
The Tg - 50 K rule helps us suitable storage temperature for amorphous APIs. At this
temperature, glassy APIs have “zero” structural mobility, and storage at this temperature can
therefore stabilize the glassy state.
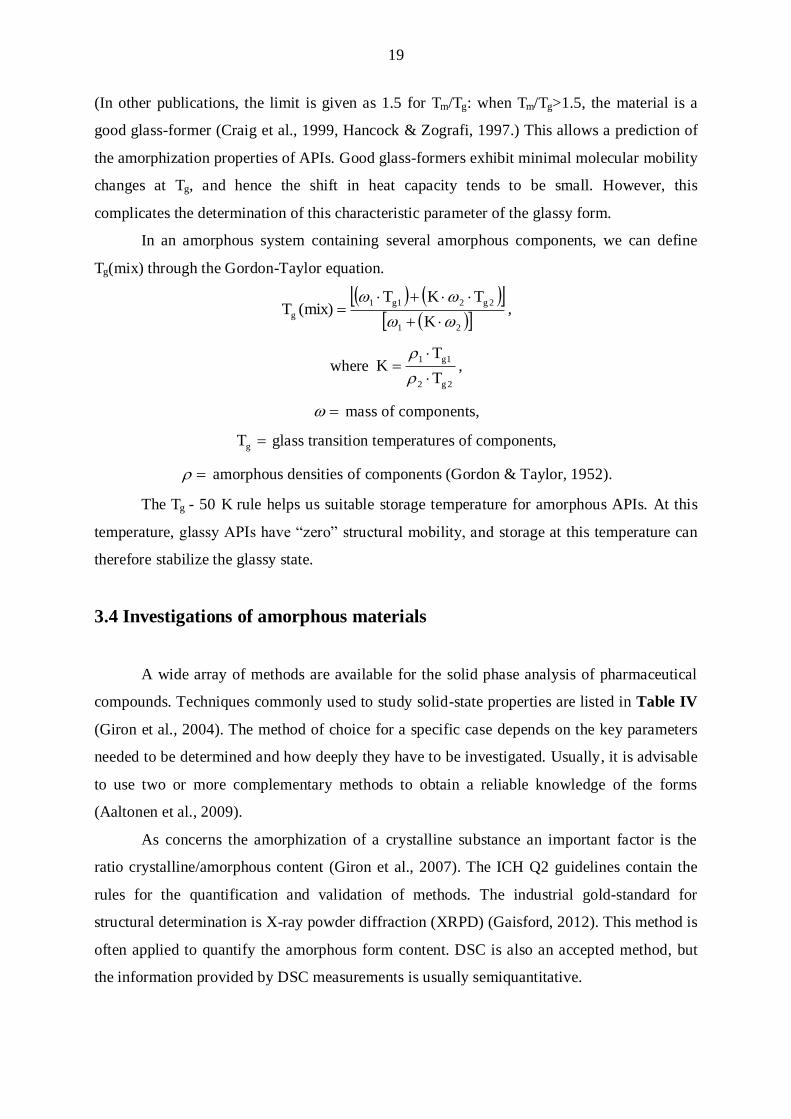
3.4 Investigations of amorphous materials
A wide array of methods are available for the solid phase analysis of pharmaceutical
compounds. Techniques commonly used to study solid-state properties are listed in Table IV
(Giron et al., 2004). The method of choice for a specific case depends on the key parameters
needed to be determined and how deeply they have to be investigated. Usually, it is advisable
to use two or more complementary methods to obtain a reliable knowledge of the forms
(Aaltonen et al., 2009).
As concerns the amorphization of a crystalline substance an important factor is the
ratio crystalline/amorphous content (Giron et al., 2007). The ICH Q2 guidelines contain the
rules for the quantification and validation of methods. The industrial gold-standard for
structural determination is X-ray powder diffraction (XRPD) (Gaisford, 2012). This method is
often applied to quantify the amorphous form content. DSC is also an accepted method, but
the information provided by DSC measurements is usually semiquantitative.
20
Table IV: Methods of investigation of solid states
Method Data measured Property measured/used
Example
X-ray diffraction (single crystal and XRPD)
Diffractogram Crystallographic properties, quantification of amorphous/crystalline ratio
Li, 2000; Chen et al., 2001
Infrared (IR) spectroscopy
IR spectrum Chemical information Ambike et al., 2004
Raman spectroscopy Raman spectrum Chemical information (complementary to IR), quantification of amorphous/crystalline ratio
Taylor & Zografi, 1998; Widjaja et al., 2011
Tetrahertz pulsed spectroscopy (TPS)
Tetrahertz pulsed spectrum
Chemical information Strachan et al., 2004
Near-infrared spectroscopy (NIR)
Near-infrared spectrum Chemical information, quantification of amorphous/crystalline ratio
Gombás et al., 2003
Solid-state nuclear magnetic resonance (NMR)
Magnetic resonance Chemical information, quantification of amorphous/crystalline ratio
Lefort et al., 2004
Differential scanning calorimetry (DSC)
Heat flow vs. temperature
Thermal events, quantification of amorphous/crystalline ratio
Gombás et al., 2002; Lefort et al., 2004
Thermogravimetry (TG) Change in mass vs. temperature
Solvate/hydrate studies Forster et al., 2001
Microscopy, polarized light microscopy (PLM), scanning electron microscopy (SEM)
Microscopy under the influence of light or electron radiation
Morphology, surface examinations, dehydration, polymorphism
Lechuga-Ballesteros et al., 2003
Moisture sorption/desorption isotherms
Change in mass vs. variable RH%
Hygroscopicity behaviour (hydrate formation, dehydration, amorphous crystallization
Bronlund & Paterson, 2004
Solubility/dissolution Amount dissolved in different solvents or temperatures vs. time
Solubility/dissolution rate measurement
Murdande et al., 2010
Dynamic vapour sorption (DVS)
Moisture sorption isotherm
Quantification of amorphous/crystalline ratio
Vollenbroek et al., 2010
Microcalorimetry Heat flow vs. time Quantification of amorphous/crystalline ratio
Ahmed et al., 1996, Dilworth et al., 2004; Gaisford et al., 2012
Solution calorimetry Heat flow during dissolution
Quantification of amorphous/crystalline ratio
Royall & Gaisford, 2005
21
4 MATERIALS AND METHODS
4.1 Materials
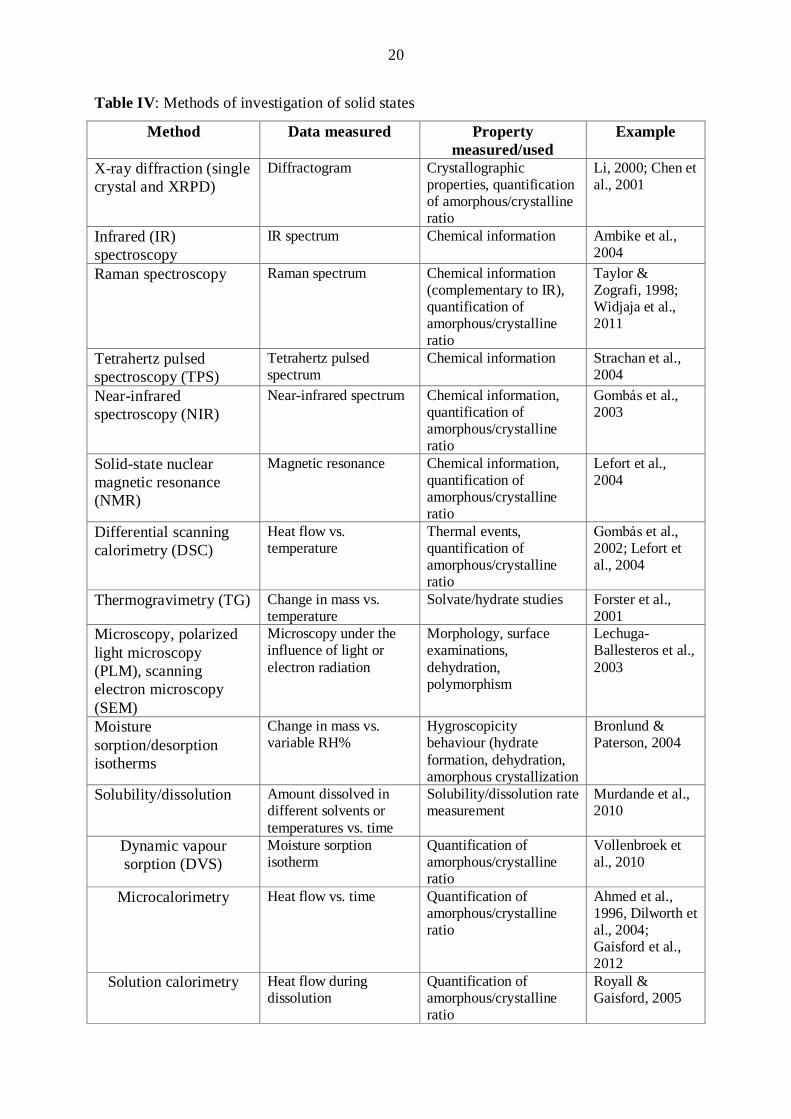
4.1.1 Clopidogrel hydrogensulfate (CLP)
In this study, the crystalline API which was subjected to amorphization was CLP
(clopidogrel bisulfate), a potent oral antiplatelet agent often used in the treatment of coronary
artery disease, peripheral vascular disease and cerebrovascular disease as Plavix® (an original
drug product). Many generic products containing this active agent are currently on the market
with in Hungary. The chemical formula of CLP is C16H16ClNO2SH2SO4 and the molecular
mass is 419.9. Chemically, it is classed among the thiophenes, and its systematic IUPAC
name is methyl (+)-(S)-alpha-(2-chlorophenyl)-6,7-dihydrothieno[3,2-c]pyridine-5(4H)-
acetate sulfate. The chemichal structure is to be seen in Figure 6. Six different polymorphic
forms (Table V) and an amorphous form of the drug have been identified, but only forms I
and II are used in pharmaceutical formulations (Bousquet et al., 2003; Uvarov & Popov,
2008). The polymorphic and amorphous forms of this drug are dealt with in a number of
patents and articles.
FIGURE 6: The chemical structure of CLP

22
Table V: Polymorphic and amorphous forms of CLP
Polymorphic form Melting point (Tm) Reference
I 184±γ ºC Lohray et al., 2004
II 176±γ ºC Lohray et al., 2004
III 105 ºC Lifshitz et al., 2004
IV 160-170 ºC Lifshitz et al., 2004
V 126-132 ºC Lifshitz et al., 2004
VI 136 ºC Lifshitz et al., 2003
Amorphous - Parthasaradhi et al., 2006
CLP polymorphic form II (EGIS, Budapest, Hungary) was used as the crystalline API.
4.1.2 Solvents and additives
Table VI details the solvents and additives applied and their producers.
Table VI: Applied solvents and additives
Type of additives Materials Producer
Solvents Ethanol 96% v/v Merck, Hungary Methanol Acetone Reanal, Hungary
Crystallization inhibitors
Aerosil 200 (colloidal SiO2) Nippon Aerosil Co., Japan Syloid 72 FP (porous SiO2) Grace, Hungary Kaolin Merck, Hungary Mannitol Microcrystalline cellulose (MCC) (Avicel PH 101)
FMC Corporation, Europe
Poly(vinyl pyrrolidone) (PVP K25) (PVP, Kollidon® 25
BASF, Germany Cross-linked PVP (Crospovidone,
Kollidon® CL-M, PVP K CL-M) Methylcellulose (Ph. Eur.)
Auxiliary agents of tablet making
Microcrystalline cellulose (MCC) (Avicel PH 101), as filler
FMC Corporation, Europe
Cross-linked PVP (PVP Polypl. XL 10) (Polyplasdone® XL 10, N-vinyl-2-pyrrolidone polymer), as disintegrant
I.S.P. Technologies Inc., Germany
Magnesium stearate, as lubricant Hungaropharma, Hungary

23
4.2 Methods of preparation
4.2.1 Preparation of pure amorphous CLP
Amorphous samples were made with the use of ethanol 96% v/v or methanol. 1.00 g
CLP was dissolved in 10.00 g ethanol or 4.00 g methanol with the aid of a magnetic stirrer
(Velp® Scientifica, Europe) for 5 minutes at room temperature. The solvent was evaporated
by two methods: with blown room temperature air or under vacuum (Binder, Germany).
1.00 g CLP was treated with 20.00 g acetone with magnetic mixing for 15 minutes at room
temperature and the solvent was then evaporated off in vacuum (Binder, Germany). After
drying, samples were pulverized in a porcelain mortar with a pestle. In the following steps, we
used the sample which was prepared with ethanol and dried with room temperature air as
amorphous reference sample. Ethanol was the most suitable solvent for the amorphization of
CLP (see section 5.1).
4.2.2 Selection of a crystallization inhibitor
Different masses of CLP were dissolved in different amounts of ethanol 96% v/v. The
resulting solutions were mixed with different crystallization inhibitors in a porcelain mortar,
leading to the formation of a solution or a suspension or a gel. The ratio CLP:crystallization
inhibitor was 7:3. The mixtures were then dried with room-temperature air (25 C, 46%
relative humidity (RH)). After the most suitable inhibitor had been chosen, it was mixed with
CLP in ratios of 1:9; 3:7; 1:1; 7:3 and 9:1 with the aim of finding the best active API:auxiliary
agent ratio.
4.2.3 Amorphization in scaling-up processes
Sample 1: 28.0 g of CLP was dissolved in 160.0 g of ethanol 96% v/v with the use of a
magnetic mixer for 2 min. 12.0 g of Aerosil 200 and 40.0 g of MCC were mixed with a
Turbula mixer (speed: 50 rpm, duration of mixing: 5 min). The solution of CLP was then
vaporized onto the surface of the Aerosil 200-MCC mixture bed in a pan (Dragex-1, Jørgen).
Sample 2: 28.0 g of CLP was dissolved in 160.0 g of ethanol 96% v/v with the use of a
magnetic mixer for 2 min. 12.0 g of Aerosil 200 was added to the solution of CLP and
underwent solvation in 2 min; a gel was made by mixing. This mixture was vapourized onto
the surface of 40.0 g of a MCC bed in the same pan.
The parameters (in both cases): pan (Dragex-1 stainless steel equipment, furnished
with an exhauster system for removal of the solvent under processing), rotation speed: 25

24
rpm; pressure of spraying air: 0.1 bar; type of vapourizer: Walther, 1 mm nozzle diameter;
drying air temperature: 25 ºC; RH of drying air: 46%; transportation of liquid: Peripump;
speed of transportation: at the beginning of the measurement 5 ml/min; at the end of the
measurement: 1 ml/min (this depends on the rate of drying). This step involves a 28-fold
scaling-up. During the process, the loss of powder was very variable, depending on the
situation of the Aerosil 200 (in a powder bed or in alcoholic solution).
4.2.4 Tablet-making
A larger amount of stabilized product was prepared with the production method
employed for Sample 2. This product was the internal phase of the tablets. The mass of a
tablet was 400 mg, containing 100 mg of CLP. The composition for 1000 tablets is given in
Table VII. The internal and external phases were mixed with a Turbula mixer (speed: 50 rpm,
duration of mixing: 5 min). Tablets were made with a Korsch EKO eccentric tablet machine
(Emil Korsch Maschinenfabrik, Berlin, Germany) (35 tablets/min, punch diameter 12 mm,
compression force: 9±1 kN).
TABLE VII: Composition for 1000 tablets
Substances Mass
Internal phase CLP
Aerosil 200
MCC
100.00 g
42.86 g
243.14 g
External phase Polyplasdone XL 10
Magnesium stearate
12.00 g
2.00 g
4.3 Methods of investigations
4.3.1 Differential scanning calorimetry (DSC)
For characterization of the amorphous form, DSC was used (a Mettler-Toledo DSC
821 instrument). Approximately 4.80-5.20 mg of sample was placed into an aluminium pan,
which was then sealed and scanned from 25 ºC to β00 ºC at 5 ºC/min under an argon gas flow
at 100-150 ml/min. The instrument was calibrated with the use of indium.
25
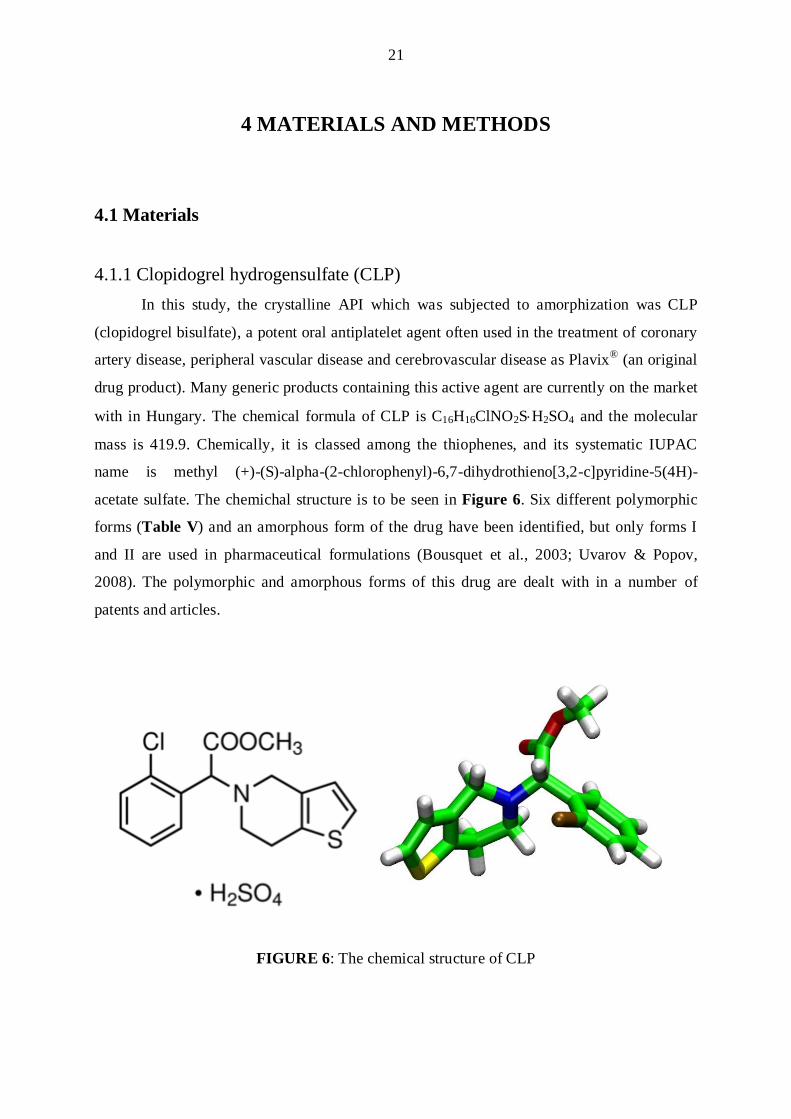
4.3.2 X-ray powder diffraction (XRPD)
XRPD was performed with an X-ray Diffractometer Miniflex II (Rigaku, Tokyo,
Japan), where the tube anode was copper with Kα=1.5405 Ǻ. The pattern was collected at a
tube voltage of 30 kV and a tube current of 15 mA in step scan mode (4°min-1). The
instrument was calibrated with silicon.
4.3.3 FT-IR analysis
To demonstrate, that no degradation occurred during preparation, and for the chemical
stability testing of samples, we used an FT-IR apparatus, Avatar 330 FT-IR spectrometer
(Thermo Nicolet, USA). The sample, with a CLP content of 0.5 mg, was mixed with 150 mg
of dry KBr in an agate mortar, and the mixture was then compressed into a disc at 10 t. Each
disc was scanned 64 times at a resolution of 2 cm−1 over the wavenumber region 4000–
400 cm−1.
The presence of H-bonding in the samples was confirmed by FT-IR analysis in the
solid and in the liquid phase. Dichloromethane was applied as solvent for the preparation of
solutions. In the liquid phase, the concentrations were 0.1000 g, 0.0500 g, 0.0250 g or
0.0125 g in 10 cm3. IR spectra were recorded 4000 and 400 cm-1 on a FT-IR spectrometer
(Bio-Rad Digilab Division FTS-65A/869, USA) between. The spectrometer was equipped
with a DTGS detector for the measurements on solid samples. Solutions were investigated in
a KBr liquid cell of 0.1 mm in thickness. The spectral resolution was 4 cm-1 and 128 scans
were averaged.
4.3.4 Investigation of tablet parameters
Five parameters of the tablets were investigated: mass, diameter, height (measured
with a screw micrometer; Mitutoyo Corporation, Tokyo, Japan), hardness against pressure
(Heberlein apparatus, Le Locle, Switzerland) and the time of disintegration (Erweka ZT71,
GmbH, Germany). Investigations were made with fresh and with stored tablets.
4.3.5 Investigation of stability of products
As recommended by international guidelines (ICH Q1A), we stored samples under
two different conditions. Long-term testing was performed at β5±β ºC with 60±5% RH, and
accelerated testing at 40±β ºC with 75±5% RH. Under both conditions, samples were stored in
open and in closed containers; the duration of storage was 4 weeks.
26
5 RESULTS
5.1 Confirmation of amorphous form
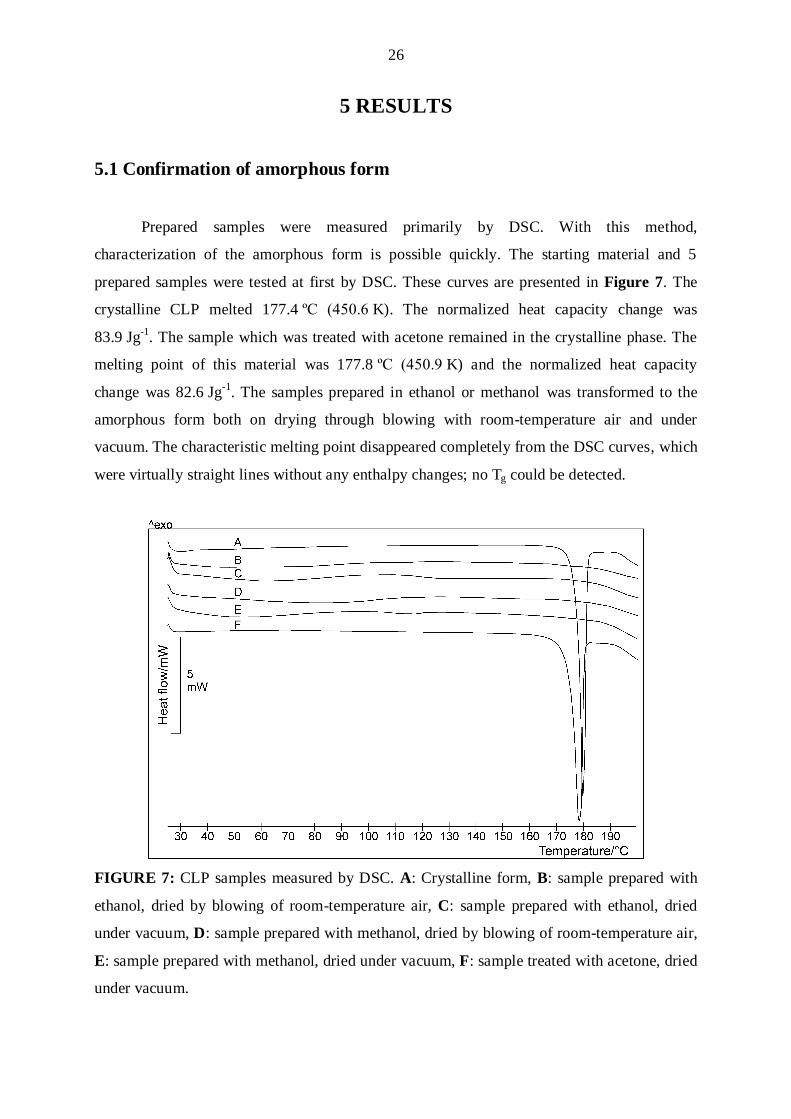
Prepared samples were measured primarily by DSC. With this method,
characterization of the amorphous form is possible quickly. The starting material and 5
prepared samples were tested at first by DSC. These curves are presented in Figure 7. The
crystalline CLP melted 177.4 ºC (450.6 K). The normalized heat capacity change was
83.9 Jg-1. The sample which was treated with acetone remained in the crystalline phase. The
melting point of this material was 177.8 ºC (450.9 K) and the normalized heat capacity
change was 82.6 Jg-1. The samples prepared in ethanol or methanol was transformed to the
amorphous form both on drying through blowing with room-temperature air and under
vacuum. The characteristic melting point disappeared completely from the DSC curves, which
were virtually straight lines without any enthalpy changes; no Tg could be detected.
FIGURE 7: CLP samples measured by DSC. A: Crystalline form, B: sample prepared with
ethanol, dried by blowing of room-temperature air, C: sample prepared with ethanol, dried
under vacuum, D: sample prepared with methanol, dried by blowing of room-temperature air,
E: sample prepared with methanol, dried under vacuum, F: sample treated with acetone, dried
under vacuum.

27
Samples were also tested by XRPD measurement. Diffractograms are to be seen in
Figure 8; for clarity, the diffractograms are displaced along the y axis. This investigation
supported the DSC results throughout. Figure 8 shows that the products prepared with
ethanol or methanol, independently of the drying procedure, were converted to the amorphous
form, because the peaks disappeared from the diffractograms, and the spectra became smooth.
The sample treated with acetone remained in the crystalline phase, and the diffractogram of
this preparation was the same as that of the crystalline starting material.
FIGURE 8: CLP samples measured by XRPD. A: Crystalline form, B: sample prepared with
ethanol, dried with room-temperature air, C: sample prepared with ethanol, dried under
vacuum, D: sample prepared with methanol, dried with room-temperature air, E: sample
prepared with methanol, dried under vacuum, F: sample treated with acetone, dried under
vacuum.
To confirm that no degradation had occurred in the prepared samples, FT-IR analysis
was performed (Figure 9). For clarity, these spectra too have been displaced along the y axis.
Each peak was present in each spectrum, reflecting the presence of the same chemical bonds,
and no degradation could be detected in the course of these measurements. The amorphous
and crystalline materials furnished the same spectra. Thus, as we had anticipated, with this
method we could not differentiate the crystalline and the amorphous forms, but we confirmed
that no degradation had taken place in the samples.

28
FIGURE 9: CLP samples measured by FT-IR. A: Crystalline form (II), B: sample prepared
with ethanol, dried with room-temperature air, C: sample prepared with ethanol, dried under
vacuum, D: sample prepared with methanol, dried with room-temperature air, E: sample
prepared with methanol, dried under vacuum, F: sample treated with acetone, dried under
vacuum.
The DSC, XRPD and FT-IR results suggested that the samples prepared with ethanol
or methanol were transformed to the amorphous form independently of the drying procedure,
but the sample treated with acetone remained in the crystalline form. Acetone is not a suitable
solvent for the amorphization of CLP, but ethanol and methanol have the same amorphizing
property in the case of this API. As mentioned in the literature background, if we apply a
solvent in a pharmaceutical technological method, we must take into account the danger class
of this solvent according to the ICH Q3C guideline (1998). The objective of this guideline is
to recommend acceptable amounts for residual solvents in pharmaceuticals for the safety of
the patient. ICH Q3C classifies ethanol into the less dangerous Class 3, while methanol is
classified into the more dangerous Class 2. Accordingly, we recomended the application of
ethanol for the amorphization of CLP.
29
5.2 Measurement of Tg
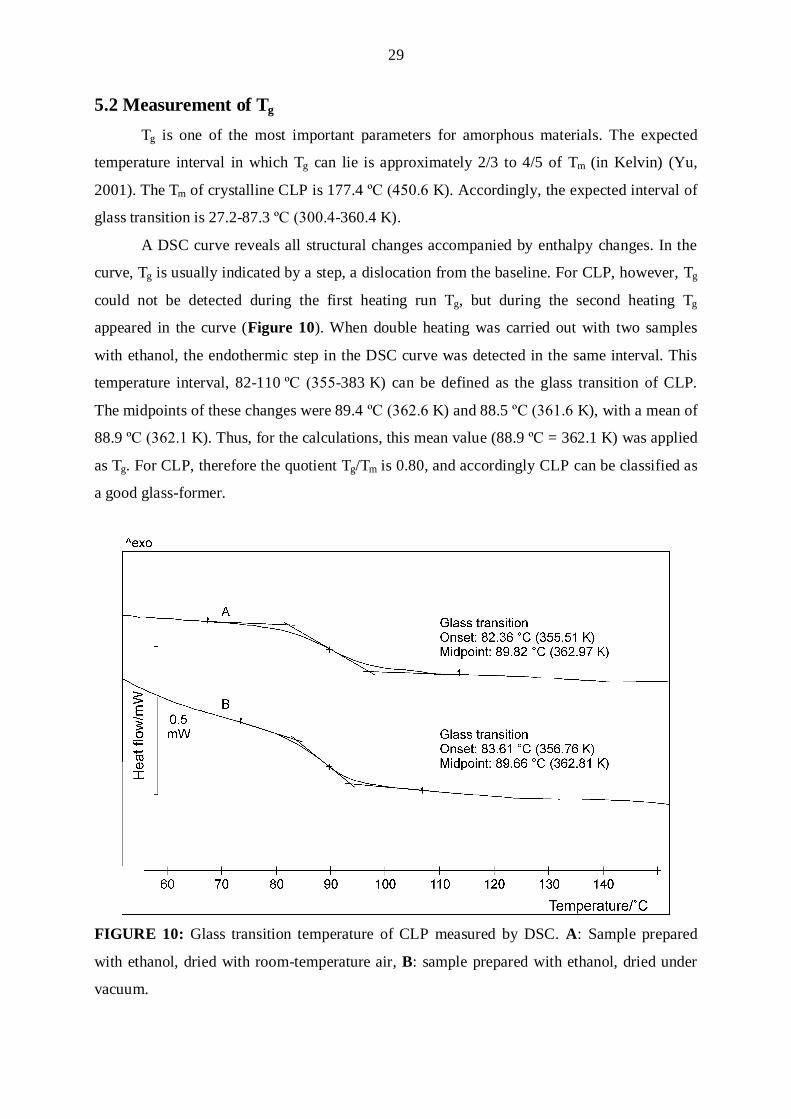
Tg is one of the most important parameters for amorphous materials. The expected
temperature interval in which Tg can lie is approximately 2/3 to 4/5 of Tm (in Kelvin) (Yu,
2001). The Tm of crystalline CLP is 177.4 ºC (450.6 K). Accordingly, the expected interval of
glass transition is 27.2-87.3 ºC (γ00.4-360.4 K).
A DSC curve reveals all structural changes accompanied by enthalpy changes. In the
curve, Tg is usually indicated by a step, a dislocation from the baseline. For CLP, however, Tg
could not be detected during the first heating run Tg, but during the second heating Tg
appeared in the curve (Figure 10). When double heating was carried out with two samples
with ethanol, the endothermic step in the DSC curve was detected in the same interval. This
temperature interval, 82-110 ºC (γ55-383 K) can be defined as the glass transition of CLP.
The midpoints of these changes were 89.4 ºC (γ6β.6 K) and 88.5 ºC (γ61.6 K), with a mean of
88.9 ºC (γ6β.1 K). Thus, for the calculations, this mean value (88.9 ºC = 362.1 K) was applied
as Tg. For CLP, therefore the quotient Tg/Tm is 0.80, and accordingly CLP can be classified as
a good glass-former.
FIGURE 10: Glass transition temperature of CLP measured by DSC. A: Sample prepared
with ethanol, dried with room-temperature air, B: sample prepared with ethanol, dried under
vacuum.
30
5.3 Preliminary stability testing
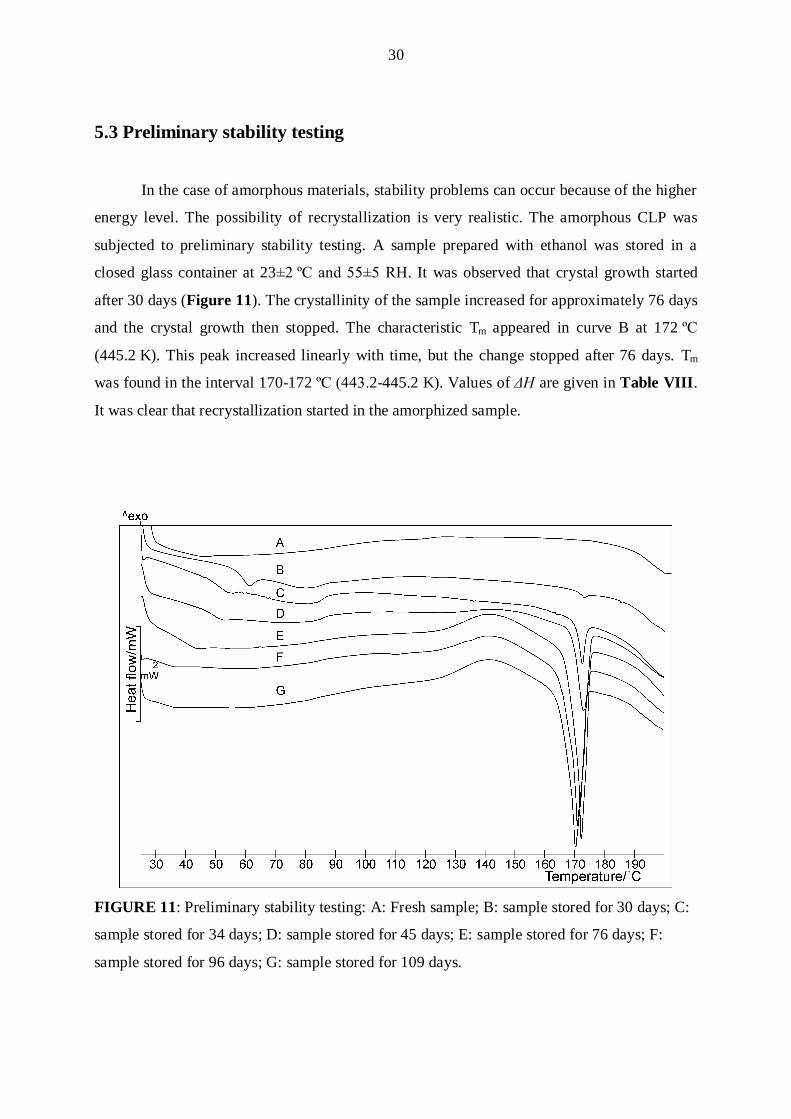
In the case of amorphous materials, stability problems can occur because of the higher
energy level. The possibility of recrystallization is very realistic. The amorphous CLP was
subjected to preliminary stability testing. A sample prepared with ethanol was stored in a
closed glass container at 23±β ºC and 55±5 RH. It was observed that crystal growth started
after 30 days (Figure 11). The crystallinity of the sample increased for approximately 76 days
and the crystal growth then stopped. The characteristic Tm appeared in curve B at 172 ºC
(445.2 K). This peak increased linearly with time, but the change stopped after 76 days. Tm
was found in the interval 170-172 ºC (44γ.2-445.2 K). Values of ΔH are given in Table VIII.
It was clear that recrystallization started in the amorphized sample.
FIGURE 11: Preliminary stability testing: A: Fresh sample; B: sample stored for 30 days; C:
sample stored for 34 days; D: sample stored for 45 days; E: sample stored for 76 days; F:
sample stored for 96 days; G: sample stored for 109 days.
31
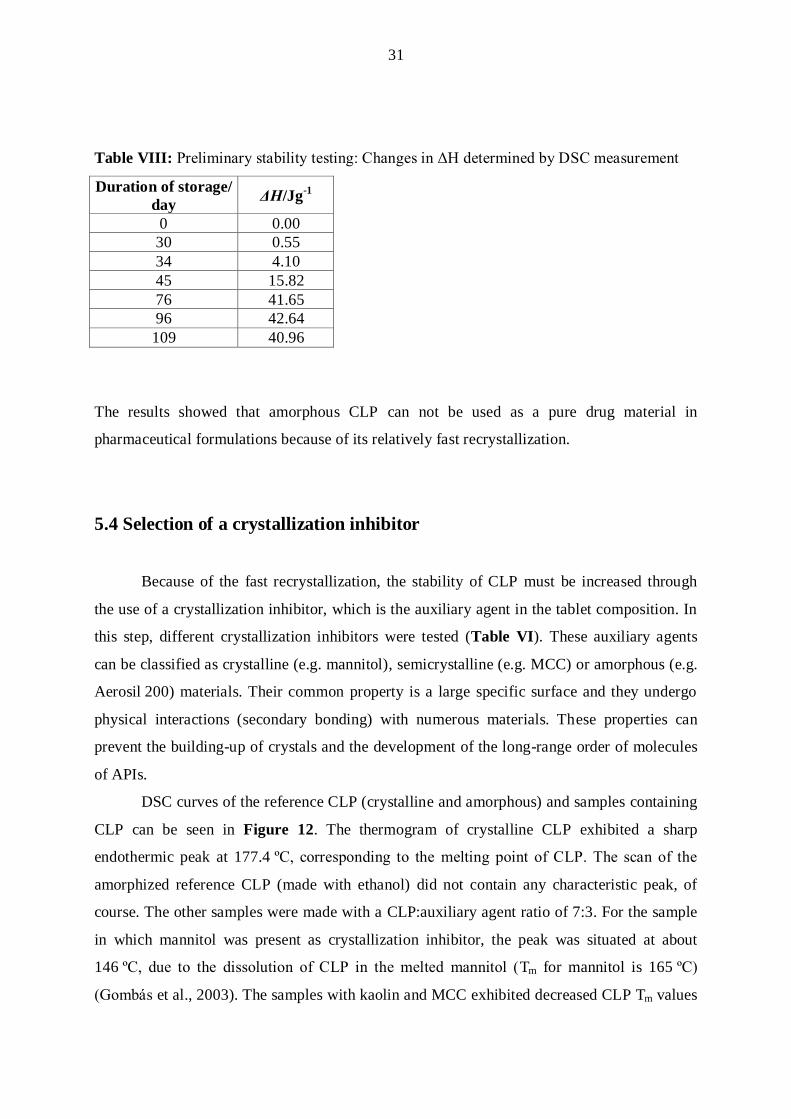
Table VIII: Preliminary stability testing: Changes in ΔH determined by DSC measurement
Duration of storage/ day ΔH/Jg-1
0 0.00 30 0.55 34 4.10 45 15.82 76 41.65 96 42.64 109 40.96
The results showed that amorphous CLP can not be used as a pure drug material in
pharmaceutical formulations because of its relatively fast recrystallization.
5.4 Selection of a crystallization inhibitor
Because of the fast recrystallization, the stability of CLP must be increased through
the use of a crystallization inhibitor, which is the auxiliary agent in the tablet composition. In
this step, different crystallization inhibitors were tested (Table VI). These auxiliary agents
can be classified as crystalline (e.g. mannitol), semicrystalline (e.g. MCC) or amorphous (e.g.
Aerosil 200) materials. Their common property is a large specific surface and they undergo
physical interactions (secondary bonding) with numerous materials. These properties can
prevent the building-up of crystals and the development of the long-range order of molecules
of APIs.
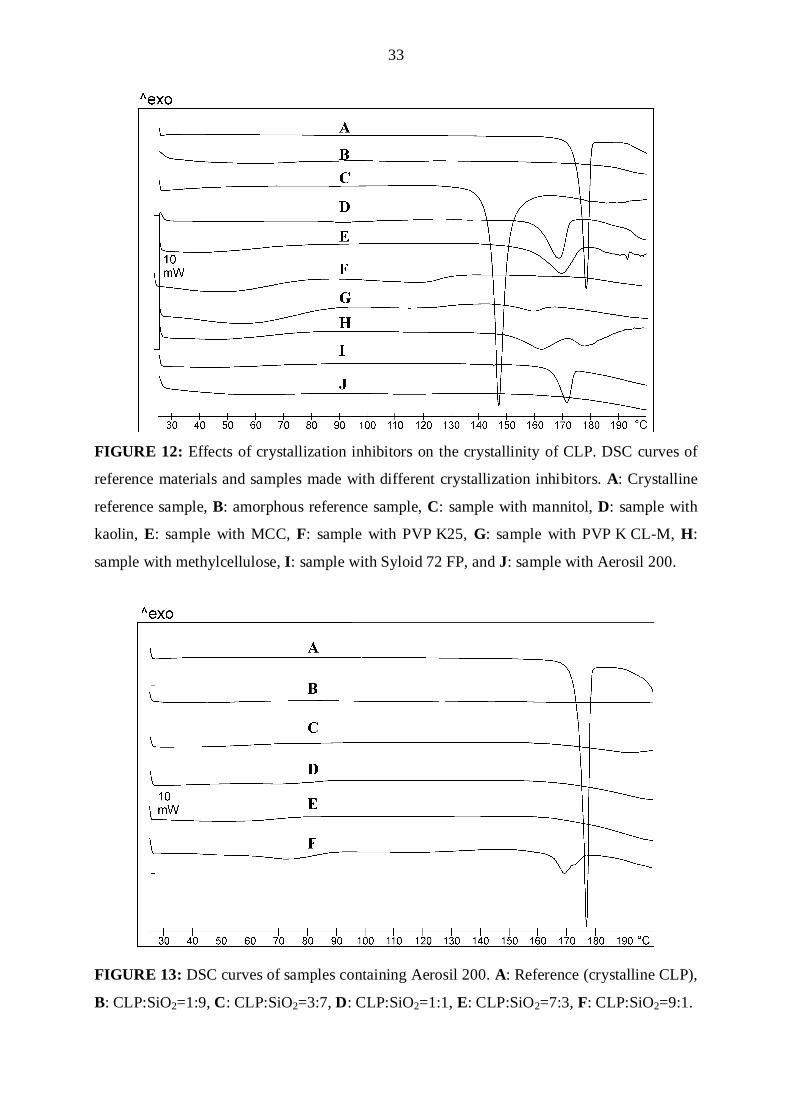
DSC curves of the reference CLP (crystalline and amorphous) and samples containing
CLP can be seen in Figure 12. The thermogram of crystalline CLP exhibited a sharp
endothermic peak at 177.4 ºC, corresponding to the melting point of CLP. The scan of the
amorphized reference CLP (made with ethanol) did not contain any characteristic peak, of
course. The other samples were made with a CLP:auxiliary agent ratio of 7:3. For the sample
in which mannitol was present as crystallization inhibitor, the peak was situated at about
146 ºC, due to the dissolution of CLP in the melted mannitol (Tm for mannitol is 165 ºC)
(Gombás et al., 2003). The samples with kaolin and MCC exhibited decreased CLP Tm values

32
(168 and 169 ºC). In this range, these agents do not have melting points. The samples
containing PVP K25 or PVP K CL-M and CLP in amorphous form, underwent a colour
change because of incompatibility between the components. The curve for the sample made
with methylcellulose displayed a double peak effect, at 167.9 ºC and 177.6 ºC. This may be an
indication of two polymorphs in this sample. It has been reported that polymorphic form IV
melts at 167.9 ºC (Lifshitz et al., 2004) and form II at 177.6 ºC (Lohray et al., 2004).
Accordingly, this sample contains three different forms of CLP: the amorphous form, and the
crystalline forms IV and II. Aerosil 200 and Syloid 72 FP differ greatly in applicability as
crystallization inhibitors, despite both of them consisting of SiO2. With ethanol as solvent,
Aerosil 200 resulted in perfectly amorphous CLP, in contrast with Syloid 72 FP, which
amorphized the CLP only partially. This result can be explained as a consequence of the
gelling property of Aerosil 200 in ethanol. After the evaporation of the ethanol, the large
surface of SiO2 fixes the CLP and protects it against crystal growth, because of the interaction
between CLP and SiO2. This interaction presumably involves H-bonding with the surface
silanol groups on the SiO2. Such silanol groups are not present on the surface of Syloid 72 FP,
which rules out this interaction. This supposition is based on the reported verification of the
presence of H-bonding between indomethacin and SiO2 by solid-state NMR imaging
(Watanabe et al., 2001). These results led us to choose Aerosil 200 as crystallization inhibitor
for the scaling-up process. This auxiliary agent is a classical additive in pharmaceutical
formulations. In the case of solid forms, it can be used as a glidant (Ohta et al., 2003) or a
coating material (Tayel et al., 2008) in tablet making, as a surface modifier (e. g. in dry
powder inhalation (DPI) formulations, due to its highly hydrophilic and adsorbing properties)
(Kawashima et al., 1998), and as an auxiliary agent in the preparation of solid dispersions
(Takeuchi et al., 2004). It is an amorphous agent itself, and thus the presence of API crystals
in samples can be detected unambiguously, e.g. by DSC.
The following step in this work was to find the optimum CLP:Aerosil 200 ratio. Five
different compositions were tested with this aim. The DSC curves are presented in Figure 13.
Melting is not detected in curves A, B, C, D and E, and these samples can therefore be
regarded as amorphous. Curve F, which relates to a CLP:Aerosil 200 ratio of 9:1, indicates Tm
at 169.5 ºC, which means the recrystallization of CLP. Accordingly, this amount of
crystallization inhibitor is not sufficient to maintain the active agent in amorphous form. For
this reason, a CLP:SiO2 ratio of 7:3 was chosen for tablet formulation.
33
FIGURE 12: Effects of crystallization inhibitors on the crystallinity of CLP. DSC curves of
reference materials and samples made with different crystallization inhibitors. A: Crystalline
reference sample, B: amorphous reference sample, C: sample with mannitol, D: sample with
kaolin, E: sample with MCC, F: sample with PVP K25, G: sample with PVP K CL-M, H:
sample with methylcellulose, I: sample with Syloid 72 FP, and J: sample with Aerosil 200.
FIGURE 13: DSC curves of samples containing Aerosil 200. A: Reference (crystalline CLP),
B: CLP:SiO2=1:9, C: CLP:SiO2=3:7, D: CLP:SiO2=1:1, E: CLP:SiO2=7:3, F: CLP:SiO2=9:1.
34
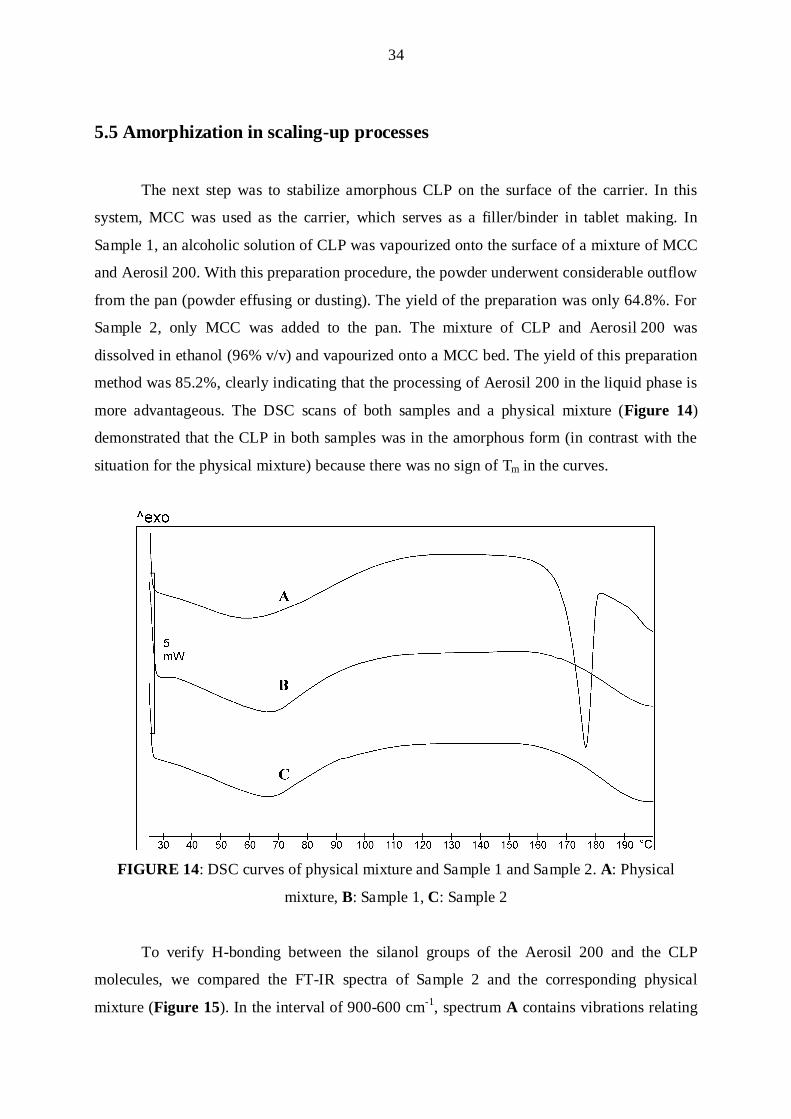
5.5 Amorphization in scaling-up processes
The next step was to stabilize amorphous CLP on the surface of the carrier. In this
system, MCC was used as the carrier, which serves as a filler/binder in tablet making. In
Sample 1, an alcoholic solution of CLP was vapourized onto the surface of a mixture of MCC
and Aerosil 200. With this preparation procedure, the powder underwent considerable outflow
from the pan (powder effusing or dusting). The yield of the preparation was only 64.8%. For
Sample 2, only MCC was added to the pan. The mixture of CLP and Aerosil 200 was
dissolved in ethanol (96% v/v) and vapourized onto a MCC bed. The yield of this preparation
method was 85.2%, clearly indicating that the processing of Aerosil 200 in the liquid phase is
more advantageous. The DSC scans of both samples and a physical mixture (Figure 14)
demonstrated that the CLP in both samples was in the amorphous form (in contrast with the
situation for the physical mixture) because there was no sign of Tm in the curves.
FIGURE 14: DSC curves of physical mixture and Sample 1 and Sample 2. A: Physical
mixture, B: Sample 1, C: Sample 2
To verify H-bonding between the silanol groups of the Aerosil 200 and the CLP
molecules, we compared the FT-IR spectra of Sample 2 and the corresponding physical
mixture (Figure 15). In the interval of 900-600 cm-1, spectrum A contains vibrations relating

35
to deformation of C structure. These bands are markedly decreased in spectrum B, indicating
that the product is in the amorphous state. On the other hand, it also demonstrates the
presence of chemical bonding in the product.
FIGURE 15: FT-IR analysis of Sample 2 and the corresponding physical mixture. A:
Physical mixture, B: Sample 2.
To confirm the chemical bonding, we measured Sample 2 at different concentrations in
solution (Figure 16). In the interval 1100-1000 cm-1, spectrum A reveals extensive
association. On dilution of the sample, this association progressively breaks down (spectra B,
C, D and E). Between 1058 and 1036 cm-1 two bands appeared, reflecting νas C-O-C
stretching (indicative of acetates). The band at 1058 cm-1 shifted to 1036 cm-1 on dilution,
demonstrating the break-down of the association. These results confirm the presence of H-
bonding in the solid Sample 2. The different states of the samples lead to the different
positions of the bands. Spectrum F shows that dichloromethane does not give a signal in this
interval.

36
FIGURE 16: FT-IR analysis of Sample 2 at different concentrations in solutions containing
dichloromethane. A: Solid Sample 2, B: 0.1000 g sample in 10 cm3 of solution, C: 0.0500 g
sample in 10 cm3 of solution, D: 0.0250 g sample in 10 cm3 of solution, E: 0.0125 g sample in
10 cm3 of solution, F: dichloromethane.
In the study of the stability of amorphous CLP, Sample 1 and Sample 2 were stored for
4 weeks at 25 ºC and 60% RH. The results revealed that the stored samples remained in the
amorphous phase. The findings of accelerated testing showed that, when Sample 1 was stored
in either open or closed containers for 4 weeks, it included crystalline material. For Sample 2,
only the sample stored in an open container included a crystalline phase.
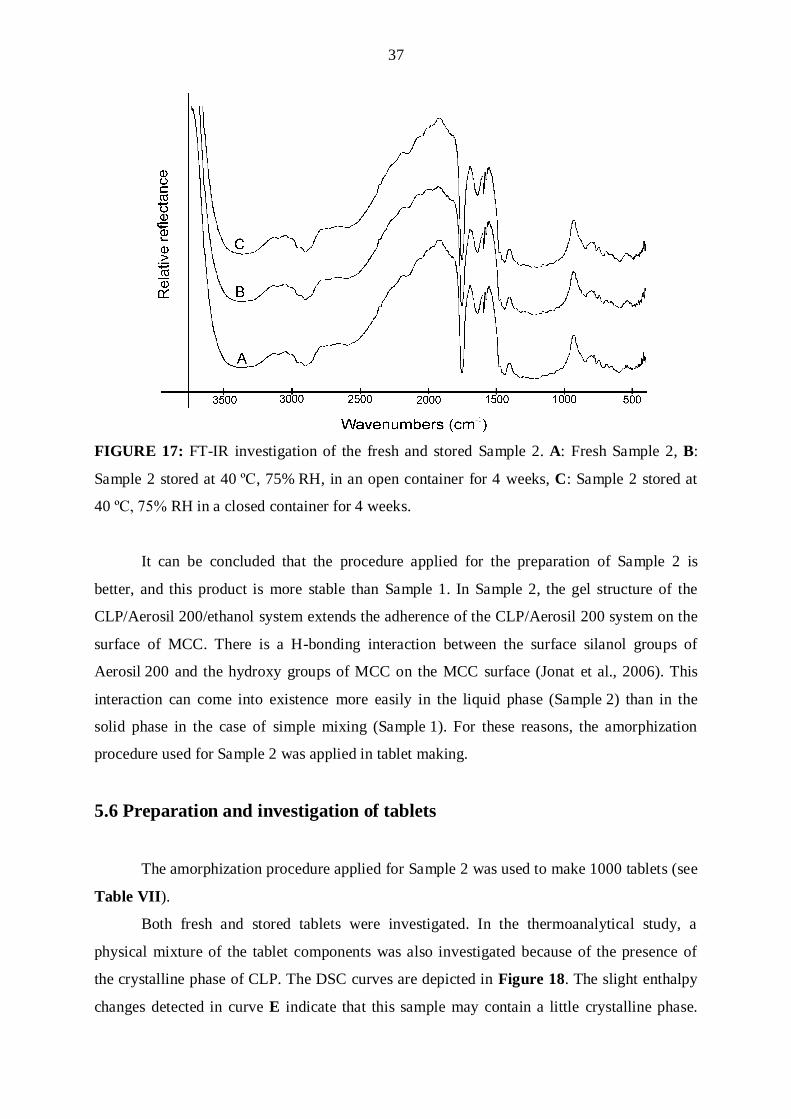
To investigate the chemical stability of Sample 2, FT-IR analysis was used. The FT-IR
spectra showed that there were no chemical changes in the samples stored either in open or in
closed containers. All of the peaks were the same in the fresh and in the stored samples
(Figure 17).
37
FIGURE 17: FT-IR investigation of the fresh and stored Sample 2. A: Fresh Sample 2, B:
Sample 2 stored at 40 ºC, 75% RH, in an open container for 4 weeks, C: Sample 2 stored at
40 ºC, 75% RH in a closed container for 4 weeks.
It can be concluded that the procedure applied for the preparation of Sample 2 is
better, and this product is more stable than Sample 1. In Sample 2, the gel structure of the
CLP/Aerosil 200/ethanol system extends the adherence of the CLP/Aerosil 200 system on the
surface of MCC. There is a H-bonding interaction between the surface silanol groups of
Aerosil 200 and the hydroxy groups of MCC on the MCC surface (Jonat et al., 2006). This
interaction can come into existence more easily in the liquid phase (Sample 2) than in the
solid phase in the case of simple mixing (Sample 1). For these reasons, the amorphization
procedure used for Sample 2 was applied in tablet making.
5.6 Preparation and investigation of tablets
The amorphization procedure applied for Sample 2 was used to make 1000 tablets (see
Table VII).
Both fresh and stored tablets were investigated. In the thermoanalytical study, a
physical mixture of the tablet components was also investigated because of the presence of
the crystalline phase of CLP. The DSC curves are depicted in Figure 18. The slight enthalpy
changes detected in curve E indicate that this sample may contain a little crystalline phase.

38
This sample was stored at 40 ºC and 75% RH in an open container for 4 weeks. Curves A, B,
C, D and F do not reveal any crystalline phase in the system. The XRPD investigations
resulted in constant data. The fingerprint of CLP did not appear in the diffractogram. A
feature of importance for tablet making was that the surface area of the amorphous product
decreased, which was another stabilizing step in the formulation.
FIGURE 18: Stability of tablets. A: Physical mixture, B: fresh product, C: sample stored at
25 ºC, 60% RH, in an open container for 4 weeks, D: sample stored at 25 ºC, 60% RH in a
closed container for 4 weeks, E: sample stored at 40 ºC, 75% RH, in an open container for 4
weeks, F: sample stored at 40 ºC, 75% RH, in a closed container for 4 weeks.
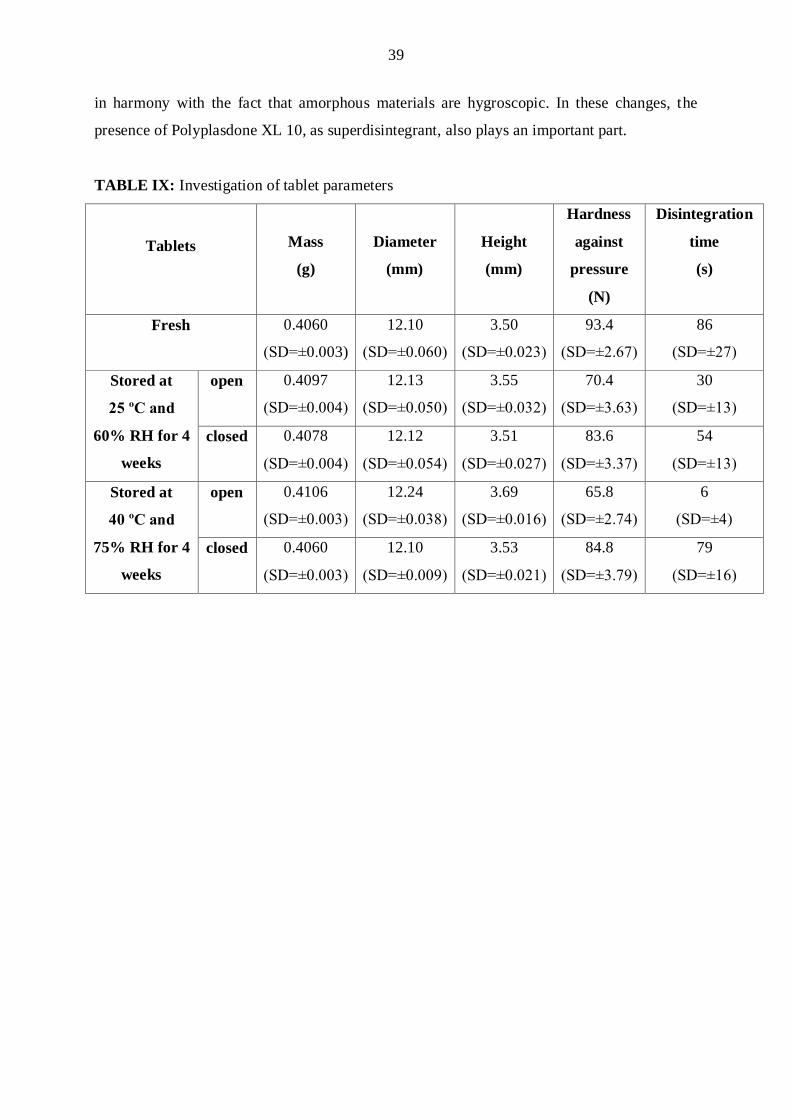
The physical parameters of the fresh and stored tablets are reported in Table IX. The
change in mass of the tablets was greatest for the tablets stored in an open container for 4
weeks under accelerated conditions (40 ºC, 75% RH). As the mass of these tablets increased,
the diameter and height also increased. In the other cases, the changes were negligible. The
hardness against pressure of the tablets decreased in all cases, most strongly for the tablets
stored in open containers. The time of disintegration also decreased in all cases, and again the
most considerable changes occurred for the tablets stored in open containers. These results are
39
in harmony with the fact that amorphous materials are hygroscopic. In these changes, the
presence of Polyplasdone XL 10, as superdisintegrant, also plays an important part.
TABLE IX: Investigation of tablet parameters
Tablets
Mass
(g)
Diameter
(mm)
Height
(mm)
Hardness
against
pressure
(N)
Disintegration
time
(s)
Fresh 0.4060
(SD=±0.003)
12.10
(SD=±0.060)
3.50
(SD=±0.0βγ)
93.4
(SD=±β.67)
86
(SD=±β7)
Stored at
25 ºC and
60% RH for 4
weeks
open 0.4097
(SD=±0.004)
12.13
(SD=±0.050)
3.55
(SD=±0.0γβ)
70.4
(SD=±γ.6γ)
30
(SD=±1γ)
closed 0.4078
(SD=±0.004)
12.12
(SD=±0.054)
3.51
(SD=±0.0β7)
83.6
(SD=±γ.γ7)
54
(SD=±1γ)
Stored at
40 ºC and
75% RH for 4
weeks
open 0.4106
(SD=±0.00γ)
12.24
(SD=±0.0γ8)
3.69
(SD=±0.016)
65.8
(SD=±β.74)
6
(SD=±4)
closed 0.4060
(SD=±0.00γ)
12.10
(SD=±0.009)
3.53
(SD=±0.0β1)
84.8
(SD=±γ.79)
79
(SD=±16)
40
6 PRACTICAL ASPECTS
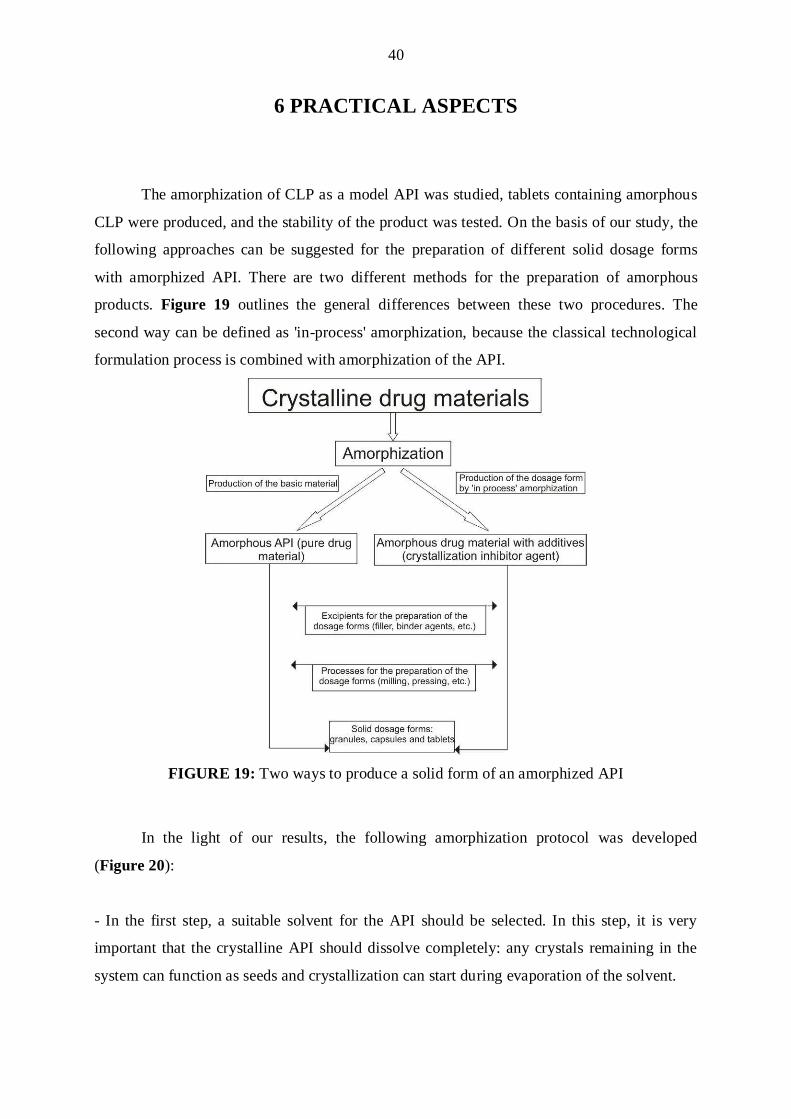
The amorphization of CLP as a model API was studied, tablets containing amorphous
CLP were produced, and the stability of the product was tested. On the basis of our study, the
following approaches can be suggested for the preparation of different solid dosage forms
with amorphized API. There are two different methods for the preparation of amorphous
products. Figure 19 outlines the general differences between these two procedures. The
second way can be defined as 'in-process' amorphization, because the classical technological
formulation process is combined with amorphization of the API.
FIGURE 19: Two ways to produce a solid form of an amorphized API
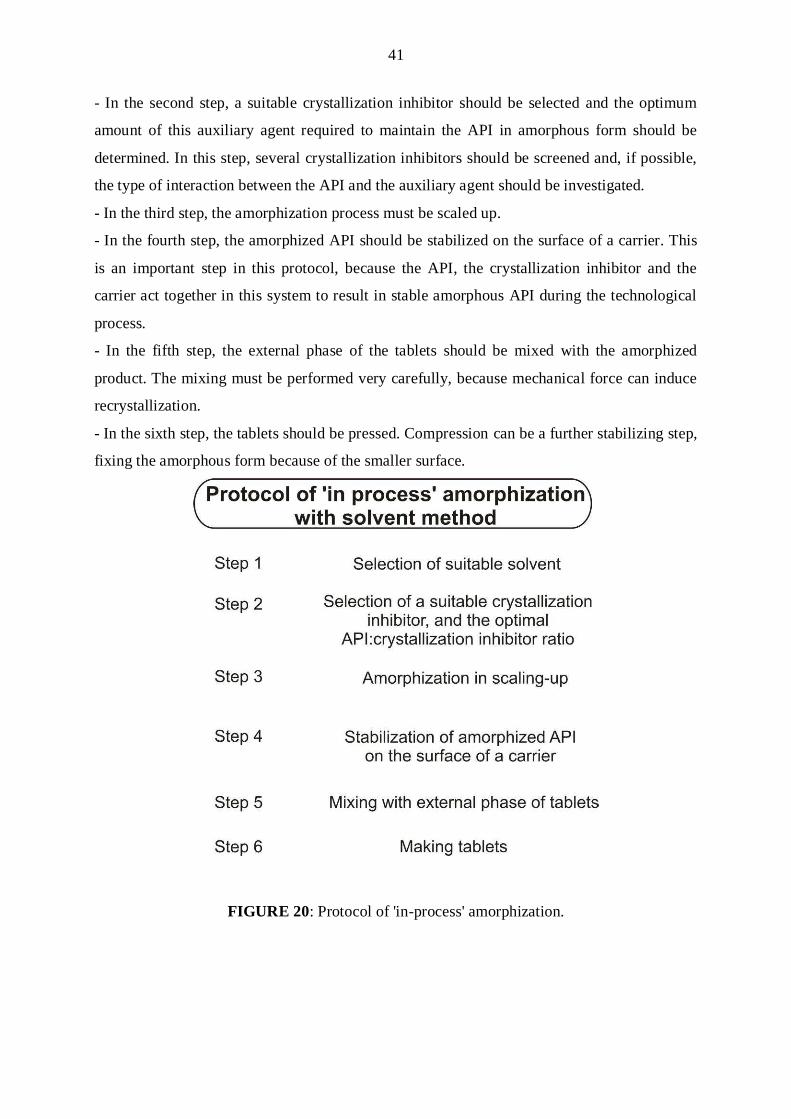
In the light of our results, the following amorphization protocol was developed
(Figure 20):
- In the first step, a suitable solvent for the API should be selected. In this step, it is very
important that the crystalline API should dissolve completely: any crystals remaining in the
system can function as seeds and crystallization can start during evaporation of the solvent.
41
- In the second step, a suitable crystallization inhibitor should be selected and the optimum
amount of this auxiliary agent required to maintain the API in amorphous form should be
determined. In this step, several crystallization inhibitors should be screened and, if possible,
the type of interaction between the API and the auxiliary agent should be investigated.
- In the third step, the amorphization process must be scaled up.
- In the fourth step, the amorphized API should be stabilized on the surface of a carrier. This
is an important step in this protocol, because the API, the crystallization inhibitor and the
carrier act together in this system to result in stable amorphous API during the technological
process.
- In the fifth step, the external phase of the tablets should be mixed with the amorphized
product. The mixing must be performed very carefully, because mechanical force can induce
recrystallization.
- In the sixth step, the tablets should be pressed. Compression can be a further stabilizing step,
fixing the amorphous form because of the smaller surface.
FIGURE 20: Protocol of 'in-process' amorphization.

42
7 SUMMARY
Our first aim was to investigate the literature background of pharmaceutical
amorphization. In this part of this work, the possibilities and the methods of glass formulation
were assembled. Many examples were collected that related to solvent, hot-melt and milling
technology. Some very well-known, frequently amorphized APIs appeared in all methods. For
example, the amorphous form of indomethacin is one of the most widely investigated active
agents in this field. Materials were categorized into 2 groups as concerns their amorphization
ability: poor and good glass-formers. The methods of solid-state analysis with which glassy
materials can be measured were considered.
In the experimental part, CLP was the model API applied in the amorphization. First,
we characterized the glassy property of this API. For this, it was necessary to produce a pure
amorphous form of CLP without any auxiliary agent. Solvent technology was applied and we
chose the most suitable solvent for the procedure. DSC measurement was the appropriate
method through which to characterize the Tm and Tg of CLP. The quotient Tg/Tm of CLP was
0.80, and accordingly this API can be classified as a good glass-former.
In the following step, preliminary stability testing was performed. We tested pure
glassy CLP from the aspect of recrystallization. We found that after about 1 month
recrystallization started, a crystalline fraction appearing in amorphous samples. Because of
this observation, the following step of the development was to identify a suitable
crystallization inhibitor.
A wide range of auxiliary materials were tested as crystallization inhibitors. These
materials can be classified as crystalline, semicrystalline and amorphous agents. The DSC
investigations suggested that Aerosil 200, as amorphous hydrophilic SiO2, was fixed and
stabilized CLP in glassy form. The gelling property of Aerosil 200 in ethanol helped in the
stabilizaton of the product. We confirmed the presence of H-bonding between CLP and the
silanol groups of Aerosil 200 by FT-IR analysis. This secondary bonding means further
stabilization of the amorphous product. We then tested the required amount of the
crystallization inhibitor. The API:auxiliary material ratio chosen was 7:3, and in the
subsequent studies this ratio was applied.
In the scaling-up process, this amorphous product was fixed on the surface of MCC, as
a carrier. This step involved a 28-fold scaling-up. We used two different preparation methods.
43
The better method from the aspects of both the yield and the stability of the product was when
Aerosil 200 was in an alcoholic solution of CLP and gave a gel in it was.
We compressed this intermediate product into tablets with suitable auxiliary agents (as
the external phase of the tablets) in another scaling-up. We produced 1000 tablets and tested
them fresh and after storage. We observed that the final dosage form exhibited better stability
from the aspect of recrystallization. This was attributed to the decrease in the surface area of
the amorphous product.
Finally, summarizing our results and experience, we devised two amorphization
protocol procedures:
- production of a basic pure amorphous product without additives, and
- production of a final dosage form containing amorphous API with ‘in-process’
amorphization.
We introduces the scientific term ‘in-process’ amorphization, into the literature. The general
steps were presented in a summarizing figure and can potentially be applied successfully in
both scientific and industrial fields.
44
8 REFERENCES
Aaltonen, J., Allesø, M., Mirza, S., Koradia, V., Gordon, K. C., & Rantanen, J. (β009). Solid
form screening - A review. Eur. J. Pharm. Biopharm., 71, 23-37.
Ahmed, H., Buckton, G., Rawlins, D. A. (1996). The use of isothermal microcalorimetry in
the study of small degrees of amorphous content of a hydrophobic powder. Int. J. Pharm., 130,
195-201.
Ambike, A. A., Mahadik, K. R., Paradkar, A. (2004). Stability study of amorphous valecoxib.
Int. J. Pharm., 282, 151-162.
Ambike, A. A., Mahadik, K. R., Paradkar, A. (2005). Physico-chemical characterization and
stability study of glassy simvastatin. Drug Dev. Ind. Pharm., 31, 895-899.
Bettinetti, G., Sorrenti, M., Catenacci, L., Ferrari, F., Rossi, S. Polymorphism,
pseudopolymorphism, and amorphism of peracetylated α-, く-, and け-cyclodextrins. J.
Pharmaceut. Biomed., 41, 1205-1211.
Bousquet, A., Castro, B., Germain, J. S. (2003). Polymorphic Form of Clopidogrel Hydrogen
Sulfate. Patent No.: US 6,504,030.
Bozic, D., Z., Dreu, R., Vrečer, F. (β008). Influance of dry granulation on compactibility and
capping tendency of macrolide antibiotic formulation. Int. J. Pharm., 357, 44-54.
Bronlund, J., Paterson, T. (2004). Moisture sorption isotherms for crystalline, amorphous and
predominantly crystalline lactose powders. Int. Dairy J., 14, 247-254.
Bruce, C., Fegely, K. A., Rajabi-Siahboomi, A. R., McGinity, J. W. (2007). Crystal growth
formation in melt extrudates. Int. J. Pharm., 341, 162-172.
Casas, M., Ferrero, C., de Paz, M. V., Jiménez-Castellanos, M. R. (2009). Synthesis and
characterization of new copolymers of ethyl methacrylate grafted on tapioca starch as novel
excipients for direct compression matrix tablets. Eur. Polym. J., 45, 1765-1776.
Chadha, R., Kashid, N., Jain, D. V. S. (2005) Characterization and quantification of
amorphous content in some selected parenteral cephalosorins by calorimetric method. J.
Therm. Anal. Cal., 81, 277-284.
Chen, C.-M., Chou, J. C. H. (1998). Once daily pharmaceutical tablet having a unitary core.
Patent No.: 5,837,379.
Chen, X., Bates, S., Morris, K. R. (2001). Quantifying amorphous content of lactose using
parallel beam X-ray powder diffraction and whole pattern fitting. J. Pharm. Biomed. Anal., 26,
63-72.
Craig, D. Q. M., Royall, P. G., Kett, V. L., & Hopton, M. L. (1999). The relevance of the
amorphous state to pharmaceutical dosage forms: glassy drugs and freeze dried systems. Int. J.
Pharm., 179, 179-207.
45
Cui, Y. (2007) A material science perspective of pharmaceutical solids. Int. J. Pharm., 339, 3-
18.
Delogu, F., Mulas, G., Schiffini, L., Cocco, G. (2004)., Mechanical work and conversion
degree in mechnically induced processes. Mat. Sci. Eng. A, 382, 280-287.
Dilworth, S. E., Buckton, G., Gaisford, S., Ramos, R. (2004). Approaches to determine the
enthalpy of crystallisation, and amorphous content, of lactose from isothermal calorimetric
data. Int. J. Pharm., 284, 83-94.
Fix, I., Steffens, K.-J. (2004). Quantifying low amorphous or crystalline amounts of alpha-
lactose-monohydrate using X-ray powder diffraction, near-infrared spectroscopy, and
Differential Scanning Calorimetry. Drug Dev. Ind. Pharm., 30, 513-523.
Forster, A., Hempenstall, J., Rades, T. (2001). Characterization of glass solutions of poorly
water-soluble drugs produced by melt extrusion with hydrophilic amorphous polymers. J.
pharm. Pharmacol., 53, 303-315.
Forster, A., Hempenstall, J., Tucker, I., Rades, T. (2001). Selection of excipients for melt
extrusion with two poorly water-soluble drugs by solubility parameter calculation and thermal
analysis. Int. J. Pharm., 226, 147-161.
Forster, A., Rades, T., & Hempenstall, J. (2002). Selection of suitable drug and excipient
candidates to prepare glass solutions by melt extrusion for immediate release oral
formulations. Pharm. Technol. Eur., 14, 27-37.
Franks, F. (2002). Scientific and technological aspects of aqueous glasses. Biophys. Chem.,
105, 251-261.
Gaisford, S. (2012). Isothermal microcalorimetry for quantifying amorphous content in
processed pharmaceuticals. Adv. Drug Deliver. Rev., 64, 431-439.
Ghebre-Sellassie, I., Reisch, R. Jr., Parikh, R., Fawzi, M. B., Nesbitt, R. U. (2004). Solid
pharmaceutical dispersions. Patent No.: US 6,677,362 B1.
Giron, D. (2002). Applications of Thermal Analysis and Coupled Techniques in
Pharmaceutical Industry. J. Therm. Anal. Cal., 68, 335-357.
Giron, D., Mutz, M., Garnier, S. (2004). Solid-state of pharmaceutical compaunds. J. Therm.
Anal. Cal., 77, 709-747.
Giron, D., Monnier, S., Mutz, M., Piechon, P., Buser, T., Stowasser, F., Schulze, K., Bellus,
M. (2007). Comparison of quantitative methods for analysis of polyphasic pharmaceuticals. J.
Therm. Anal. Cal., 89, 729-743.
Gombás, Á., Szabó-Révész, P., Kata M., Regdon, G. Jr., Erős, I. (β00β) Quantitative
Determination of α-Lactose Monohydrate by DSC. J. Therm. Anal. Cal., 68, 503-510.
46
Gombás, Á., Antal, I., Szabó-Révész, P., Marton, S., Erős, I. (β00γ). Quantitative
determination of crystallinity of alpha-lactose monohydrate by near infrared spectroscopy
(NIRS). Int. J. Pharm., 256, 25-32.
Gordon, M., Taylor, J. S. (1952). Ideal copolymers and the second-order transitions of
synthetic rubbers. J. Appl. Chem., 2, 493-500.
Hancock, B. C., Carlson, G. T., Ladipo, D. D., Langdon, B. A., Mullarney, M. P. (2002).
Comparison of the mechanical properties of the crystalline and amorphous forms of a drug
substance. Int. J. Pharm., 241, 73-85.
Hancock, B. C., Parks, M. (2000). What is the True Solubility Advantage for Amorphous
Pharmaceuticals? Pharm. Res., 17, 397-403.
Hancock, B. C., Zografi, G. (1997). Characteristics and significance of amorphous state in
pharmaceutical systems. J. Pharm. Sci., 86, 1-12.
Hancock, B. C., Parks, M. (1999). What is the true solubility adventage for amorphous
pharmaceuticals? Pharm. Res., 17, 397-403.
Hédoux, A., Paccou, L., Guinet, Y., Willart, J.-F., Descamps, M. (2009). Using the low-
frequency Raman spectroscopy to analyze the crystallization of amorphous indomethacin. Eur.
J. Pharm. Sci., 38, 156-164.
ICH Q2B: International Conference on Harmonization Q2B, Validation of Analytical
Procedures. 1996. http://www.ich.org/products/guidelines/quality/article/quality-
guidelines.html
ICH Q3C: International Conference on Harmonization Q3C, Impurities: Residual Solvents.
1998. http://www.emea.europa.eu/pdfs/human/ich/028395en.pdf of subordinate document.
Accessed March 1998.
Ignatious, F., Sun, L., Craig, A., Crowe, D., Ho, T., Millan, M. (2006). Amorphous
pharmaceutical compositions. Patent No.: US 2006/0083784 A1
Jonat, S., Albers, P., Gray, A., Schmidt, P. C. (2006). Investigation of the glidant
properties of compcted colloidal silicon dioxide by angle of repose and X-ray
photoelectron spectroscopy. Eur. J. Pharm. Biopharm., 63, 356-359.
Kawashima, Y., Serigano, T., Hino, Tomoaki, Yamamoto, H., Takeuchi, H. (1998).
Design of inhalation dry powder of pranlukast hydrate to improve dispersibility by the
surface modification with light anhydrous silicic acid (AEROSIL 200). Int. J. Pharm.,
173, 243-251.
Kauzmann, W. (1948). The nature of glassy state and the behaviour of liquids at low
temperatures. Chem. Rew., 43, 219-256.
Kerč, J., Srčič, S. (1995), Thermal analysis of glassy pharmaceuticals. Thermochim, Acta,
248, 81-95.
47
Khoo, S.-M., Porter, C. J. H., Charman, W. N. (2000). The formulation of Halofantrine as
either non-solubilising PEG 6000 or solubilising lipid based solid dispersion: Physical
stability and absolute bioavailability assessment. Int. J. Pharm., 205, 65-78.
Kim, J.-S., Kim, M.-S., Park, H. J., Jin, S.-J., Lee, S., Hwang, S.-J. (2008). Physicochemical
properties and oral bioavailability of amorphous atrovastatin hemi-calcium using spry-drying
and SAS process. Int. J. Pharm., 359, 211-219.
Kinoshita, M., Baba, K., Nagayasu, A., Yamabe, K., Azuma, M., Houchi, H., Minakuchi, K.
(2003). Highly stabilized amorphous 3-bis(4-methoxyphenyl)methylene-2-inolinone (TAS-
301) in melt-adsorbed products with silicate compounds. Drug Dev. Ind. Pharm., 29, 523-529.
Kinoshita, M., Baba, K., Nagayasu, A., Yamabe, K., Shimooka, T., Takeichi, Y., Azuma, M.,
Houchi, H., Minakuchi, K. (2002). Improvement of solubility and oral bioavailability of a
poorly water-soluble drug, TAS-301, by its melt-adsorption on a porous calcium silicate. J.
Pharm. Sci., 91, 362-370.
Kürti, L., Kukovecz, Á., Kozma, G., Ambrus, R., Deli, M. A., Szabó-Révész, P. (β011). Study
of the parameters influencing the co-grinding process for the production of meloxicam
nanoparticles. Powder Technol., 212, 210-217.
Lecuga-Ballesteros, D., Bakri, A., Miller, D. P. (2003). Microcalorimetric measurement of the
interactions between water vapour and amorphous pharmaceutical solids. Pharmaceut. Res.,
20, 308-318.
Lefort, L., De Gusseme, A., Willart, J.-F., Danéde, F., Descamps, M. (2004). Solid state NMR
and DSC methods for quantifying the amorphous content in solid dosage forms: an application
to ball-milling of trehalose. Int. J. Pharm., 280, 209-219.
Leuner, C., Dressman, J. (2000). Improving drug solubility for oral delivery using solid
dispersions. Eur. J. Pharm. Biopharm., 50, 47-60.
Li, Y., Han, J., Zhang, G. G. Z., Grant, D. J. W., Suryanarayanan, R. (2000). In situ
dehydration of carbamazepine dehydrate: a novel technique to prepare amorphous anhydrous
carbamazepine. Pharm. Dev. Technol., 5, 257-266.
Lifshitz, R., Kovalevski-Ishai, E., Wizel, S., Maydan, S. A., Lidor-Hadas, R. (2003).
Polymorphs of clopidogrel hydrogensulfate. Patent No.: WO /2003/051362.
Lifshitz, R., Kovalevski-Ishai, E., Wizel, S., Maydan, S. A., Lidor-Hadas, R. (2004). Crystal
forms III, IV, V, and novel amorphous form of clopidogrel hydrogensulfate, processes for
their preparation, processes for the preparation of form I, compositions containing the new
forms and methods of administering the new forms. Patent No.: US 6,767,913 B2.
Lohray, B. B., Lohray, V. B., Pandey, B., Dave, M. G. (2004). Polymorph and amorphous
form of (S)-(+)-clopidogrel bisulfate. Patent No.: WO 2004/081016.
48
Mallick, S., Pattnaik, S., Swain, K., Saha, P. K. De A., Ghoshal, G., Mondal, A. (2008).
Formation of physically stable amorphous phase of ibuprofen by solid state milling with
kaolin. Eur. J. Pharm. Biopharm., 68, 346-351.
Marom, E., Rubnov, S. (2012). Amorphous form of dronedarone. Patent No.:
WO/2012/001673
Martino, P. D., Joiris, E., Gobetto, R., Masic, A., Palmieri, G. F., Martelli, S. (2004).
Ketoprofen-poly(vinylpyrrolidone) physical interaction. J. Cryst. Growth, 265, 302-308.
Maryanoff, C. A., Six, K., Vandecruys, R. (2008). Solvent free amorphous rapamycin. Patent
No.: US 2008/0227982 A1.
Murdande, S. B., Pikal, M. J., Shanker, R. M., Bogner, R. H. (2010). Solubility advantage of
amorphous pharmaceuticals: I. A thermodynamic analysis. J. Pharm. Sci., 99, 1254-1264.
Ohta, K. M:, Fuji, M., Takei, T., Chikazawa, M. (2003). Effect of geometric structure
and surface wettability of glidant on tablet hardness. Int. J. Pharm., 262, 75-82.
Panchagnula, R., Bhardwaj, V. (2008). Effect of amorphous content on dissolution
characteristics of rifampicin. Drug Dev. Ind. Pharm., 34, 642-649.
Paradkar, A., Ambike, A. A., Jadhav, B. K., Mahadik, K. R. (2004) Characterization of
curcumin-PVP solid dispersion obtained by spray draying.
Parthasaradhi, R. B., Rathnakar, R. K., Raji, R. R., Muralidhara, R. D. (2006). Amorphous
clopidogrel hydrogen sulfate. Patent No.: US 2006/0100231 A1.
Pokharkar, V. B., Mandpe, L. P., Padamwar, M. N., Ambike, A. A., Mahadik, K. R., &
Paradkar, A. (2006). Development, characterization and stabilization of amorphous form of a
low Tg drug. Powder Technol., 167, 20-25.
Reddy, B. P., Reddy, K. R., Reddy, R. R., Reddy, D. M. (2009). Amorphous esomeprazole
hydrate. Patent No.: US 7,563,812 B2.
Rodríguez-Spong, B., Price, C. P., Jayasankar, A., Matzger, A. J., Rodríguez-Hornedo, N.
(2004). General principles of pharmaceutical solid polymorphism: a supramolecular
perspective. Adv. Drug Deliver. Rev., 56, 241-274.
Rossmann, M., Braeuer, A., Dowy, S., Gottfried Gallinger, T., Leipertz, A., Schluecker, E.
(2012). Solute solubility as criterion fort he appearance of amorphous particle precipitation or
crystallization in the supercritical antisolvent (SAS) process. J. of Supercritical Fluids, 66,
350-358.
Royall, P. G., Gaisford, S. (2005). Application of solution calorimetry in pharmaceutical and
biopharmaceutical research. Curr. Pharm. Biotech., 6, 215-222.
Rupprecht, H., Kindl, G. (1974). Sorption of drugs on surface-treated silicic acids. Pharmazie,
29, 350-1.
49
Saerens, L., Dierickx, L., Quinten, T., Adriaensens, P., Carleer, R., Vervaet, C., Remon, J. P.,
De Beer, T. (2012). In-line NIR spectroscopy for the understanding of polymer-drug
interaction during pharmaceutical hot-melt extrusion. Eur. J. Pharm. Biopharm., 81, 230-237.
Sethia, S., Squillante, E., (2004). Solid dispersion of carbamazepine in PVP K30 by
conventional solvent evaporation and supercritical methods. Int. J. Pharm., 272, 1-10.
Sherwood, B. E., Staniforth, J. H., Hunter, E. A. (2003). Pharmaceutical excipient having
impoved compressibility. Patent No.: US 6,521,261 B.
Singhal, D., Curatolo, W. (2004) Drug polymorphism and dosage form design: a practical
perspective. Adv. Drug Deliver. Rev., 56, 335-347.
Strachan, C. J., Rades, T., Newnham, D. A., Gordon, K. C., Pepper, M., Taday, P. F. (2004).
Using tetrahertz pulsed spectroscopy to study crystallinity of pharmaceutical materials. Chem.
Phys. Lett., 390, 20-24.
Szabó-Révész, P., Laczkovich, O., Ambrus, R., Szűts, A., Aigner, Z. (β007). Protocols for
amorphization of crystalline solids through the application of pharmaceutical technological
processes. Eur. J. Pharm. Sci., 32S, S18.
Takeuchi, H., Nagira, S., Yamamoto, H., Kawashima, Y. (2004). Solid dispersion particles of
tolbutamide prepared with fine silica particles by the spray-drying method. Powder Technol.,
141, 187-195.
Takeuchi, H., Nagira, S., Yamamoto, H., Kawashima, Y. (2005). Solid dispersion particles of
amorphous indomethacin with fine porous silica particles by using spray-drying method. Int.
J. Pharm., 293, 155-164.
Tantishaiyakul, V., Kaewnopparat, N., Ingkatawornwong, S. (1999). Properties of solid
dispersions of piroxicam in polyvinylpyrrolidone. Int. J. Pharm., 181, 143-151.
Tayel, S. A., Soliman, I. I., Louis, D. (2008). Improvement of dissolution properties of
Carbamazepine through application of the liquisolid tablet technique. Eur. J. Pharm.
Biopharm., 69, 342-347.
Taylor, L. S., Zografi, G. (1998). The quantitative analysis of crystallinity using FT-Raman
spectroscopy. Pharm. Res., 15, 755-761.
Trasi, N. S., Boerrigter, S. X. M., Byrn, S. R., Carvajal, T. M. (2011). Investigating the effect
of dehydration condition on the compactability of glucose. Int. J. Pharm., 406, 55-61.
Uvarov, V., Popov, I. (2008). Development and metrological characterization of quantitative
X-ray diffraction phase analysis for the mixture of clopidogrel bisulphate polymorphs. J.
Pharmaceut. Biomed., 46, 676-682.
Vemavarapu, C., Mollan, M. J., Needham, T. E. (2009). Coprecipitation of pharmaceutical
actives and their structurally related additives by the RESS process. Powder Technol., 189,
444-453.
50
Vogt, M., Kunath, K., Dressmann, J. B. (2008). Dissolution enhancement of fenofibrate by
micronization, cogrinding and spry-drying: Comparison with commercial preparations. Eur. J.
Pharm. Biopharm., 68, 283-288.
Vollenbroek, J., Hebbink, G. A., Ziffels, S., Steckel, H. (2010). Determination of low levels of
amorphous content in inhalation grade lactose by moisture sorption isotherms. Int. J. Pharm.,
395, 62-70.
Watanabe, T., Hasegawa, S., Wakiyama, N., Kusai, A., Senna, M. (2003). Comparison
between polyvinylpyrrolidone and silica nanoparticles as carriers for indomethacin in solid
state dispersion. Int. J. Pharm., 250, 283-286.
Watanabe, T., Ohno, I., Wakiyama, N., Kusai, A., Senna, M. (2002). Stabilization of
amorphous indomethacin by co-grinding in a ternary mixture. Int. J. Pharm., 241, 103-111.
Watanabe, T., Wakiyama, N., Usui, F., Ikeda, M., Isobe, T., sienna, M. (2001). Stability of
amorphous indomethacin compounded with silica. Int. J. Pharm., 226, 81-91.
Weuts, I., Kempen, D., Decorte, A., Verreck, G., Peeters, J., Brewster, M., Mooter, G. V. Den.
(2004). Phase behaviour analysis of solid dispersion of loperamide and two structurally related
compaund with the polymers PVP-K30 and PVP-VA64. Eur. J. Pharm. Sci., 22, 375-385.
Weuts, I., Kempen, D., Six, K., Peeters, J., Werreck, G., Brewster, M., Mooter, G. V. Den.
(2003). Evaluation of different calorimetric methods to determine the glass transition
temperature and molecular mobility belowe Tg for amorphous drugs. Int. J. Pharm., 259, 17-
25.
Widjaja, E., Kanaujia, P., Lau, G., Kiong Ng, W., Garland, M., Saal, C., Hanefeld, A.,
Fischbach, M., Maio, M., Tan, R. B. H. (2011). Detection of trace crystallinity in an
amorphous system using Raman microscopy and chemometric analysis. Eur. J. Pharm. Sci.,
42, 45-54.
Yamashita, K., Nakate, T., Okimoto, K., Ohike, A., Tokunaga, Y., Ibuki, R., Higaki, K.,
Kimura, T. (2003). Establishment of new preparation method for solid dispersion formulation
of tacrolimus. Int. J. Pharm., 267, 79-91.
Yu, L. (2001). Amorphous pharmaceutical solids: preparation, characterization and
stabilization. Adv. Drug Deliver. Rev., 48, 27-42.
Yu, L., De Villiers, M. M., Wu, T. (2008). Inhibiting surface enhanced crystallization of
amorphous pharmaceuticals with ultrathin coatings. Patent No.: US 2008/0233157 A1.
Zhang, G. G. Z., Law, D., Schmitt, E. A., Qiu, Y. (2004) Phase transformation consideration
during process development and manufacture of solid oral dosage forms. Adv. Drug Deliver.
Rev., 56, 371-390.
Ziewiec, K., Bryla, K., Blachowski, A., Ruebenbauer, K., Mucha, D. (2009). Characterization
of microstructures and amorphization in Ni-Cu-Fe-P system. J. Alloy Compd., 483, 585-588.
51
ACKNOWLEDGEMENTS
First of all, I would like to express my warmest thanks to my supervisor, the head of
the Department of Pharmaceutical Technology and the head of PhD Programme
Pharmaceutical Technology,
Prof. Dr. Piroska Szabó-Révész DSc,
for her generous help and advice in my scientific work, and for critically reviewing my
manuscript. I am grateful deeply to her for her kindness and support from my first steps in the
scientific field of pharmaceutical technology.
I would like to thank to
Prof. Dr. István Erős DSc, the then head of Department in 2002, when I started my PhD work, for the possibility to take
part in the PhD studies.
I would like to thank for the support of the
Centenarium Foundation of Gedeon Richter Ltd
and
TÁMOP research project: Development of teranostics in
cardiovascular, metabolics, and inflammatory diseases (TÁMOP-
4.2.2-08/1-2008-0013).
My thanks are also due to all of my
colleagues in the Department of Pharmaceutical Technology
for providing such a favourable atmosphere.
I am deeply grateful to my family for their patience and love.
ANNEX

I.

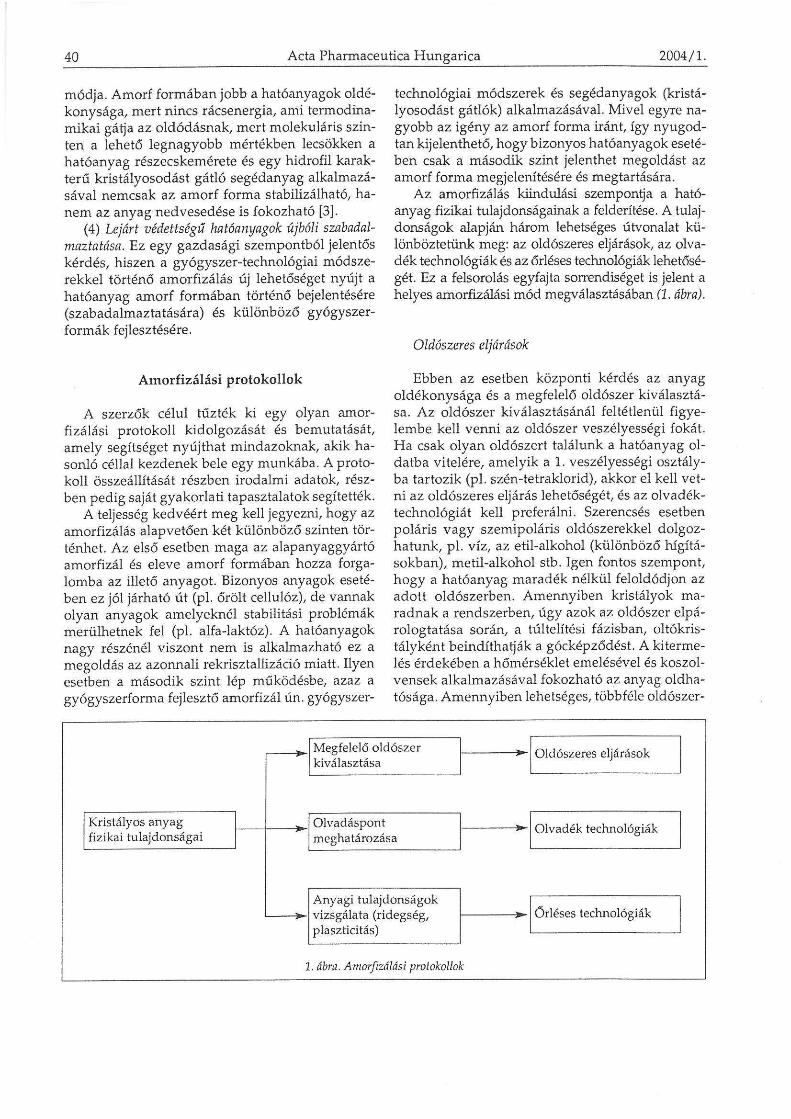

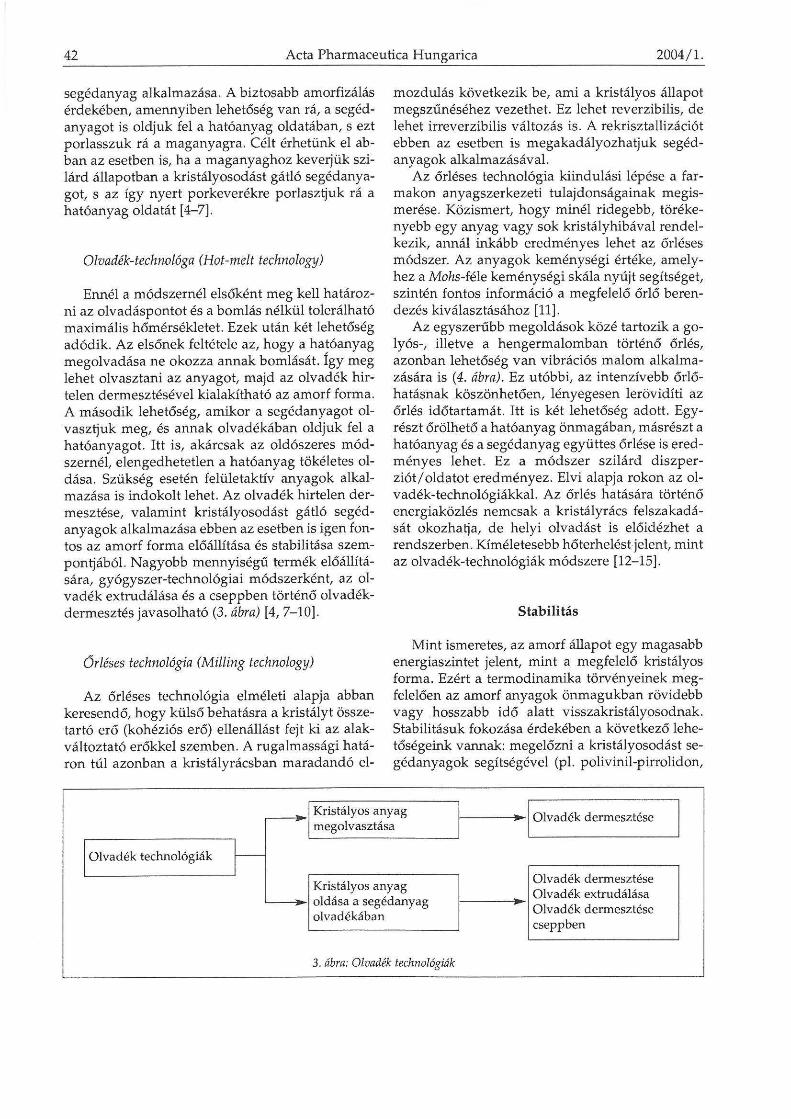
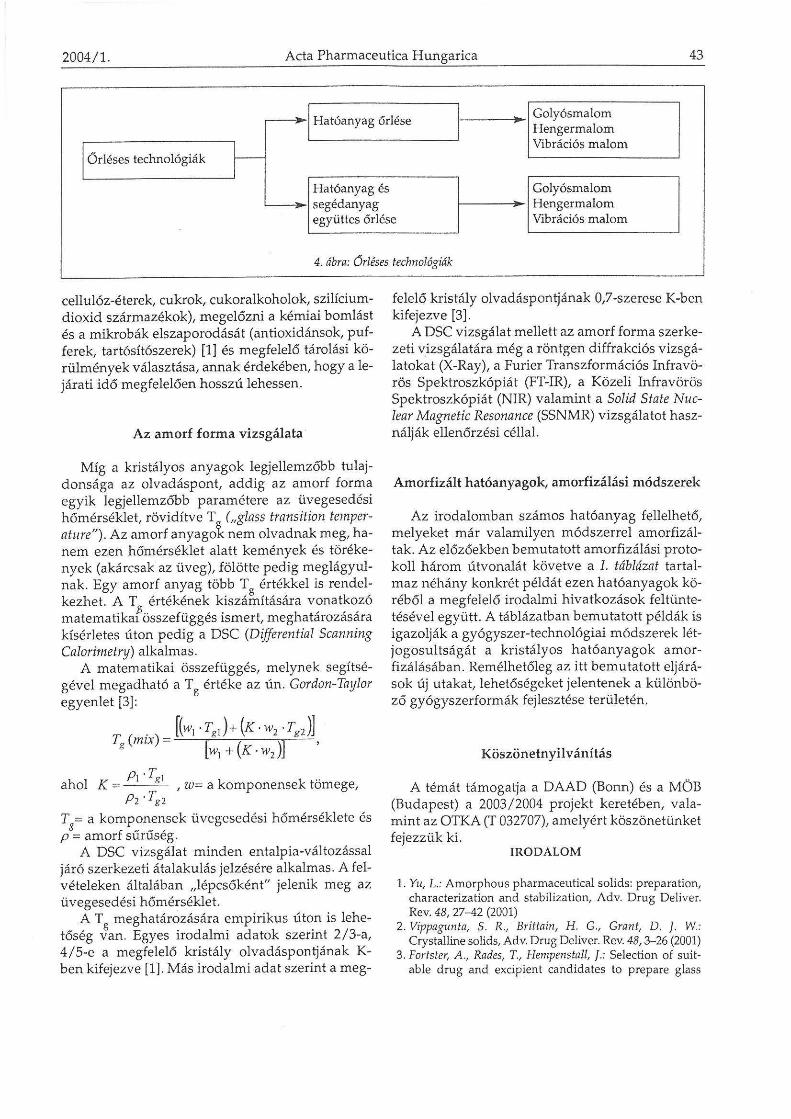


II.
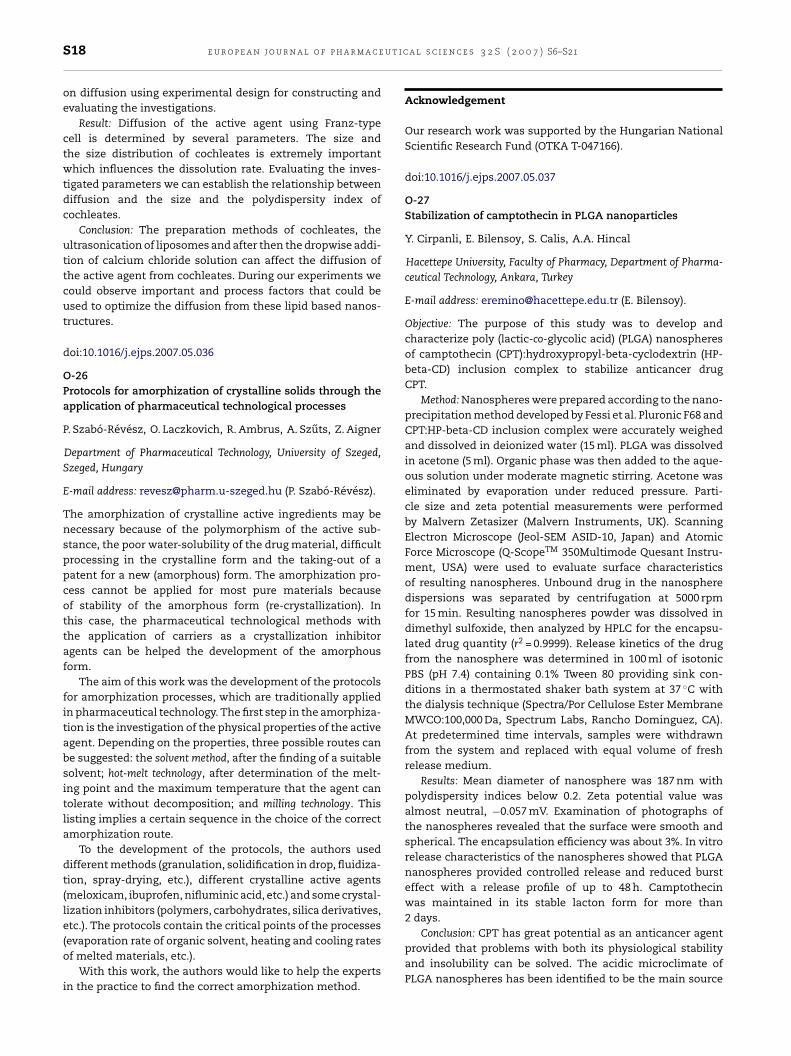
S18 e u r o p e a n j o u r n a l o f p h a r m a c e u t i c a l s c i e n c e s 3 2 S ( 2 0 0 7 ) S6–S21
on diffusion using experimental design for constructing and
evaluating the investigations.
Result: Diffusion of the active agent using Franz-type
cell is determined by several parameters. The size and
the size distribution of cochleates is extremely important
which influences the dissolution rate. Evaluating the inves-
tigated parameters we can establish the relationship between
diffusion and the size and the polydispersity index of
cochleates.
Conclusion: The preparation methods of cochleates, the
ultrasonication of liposomes and after then the dropwise addi-
tion of calcium chloride solution can affect the diffusion of
the active agent from cochleates. During our experiments we
could observe important and process factors that could be
used to optimize the diffusion from these lipid based nanos-
tructures.
doi:10.1016/j.ejps.2007.05.036
O-26
Protocols for amorphization of crystalline solids through the
application of pharmaceutical technological processes
P. Szabo-Revesz, O. Laczkovich, R. Ambrus, A. Szuts, Z. Aigner
Department of Pharmaceutical Technology, University of Szeged,
Szeged, Hungary
E-mail address: [email protected] (P. Szabo-Revesz).
The amorphization of crystalline active ingredients may be
necessary because of the polymorphism of the active sub-
stance, the poor water-solubility of the drug material, difficult
processing in the crystalline form and the taking-out of a
patent for a new (amorphous) form. The amorphization pro-
cess cannot be applied for most pure materials because
of stability of the amorphous form (re-crystallization). In
this case, the pharmaceutical technological methods with
the application of carriers as a crystallization inhibitor
agents can be helped the development of the amorphous
form.
The aim of this work was the development of the protocols
for amorphization processes, which are traditionally applied
in pharmaceutical technology. The first step in the amorphiza-
tion is the investigation of the physical properties of the active
agent. Depending on the properties, three possible routes can
be suggested: the solvent method, after the finding of a suitable
solvent; hot-melt technology, after determination of the melt-
ing point and the maximum temperature that the agent can
tolerate without decomposition; and milling technology. This
listing implies a certain sequence in the choice of the correct
amorphization route.
To the development of the protocols, the authors used
different methods (granulation, solidification in drop, fluidiza-
tion, spray-drying, etc.), different crystalline active agents
(meloxicam, ibuprofen, nifluminic acid, etc.) and some crystal-
lization inhibitors (polymers, carbohydrates, silica derivatives,
etc.). The protocols contain the critical points of the processes
(evaporation rate of organic solvent, heating and cooling rates
of melted materials, etc.).
With this work, the authors would like to help the experts
in the practice to find the correct amorphization method.
Acknowledgement
Our research work was supported by the Hungarian National
Scientific Research Fund (OTKA T-047166).
doi:10.1016/j.ejps.2007.05.037
O-27
Stabilization of camptothecin in PLGA nanoparticles
Y. Cirpanli, E. Bilensoy, S. Calis, A.A. Hincal
Hacettepe University, Faculty of Pharmacy, Department of Pharma-
ceutical Technology, Ankara, Turkey
E-mail address: [email protected] (E. Bilensoy).
Objective: The purpose of this study was to develop and
characterize poly (lactic-co-glycolic acid) (PLGA) nanospheres
of camptothecin (CPT):hydroxypropyl-beta-cyclodextrin (HP-
beta-CD) inclusion complex to stabilize anticancer drug
CPT.
Method: Nanospheres were prepared according to the nano-
precipitation method developed by Fessi et al. Pluronic F68 and
CPT:HP-beta-CD inclusion complex were accurately weighed
and dissolved in deionized water (15 ml). PLGA was dissolved
in acetone (5 ml). Organic phase was then added to the aque-
ous solution under moderate magnetic stirring. Acetone was
eliminated by evaporation under reduced pressure. Parti-
cle size and zeta potential measurements were performed
by Malvern Zetasizer (Malvern Instruments, UK). Scanning
Electron Microscope (Jeol-SEM ASID-10, Japan) and Atomic
Force Microscope (Q-ScopeTM 350Multimode Quesant Instru-
ment, USA) were used to evaluate surface characteristics
of resulting nanospheres. Unbound drug in the nanosphere
dispersions was separated by centrifugation at 5000 rpm
for 15 min. Resulting nanospheres powder was dissolved in
dimethyl sulfoxide, then analyzed by HPLC for the encapsu-
lated drug quantity (r2 = 0.9999). Release kinetics of the drug
from the nanosphere was determined in 100 ml of isotonic
PBS (pH 7.4) containing 0.1% Tween 80 providing sink con-
ditions in a thermostated shaker bath system at 37 ◦C with
the dialysis technique (Spectra/Por Cellulose Ester Membrane
MWCO:100,000 Da, Spectrum Labs, Rancho Dominguez, CA).
At predetermined time intervals, samples were withdrawn
from the system and replaced with equal volume of fresh
release medium.
Results: Mean diameter of nanosphere was 187 nm with
polydispersity indices below 0.2. Zeta potential value was
almost neutral, −0.057 mV. Examination of photographs of
the nanospheres revealed that the surface were smooth and
spherical. The encapsulation efficiency was about 3%. In vitro
release characteristics of the nanospheres showed that PLGA
nanospheres provided controlled release and reduced burst
effect with a release profile of up to 48 h. Camptothecin
was maintained in its stable lacton form for more than
2 days.
Conclusion: CPT has great potential as an anticancer agent
provided that problems with both its physiological stability
and insolubility can be solved. The acidic microclimate of
PLGA nanospheres has been identified to be the main source

III.
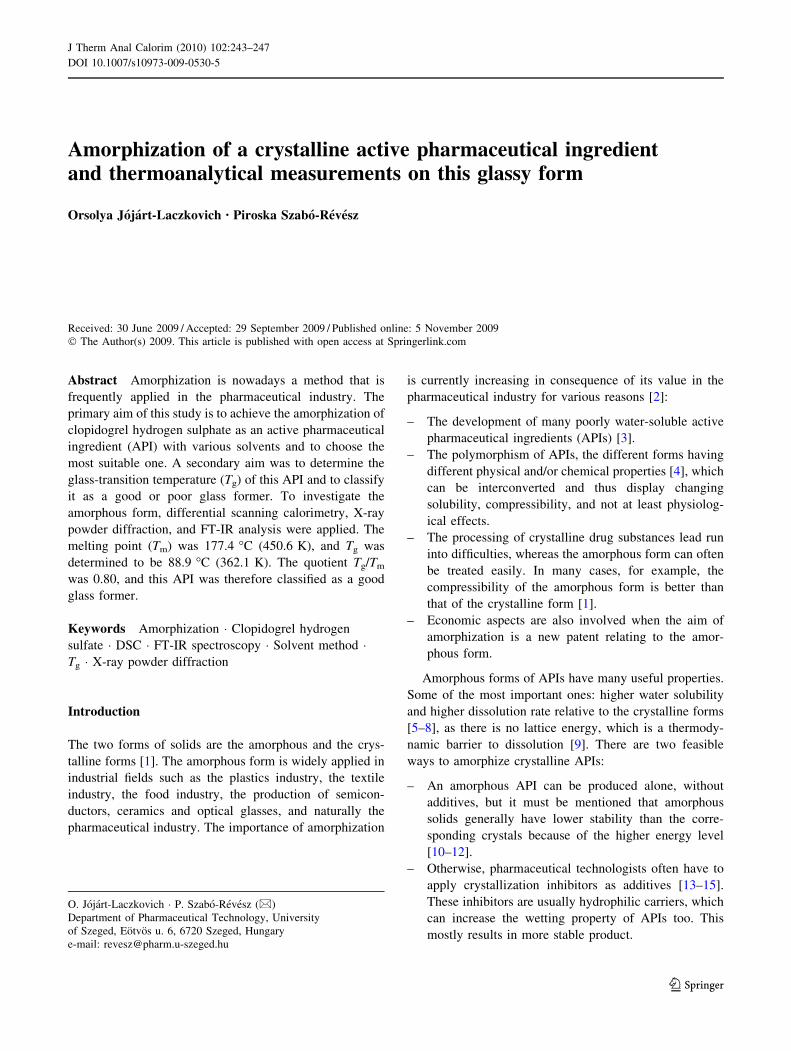
Amorphization of a crystalline active pharmaceutical ingredientand thermoanalytical measurements on this glassy form
Orsolya Jojart-Laczkovich • Piroska Szabo-Revesz
Received: 30 June 2009 / Accepted: 29 September 2009 / Published online: 5 November 2009
� The Author(s) 2009. This article is published with open access at Springerlink.com
Abstract Amorphization is nowadays a method that is
frequently applied in the pharmaceutical industry. The
primary aim of this study is to achieve the amorphization of
clopidogrel hydrogen sulphate as an active pharmaceutical
ingredient (API) with various solvents and to choose the
most suitable one. A secondary aim was to determine the
glass-transition temperature (Tg) of this API and to classify
it as a good or poor glass former. To investigate the
amorphous form, differential scanning calorimetry, X-ray
powder diffraction, and FT-IR analysis were applied. The
melting point (Tm) was 177.4 �C (450.6 K), and Tg was
determined to be 88.9 �C (362.1 K). The quotient Tg/Tmwas 0.80, and this API was therefore classified as a good
glass former.
Keywords Amorphization � Clopidogrel hydrogen
sulfate � DSC � FT-IR spectroscopy � Solvent method �
Tg � X-ray powder diffraction
Introduction
The two forms of solids are the amorphous and the crys-
talline forms [1]. The amorphous form is widely applied in
industrial fields such as the plastics industry, the textile
industry, the food industry, the production of semicon-
ductors, ceramics and optical glasses, and naturally the
pharmaceutical industry. The importance of amorphization
is currently increasing in consequence of its value in the
pharmaceutical industry for various reasons [2]:
– The development of many poorly water-soluble active
pharmaceutical ingredients (APIs) [3].
– The polymorphism of APIs, the different forms having
different physical and/or chemical properties [4], which
can be interconverted and thus display changing
solubility, compressibility, and not at least physiolog-
ical effects.
– The processing of crystalline drug substances lead run
into difficulties, whereas the amorphous form can often
be treated easily. In many cases, for example, the
compressibility of the amorphous form is better than
that of the crystalline form [1].
– Economic aspects are also involved when the aim of
amorphization is a new patent relating to the amor-
phous form.
Amorphous forms of APIs have many useful properties.
Some of the most important ones: higher water solubility
and higher dissolution rate relative to the crystalline forms
[5–8], as there is no lattice energy, which is a thermody-
namic barrier to dissolution [9]. There are two feasible
ways to amorphize crystalline APIs:
– An amorphous API can be produced alone, without
additives, but it must be mentioned that amorphous
solids generally have lower stability than the corre-
sponding crystals because of the higher energy level
[10–12].
– Otherwise, pharmaceutical technologists often have to
apply crystallization inhibitors as additives [13–15].
These inhibitors are usually hydrophilic carriers, which
can increase the wetting property of APIs too. This
mostly results in more stable product.
O. Jojart-Laczkovich � P. Szabo-Revesz (&)
Department of Pharmaceutical Technology, University
of Szeged, Eotvos u. 6, 6720 Szeged, Hungary
e-mail: [email protected]
123
J Therm Anal Calorim (2010) 102:243–247
DOI 10.1007/s10973-009-0530-5
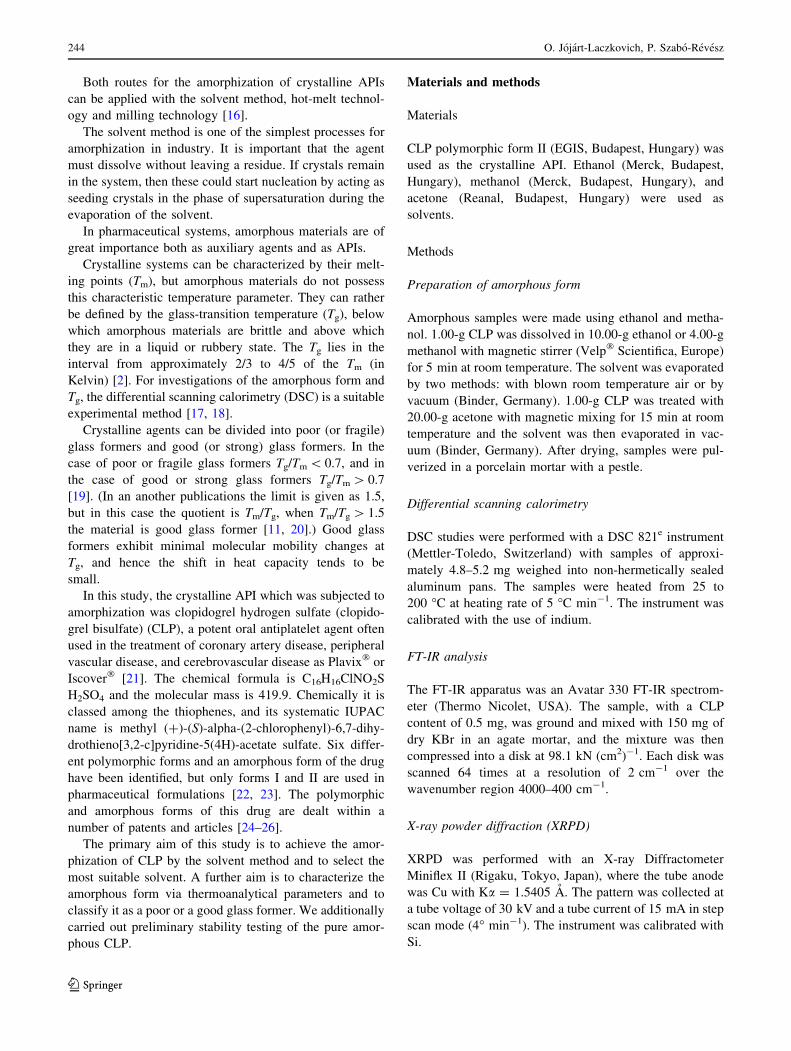
Both routes for the amorphization of crystalline APIs
can be applied with the solvent method, hot-melt technol-
ogy and milling technology [16].
The solvent method is one of the simplest processes for
amorphization in industry. It is important that the agent
must dissolve without leaving a residue. If crystals remain
in the system, then these could start nucleation by acting as
seeding crystals in the phase of supersaturation during the
evaporation of the solvent.
In pharmaceutical systems, amorphous materials are of
great importance both as auxiliary agents and as APIs.
Crystalline systems can be characterized by their melt-
ing points (Tm), but amorphous materials do not possess
this characteristic temperature parameter. They can rather
be defined by the glass-transition temperature (Tg), below
which amorphous materials are brittle and above which
they are in a liquid or rubbery state. The Tg lies in the
interval from approximately 2/3 to 4/5 of the Tm (in
Kelvin) [2]. For investigations of the amorphous form and
Tg, the differential scanning calorimetry (DSC) is a suitable
experimental method [17, 18].
Crystalline agents can be divided into poor (or fragile)
glass formers and good (or strong) glass formers. In the
case of poor or fragile glass formers Tg/Tm\ 0.7, and in
the case of good or strong glass formers Tg/Tm[ 0.7
[19]. (In an another publications the limit is given as 1.5,
but in this case the quotient is Tm/Tg, when Tm/Tg[ 1.5
the material is good glass former [11, 20].) Good glass
formers exhibit minimal molecular mobility changes at
Tg, and hence the shift in heat capacity tends to be
small.
In this study, the crystalline API which was subjected to
amorphization was clopidogrel hydrogen sulfate (clopido-
grel bisulfate) (CLP), a potent oral antiplatelet agent often
used in the treatment of coronary artery disease, peripheral
vascular disease, and cerebrovascular disease as Plavix� or
Iscover� [21]. The chemical formula is C16H16ClNO2S
H2SO4 and the molecular mass is 419.9. Chemically it is
classed among the thiophenes, and its systematic IUPAC
name is methyl (?)-(S)-alpha-(2-chlorophenyl)-6,7-dihy-
drothieno[3,2-c]pyridine-5(4H)-acetate sulfate. Six differ-
ent polymorphic forms and an amorphous form of the drug
have been identified, but only forms I and II are used in
pharmaceutical formulations [22, 23]. The polymorphic
and amorphous forms of this drug are dealt within a
number of patents and articles [24–26].
The primary aim of this study is to achieve the amor-
phization of CLP by the solvent method and to select the
most suitable solvent. A further aim is to characterize the
amorphous form via thermoanalytical parameters and to
classify it as a poor or a good glass former. We additionally
carried out preliminary stability testing of the pure amor-
phous CLP.
Materials and methods
Materials
CLP polymorphic form II (EGIS, Budapest, Hungary) was
used as the crystalline API. Ethanol (Merck, Budapest,
Hungary), methanol (Merck, Budapest, Hungary), and
acetone (Reanal, Budapest, Hungary) were used as
solvents.
Methods
Preparation of amorphous form
Amorphous samples were made using ethanol and metha-
nol. 1.00-g CLP was dissolved in 10.00-g ethanol or 4.00-g
methanol with magnetic stirrer (Velp� Scientifica, Europe)
for 5 min at room temperature. The solvent was evaporated
by two methods: with blown room temperature air or by
vacuum (Binder, Germany). 1.00-g CLP was treated with
20.00-g acetone with magnetic mixing for 15 min at room
temperature and the solvent was then evaporated in vac-
uum (Binder, Germany). After drying, samples were pul-
verized in a porcelain mortar with a pestle.
Differential scanning calorimetry
DSC studies were performed with a DSC 821e instrument
(Mettler-Toledo, Switzerland) with samples of approxi-
mately 4.8–5.2 mg weighed into non-hermetically sealed
aluminum pans. The samples were heated from 25 to
200 �C at heating rate of 5 �C min-1. The instrument was
calibrated with the use of indium.
FT-IR analysis
The FT-IR apparatus was an Avatar 330 FT-IR spectrom-
eter (Thermo Nicolet, USA). The sample, with a CLP
content of 0.5 mg, was ground and mixed with 150 mg of
dry KBr in an agate mortar, and the mixture was then
compressed into a disk at 98.1 kN (cm2)-1. Each disk was
scanned 64 times at a resolution of 2 cm-1 over the
wavenumber region 4000–400 cm-1.
X-ray powder diffraction (XRPD)
XRPD was performed with an X-ray Diffractometer
Miniflex II (Rigaku, Tokyo, Japan), where the tube anode
was Cu with Ka = 1.5405 A. The pattern was collected at
a tube voltage of 30 kV and a tube current of 15 mA in step
scan mode (4� min-1). The instrument was calibrated with
Si.
244 O. Jojart-Laczkovich, P. Szabo-Revesz
123
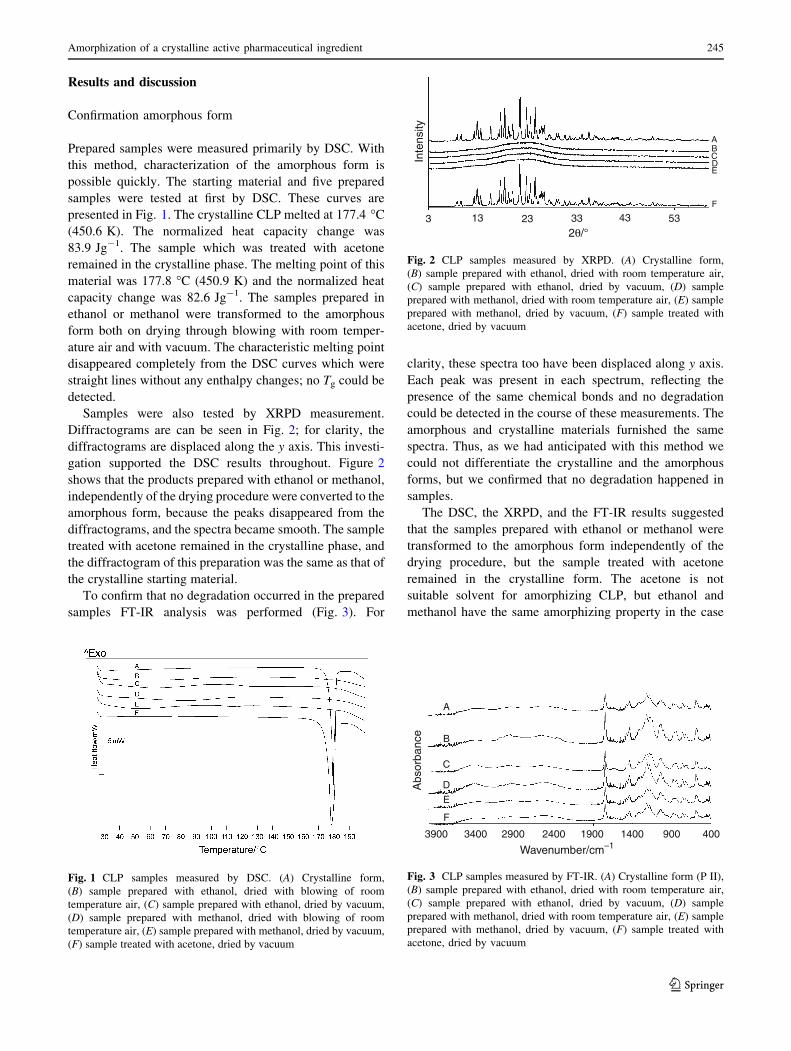
Results and discussion
Confirmation amorphous form
Prepared samples were measured primarily by DSC. With
this method, characterization of the amorphous form is
possible quickly. The starting material and five prepared
samples were tested at first by DSC. These curves are
presented in Fig. 1. The crystalline CLP melted at 177.4 �C
(450.6 K). The normalized heat capacity change was
83.9 Jg-1. The sample which was treated with acetone
remained in the crystalline phase. The melting point of this
material was 177.8 �C (450.9 K) and the normalized heat
capacity change was 82.6 Jg-1. The samples prepared in
ethanol or methanol were transformed to the amorphous
form both on drying through blowing with room temper-
ature air and with vacuum. The characteristic melting point
disappeared completely from the DSC curves which were
straight lines without any enthalpy changes; no Tg could be
detected.
Samples were also tested by XRPD measurement.
Diffractograms are can be seen in Fig. 2; for clarity, the
diffractograms are displaced along the y axis. This investi-
gation supported the DSC results throughout. Figure 2
shows that the products prepared with ethanol or methanol,
independently of the drying procedure were converted to the
amorphous form, because the peaks disappeared from the
diffractograms, and the spectra became smooth. The sample
treated with acetone remained in the crystalline phase, and
the diffractogram of this preparation was the same as that of
the crystalline starting material.
To confirm that no degradation occurred in the prepared
samples FT-IR analysis was performed (Fig. 3). For
clarity, these spectra too have been displaced along y axis.
Each peak was present in each spectrum, reflecting the
presence of the same chemical bonds and no degradation
could be detected in the course of these measurements. The
amorphous and crystalline materials furnished the same
spectra. Thus, as we had anticipated with this method we
could not differentiate the crystalline and the amorphous
forms, but we confirmed that no degradation happened in
samples.
The DSC, the XRPD, and the FT-IR results suggested
that the samples prepared with ethanol or methanol were
transformed to the amorphous form independently of the
drying procedure, but the sample treated with acetone
remained in the crystalline form. The acetone is not
suitable solvent for amorphizing CLP, but ethanol and
methanol have the same amorphizing property in the case
Fig. 1 CLP samples measured by DSC. (A) Crystalline form,
(B) sample prepared with ethanol, dried with blowing of room
temperature air, (C) sample prepared with ethanol, dried by vacuum,
(D) sample prepared with methanol, dried with blowing of room
temperature air, (E) sample prepared with methanol, dried by vacuum,
(F) sample treated with acetone, dried by vacuum
Inte
nsity
3 13 23 33 43 53
2θ/°
F
ABC
ED
Fig. 2 CLP samples measured by XRPD. (A) Crystalline form,
(B) sample prepared with ethanol, dried with room temperature air,
(C) sample prepared with ethanol, dried by vacuum, (D) sample
prepared with methanol, dried with room temperature air, (E) sample
prepared with methanol, dried by vacuum, (F) sample treated with
acetone, dried by vacuum
3900 3400 2900 2400 1900 1400
Wavenumber/cm–1
Absorb
ance
900 400
A
B
C
D
E
F
Fig. 3 CLP samples measured by FT-IR. (A) Crystalline form (P II),
(B) sample prepared with ethanol, dried with room temperature air,
(C) sample prepared with ethanol, dried by vacuum, (D) sample
prepared with methanol, dried with room temperature air, (E) sample
prepared with methanol, dried by vacuum, (F) sample treated with
acetone, dried by vacuum
Amorphization of a crystalline active pharmaceutical ingredient 245
123
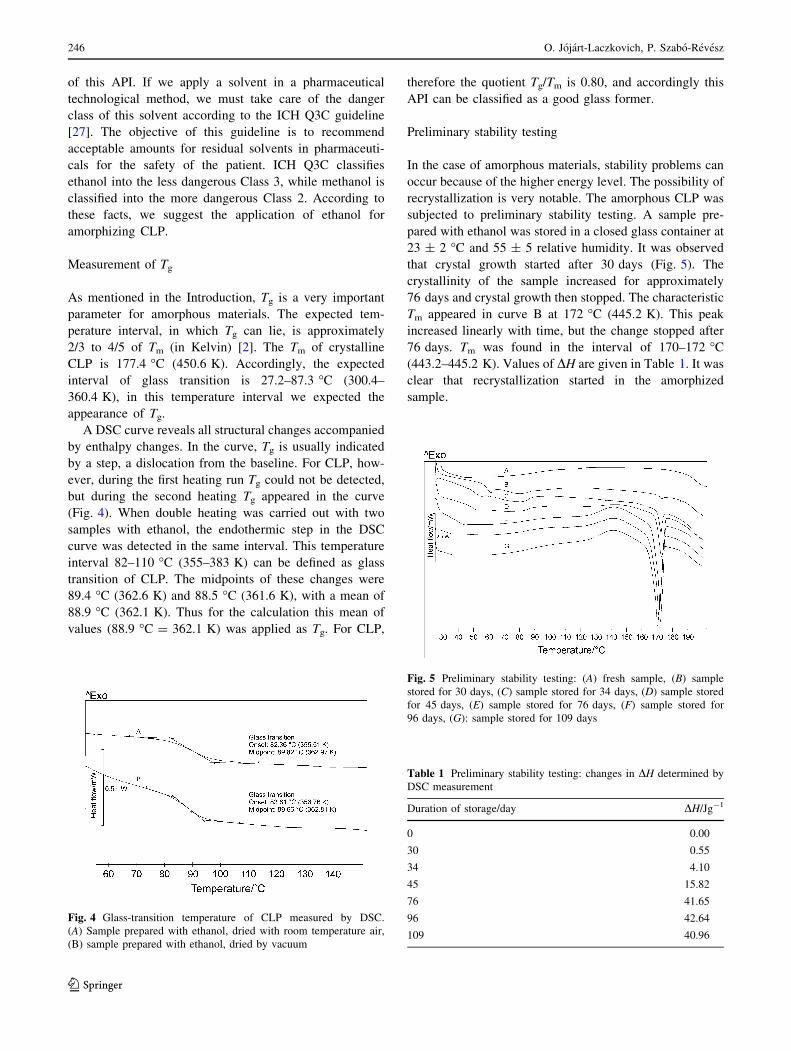
of this API. If we apply a solvent in a pharmaceutical
technological method, we must take care of the danger
class of this solvent according to the ICH Q3C guideline
[27]. The objective of this guideline is to recommend
acceptable amounts for residual solvents in pharmaceuti-
cals for the safety of the patient. ICH Q3C classifies
ethanol into the less dangerous Class 3, while methanol is
classified into the more dangerous Class 2. According to
these facts, we suggest the application of ethanol for
amorphizing CLP.
Measurement of Tg
As mentioned in the Introduction, Tg is a very important
parameter for amorphous materials. The expected tem-
perature interval, in which Tg can lie, is approximately
2/3 to 4/5 of Tm (in Kelvin) [2]. The Tm of crystalline
CLP is 177.4 �C (450.6 K). Accordingly, the expected
interval of glass transition is 27.2–87.3 �C (300.4–
360.4 K), in this temperature interval we expected the
appearance of Tg.
A DSC curve reveals all structural changes accompanied
by enthalpy changes. In the curve, Tg is usually indicated
by a step, a dislocation from the baseline. For CLP, how-
ever, during the first heating run Tg could not be detected,
but during the second heating Tg appeared in the curve
(Fig. 4). When double heating was carried out with two
samples with ethanol, the endothermic step in the DSC
curve was detected in the same interval. This temperature
interval 82–110 �C (355–383 K) can be defined as glass
transition of CLP. The midpoints of these changes were
89.4 �C (362.6 K) and 88.5 �C (361.6 K), with a mean of
88.9 �C (362.1 K). Thus for the calculation this mean of
values (88.9 �C = 362.1 K) was applied as Tg. For CLP,
therefore the quotient Tg/Tm is 0.80, and accordingly this
API can be classified as a good glass former.
Preliminary stability testing
In the case of amorphous materials, stability problems can
occur because of the higher energy level. The possibility of
recrystallization is very notable. The amorphous CLP was
subjected to preliminary stability testing. A sample pre-
pared with ethanol was stored in a closed glass container at
23 ± 2 �C and 55 ± 5 relative humidity. It was observed
that crystal growth started after 30 days (Fig. 5). The
crystallinity of the sample increased for approximately
76 days and crystal growth then stopped. The characteristic
Tm appeared in curve B at 172 �C (445.2 K). This peak
increased linearly with time, but the change stopped after
76 days. Tm was found in the interval of 170–172 �C
(443.2–445.2 K). Values of DH are given in Table 1. It was
clear that recrystallization started in the amorphized
sample.
Fig. 4 Glass-transition temperature of CLP measured by DSC.
(A) Sample prepared with ethanol, dried with room temperature air,
(B) sample prepared with ethanol, dried by vacuum
Fig. 5 Preliminary stability testing: (A) fresh sample, (B) sample
stored for 30 days, (C) sample stored for 34 days, (D) sample stored
for 45 days, (E) sample stored for 76 days, (F) sample stored for
96 days, (G): sample stored for 109 days
Table 1 Preliminary stability testing: changes in DH determined by
DSC measurement
Duration of storage/day DH/Jg-1
0 0.00
30 0.55
34 4.10
45 15.82
76 41.65
96 42.64
109 40.96
246 O. Jojart-Laczkovich, P. Szabo-Revesz
123
Conclusions
In the course of this study, CLP was amorphized by the
solvent method. Both ethanol and methanol as solvent
resulted in amorphous samples. Either can be a suitable
solvent for amorphization, but ethanol is preferred in view of
the ICH guidelines relating to residual solvent. Methanol
belongs to Class 2, and ethanol in the less dangerous Class 3.
In the sample drying procedures, blown room temperature
air, and vacuum drying have the same effectiveness. Tg was
determined to be 88.9 �C (362.1 K), the quotient Tg/Tm was
0.80, so CLP is a good glass former. The results of the
preliminary stability testing indicated that recrystallization
occurred in the pure amorphized API after 30 days at room
temperature. The application of crystallization inhibitors is
therefore suggested.
Open Access This article is distributed under the terms of the
Creative Commons Attribution Noncommercial License which per-
mits any noncommercial use, distribution, and reproduction in any
medium, provided the original author(s) and source are credited.
References
1. Cui Y. A material science perspective of pharmaceutical solids.
Int J Pharm. 2007;339:3–18.
2. Yu L. Amorphous pharmaceutical solids: preparation, character-
ization and stabilization. Adv Drug Deliver Rev. 2001;48:27–42.
3. Chawla G, Gupta P, Thilagavathi R, Chakraborti AK, Bansal AK.
Characterization of solid-state forms of celecoxib. Eur J Pharm
Sci. 2003;20:305–17.
4. Vippagunta SR, Brittain HG, Grant DJW. Crystalline solids. Adv
Drug Deliver Rev. 2001;48:3–26.
5. Rodrıguez-Spong B, Price CP, Jayasankar A, Matzger AJ, Rod-
rıguez-Hornedo N. General principles of pharmaceutical solid
polymorphism: a supramolecular perspective. Adv Drug Deliver
Rev. 2004;56:241–74.
6. Zhang GGZ, Law D, Schmitt EA, Qiu Y. Phase transformation
consideration during process development and manufacture of
solid oral dosage forms. Adv Drug Deliver Rev. 2004;56:371–90.
7. Takeuchi H, Nagira S, Yamamoto H, Kawashima Y. Solid dis-
persion particles of amorphous indomethacin with fine porous
silica particles by using spray-drying method. Int J Pharm.
2005;293:155–64.
8. Hancock BC, Parks M. What is the true solubility advantage for
amorphous pharmaceuticals? Pharm Res. 2000;17:397–403.
9. Singhal D, Curatolo W. Drug polymorphism and dosage form
design: a practical perspective. Adv Drug Deliver Rev. 2004;56:
335–47.
10. Chadha R, Kashid N, Jain DVS. Characterization and quantifi-
cation of amorphous content in some selected parenteral cepha-
losporins by calorimetric method. J Therm Anal Calorim. 2005;
81:277–84.
11. Craig DQM, Royall PG, Kett VL, Hopton ML. The relevance of
the amorphous state to pharmaceutical dosage forms: glassy
drugs and freeze dried systems. Int J Pharm. 1999;179:179–207.
12. Pokharkar VB, Mandpe LP, Padamwar MN, Ambike AA,
Mahadik KR, Paradkar A. Development, characterization and
stabilization of amorphous form of a low Tg drug. Powder
Technol. 2006;167:20–5.
13. Watanabe T, Hasegawa S, Wakiyama N, Kusai A, Senna M.
Comparison between polyvinylpyrrolidone and silica nanoparti-
cles as carriers for indomethacin in a solid state dispersion. Int
J Pharm. 2003;250:283–6.
14. Kim J-H, Choi H-K. Effect of additives on the crystallization and
the permeation of ketoprofen from adhesive matrix. Int J Pharm.
2002;236:81–5.
15. Takeuchi H, Nagira S, Yamamoto H, Kawashima Y. Solid dis-
persion particles of tolbutamide prepared with fine silica particles
by the spray-drying method. Powder Technol. 2004;141:187–95.
16. Szabo-Revesz P, Laczkovich O, Ambrus R, Sz}uts A, Aigner Z.
Protocols for amorphization of crystalline solids through the
application of pharmaceutical technological processes. Eur J Pharm
Sci. 2007;32:26. doi:10.10166j.ejps.2007.05.036.
17. Giron D. Applications of thermal analysis and coupled techniques
in pharmaceutical industry. J Therm Anal Calorim. 2002;68:
335–57.
18. Gombas A, Szabo-Revesz P, Kata M, Regdon G Jr, Er}os I.
Quantitative determination of a-lactose monohydrate by DSC.
J Therm Anal Calorim. 2002;68:503–10.
19. Kerc J, Srcic S. Thermal analysis of glassy pharmaceuticals.
Thermochim Acta. 1995;248:81–95.
20. Hancock BC, Zografi G. Characteristics and Significance of the
Amorphous State in Pharmaceutical Systems. J Pharm Sci. 1997;
86:1–12.
21. Gomez Y, Adams E, Hoogmartens J. Analysis of purity in 19
drug product tablets containing clopidogrel: 18 copies versus the
original brand. J Pharmaceut Biomed. 2004;34:341–8.
22. Bousquet A, Castro B, Germain JS. Polymorphic form of clopi-
dogrel hydrogen sulfate, US Patent 6,504,030, Jan 07 2003; ref.
Chem. Abstract 132 (2000) 54841n.
23. Uvarov V, Popov I. Development and metrological character-
ization of quantitative X-ray diffraction phase analysis for the
mixture of clopidogrel bisulphate polymorphs. J Pharmaceut
Biomed. 2008;46:676–82.
24. Lohray BB, Lohray VB, Pandey B, Dave MG. Polymorph and
amorphous form of (S)-(?)-clopidogrel bisulfate, WO 2004/
081016, 23 Sept 2004.
25. Nemeth Z, Demeter A, Pokol Gy. Quantifying low levels of
polymorphic impurity in clopidogrel bisulphate by vibrational
spectroscopy and chemometrics. J Pharmaceut Biomed. 2009;49:
32–41.
26. Aaltonen J, Allesø M, Mirza S, Koradia V, Gordon KC, Rantanen
J. Solid form screening—a review. Eur J Pharm Biopharm. 2009;
71:23–37.
27. International conference on harmonization Q3C, impurities:
residual solvents. 1998. http://www.emea.europa.eu/pdfs/human/
ich/028395en.pdf of subordinate document. Accessed March
1998.
Amorphization of a crystalline active pharmaceutical ingredient 247
123

IV.

Magyar Kémiai Folyóirat
*Tel.: 06-62-545-572; fax: 06-62-545-571; e-mail: [email protected]
1
Kristályos vagy amorf forma?
JÓJÁRTNÉ LACZKOVICH Orsolya, SZABÓNÉ RÉVÉSZ Piroska*
Szegedi Tudományegyetem, Gyógyszertechnológiai Intézet, Eötvös utca 6., 6720 Szeged, Magyarország
1. Bevezetés
Az amorf forma a szilárd fázis egyik alfázisának tekinthetőa kristályos alfázis mellett1. Alkalmazását tekintve az ipar számos területén használják, sőt sok esetben előnyben részesítik a kristályos formával szemben. Alkalmazzák a műanyag gyártásban, a textil iparban, a kerámiák előállítása során, az élelmiszeriparban, az építészetben, félvezetőkelőállítása során, optikai üvegek készítésekor és természetesen a gyógyszeriparban is. A különböző ipari területek más és más kémiai anyagok amorf formáját alkalmazzák. Három fő csoport nevezhető meg: szervetlen kristályos anyagok amorf formájának felhasználása, szerves kis molekulájú kristályos anyagok amorf formájának használata és nagy molekulájú polimerek amorf formában történő alkalmazása. Ezen összeállítás a gyógyszerészetben használt kristályos hatóanyagok amorf formájának előállításával, tulajdonságaival foglalkozik.
Az amorf forma gyógyszeripari előállítása esetén két nagy csoport különíthető el. Az egyik amikor kristályos anyagok amorf formáját előállítva tisztán amorf formában kerülnek alkalmazásra, illetve további feldolgozásra. Ekkor az amorfizálás elsősorban az alapanyaggyártók által kivitelezett művelet. A másik lehetőség, amikor kristályosodást gátló segédanyagok segítségével amorf rendszereket állítanak elő elsősorban a gyógyszertechnológusok. Ez a két terület jól elkülöníthetőegymástól, hiszen az amorf terméket tekintve teljesen más rendszerek állíthatók elő a megjelölt módokon.
Szerkezetüket tekintve az amorf anyagok nem rendelkeznek kristályráccsal. Molekuláik között a rövid távú rendezettség fennáll, de a hosszú távú rendezettség nem alakul ki. A kristályos formával összehasonlítva sokkal energiagazdagabb állapotnak tekinthető2. Ebbőladódóan stabilitási problémák lépnek fel ezekben az anyagokban. A rekrisztallizáció különböző behatások következtében, vagy egyszerű tárolás során is megindulhat a mintákban3. Az amorf anyagok általában higroszkóposak, nagyobb oldódási sebességgel és jobb vízoldékonysággal rendelkeznek, mint a megfelelő kristályok4.
A gyógyszergyártásban négy területen jön számításba kristályos hatóanyagok amorf formájának alkalmazása2.
1. A gyakorlatban számos rossz vízoldékonysággal rendelkező hatóanyag kerül alkalmazásra. Az új hatóanyagok egyre gyakrabban sorolhatók a BCS (Biopharmaceutics Classification System) II. vagy IV. osztályba. A rossz vízoldékonyág maga után vonja a nem
kielégítő biológiai hasznosíthatóságot. Az amorf anyagoknak nincs kristályrácsuk, ezáltal nincs rácsenergia sem, amely termodinamikai gátja az oldódásnak. Tehát az amorf anyagok alkalmazásának egyik legfontosabb indikációs területe az oldékonyság-növelés.
2. A gyógyszerészetben alkalmazott hatóanyagok nagy része rendelkezik különböző polimorf módosulatokkal. Ezek a módosulatok a gyógyszer-készítmény formulálása során is egymásba alakulhatnak5. A polimorfok különbözőfizikai és fizikai-kémiai tulajdonságokkal rendelkeznek. A polimorfok egymásba alakulása mindenképpen kerülendő,mivel ezáltal megváltozhatnak alapvető tulajdonságaik (pl. oldékonyságuk, olvadáspontjuk stb.) és ezekkel együtt feldolgozhatóságuk, illetve biológiai hasznosíthatóságuk is. A polimorfok egymásba alakulásának kivédésére egyik kínálkozó megoldás az amorfizálás művelete.
3. Léteznek olyan kristályos hatóanyagok, amelyek kristályos formában nehezen kezelhetőek, formulálásuk során nehézségek merülnek fel. Ezen anyagok feldolgozhatósága az amorfizálással sok esetben javítható, köszönhetően annak, hogy az amorf forma például jobb préslhetőségi tulajdonsággal rendelkezik a megfelelőkristályos anyaghoz képest.
4. Nagyon fontos indikációs területe az amorfizálásnak egy gazdasági szempontból lényeges kérdés. Ez a terület a szabadalmaztatás, hiszen egy védett hatóanyag új szabadalomként való bejelentése történhet meg amorf formában6.
2. Az amorf forma jellemzése
A kristályos anyagok termikus jellemzésére használt paraméter az olvadáspont. Az amorf anyagok nem rendelkeznek ezzel a jellemző hőmérséklettel, termikus viselkedésük eltér a kristályos anyaghoz képest. Hőmérsékletük emelése közben nem olvadnak meg, hanem egy üvegesedési átmeneten keresztül meglágyulnak, rugalmassá válnak. Ez egy hőmérsékleti intervallum, amely tartománynak a középértékét üvegesedési hőmérséklet ("glass transition temperature", rövidítése Tg) néven említi az irodalom. A kristályos olvadáspontnak (Tm) és az amorf üvegesedési hőmérsékletnek (Tg) az egymáshoz való viszonyából következtethetünk az adott anyag amorfizálhatósági tulajdonságára. Irodalmi adatok alapján ha a
7,0>Tm
Tg,
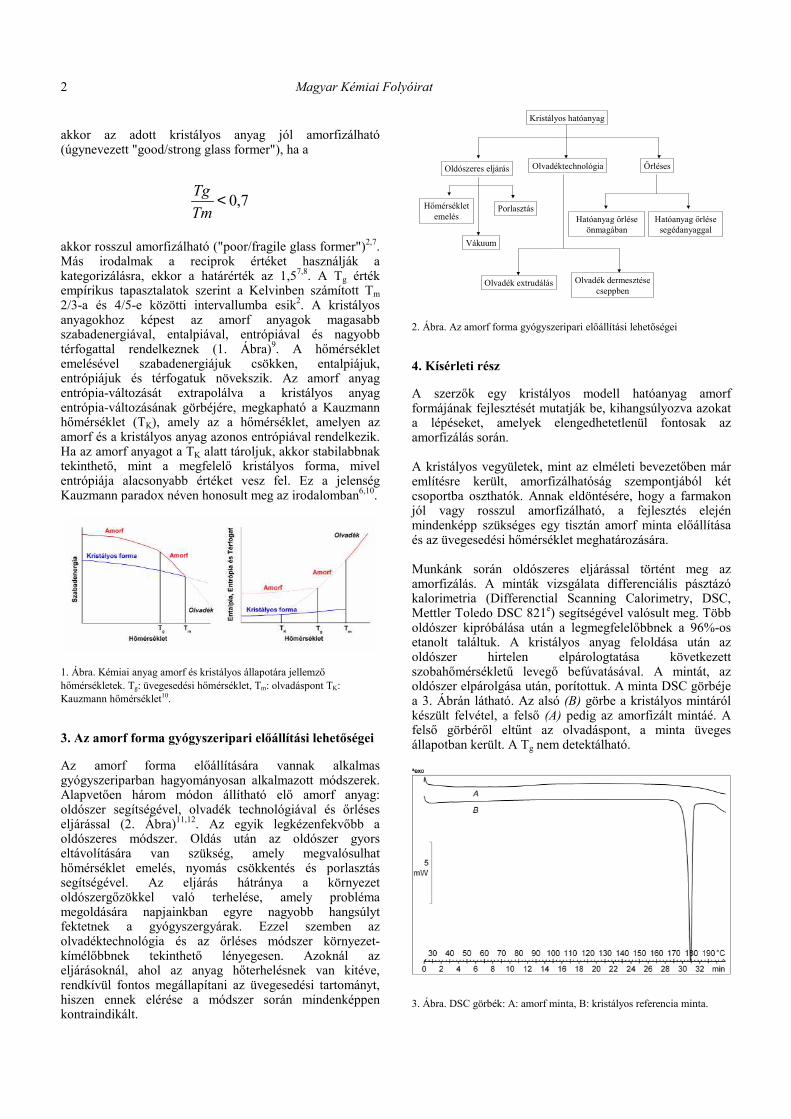
Magyar Kémiai Folyóirat 2
akkor az adott kristályos anyag jól amorfizálható (úgynevezett "good/strong glass former"), ha a
7,0<Tm
Tg
akkor rosszul amorfizálható ("poor/fragile glass former")2,7.Más irodalmak a reciprok értéket használják a kategorizálásra, ekkor a határérték az 1,57,8. A Tg érték empírikus tapasztalatok szerint a Kelvinben számított Tm
2/3-a és 4/5-e közötti intervallumba esik2. A kristályos anyagokhoz képest az amorf anyagok magasabb szabadenergiával, entalpiával, entrópiával és nagyobb térfogattal rendelkeznek (1. Ábra)9. A hőmérséklet emelésével szabadenergiájuk csökken, entalpiájuk, entrópiájuk és térfogatuk növekszik. Az amorf anyag entrópia-változását extrapolálva a kristályos anyag entrópia-változásának görbéjére, megkapható a Kauzmann hőmérséklet (TK), amely az a hőmérséklet, amelyen az amorf és a kristályos anyag azonos entrópiával rendelkezik. Ha az amorf anyagot a TK alatt tároljuk, akkor stabilabbnak tekinthető, mint a megfelelő kristályos forma, mivel entrópiája alacsonyabb értéket vesz fel. Ez a jelenség Kauzmann paradox néven honosult meg az irodalomban6,10.
1. Ábra. Kémiai anyag amorf és kristályos állapotára jellemzőhőmérsékletek. Tg: üvegesedési hőmérséklet, Tm: olvadáspont TK:Kauzmann hőmérséklet10.
3. Az amorf forma gyógyszeripari előállítási lehetőségei
Az amorf forma előállítására vannak alkalmas gyógyszeriparban hagyományosan alkalmazott módszerek. Alapvetően három módon állítható elő amorf anyag: oldószer segítségével, olvadék technológiával és őrléses eljárással (2. Ábra)11,12. Az egyik legkézenfekvőbb a oldószeres módszer. Oldás után az oldószer gyors eltávolítására van szükség, amely megvalósulhat hőmérséklet emelés, nyomás csökkentés és porlasztás segítségével. Az eljárás hátránya a környezet oldószergőzökkel való terhelése, amely probléma megoldására napjainkban egyre nagyobb hangsúlyt fektetnek a gyógyszergyárak. Ezzel szemben az olvadéktechnológia és az őrléses módszer környezet-kímélőbbnek tekinthető lényegesen. Azoknál az eljárásoknál, ahol az anyag hőterhelésnek van kitéve, rendkívül fontos megállapítani az üvegesedési tartományt, hiszen ennek elérése a módszer során mindenképpen kontraindikált.
Kristályos hatóanyag
Oldószeres eljárás Olvadéktechnológia Őrléses
Hőmérséklet emelés
Vákuum
Porlasztás
Olvadék extrudálás Olvadék dermesztése cseppben
Hatóanyag őrlése önmagában
Hatóanyag őrlése segédanyaggal
2. Ábra. Az amorf forma gyógyszeripari előállítási lehetőségei
4. Kísérleti rész
A szerzők egy kristályos modell hatóanyag amorf formájának fejlesztését mutatják be, kihangsúlyozva azokat a lépéseket, amelyek elengedhetetlenül fontosak az amorfizálás során.
A kristályos vegyületek, mint az elméleti bevezetőben már említésre került, amorfizálhatóság szempontjából két csoportba oszthatók. Annak eldöntésére, hogy a farmakon jól vagy rosszul amorfizálható, a fejlesztés elején mindenképp szükséges egy tisztán amorf minta előállítása és az üvegesedési hőmérséklet meghatározására.
Munkánk során oldószeres eljárással történt meg az amorfizálás. A minták vizsgálata differenciális pásztázó kalorimetria (Differenctial Scanning Calorimetry, DSC, Mettler Toledo DSC 821e) segítségével valósult meg. Több oldószer kipróbálása után a legmegfelelőbbnek a 96%-os etanolt találtuk. A kristályos anyag feloldása után az oldószer hirtelen elpárologtatása következett szobahőmérsékletű levegő befúvatásával. A mintát, az oldószer elpárolgása után, porítottuk. A minta DSC görbéje a 3. Ábrán látható. Az alsó (B) görbe a kristályos mintáról készült felvétel, a felső (A) pedig az amorfizált mintáé. A felső görbéről eltűnt az olvadáspont, a minta üveges állapotban került. A Tg nem detektálható.
3. Ábra. DSC görbék: A: amorf minta, B: kristályos referencia minta.

Magyar Kémiai Folyóirat
*Tel.: 06-62-545-572; fax: 06-62-545-571; e-mail: [email protected]
3
Annak bizonyítására, hogy a minta valóban amorf, porröntgen diffrakciós vizsgálatot végeztünk (Rigaku X-ray Diffractometer Miniflex II.). Az eredmények teljesen összhangban állnak a DSC eredményekkel, amely a diffraktogrammokon jól követhető (4. Ábra). Az amorf minta diffraktogrammja kisimult a kristályoshoz képest, a jellemző intenzitás értékek eltűntek, tehát röntgen amorf mintát állítottunk elő.
4. Ábra. Porröntgen diffrakciós vizsgálat: A: amorf minta B: kristályos referencia minta.
Annak bizonyítására, hogy nem történt bomlás a mintában és kémiailag azonos molekulákból felépülő anyagot képeztünk Furier transzformációs infravörös spektoszkópiás (FT-IR) vizsgálatot végeztünk (Thermo Nicolet Avatar 330 FT-IR Spectrometer). A spektrumon jól követhető, hogy minden jellemző abszorbancia érték jelen van a görbéken, kémiai átalakulás nem következett be az anyagban (5. Ábra).
5. Ábra. FT-IR vizsgálat: A: amorf minta spektruma, B: kristályos referencia spektruma.
Az üvegesedési hőmérséklet meghatározására alkalmas módszer a differenciális pásztázó kalorimetria. Elsőfelfűtésre a Tg érték nem volt detektálható. Ugyanazon minta második felfűtése viszont láthatóvá tette az üvegesedési hőmérsékletet (6. Ábra). Kétszer elvégezve ezt a dupla fűtést ugyanabban az intervallumban tapasztaltuk az üvegesedési átmenetet. Az olvadáspontból előre számolt intervallum, amelyen belül várható a Tg 28-89 ºC volt. Az üvegesedési tartomány középértéke 88,9 ºC, mely a Tg
értéknek felel meg. Kiszámolva a Tg/Tm hányadost 0,80-ot
kaptunk, amely érték alapján a vizsgált anyag a jól amorfizálható hatóanyagok közé sorolható.
6. Ábra. A Tg meghatározása DSC módszer segítségével.
Következő lépésként az amorfizált hatóanyagot előzetes stabilitás vizsgálatnak vetettük alá (7. Ábra). A vizsgálati körülmények: 23±2 ºC és 55±5 % relatív páratartalom voltak. Azt tapasztaltuk, hogy a rekrisztallizáció körülbelül egy hónap tárolás után indul meg. A 7. Ábrán a legfelsőgörbe, amelyen még nem látható olvadáspont, a frissen előállított amorf anyag görbéje, majd a következő görbék az idő előrehaladtával azt mutatják, hogy a kristályos frakció egyre meghatározóbbá válik a termékben. A karakterisztikus olvadáspontok az idő előrehaladtával egyre növekszenek. Megállapítható tehát, hogy a tiszta amorf anyag nem rendelkezik megfelelő stabilitással.
7. Ábra. A: frissen előállított minta, B: 30 napos tárolt minta, C: 34 napos tárolt minta, D: 45 napos tárolt minta, E: 76 napos tárolt minta.
5. Összefoglalás
Befejezésül megállapítható, hogy az amorfizálásra a gyógyszertechnológiában nagy szükség van elsősorban olyan esetekben, ahol oldékonyság növelése a cél. Az amorf forma számos előnye mellett ki kell hangsúlyozni a stabilitási problémákat is, amely a legnagyobb nehézség ilyen fejlesztések során. A rekrisztallizáció visszaszorítására az egyik lehetőség segédanyagok alkalmazása, de nagyon fontos szerepet kaphat a tárolási

Magyar Kémiai Folyóirat 4
körülmények helyes megválasztása is. Végezetül a címben felvetett kérdésre az a válasz adható, hogy az amorf forma esetenként előnyben részesíthető a kristályossal szemben, de a fejlesztési folyamat megkezdése előtt mindenképpen meg kell határozni a cikkben felvetett fontos paramétereket, hiszen ezek ismerete nélkül abban sem lehetünk biztosak, hogy amorfizálható-e az adott kristályos farmakon. Ha a hatóanyag a vizsgálatok eredményeként besorolható a jól amorfizálható vegyületek közé, akkor mindenképpen érdemes, egy felmerülő gyógyszeripari probléma megoldására felsorakoztatott lehetőségek közül választani; nem hagyva figyelmen kívül a stabilitási problémákat sem.
Hivatkozások
1. Cui, Y. Int. J. Pharm. 2007, 339, 3-18.
2. Yu, L. Adv. Drug Deliver. Rev. 2001, 48, 27-42. 3. Gombás, Á.; Szabó-Révész, P.; Kata, M.; Regdon Jr., G.;
Erős, I. J. Therm. Anal. Cal. 2002, 68, 503-510. 4. Hancock, B. C.; Parks, M. Pharm. Res. 2000, 17, 397-403. 5. Vippagunta, S. R.; Brittain, H. G.; Grant, D. J. W. Adv. Drug
Deliver. Rev. 2001, 48, 3-26. 6. Aaltonen, J.; Allesø, M.; Mirza, S.; Koradia, V.; Gordon, K.
C.; Rantanen, J. Eur. J. Pharm. Biopharm. 2009, 71, 23-37. 7. Craig, D. Q.M.; Royall, P. G.; Kett, V. L.; Hopton, M. L. Int.
J. Pharm. 1999, 179, 179-207. 8. Hancock, B. C.; Zografi, G. J. Pharm. Sci. 1997, 86, 1-12. 9. Zhang, G. G. Z.; Law, D.; Schmitt, E. A.;Qiu, Y. Adv. Drug.
Deliver. Rev. 2004, 56, 371-390. 10. Kauzmann, W. Chem. Rew. 1948, 43, 219-256. 11. Révész, P.; Laczkovich, O.; Erős, I. Acta Pharm. Hung. 2004,
74, 39-44. 12. Szabó-Révész, P.; Laczkovich, O.; Ambrus, R.; Szűts, A.;
Aigner, Z. Eur. J. Pharm. Sci. 2007, 32, Suppl., S18
Crystalline or amorphous form
The amorphous form of materials is well known because it is applied in different fields, e.g. the plastics industry, the textile industry, the production of ceramics, the food industry, architecture, the preparation of semi-conductors, the manufacture of optical glasses and naturally the pharmaceutical industry. In pharmaceutical technology the procedures for the production of a glassy form must be divided into two groups: the preparation of the pure amorphous form of crystalline active pharmaceutical ingredients (APIs) and the amorphization of crystalline APIs with a crystallization inhibitor. The amorphization of crystalline APIs may be necessary because of the poor water-solubility of the drug material, the polymorphism of the active substance, difficulty in the processing of the crystalline form, or the taking-out of a patent for a new (amorphous) form. The most important useful property of this form in this field is the increased solubility of drug
substances. It should be mentioned that stability problems can occur in the course of application of this form, because of the possibility of recrystallization during the preparation procedure and storage. The aim of this work was to introduce the main properties of the amorphous form, the possibilities of its preparation and the investigation of the developed amorphous API.
For a crystalline model drug the authors determined the quotient Tg/Tm (Tg: glass transition temperature; Tm: melting point), which indicated that this model drug can be classified in the group of good glass formers. Investigation of the stability of the pure amorphous form allowed the conclusion that a crystallization inhibitor should be applied to attain suitable stability.

V.

1272
Introduction
In pharmaceutical formulations, most drug materials are processed in their crystalline form, which is a thermo-dynamically stable state that exhibits both short-range and long-range order1,2. Unlike a crystalline solid, an amorphous solid has no long-range order of molecular packing, so the molecules are conformationally lexible3. he application of an active pharmaceutical ingredient (API) in amorphous form is increasingly common in the development of pharmaceutical solid formulations, with all its risks and beneits4,5. he amorphous or glassy form is one of the two solid subphases next to the crystalline form6. In pharmaceutical technology, this solid form is well known and widely studied because of its advanta-geous properties7,8. he applications of amorphization can be divided into three groups:
amorphization of inorganic crystalline materials• 9;amorphization of organic materials consisting of •small molecules (most APIs can be classiied in this group)10; andamorphization of large polymer molecules• 11.
he present work is concerned with the second point, using a model API for amorphization.
Amorphization can be applied in pharmaceutical technology for four reasons:
to increase the dissolution rate and solubility of a •poorly water-soluble API12–15,to protect active agents from a polymorphous •transformation16,to revise the processability of the corresponding •crystalline drug17, andto take out a new patent relating to the amorphous •form of a given API (US Patent 6,767,913 B2).
he possibility of amorphization is very important as concerns amorphous formulations, because there are two groups of APIs from the aspect of the glass-forming tendency. Crystalline APIs can be divided into poor (or fragile) glass-formers and good (or strong) glass-formers. here is an empirical formula with which the glass-forming tendency of an API can be predicted. For poor or fragile glass-formers, T
g/T
m < 0.7, and for good or strong
RESEARCH ARTICLE
Formulation of tablets containing an ‘in-process’ amorphized active pharmaceutical ingredient
Orsolya Jójárt-Laczkovich and Piroska Szabó-Révész
Department of Pharmaceutical Technology, University of Szeged, Szeged, Hungary
AbstractThe aim of this work was a preliminary study of the “in-process” amorphization of clopidogrel hydrogensulfate (CLP) as model drug during the production of tablets as dosage form. A solvent method was used for amorphization and the crystalline phase of CLP was detected by diferential scanning calorimetry; the physical parameters of fresh and stored tablets were investigated. For the amorphous form, Aerosil 200 was selected as crystallization inhibitor as the most suitable of eight auxiliary agents. The optimum composition of the product for amorphization in the scaling-up process (100-fold) was 7 parts of CLP to 3 parts of Aerosil 200. In this scaled-up product, the amorphous CLP was ixed on the surface of microcrystalline cellulose. The tablet form further stabilized the amorphous form. Finally, the steps of an “in-process” amorphization are given as a protocol, which can promote stabilization of an amorphized active pharmaceutical ingredient.
Keywords: Aerosil 200, amorphous, clopidogrel hydrogensulfate, crystallization inhibitor, ‘in-process’ amorphization
Address for Correspondence: Dr. Piroska Szabó-Révész, Department of Pharmaceutical Technology, University of Szeged, Eötvös u. 6, Szeged, 6720 Hungary. Tel.: +36/62–545572. E-mail address: [email protected]
(Received 27 May 2010; revised 01 March 2011; accepted 02 March 2011)
Drug Development and Industrial Pharmacy, 2011; 37(11): 1272–1281
© 2011 Informa Healthcare USA, Inc.
ISSN 0363-9045 print/ISSN 1520-5762 online
DOI: 10.3109/03639045.2011.569933
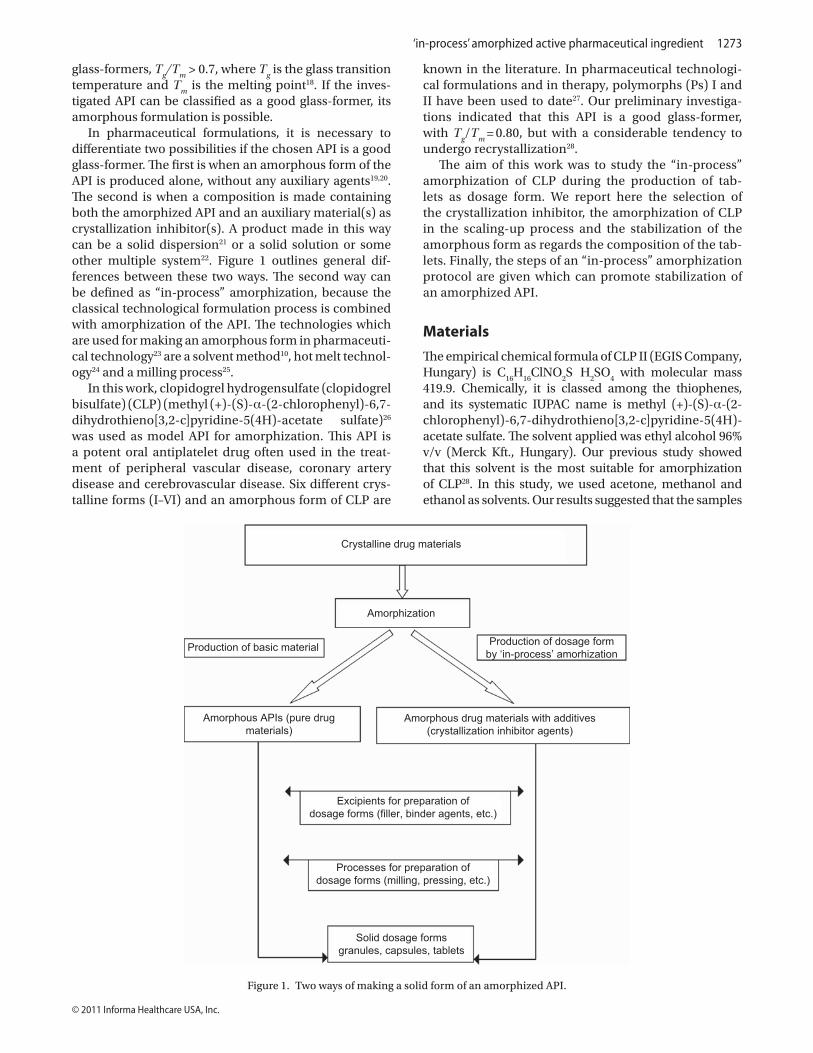
‘in-process’ amorphized active pharmaceutical ingredient 1273
© 2011 Informa Healthcare USA, Inc.
glass-formers, Tg/T
m > 0.7, where T
g is the glass transition
temperature and Tm
is the melting point18. If the inves-tigated API can be classiied as a good glass-former, its amorphous formulation is possible.
In pharmaceutical formulations, it is necessary to diferentiate two possibilities if the chosen API is a good glass-former. he irst is when an amorphous form of the API is produced alone, without any auxiliary agents19,20. he second is when a composition is made containing both the amorphized API and an auxiliary material(s) as crystallization inhibitor(s). A product made in this way can be a solid dispersion21 or a solid solution or some other multiple system22. Figure 1 outlines general dif-ferences between these two ways. he second way can be deined as “in-process” amorphization, because the classical technological formulation process is combined with amorphization of the API. he technologies which are used for making an amorphous form in pharmaceuti-cal technology23 are a solvent method10, hot melt technol-ogy24 and a milling process25.
In this work, clopidogrel hydrogensulfate (clopidogrel bisulfate) (CLP) (methyl (+)-(S)-α-(2-chlorophenyl)-6,7-dihydrothieno[3,2-c]pyridine-5(4H)-acetate sulfate)26 was used as model API for amorphization. his API is a potent oral antiplatelet drug often used in the treat-ment of peripheral vascular disease, coronary artery disease and cerebrovascular disease. Six diferent crys-talline forms (I–VI) and an amorphous form of CLP are
known in the literature. In pharmaceutical technologi-cal formulations and in therapy, polymorphs (Ps) I and II have been used to date27. Our preliminary investiga-tions indicated that this API is a good glass-former, with T
g/T
m = 0.80, but with a considerable tendency to
undergo recrystallization28.he aim of this work was to study the “in-process”
amorphization of CLP during the production of tab-lets as dosage form. We report here the selection of the crystallization inhibitor, the amorphization of CLP in the scaling-up process and the stabilization of the amorphous form as regards the composition of the tab-lets. Finally, the steps of an “in-process” amorphization protocol are given which can promote stabilization of an amorphized API.
Materials
he empirical chemical formula of CLP II (EGIS Company, Hungary) is C
16H
16ClNO
2S H
2SO
4 with molecular mass
419.9. Chemically, it is classed among the thiophenes, and its systematic IUPAC name is methyl (+)-(S)-α-(2-chlorophenyl)-6,7-dihydrothieno[3,2-c]pyridine-5(4H)-acetate sulfate. he solvent applied was ethyl alcohol 96% v/v (Merck Kft., Hungary). Our previous study showed that this solvent is the most suitable for amorphization of CLP28. In this study, we used acetone, methanol and ethanol as solvents. Our results suggested that the samples
Excipients for preparation of
dosage forms (filler, binder agents, etc.)
Amorphous APIs (pure drug
materials)
Production of basic materialProduction of dosage form
by ‘in-process’ amorhization
Amorphization
Crystalline drug materials
Amorphous drug materials with additives
(crystallization inhibitor agents)
Processes for preparation of
dosage forms (milling, pressing, etc.)
Solid dosage forms
granules, capsules, tablets
Figure 1. Two ways of making a solid form of an amorphized API.
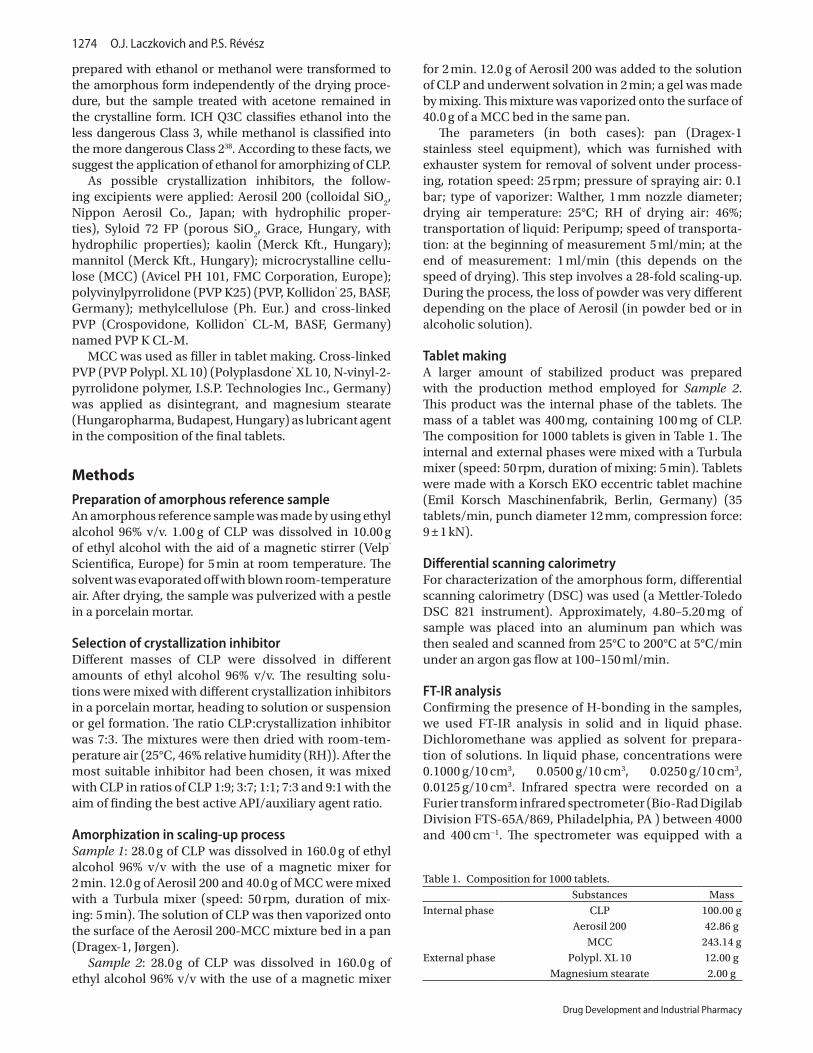
1274 O.J. Laczkovich and P.S. Révész
Drug Development and Industrial Pharmacy
prepared with ethanol or methanol were transformed to the amorphous form independently of the drying proce-dure, but the sample treated with acetone remained in the crystalline form. ICH Q3C classiies ethanol into the less dangerous Class 3, while methanol is classiied into the more dangerous Class 238. According to these facts, we suggest the application of ethanol for amorphizing of CLP.
As possible crystallization inhibitors, the follow-ing excipients were applied: Aerosil 200 (colloidal SiO
2,
Nippon Aerosil Co., Japan; with hydrophilic proper-ties), Syloid 72 FP (porous SiO
2, Grace, Hungary, with
hydrophilic properties); kaolin (Merck Kft., Hungary); mannitol (Merck Kft., Hungary); microcrystalline cellu-lose (MCC) (Avicel PH 101, FMC Corporation, Europe); polyvinylpyrrolidone (PVP K25) (PVP, Kollidon® 25, BASF, Germany); methylcellulose (Ph. Eur.) and cross-linked PVP (Crospovidone, Kollidon® CL-M, BASF, Germany) named PVP K CL-M.
MCC was used as iller in tablet making. Cross-linked PVP (PVP Polypl. XL 10) (Polyplasdone® XL 10, N-vinyl-2-pyrrolidone polymer, I.S.P. Technologies Inc., Germany) was applied as disintegrant, and magnesium stearate (Hungaropharma, Budapest, Hungary) as lubricant agent in the composition of the inal tablets.
Methods
Preparation of amorphous reference sampleAn amorphous reference sample was made by using ethyl alcohol 96% v/v. 1.00 g of CLP was dissolved in 10.00 g of ethyl alcohol with the aid of a magnetic stirrer (Velp® Scientiica, Europe) for 5 min at room temperature. he solvent was evaporated of with blown room-temperature air. After drying, the sample was pulverized with a pestle in a porcelain mortar.
Selection of crystallization inhibitorDiferent masses of CLP were dissolved in diferent amounts of ethyl alcohol 96% v/v. he resulting solu-tions were mixed with diferent crystallization inhibitors in a porcelain mortar, heading to solution or suspension or gel formation. he ratio CLP:crystallization inhibitor was 7:3. he mixtures were then dried with room-tem-perature air (25°C, 46% relative humidity (RH)). After the most suitable inhibitor had been chosen, it was mixed with CLP in ratios of CLP 1:9; 3:7; 1:1; 7:3 and 9:1 with the aim of inding the best active API/auxiliary agent ratio.
Amorphization in scaling-up processSample 1: 28.0 g of CLP was dissolved in 160.0 g of ethyl alcohol 96% v/v with the use of a magnetic mixer for 2 min. 12.0 g of Aerosil 200 and 40.0 g of MCC were mixed with a Turbula mixer (speed: 50 rpm, duration of mix-ing: 5 min). he solution of CLP was then vaporized onto the surface of the Aerosil 200-MCC mixture bed in a pan (Dragex-1, Jørgen).
Sample 2: 28.0 g of CLP was dissolved in 160.0 g of ethyl alcohol 96% v/v with the use of a magnetic mixer
for 2 min. 12.0 g of Aerosil 200 was added to the solution of CLP and underwent solvation in 2 min; a gel was made by mixing. his mixture was vaporized onto the surface of 40.0 g of a MCC bed in the same pan.
he parameters (in both cases): pan (Dragex-1 stainless steel equipment), which was furnished with exhauster system for removal of solvent under process-ing, rotation speed: 25 rpm; pressure of spraying air: 0.1 bar; type of vaporizer: Walther, 1 mm nozzle diameter; drying air temperature: 25°C; RH of drying air: 46%; transportation of liquid: Peripump; speed of transporta-tion: at the beginning of measurement 5 ml/min; at the end of measurement: 1 ml/min (this depends on the speed of drying). his step involves a 28-fold scaling-up. During the process, the loss of powder was very diferent depending on the place of Aerosil (in powder bed or in alcoholic solution).
Tablet makingA larger amount of stabilized product was prepared with the production method employed for Sample 2. his product was the internal phase of the tablets. he mass of a tablet was 400 mg, containing 100 mg of CLP. he composition for 1000 tablets is given in Table 1. he internal and external phases were mixed with a Turbula mixer (speed: 50 rpm, duration of mixing: 5 min). Tablets were made with a Korsch EKO eccentric tablet machine (Emil Korsch Maschinenfabrik, Berlin, Germany) (35 tablets/min, punch diameter 12 mm, compression force: 9 ± 1 kN).
Differential scanning calorimetryFor characterization of the amorphous form, diferential scanning calorimetry (DSC) was used (a Mettler-Toledo DSC 821 instrument). Approximately, 4.80–5.20 mg of sample was placed into an aluminum pan which was then sealed and scanned from 25°C to 200°C at 5°C/min under an argon gas low at 100–150 ml/min.
FT-IR analysisConirming the presence of H-bonding in the samples, we used FT-IR analysis in solid and in liquid phase. Dichloromethane was applied as solvent for prepara-tion of solutions. In liquid phase, concentrations were 0.1000 g/10 cm3, 0.0500 g/10 cm3, 0.0250 g/10 cm3, 0.0125 g/10 cm3. Infrared spectra were recorded on a Furier transform infrared spectrometer (Bio-Rad Digilab Division FTS-65A/869, Philadelphia, PA ) between 4000 and 400 cm−1. he spectrometer was equipped with a
Table 1. Composition for 1000 tablets.
Substances Mass
Internal phase CLP 100.00 g
Aerosil 200 42.86 g
MCC 243.14 g
External phase Polypl. XL 10 12.00 g
Magnesium stearate 2.00 g
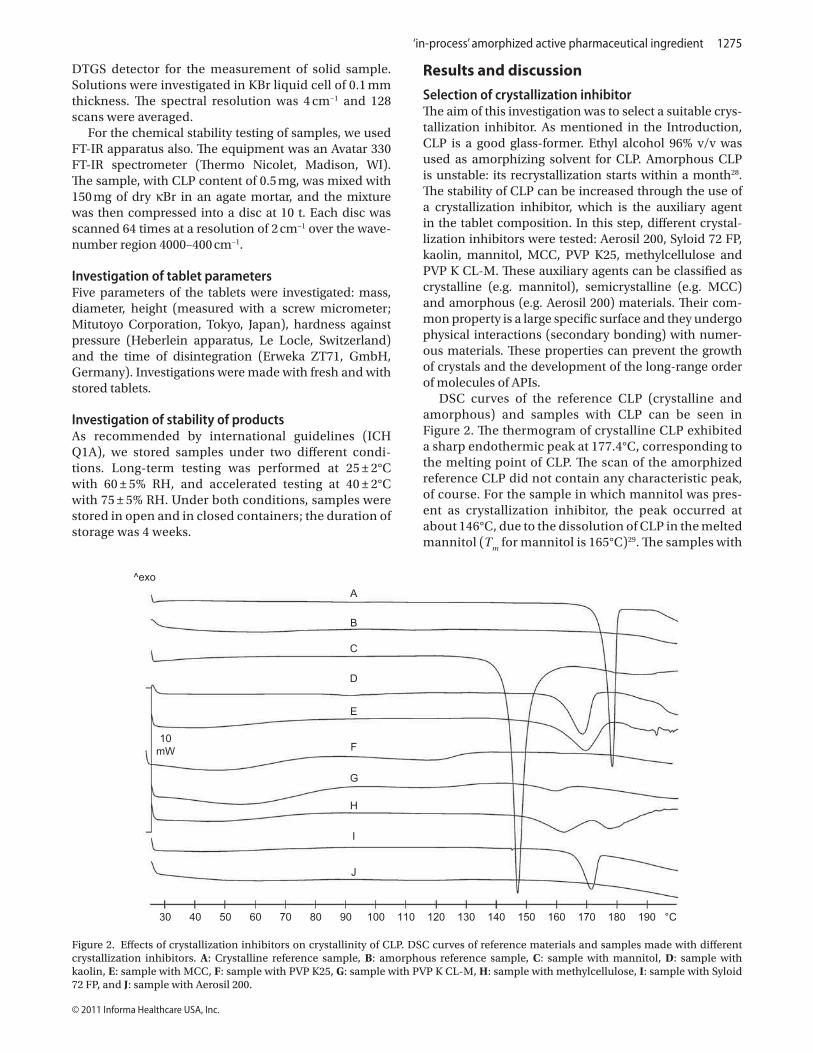
‘in-process’ amorphized active pharmaceutical ingredient 1275
© 2011 Informa Healthcare USA, Inc.
DTGS detector for the measurement of solid sample. Solutions were investigated in KBr liquid cell of 0.1 mm thickness. he spectral resolution was 4 cm−1 and 128 scans were averaged.
For the chemical stability testing of samples, we used FT-IR apparatus also. he equipment was an Avatar 330 FT-IR spectrometer (hermo Nicolet, Madison, WI). he sample, with CLP content of 0.5 mg, was mixed with 150 mg of dry κBr in an agate mortar, and the mixture was then compressed into a disc at 10 t. Each disc was scanned 64 times at a resolution of 2 cm−1 over the wave-number region 4000–400 cm−1.
Investigation of tablet parametersFive parameters of the tablets were investigated: mass, diameter, height (measured with a screw micrometer; Mitutoyo Corporation, Tokyo, Japan), hardness against pressure (Heberlein apparatus, Le Locle, Switzerland) and the time of disintegration (Erweka ZT71, GmbH, Germany). Investigations were made with fresh and with stored tablets.
Investigation of stability of productsAs recommended by international guidelines (ICH Q1A), we stored samples under two diferent condi-tions. Long-term testing was performed at 25 ± 2°C with 60 ± 5% RH, and accelerated testing at 40 ± 2°C with 75 ± 5% RH. Under both conditions, samples were stored in open and in closed containers; the duration of storage was 4 weeks.
Results and discussion
Selection of crystallization inhibitorhe aim of this investigation was to select a suitable crys-tallization inhibitor. As mentioned in the Introduction, CLP is a good glass-former. Ethyl alcohol 96% v/v was used as amorphizing solvent for CLP. Amorphous CLP is unstable: its recrystallization starts within a month28. he stability of CLP can be increased through the use of a crystallization inhibitor, which is the auxiliary agent in the tablet composition. In this step, diferent crystal-lization inhibitors were tested: Aerosil 200, Syloid 72 FP, kaolin, mannitol, MCC, PVP K25, methylcellulose and PVP K CL-M. hese auxiliary agents can be classiied as crystalline (e.g. mannitol), semicrystalline (e.g. MCC) and amorphous (e.g. Aerosil 200) materials. heir com-mon property is a large speciic surface and they undergo physical interactions (secondary bonding) with numer-ous materials. hese properties can prevent the growth of crystals and the development of the long-range order of molecules of APIs.
DSC curves of the reference CLP (crystalline and amorphous) and samples with CLP can be seen in Figure 2. he thermogram of crystalline CLP exhibited a sharp endothermic peak at 177.4°C, corresponding to the melting point of CLP. he scan of the amorphized reference CLP did not contain any characteristic peak, of course. For the sample in which mannitol was pres-ent as crystallization inhibitor, the peak occurred at about 146°C, due to the dissolution of CLP in the melted mannitol (T
m for mannitol is 165°C)29. he samples with
30
10
mW
^exo
A
B
C
D
E
F
G
H
I
J
40 50 60 70 80 90 100 110 120 130 140 150 160 170 180 190 °C
Figure 2. Efects of crystallization inhibitors on crystallinity of CLP. DSC curves of reference materials and samples made with diferent crystallization inhibitors. A: Crystalline reference sample, B: amorphous reference sample, C: sample with mannitol, D: sample with kaolin, E: sample with MCC, F: sample with PVP K25, G: sample with PVP K CL-M, H: sample with methylcellulose, I: sample with Syloid 72 FP, and J: sample with Aerosil 200.

1276 O.J. Laczkovich and P.S. Révész
Drug Development and Industrial Pharmacy
kaolin and MCC exhibited decreased CLP Tm
values (168 and 169°C). In this range, these agents do not have melting points. he samples with PVP K25 and PVP K CL-M contained CLP in amorphous form, but sufered a color change because of incompatibility between the components. he curve for the sample made with methylcellulose displayed a double peak efect, at 167.9°C and 177.6°C. his may be an indication of two Ps in this sample. It has been reported that P IV melts at 167.9°C30 and P II at 177.6°C31. Accordingly, this sample contains three diferent forms of CLP: the amorphous form, and the crystalline forms P IV and P II. Aerosil 200 and Syloid 72 FP difer greatly in applicability as crystallization inhibitors despite both of them consist-ing of SiO
2. With ethyl alcohol as solvent, Aerosil 200
resulted in perfectly amorphous CLP, in contrast with Syloid 72 FP, which amorphized the CLP only partially. his result can be explained as a consequence of the gelling property of Aerosil 200 in ethyl alcohol. After the evaporation of the ethyl alcohol, the large surface of SiO
2 ixes the CLP and protects against crystal growth,
because of the interaction between CLP and SiO2. his
interaction presumably involves H-bonding with the surface silanol groups of SiO
2. Such silanol groups
are not present on the surface of Syloid 72 FP, which rules out this interaction. his supposition is based on the reported veriication of the presence of H-bonding between indomethacin and SiO
2 by solid-state nuclear
magnetic resonance imaging32. hese results led us to choose Aerosil 200 as crystallization inhibitor for the scaling-up process. his auxiliary agent is a classical additive in pharmaceutical formulations. In the case of
solid forms, it can be used as glidant33 or coating mate-rial34 in tablet making, as surface modiier (for example, DPI formulations, due to its highly hydrophilic and adsorbing property)35 and as auxiliary agent in the case of preparation of solid dispersion36. It is an amorphous agent itself, and thus the presence of API crystals in samples can be detected unambiguously, e.g. by DSC.
he following step in this work was to ind the opti-mum CLP/Aerosil 200 ratio. Five diferent compositions were tested with this aim. he DSC curves are presented in Figure 3. Melting is not detected in curves A, B, C, D and E, and these samples can therefore be regarded as amorphous. Curve F, which relates to a CLP:Aerosil 200 ratio of 9:1, indicates T
m at 169.5°C, which means the
recrystallization of CLP. Accordingly, this amount of crys-tallization inhibitor is not suicient to maintain the active agent in amorphous form. For this reason, a CLP:SiO
2
ratio of 7:3 was chosen for tablet formulation.
Amorphization in scaling-up processhe next step was to stabilize amorphous CLP on the sur-face of the carrier. In this system, MCC was used as the carrier, which serves as a iller/binder in tablet making. In Sample 1, the alcoholic solution of CLP was vaporized onto the surface of the mixture of MCC and Aerosil 200. With this preparation procedure, the powder underwent considerable outlow from the pan (powder efusing or dusting). he yield of the preparation was only 64.8%. For Sample 2, only MCC was added to the pan. he mixture of CLP and Aerosil 200 was dissolved in ethyl alcohol (96% v/v) and vaporized onto MCC bed. he yield of this preparation method was 85.2%, clearly indicating
30
10
mW
^exo
A
B
C
D
E
F
40 50 60 70 80 90 100 110 120 130 140 150 160 170 180 190 °C
Figure 3. DSC curves of samples containing Aerosil 200. A: Reference (crystalline CLP), B: CLP:SiO2 = 1:9, C: CLP:SiO
2 = 3:7, D: CLP:SiO
2 = 1:1,
E: CLP:SiO2 = 7:3, F: CLP:SiO
2 = 9:1
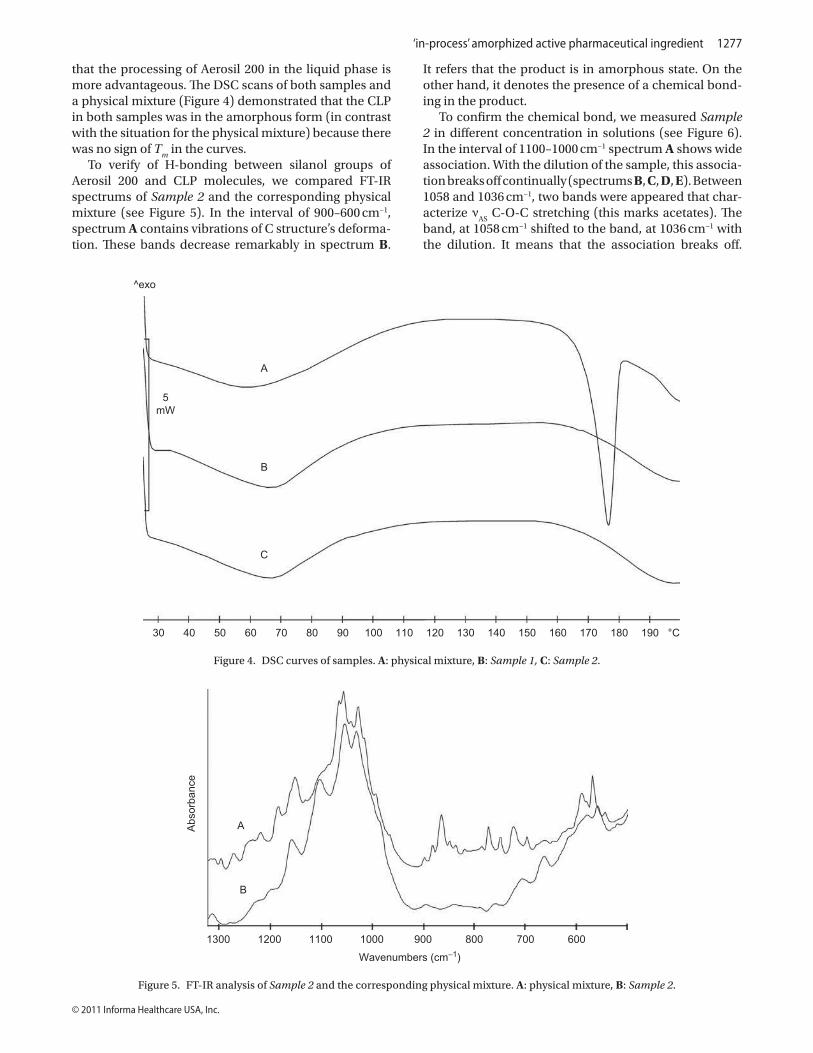
‘in-process’ amorphized active pharmaceutical ingredient 1277
© 2011 Informa Healthcare USA, Inc.
that the processing of Aerosil 200 in the liquid phase is more advantageous. he DSC scans of both samples and a physical mixture (Figure 4) demonstrated that the CLP in both samples was in the amorphous form (in contrast with the situation for the physical mixture) because there was no sign of T
m in the curves.
To verify of H-bonding between silanol groups of Aerosil 200 and CLP molecules, we compared FT-IR spectrums of Sample 2 and the corresponding physical mixture (see Figure 5). In the interval of 900–600 cm−1, spectrum A contains vibrations of C structure’s deforma-tion. hese bands decrease remarkably in spectrum B.
It refers that the product is in amorphous state. On the other hand, it denotes the presence of a chemical bond-ing in the product.
To conirm the chemical bond, we measured Sample 2 in diferent concentration in solutions (see Figure 6). In the interval of 1100–1000 cm−1 spectrum A shows wide association. With the dilution of the sample, this associa-tion breaks of continually (spectrums B, C, D, E). Between 1058 and 1036 cm−1, two bands were appeared that char-acterize ν
AS C-O-C stretching (this marks acetates). he
band, at 1058 cm−1 shifted to the band, at 1036 cm−1 with the dilution. It means that the association breaks of.
1300 1200
A
B
1100 1000 900
Wavenumbers (cm−1)
Absorb
ance
800 700 600
Figure 5. FT-IR analysis of Sample 2 and the corresponding physical mixture. A: physical mixture, B: Sample 2.
30
5
mW
^exo
A
B
C
40 50 60 70 80 90 100 110 120 130 140 150 160 170 180 190 °C
Figure 4. DSC curves of samples. A: physical mixture, B: Sample 1, C: Sample 2.
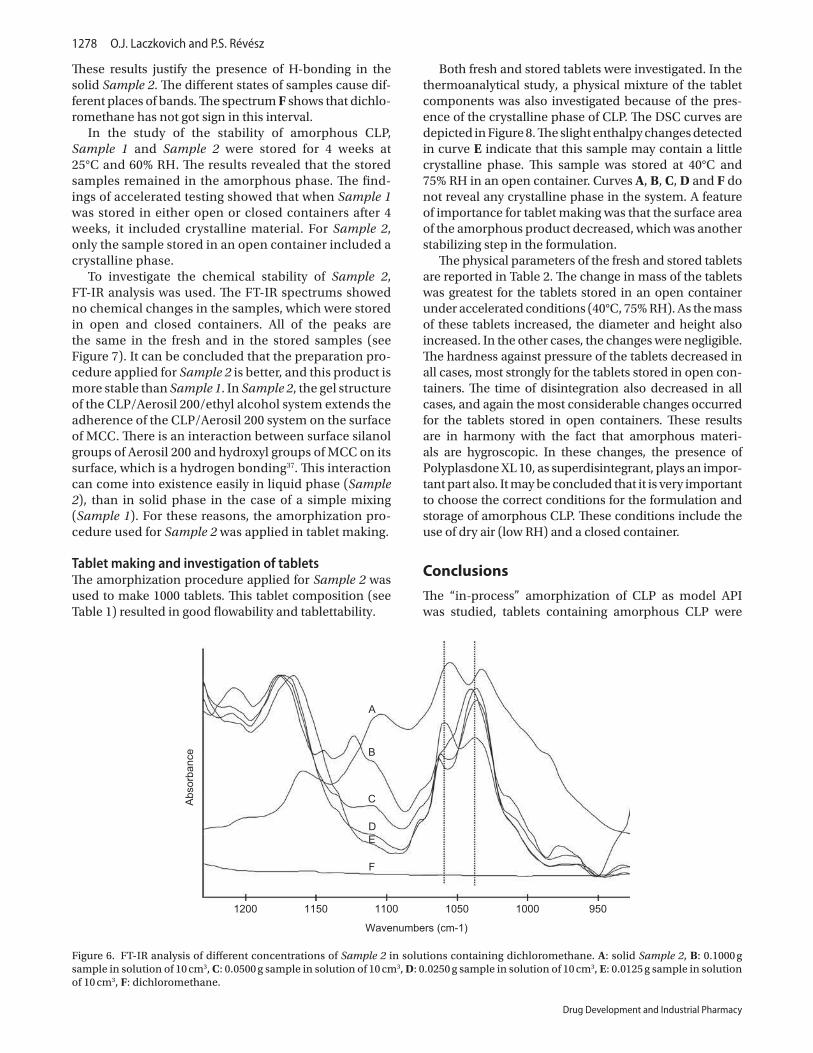
1278 O.J. Laczkovich and P.S. Révész
Drug Development and Industrial Pharmacy
hese results justify the presence of H-bonding in the solid Sample 2. he diferent states of samples cause dif-ferent places of bands. he spectrum F shows that dichlo-romethane has not got sign in this interval.
In the study of the stability of amorphous CLP, Sample 1 and Sample 2 were stored for 4 weeks at 25°C and 60% RH. he results revealed that the stored samples remained in the amorphous phase. he ind-ings of accelerated testing showed that when Sample 1 was stored in either open or closed containers after 4 weeks, it included crystalline material. For Sample 2, only the sample stored in an open container included a crystalline phase.
To investigate the chemical stability of Sample 2, FT-IR analysis was used. he FT-IR spectrums showed no chemical changes in the samples, which were stored in open and closed containers. All of the peaks are the same in the fresh and in the stored samples (see Figure 7). It can be concluded that the preparation pro-cedure applied for Sample 2 is better, and this product is more stable than Sample 1. In Sample 2, the gel structure of the CLP/Aerosil 200/ethyl alcohol system extends the adherence of the CLP/Aerosil 200 system on the surface of MCC. here is an interaction between surface silanol groups of Aerosil 200 and hydroxyl groups of MCC on its surface, which is a hydrogen bonding37. his interaction can come into existence easily in liquid phase (Sample 2), than in solid phase in the case of a simple mixing (Sample 1). For these reasons, the amorphization pro-cedure used for Sample 2 was applied in tablet making.
Tablet making and investigation of tabletshe amorphization procedure applied for Sample 2 was used to make 1000 tablets. his tablet composition (see Table 1) resulted in good lowability and tablettability.
Both fresh and stored tablets were investigated. In the thermoanalytical study, a physical mixture of the tablet components was also investigated because of the pres-ence of the crystalline phase of CLP. he DSC curves are depicted in Figure 8. he slight enthalpy changes detected in curve E indicate that this sample may contain a little crystalline phase. his sample was stored at 40°C and 75% RH in an open container. Curves A, B, C, D and F do not reveal any crystalline phase in the system. A feature of importance for tablet making was that the surface area of the amorphous product decreased, which was another stabilizing step in the formulation.
he physical parameters of the fresh and stored tablets are reported in Table 2. he change in mass of the tablets was greatest for the tablets stored in an open container under accelerated conditions (40°C, 75% RH). As the mass of these tablets increased, the diameter and height also increased. In the other cases, the changes were negligible. he hardness against pressure of the tablets decreased in all cases, most strongly for the tablets stored in open con-tainers. he time of disintegration also decreased in all cases, and again the most considerable changes occurred for the tablets stored in open containers. hese results are in harmony with the fact that amorphous materi-als are hygroscopic. In these changes, the presence of Polyplasdone XL 10, as superdisintegrant, plays an impor-tant part also. It may be concluded that it is very important to choose the correct conditions for the formulation and storage of amorphous CLP. hese conditions include the use of dry air (low RH) and a closed container.
Conclusions
he “in-process” amorphization of CLP as model API was studied, tablets containing amorphous CLP were
1100
A
B
C
D
E
F
Wavenumbers (cm-1)
Absorb
ance
1150 10001050 9501200
Figure 6. FT-IR analysis of diferent concentrations of Sample 2 in solutions containing dichloromethane. A: solid Sample 2, B: 0.1000 g sample in solution of 10 cm3, C: 0.0500 g sample in solution of 10 cm3, D: 0.0250 g sample in solution of 10 cm3, E: 0.0125 g sample in solution of 10 cm3, F: dichloromethane.

‘in-process’ amorphized active pharmaceutical ingredient 1279
© 2011 Informa Healthcare USA, Inc.
produced, and the stability of the product was tested. he results suggested the following amorphization protocol (see Figure 9):
In the irst step, a suitable solvent for the API should •be selected. In this step, it is very important that the crystalline API should dissolve completely: any crys-tals remaining in the system can function as seeds
and crystallization can start during evaporation of the solvent.In the second step, a suitable crystallization inhibi-•tor should be selected and the optimum amount of this auxiliary agent required to maintain the API in amorphous form should be determined. In this step, several crystallization inhibitors should be screened
30
5
mW
^exo
A
B
C
D
E
F
40 50 60 70 80 90 100 110 120 130 140 150 160 170 180 190 °C
Figure 8. Stability of tablets. A: Physical mixture, B: fresh product, C: stored sample (25°C, 60% RH, open), D: stored sample (25°C, 60% RH, closed), E: stored sample (40°C, 75% RH, open), F: stored sample (40°C, 75% RH, closed).
2500
Wavenumbers (cm−1)
Rela
tive r
eflecta
nce
2000 1500 1000 5003000
A
B
C
3500
Figure 7. FT-IR investigation of the fresh and stored Sample 2. A: fresh Sample 2, B: stored Sample 2 (40°C, 75% RH, open), C: stored Sample
2 (40°C, 75% RH, closed).

1280 O.J. Laczkovich and P.S. Révész
Drug Development and Industrial Pharmacy
and, if possible, the type of interaction between the API and the auxiliary agent should be investigated.In the third step, the amorphization process must be •scaled up.In the fourth step, the amorphized API should be sta-•bilized on the surface of a carrier. his is an important step in this protocol, because the API, the crystal-lization inhibitor and the carrier act together in this system to result in stable amorphous API during the technological process.In the ifth step, the external phase of the tablets •should be mixed with the amorphized product. he mixing must be performed very carefully, because mechanical force can induce recrystallization.In the sixth step, the tablets should be pressed. •Compression can be a further stabilizing step, ixing the amorphous form because of the smaller surface.
Acknowledgment
he help of Ottó Berkesi and Gabriella Farkas is grate-fully acknowledged for the measurement of FT-IR analysis.
Declaration of interest
his work was supported by TÁMOP-Hungary research project: Development of teranostics in cardiovascular, metabolics, and inlammatory diseases (TÁMOP-4.2.2-08/1-2008-0013).
References
1. Hancock BC, Zograi G. (1997). Characteristics and signiicance of amorphous state in pharmaceutical systems. J Pharm Sci, 86:1–12.
2. Aaltonen J, Allesø M, Mirza S, Koradia V, Gordon KC, Rantanen J (2009). Solid form screening—A review. Eur J Pharm Biopharm, 71:23–37.
3. Yu L. (2001). Amorphous pharmaceutical solids: Preparation, characterization and stabilization. Adv Drug Deliv Rev, 48:27–42.
4. Craig DQ, Royall PG, Kett VL, Hopton ML. (1999). he relevance of the amorphous state to pharmaceutical dosage forms: Glassy drugs and freeze dried systems. Int J Pharm, 179:179–207.
5. Pokharkar VB, Mandpe LP, Padamwar MN, Ambike AA, Mahadik KR, Paradkar A. (2006). Development, characterization and stabilization of amorphous form of a low Tg drug. Powder Technol, 167:20–25.
6. Cui Y. (2007). A material science perspective of pharmaceutical solids. Int J Pharm, 339:3–18.
7. Forster A, Rades T, Hempenstall J. (2002). Selection of suitable drug and excipient candidates to prepare glass solutions by melt extrusion for immediate release oral formulations. Pharm Technol Eur, 14:27–37.
8. Franks F. (2003). Scientiic and technological aspects of aqueous glasses. Biophys Chem, 105:251–261.
9. Ziewiec K, Bryla K, Blachowski A, Ruebenbauer K, Mucha D. (2009). Characterization of microstructures and amorphization in Ni-Cu-Fe-P system. J Alloy Compd, 483:585–588.
10. Panchagnula R, Bhardwaj V. (2008). Efect of amorphous content on dissolution characteristics of rifampicin. Drug Dev Ind Pharm, 34:642–649.
11. Casas M, Ferrero C, de Paz MV, Jiménez-Castellanos MR. (2009). Synthesis and characterization of new copolymers of ethyl methacrylate grafted on tapioca starch as novel excipients for direct compression matrix tablets. Eur Polym J, 45:1765–1776.
12. Hancock BC, Parks M. (2000). What is the true solubility advantage for amorphous pharmaceuticals? Pharm Res, 17:397–404.
13. Leuner C, Dressman J. (2000). Improving drug solubility for oral delivery using solid dispersions. Eur J Pharm Biopharm, 50:47–60.
14. Forster A, Hempenstall J, Tucker I, Rades T. (2001). Selection of excipients for melt extrusion with two poorly water-soluble drugs by solubility parameter calculation and thermal analysis. Int J Pharm, 226:147–161.
15. Kinoshita M, Baba K, Nagayasu A, Yamabe K, Shimooka T, Takeichi Y et al. (2002). Improvement of solubility and oral bioavailability of a poorly water-soluble drug, TAS-301, by its melt-adsorption on a porous calcium silicate. J Pharm Sci, 91:362–370.
16. Zhang GG, Law D, Schmitt EA, Qiu Y. (2004). Phase transformation considerations during process development and manufacture of solid oral dosage forms. Adv Drug Deliv Rev, 56:371–390.
17. Bozic DZ, Dreu R, Vrečer F. (2008). Inluence of dry granulation on compatibility and capping tendency of macrolide antibiotic formulation. Int J Pharm, 357:44–54.
18. Kerč J, Srčič S. (1995). hermal analysis of glassy pharmaceuticals. hermochim Acta, 248:81–95.
19. Fix I, Stefens KJ. (2004). Quantifying low amorphous or crystalline amounts of α-lactose-monohydrate using X-ray powder difraction, near-infrared spectroscopy, and diferential scanning calorimetry. Drug Dev Ind Pharm, 30:513–523.
Table 2. Investigation of tablet parameters.
Tablets Mass (g) Diameter (mm) Height (mm)Hardness against
pressure (N) Time of disintegration (s)
Fresh 0.4060 (SD ± 0.003) 12.10 (SD ± 0.060) 3.50 (SD ± 0.023) 93.4 (SD ± 2.67) 86 (SD ± 27)
Stored 25°C and 60% RH
Open 0.4097 (SD ± 0.004) 12.13 (SD ± 0.050) 3.55 (SD ± 0.032) 70.4 (SD ± 3.63) 30 (SD ± 13)
Closed 0.4078 (SD ± 0.004) 12.12 (SD ± 0.054) 3.51 (SD ± 0.027) 83.6 (SD ± 3.37) 54 (SD ± 13)
Stored 40°C and 75% RH
Open 0.4106 (SD ± 0.003) 12.24 (SD ± 0.038) 3.69 (SD ± 0.016) 65.8 (SD ± 2.74) 6 (SD ± 4)
Closed 0.4060 (SD ± 0.003) 12.10 (SD ± 0.009) 3.53 (SD ± 0.021) 84.8 (SD ± 3.79) 79 (SD ± 16)
Selection of a suitable crystallization
inhibitor, optimal the ratio of
API:crystallization inhibitor
Selection of suitable solvent
Protocol of ‘in process’ amorphization
with solvent method
Amorphization in scaling-up
Making tablets6. step
5. step
4. step
3. step
2. step
1. step
Mixing with external phase of tablets
Stabilization of amorphized API
on the surface of a carrier
Figure 9. Protocol of ‘in-process’ amorphization.
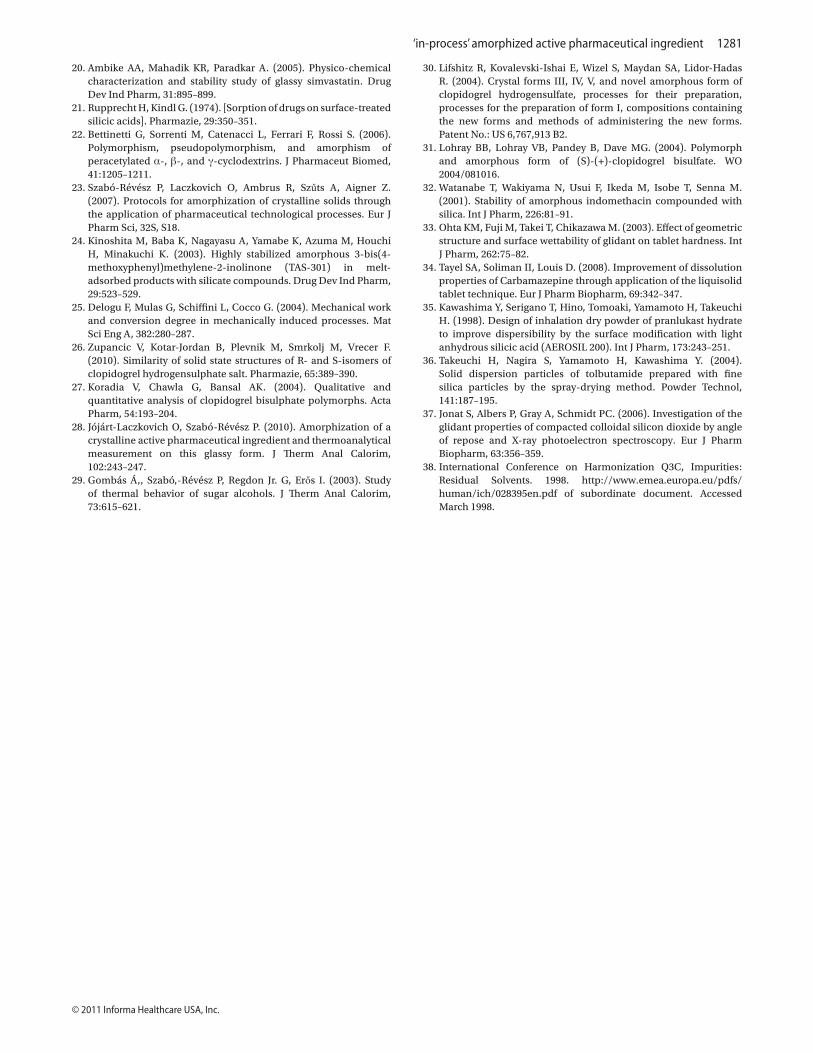
‘in-process’ amorphized active pharmaceutical ingredient 1281
© 2011 Informa Healthcare USA, Inc.
20. Ambike AA, Mahadik KR, Paradkar A. (2005). Physico-chemical characterization and stability study of glassy simvastatin. Drug Dev Ind Pharm, 31:895–899.
21. Rupprecht H, Kindl G. (1974). [Sorption of drugs on surface-treated silicic acids]. Pharmazie, 29:350–351.
22. Bettinetti G, Sorrenti M, Catenacci L, Ferrari F, Rossi S. (2006). Polymorphism, pseudopolymorphism, and amorphism of peracetylated α-, β-, and γ-cyclodextrins. J Pharmaceut Biomed, 41:1205–1211.
23. Szabó-Révész P, Laczkovich O, Ambrus R, Szűts A, Aigner Z. (2007). Protocols for amorphization of crystalline solids through the application of pharmaceutical technological processes. Eur J Pharm Sci, 32S, S18.
24. Kinoshita M, Baba K, Nagayasu A, Yamabe K, Azuma M, Houchi H, Minakuchi K. (2003). Highly stabilized amorphous 3-bis(4-methoxyphenyl)methylene-2-inolinone (TAS-301) in melt-adsorbed products with silicate compounds. Drug Dev Ind Pharm, 29:523–529.
25. Delogu F, Mulas G, Schiini L, Cocco G. (2004). Mechanical work and conversion degree in mechanically induced processes. Mat Sci Eng A, 382:280–287.
26. Zupancic V, Kotar-Jordan B, Plevnik M, Smrkolj M, Vrecer F. (2010). Similarity of solid state structures of R- and S-isomers of clopidogrel hydrogensulphate salt. Pharmazie, 65:389–390.
27. Koradia V, Chawla G, Bansal AK. (2004). Qualitative and quantitative analysis of clopidogrel bisulphate polymorphs. Acta Pharm, 54:193–204.
28. Jójárt-Laczkovich O, Szabó-Révész P. (2010). Amorphization of a crystalline active pharmaceutical ingredient and thermoanalytical measurement on this glassy form. J herm Anal Calorim, 102:243–247.
29. Gombás Á,, Szabó,-Révész P, Regdon Jr. G, Erős I. (2003). Study of thermal behavior of sugar alcohols. J herm Anal Calorim, 73:615–621.
30. Lifshitz R, Kovalevski-Ishai E, Wizel S, Maydan SA, Lidor-Hadas R. (2004). Crystal forms III, IV, V, and novel amorphous form of clopidogrel hydrogensulfate, processes for their preparation, processes for the preparation of form I, compositions containing the new forms and methods of administering the new forms. Patent No.: US 6,767,913 B2.
31. Lohray BB, Lohray VB, Pandey B, Dave MG. (2004). Polymorph and amorphous form of (S)-(+)-clopidogrel bisulfate. WO 2004/081016.
32. Watanabe T, Wakiyama N, Usui F, Ikeda M, Isobe T, Senna M. (2001). Stability of amorphous indomethacin compounded with silica. Int J Pharm, 226:81–91.
33. Ohta KM, Fuji M, Takei T, Chikazawa M. (2003). Efect of geometric structure and surface wettability of glidant on tablet hardness. Int J Pharm, 262:75–82.
34. Tayel SA, Soliman II, Louis D. (2008). Improvement of dissolution properties of Carbamazepine through application of the liquisolid tablet technique. Eur J Pharm Biopharm, 69:342–347.
35. Kawashima Y, Serigano T, Hino, Tomoaki, Yamamoto H, Takeuchi H. (1998). Design of inhalation dry powder of pranlukast hydrate to improve dispersibility by the surface modiication with light anhydrous silicic acid (AEROSIL 200). Int J Pharm, 173:243–251.
36. Takeuchi H, Nagira S, Yamamoto H, Kawashima Y. (2004). Solid dispersion particles of tolbutamide prepared with ine silica particles by the spray-drying method. Powder Technol, 141:187–195.
37. Jonat S, Albers P, Gray A, Schmidt PC. (2006). Investigation of the glidant properties of compacted colloidal silicon dioxide by angle of repose and X-ray photoelectron spectroscopy. Eur J Pharm Biopharm, 63:356–359.
38. International Conference on Harmonization Q3C, Impurities: Residual Solvents. 1998. http://www.emea.europa.eu/pdfs/human/ich/028395en.pdf of subordinate document. Accessed March 1998.