University of South Florida System and DSO/Component ... of South Florida System and DSO/Component...
29
University of South Florida System and DSO/Component Unit Quarterly Financial Reports QUARTER 3 FOR FISCAL YEAR 2014-2015 Period Ended March 31, 2015
Transcript of University of South Florida System and DSO/Component ... of South Florida System and DSO/Component...

University of South Florida System and DSO/Component Unit Quarterly Financial Reports
QUARTER 3 FOR FISCAL YEAR 2014-2015
Period Ended March 31, 2015
INDEX University of South Florida System .................................................................. 2-4
USF Foundation ................................................................................................ 5-7
USF Alumni Association .................................................................................. 8-10
USF Financing Corporation .............................................................................. 11-13
University Medical Service Association, Inc. ................................................... 14-16
USF Medical Services Support Corporation ..................................................... 17-19
USF Research Foundation ................................................................................. 20-22
USF Health Professions Conferencing Corporation ......................................... 23-25
Sun Dome, Inc. .................................................................................................. 26-28
FY 2015 QUARTER 3 REPORT – MARCH 31, 2015
[ Page 1 of 28 ]

(In thousands)
2015 2014ACTUAL ACTUAL $ %
ASSETS
Current AssetsCash and Cash Equivalents $12,968 $18,618 $(5,650) (30)%Investments 540,183 495,243 44,940 9 %Receivables 98,337 92,344 5,993 6 %Due from Primary and Component Units 73,438 47,183 26,255 56 %Other Current Assets 1,537 2,138 (601) (28)%Total Current Assets $726,463 $655,526 $70,937 11 %
Noncurrent AssetsRestricted Cash and Cash Equivalents $9,944 $2,215 $7,729 349 %Restricted Investments 40,245 33,192 7,053 21 %Capital Assets 1,347,865 1,350,537 (2,672) (0)%
Less: Accumulated Depreciation (606,668) (598,291) (8,377) (1)%Non-Depreciable Items (CIP, Land, etc.) 41,641 53,897 (12,256) (23)%Loans and Notes Receivable, net of allowance 4,570 4,318 252 6 %Other 0 262 (262) (100)%Total Noncurrent Assets $837,597 $846,130 $(8,533) (1)%
Total Assets $1,564,060 $1,501,656 $62,404 4 %
LIABILITIES
Current LiabilitiesAccounts Payable $16,935 $15,915 $1,020 6 %Accrued Salaries and Benefits 12,414 11,270 1,144 10 %Due to Primary and Component Units 29,190 36,517 (7,327) (20)%Unearned Revenue 33,290 41,799 (8,509) (20)%Other Current Liabilities 16,160 20,573 (4,413) (21)%Total Current Liabilities $107,989 $126,074 $(18,085) (14)%
Noncurrent LiabilitiesLong Term Debt $25,377 $28,242 $(2,865) (10)%Compensated Absences 63,598 57,663 5,935 10 %Other Noncurrent Liabilities 96,369 75,799 20,570 27 %Total Noncurrent Liabilities $185,344 $161,704 $23,640 15 %
Total Liabilities $293,333 $287,778 $5,555 2 %
NET POSITION $1,270,727 $1,213,878 $56,849 5 %
Total Liabilities & Net Assets $1,564,060 $1,501,656 $62,404 4 %
FY 2015 QUARTER 3 REPORT - MARCH 31, 2015
University of South Florida System
BALANCE SHEET
9 Months Ended March 31,Variance
[ Page 2 of 28 ]

(In thousands)2015 2014
ACTUAL ACTUAL $ %REVENUES Tuition & Fees, net $259,826 $244,989 $14,837 6 %State Appropriations 246,658 230,583 16,075 7 %Contracts & Grants 235,158 228,945 6,213 3 %Federal & State Financial Aid 98,240 103,523 (5,283) (5)%Program Revenue / Sales / Services 99,394 84,294 15,100 18 %Noncapital Grants and Donations 19,660 16,854 2,806 17 %Investment Income (Loss) 4,893 15,230 (10,337) (68)%Other Revenues 2,063 3,188 (1,125) (35)%Total Revenues $965,892 $927,606 $38,286 4 %
EXPENSESSalaries & Benefits $569,169 $541,013 $28,156 5 %Scholarships & Fellowships 80,605 85,470 (4,865) (6)%Services and Supplies 183,298 158,819 24,479 15 %Utilities and Communications 19,948 19,928 20 0 %Interest Paid on Debt 735 1,716 (981) (57)%Depreciation/Amortization 36,927 38,055 (1,128) (3)%Other expenses 26,854 18,645 8,209 44 %Total Expenses $917,536 $863,646 $53,890 6 %
Operating Profit $48,356 $63,960 $(15,604) (24)%
Non Operating State Capital Appropriations $43,842 $37,511 $6,331 17 %Capital Grants, Contracts, Donations & Fees $1,612 $1,719 $(107) (6)%Transfer to/from Primary Government / Other SUS $2,026 $(8,635) $10,661 123 %
INCREASE (DECREASE) in Net Position $95,836 $94,555 $1,281 1 %
Variance
FY 2015 QUARTER 3 REPORT - MARCH 31, 2015
University of South Florida System
INCOME STATEMENT
9 Months Ended March 31,
[ Page 3 of 28 ]

(In thousands)
2015 2014ACTUAL ACTUAL $ %
BEGINNING CASH $579,261 $471,050 $108,211 23 %
Cash Flow from Operating Activities Tuition & Fees $234,526 $227,775 $6,751 3 % Contracts and Grants 234,474 232,245 2,229 1 % Program Revenue / Sales / Services 95,672 81,549 14,123 17 % Other Operating Activities 2,345 2,846 (501) (18)% Operating Expenses (863,540) (810,839) (52,701) (6)%Net Cash Flow from Operating Activities $(296,523) $(266,424) $(30,099) (11)%
Cash Flow from Financing Activities State Appropriations $260,463 $232,450 $28,013 12 % Federal and State Financial Aid $98,240 $103,523 $(5,283) (5)% Noncapital Grants, Contracts and Donations $16,585 $14,859 $1,726 12 % Acquisition / Construction of Capital Asset (21,210) (7,332) (13,878) (189)% Principal & Interest Payments (936) (3,299) 2,363 72 % Capital Grants, Contracts, Donations and Fees 292 1,719 (1,427) (83)% Other Financing Activities (37,725) (12,508) (25,217) (202)%Net Cash Flow from Financing Activities $315,709 $329,412 $(13,703) (4)%
Cash Flow from Investing ActivitiesInvestment Income 4,893 15,230 (10,337) (68)%Net Cash Flow from Investing Activities $4,893 $15,230 $(10,337) (68)%
ENDING CASH $603,340 $549,268 $54,072 10 %
FY 2015 QUARTER 3 REPORT - MARCH 31, 2015
University of South Florida System
STATEMENT OF CASH FLOWS
9 Months Ended March 31,Variance
[ Page 4 of 28 ]

STATEMENT OF FINANCIAL POSITION
AuditedCurrent Year Prior Year
3/31/2015 6/30/2014 $ %
AssetsCash and cash equivalents 1,628,779$ 471,291$ 1,157,488 246%Operating investment pool 73,686,161 67,160,853 6,525,308 10%Contributions receivable, net 45,759,033 38,102,797 7,656,236 20%Accrued interest & other receivables, net 910,551 1,031,866 (121,315) -12%Endowment investment pool 449,352,707 449,776,559 (423,852) 0%Remainder interest trusts 1,879,932 1,682,855 197,077 12%Funds held in trust by others 13,724,249 10,790,395 2,933,854 27%Books and art objects 3,292,408 3,121,509 170,899 5%Capitalized lease receivable, net 6,200,000 - 6,200,000 100%Land, buildings, and equipment, net 457,404 473,230 (15,826) -3%Real estate held for resale 600,000 684,113 (84,113) -12%
Total assets 597,491,224$ 573,295,468$ 24,195,756$ 4%
Liabilities and Net AssetsLiabilities:Accounts payable and accrued expenses 5,368,159$ 4,602,733$ 765,426 17%Mortgage payable 6,200,000 -$ 6,200,000 100%Annuities and life income trusts payable 706,683 718,187 (11,504) -2%Amounts due to third-party beneficiaries 26,726,802 26,618,252 108,550 0%Due to the University of South Florida 1,131,491 641,738 489,753 76%Total liabilities 40,133,135 32,580,910 7,552,225 23%
Net Assets:Unrestricted net assets 12,845,722 9,462,510 3,383,212 36%Temporarily restricted net assets 205,517,281 204,147,100 1,370,181 1%Permanently restricted net assets 338,995,086 327,104,948 11,890,138 4%Total net assets 557,358,089 540,714,558 16,643,531 3%
Total liabilities and net assets 597,491,224$ 573,295,468$ 24,195,756$ 4%
Records of the University of South Florida are subject to disclosure under the Florida Public Records law unless exempt by law. Documents made or received by a USF Foundation agent in connection with the transaction of business by the USF Foundation are confidential and exempt from F.S. 119 pursuant to F.S. 1004.28(5) and in
accordance with the USF Foundation Policy on Confidentiality of USF Foundation Documents.
Variance
[ Page 5 of 28 ]

Current Year Prior Year3/31/2015 3/31/2014 $ %
Revenues:
Contributions, gifts and bequests 37,026,126$ 47,964,444 (10,938,318) -23% Fundraising activities 1,875,699 1,641,735 233,964 14% Investment income 4,408,434 4,680,582 (272,148) -6% Campaign support 3,183,691 2,558,269 625,422 24%
Total revenues 46,493,951 56,845,030 (10,351,079) -18%
Expenditures:
Program services: Salaries and benefits 13,588,996 12,001,076 1,587,920 13% Scholarships/fellowships 6,411,998 5,893,993 518,005 9% Contractual services 3,848,794 2,940,971 907,823 31% Supplies 2,650,683 2,535,373 115,310 5% Transfers to state - other 876,158 435,132 441,026 101% Gift in kind transfers 1,219,747 29,025,983 (27,806,236) -96% Travel, meals & auto 2,088,514 1,997,334 91,180 5% Community relations 643,014 814,561 (171,547) -21% Depreciation 15,826 16,273 (447) -3% Repairs and maintenance 500,182 466,668 33,514 7% Provision for doubtful accounts 1,843,703 7,702,238 (5,858,535) -76% Other 352,489 1,319,907 (967,418) -80%
Total program service expense 34,040,103 65,149,509 (31,109,406) -48%
Fundraising & operating costs: Salaries and benefits 1,378,551 3,173,474 (1,794,923) -57% Contractual services 593,838 853,545 (259,707) -30% Other transfers and expenses 2,141,285 3,732,726 (1,591,441) -43%
Total fundraising & operating expense 4,113,675 7,759,745 (3,646,070) -47%
Total expenditures 38,153,778 72,909,254 (34,755,476) -48%
Change in net assets before change in market value 8,340,173 (16,064,224) 24,404,397 152%
Changes in market value:Unrealized investment income gain (3,358,982) 40,025,180 (43,384,162) -108%Realized investment income gain 11,662,341 12,198,038 (535,697) -4%Total changes in market value 8,303,360 52,223,218 (43,919,858) -84%Change in net assets 16,643,533$ 36,158,994 (19,515,461) -54%
STATEMENT OF CHANGES IN NET ASSETS
Records of the University of South Florida are subject to disclosure under the Florida Public Records law unless exempt by law. Documents made or received by a USF Foundation agent in connection with the transaction of business by the USF Foundation are confidential and exempt from F.S. 119 pursuant to F.S. 1004.28(5) and in accordance with the USF Foundation Policy on Confidentiality of USF Foundation Documents.
Fiscal Year 2014Variance
Year-to-Date
[ Page 6 of 28 ]

Current Year Prior Year3/31/2015 6/30/2014
Change in Net Assets 16,643,533 40,199,689
Operating ActivitiesDepreciation 15,826 24,374 Investment (gains) losses, net (10,483,740) (68,901,173) Change in assets/liabilities:
Contributions receivable (7,656,236) 3,455,929 Other receivables 121,315 3,177,450 Books and art objects (170,901) 81,575 Accounts payable & accrued expenses 765,426 (4,468,560) Annuities & life income trusts payable (11,504) 310,158 Amts due to third-party beneficiaries (215,341) 1,693,220 Due to University of South Florida 489,753 (59,222) Gift of real estate/Impairment loss on real estate - 1,232
Net cash flow from operating activities (501,869) (24,485,328)
Investing ActivitiesProceeds from sale of real estate held for resale 112,221 - Net gain on sale of real estate held for resale (28,108) - Purchase of land, buildings and equipment (6,200,000) - Transfer of land, buildings and equipment 6,200,000 - Proceeds from sale of investments 20,005,899 182,161,817 Purchases of investments (12,884,695) (155,910,728) Interest & dividends reinvested (5,545,960) (5,436,427) Repayment of loans to the University of South Florida - 117,886 Net cash flow from investing activities 1,659,357 20,932,548
Financing ActivitiesIssuance of mortgage payable 6,200,000 - Capitalized lease receivable (6,200,000) - Proceeds from contributions restricted for long-term investment - 2,460,060 Net cash flow from investing activities - 2,460,060
Net increase in cash 1,157,488 (1,092,720) Cash at the beginning of the year 471,291 1,564,011 Cash at the end of the year 1,628,779 471,291
STATEMENT OF CASH FLOWS
Records of the University of South Florida are subject to disclosure under the Florida Public Records law unless exempt by law. Documents made or received by a USF Foundation agent in connection with the transaction of business by the USF Foundation are confidential and exempt from F.S. 119 pursuant to F.S. 1004.28(5) and in
accordance with the USF Foundation Policy on Confidentiality of USF Foundation Documents.
[ Page 7 of 28 ]

March 31, 2015 June 30, 2014 Variance $ Variance %
ASSETS
Cash and cash equivalents 330,761 154,315 176,446 114%
Pooled investments within Foundation 838,392 838,392 ‐ 0%
Accounts receivable 54,678 55,112 (434) ‐1%
Prepaid expenses 33,529 35,437 (1,908) ‐5%
Total assets 1,257,360 1,083,256 174,104 16%
LIABILITIES AND NET ASSETS
Liabilities:
Accounts payable and accrued expenses 36,311 91,045 (54,734) 60%
Due to Foundation 33,219 33,219 ‐ 0%
Due to USF 69,318 25,211 44,107 ‐175%
Deferred revenue 200,145 130,635 69,510 ‐53%
Total liabilities 338,993 280,110 58,883 ‐21%
Net Assets:
Unrestricted net assets 918,367 803,146 115,221 14%
Total liabilities and net assets 1,257,360 1,083,256 174,104 16%
Reserve: Principle 838,392 838,392
Reserve: Market Adjustment 107,281 128,385
Total Reserve 945,673 966,777
University of South Florida Alumni Association, Inc.
Operating Balance Sheet
Confidential
For internal use only
[ Page 8 of 28 ]
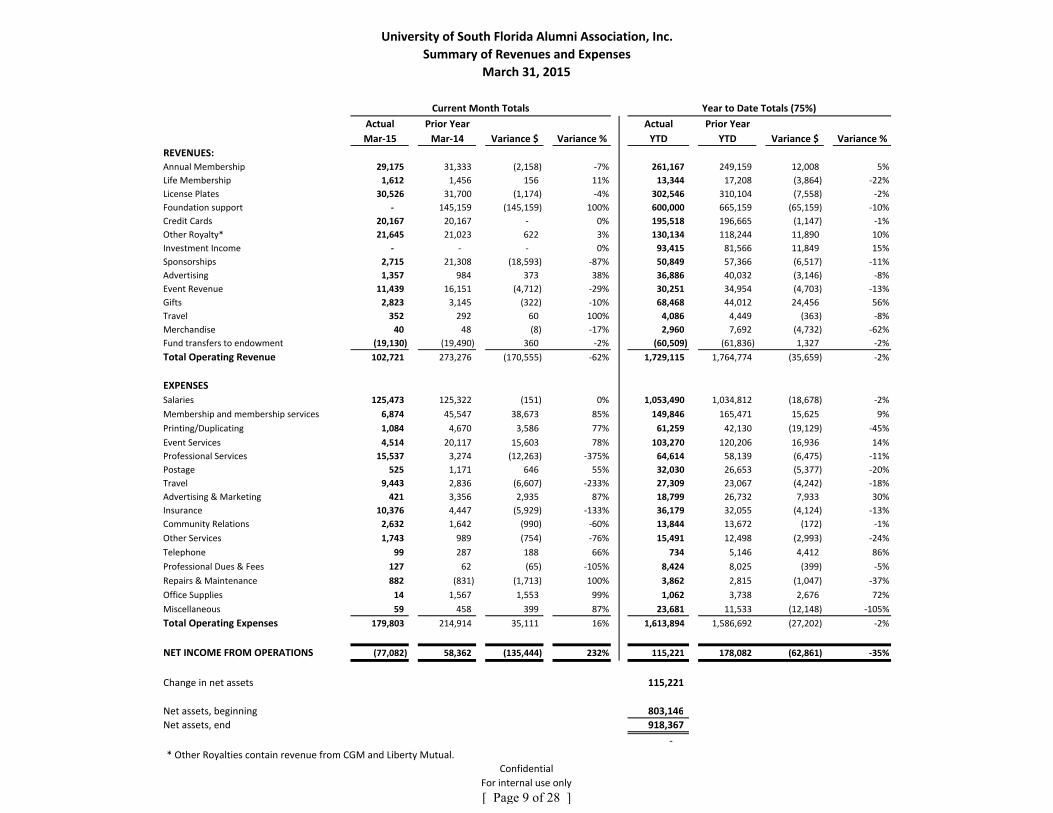
Actual Prior Year Actual Prior Year
Mar‐15 Mar‐14 Variance $ Variance % YTD YTD Variance $ Variance %
REVENUES:Annual Membership 29,175 31,333 (2,158) ‐7% 261,167 249,159 12,008 5%
Life Membership 1,612 1,456 156 11% 13,344 17,208 (3,864) ‐22%
License Plates 30,526 31,700 (1,174) ‐4% 302,546 310,104 (7,558) ‐2%
Foundation support ‐ 145,159 (145,159) 100% 600,000 665,159 (65,159) ‐10%
Credit Cards 20,167 20,167 ‐ 0% 195,518 196,665 (1,147) ‐1%
Other Royalty* 21,645 21,023 622 3% 130,134 118,244 11,890 10%
Investment Income ‐ ‐ ‐ 0% 93,415 81,566 11,849 15%
Sponsorships 2,715 21,308 (18,593) ‐87% 50,849 57,366 (6,517) ‐11%
Advertising 1,357 984 373 38% 36,886 40,032 (3,146) ‐8%
Event Revenue 11,439 16,151 (4,712) ‐29% 30,251 34,954 (4,703) ‐13%
Gifts 2,823 3,145 (322) ‐10% 68,468 44,012 24,456 56%
Travel 352 292 60 100% 4,086 4,449 (363) ‐8%
Merchandise 40 48 (8) ‐17% 2,960 7,692 (4,732) ‐62%
Fund transfers to endowment (19,130) (19,490) 360 ‐2% (60,509) (61,836) 1,327 ‐2%
Total Operating Revenue 102,721 273,276 (170,555) ‐62% 1,729,115 1,764,774 (35,659) ‐2%
EXPENSES
Salaries 125,473 125,322 (151) 0% 1,053,490 1,034,812 (18,678) ‐2%
Membership and membership services 6,874 45,547 38,673 85% 149,846 165,471 15,625 9%
Printing/Duplicating 1,084 4,670 3,586 77% 61,259 42,130 (19,129) ‐45%
Event Services 4,514 20,117 15,603 78% 103,270 120,206 16,936 14%
Professional Services 15,537 3,274 (12,263) ‐375% 64,614 58,139 (6,475) ‐11%
Postage 525 1,171 646 55% 32,030 26,653 (5,377) ‐20%
Travel 9,443 2,836 (6,607) ‐233% 27,309 23,067 (4,242) ‐18%
Advertising & Marketing 421 3,356 2,935 87% 18,799 26,732 7,933 30%
Insurance 10,376 4,447 (5,929) ‐133% 36,179 32,055 (4,124) ‐13%
Community Relations 2,632 1,642 (990) ‐60% 13,844 13,672 (172) ‐1%
Other Services 1,743 989 (754) ‐76% 15,491 12,498 (2,993) ‐24%
Telephone 99 287 188 66% 734 5,146 4,412 86%
Professional Dues & Fees 127 62 (65) ‐105% 8,424 8,025 (399) ‐5%
Repairs & Maintenance 882 (831) (1,713) 100% 3,862 2,815 (1,047) ‐37%
Office Supplies 14 1,567 1,553 99% 1,062 3,738 2,676 72%
Miscellaneous 59 458 399 87% 23,681 11,533 (12,148) ‐105%
Total Operating Expenses 179,803 214,914 35,111 16% 1,613,894 1,586,692 (27,202) ‐2%
NET INCOME FROM OPERATIONS (77,082) 58,362 (135,444) 232% 115,221 178,082 (62,861) ‐35%
Change in net assets 115,221
Net assets, beginning 803,146
Net assets, end 918,367
‐
* Other Royalties contain revenue from CGM and Liberty Mutual.
University of South Florida Alumni Association, Inc.
Current Month Totals
Summary of Revenues and Expenses
March 31, 2015
Year to Date Totals (75%)
Confidential
For internal use only
[ Page 9 of 28 ]
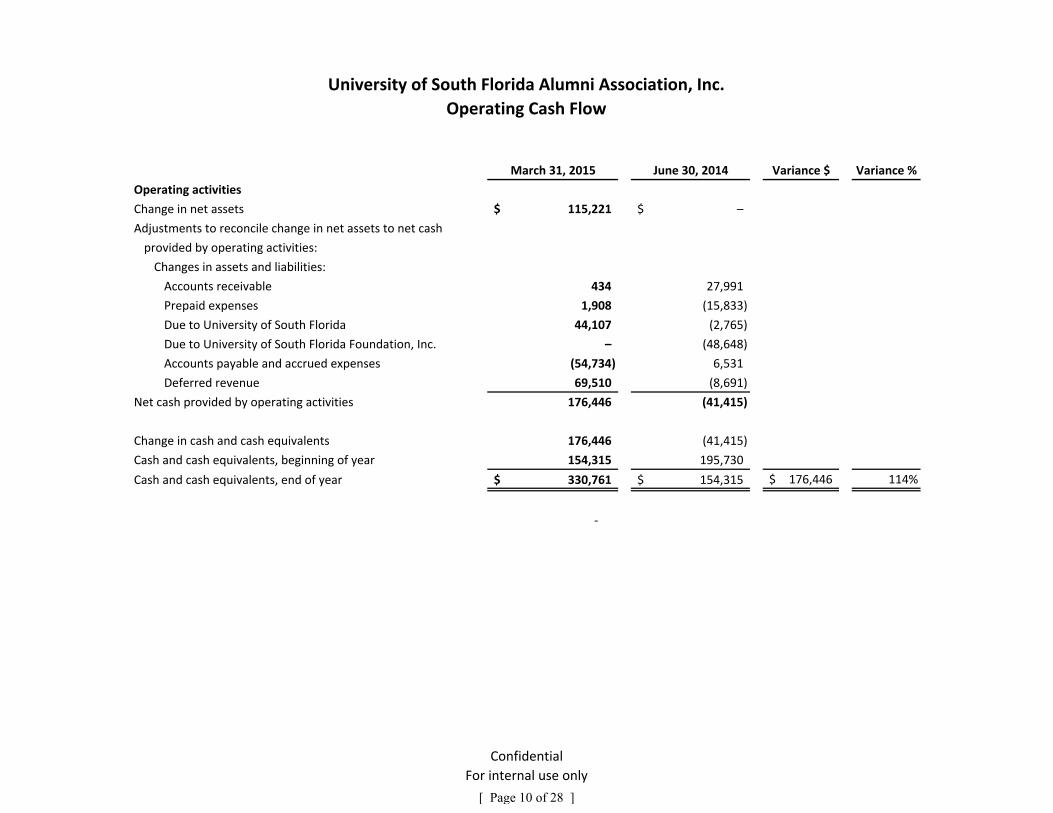
March 31, 2015 June 30, 2014 Variance $ Variance %
Operating activities
Change in net assets 115,221$ –$
Adjustments to reconcile change in net assets to net cash
provided by operating activities:
Changes in assets and liabilities:
Accounts receivable 434 27,991
Prepaid expenses 1,908 (15,833)
Due to University of South Florida 44,107 (2,765)
Due to University of South Florida Foundation, Inc. – (48,648)
Accounts payable and accrued expenses (54,734) 6,531
Deferred revenue 69,510 (8,691)
Net cash provided by operating activities 176,446 (41,415)
Change in cash and cash equivalents 176,446 (41,415)
Cash and cash equivalents, beginning of year 154,315 195,730
Cash and cash equivalents, end of year 330,761$ 154,315$ 176,446$ 114%
‐
University of South Florida Alumni Association, Inc.
Operating Cash Flow
Confidential
For internal use only
[ Page 10 of 28 ]

2015 2014 $ %
AssetsCash 2,641$ 2,641$ –$ 0 %Restricted cash and cash equivalents 31,937,181 26,919,976 5,017,205 19 %Due from related parties 30,733,243 39,726,982 (8,993,739) (23)%Accounts receivable 168 679 (511) (75)%Equity investment 899,475 226,965 672,510 296 %Security pledged to counterparty 10,990,000 6,970,000 4,020,000 58 %Deferred charges, net of accumulated amortization of
$2,232,364 and $2,150,637, respectively 1,227,375 1,309,102 (81,727) (6)%Construction in progress – – - %Capital assets, net of accumulated depreciation of
$54,197,183 and $44,817,495, respectively 311,967,493 320,831,664 (8,864,171) (3)%Total assets 387,757,576$ 395,988,009$ (8,230,433)$ (2)%
Liabilities and net assetsLiabilities:
Accounts payable –$ 14,672$ (14,672)$ (100)%Interest payable 3,340,320 3,429,420 (89,100) (3)%Due to related parties 1,259,282 252,094 1,007,188 %Interest rate swaps payable 21,116,437 20,005,497 1,110,940 6 %Long-term debt 361,139,421 372,056,720 (10,917,299) (3)%
Total liabilities 386,855,460 395,758,403 (8,902,943) (2)%
Net assets:
Unrestricted net assets 902,116 229,606 672,510 293 %Total liabilities and net assets 387,757,576$ 395,988,009$ (8,230,433)$ (2)%
Period Ending March 31, Variance
USF Financing Corporation andUSF Property Corporation
Consolidated Statements of Financial Position
[ Page 11 of 28 ]

2015 2014 $ %
RevenuesOperating revenues:
University of South Florida housing system lease revenue 40,750,789$ 36,004,747$ 4,746,042$ 13 %University of South Florida athletics system lease revenue 1,649,175 1,643,016 6,159 0 %University of South Florida arena revenue 905,841 906,904 (1,063) (0)%Medical Services Support Corporation lease revenue 3,476,854 3,644,672 (167,818) (5)%Health Professions Conferencing Corporation lease revenue 1,399,930 1,401,019 (1,089) (0)%
Total operating revenues 48,182,589 43,600,358 4,582,231 11 %
ExpensesUniversity of South Florida housing system operating expenses 14,473,632$ 16,042,973$ (1,569,341)$ (10)%Management expense 405,039 399,003 6,036 2 %Interest expense 11,411,124 11,414,533 (3,409) (0)%Amortization of deferred charges 61,295 61,828 (533) (1)%Amortization of deferred charges due to refunding of debt – 338,062 (338,062) (100)%Depreciation expense 7,037,753 7,038,242 (489) (0)%
General and administrative expense 475,170 535,674 (60,504) (11)%Total expenses 33,864,013 35,830,315 (1,966,302) (5)%
Other revenues (expenses)Change in interest in equity investment 1,107,107$ 476,075$ 631,032$ 133 %Change in fair value of interest rate swaps 474,203 4,997,914 (4,523,711) (91)%Transfer to affiliates to offset the change in fair value
of interest rate swaps and other expenses (14,795,401) (12,771,457) (2,023,944) (16)%Interest income 2,621 3,500 (879) (25)%Total other expenses (13,211,470) (7,293,968) (5,917,502) (81)%
Change in unrestricted net assets 1,107,107 476,075 631,032 %Unrestricted net assets (deficit), beginning of year (204,991) (246,469) 41,478 17 %Unrestricted net assets, end of year 902,116$ 229,606$ 672,510$ 293 %
9 Months Ending March 31,
USF Financing Corporation andUSF Property Corporation
Consolidated Statements of Activities and Changes in Net Assets
Variance
[ Page 12 of 28 ]

2015 2014 $ %
Operating activitiesChange in net assets 1,107,107$ 476,075$ 631,032$ 133 %Adjustments to reconcile change in net assets to net cash
provided by operating activities:
Amortization of deferred charges 61,295 61,828 (533) (1)%Deferred charges written off - 338,062 (338,062) (100)%Depreciation of capital assets 7,037,753 7,038,242 (489) (0)%Net amortization of premiums and discounts on COPs (76,756) (76,756) - 0 %Change in fair value of interest rate swap (474,203) (4,997,914) 4,523,711 91 %Change in interest in equity investment (1,107,107) (476,075) (631,032) (133)%Changes in operating assets and liabilities:
Due from related parties 16,292,792 (7,311,236) 23,604,028 323 %Accounts receivable 633 (214) 847 396 %Accounts payable (1,000) (534,888) 533,888 100 %Interest payable (2,632,505) (2,577,887) (54,618) (2)%Due to related parties 938,900 (49,847) 988,747 1,984 %
Net cash provided by (used in) operating activities 21,146,909 (8,110,610) 29,257,519 361 %
Investing activitiesCapital expenditures (227,546) (162,524) (65,022) (40)%Purchases of investments (99,597,913) (88,962,204) (10,635,709) (12)%Proceeds from sales or maturities of investments 93,513,508 85,898,492 7,615,016 9 %Net cash provided by investing activities (6,311,951) (3,226,236) (3,085,715) (96)%
Financing activitiesDeferred charges on debt issuances - (192,602) 192,602 100 %Proceeds from issuances of long-term debt - 82,505,000 (82,505,000) (100)%Principal paid due to refunding of debt - (62,505,000) 62,505,000 100 %Principal paid on debt (10,814,958) (9,800,552) (1,014,406) (10)%Security pledged to counterparty (4,020,000) 1,330,000 (5,350,000) %Net cash (used in) provided by financing activities (14,834,958) 11,336,846 (26,171,804) (231)%
Change in cash and cash equivalents 0 – 0 %Cash and cash equivalents, beginning of year 2,641 2,641 - 0 %Cash and cash equivalents, end of year 2,641$ 2,641$ 0$ 0 %
USF Financing Corporation andUSF Property Corporation
Consolidated Statements of Cash Flows
9 Months Ending March 31, Variance
[ Page 13 of 28 ]

(In thousands) MARCH 31 MARCH 312015 2014 $ %
ASSETS
Current AssetsCash and Cash Equivalents $8,245 $7,519 $726 10 %Investments 36,769 38,342 (1,574) (4)%Receivables 22,543 23,214 (672) (3)%Due from Primary Unit and Other Component Units 7,521 4,337 3,184 73 %Inventories 243 195 48 25 %Other: Prepaid 1,370 1,108 263 24 %Total Current Assets $76,691 $74,716 $1,975 3 %
Noncurrent AssetsOther Noncurrent Assets
Other: Notes Receivable, Deposits 152 3,555 (3,403) (96)%Capital Assets
Depreciables (Buildings and other Fixed Assets) 26,990 25,413 1,576 6 % Less Accumulated Depreciation (23,835) (23,992) 157 1 %Non-Depreciables (Construction in Process, Land, etc.) 1,770 1,686 84 5 %
Total Noncurrent Assets $5,077 $6,663 $(1,586) (24)%
Total Assets $81,768 $81,379 $389 0 %
LIABILITIES
Current LiabilitiesAccounts Payable $2,856 $3,745 $(889) (24)%Accrued Salaries and Benefits 1,603 2,392 (789) (33)%Due to Primary Unit and Other Component Units 5,746 5,392 355 7 %Deferred Revenue 1,467 529 938 178 %Other: 542 821 (279) (34)%Total Current Liabilities $12,215 $12,878 $(664) (5)%
Noncurrent LiabilitiesOther $54 $47 $6 14 %Total Noncurrent Liabilities $54 $47 $6 14 %
Total Liabilities $12,269 $12,926 $(657) (5)%
NET ASSETS $69,500 $68,453 $1,046 2 %
Total Liabilities & Net Assets $81,768 $81,379 $389 0 %
BALANCE SHEET
Variance
FY 2015 QUARTER 3 REPORT - MARCH 31, 2015
UNIVERSITY MEDICAL SERVICE ASSOCIATION
[ Page 14 of 28 ]

(In thousands)
2015 2014ACTUAL ACTUAL $ %
REVENUES Net Patient Service $102,085 $95,402 $6,683 7 %Grants, Contracts & Awards 38,562 36,152 2,410 7 %UPL 4,214 2,863 1,350 47 %Meaningful Use 901 15 886 5,904 %Other Revenues 18,277 17,776 501 3 %Total Revenues $164,039 $152,208 $11,831 8 %
EXPENSESFaculty Support 80,473 73,643 $6,830 9 %Housestaff Support 8,054 8,491 (437) (5)%Other Staff Support 20,049 18,605 1,444 8 %Contributions to MSSC 44,445 42,425 2,020 5 %Depreciation/Amortization 948 931 17 2 %Other Expenses 12,130 13,752 (1,622) (12)%Exit Costs on Behalf of MSSC 0 0 0 %Total Expenses $166,098 $157,848 $8,251 5 %
Operating Profit Before Non-Cash Changes $(2,059) $(5,639) $3,580 63 %
Unrealized Gain/Losses (192) 1,049 (1,241) (118)%Change in Fair Value of Swaps 0 0 0 %Total Non-Cash Changes $(192) $1,049 $(1,241) (118)%
NET OPERATING PROFIT $(2,251) $(4,590) $2,339 51 %
Variance
INCOME STATEMENT
FY 2015 QUARTER 3 REPORT - MARCH 31, 2015
9 Months Ended March 31,
UNIVERSITY MEDICAL SERVICE ASSOCIATION
[ Page 15 of 28 ]

(In thousands)
2015 2014
ACTUAL ACTUAL $ %
OPERATING ACTIVITIES Net Operating Profit $(2,251) $(4,590) $2,339 51 %Changes in operating assets and liabilities (149) (2,363) 2,214 94 %Adjustments for Non-Cash Activities:
Depreciation / Amortization 948 931 17 2 %Unrealized Gains 192 (1,049) 1,241 118 %
Total Cash From Operating Activities $(1,260) $(7,071) $5,811 82 %
INVESTING ACTIVITIESCapital Expenditures $(2,775) $(2,455) $(320) (13)%Purchases/Sales of Investments 3,000 (500) 3,500 700 %
Total Cash From Investing Activities $225 $(2,955) $3,180 108 %
FINANCING ACTIVITIESProceeds of Long-Term Debt $0 $(4,384) $4,384 100 %Principal Paid on Debt 0 0 0 %
Total Cash From Financing Activities $0 $(4,384) $4,384 100 %
CHANGE IN CASH (1,035) (14,410) 13,375 93 %
Operatng Cash, Beginning of Year 9,280 21,929 (12,649) (58)%
Operating Cash, End of Year 8,245 7,519 726 10 %
Invested Cash, End of Year 36,809 38,343 (1,534) (4)%Total Cash, End of Year $45,054 $45,862 $(808) (2)%
FY 2015 QUARTER 3 REPORT - MARCH 31, 2015
STATEMENT OF CASH FLOWS
UNIVERSITY MEDICAL SERVICE ASSOCIATION
Variance
9 Mos Ended March 31,
[ Page 16 of 28 ]
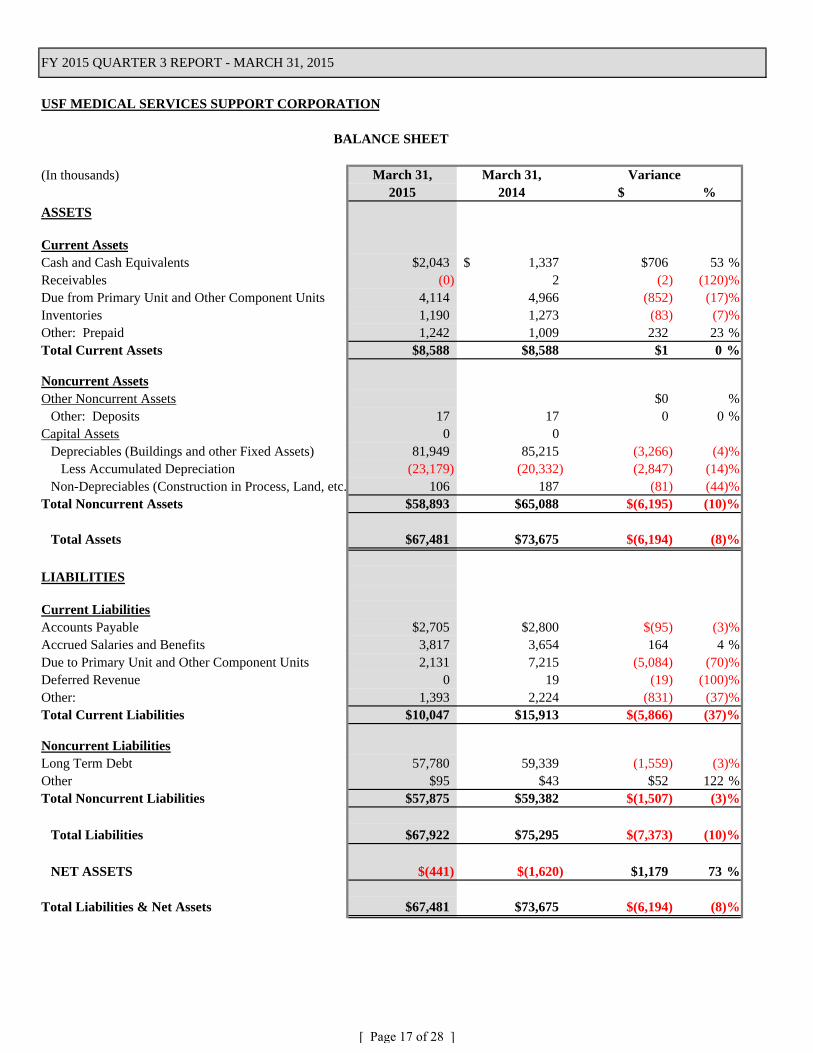
USF MEDICAL SERVICES SUPPORT CORPORATION
(In thousands) March 31, March 31,2015 2014 $ %
ASSETS
Current AssetsCash and Cash Equivalents $2,043 1,337$ $706 53 %Receivables (0) 2 (2) (120)%Due from Primary Unit and Other Component Units 4,114 4,966 (852) (17)%Inventories 1,190 1,273 (83) (7)%Other: Prepaid 1,242 1,009 232 23 %Total Current Assets $8,588 $8,588 $1 0 %
Noncurrent AssetsOther Noncurrent Assets $0 %
Other: Deposits 17 17 0 0 %Capital Assets 0 0
Depreciables (Buildings and other Fixed Assets) 81,949 85,215 (3,266) (4)% Less Accumulated Depreciation (23,179) (20,332) (2,847) (14)%Non-Depreciables (Construction in Process, Land, etc. 106 187 (81) (44)%
Total Noncurrent Assets $58,893 $65,088 $(6,195) (10)%
Total Assets $67,481 $73,675 $(6,194) (8)%
LIABILITIES
Current LiabilitiesAccounts Payable $2,705 $2,800 $(95) (3)%Accrued Salaries and Benefits 3,817 3,654 164 4 %Due to Primary Unit and Other Component Units 2,131 7,215 (5,084) (70)%Deferred Revenue 0 19 (19) (100)%Other: 1,393 2,224 (831) (37)%Total Current Liabilities $10,047 $15,913 $(5,866) (37)%
Noncurrent LiabilitiesLong Term Debt 57,780 59,339 (1,559) (3)%Other $95 $43 $52 122 %Total Noncurrent Liabilities $57,875 $59,382 $(1,507) (3)%
Total Liabilities $67,922 $75,295 $(7,373) (10)%
NET ASSETS $(441) $(1,620) $1,179 73 %
Total Liabilities & Net Assets $67,481 $73,675 $(6,194) (8)%
BALANCE SHEET
Variance
FY 2015 QUARTER 3 REPORT - MARCH 31, 2015
[ Page 17 of 28 ]

(In thousands)
2015 2014ACTUAL ACTUAL $ %
REVENUES Operating/payroll expenses funded by UMSA $47,464 $45,636 1,829 4 %Other Revenues 2 5 (3) (60)%Total Revenues $47,466 $45,641 $1,826 4 %
EXPENSESFaculty support 107 131 (24) (18)%Housestaff support 34 37 (3) (9)%Staff support 29,438 26,935 2,503 9%Medical Materials/Supplies 8,124 7,062 1,063 15%Interest Paid on Debt 1,899 1,982 (83) (4)%Depreciation/Amortization 2,254 2,352 (98) (4)%Other Expenses 6,604 7,166 (561) (8)%
Total Expenses $48,461 $45,664 $2,797 6 %Operating Profit Before Non-Cash Changes $(995) $(23) $(972) (4,208)%
Unrealized Gains/Losses 0 0 0 %Gains/Losses on Transfer of Assets 0 0 0 %Change in Fair Value of Swaps 1,760 1,671 88 5%
Total Non-Cash Changes $1,760 $1,671 $88 5 %
NET OPERATING PROFIT $765 $1,648 $(883) (54)%
Variance
INCOME STATEMENT
FY 2015 QUARTER 3 REPORT - MARCH 31, 2015
9 Months Ended March 31,
USF MEDICAL SERVICES SUPPORT CORPORATION
[ Page 18 of 28 ]

(In thousands)
2015 2014ACTUAL ACTUAL $ %
OPERATING ACTIVITIESNet Operating Profit $765 $1,648 $(883) (54)%Changes in operating assets and liabilities (1,125) (2,350) 1,225 52 %Adjustments for Non-Cash Activities:
Depreciation / Amortization 2,254 2,352 (98) (4)%Unrealized Gains (1,760) 0 (1,760) %
Total Cash From Operating Activities $135 $1,650 $(1,515) (92)%
INVESTING ACTIVITIESCapital Expenditures $(530) $(5,457) $4,927 90 %Purchases (Sales) of Investments 0 0 0 %Total Cash From Investing Activities $(530) $(5,457) $4,927 90 %
FINANCING ACTIVITIESProceeds of Long-Term Debt $0 $4,384 $(4,384) (100)%Principal Paid on Debt 1,368 (1,153) 2,521 219 %Total Cash From Financing Activities $1,368 $3,231 $(1,863) (58)%
CHANGE IN CASH 973 (576) 1,549 269 %Cash, Beginning of Year 1,069 1,913 (844) (44)%Cash, End of Year $2,043 $1,337 $706 53 %
STATEMENT OF CASH FLOWS
FY 2015 QUARTER 3 REPORT - MARCH 31, 2015
USF MEDICAL SERVICES SUPPORT CORPORATION
9 Mos Ended March 31,VARIANCE
[ Page 19 of 28 ]

USF Research Foundation, Inc.
(In thousands) March 31, March 31,
2015 2014 $ %
ASSETS
Current Assets
Cash and Cash Equivalents $4,865 $3,151 $1,714 54 %
Investments 30,390 29,313 1,077 4 %
Receivables 1,494 1,940 (446) (23)%
Other Current Assets 500 77 423 552 %
Total Current Assets $37,249 $34,481 $2,767 8 %
Noncurrent Assets
Other Receivables $360 $175 185 100 %
Capital Assets 59,107 57,602 1,506 3 %
Less: Accumulated Depreciation (19,226) (16,446) (2,780) (17)%
Non-Depreciable Items (CIP, Land, etc.) 8,815 9,401 (586) (6)%
Other: Developer Rights to Research Park 7,602 7,718 (116) (2)%
Deferred Outflow - Interest Rate Swap 2,028 3,219 (1,190) (37)%
Total Noncurrent Assets $58,686 $61,668 $(2,982) (5)%
Total Assets & Deferred Outflow $95,935 $96,149 $(214) (0)%
LIABILITIES
Current Liabilities
Accounts Payable $390 $631 $(241) (38)%
Due to Primary Units and Other Component Units 7,059 7,844 (786) (10)%
Unearned Revenue 928 1,100 (172) (16)%
Other Current Liabilities 895 764 131 17 %
Total Current Liabilities $9,272 $10,339 $(1,068) (10)%
Noncurrent Liabilities
Revenue Bonds Payable $33,235 $34,865 $(1,630) (5)%
Interest Rate Swap Liabilities 2,028 3,219 (1,190) (37)%
Total Noncurrent Liabilities $35,263 $38,084 $(2,820) (7)%
Total Liabilities $44,535 $48,423 $(3,888) (8)%
NET POSITION $51,400 $47,726 $3,674 7.7 %
Total Liabilities & Net Position $95,935 $96,149 $(214) (0)%
BALANCE SHEET
Variance
FY 2015 QUARTER 3 REPORT - March 31, 2015
[ Page 20 of 28 ]

(In thousands)
2015 2014
ACTUAL ACTUAL $ %
REVENUES Rental Revenue $5,668 $5,718 $(50) (1)%Intellectual Property (IP) Revenue 1,999 1,746 253 15 %Less - IP Revenue (on behalf of USF) (376) (825) 449 54 %Incubator Program Revenue 1,123 1,034 89 9 %NMR License Revenue 230 312 (82) (26)%Economic Development Grant 115 249 (134) (54)%
Other Revenues 117 63 54 85 %
Total Revenues $8,876 $8,298 $579 7 %
EXPENSESSalaries & Benefits $890 $772 $118 15 %
Contractual Services 103 122 (19) (15)%
Program Expense -IP, Incubator & Univ Support 690 865 (175) (20)%
Operations - Utilities / Repairs / Maintenance 2,166 2,189 (23) (1)%
Other Operating Expenses 18 31 (13) (42)%
Interest Expense 1,368 1,446 (78) (5)%
Depreciation & Amortization 2,172 2,100 73 3 %
Total Expenses $7,407 $7,524 $(117) (2)%
OPERATING INCOME BEFORE NON-OPERATING REVENUE $1,469 $774 $695 90 %
Investment Income (Loss) 845 2,658 (1,813) (68)%Contribution Revenue - - -
Total Non-Operating Revenue $845 $2,658 $(1,813) (68)%
NET INCOME (Increase in Net Position) $2,314 $3,432 $(1,118) (33)%
INCOME STATEMENT
FY 2015 QUARTER 3 REPORT - March 31, 2015
USF Research Foundation, Inc.
9 Months Ended March 31,
Variance
[ Page 21 of 28 ]

USF Research Foundation, Inc.
(In thousands)
2015 2014
ACTUAL ACTUAL $ %
OPERATING ACTIVITIESNet Income $2,314 $3,432 ($1,118) (33)%Adjustments to reconcile net income to netcash provided by operating activities:
Adjustments for Non-Cash Revenue/Expenses:Depreciation / Amortization Expense 2,172 2,100 72 3 %Non Cash Expenses 29 (2,658) 2,687 101 %Non Cash Investment Loss (Gain) (845) (837) (8) (1)%Non Cash Revenue (230) 13 (243) (1,871)%
Change in Assets and Liabilities (net) 843 1,734 (891) (51)%
Total Cash Provided From Operating Activities $4,282 $3,783 $499 13 %
INVESTING ACTIVITIESCapital Expenditures (271) (974) 703 72 %Net Sales (Purchases) of Investments 363 300 63 21 %Transfer from Venture Investment Fund 0 0 0 %Seed Capital Funding (150) (175) 26 15 %
Total Cash Used for Investing Activities ($57) ($849) $792 93 %
FINANCING ACTIVITIESPrincipal Paid on Debt (1,630) (1,580) (50) (3)%
Total Cash Used for Financing Activities ($1,630) ($1,580) ($50) (3)%
CHANGE IN CASH $2,595 $1,354 $1,241 92 %
Cash, Beginning of Year 2,270 1,797 473 26 %Cash, End of Period $4,865 $3,151 $1,714 54 %
STATEMENT OF CASH FLOWS
FY 2015 QUARTER 3 REPORT - March 31, 2015
9 Months Ended March 31,VARIANCE
[ Page 22 of 28 ]

2015 2014 $ %
Assets
Current Assets
Cash and Cash Equivalents 1,120,002 828,494 291,508 35 %
Investments 8,285 8,132 153 2 %
Accounts receivable 1,673,447 1,378,072 295,375 21 %
Accrued receivable, University of South Florida/DSO 353,900 385,241 (31,341) (8)%
Prepaid Expenses 438,824 551,020 (112,196) (20)%
Other Current Assets 37,901 76,578 (38,677) (51)%
Total Current Assets 3,632,359 3,227,537 404,822 13 %
Property and equipment, net 22,876,346 25,678,494 (2,802,148) (11)%
Other Assets 14,423 14,423 - %
Total Assets 26,523,128 28,920,454 (2,397,326) (8)%
Liabilities and Net Assets
Current Liabilities
Current Portion of Obligation under capital leases 2,324,706 1,982,349 342,357 17 %
Due to USF - LOC 1,500,000 1,500,000 - 0 %
Accounts payable 1,978,664 978,046 1,000,618 102 %
Accrued expenses - other 225,073 451,740 (226,667) (50)%
Accrued expenses - University of South Florida/DSO's 635,345 1,713,981 (1,078,636) (63)%
Refunds due to sponsors 585,890 60,634 525,256 866 %
Deferred revenue 1,982,456 1,683,555 298,901 18 %
Total Current Liabilities 9,232,134 8,370,305 861,829 10 %
LT Obligation under capital leases 17,867,814 20,093,575 (2,225,761) (11)%
Deferred rent abatement 58,127 8,959 49,168 549 %
Deposits Payable - Non Current 4,402 4,402 - 0 %
Total Liabilities 27,162,477 28,477,241 (1,314,764) (5)%
Net Assets:
Unrestricted:
Operating (3,753,276) (3,705,506) (47,770) 1 %
Net investment in property and equipment 2,683,826 3,602,570 (918,744) (26)%
(1,069,450) (102,936) (966,514) 939 %
Temporarily restricted 430,101 546,149 (116,048) (21)%
Total net assets (639,349) 443,213 (1,082,562) (244)%
Total Liabilities and Net Assets 26,523,128 28,920,454 (2,397,326) (8)%
Variance
March 31, 2015 and 2014
USF HEALTH PROFESSIONS CONFERENCING CORPORATION
Statements of Financial Position
[ Page 23 of 28 ]

2015 2014 $ %
Support & Revenue
Contracts & Grants - Non USF 9,293,635 7,373,521 1,920,113 26 %
Net change in Temp Restricted Net Assets (149,120) 146,302 (295,422) (202)%
Contracts & Grants - USF 3,609,460 3,394,056 215,405 6 %
Program Registration & Exhibits 2,254,078 2,895,679 (641,601) (22)%
Rental Revenue 141,493 110,017 31,476 29 %
Investment Income 816 659 157 24 %
Rebates & Commissions 154,268 86,581 67,687 78 %
Total Support & Revenue before non-cash changes 15,304,631 14,006,815 1,297,816 12 %
Expenditures
Salaries & Benefits 2,294,213 2,629,964 (335,751) (13)%
Rent, Utilities & Equipment Leases 1,883,787 1,938,316 (54,529) (3)%
Other Operating Expenses 1,077,447 1,006,356 71,091 7 %
Interest Paid on Debt 628,975 658,036 (29,061) (4)%
Sub-Total 5,884,422 6,232,672 (348,250) (6)%
Program Services 7,799,735 6,299,314 1,500,422 24 %
Total Expenditures before non-cash changes 13,684,157 12,531,986 1,152,172 9 %
Earnings before Depreciation and other non-cash changes 1,620,474 1,474,830 145,644 34 %
Non-Cash Changes
In Kind Donations (602,996) (1,311,852) 708,856 (54)%
Other: In Kind Donation Utilization 602,996 1,261,182 (658,186) (52)%
Depreciation Expense 2,245,156 3,225,089 (979,932) (30)%
Net Support & Revenue over (under) Expenditures -
Unrestricted (624,683) (1,699,589) 1,074,906 (63)%
Beginning Net Assets - Unrestricted (444,767) 1,596,653 (2,041,420) (128)%
Ending Net Assets - Unrestricted (719,450) (102,936) (616,514) 599 %
Beginning Net Assets - Temp Restricted 280,982 692,452 (411,470) (59)%
Change in Net Assets - Temp Restricted 149,120 (146,302) 295,422 (202)%
Ending Net Assets - Temp Restricted 430,101 546,149 (116,048) (21)%
Change in Net Assets (475,563) (1,845,891) 1,370,328 (74)%
Net Assets, beginning of year (163,786) 2,289,104 (2,452,890) (107)%
Net Assets, end of period (639,349) 443,213 (1,082,561) (244)%
Variance
USF HEALTH PROFESSIONS CONFERENCING CORPORATION
Statements of Activities
March 31, 2015 and 2014
[ Page 24 of 28 ]

2015 2014 $ %
Cash flows from Operating Activities
Increase (decrease) in net assets (475,564) (1,836,705) 1,361,141 (74)%
Adjustments to reconcile increase (decrease) in net assets to net cash
provided by (used in) operating activities:
Depreciation 2,245,156 3,225,089 (979,933) (30)%
Donation of property and equipment - (50,670) 50,670 (100)%
Decrease (increase) in accounts receivable 229,936 (642,353) 872,289 (136)%
Decrease (increase) in prepaid expenses (75,272) (102,839) 27,567 (27)%
Decrease (increase) in other assets - 1,845 (1,845) (100)%
Increase (decrease) in accounts payable and accrued expenses (993,724) 128,831 (1,122,555) (871)%
Increase (decrease) in refunds due to sponsors 527,012 (639) 527,651 (82,574)%
Increase (decrease) in deferred revenue 634,634 978,122 (343,488) (35)%
Net cash provided by (used in) operating activities 2,092,179 1,700,681 391,498 23 %
Cash flows from investing activities:
Purchases of property and equipment (162,732) (122,626) (40,106) 33 %
Vanguard ST Bond Index Fund (105) (88) (17) 19 %
Net cash provided by (used in) investing activities (162,837) (122,714) (40,123) 33 %
Cash flows from financing activities:
Principal payments under short term debt obligations (93,943) (271,362) 177,419 (65)%
Principal payments under equipment purchase contract (739,466) (726,984) (12,482) 2 %
Principal payments under capital lease obligation (254,189) (237,213) (16,976) 7 %
Principal payments DFO (800,646) (461,776) (338,870) 73 %
-
Net cash provided by (used in) financing activities (1,888,243) (1,697,335) (190,908) 11 %
-
Net increase (decrease) in cash and cash equivalents 41,099 (119,368) 160,467 (134)%
Cash and cash equivalents at beginning of year 1,078,903 947,862 131,041 14 %
Cash and cash equivalents at end of period 1,120,002 828,494 291,508 35 %
Variance
USF HEALTH PROFESSIONS CONFERENCING CORPORATION
Statements of Cash Flow
March 31, 2015 and 2014
[ Page 25 of 28 ]

Sun Dome, Inc.
(In thousands) March 31, March 31,
2015 2014 $ %
ASSETS
Current Assets
Cash and Cash Equivalents $1,146 $1,220 $(74) (6)%
Accounts Receivable 631 511 120 23 %
Investments 0 0 0 %
Other 27 22 5 23 %
Total Current Assets $1,804 $1,753 $51 3 %
Noncurrent Assets
Restricted Cash and Cash Equivalents $0 $0 $0 %
Restricted Investments 0 0 0 %
Capital Assets 3,013 3,013 0 0 %
Less: Accumulated Depreciation (1,857) (1,857) 0 0 %
Non-Depreciable Items (CIP, Land, etc.) 0 0 0 %
Total Noncurrent Assets $1,156 $1,156 $0 0 %
Total Assets $2,960 $2,909 $51 2 %
LIABILITIES
Current Liabilities
Accounts Payable $198 $218 $(20) (9)%
Due to Component Units 1,005 1,071 (66) (6)%
Deferred Revenue 381 204 177 87 %
Other 100 363 (263) (72)%
Total Current Liabilities $1,684 $1,856 $(172) (9)%
Noncurrent Liabilities
Long Term Debt $819 $819 $0 0 %
Total Noncurrent Liabilities $819 $819 $0 0 %
Total Liabilities $2,503 $2,675 $(172) (6)%
NET ASSETS $457 $234 $223 95 %
Total Liabilities & Net Assets $2,960 $2,909 $51 2 %
BALANCE SHEET
Variance
FY 2015 QUARTER 3 REPORT - MARCH 31, 2015
[ Page 26 of 28 ]

(In thousands)
2015 2014
ACTUAL ACTUAL $ %
REVENUES Rent Income $494 $170 $324 191 %
Service Income 181 168 13 8 %
Premium Seating 68 60 8 13 %
Facility Fee 237 202 35 17 %
Sponsorship, Commissions & Royalties 500 508 (8) (2)%
Parking 175 144 31 22 %
Other Revenues 160 82 78 95 %
Total Revenues $1,815 $1,334 $481 36 %
EXPENSESSalaries & Wages $510 $488 $22 5 %
Payroll Taxes & Benefits 150 138 12 9 %
Repairs, Maintenance and Utilities 260 247 13 5 %
Operating & Administrative 143 146 (3) (2)%
Management Fees 93 92 1 1 %
Depreciation/Amortization 174 178 (4) (2)%
Total Expenses $1,330 $1,289 $41 3 %OPERATING PROFIT BEFORE NON-CASH CHANGES $485 $45 $440 978 %
NON-OPERATING REVENUES/(EXPENSES)
Unrealized Investment Gains (Losses) 0 0 0 %
Change in Fair Value of Swaps 0 0 0 %
Total Non-Operating Revenues/(Expenses) $0 $0 $0 %
NET OPERATING PROFIT $485 $45 $440 978 %
INCOME STATEMENT
FY 2015 QUARTER 3 REPORT - MARCH 31, 2015
Sun Dome, Inc.
9 Months Ended March 31,Variance
[ Page 27 of 28 ]

Sun Dome, Inc.
(In thousands)
2015 2014
ACTUAL ACTUAL $ %
OPERATING ACTIVITIESNet Operating Profit $485 $45 $440 978 %Adjustments for Non-Cash Activities:
Depreciation / Amortization 174 176 (2) (1)%Net Adjustments to Assets 0 42 (42) (100)%Net Adjustments to Liabilities 0 54 (54) (100)%Customer Deposits & Deferred Revenue (381) (86) (295) (343)%
Total Cash From Operating Activities $278 $231 $47 20 %
INVESTING ACTIVITIESCapital Expenditures $0 $0 $0 %Purchases (Sales) of Investments 0 0 0 %
Total Cash From Investing Activities $0 $0 $0 %
FINANCING ACTIVITIESProceeds of Long-Term Debt $0 $0 $0 %Principal Paid on Debt (70) (142) 72 51 %Interest Paid (7) 0 (7) %Net transfers to USF for debt service on arena (411) 0 (411) %
Total Cash From Financing Activities $(488) $(142) $(346) (244)%
CHANGE IN CASH (210) 89 (299) (336)%
Cash, Beginning of Year 738 1,481 (743) (50)%Cash, End of Year $528 $1,570 $(1,042) (66)%
STATEMENT OF CASH FLOWS
FY 2015 QUARTER 3 REPORT - MARCH 31, 2015
9 Mos Ended Mar 31,VARIANCE
[ Page 28 of 28 ]