University of South Florida College of Engineering...
40
University of South Florida College of Engineering Department of Industrial & Management Systems Engineering Ross Stores Inc. EIN 6183 Engineering Management Policy and Strategy Fall 2014 Roberto Serrano
Transcript of University of South Florida College of Engineering...

University of South Florida
College of Engineering
Department of Industrial & Management Systems Engineering
Ross Stores Inc.
EIN 6183 Engineering Management Policy and Strategy
Fall 2014
Roberto Serrano
TABLE OF CONTENTS
EXECUTIVE SUMMARY 5
COMPANY OVERVIEW 6
HISTORY 7
KEY METRICS 8
PRODUCTS 10
INDUSTRY COMPETITION 12
COMPETITORS 12
CUSTOMERS 13
EXTERNAL COMPETITION 14
BARRIERS TO ENTRY 14
SUPPLIERS 14
CRITICAL SUCCESS FACTORS 15
EXTERNAL ENVIRONMENT 16
Political and Legal Forces 16
Economic forces 17
Social forces 17
Technological forces 18
ETHICS AND CORPORATE SOCIAL RESPONSIBILITY 18
Empowering our associates 19
Supporting our communities 19
Operating sustainably 20
Conducting business ethically 20
BUSINESS STRATEGIES 21
FUNCTIONAL STRATEGIES 22
Marketing 22 Price 23 Promotion 24 Product 25 Place 26
FINANCE 29
PRODUCTION 30
PURCHASING 31
HUMAN RESOURCE MANAGEMENT 31
INFORMATION SYSTEMS 31
STRATEGY FORMULATION 32
STRATEGY EXECUTION: STRUCTURE, STRATEGIC CHANGE, CULTURE AND LEADERSHIP 34
COMPARISON WITH THE GAP, INC., INC 36
CONCLUSIONS 38
List of tables
TABLE 1: REVENUES 9 TABLE 2: PRODUCT CATEGORIES 10 TABLE 3: PRODUCTS 11 TABLE 4: WORKING ENVIRONMENT CONTRIBUTIONS 19 TABLE 5: IVA REPORT 2013 21 TABLE 6: SWOT MATRIX 33 TABLE 7: COMPARISON BETWEEN THE THE GAP, INC., INC. AND ROSS STORES, INC 36 TABLE 8: FINANCIAL COMPARISON BETWEEN ROSS STORES, INC. AND THE GAP, INC. 37
List of figures
FIGURE 1: STORE DISTRIBUTION 7 FIGURE 2: TOTAL REVENUES IN FY2013 10 FIGURE 3: MARKET SHARE 13 FIGURE 4: CORPORATE SOCIAL RESPONSIBILITY 18 FIGURE 5: PRICE TAGS IN ROSS STORES 23 FIGURE 6: PROMOTIONS THROUGH ROSS STORES FACEBOOK PAGE 24 FIGURE 7: ROSS DRESS FOR LESS STORE FACADE 27 FIGURE 8: DD'S DISCOUNTS STORE FACADE 28 FIGURE 9: ROSS STORES, INC. EXECUTIVES 35

Executive Summary
The following report describes strategic elements of the Ross Stores, Inc. in
terms of external environment, organization details and the process of strategy
formulation and execution. The company operates within the US family clothing industry
and its external environment has been analyzed through both, Michael Porter’s five
forces and PEST (Political, Economic, Social and Technological forces).
Ross Stores, Inc. is an off-price retailer of apparel and home fashion with two
business units, Ross dress for less and dd’s Discounts. Both units operate in the same
industry targeting a slightly different market. Therefore, some strategies are analyzed
considering each brand individually. Strategy formulation includes the SWOT analysis
and the assessment for current and potential strategies.
Several of the company’s financial ratios and strategic elements are compared
with one relevant competitor in the family clothing industry to describe even more the
competitive position of Ross Stores, Inc.
Conclusions are presented at the end of the report and include some
recommendations and comments related to the competitive position of the company
within the industry and the potential strategies to enhance its future performance.

Company Overview
Ross Stores, Inc. is an off-price retailer of designer apparel, footwear,
accessories and home fashions for the entire family. The company´s headquarter is
located at Pleasanton, California. The target customers of the company are mainly
value-conscious women and men between the ages of 18 and 54. There are two chains
of stores within the Company, Ross Dress for Less that target customers from middle
income households and dd’s Discounts with similar product portfolio but concentrated on
moderate income households. The website of the Company is designed to provide
stores locator search and special offers to customers. The mission of the company is not
clearly stated on the website or in its annual report. Nevertheless, according to the
International Directory of Company Histories (1997), “Ross Stores' mission is to offer
competitive values to its target customers by focusing on the following key strategic
objectives: achieve an appropriate level of brands and labels at strong discounts
throughout the store; meet customer needs on a more regional basis; deliver an in-store
shopping experience that reflects the expectations of the off-price customer; and
manage real estate growth to maintain dominance or achieve parity with the competition
in key markets”.
Locations
The Company’s first chain is Ross “Dress for Less” with 1.146 locations in
February 2013 (Ross Stores, Inc. 2013 Annual Report), making it the largest off-price
apparel retailer in the United States as shown in Figure 1. (p. 8).

Figure 1: Store distribution
Source: Ross Stores Inc., 2013
History
According to International Directory of Company Histories (1997), Ross Stores
was incorporated in California in 1957 with the name of Ross junior department store;
however, is in 1982 when the Company, as we know it today, was born. During that
year, two entrepreneurs, Stewart Moldaw and Donald Rowlet, bought the 6 stores chain
with help from venture capital partners. Since the beginning, they had clear intentions to
build a retail empire, and only three years later they had a 107 stores growing retail
254165
13459
443939
3736
3427272827
20212019
15151413
1110
866
44322111
CaliforniaTexas
FloridaArizonaGeorgia
Pennsylvania Washington
Illinois North Carolina
Virginia Nevada
TennesseeOregon
Colorado Maryland
South CarolinaAlabama
Oklahoma Hawaii
Utah Missouri
Louisiana New Jersey
Idaho New Mexico
Mississippi Montana Arkansas
Kansas Kentucky
Indiana Wyoming Delaware
DCGuam
chain. In 1985, the company went public trading on NASDAQ under the ROST symbol,
and starts an aggressive expansion by increasing its number of stores, distribution
centers and product portfolio. In 1992, the company added the department of home
accents featuring, fine china, glassware, framed art and ceramics. (Chapter about
Company’s history). Their current website, www.rossstores.com, was launched in 2000
with relevant information regarding investment, customer’s relationship and job
opportunities. In 2004, the company launched dd´s Discounts as a new concept for
lower income consumers.
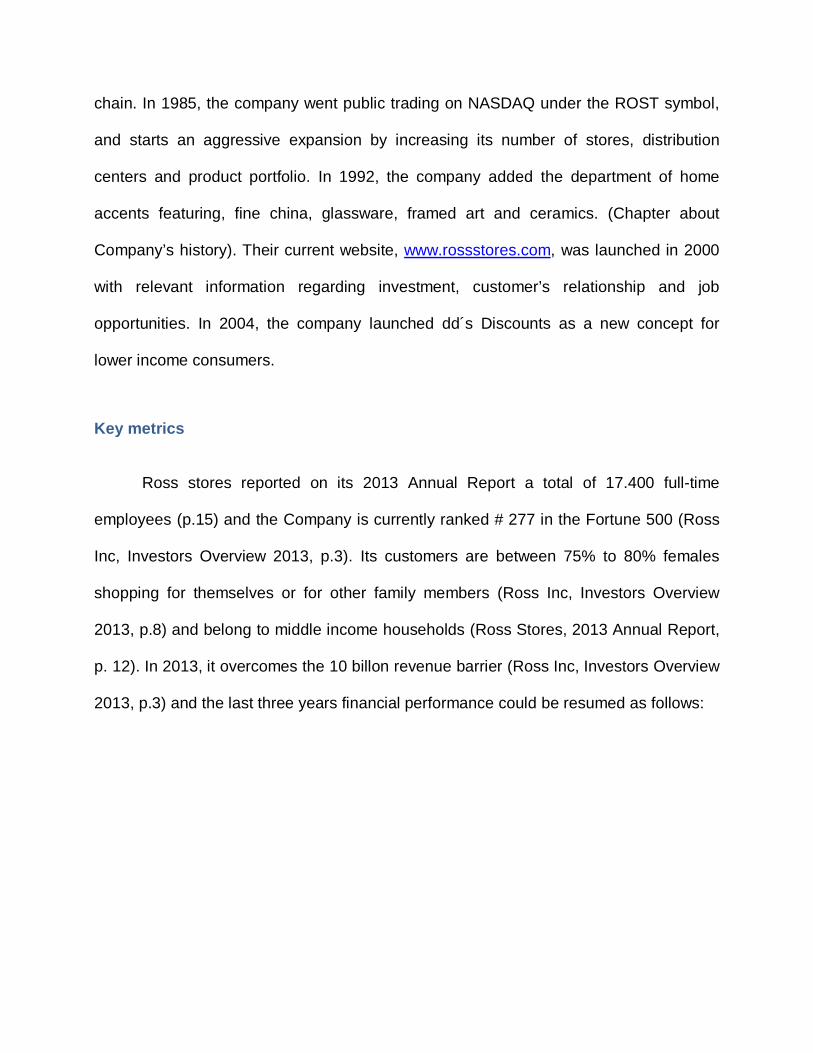
Key metrics
Ross stores reported on its 2013 Annual Report a total of 17.400 full-time
employees (p.15) and the Company is currently ranked # 277 in the Fortune 500 (Ross
Inc, Investors Overview 2013, p.3). Its customers are between 75% to 80% females
shopping for themselves or for other family members (Ross Inc, Investors Overview
2013, p.8) and belong to middle income households (Ross Stores, 2013 Annual Report,
p. 12). In 2013, it overcomes the 10 billon revenue barrier (Ross Inc, Investors Overview
2013, p.3) and the last three years financial performance could be resumed as follows:
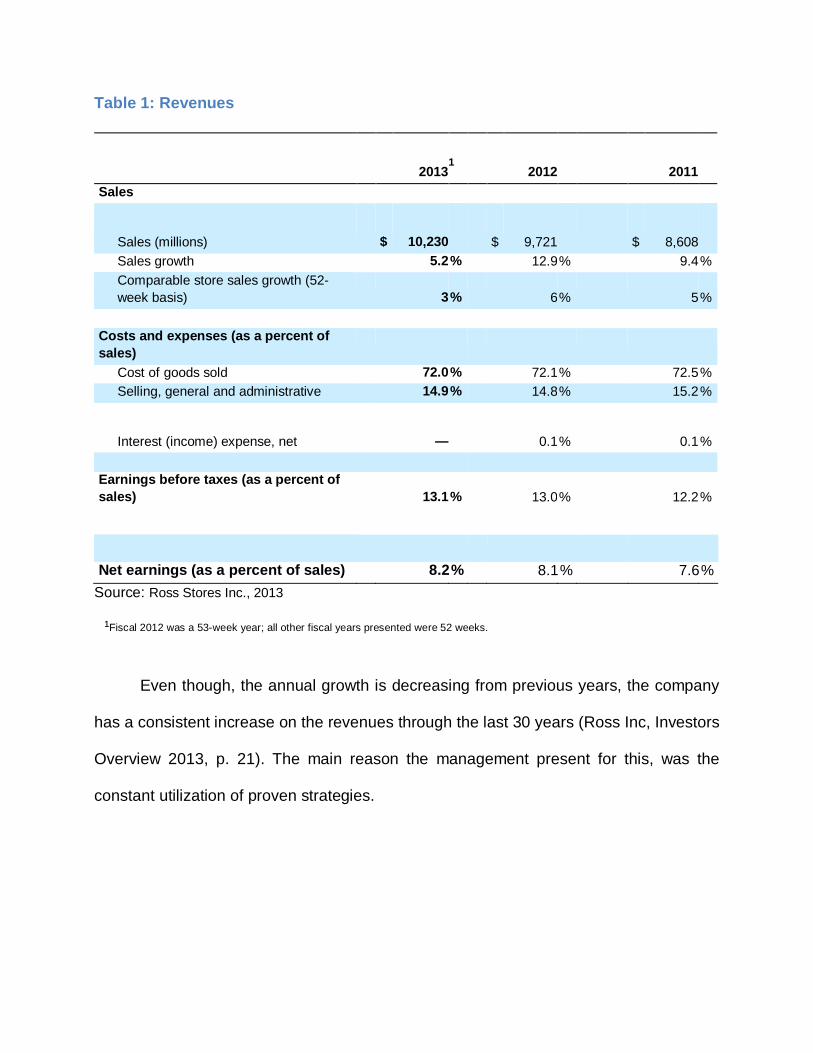
Table 1: Revenues
2013
1
2012
2011
Sales
Sales (millions) $ 10,230
$ 9,721
$ 8,608
Sales growth 5.2% 12.9% 9.4% Comparable store sales growth (52-week basis) 3% 6% 5%
Costs and expenses (as a percent of sales)
Cost of goods sold 72.0% 72.1% 72.5% Selling, general and administrative 14.9% 14.8% 15.2%
Interest (income) expense, net —
0.1% 0.1% Earnings before taxes (as a percent of sales) 13.1% 13.0% 12.2%
Source: Ross Stores Inc., 2013
¹Fiscal 2012 was a 53-week year; all other fiscal years presented were 52 weeks.
Even though, the annual growth is decreasing from previous years, the company
has a consistent increase on the revenues through the last 30 years (Ross Inc, Investors
Overview 2013, p. 21). The main reason the management present for this, was the
constant utilization of proven strategies.
Net earnings (as a percent of sales) 8.2% 8.1% 7.6%

Products
During 2013, the company generated revenues through the following product
categories:
Table 2: Product categories
Product Category Percentage of the total revenues in FY2013
Ladies 29% Home accents and bed and bath 24% Accessories, lingerie, fine jewelry and fragrances 13% Shoes 13% Men´s 13% Children's 8%
Source: Ross Stores Inc., 2013 Figure 2: Total revenues in FY2013
Source: Ross Stores Inc, Investor Overview, August 2014
29%
24%13%
13%
13%8%
Percentage of the total revenues in FY2013
Ladies
Home accents and bed and bath
Accessories, lingerie, fine jewelry and fragrances
Shoes
Men´s

Managing an effective portfolio is critical for every company within the family
clothing stores industry. Ross Stores is very active in following trends and identifying
the additional customer needs. The entire product portfolio of the company is
described in the following table.
Table 3: Products
Apparel and fashion accessories Home decor products Educational toys and games Fragrances Jewelry Footwear Furniture Gourmet food and cookware Home accessories Lingerie Luggage Sporting goods Watches Kitchen Dining Bedding products Bath products Kid’s wear Baby shower gifts Garden Décor Source: Ross Stores Inc., 2013
The ladies segment accounts for 29% of the total revenues in contrast to the men
section which only accounts for 13% (Ross Inc, Investors Overview 2013, p.6). Men and
women apparel can be divided in formal and casual wear; formal typically includes
pieces like suits, blazers, tailored pants and coats, while casual include jeans, shirts,
shorts, running pants and others.
Industry Competition
The family clothing retail US industry (NAICS 448140) is considered mature
within its life cycle mainly because the companies’ procedures are standard and the
revenue grows at the same pace of the economy. This industry value added (IVA),
which measures “the industry´s contribution to the economy, is expected to grow 2.9%
on average per year until 2019, compared to GDP growth of 2.5% per year” (Rivera,
2014, p. 12). The difference is explained by the fact that after the 2009 recession the
industry has made relevant improvements and is expected to remain in the same track
for the next years.
Competitors
The concentration level of the industry is moderate. Is expected that top four
competitors consolidated revenues will account in 2014 for 43.5% (Rivera, 2014, p. 23)
of total industry revenue (Figure 3). Nevertheless, considering the relevance, only 3
main competitors where considered in this analysis, TJX Companies Inc., THE GAP,
INC. Inc. and Ross Stores Inc. On one hand, the first two companies target price-
conscious customers through their low in-store prices, which is the fact that helped
these companies to thrive during recession. On the other hand, THE GAP, INC. Inc.
targets more fashion-conscious customers relying on its existing well positioned brands
to sale products in all price ranges.

Figure 3: Market Share
Source: Rivera, IBIS World, 2014
The family clothing stores are generally located in metropolitan areas and more
concentrated in states like California, Florida and Texas. However, due to the increase
on the online sales, the location for stores is shifting to follow other facts such as
operational costs.
Customers
The customers in this industry are normally sensitive to price changes; however,
comfort and variety are also very important. Higher prices are often related to brands
carrying positive consumer perceptions. Moreover, the stores within this industry are
competing with the stores located under the same area of influence, in which customers
tend to favor those stores near home, unless they are looking for a specific item or
brand.
14.8
13.7
11.1
3.9
56.5
Market share
The TJX Companies Inc.
GAP Inc.
Ross Stores Inc.
Abercrombie & Fitch Co.
Others

External Competition
There are many important competitors assigned to different industries, On one
hand, the stores specialized in specific market segments such as men’s clothing stores,
women’s clothing stores, children’s and department stores. These stores compete
against the family clothing stores in selection and price. On the other hand, the Internet-
based retailers allow customers to buy a wide variety of products at competitive prices
without leaving their homes.
Barriers to Entry
There are some important barriers to entry to this Industry. One is the highly cost
related to develop and maintain a brand reputation; most of the successful existing
competitors invested great time and resources to gain a strong brand name. Other
barrier is the established sourcing networks. For instance, during the recession, Ross
Stores was able to purchase products earlier in the season at discounted prices and
offer them more competitively. For new entrants would be very difficult to offer
competitive prices without having access to these sourcing networks.
Suppliers
The company has a great quantity of suppliers, strengthening its position to select
and manage the negotiation. Even though, there are many social and environmental
risks involved in the supply chain, the company has a clear policy to avoid those
suppliers that are involved in the use of child, slave, prison or forced labor. Moreover,

the company has a network of 7,900 merchandise suppliers to serve the demand
originated in Ross Dress for less and dd’s Discounts stores (Canadean, 2014, p. 15).
Critical success factors
Inventory Management: This is critical for almost every retail company, and it is getting
more important considering the challenges emerging from the on-line demand.
Market Position: The image of the company is proportional to the demand and the flow
of people going to the stores. If the message sent to the market is clear and consistent,
better outcomes are expected.
Brand names: The brands displayed in the stores are as important as the store name
itself.
Production planning: It is also critical to have the products people want at the right
moment. For instance, to THE GAP, INC. is clear how build their own brands gives them
the opportunity to be consistent with the seasonal offers.
Qualified Workforce: Stores are always trying to acquire customer’s fidelity or at least
retain them as much as possible. Currently, the human interrelations are still very
important to enhance the shopping experience.

External Environment
Political and Legal Forces
The company is based entirely in the US. Therefore, almost any important
geopolitical change could affect its performance. However, some legal forces are most
likely to affect the short term financial results.
First, the increase in manpower costs in the United States may have a negative
effect in Ross Stores, mainly because it would affect a big portion of over 17,400 full-
time employees and 48.900 part-time employees (Ross Inc, 2013 Annual Report, p. 15).
The federal minimum wage provisions are contained in the Fair Labor Standards Act
and depending on the State, the current rate could vary between $8 and $10 dollars per
hour (Canadean, 2014, p.18).
Second, the company may be affected as a result of changes in effective actions
and regulations against counterfeit products. The penetration of counterfeit merchandise
decreases the company sales and products with fake labels affect the consumer
confidence and damage the genuine brand image. The International Chamber of
Commerce in 2014 estimated that global economic and social impacts of counterfeiting
and piracy are expected to reach US$2 trillion by 2015 and International trade in fakes is
expected to increase to $ US$960 billion by 2015 (Canadean, 2014, p.18).
Finally, some regulations can affect indirectly the company through its contractors
or other companies related to its supply chain. In December 2012, the “US department
of Labor´s Wage and Hour Division and the California Division of Labor Standards
Enforcement uncovered various labor violations during an inspection of ten garment

contractors in California” (IVA Report, MSCI, 2013, p.9). It was further stated that one of
the companies that sourced the contractor’s merchandise was Ross Stores Inc.
Economic forces
Many economic factors can affect the consumer disposable income and
consumer confidence. According to the 2013 Company´s Annual Report, some of those
are interest rates, recession, inflation, deflation, energy costs, tax rates and policy,
unemployment trends, and fluctuation commodity costs (p.16). Nevertheless, the
increase on the disposable income could also affect adversely to Ross Stores: “A focus
on fashion rather than function will also play a role in consumer decisions when making
purchases from family clothing stores. Well-established, branded stores will likely
experience a surge in sales, while revenue from competitively priced retailers like Ross
may stagnate” (Rivera, 2014, p. 9). This specific fact could benefit some competitors
more fashion-oriented like THE GAP, INC. Inc.
Social forces
It was stated before that over 75% of the company’s customers are women
buying merchandise for the entire family. This is a critical fact that the company takes in
account to develop new markets and build new stores. Furthermore, the number of
adults between the ages 20 and 64 years old are expected to grow, and since women’s
clothing accounts for the bulk of industry revenue, it makes women over the age of 20
and less than 65-years-old the key market for industry operators. Any shifts in this group
are likely to adversely demand for industry products (Rivera, 2014, p.14).
Technological forces
Many technological advances are helping the family clothing retail industry to
enhance different functions; these improvements are commonly performed in security,
inventory management and labor management. Centralized systems are used to
monitor the supply chain management and they are combined with barcode and radio
frequency identification (RFID) technology to make processes more efficient. According
to Rivera (2014), “Ross Stores has a labor management system that tracks in-store
labor against budget and forecasts to determine if resources are being allocated
correctly and if adjustments need to be made” (p.28).
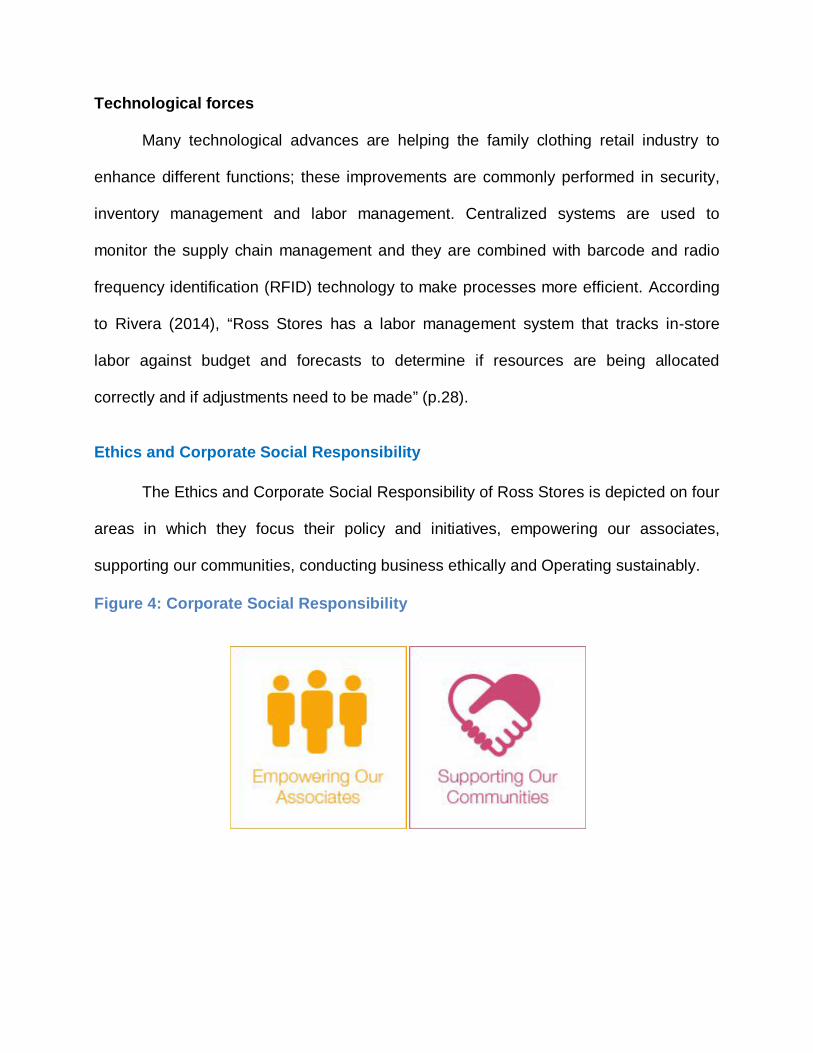
Ethics and Corporate Social Responsibility
The Ethics and Corporate Social Responsibility of Ross Stores is depicted on four
areas in which they focus their policy and initiatives, empowering our associates,
supporting our communities, conducting business ethically and Operating sustainably.
Figure 4: Corporate Social Responsibility

Source: Ross Stores Inc., 2013
Empowering our associates
They claim to provide a working environment for their employees to grow and
contribute to their own community. The initiatives they performed in behalf this area are
described in the following table:
Table 4: Working environment contributions
• Training and development programs • Advancement opportunities • A commitment to diversity • Volunteering in the community • A scholarship program for associates and their children • Competitive benefits and total rewards package • A safe work environment • Inviting feedback regularly • Hiring in our communities • Military recruiting program
Source: Ross Stores Inc., Corporate Social Responsibility Overview, 2014
Supporting our communities
The company works with local and national organizations to support the
communities focusing in building academic achievement and life skills for young people.
Some of Ross Stores community partners are: Boys and Girls Clubs of America, First
Book, American Heart Association and American Red Cross (CSR Overview, 2014,
p.10).

Operating sustainably
The company is empowered with efficiency and sustainability to become
responsible corporate citizens, lower costs and deliver the expected value to the
company´s customers. Some of the operating sustainably initiatives within this field are:
sustainable product transportation, energy efficiency at the stores and distribution
centers, reduction of waste and increase of the company’s efficiency sustainability at the
headquarters (CSR Overview, 2014, p.19-26).
Conducting business ethically
Regarding to this field, the company acknowledge the risks involved in being part
of such complex supply chain environment. Moreover, they create a specific policy
stated as follows: “This focus on ethical business practices is also reflected in Ross’
policy that we will not knowingly purchase merchandise from any manufacturer involved
in the use of child, slave, prison or forced labor” (CSR Overview, 2014, p.27).
Nevertheless, they claim to source their products from diverse suppliers always trying to
build long-lasting relationships.
Finally, in order to have a different and independent perspective, a private
assessment must be consulted. According to the MSCI ESG (environmental, social and
governance) Research, the company’s Intangible Value Assessment (IVA) is BB and the
component ratings are the following:
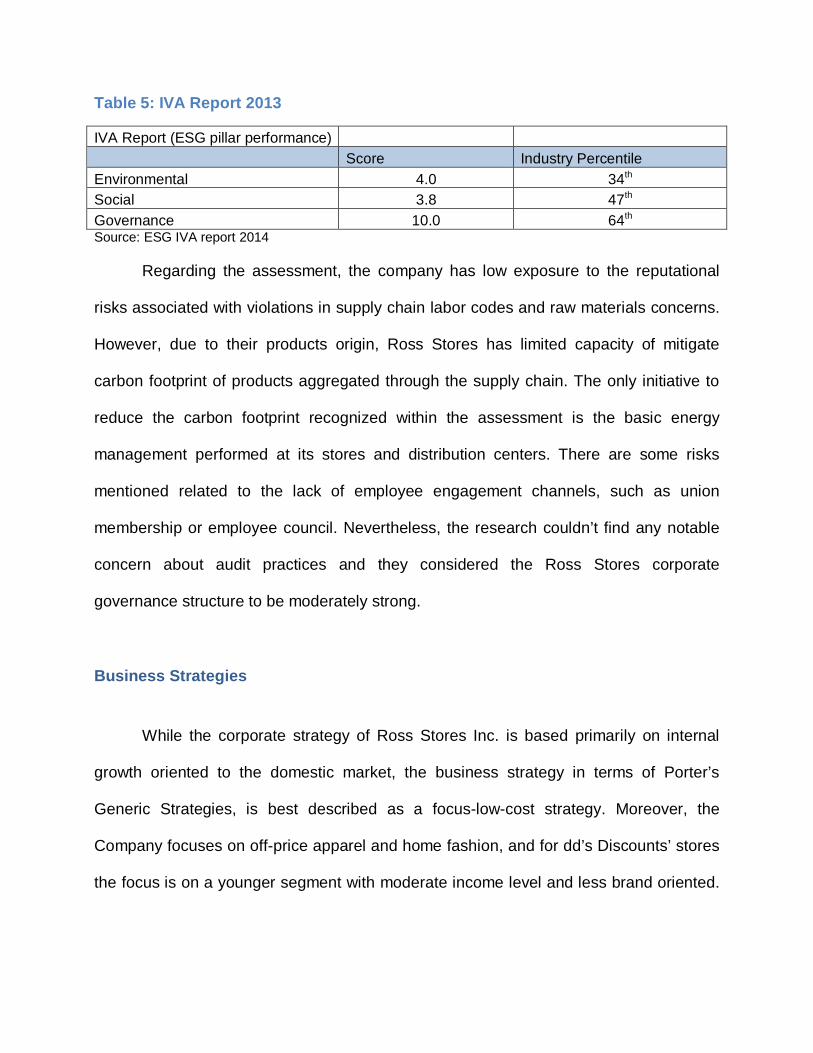
Table 5: IVA Report 2013
IVA Report (ESG pillar performance) Score Industry Percentile Environmental 4.0 34th Social 3.8 47th Governance 10.0 64th Source: ESG IVA report 2014
Regarding the assessment, the company has low exposure to the reputational
risks associated with violations in supply chain labor codes and raw materials concerns.
However, due to their products origin, Ross Stores has limited capacity of mitigate
carbon footprint of products aggregated through the supply chain. The only initiative to
reduce the carbon footprint recognized within the assessment is the basic energy
management performed at its stores and distribution centers. There are some risks
mentioned related to the lack of employee engagement channels, such as union
membership or employee council. Nevertheless, the research couldn’t find any notable
concern about audit practices and they considered the Ross Stores corporate
governance structure to be moderately strong.
Business Strategies
While the corporate strategy of Ross Stores Inc. is based primarily on internal
growth oriented to the domestic market, the business strategy in terms of Porter’s
Generic Strategies, is best described as a focus-low-cost strategy. Moreover, the
Company focuses on off-price apparel and home fashion, and for dd’s Discounts’ stores
the focus is on a younger segment with moderate income level and less brand oriented.

Therefore, the strategies implemented emphasize low overall purchasing costs while
serving the specific off-price segment within the United States market.
Furthermore, in terms of the Miles and Snow strategy framework which considers
four strategic types (prospectors, defenders, analyzers and reactors), the Company’s
strategy is clearly identified as analyzer because they imitate or respond prospectors
while maintaining efficiency in operations. Moreover, by offering off-price products, Ross
Stores Inc is seeking a second mover advantage.
Even tough, Ross Stores Inc. adopted the same generic strategy than other
competitors by comprising the clothing off-price strategic group; the Company applies
multiple functional strategies. The most visible strategy that reveals the intention to
differentiate from its competitors is emphasizing the treasure hunt of fashion brands or
enhancing the merchandising capabilities.
Functional strategies
For both business units, Ross dress for less and dd’s Discounts, the functional
strategies are similar and executed on a centralized manner. Moreover, since the
difference between Ross dress for less and dd’s discounts is the target market, only the
marketing strategies are particularly different for each business unit.
Marketing
The Company’s marketing always seek to communicate the message, great
brands at great values every day and it is well directed to their primary customers, which
according to their investors report are mostly women (75-80%), shopping for herself or
for other family members. Their customers depending on the household incomes could

be typically wanting or needing a bargain. The specific strategies are described in the
Investors Overview Report (2014) using the four Ps, price, promotion, product and
place.
Price
The price is emphasized on each product tag by comparing to a supposed retail
normal price and the average mark down for the entire product mix is normally between
27% and 28% (See Table 1). The difference between the “normal retail price” and the
price offered is one critical fact to motivate the treasure hunt among their customers.
Figure 5: Price tags in Ross Stores
Source: Google, 2014
Moreover the gross margin of the company has increased during the past few
years due to better buying and faster inventory turns as a consequence of the reduction
of selling store inventories.
For the specific case of dd’s Discounts, the assortments feature more moderate
brands and fashions for the family and home but at lower average price points than
Ross dress for less.

Promotion
The Company uses a wide variety of methods to promote its brand and offers
such us TV, radio, newspaper, btl media and social media. Nevertheless, according to
their Investors Overview Report (2014) the most effective medium to reach its customers
encouraging more frequent shopping and creating awareness is the Television (p.8).
The message is consistent with the business strategy and, as we can see on the
announcements posted on the Company’s facebook page, they used a lot the concept
of “treasure hunt” or “bargain hunter” during the past months. They also use frequently
fashion dressed women and communicate holyday’s sales to enhance the seasonality
impact. Some examples of the promotion strategy can be seen on the following pictures:
Figure 6: Promotions through Ross Stores Facebook page

Source: Ross dress for less facebook page
Product
The composition of products in terms of categories is described on Figure 2 and
Table 3. The same composition applies for both business units with the only difference
that Ross dress for less targets more brand oriented customers by offering well known
brands in contrast to dd’s Discounts which emphasizes the value of the products for
moderate household income customers. Nevertheless, the quality and characteristics of
the entire product mix offered in both business units highly depends upon the vendor’s
network and the purchasing strategy that will be described further on.
For instance Ross dress for less carries products that you might find at Dillards or
Macys, while dd’s Discounts carries products that you might find at Sears or Wallmart.
(Mannes, 2012)
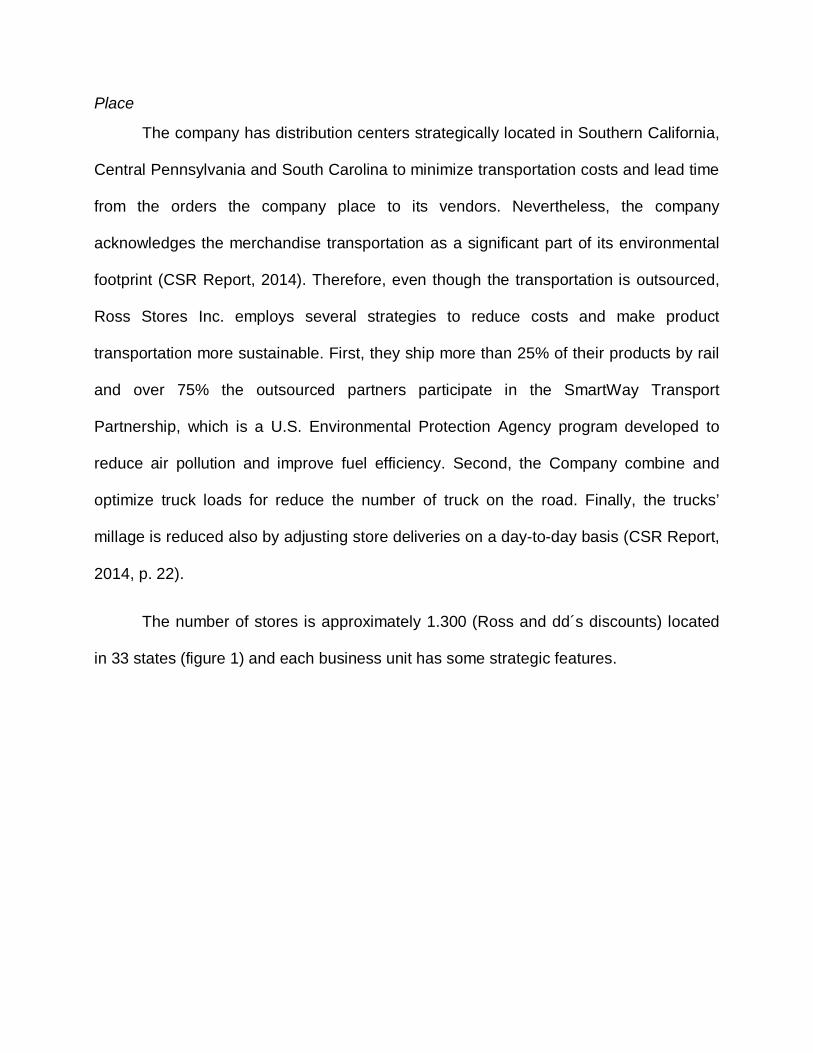
Place
The company has distribution centers strategically located in Southern California,
Central Pennsylvania and South Carolina to minimize transportation costs and lead time
from the orders the company place to its vendors. Nevertheless, the company
acknowledges the merchandise transportation as a significant part of its environmental
footprint (CSR Report, 2014). Therefore, even though the transportation is outsourced,
Ross Stores Inc. employs several strategies to reduce costs and make product
transportation more sustainable. First, they ship more than 25% of their products by rail
and over 75% the outsourced partners participate in the SmartWay Transport
Partnership, which is a U.S. Environmental Protection Agency program developed to
reduce air pollution and improve fuel efficiency. Second, the Company combine and
optimize truck loads for reduce the number of truck on the road. Finally, the trucks’
millage is reduced also by adjusting store deliveries on a day-to-day basis (CSR Report,
2014, p. 22).
The number of stores is approximately 1.300 (Ross and dd´s discounts) located
in 33 states (figure 1) and each business unit has some strategic features.
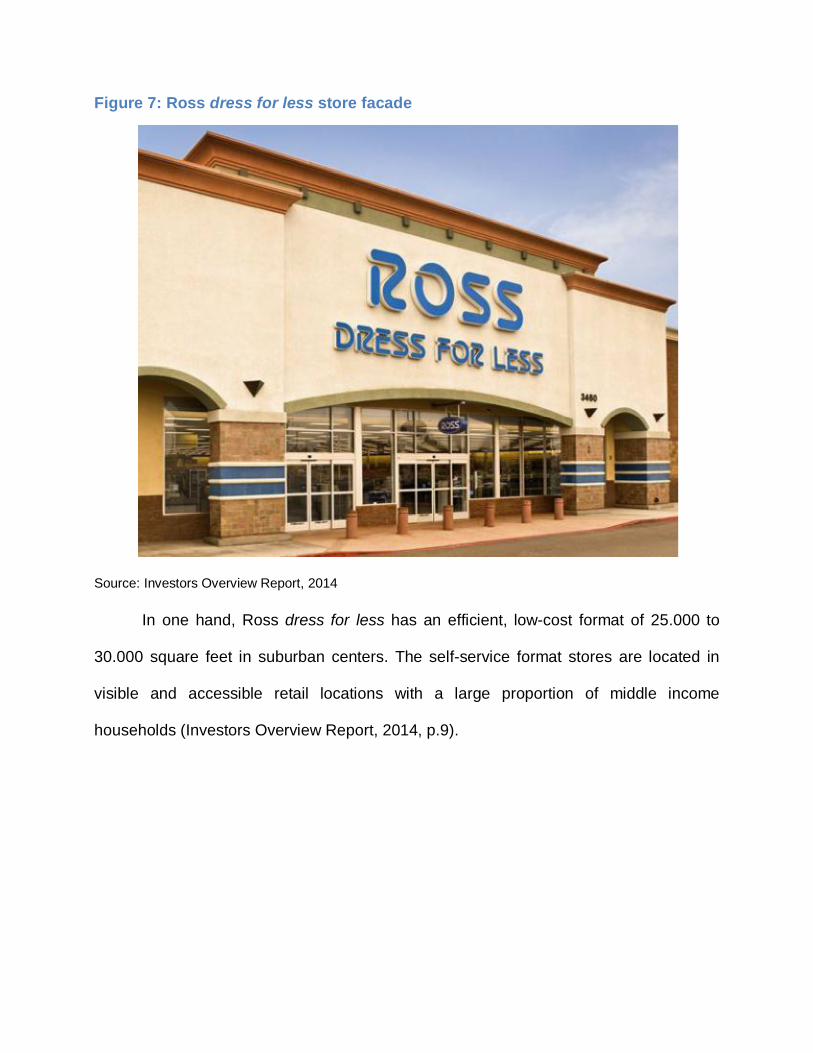
Figure 7: Ross dress for less store facade
Source: Investors Overview Report, 2014
In one hand, Ross dress for less has an efficient, low-cost format of 25.000 to
30.000 square feet in suburban centers. The self-service format stores are located in
visible and accessible retail locations with a large proportion of middle income
households (Investors Overview Report, 2014, p.9).

Figure 8: dd's Discounts store facade
Source: Investors Overview Report, 2014
On the other hand, dd’s Discounts is typically located within areas populated by
younger customers with more moderate income levels than Ross dress for less. The
format is still self service and cost-efficient, however the size is slightly smaller (20.000 –
25.000 square feet and a larger children’s department (Investors Overview Report,
2014, p. 10).
According to the Company’s business strategy, potential locations are being
identified to increase the number of stores up to 2.500 units within the United States,
where 2.000 stores correspond to Ross dress for less and 500 to dd’s Discounts
(Investors Overview Report, 2014, p. 13). This potential growth would double the size of
the existing store base and is considered for the long term.
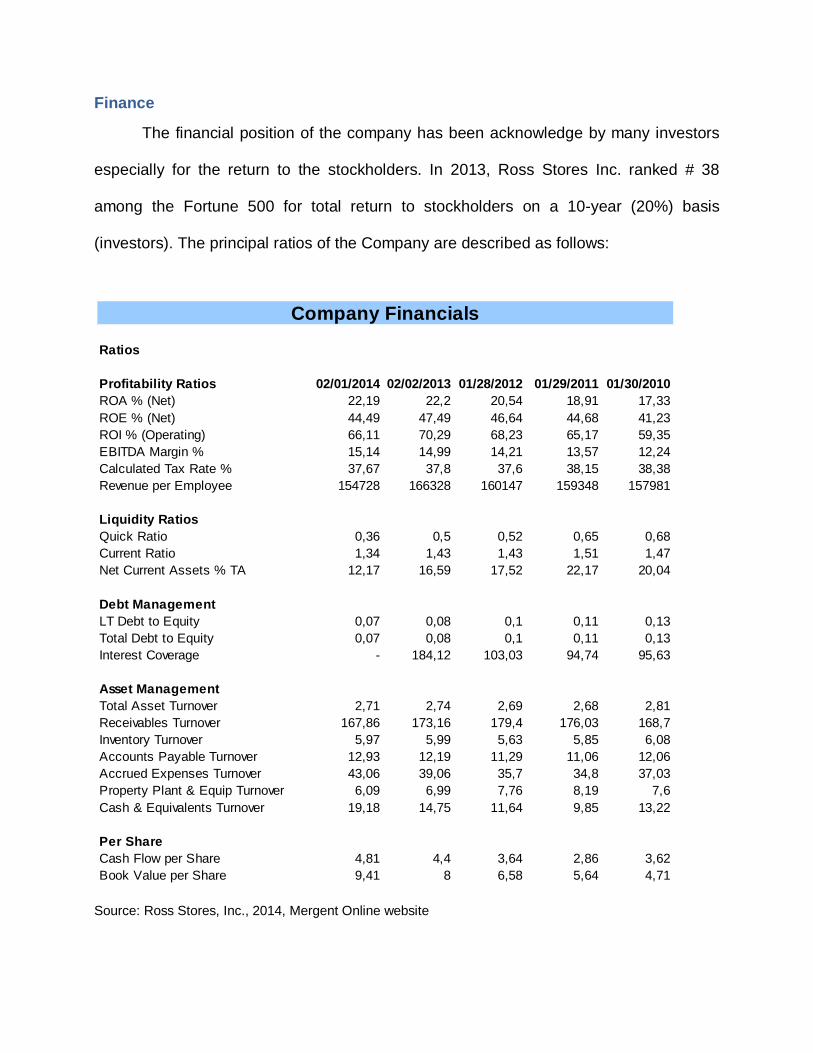
Finance
The financial position of the company has been acknowledge by many investors
especially for the return to the stockholders. In 2013, Ross Stores Inc. ranked # 38
among the Fortune 500 for total return to stockholders on a 10-year (20%) basis
(investors). The principal ratios of the Company are described as follows:
Source: Ross Stores, Inc., 2014, Mergent Online website
Company Financials
Ratios
Profitability Ratios 02/01/2014 02/02/2013 01/28/2012 01/29/2011 01/30/2010ROA % (Net) 22,19 22,2 20,54 18,91 17,33ROE % (Net) 44,49 47,49 46,64 44,68 41,23ROI % (Operating) 66,11 70,29 68,23 65,17 59,35EBITDA Margin % 15,14 14,99 14,21 13,57 12,24Calculated Tax Rate % 37,67 37,8 37,6 38,15 38,38Revenue per Employee 154728 166328 160147 159348 157981
Liquidity RatiosQuick Ratio 0,36 0,5 0,52 0,65 0,68Current Ratio 1,34 1,43 1,43 1,51 1,47Net Current Assets % TA 12,17 16,59 17,52 22,17 20,04
Debt ManagementLT Debt to Equity 0,07 0,08 0,1 0,11 0,13Total Debt to Equity 0,07 0,08 0,1 0,11 0,13Interest Coverage - 184,12 103,03 94,74 95,63
Asset ManagementTotal Asset Turnover 2,71 2,74 2,69 2,68 2,81Receivables Turnover 167,86 173,16 179,4 176,03 168,7Inventory Turnover 5,97 5,99 5,63 5,85 6,08Accounts Payable Turnover 12,93 12,19 11,29 11,06 12,06Accrued Expenses Turnover 43,06 39,06 35,7 34,8 37,03Property Plant & Equip Turnover 6,09 6,99 7,76 8,19 7,6Cash & Equivalents Turnover 19,18 14,75 11,64 9,85 13,22
Per ShareCash Flow per Share 4,81 4,4 3,64 2,86 3,62Book Value per Share 9,41 8 6,58 5,64 4,71

It is important to mention that profitability ratios such as ROA (22.19%) and
EBITDA (15.14%) show a good performance after the recession. As it is described
above, both increase consistently from 2010 to 2014.
Perhaps one of the lowest relative ratios the company has is Debt to Equity (0.07
vs. 0.46 of THE GAP, INC.), which is explained by considering the low leverage the
Company has upon external sources. The inventory turnover, 5.97 is average within the
industry (THE GAP, INC. 5.35) and it is a good ratio for retail assessment revealing that
Ross Stores, Inc. rotates its inventory every two months.
The Net current assets ratio (12.17) is low in comparison to other competitors
such as THE GAP, INC. (25.29). Nevertheless, Ross Stores does not show any liquidity
problem and it is being systematically reducing the inventory levels without affecting the
stores sales performance. Moreover, its financial plans are considered to increase the
capital expenditures on infrastructure and new stores according to the expansion plan
Furthermore, for FY 2014, the capital expenditures are expected to increase to
approximately $800 million in order to finance new stores and other infrastructure
investments such as, the New York Buying Office building. It will enable Ross Stores
Inc. to house all the New York Company’s merchants together increasing the
effectiveness of this strategic function (Ross Stores Inc, 2013 Annual report, p.6 ).
Production
Ross Stores, Inc. does not produce their products by itself and the majority of the
apparel, footwear, accessories and home fashions are purchased from suppliers after
they have been produced or imported in response to other retail chain’s orders.
However, a small portion of merchandise is ordered directly through the Company’s
international buying agents. For these particular items, there are additional quality
requirements.
Purchasing
One of the strengths the Company has is its purchasing function. The company’s
buyer’s objective is to get the right goods to the right stores at the right time; that is why
people, process and technology are in continuous assessment and improvement to
increase the purchasing performance. The buyer´s offices are strategically located in
New York City and Los Angeles to buy closeouts and cancelled orders. This is probably
the clearest evidence of the company using the second mover strategy.
Human Resource Management
Another clear objective of the company is to embrace diversity. The workforce is
consists of people with a range of economic and ethnic background; currently, 72
percent of our associates are people of color and 77 percent are women (CSR, 2014, p.
6).
Information Systems
As it was stated before, technology and information systems are critical for the
inventory management and the purchasing function. Furthermore, Ross Stores
developed a system to perform a strategy they named micro-merchandising. The
purpose of this strategy is to drive better product allocation and increase the margins.
The results can be seen on Table 1.

Another relevant information system Ross Stores is utilizing to improve stores’
performance is a labor management system that tracks in-stores labor against budget
and forecasts in order to evaluate the correct allocation of human resources.
Strategy Formulation
Perhaps the best and more used tool to formulate strategies is the SWOT
Analysis. Identifying the strengths, weaknesses, opportunities and threats enables
management to formulate realistic and effective strategies. The SWOT analysis for Ross
Stores, Inc. contains the following elements:
Strengths
1. Off-price business model helps deliver significant bargain
2. Better inventory management leading to gross margin expansion
3. Effective sourcing strategy coupled with strong vendor relationships
4. Pricing policy
Weaknesses
1. Lack of presence in e-commerce platform
2. Concentrated presence in the U.S.
Opportunities
1. Expansion to penetrate into the US
2. A shift in the behavior of shoppers towards low-priced branded products
3. Overseas market
Threats
1. Intense competition in the retail environment
2. Regulations concerning the quality and safety of products
3. Increase in operating cost due to rising labor
4. Increase in counterfeit products
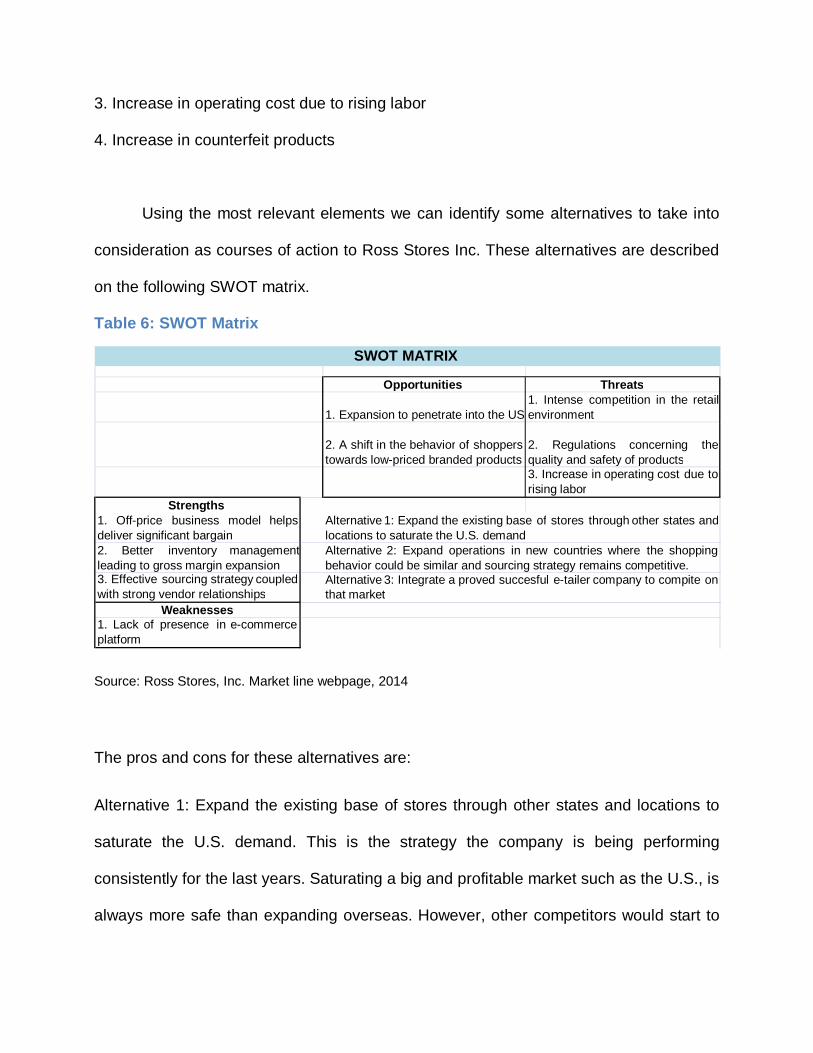
Using the most relevant elements we can identify some alternatives to take into
consideration as courses of action to Ross Stores Inc. These alternatives are described
on the following SWOT matrix.
Table 6: SWOT Matrix
Source: Ross Stores, Inc. Market line webpage, 2014
The pros and cons for these alternatives are:
Alternative 1: Expand the existing base of stores through other states and locations to
saturate the U.S. demand. This is the strategy the company is being performing
consistently for the last years. Saturating a big and profitable market such as the U.S., is
always more safe than expanding overseas. However, other competitors would start to
Opportunities Threats
1. Expansion to penetrate into the US1. Intense competition in the retailenvironment
2. A shift in the behavior of shopperstowards low-priced branded products
2. Regulations concerning the quality and safety of products3. Increase in operating cost due torising labor
Strengths 1. Off-price business model helpsdeliver significant bargain 2. Better inventory managementleading to gross margin expansion3. Effective sourcing strategy coupled with strong vendor relationships
Weaknesses1. Lack of presence in e-commerce platform
Alternative 1: Expand the existing base of stores through other states andlocations to saturate the U.S. demandAlternative 2: Expand operations in new countries where the shopping behavior could be similar and sourcing strategy remains competitive.Alternative 3: Integrate a proved succesful e-tailer company to compite onthat market
SWOT MATRIX
develop a strong presence on other countries such as the BRIC group building potential
barriers for Ross Stores to enter.
Alternative 2: Expand operations in new countries where the shopping behavior could be
similar and sourcing strategy remains competitive. Since the company has proved
sourcing capabilities and great efficient inventory management system, it could be great
to explore other country’s markets. Nevertheless, some additional costs, research and
political risks would interfere during this course of action.
Alternative 3: Integrate a proved successful e-tailer company to compete on the digital
market. Worldwide tendency is clear related to e-commerce. Not entering to this market
could be a threatening to the Company’s future. Moreover, since many companies are
showing great operational performance as apparel e-tailers, the transition to this new
segment could be smoothed using an integration strategy. The integration has many
risks and also could affect negatively Ross Stores, Inc. image.
Perhaps, the best course of action for the Company at this moment is to continue
with the expansion strategy through the U.S. market before start overseas expansion.
However, some efforts are recommendable to evaluate and execute Alternative 3. The
e-commerce is too relevant to avoid consider it in the short term.
Strategy Execution: Structure, Strategic Change, Culture and Leadership
The organizational structure of Ross Stores, Inc. has been conducted on a very
consistent way due to its experienced Board of Directors and Officers. Both, the
President of the Board and the CEO have a vast corporate experience and their tenure
is over 20 years within the Company.

Figure 9: Ross Stores, Inc. Executives
Source: Mergent online webpage
During 2014, Barbara Rentler became the Chief Executive Officer of the
Company and Michael Balmuth become the Executive Chairman of the Board and
keeps playing an integral role on the senior management team (Market watch, 2014).
The fact that management continues executing similar corporate strategies and
keeps avoiding the integration into potential markets such as, e-comerce, is a sign of an
inert culture. Nevertheless, Ross Stores, Inc is been characterized by strong values like
consistency, reliability and commitment to the employees and society.
Furthermore, some changes have been performed during the last years related to
the implementation of information systems and enhancing dd’s Discounts performance.
However, the Company does not show a strong intention to generate disruptive
changes.
James S. Fassio Title : President Tenure : 26 Age : 59 Total Compensation : $4,043,561 %Change : 0.03 Status : Active Michael Balmuth Title : Executive Chairman Tenure : 25 Age : 63 Total Compensation : $6,231,026 %Change : -0.43 Status : Active
Barbara Rentler Title : Chief Executive Officer Tenure : 28 Age : 56 Total Compensation : $4,828,713 %Change : -0.02 Status : Active
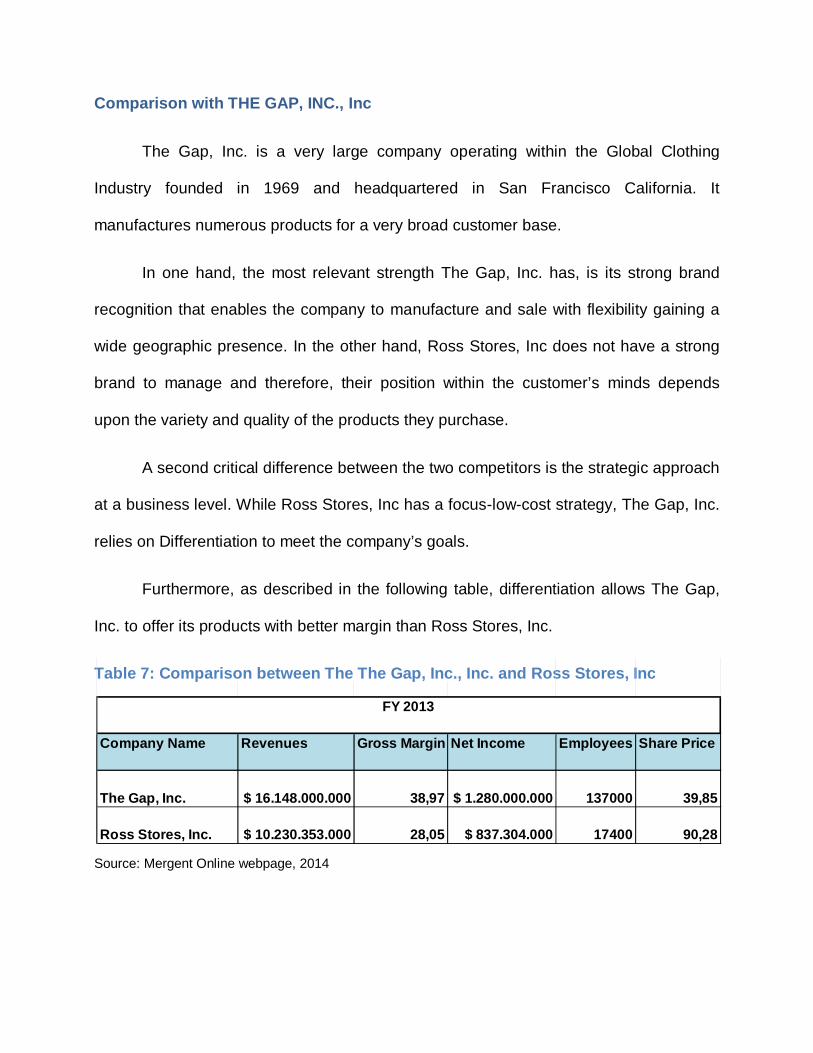
Comparison with THE GAP, INC., Inc
The Gap, Inc. is a very large company operating within the Global Clothing
Industry founded in 1969 and headquartered in San Francisco California. It
manufactures numerous products for a very broad customer base.
In one hand, the most relevant strength The Gap, Inc. has, is its strong brand
recognition that enables the company to manufacture and sale with flexibility gaining a
wide geographic presence. In the other hand, Ross Stores, Inc does not have a strong
brand to manage and therefore, their position within the customer’s minds depends
upon the variety and quality of the products they purchase.
A second critical difference between the two competitors is the strategic approach
at a business level. While Ross Stores, Inc has a focus-low-cost strategy, The Gap, Inc.
relies on Differentiation to meet the company’s goals.
Furthermore, as described in the following table, differentiation allows The Gap,
Inc. to offer its products with better margin than Ross Stores, Inc.
Table 7: Comparison between The The Gap, Inc., Inc. and Ross Stores, Inc
Source: Mergent Online webpage, 2014
Company Name Revenues Gross Margin Net Income Employees Share Price
The Gap, Inc. $ 16.148.000.000 38,97 $ 1.280.000.000 137000 39,85
Ross Stores, Inc. $ 10.230.353.000 28,05 $ 837.304.000 17400 90,28
FY 2013

Finally, reviewing the financial ratios of both companies (Table ), Ross Stores,
Inc. appears to be more profitable since its ROI was 66.11 compare to 50.14 for The
Gap, Inc.. However, The Gap, Inc. has better liquidity ratios considering a higher level of
inventories worldwide. In terms of debt management, there is a big difference due to the
fact The Gap, Inc. has a strong external financial sources’ leverage.
Table 8: Financial comparison between Ross Stores, Inc. and The Gap, Inc.
Source: Mergent Online website
Financial Comparison
RatiosROSS THE GAP
Profitability Ratios 02/01/2014 02/01/2014ROA % (Net) 22,19 16,76ROE % (Net) 44,49 43,1ROI % (Operating) 66,11 50,14EBITDA Margin % 15,14 16,59Calculated Tax Rate % 37,67 38,84Revenue per Employee 154728 118192
Liquidity RatiosQuick Ratio 0,36 0,8Current Ratio 1,34 1,81Net Current Assets % TA 12,17 25,29
Debt ManagementLT Debt to Equity 0,07 0,45Total Debt to Equity 0,07 0,46Interest Coverage - 38,38
Asset ManagementTotal Asset Turnover 2,71 2,11Receivables Turnover 167,86 40,84Inventory Turnover 5,97 5,35Accounts Payable Turnover 12,93 13,57Accrued Expenses Turnover 43,06 35,78Property Plant & Equip Turnover 6,09 6,02Cash & Equivalents Turnover 19,18 10,9
Per ShareCash Flow per Share 4,81 3,71Book Value per Share 9,41 6,87

Conclusions
The entire strategic process of Ross Stores Inc. analysis uncovered some
relevant facts:
The company is perceived as very reliable and profitable by the stockholders due
to their positive consecutive financial results, a consistent leadership and a
proved strategic behavior.
Even though the off-price retailers thrive most likely during economic recessions,
in the last years the demand for Ross Stores, Inc. products has a consistent
growth and the company expects the customer behavior to keep shifting into the
off-price apparel products.
Consistency and the focus-low-cost strategy are given the company a continuous
increase on the market share within the industry. Moreover, part of this augment
comes from other companies that are targeting products towards brand-oriented
customers.
Finally, the strategy the company has been executing would last for the next few
years. However, in a long term basis other competitors or apparel retailers would
outperform Ross Stores, Inc. in terms of supply chain management and
merchandising. Therefore, if the company maintains its strategic behavior will
most likely lose market share and expansion opportunities.

References
(2014, May), Ross Stores Announces Senior Management Succession, Ross Stores
Inc. press release. Retrieved December 3, 2014 from MarketWatch webpage. (2014, June), Ross Stores' Growth Initiatives Show Potential, Zacks Equity Research.
Retrieved December 4, 2014 from Yahoo finance webpage. (2014, October), Ross Stores Inc., Retrieved from the University of South Florida,
University Library Web site: http://www.mergentonline.com Canadean. (2014, October). Ross Stores, Inc. Web.Retrieved October 18, 2014, from
Canadean Market Research database. Datamonitor 360-Marketline (2014, October). Ross Stores Inc., Company Profile.
Retrieved October 18, 2014 from Marketline database. Web. Gale Cengage Learning. (n.d.). Ross Stores, Inc. [Company profile]. Retrieved October
18, 2014, from Business Insights: Essentials database. International Directory of Company Histories, Vol. 17, St James Press, 1997. Retrieve
from http://www.fundinguniverse.com/company-histories/ross-stores-inc-history/ Jenny, S. (n.d). High hopes for low prices / Ross appeals to bargain hunters with DD's Discounts. San Francisco Chronicle (CA)
John A. Parnell, Strategic Management Theory and Practice, Los Angeles, CA: SAGE Publications, Inc, 2014, pp. 422-437
Mannes T (2012,February), Ross opens 2 more dd’s Discounts in SD, Retrieved
December 2, 2014, from Union-Tribute San Diego. Web Mammarella, J. (2010). Ross Stores Reports Spectacular First Quarter. Home Textiles Today, (13).
MSCI ESG Research (2014, October). Ross Stores Inc. Intangible Value Assessment (IVA). Retrieved October 18, 2014, from MSCI ESG Research Database. Web
Max Byerly (2014, Oct 9th), Insider Selling: Ross Stores Insider Sells 20,000 Shares of
Stock (ROST). Retrieved October 18, 2014, from Ticker Report. Web Rivera E. (2014), IBIS World Industry Report 44814. Family Clothing Stores in the US.
Web. Retrieved October 18, 2014, from IBIS Industry Market Research database.

Ross Stores Inc. (2014). 2013 Annual Report. Web. Ross Stores Inc. (2014). Investor Overview August 2014. Web. Ross Stores Inc. (2014). Corporate Responsibility. Web.