University of Rhode Island Natural Resources Sciencenesoil.com/sas/1_17_Stolt2.pdf · ·...
34
Subaqueous Soils and Shellfish Aquaculture Mark H. Stolt University of Rhode Island Natural Resources Science
Transcript of University of Rhode Island Natural Resources Sciencenesoil.com/sas/1_17_Stolt2.pdf · ·...

Subaqueous Soils and Shellfish Aquaculture
Mark H. Stolt
University of Rhode IslandNatural Resources Science

Acknowledgements
Dr. Jose Amador
Chelsea Duball
Alex Salisbury
Dr. Brett Still
Coastal FellowsShannon Cron, Mason Garfield,Kristopher Plante, Annie Ragan,
Lauren Salisbury,Ed Tally, Marissa Theve
Laboratory of Pedology &
Soil Environmental Science
Oyster farmers!
Soils Work!
NRCS Soil ScientistsJim TurenneMaggie Payne
Steven Brown (TNC)Dave Beutel (CRMC)

Aquaculture projects
• Aquaculture Productivity• Effects of Aquaculture on Soils• Coastal Acidification• Balancing Aquaculture with Other Estuary Uses

Shellfish Growth Experiment LocationsFigure 1:


• Psammowassents
• (sandy, low SOM and sulfides)
• Sulfiwassents
• silty, high sulfides, & SOM)
• Haplowassents
• (loamy, intermediate sulfides)
Subaqueous Soil Landscape Relationships

Hard-shell Clam Growth
Initial size 9 mm
300 clams/plot
420 days

Initial size 30 mm long in June 2008Oyster Growth

Oyster growth/day vs Sand Content

5 growing seasons (2008 – 2009,
2011 – 2013)
– 3 replicate aquatrays/site
(250 oysters/m2)
– Sampled 30 oysters from
each tray
– Calculated growth rates
(mm/day)

Oyster Growth vs. Year

Oyster Growth vs. Estuary Type
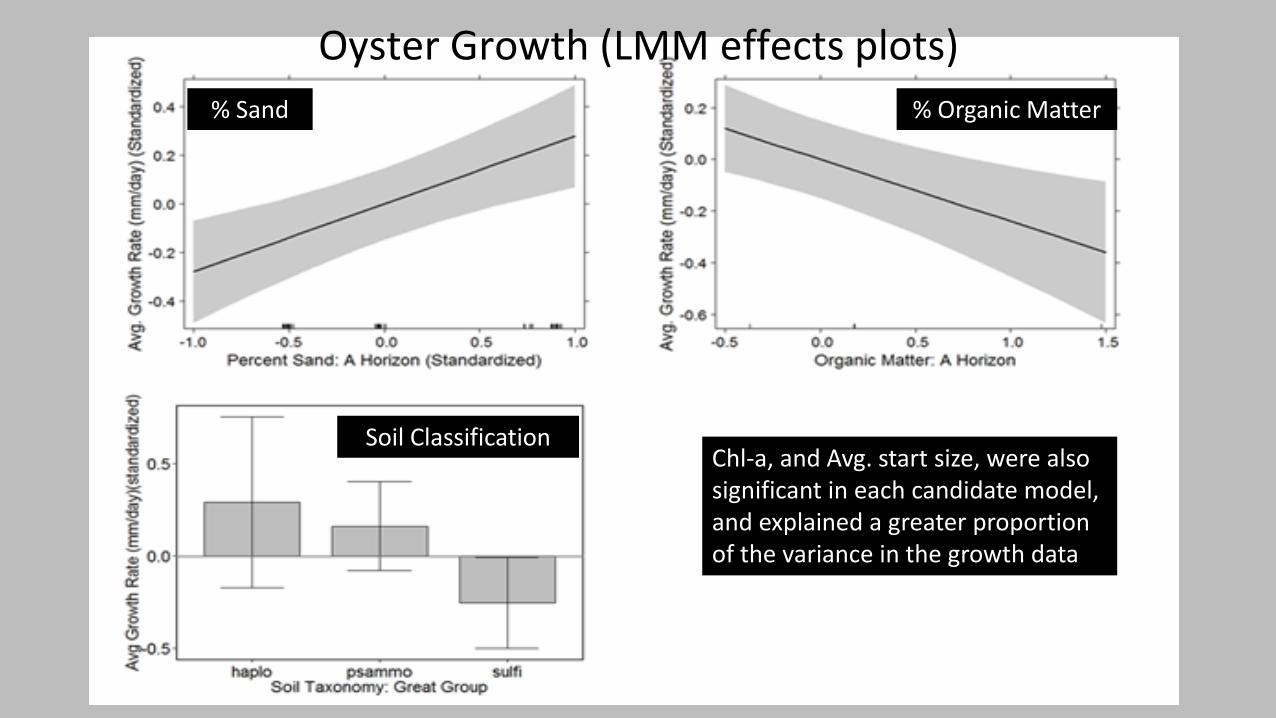
Oyster Growth (LMM effects plots)
% Sand
Soil Classification
% Organic Matter
Chl-a, and Avg. start size, were also significant in each candidate model, and explained a greater proportion of the variance in the growth data

Oyster Aquaculture in Ninigret Pond, RI
Oyster Aquaculture in Potter Pond, RI

Our results are consistent with previous research that indicates course textured substrates support increased bivalve growth relative to fine textured substrates due to greater current velocity and seston flux
Take Away Message

Physical
disturbance
Biomass Harvest
Effects of oyster aquaculture on the benthic environment
Carbon
Benthic Infauna

Winnapaug
Ninigret
Potter
Aquaculture sites were in continuous use from 5 to 21 years

Each site had a control not used for aquaculture
Soil properties
Benthic Infauna
Est.
2010
Soil Properties
Benthic Infauna
• Particle size• Electrical conductivity• Bulk density• Total N and C• Pore-water sulfide
levels
• Species analysis• Functional feeding
group analysis• Functional diversity of
infauna

Physical Properties (Bulk density)

Total C

Total N

Back of the envelope N budgets
• N in the water column
• N stored in the oyster tissue (6 to 10% of dry weight)
• Denitrification in the oyster (maybe as much as 3%)
• N in the biodeposits (1 to 2 g of N per day per aquaculture rack)
• N sequestered in the soil
• Denitrification in the soil
• N resuspened into the water column

Depth
- 0 cm -
-10 cm-
-20 cm-
Control Sites Aquaculture Sites
Soil pore-water sulfides

Organism FFGAquaculture
AbundanceControl
Abundance
Benthic copepods Scrapers 0 1
Gemma gemma Suspension 6 20
Capitellid
polychaetesDeposit 88 28
Spionid polychaetes Interface 95 74
Benthic Infauna Diversity
1.5
1.8
2.1
2.4
2.7
3
Div
ers
ity


Acidification and Commercial Bivalves
Negative responses to acidification
Low pH (< 7.6), Ωar, saturation (< 1)
– Larval development
– Recruitment
– Growth
– Survival
– Shell dissolution
Early Development StagesGreen et al., 2009

Ocean vs. Coastal Acidification
pH in the coastal zone is much more variable when compared to the open ocean
Additional Sources of Acidity
• Nutrient enrichment
• Freshwater inputs
• Sediment biogeochemistry
– Sulfide chemistry
– Organic matter oxidation
Hofmann et al. 2011
Hofmann et al. 2011

SR Buoy
GB Buoy
Bottom water conditionsJune – Sept2008 – 2010

Soil pH Depth Profiles
Still & Stolt, 2015

In-situ Oyster Shell Dissolution
• Shells were oven dried at 105oC
• Bags were deployed forfour weeks (August)
• Shells were washed andoven dried at 105oC
• % shell loss was calculated

Shell loss across sites/treatment
Still & Stolt, 2015

Aquaculture Management in Rhode Island
In the coastal salt ponds the area occupied by aquaculture shall not exceed five percent (5%) of the total open water surface area of the coastal pond below MLW. (CRMC Red Book 300.11(E)(6)
CRMC Red Book
The 5% rule

Uses incompatible with shellfish aquaculture
Aquaculture Restriction Zone (ARZ)

43 to 69% restricted use