UNIVERSITY OF NORTH CAROLINA WILMINGTON Greenhouse Gas Inventory
42
UNIVERSITY OF NORTH CAROLINA WILMINGTON Greenhouse Gas Inventory November 2011 Prepared for UNCW by
Transcript of UNIVERSITY OF NORTH CAROLINA WILMINGTON Greenhouse Gas Inventory
UNIVERSITY OF NORTH CAROLINA WILMINGTON
Greenhouse Gas Inventory
November 2011
Prepared for UNCW by
UNIVERSITY OF NORTH CAROLINA WILMINGTON GREENHOUSE GAS INVENTORY 2011
University of North Carolina Wilmington would like to acknowledge the following
individuals for their time and expertise in contributing to this report:
Terry Blake, Facilities Administration
Michelle Dickens, Business Applications and Access Management
Pamela Elliot, Environmental Health & Safety
Rita Gordon, Auxiliary Services and Sustainability Committee
Stan Harts, Environmental Health & Safety and Sustainability Committee
Whitney Lawson, Office of Institutional Research
Starkey McGowan, Purchasing Services
Gail Morrison, Facilities Administration
Bart Neu, Parking and Transportation Services
Diane Reed, Career Center and Sustainability Committee
Ed Samuels, Office of Facilities
Roger Shaw, Geography-Geology and Sustainability Committee
Jay Styron, Marine Operations, Center for Marine Science
Robert Warren, Physical Plant
ACKNOWLEDGEMENTS
UNIVERSITY OF NORTH CAROLINA WILMINGTON GREENHOUSE GAS INVENTORY 2011
Executive Summary .......................................................................................................... 1
1 Introduction and Background ................................................................................ 7
1.1 Climate Change and Greenhouse Gases ..................................................... 7
1.2 UNCW’s Sustainability Initiatives ....................................................................... 9
1.2.1 Performance Contracting ........................................................................... 9
1.2.2 Green Building for New and Renovated Facilities ................................... 9
1.2.3 Expanded Transportation Options ........................................................... 10
1.2.4 Improved Recycling Initiatives .................................................................. 10
1.3 Sustainability Committee ................................................................................ 11
2 Inventory Methodology ......................................................................................... 12
2.1 Protocol ............................................................................................................. 12
2.2 Greenhouse Gases .......................................................................................... 14
2.3 Global Warming Potential and Carbon Dioxide Equivalent ..................... 14
2.4 Scopes and Emission Sources......................................................................... 14
2.5 Data Collection, Calculations and Tools ...................................................... 15
3 Campus Overview.................................................................................................. 17
4 Greenhouse Gas Emissions .................................................................................... 18
4.1 Building Energy ................................................................................................. 20
4.1.1 Natural Gas, Propane, and Residual Oil ................................................. 20
4.1.2 Purchased Electricity .................................................................................. 21
4.2 Transportation ................................................................................................... 23
4.2.1 University Fleet ............................................................................................. 23
4.2.2 Student and Faculty/Staff Commuting ................................................... 24
4.2.3 University Financed Travel ......................................................................... 26
4.3 Other .................................................................................................................. 28
4.3.1 Refrigerants .................................................................................................. 28
4.3.2 Fertilizers ....................................................................................................... 29
4.3.3 Solid Waste .................................................................................................. 30
4.3.4 Wastewater ................................................................................................. 31
TABLE OF CONTENTS
UNIVERSITY OF NORTH CAROLINA WILMINGTON GREENHOUSE GAS INVENTORY 2011
4.3.5 Purchased Goods ....................................................................................... 31
5 Benchmarking ......................................................................................................... 32
6 Next Steps ................................................................................................................ 35
Contact Information ...................................................................................................... 36
Acronyms ......................................................................................................................... 36
UNIVERSITY OF NORTH CAROLINA WILMINGTON GREENHOUSE GAS INVENTORY 2011
Table 1. FY’10 GHG Emissions .......................................................................................... 4
Table 2. Alignment with Key GHG Protocol Requirements ....................................... 13
Table 3. FY’10 GHG Emissions ........................................................................................ 19
Table 4. University Financed Travel Data .................................................................... 27
Table 5. GHG Inventories of Peer Higher Education Institutions ............................... 33
Figure 1. Fiscal Year 2010 GHG Emissions by Sector .................................................... 3
Figure 2. Fiscal Year 2007 to Fiscal Year 2010 GHG Emissions ..................................... 3
Figure 3. Gross Scope 1 and 2 Emissions per FTE Student............................................ 5
Figure 4. Concentrations of Greenhouse Gases (IPCC) ............................................. 7
Figure 5. GHG Inventory Protocol and Tools ............................................................... 12
Figure 6. Emission Scopes .............................................................................................. 15
Figure 7. Relationship of IMS and CA-CP .................................................................... 16
Figure 8. Aerial Photo of Main Campus ....................................................................... 17
Figure 9. Fiscal Year 2010 GHG Emissions by Sector .................................................. 18
Figure 10. Fiscal Year 2007 to Fiscal Year 2010 GHG Emissions ................................. 19
Figure 11. Stationary Fuels Emissions Trend .................................................................. 20
Figure 12. Electricity Emissions Trend ............................................................................ 21
Figure 13. Vehicle Fleet Emissions Trend ...................................................................... 24
Figure 14. Gross Scope 1 and 2 Emissions per FTE Student ....................................... 33
Figure 15. Gross Scope 1 and Scope 2 Emissions per Square Foot .......................... 34
LIST OF TABLES AND FIGURES

1 UNIVERSITY OF NORTH CAROLINA WILMINGTON GREENHOUSE GAS INVENTORY 2011
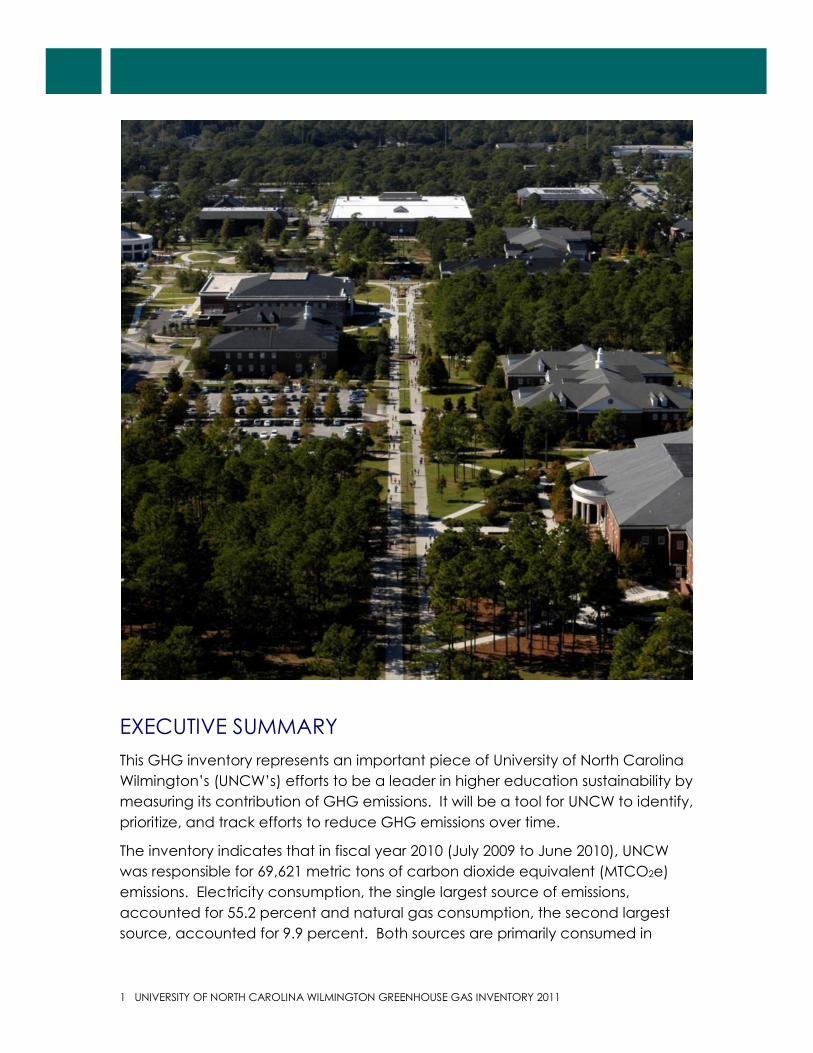
EXECUTIVE SUMMARY
This GHG inventory represents an important piece of University of North Carolina
Wilmington’s (UNCW’s) efforts to be a leader in higher education sustainability by
measuring its contribution of GHG emissions. It will be a tool for UNCW to identify,
prioritize, and track efforts to reduce GHG emissions over time.
The inventory indicates that in fiscal year 2010 (July 2009 to June 2010), UNCW
was responsible for 69,621 metric tons of carbon dioxide equivalent (MTCO2e)
emissions. Electricity consumption, the single largest source of emissions,
accounted for 55.2 percent and natural gas consumption, the second largest
source, accounted for 9.9 percent. Both sources are primarily consumed in
UNIVERSITY OF NORTH CAROLINA WILMINGTON GREENHOUSE GAS INVENTORY 2011 2
buildings and together account for over 60 percent of all emissions at the
university. Understanding the sources and scale of the university’s emissions is the
foundation upon which informed strategies can be developed to reduce
emissions.
Boundaries
The inventory includes all activities and facilities under the operational control of
UNCW, including the main campus, the Center for Marine Science, and a
number of leased and owned facilities at dispersed locations, including the
Harbor Island Research Facility, Aquarius Reef Base in Key Largo, and the Airlie
Commons.
Scope
Three emission scopes are addressed in the inventory. Scope 1 emission sources
− those that occur directly on UNCW campuses − include natural gas, fleet
vehicles, refrigerants, and fertilizer application. The Scope 2 emission source −
indirect emissions from electricity generation − is purchased electricity. Scope 3
emission sources − indirect emissions occurring off campus that are the result of
activities or demand generated by UNCW − include faculty/staff and student
commuting, directly financed air travel and other travel, paper purchases, and
solid and wastewater disposal.
Timeframe
The inventory includes fiscal year 2006 through fiscal year 2010. Data were
consistently available across all emission sources for fiscal years 2007 through
2010.
Methodology
Though UNCW has not signed the American College & University President’s
Climate Commitment (ACUPCC) to date, the inventory was prepared according
to the guidance of ACUPCC to prepare for that possibility. The Clean Air-Cool
Planet Campus Carbon Calculator™ (CA-CP) Version 6.6 was used to generate
the inventory. This tool generally follows the Greenhouse Gas Reporting Protocol
and is designed for college and university campuses. It provides a consistent
inventory approach for the more than 600 signatories of ACUPCC.
Results
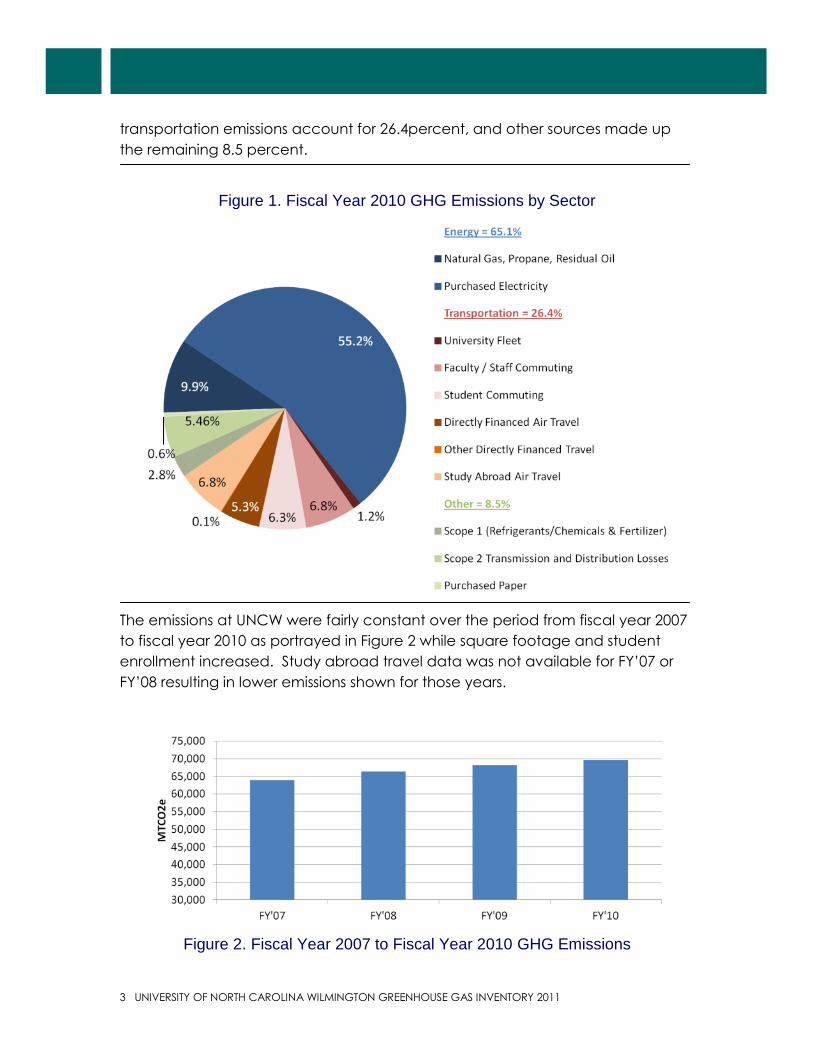
UNCW’s GHG emissions in fiscal year 2010 were estimated to be 69,621 MTCO2e.
These emissions result from a number of sources as portrayed in Figure 1.
Emissions from energy use in buildings accounts for 65.1 percent of the inventory,
3 UNIVERSITY OF NORTH CAROLINA WILMINGTON GREENHOUSE GAS INVENTORY 2011
transportation emissions account for 26.4percent, and other sources made up
the remaining 8.5 percent.
Figure 1. Fiscal Year 2010 GHG Emissions by Sector
The emissions at UNCW were fairly constant over the period from fiscal year 2007
to fiscal year 2010 as portrayed in Figure 2 while square footage and student
enrollment increased. Study abroad travel data was not available for FY’07 or
FY’08 resulting in lower emissions shown for those years.
Figure 2. Fiscal Year 2007 to Fiscal Year 2010 GHG Emissions
UNIVERSITY OF NORTH CAROLINA WILMINGTON GREENHOUSE GAS INVENTORY 2011 4
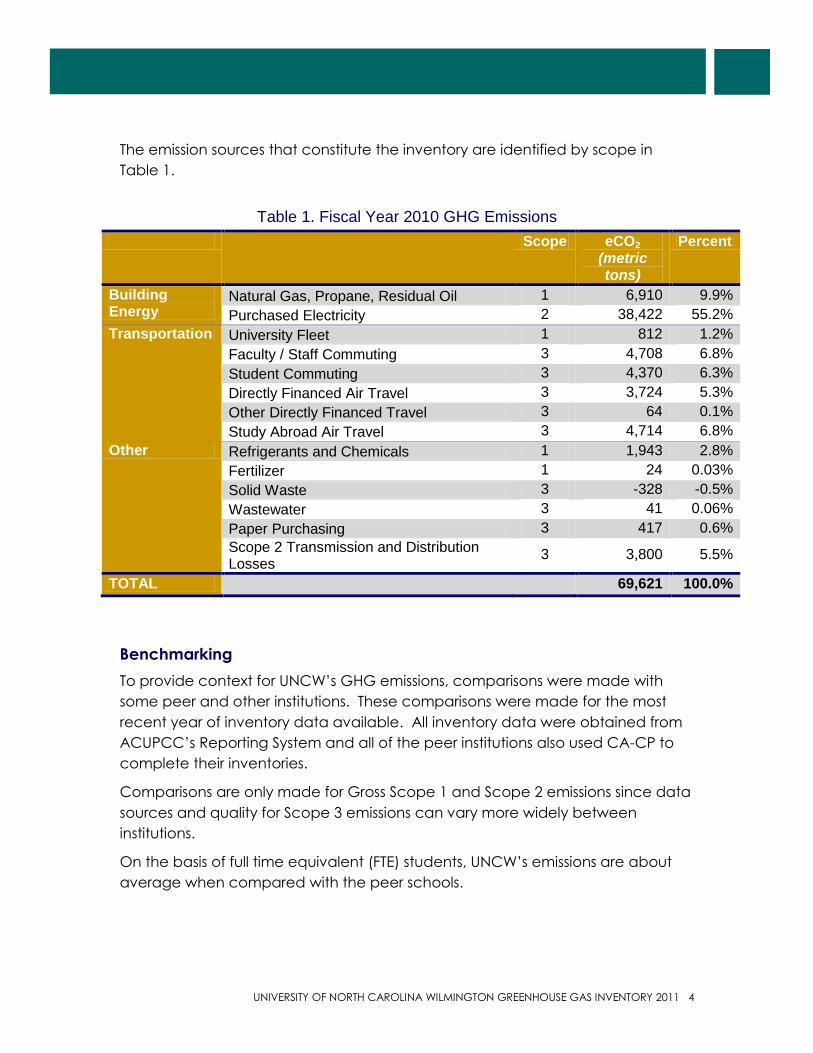
The emission sources that constitute the inventory are identified by scope in
Table 1.
Table 1. Fiscal Year 2010 GHG Emissions
Scope eCO2 (metric tons)
Percent
Building Energy
Natural Gas, Propane, Residual Oil 1 6,910 9.9%
Purchased Electricity 2 38,422 55.2%
Transportation University Fleet 1 812 1.2%
Faculty / Staff Commuting 3 4,708 6.8%
Student Commuting 3 4,370 6.3%
Directly Financed Air Travel 3 3,724 5.3%
Other Directly Financed Travel 3 64 0.1%
Study Abroad Air Travel 3 4,714 6.8%
Other Refrigerants and Chemicals 1 1,943 2.8%
Fertilizer 1 24 0.03%
Solid Waste 3 -328 -0.5%
Wastewater 3 41 0.06%
Paper Purchasing 3 417 0.6%
Scope 2 Transmission and Distribution Losses
3 3,800 5.5%
TOTAL 69,621 100.0%
Benchmarking
To provide context for UNCW’s GHG emissions, comparisons were made with
some peer and other institutions. These comparisons were made for the most
recent year of inventory data available. All inventory data were obtained from
ACUPCC’s Reporting System and all of the peer institutions also used CA-CP to
complete their inventories.
Comparisons are only made for Gross Scope 1 and Scope 2 emissions since data
sources and quality for Scope 3 emissions can vary more widely between
institutions.
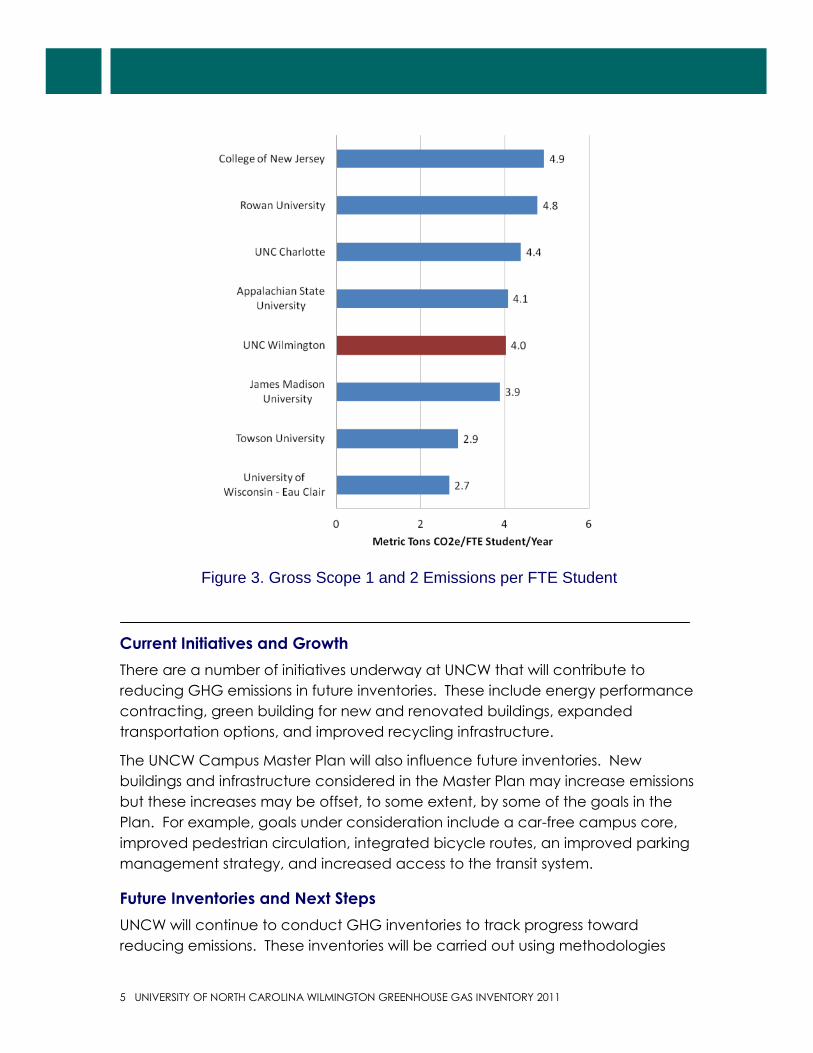
On the basis of full time equivalent (FTE) students, UNCW’s emissions are about
average when compared with the peer schools.
5 UNIVERSITY OF NORTH CAROLINA WILMINGTON GREENHOUSE GAS INVENTORY 2011
Current Initiatives and Growth
There are a number of initiatives underway at UNCW that will contribute to
reducing GHG emissions in future inventories. These include energy performance
contracting, green building for new and renovated buildings, expanded
transportation options, and improved recycling infrastructure.
The UNCW Campus Master Plan will also influence future inventories. New
buildings and infrastructure considered in the Master Plan may increase emissions
but these increases may be offset, to some extent, by some of the goals in the
Plan. For example, goals under consideration include a car-free campus core,
improved pedestrian circulation, integrated bicycle routes, an improved parking
management strategy, and increased access to the transit system.
Future Inventories and Next Steps
UNCW will continue to conduct GHG inventories to track progress toward
reducing emissions. These inventories will be carried out using methodologies
Figure 3. Gross Scope 1 and 2 Emissions per FTE Student
UNIVERSITY OF NORTH CAROLINA WILMINGTON GREENHOUSE GAS INVENTORY 2011 6
and tools that will remain consistent with inventory trends among academic
institutions.
Based on this inventory and other considerations, UNCW will be evaluating next
steps with respect to GHG emissions and sustainability. These next steps may
include signing ACUPCC; participating in the Association for the Advancement
of Sustainability in Higher Education (AASHE) Sustainability Tracking, Assessment &
Rating System™ (STARS); or independently developing plans for energy, GHG
emission, and sustainability management.
7 UNIVERSITY OF NORTH CAROLINA WILMINGTON GREENHOUSE GAS INVENTORY 2011
1 INTRODUCTION AND BACKGROUND
1.1 Climate Change and Greenhouse Gases
Climate change refers to the wide range of impacts resulting from the increase
in accumulated concentrations of greenhouse gases (GHGs) in the atmosphere
as a result of human activity, primarily the combustion of fossil fuels and
deforestation. Globally, these impacts include changes in temperature,
precipitation, sea level, ice melt, frequency and severity of storms, and changes
to species and habitats, which ultimately affect human health and economies.
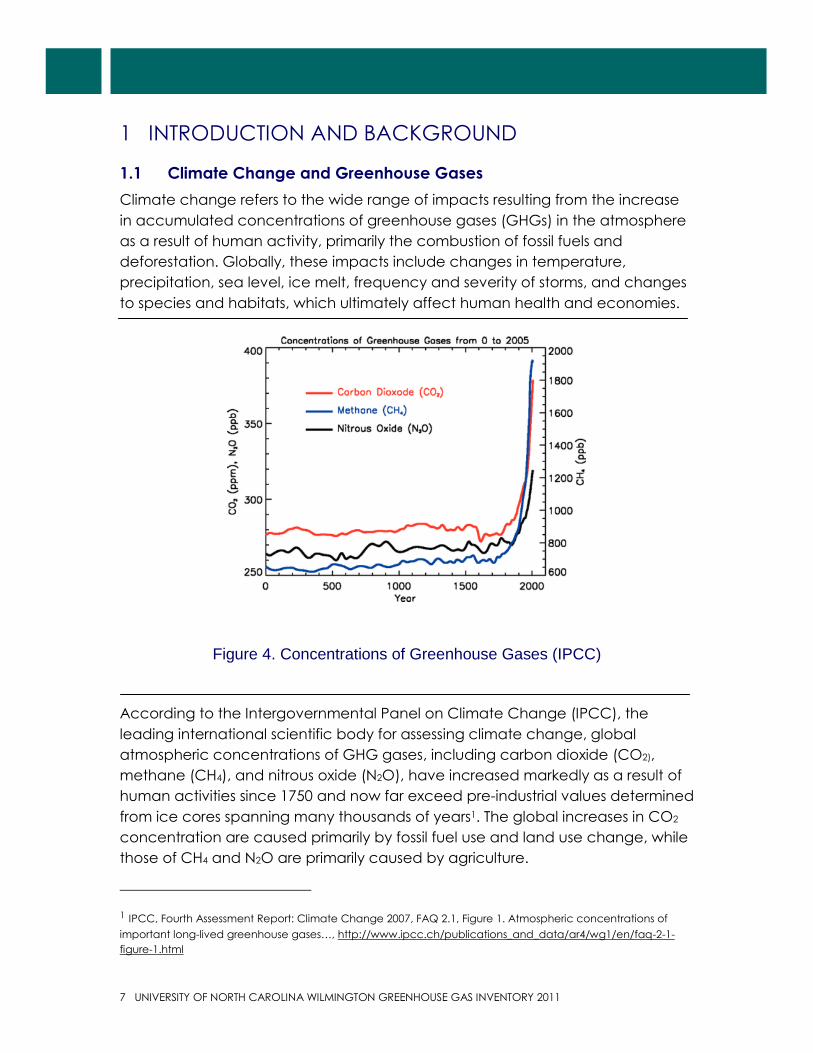
According to the Intergovernmental Panel on Climate Change (IPCC), the
leading international scientific body for assessing climate change, global
atmospheric concentrations of GHG gases, including carbon dioxide (CO2),
methane (CH4), and nitrous oxide (N2O), have increased markedly as a result of
human activities since 1750 and now far exceed pre-industrial values determined
from ice cores spanning many thousands of years1. The global increases in CO2
concentration are caused primarily by fossil fuel use and land use change, while
those of CH4 and N2O are primarily caused by agriculture.
1 IPCC, Fourth Assessment Report: Climate Change 2007, FAQ 2.1, Figure 1. Atmospheric concentrations of
important long-lived greenhouse gases…, http://www.ipcc.ch/publications_and_data/ar4/wg1/en/faq-2-1-
figure-1.html
Figure 4. Concentrations of Greenhouse Gases (IPCC)
UNIVERSITY OF NORTH CAROLINA WILMINGTON GREENHOUSE GAS INVENTORY 2011 8
According to the IPCC’s 2007 Fourth Assessment Report on the state of climate
change, warming of the climate system is unequivocal as is now evident from
observations of increases in global average air and ocean temperatures,
widespread melting of snow and ice, and a rising global average sea level.
Continued GHG emissions at or above current rates will cause further warming
and induce many changes in the global climate system during the 21st century
that will very likely be larger than those observed during the 20th century.
In addition to these global trends, a number of potential climate change
impacts on North Carolina have also been identified by the North Carolina
Climate Action Plan Advisory Group2, which has conducted regional models of
climate change:
Sea level rise could lead to flooding of low-lying areas, erosion of beaches,
loss of coastal wetlands, intrusion of salt water into water supplies, and
increased vulnerability of coastal areas to storms and hurricanes.
As climate changes, this could cause some plants and animals to go extinct,
some to decline or increase in population, and others to migrate to areas
with more favorable conditions. For example, along the coast, fish that need
colder temperatures to survive could migrate north, while more tropical
varieties could move up the coast into North Carolina.
Diseases and pests that thrive in warmer climates could spread into North
Carolina, such as the West Nile virus that used to be confined to the Mid-East
and only recently has spread to the United States.
Crops and trees that need cooler climates may not grow as well in North
Carolina, while more tropical varieties might do better. For example, the
spruce and fir trees growing at high altitudes in North Carolina’s mountains
could die out if temperatures increase.
More severe storms and droughts could affect crop production, pests, and
growth rates of vegetation.
While the Earth’s climate has already changed, helping reduce GHG emissions
now can help mitigate further future changes. In addition to minimizing the
impact of climate change, reducing GHG emissions can have many additional
benefits. These include, but are not limited to, improved air quality, less
susceptibility to volatile energy costs, reduced vulnerability to federal and state
energy regulations, and water security. Protecting the climate also minimizes a
2 North Carolina Climate Action Plan Advisory Group, http://www.ncclimatechange.us

9 UNIVERSITY OF NORTH CAROLINA WILMINGTON GREENHOUSE GAS INVENTORY 2011
range of potential impacts, such as extreme weather events, insect outbreaks,
climate-sensitive diseases, and agricultural impacts, to which response or
adaptation could be very costly.
1.2 UNCW’s Sustainability Initiatives
In response to the risks of global climate change and the opportunities
presented by some actions that mitigate GHG emissions, UNCW has already
undertaken many sustainability initiatives on campus. Some recent initiatives are
described in the following sections.
1.2.1 Performance Contracting
Building upgrades are underway in ten of the
oldest buildings on campus under a performance
contract with an energy service company. These
upgrades include connection to the university’s
central plant, new controls or assurance that
existing controls are functioning through
retrocommissioning, demand control ventilation
that adjusts room conditioning based on
occupancy, daylighting, and lighting retrofits.
These upgrades are scheduled to be completed in July 2011 and will lead to
significant energy and GHG emission reductions.
1.2.2 Green Building for New and Renovated Facilities
The Student Recreation Center is being renovated
and expanded and the new facility is aiming to
achieve the green building certification of
Leadership in Energy and Environmental Design
(LEED) Silver. Energy improvements, including
connection to the central plant, upgraded lighting
and HVAC equipment, and possibly solar thermal
heating for the new lap pool, will reduce the
energy consumption of the new facility and
associated GHG emissions. Three other buildings
that will be LEED certified include the Teaching
Laboratory Building, Seahawk Crossing, and
McNeil Building.
UNIVERSITY OF NORTH CAROLINA WILMINGTON GREENHOUSE GAS INVENTORY 2011 10
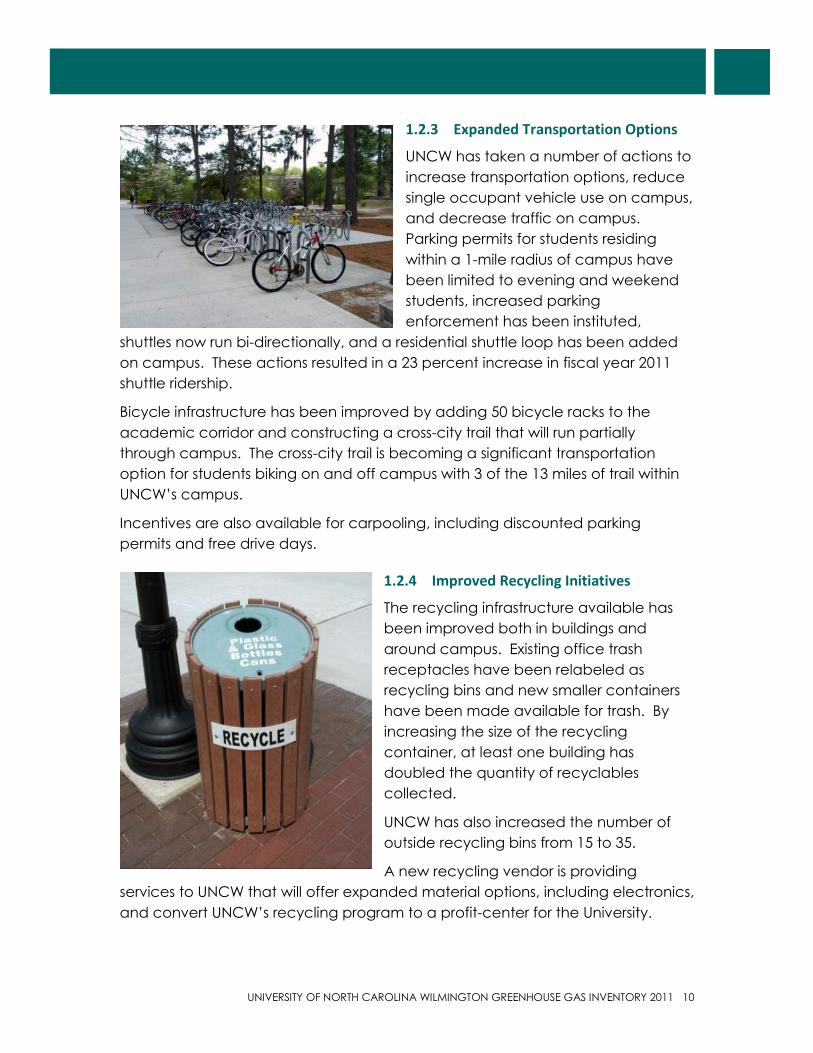
1.2.3 Expanded Transportation Options
UNCW has taken a number of actions to
increase transportation options, reduce
single occupant vehicle use on campus,
and decrease traffic on campus.
Parking permits for students residing
within a 1-mile radius of campus have
been limited to evening and weekend
students, increased parking
enforcement has been instituted,
shuttles now run bi-directionally, and a residential shuttle loop has been added
on campus. These actions resulted in a 23 percent increase in fiscal year 2011
shuttle ridership.
Bicycle infrastructure has been improved by adding 50 bicycle racks to the
academic corridor and constructing a cross-city trail that will run partially
through campus. The cross-city trail is becoming a significant transportation
option for students biking on and off campus with 3 of the 13 miles of trail within
UNCW’s campus.
Incentives are also available for carpooling, including discounted parking
permits and free drive days.
1.2.4 Improved Recycling Initiatives
The recycling infrastructure available has
been improved both in buildings and
around campus. Existing office trash
receptacles have been relabeled as
recycling bins and new smaller containers
have been made available for trash. By
increasing the size of the recycling
container, at least one building has
doubled the quantity of recyclables
collected.
UNCW has also increased the number of
outside recycling bins from 15 to 35.
A new recycling vendor is providing
services to UNCW that will offer expanded material options, including electronics,
and convert UNCW’s recycling program to a profit-center for the University.

11 UNIVERSITY OF NORTH CAROLINA WILMINGTON GREENHOUSE GAS INVENTORY 2011
1.3 Sustainability Committee
The UNCW Sustainability Committee is a cross-departmental group charged with
prioritizing and facilitating sustainable practices in all aspects of UNCW’s
institutional culture, including operations, academic programs, and community
relationships. The Sustainability Committee has been the driver behind a number
of successful initiatives and is also the force behind the completion of this
inventory.
UNIVERSITY OF NORTH CAROLINA WILMINGTON GREENHOUSE GAS INVENTORY 2011 12
2 INVENTORY METHODOLOGY
The following section provides UNCW’s methodology for the inventory
completed for fiscal years 2007 to 2010.
2.1 Protocol
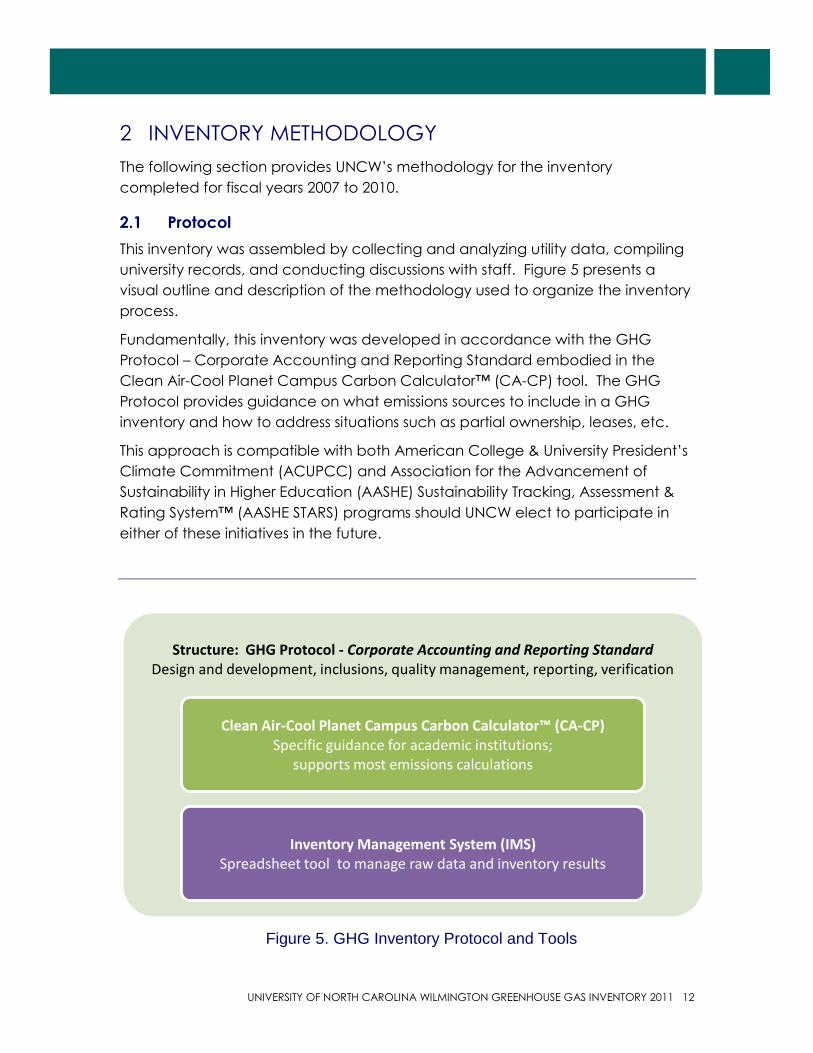
This inventory was assembled by collecting and analyzing utility data, compiling
university records, and conducting discussions with staff. Figure 5 presents a
visual outline and description of the methodology used to organize the inventory
process.
Fundamentally, this inventory was developed in accordance with the GHG
Protocol – Corporate Accounting and Reporting Standard embodied in the
Clean Air-Cool Planet Campus Carbon Calculator™ (CA-CP) tool. The GHG
Protocol provides guidance on what emissions sources to include in a GHG
inventory and how to address situations such as partial ownership, leases, etc.
This approach is compatible with both American College & University President’s
Climate Commitment (ACUPCC) and Association for the Advancement of
Sustainability in Higher Education (AASHE) Sustainability Tracking, Assessment &
Rating System™ (AASHE STARS) programs should UNCW elect to participate in
either of these initiatives in the future.
Figure 5. GHG Inventory Protocol and Tools
Structure: GHG Protocol - Corporate Accounting and Reporting Standard Design and development, inclusions, quality management, reporting, verification
Clean Air-Cool Planet Campus Carbon Calculator™ (CA-CP) Specific guidance for academic institutions;
supports most emissions calculations
Inventory Management System (IMS) Spreadsheet tool to manage raw data and inventory results
13 UNIVERSITY OF NORTH CAROLINA WILMINGTON GREENHOUSE GAS INVENTORY 2011
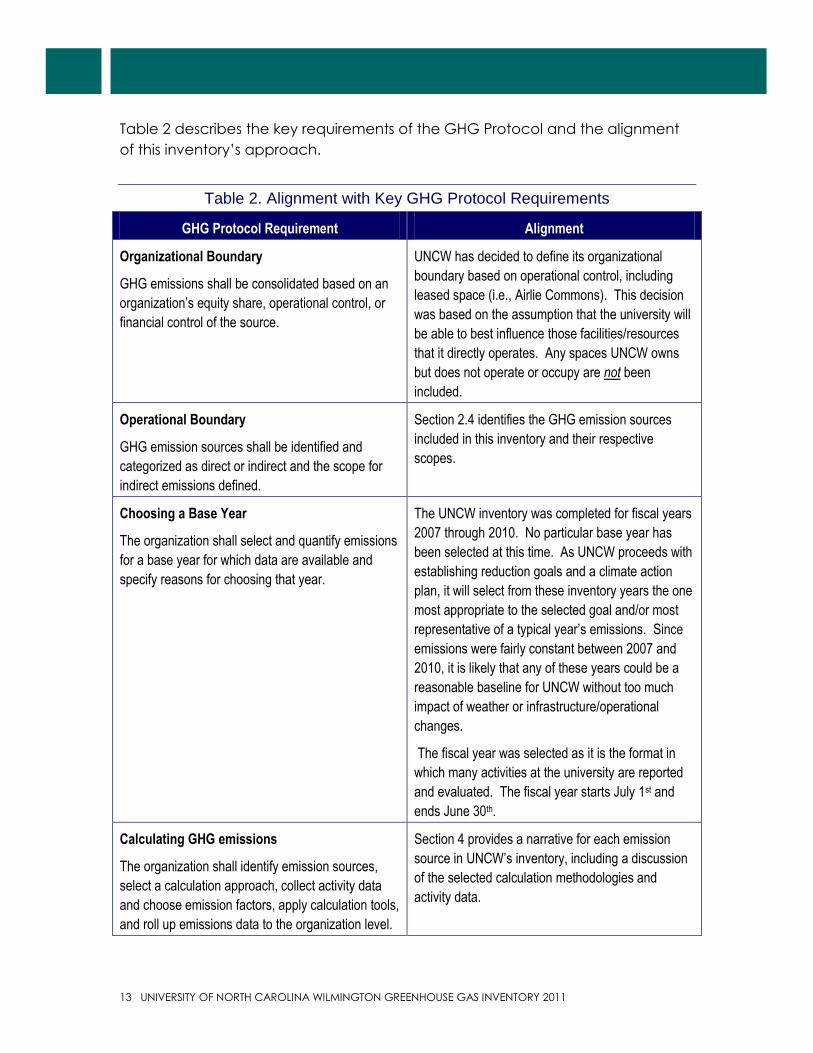
Table 2 describes the key requirements of the GHG Protocol and the alignment
of this inventory’s approach.
Table 2. Alignment with Key GHG Protocol Requirements
GHG Protocol Requirement Alignment
Organizational Boundary
GHG emissions shall be consolidated based on an
organization’s equity share, operational control, or
financial control of the source.
UNCW has decided to define its organizational
boundary based on operational control, including
leased space (i.e., Airlie Commons). This decision
was based on the assumption that the university will
be able to best influence those facilities/resources
that it directly operates. Any spaces UNCW owns
but does not operate or occupy are not been
included.
Operational Boundary
GHG emission sources shall be identified and
categorized as direct or indirect and the scope for
indirect emissions defined.
Section 2.4 identifies the GHG emission sources
included in this inventory and their respective
scopes.
Choosing a Base Year
The organization shall select and quantify emissions
for a base year for which data are available and
specify reasons for choosing that year.
The UNCW inventory was completed for fiscal years
2007 through 2010. No particular base year has
been selected at this time. As UNCW proceeds with
establishing reduction goals and a climate action
plan, it will select from these inventory years the one
most appropriate to the selected goal and/or most
representative of a typical year’s emissions. Since
emissions were fairly constant between 2007 and
2010, it is likely that any of these years could be a
reasonable baseline for UNCW without too much
impact of weather or infrastructure/operational
changes.
The fiscal year was selected as it is the format in
which many activities at the university are reported
and evaluated. The fiscal year starts July 1st and
ends June 30th.
Calculating GHG emissions
The organization shall identify emission sources,
select a calculation approach, collect activity data
and choose emission factors, apply calculation tools,
and roll up emissions data to the organization level.
Section 4 provides a narrative for each emission
source in UNCW’s inventory, including a discussion
of the selected calculation methodologies and
activity data.
UNIVERSITY OF NORTH CAROLINA WILMINGTON GREENHOUSE GAS INVENTORY 2011 14
2.2 Greenhouse Gases
The GHG Protocol requires reporting six different GHGs: CO2, CH4, N2O,
perfluorocarbons (PFCs), hydrofluorocarbons (HFCs), and sulfur hexafluoride (SF6).
The majority of UNCW’s climate change impact is a result of emissions of the first
three gases, as documented in the following sections. PFCs and HFCs are
primarily released during normal operation and maintenance of refrigeration, air
conditioning, and fire suppression systems, and though they are a minimal
contributor to the overall inventory, they are documented here to align with
ACUPCC requirements. SF6 is found primarily in large electrical equipment, such
as transformers. Most, if not all, of UNCW’s transformers do not use SF6.
2.3 Global Warming Potential and Carbon Dioxide Equivalent
Each of the GHGs reported in this inventory has a different level of impact on
global warming. For example, the emission of 1 ton of N2O has a global warming
potential (GWP) 310 times larger than that of the emission of 1 ton of CO2.
Similarly, the emission of 1 ton of CH4 has a GWP 21 times that of CO2. To avoid
confusion between emissions of the different types of gases and their respective
GWPs, all emissions are reduced to the common unit of CO2e, or carbon dioxide
equivalent. Thus, the emission of 1 ton of N2O is expressed as the emission of 310
tons of CO2e. All results in this report will be presented in units of metric tons of
CO2e unless otherwise noted and will be labeled as MTCO2e.
2.4 Scopes and Emission Sources
All emissions are categorized into three scopes as defined in the GHG Protocol.
The purpose of scopes is to prevent double counting emissions between
reporting entities. For example, a power plant would report emissions from
generating electricity as Scope 1 and consumers using that electricity would
report their responsibility to those emissions as Scope 2. By segregating these
emissions, they are allocated accurately and not added together.
In general, Scope 1 emissions are direct emissions occurring at the university,
Scope 2 emissions are those resulting from energy that is purchased by the
university but generated elsewhere (i.e., electricity), and Scope 3 emissions are
other indirect emissions that occur outside of the university as a result of the
activities or demand generated by the university. These scopes are outlined
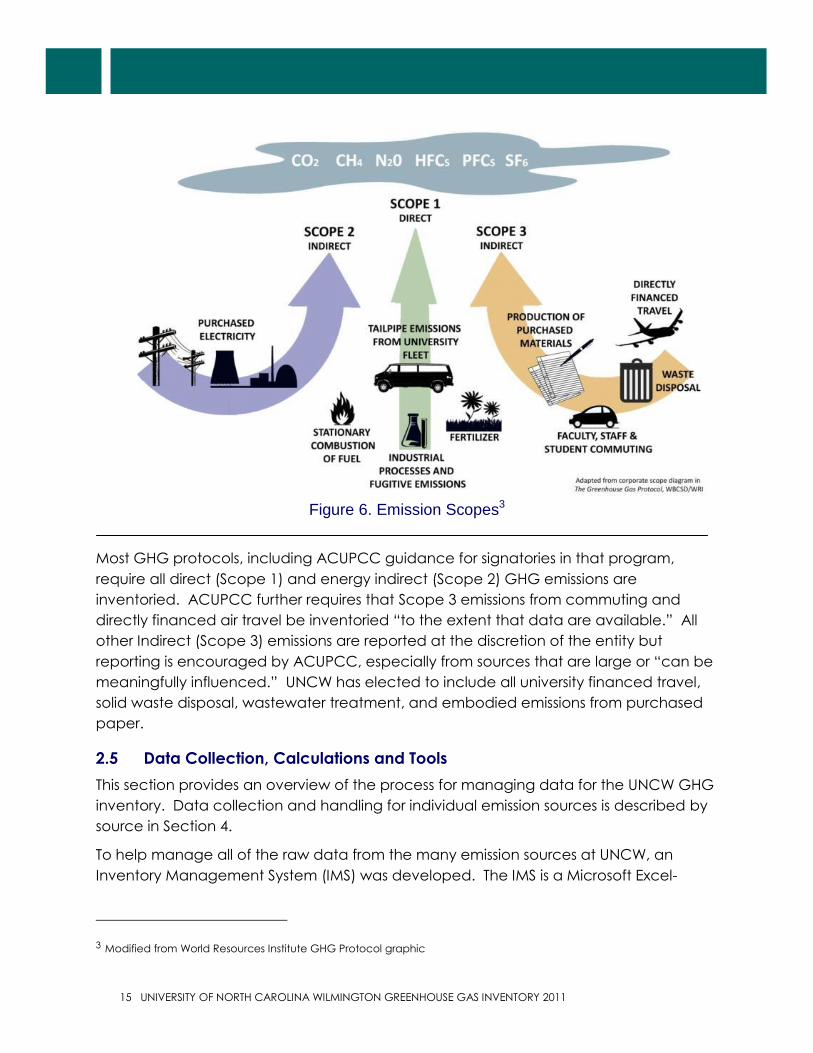
graphically in Figure 6.
15 UNIVERSITY OF NORTH CAROLINA WILMINGTON GREENHOUSE GAS INVENTORY 2011
Figure 6. Emission Scopes3
Most GHG protocols, including ACUPCC guidance for signatories in that program,
require all direct (Scope 1) and energy indirect (Scope 2) GHG emissions are
inventoried. ACUPCC further requires that Scope 3 emissions from commuting and
directly financed air travel be inventoried “to the extent that data are available.” All
other Indirect (Scope 3) emissions are reported at the discretion of the entity but
reporting is encouraged by ACUPCC, especially from sources that are large or “can be
meaningfully influenced.” UNCW has elected to include all university financed travel,
solid waste disposal, wastewater treatment, and embodied emissions from purchased
paper.
2.5 Data Collection, Calculations and Tools
This section provides an overview of the process for managing data for the UNCW GHG
inventory. Data collection and handling for individual emission sources is described by
source in Section 4.
To help manage all of the raw data from the many emission sources at UNCW, an
Inventory Management System (IMS) was developed. The IMS is a Microsoft Excel-
3 Modified from World Resources Institute GHG Protocol graphic
UNIVERSITY OF NORTH CAROLINA WILMINGTON GREENHOUSE GAS INVENTORY 2011 16
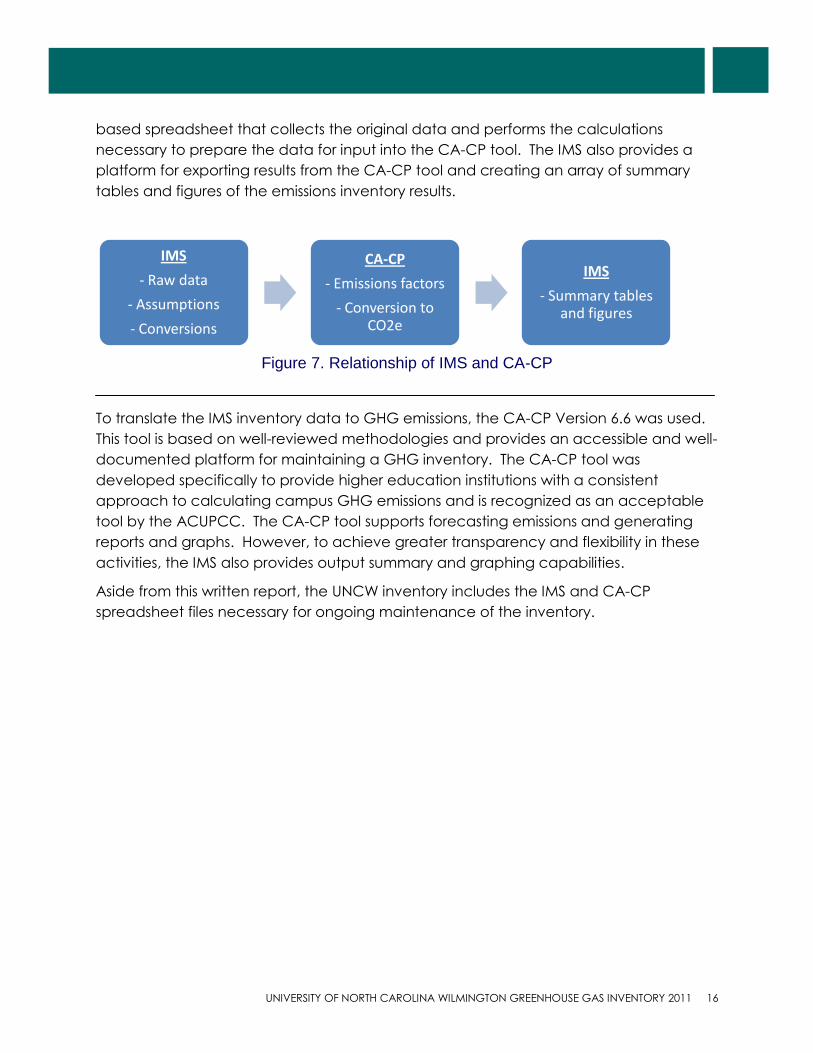
based spreadsheet that collects the original data and performs the calculations
necessary to prepare the data for input into the CA-CP tool. The IMS also provides a
platform for exporting results from the CA-CP tool and creating an array of summary
tables and figures of the emissions inventory results.
Figure 7. Relationship of IMS and CA-CP
To translate the IMS inventory data to GHG emissions, the CA-CP Version 6.6 was used.
This tool is based on well-reviewed methodologies and provides an accessible and well-
documented platform for maintaining a GHG inventory. The CA-CP tool was
developed specifically to provide higher education institutions with a consistent
approach to calculating campus GHG emissions and is recognized as an acceptable
tool by the ACUPCC. The CA-CP tool supports forecasting emissions and generating
reports and graphs. However, to achieve greater transparency and flexibility in these
activities, the IMS also provides output summary and graphing capabilities.
Aside from this written report, the UNCW inventory includes the IMS and CA-CP
spreadsheet files necessary for ongoing maintenance of the inventory.
IMS
- Raw data
- Assumptions
- Conversions
CA-CP
- Emissions factors
- Conversion to CO2e
IMS
- Summary tables and figures
17 UNIVERSITY OF NORTH CAROLINA WILMINGTON GREENHOUSE GAS INVENTORY 2011
3 CAMPUS OVERVIEW
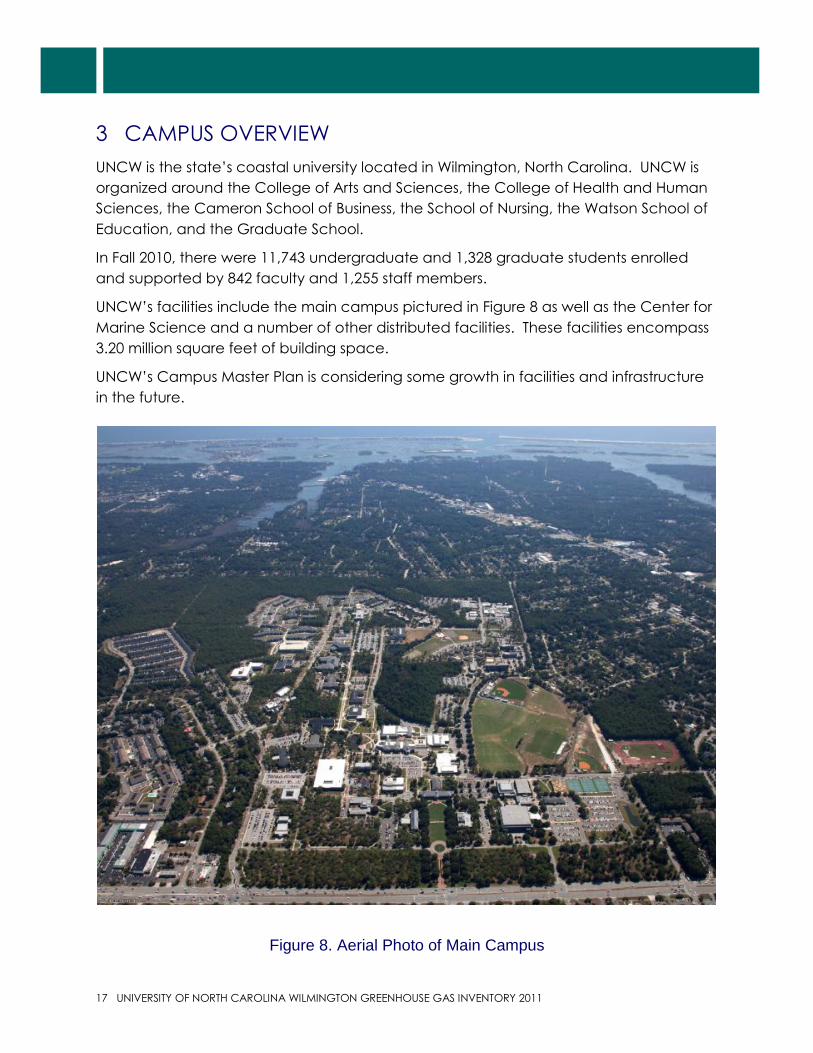
UNCW is the state’s coastal university located in Wilmington, North Carolina. UNCW is
organized around the College of Arts and Sciences, the College of Health and Human
Sciences, the Cameron School of Business, the School of Nursing, the Watson School of
Education, and the Graduate School.
In Fall 2010, there were 11,743 undergraduate and 1,328 graduate students enrolled
and supported by 842 faculty and 1,255 staff members.
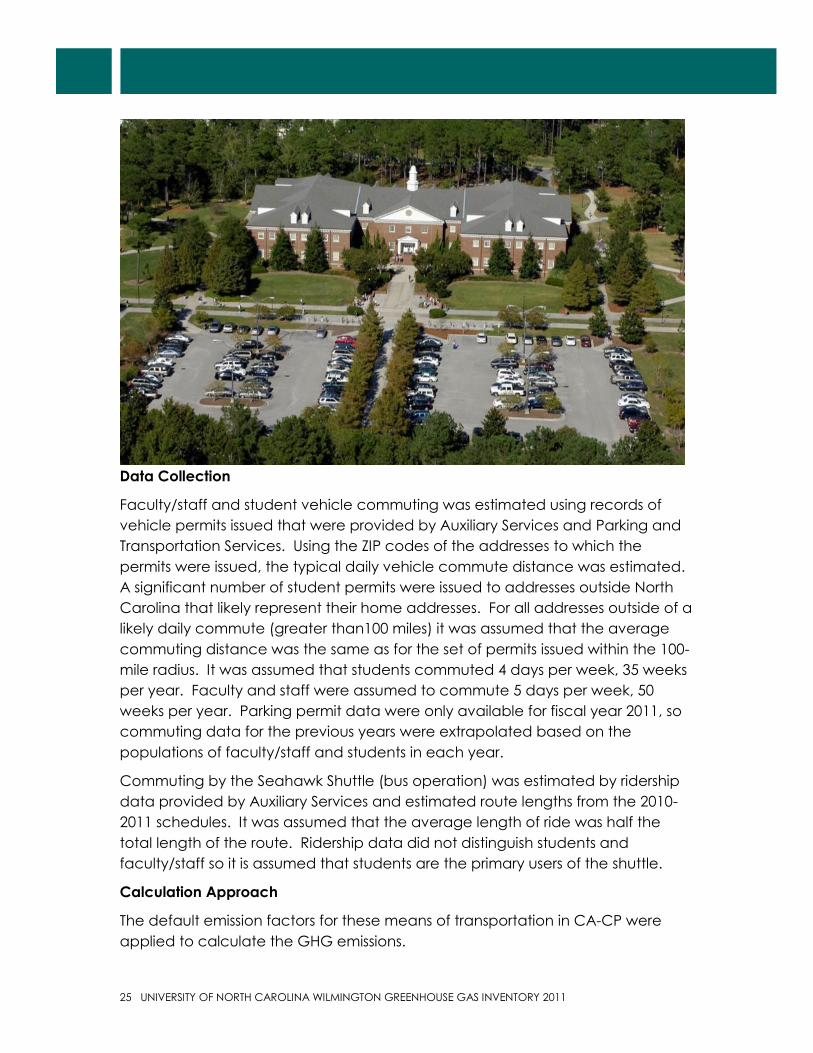
UNCW’s facilities include the main campus pictured in Figure 8 as well as the Center for
Marine Science and a number of other distributed facilities. These facilities encompass
3.20 million square feet of building space.
UNCW’s Campus Master Plan is considering some growth in facilities and infrastructure
in the future.
Figure 8. Aerial Photo of Main Campus
UNIVERSITY OF NORTH CAROLINA WILMINGTON GREENHOUSE GAS INVENTORY 2011 18
4 GREENHOUSE GAS EMISSIONS
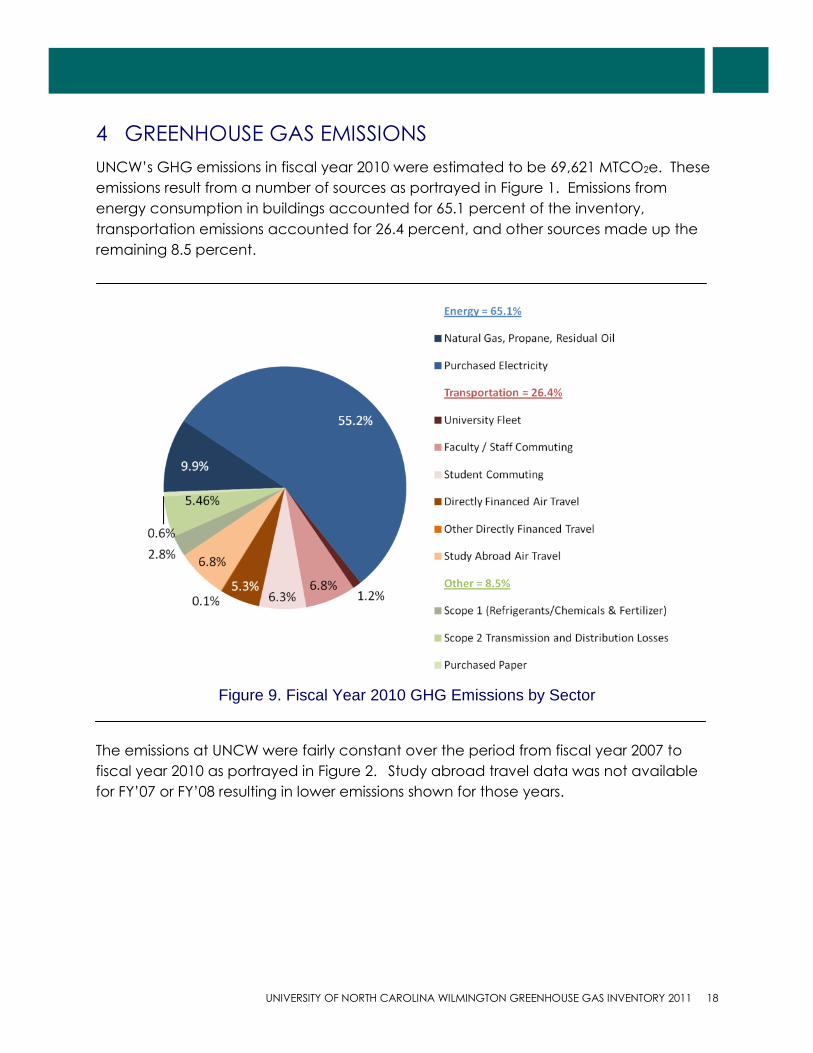
UNCW’s GHG emissions in fiscal year 2010 were estimated to be 69,621 MTCO2e. These
emissions result from a number of sources as portrayed in Figure 1. Emissions from
energy consumption in buildings accounted for 65.1 percent of the inventory,
transportation emissions accounted for 26.4 percent, and other sources made up the
remaining 8.5 percent.
Figure 9. Fiscal Year 2010 GHG Emissions by Sector
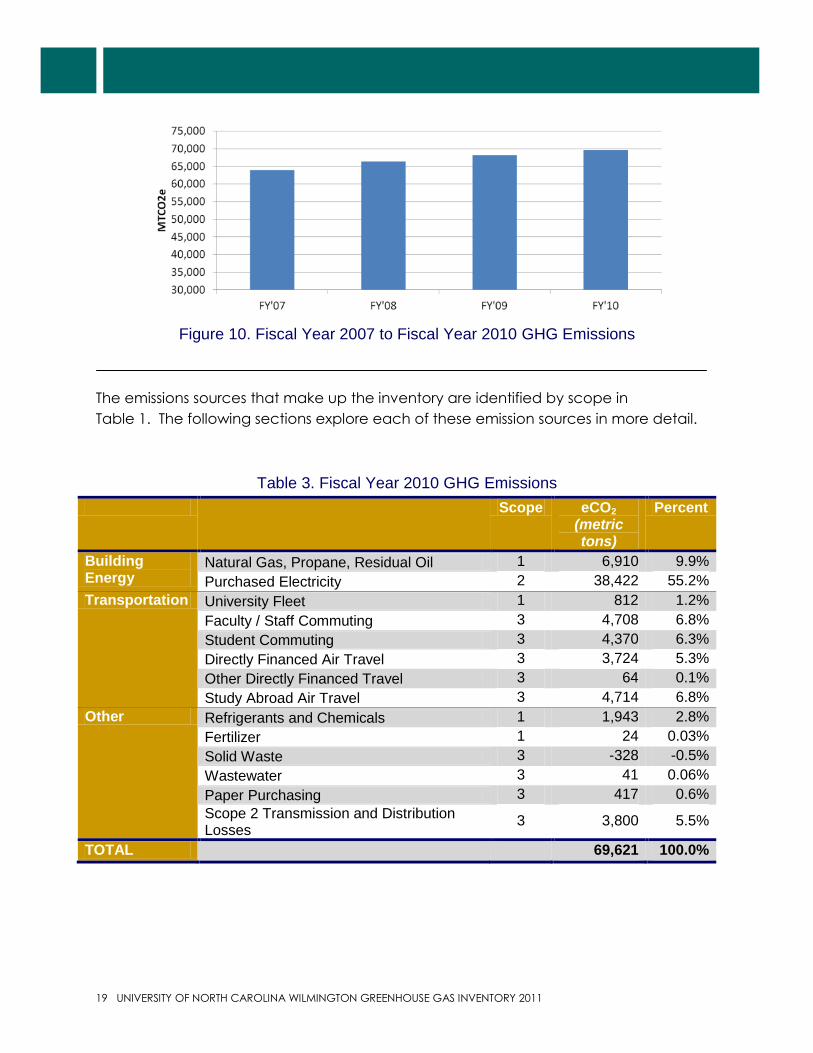
The emissions at UNCW were fairly constant over the period from fiscal year 2007 to
fiscal year 2010 as portrayed in Figure 2. Study abroad travel data was not available
for FY’07 or FY’08 resulting in lower emissions shown for those years.
19 UNIVERSITY OF NORTH CAROLINA WILMINGTON GREENHOUSE GAS INVENTORY 2011
Figure 10. Fiscal Year 2007 to Fiscal Year 2010 GHG Emissions
The emissions sources that make up the inventory are identified by scope in
Table 1. The following sections explore each of these emission sources in more detail.
Table 3. Fiscal Year 2010 GHG Emissions
Scope eCO2 (metric tons)
Percent
Building Energy
Natural Gas, Propane, Residual Oil 1 6,910 9.9%
Purchased Electricity 2 38,422 55.2%
Transportation University Fleet 1 812 1.2%
Faculty / Staff Commuting 3 4,708 6.8%
Student Commuting 3 4,370 6.3%
Directly Financed Air Travel 3 3,724 5.3%
Other Directly Financed Travel 3 64 0.1%
Study Abroad Air Travel 3 4,714 6.8%
Other Refrigerants and Chemicals 1 1,943 2.8%
Fertilizer 1 24 0.03%
Solid Waste 3 -328 -0.5%
Wastewater 3 41 0.06%
Paper Purchasing 3 417 0.6%
Scope 2 Transmission and Distribution Losses
3 3,800 5.5%
TOTAL 69,621 100.0%
UNIVERSITY OF NORTH CAROLINA WILMINGTON GREENHOUSE GAS INVENTORY 2011 20
4.1 Building Energy
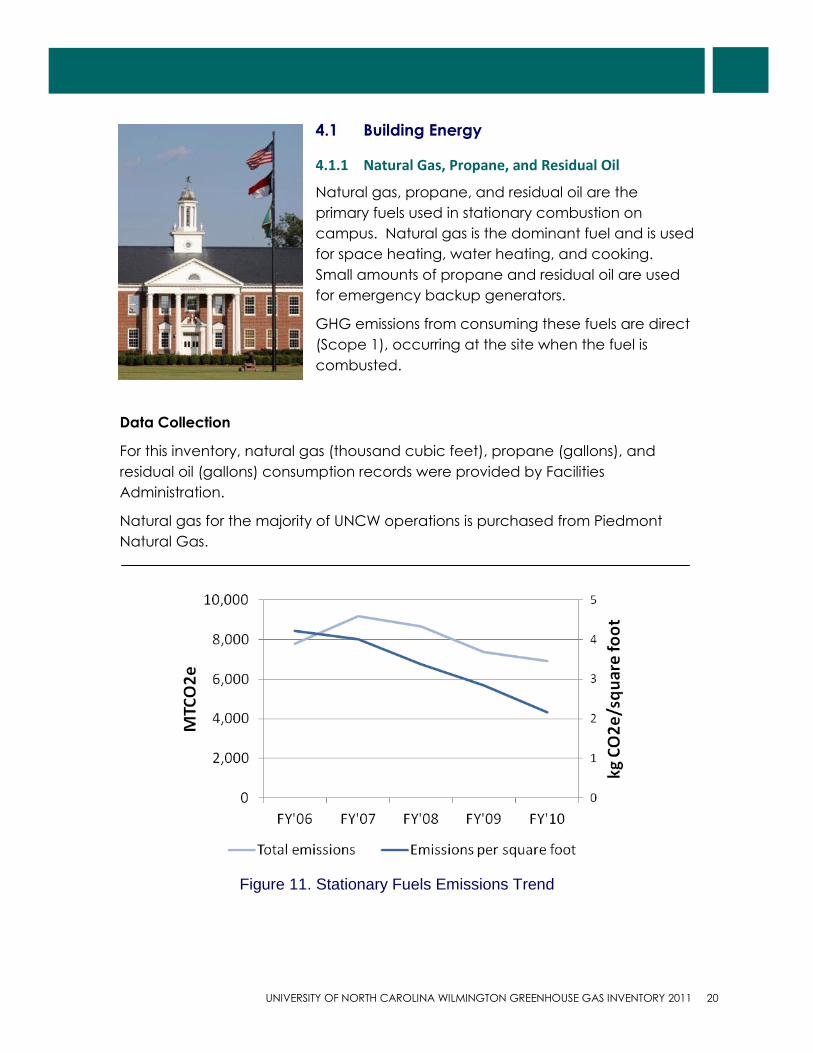
4.1.1 Natural Gas, Propane, and Residual Oil
Natural gas, propane, and residual oil are the
primary fuels used in stationary combustion on
campus. Natural gas is the dominant fuel and is used
for space heating, water heating, and cooking.
Small amounts of propane and residual oil are used
for emergency backup generators.
GHG emissions from consuming these fuels are direct
(Scope 1), occurring at the site when the fuel is
combusted.
Data Collection
For this inventory, natural gas (thousand cubic feet), propane (gallons), and
residual oil (gallons) consumption records were provided by Facilities
Administration.
Natural gas for the majority of UNCW operations is purchased from Piedmont
Natural Gas.
Figure 11. Stationary Fuels Emissions Trend
21 UNIVERSITY OF NORTH CAROLINA WILMINGTON GREENHOUSE GAS INVENTORY 2011
Calculation Approach
The default emissions factors in CA-CP were applied to calculate the GHG
emissions for these sources.
Contribution to Total Emissions
The combustion of these fuels resulted in emissions of an estimated 6,910 MTCO2e
in fiscal year 2010. This was 9.9 percent of the total inventory. There has been a
downward trend in total and per square foot emissions from these sources from
fiscal year 2006 to fiscal year 2010.
Next Steps
As the second largest source of emissions in the inventory, the consumption of
natural gas will be a significant opportunity for reduction through improved
efficiency in buildings.
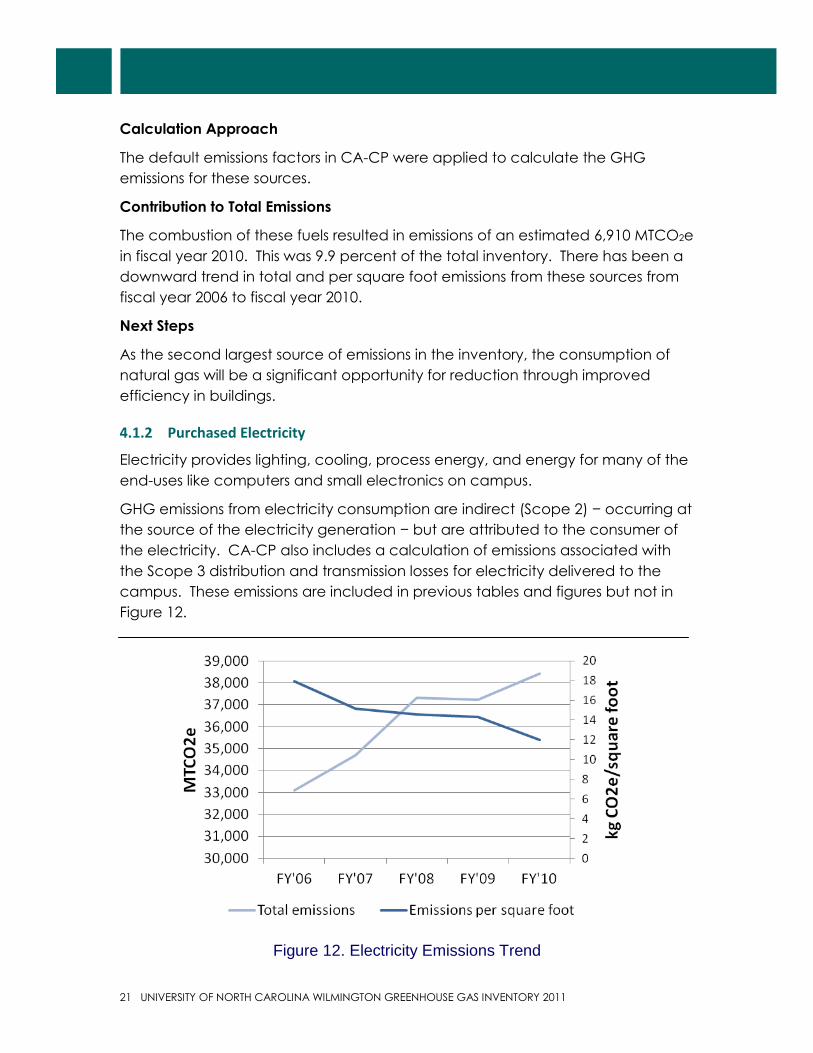
4.1.2 Purchased Electricity
Electricity provides lighting, cooling, process energy, and energy for many of the
end-uses like computers and small electronics on campus.
GHG emissions from electricity consumption are indirect (Scope 2) − occurring at
the source of the electricity generation − but are attributed to the consumer of
the electricity. CA-CP also includes a calculation of emissions associated with
the Scope 3 distribution and transmission losses for electricity delivered to the
campus. These emissions are included in previous tables and figures but not in
Figure 12.
Figure 12. Electricity Emissions Trend
UNIVERSITY OF NORTH CAROLINA WILMINGTON GREENHOUSE GAS INVENTORY 2011 22
Data Collection
For this inventory, electricity (kWh) consumption records were provided by
Facilities Administration.
Electricity is purchased from Progress Energy Carolinas.
Calculation Approach
The default grid emission factor for electricity produced in the Southeast
Reliability Corporation (SERC) Virginia/Carolina (SRVC) region, as available in CA-
CP, was applied to calculate the GHG emissions from electricity. This factor
accounts for the sources of electricity that are under the control of the local grid
region to determine the carbon intensity of that mix of resources.
Contribution to Total Emissions
The consumption of electricity resulted in emissions of an estimated 38,422
MTCO2e in fiscal year 2010. This was 55.2 percent of the total inventory. There
has been an upward trend in total and per square foot emissions from these
sources from fiscal year 2007 to fiscal year 2010.
Next Steps
As the largest source of emissions in the inventory, the consumption of electricity
will be a significant opportunity for reduction through improved efficiency and
conservation in buildings.
23 UNIVERSITY OF NORTH CAROLINA WILMINGTON GREENHOUSE GAS INVENTORY 2011
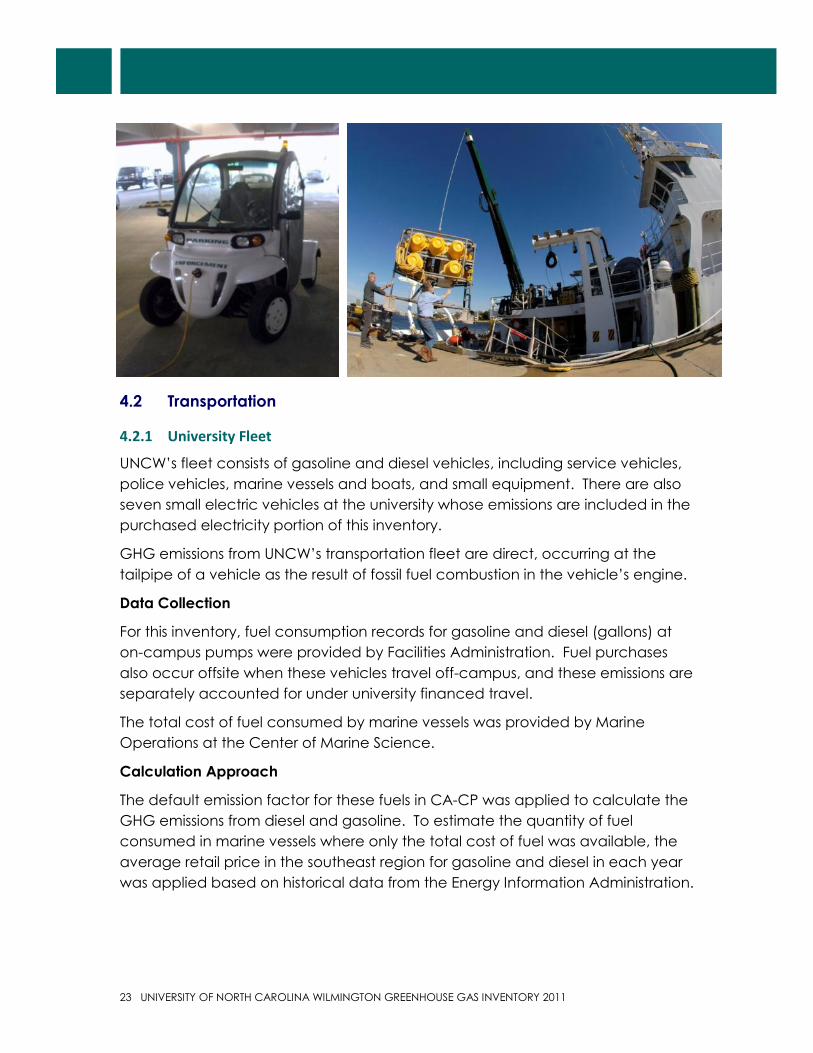
4.2 Transportation
4.2.1 University Fleet
UNCW’s fleet consists of gasoline and diesel vehicles, including service vehicles,
police vehicles, marine vessels and boats, and small equipment. There are also
seven small electric vehicles at the university whose emissions are included in the
purchased electricity portion of this inventory.
GHG emissions from UNCW’s transportation fleet are direct, occurring at the
tailpipe of a vehicle as the result of fossil fuel combustion in the vehicle’s engine.
Data Collection
For this inventory, fuel consumption records for gasoline and diesel (gallons) at
on-campus pumps were provided by Facilities Administration. Fuel purchases
also occur offsite when these vehicles travel off-campus, and these emissions are
separately accounted for under university financed travel.
The total cost of fuel consumed by marine vessels was provided by Marine
Operations at the Center of Marine Science.
Calculation Approach
The default emission factor for these fuels in CA-CP was applied to calculate the
GHG emissions from diesel and gasoline. To estimate the quantity of fuel
consumed in marine vessels where only the total cost of fuel was available, the
average retail price in the southeast region for gasoline and diesel in each year
was applied based on historical data from the Energy Information Administration.
UNIVERSITY OF NORTH CAROLINA WILMINGTON GREENHOUSE GAS INVENTORY 2011 24
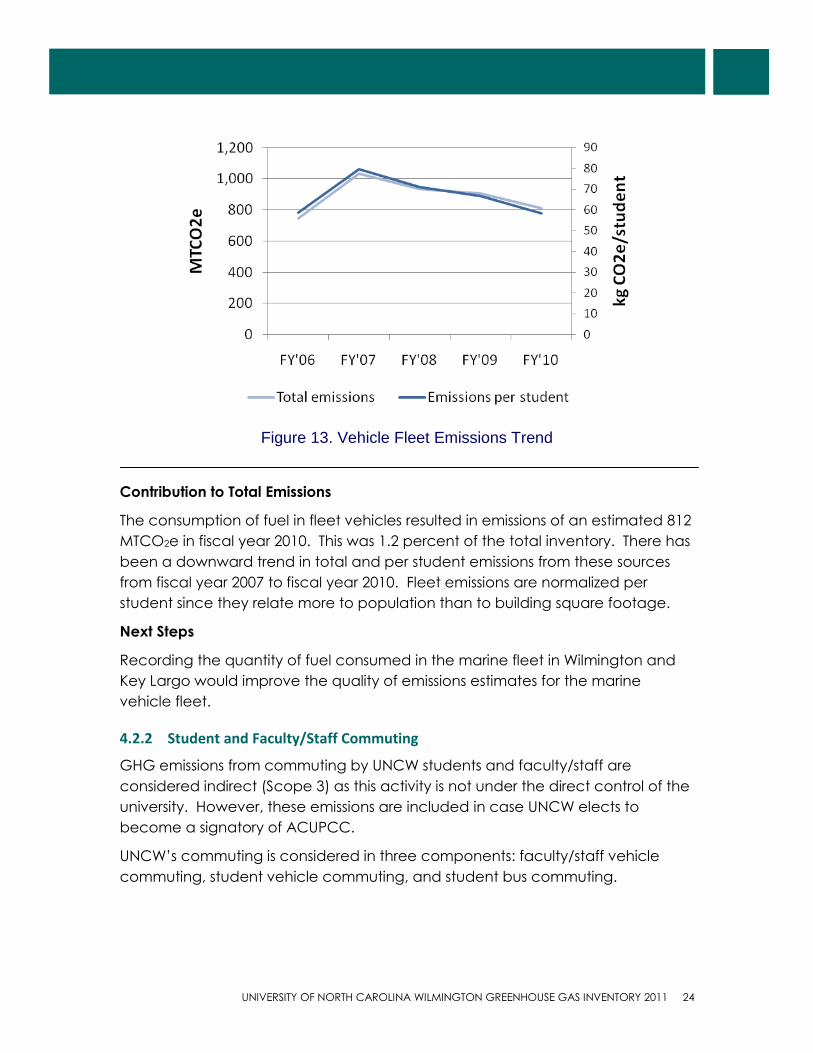
Contribution to Total Emissions
The consumption of fuel in fleet vehicles resulted in emissions of an estimated 812
MTCO2e in fiscal year 2010. This was 1.2 percent of the total inventory. There has
been a downward trend in total and per student emissions from these sources
from fiscal year 2007 to fiscal year 2010. Fleet emissions are normalized per
student since they relate more to population than to building square footage.
Next Steps
Recording the quantity of fuel consumed in the marine fleet in Wilmington and
Key Largo would improve the quality of emissions estimates for the marine
vehicle fleet.
4.2.2 Student and Faculty/Staff Commuting
GHG emissions from commuting by UNCW students and faculty/staff are
considered indirect (Scope 3) as this activity is not under the direct control of the
university. However, these emissions are included in case UNCW elects to
become a signatory of ACUPCC.
UNCW’s commuting is considered in three components: faculty/staff vehicle
commuting, student vehicle commuting, and student bus commuting.
Figure 13. Vehicle Fleet Emissions Trend
25 UNIVERSITY OF NORTH CAROLINA WILMINGTON GREENHOUSE GAS INVENTORY 2011
Data Collection
Faculty/staff and student vehicle commuting was estimated using records of
vehicle permits issued that were provided by Auxiliary Services and Parking and
Transportation Services. Using the ZIP codes of the addresses to which the
permits were issued, the typical daily vehicle commute distance was estimated.
A significant number of student permits were issued to addresses outside North
Carolina that likely represent their home addresses. For all addresses outside of a
likely daily commute (greater than100 miles) it was assumed that the average
commuting distance was the same as for the set of permits issued within the 100-
mile radius. It was assumed that students commuted 4 days per week, 35 weeks
per year. Faculty and staff were assumed to commute 5 days per week, 50
weeks per year. Parking permit data were only available for fiscal year 2011, so
commuting data for the previous years were extrapolated based on the
populations of faculty/staff and students in each year.
Commuting by the Seahawk Shuttle (bus operation) was estimated by ridership
data provided by Auxiliary Services and estimated route lengths from the 2010-
2011 schedules. It was assumed that the average length of ride was half the
total length of the route. Ridership data did not distinguish students and
faculty/staff so it is assumed that students are the primary users of the shuttle.
Calculation Approach
The default emission factors for these means of transportation in CA-CP were
applied to calculate the GHG emissions.
UNIVERSITY OF NORTH CAROLINA WILMINGTON GREENHOUSE GAS INVENTORY 2011 26
Contribution to Total Emissions
Faculty/staff and student commuting resulted in emissions of an estimated 4,708
and 4,370 MTCO2e, respectively, in fiscal year 2010. This was 6.8 and 6.3 percent,
respectively, of the total inventory.
Next Steps
Conducting a full commuter survey would allow UNCW to refine this estimate of
commuting by better identifying vehicle commuters that do not purchase
permits (off-campus parking), carpooling, and frequency of commute during the
week. It would also better define non-motorized commuting methods like biking
and walking.
4.2.3 University Financed Travel
Following the requirements of ACUPCC for ease of comparison with peer
institutions and possible signing of the ACUPCC commitment, the inventory also
includes the emissions from all air and ground travel by faculty/staff and students
that is financed by UNCW. This includes reimbursements for fuel and mileage, air
travel, train, taxi/ferry/rental car, and bus travel.
GHG emissions from UNCW’s directly financed travel are indirect (Scope 3)
emissions, which are typically the direct responsibility of a transportation provider
such as an airline or taxi service.
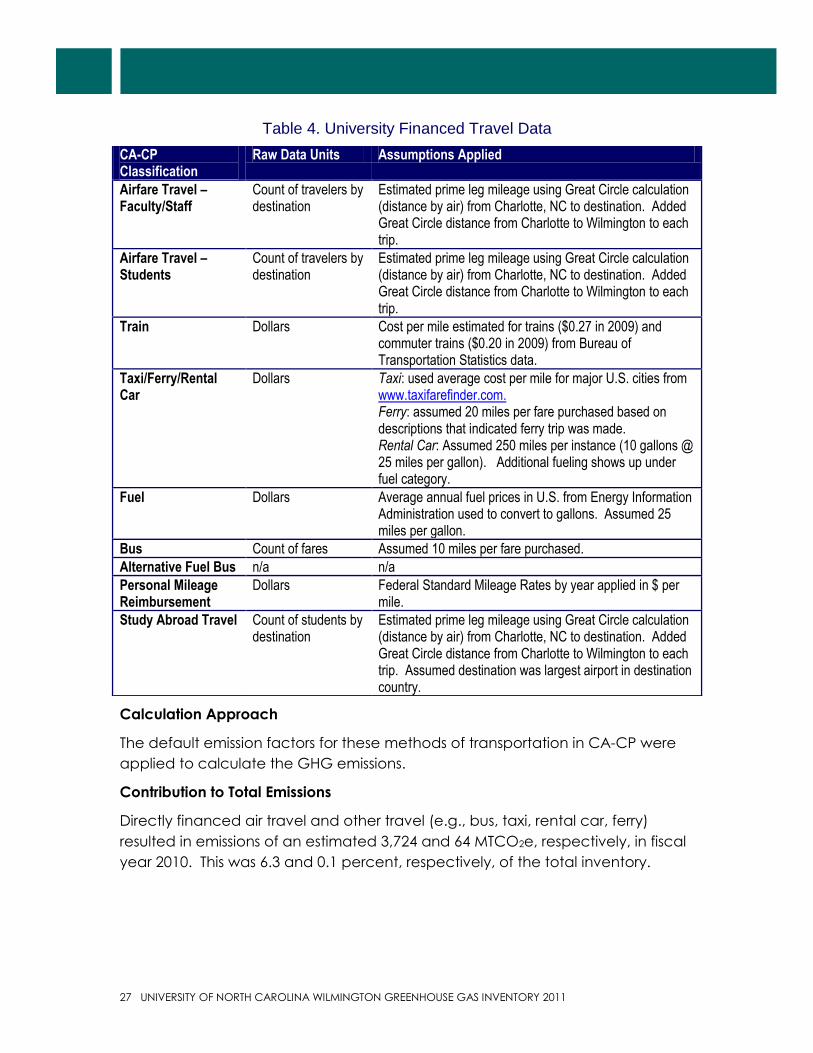
Data Collection
Data used to estimate the GHG emissions from university financed travel were
provided by the Business Affairs Division. The data provided and assumptions
applied to convert them to miles are outlined in Table 4.
27 UNIVERSITY OF NORTH CAROLINA WILMINGTON GREENHOUSE GAS INVENTORY 2011
Table 4. University Financed Travel Data
Calculation Approach
The default emission factors for these methods of transportation in CA-CP were
applied to calculate the GHG emissions.
Contribution to Total Emissions
Directly financed air travel and other travel (e.g., bus, taxi, rental car, ferry)
resulted in emissions of an estimated 3,724 and 64 MTCO2e, respectively, in fiscal
year 2010. This was 6.3 and 0.1 percent, respectively, of the total inventory.
CA-CP Classification
Raw Data Units Assumptions Applied
Airfare Travel – Faculty/Staff
Count of travelers by destination
Estimated prime leg mileage using Great Circle calculation (distance by air) from Charlotte, NC to destination. Added Great Circle distance from Charlotte to Wilmington to each trip.
Airfare Travel – Students
Count of travelers by destination
Estimated prime leg mileage using Great Circle calculation (distance by air) from Charlotte, NC to destination. Added Great Circle distance from Charlotte to Wilmington to each trip.
Train Dollars Cost per mile estimated for trains ($0.27 in 2009) and commuter trains ($0.20 in 2009) from Bureau of Transportation Statistics data.
Taxi/Ferry/Rental Car
Dollars Taxi: used average cost per mile for major U.S. cities from www.taxifarefinder.com. Ferry: assumed 20 miles per fare purchased based on descriptions that indicated ferry trip was made. Rental Car: Assumed 250 miles per instance (10 gallons @ 25 miles per gallon). Additional fueling shows up under fuel category.
Fuel Dollars Average annual fuel prices in U.S. from Energy Information Administration used to convert to gallons. Assumed 25 miles per gallon.
Bus Count of fares Assumed 10 miles per fare purchased.
Alternative Fuel Bus n/a n/a
Personal Mileage Reimbursement
Dollars Federal Standard Mileage Rates by year applied in $ per mile.
Study Abroad Travel Count of students by destination
Estimated prime leg mileage using Great Circle calculation (distance by air) from Charlotte, NC to destination. Added Great Circle distance from Charlotte to Wilmington to each trip. Assumed destination was largest airport in destination country.
UNIVERSITY OF NORTH CAROLINA WILMINGTON GREENHOUSE GAS INVENTORY 2011 28
Next Steps
Through the travel authorization system, UNCW has good records of air travel
destinations − better than many institutions that have to estimate airline miles
based on cost alone. There are no recommended next steps for this aspect of
the inventory.
4.3 Other
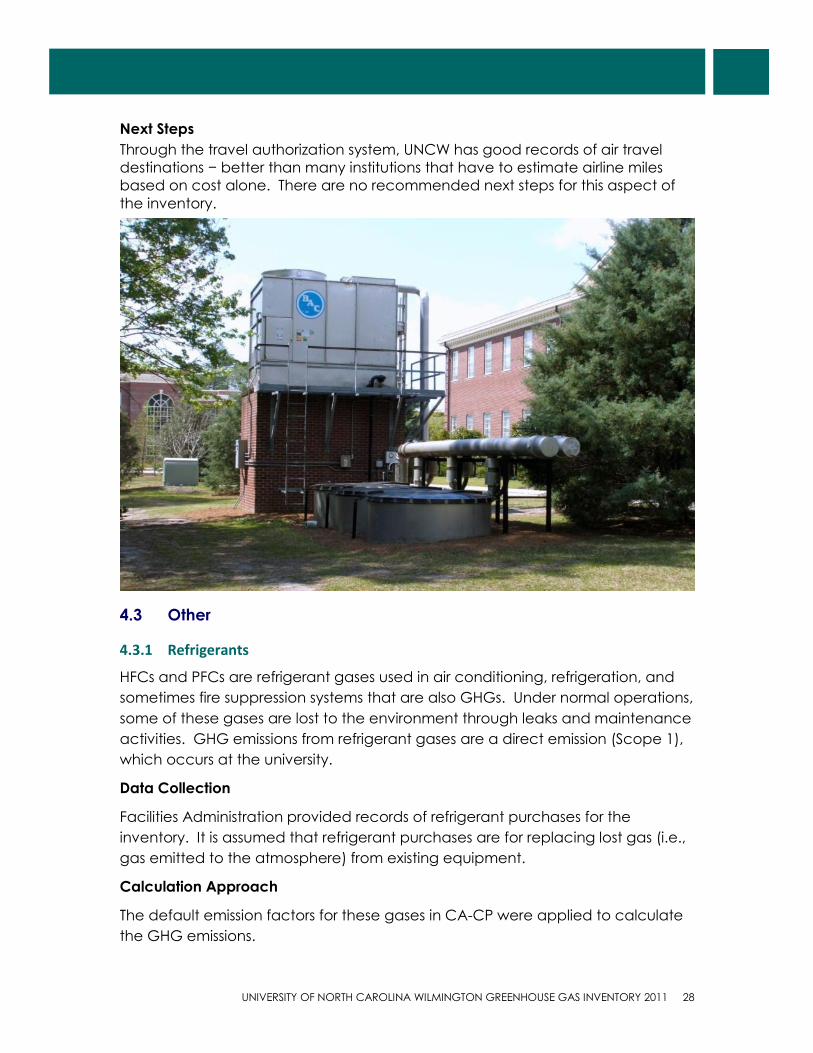
4.3.1 Refrigerants
HFCs and PFCs are refrigerant gases used in air conditioning, refrigeration, and
sometimes fire suppression systems that are also GHGs. Under normal operations,
some of these gases are lost to the environment through leaks and maintenance
activities. GHG emissions from refrigerant gases are a direct emission (Scope 1),
which occurs at the university.
Data Collection
Facilities Administration provided records of refrigerant purchases for the
inventory. It is assumed that refrigerant purchases are for replacing lost gas (i.e.,
gas emitted to the atmosphere) from existing equipment.
Calculation Approach
The default emission factors for these gases in CA-CP were applied to calculate
the GHG emissions.
29 UNIVERSITY OF NORTH CAROLINA WILMINGTON GREENHOUSE GAS INVENTORY 2011
Contribution to Total Emissions
Refrigerant gases resulted in emissions of an estimated 1,943 MTCO2e in fiscal
year 2010. This was 2.8 percent of the total inventory.
4.3.2 Fertilizers
Applying nitrogen as a fertilizer leads to the emission of the GHG N2O by a
couple of mechanisms. A portion of the nitrogen fertilizer converts to N2O on
application before uptake and is then directly emitted. An additional portion
can volatilize and be re-deposited elsewhere before being emitted as N2O.
GHG emissions from fertilizers are a direct emission (Scope 1), which occurs at the
university.
Data Collection
Landscape Services provided records for each of six fertilizer applications that
were conducted during fiscal year 2010 in total pounds and pounds nitrogen per
1,000 square feet, as well as the total application area in acres.
Calculation Approach
The total pounds of nitrogen were calculated from the provided data and
entered into CA-CP as 100 percent nitrogen. The default emission factor for
fertilizer application in CA-CP was applied to calculate the GHG emissions.
Contribution to Total Emissions
Applying fertilizer resulted in emissions of an estimated 24 MTCO2e in fiscal year
2010. This was 0.03 percent of the total inventory.
UNIVERSITY OF NORTH CAROLINA WILMINGTON GREENHOUSE GAS INVENTORY 2011 30
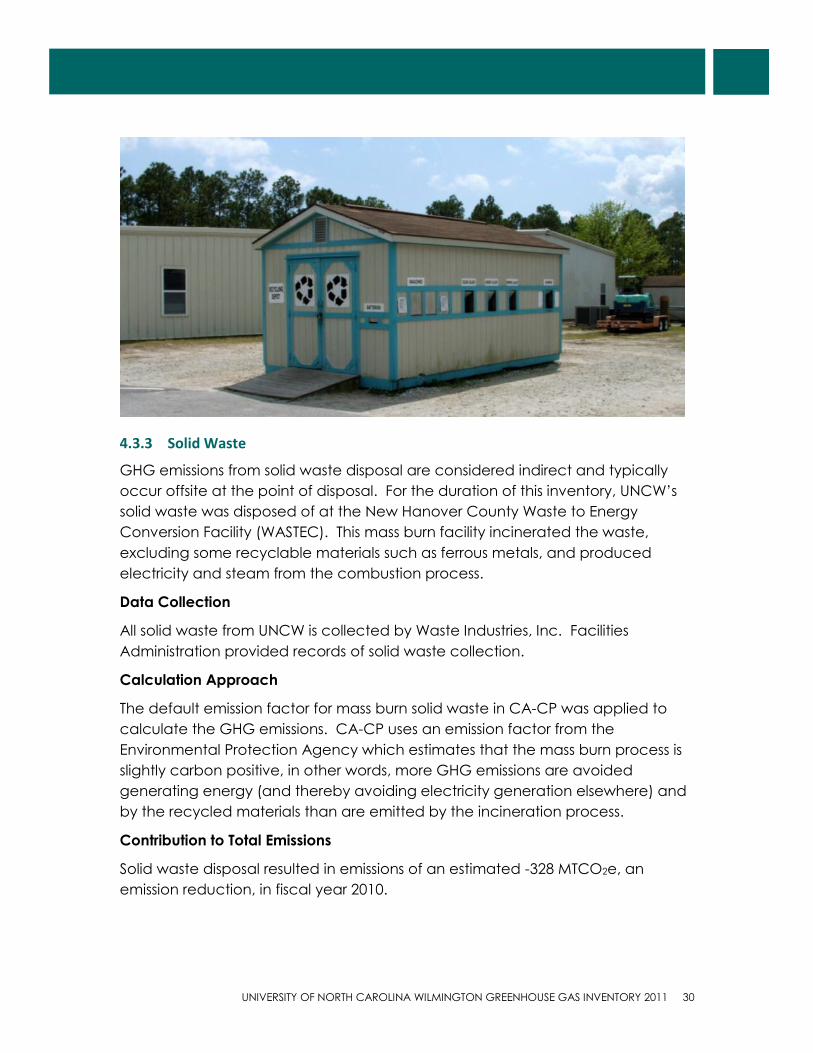
4.3.3 Solid Waste
GHG emissions from solid waste disposal are considered indirect and typically
occur offsite at the point of disposal. For the duration of this inventory, UNCW’s
solid waste was disposed of at the New Hanover County Waste to Energy
Conversion Facility (WASTEC). This mass burn facility incinerated the waste,
excluding some recyclable materials such as ferrous metals, and produced
electricity and steam from the combustion process.
Data Collection
All solid waste from UNCW is collected by Waste Industries, Inc. Facilities
Administration provided records of solid waste collection.
Calculation Approach
The default emission factor for mass burn solid waste in CA-CP was applied to
calculate the GHG emissions. CA-CP uses an emission factor from the
Environmental Protection Agency which estimates that the mass burn process is
slightly carbon positive, in other words, more GHG emissions are avoided
generating energy (and thereby avoiding electricity generation elsewhere) and
by the recycled materials than are emitted by the incineration process.
Contribution to Total Emissions
Solid waste disposal resulted in emissions of an estimated -328 MTCO2e, an
emission reduction, in fiscal year 2010.
31 UNIVERSITY OF NORTH CAROLINA WILMINGTON GREENHOUSE GAS INVENTORY 2011
4.3.4 Wastewater
GHG emissions from wastewater treatment vary depending on the type of
treatment process used. Both Cape Fear Public Utility Authority facilities employ
anaerobic digestion and that type of process was selected for this calculation.
Data Collection
Facilities Administration provided records of wastewater discharge.
Calculation Approach
The default emission factor for wastewater treatment with anaerobic digestion in
CA-CP was applied to calculate the GHG emissions.
Contribution to Total Emissions
Refrigerant gases resulted in emissions of an estimated 41 MTCO2e in fiscal year
2010. This was 0.06 percent of the total inventory.
4.3.5 Purchased Goods
Many inventories are starting to consider the embodied emissions from
extracting, producing, and transporting purchased goods. The CA-CP tool has
recently included paper purchases in its inventory calculator.
GHG emissions from paper purchases are an indirect emission (Scope 3), which
occurs in the supply chain for the paper products.
Data Collection
Purchasing Services provided records of spending for paper products at the
university. These dollar values were converted to quantities of paper based on
typical costs provided by Purchasing Services.
Calculation Approach
The default emission factors for paper purchases in CA-CP were applied to
calculate the GHG emissions.
Contribution to Total Emissions
Paper purchases resulted in emissions of an estimated 417 MTCO2e in fiscal year
2010. This was 0.6 percent of the total inventory.
UNIVERSITY OF NORTH CAROLINA WILMINGTON GREENHOUSE GAS INVENTORY 2011 32
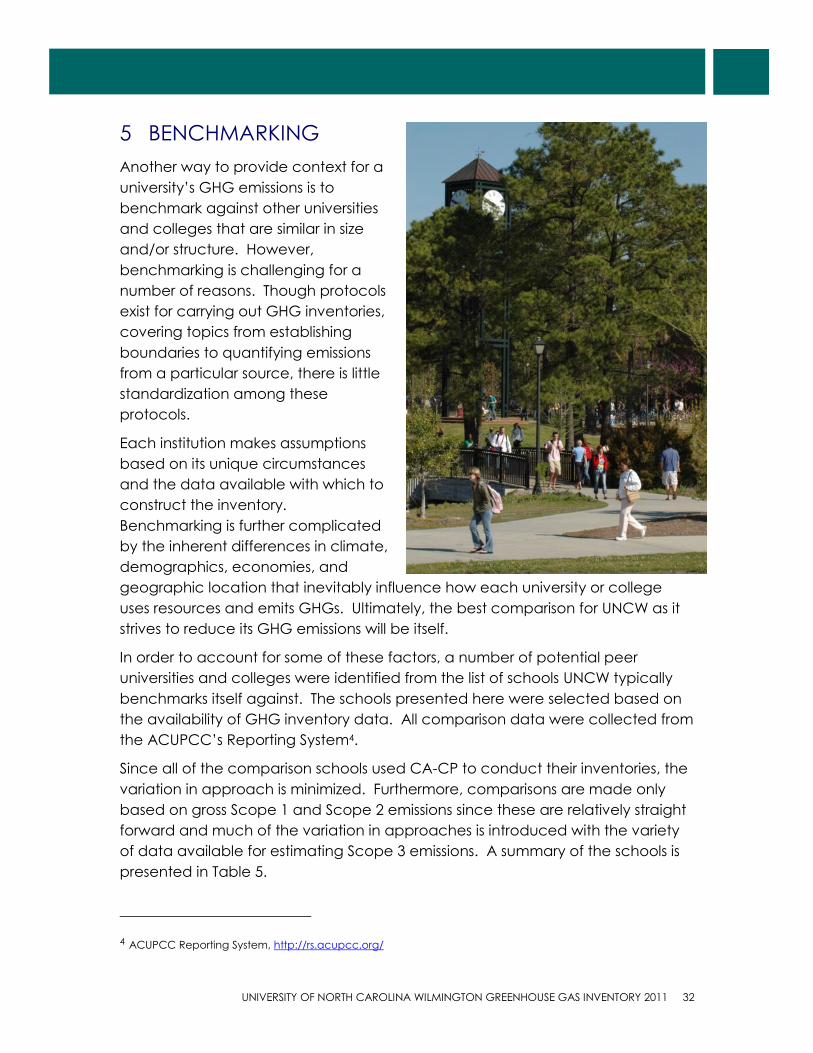
5 BENCHMARKING
Another way to provide context for a
university’s GHG emissions is to
benchmark against other universities
and colleges that are similar in size
and/or structure. However,
benchmarking is challenging for a
number of reasons. Though protocols
exist for carrying out GHG inventories,
covering topics from establishing
boundaries to quantifying emissions
from a particular source, there is little
standardization among these
protocols.
Each institution makes assumptions
based on its unique circumstances
and the data available with which to
construct the inventory.
Benchmarking is further complicated
by the inherent differences in climate,
demographics, economies, and
geographic location that inevitably influence how each university or college
uses resources and emits GHGs. Ultimately, the best comparison for UNCW as it
strives to reduce its GHG emissions will be itself.
In order to account for some of these factors, a number of potential peer
universities and colleges were identified from the list of schools UNCW typically
benchmarks itself against. The schools presented here were selected based on
the availability of GHG inventory data. All comparison data were collected from
the ACUPCC’s Reporting System4.
Since all of the comparison schools used CA-CP to conduct their inventories, the
variation in approach is minimized. Furthermore, comparisons are made only
based on gross Scope 1 and Scope 2 emissions since these are relatively straight
forward and much of the variation in approaches is introduced with the variety
of data available for estimating Scope 3 emissions. A summary of the schools is
presented in Table 5.
4 ACUPCC Reporting System, http://rs.acupcc.org/
33 UNIVERSITY OF NORTH CAROLINA WILMINGTON GREENHOUSE GAS INVENTORY 2011
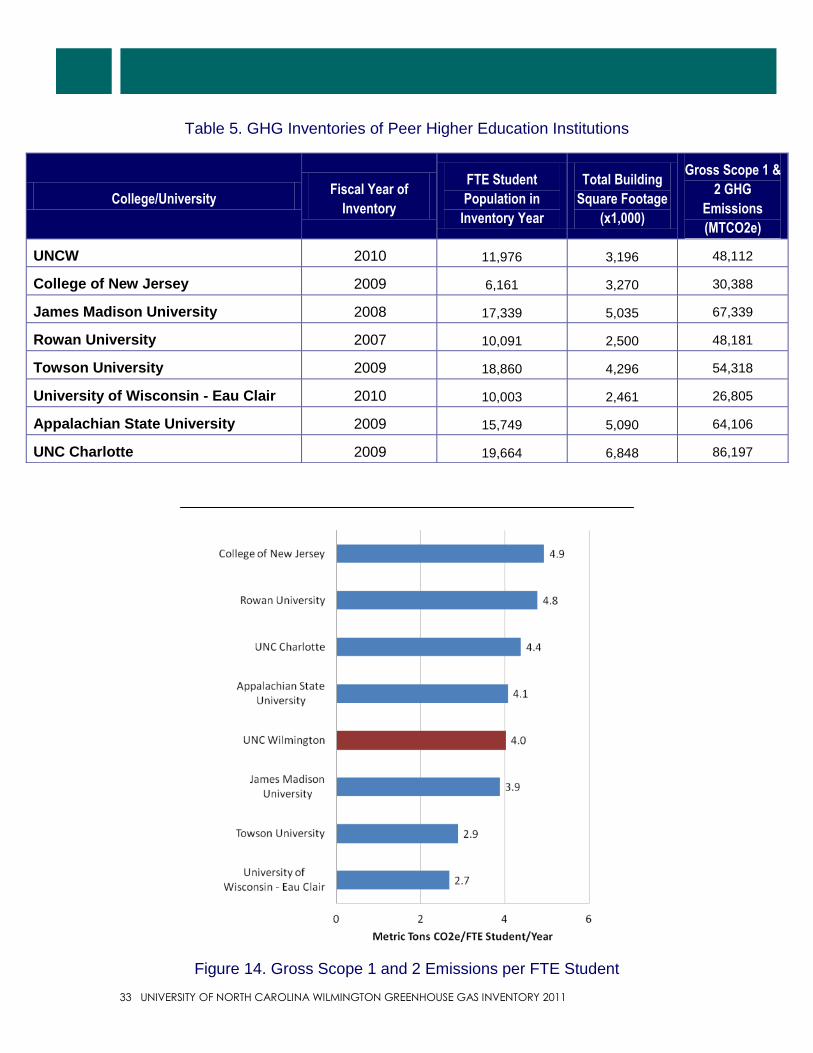
Table 5. GHG Inventories of Peer Higher Education Institutions
College/University Fiscal Year of
Inventory
FTE Student
Population in
Inventory Year
Total Building
Square Footage
(x1,000)
Gross Scope 1 &
2 GHG
Emissions
(MTCO2e)
UNCW 2010 11,976 3,196 48,112
College of New Jersey 2009 6,161 3,270 30,388
James Madison University 2008 17,339 5,035 67,339
Rowan University 2007 10,091 2,500 48,181
Towson University 2009 18,860 4,296 54,318
University of Wisconsin - Eau Clair 2010 10,003 2,461 26,805
Appalachian State University 2009 15,749 5,090 64,106
UNC Charlotte 2009 19,664 6,848 86,197
Figure 14. Gross Scope 1 and 2 Emissions per FTE Student
UNIVERSITY OF NORTH CAROLINA WILMINGTON GREENHOUSE GAS INVENTORY 2011 34
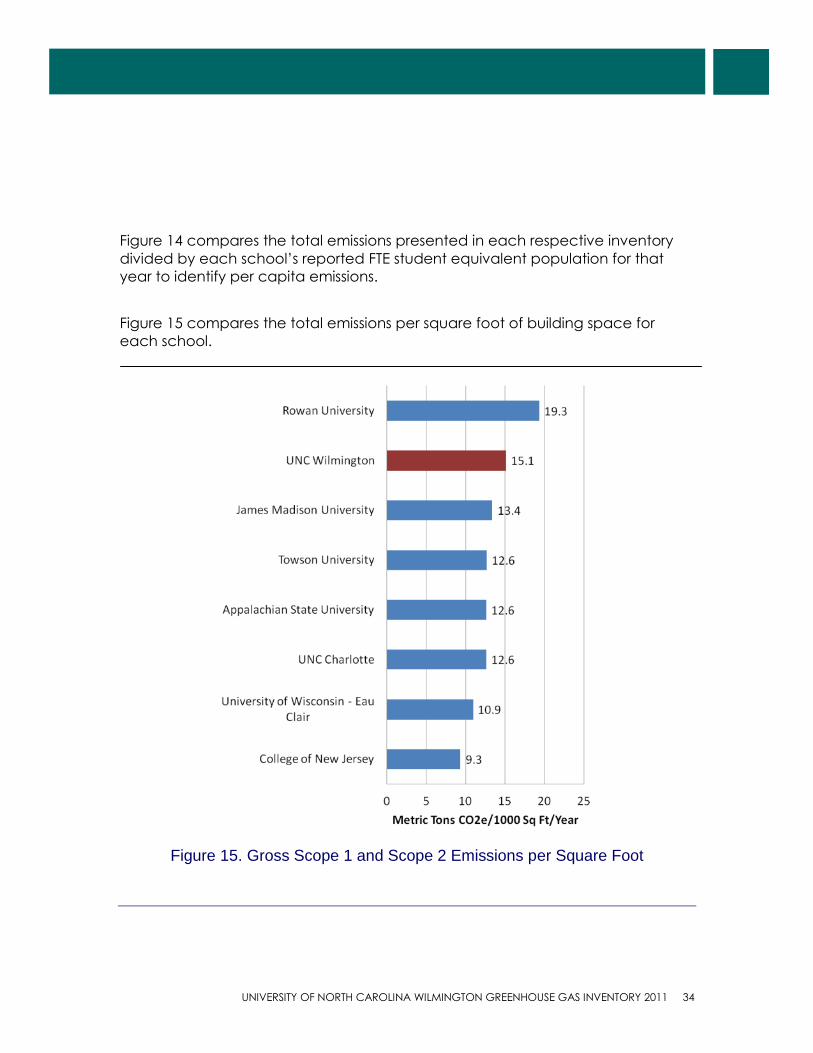
Figure 14 compares the total emissions presented in each respective inventory
divided by each school’s reported FTE student equivalent population for that
year to identify per capita emissions.
Figure 15 compares the total emissions per square foot of building space for
each school.
Figure 15. Gross Scope 1 and Scope 2 Emissions per Square Foot
35 UNIVERSITY OF NORTH CAROLINA WILMINGTON GREENHOUSE GAS INVENTORY 2011
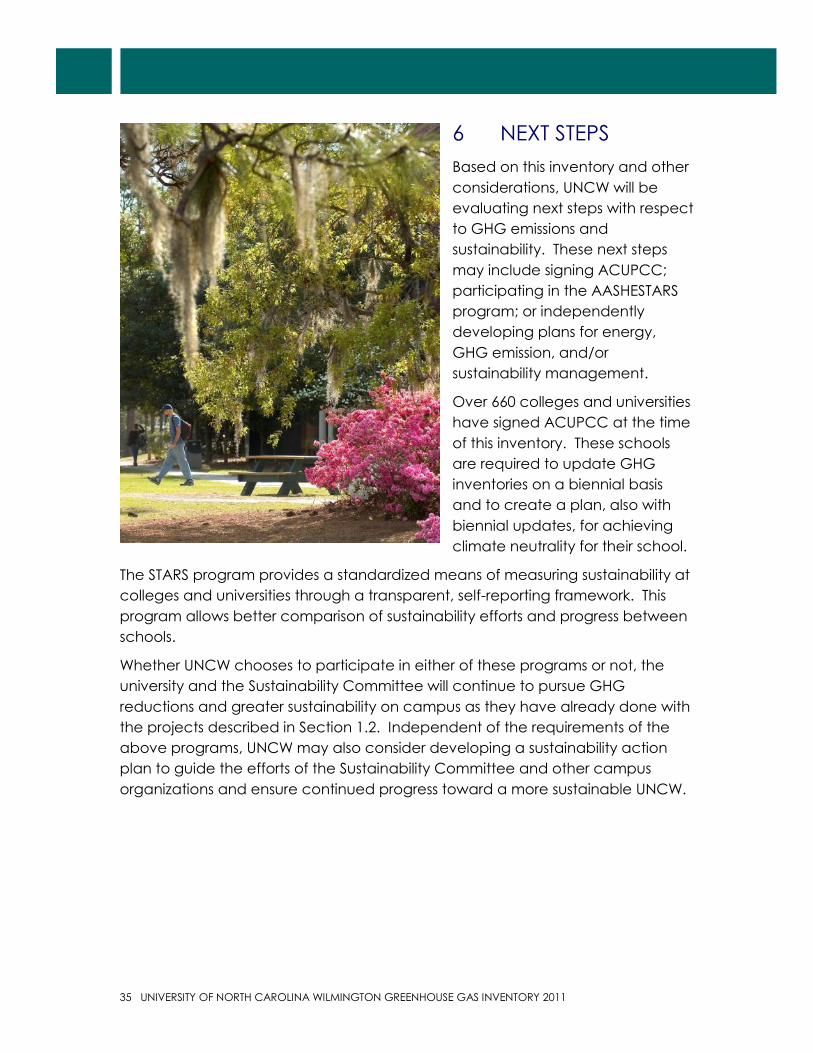
6 NEXT STEPS
Based on this inventory and other
considerations, UNCW will be
evaluating next steps with respect
to GHG emissions and
sustainability. These next steps
may include signing ACUPCC;
participating in the AASHESTARS
program; or independently
developing plans for energy,
GHG emission, and/or
sustainability management.
Over 660 colleges and universities
have signed ACUPCC at the time
of this inventory. These schools
are required to update GHG
inventories on a biennial basis
and to create a plan, also with
biennial updates, for achieving
climate neutrality for their school.
The STARS program provides a standardized means of measuring sustainability at
colleges and universities through a transparent, self-reporting framework. This
program allows better comparison of sustainability efforts and progress between
schools.
Whether UNCW chooses to participate in either of these programs or not, the
university and the Sustainability Committee will continue to pursue GHG
reductions and greater sustainability on campus as they have already done with
the projects described in Section 1.2. Independent of the requirements of the
above programs, UNCW may also consider developing a sustainability action
plan to guide the efforts of the Sustainability Committee and other campus
organizations and ensure continued progress toward a more sustainable UNCW.
UNIVERSITY OF NORTH CAROLINA WILMINGTON GREENHOUSE GAS INVENTORY 2011 36
CONTACT INFORMATION
Stan Harts
Environmental, Health & Safety Director
910-962-3108
ACRONYMS
ACUPCC – American College & University President’s Climate Commitment
AASHE – Association for the Advancement of Sustainability in Higher Education
CA-CP – Clean Air-Cool Planet Campus Carbon Calculator™
CH4 – Methane
CO2 – Carbon dioxide
GHG – Greenhouse gas
GWP – Global warming potential
HCFC – hydrochlorofluorocarbon
IMS – Inventory Management System
IPCC – Intergovernmental Panel on Climate Change
kWh – kilowatt-hour
LEED – Leadership in Energy and Environmental Design
MTCO2e – Metric tons carbon dioxide equivalent
N2O – Nitrous oxide
PFC – Perfluorocarbon
SF6 – Sulfur hexafluoride
STARS – Sustainability Tracking, Assessment & Rating System™ from AASHE
UNCW – University of North Carolina – Wilmington