UNIVERSITY OF NAIROBI - Latest News in Geospatial...
54
i UNIVERSITY OF NAIROBI USE OF GIS IN MAPPING OF CANCER PREVALENCE A CASE STUDY OF UASIN GISHU COUNTY By KIRUMBA JOHN MWANGI F19/2469/2009 A project report submitted to the Department of Geospatial and Space Technology in partial fulfillment of the requirements for the award of the degree of: Bachelor of Science in Geospatial and Space Technology APRIL 2014
Transcript of UNIVERSITY OF NAIROBI - Latest News in Geospatial...
i
UNIVERSITY OF NAIROBI
USE OF GIS IN MAPPING OF CANCER PREVALENCE
A CASE STUDY OF UASIN GISHU COUNTY
By
KIRUMBA JOHN MWANGI
F19/2469/2009
A project report submitted to the Department of Geospatial and Space Technology in
partial fulfillment of the requirements for the award of the degree of:
Bachelor of Science in Geospatial and Space Technology
APRIL 2014

ii
Abstract
Events that occur anywhere are associated with location and time thus spatial and
temporal components of these events can be combined to demonstrate aspects related
to when and where these events occurred. Cancer is also an event associated with
space and time therefore analysis can be done on cancer data to determine its spread,
patterns and trends to come up with ways to halt its spread. GIS has been used in this
project in management, analysis and displaying of the cancer data. GIS provides an
efficient means of analyzing and visualizing cancer data thus depicting trends and
patterns of the spread of cancer in space and time.
To determine the spatial and temporal prevalence of cancer, a GIS cancer database
was developed using cancer data from the six constituencies of Uasin Gishu County.
The data was recorded from the year 2004 to 2012 by the Eldoret Cancer Registry and
contained specific data for gender and status (alive or deceased). Different maps and
graphs were produced as a means to visualize and evaluate the extent at which cancer
has spread in Uasin Gishu County.

iii
Dedication
I dedicate this project to my grandmother Wanja and my dad Kirumba.

iv
Acknowledgements
First, I’m grateful to the almighty God for seeing me through the project and everyday
spiritual and mental support.
Secondly, I’m grateful to my supervisor Dr-Ing. F.N Karanja for her support and
assistance throughout the project.
Thirdly, i appreciate Daisy Chepsumbai of Eldoret Cancer Registry for assisting me with
cancer data that was used in this project.
I also appreciate the assistance of all the members of staff, Department of Geospatial
and Space Technology and their everyday support throughout the five years I’ve been
in campus.
Finally, I’m grateful to all my friends and classmates for their support, assistance and
motivation.

v
Table of contents
Abstract........................................................................................................................................ ii
Dedication ................................................................................................................................... iii
Acknowledgements .................................................................................................................... iv
Table of Contents........................................................................................................................ v
List of Tables...............................................................................................................................vii
List of Figures.............................................................................................................................viii
List of Abbreviations....................................................................................................................ix
CHAPTER ONE: INTRODUCTION …………………………………………………..……………… 1
1.1 Background ……………………………………………………………………………………. 1
1.2 Problem statement …………………………………………………………………….……… 3
1.3 Objectives of the study ……………………………………………………………………….. 4
1.4 Overview of the methodology …………………………………………………………………4
1.5 Scope and limatations of the study ……………………………………………………….… 5
1.6 Report organization ………………………………………………………….……………….. 5
CHAPTER TWO: LITERATURE REVIEW ………………………………………………….………. 6
2.1 Introduction ………………………………………………………..………………………..6
2.2 Global cancer situation ……………………………………………………………..……..6
2.3 Cancer situation in Kenya …………………………………………………..…………….7
2.4 Cancer statistics …………………………………………………………………..………..8
2.5 Definition of cancer …………………………………………………………………..…….9
2.6 Types of cancer ……………………………………………………………….………..…11
2.7 Causes of cancer ……………………………………………………………………..…..11
2.8 Cancer treatment ………………………………………………………………………….15
2.9 Role of GIS in Health Management.…………………………………………..…………18
vi
CHAPTER THREE: METHODOLOGY ………………………………………………………………21
3.1 Overview. …………………………………………………….……………..…………….21
3.2 Area of study …………………………………………..………………………..………..21
3.3 Data sources and tools …………………………………………………….……………22
3.4 Mapping spatial distribution of cancer …………………………………………………23
3.4.1 Data collection ……………………………………………………………………..…..23
3.4.2 Data preparation ……………………………………………………….………………23
3.4.3 Cancer spatial database development ……………………………………..……… 24
3.4.4 Database validation ……………………………………………….…………………..24
3.5 Mapping of cancer prevalence …………………………………………..……………..25
3.5.1 Spatial prevalence ………………………………………………………………..……25
3.5.2 Temporal prevalence ………………………………………………………..……..….25
CHAPTER FOUR: RESULTS AND DISCUSSIONS…………………………………………….…27
4.1 Results ………………………………………………….…………………..……………..27
4.1.1 Cancer prevalence ……………………………………………………………………..27
4.1.2 Cancer Prevalence Analysis…………………………………………………………..30
4.2 Discussions ……………………………………………….………………………………38
CHAPTER FIVE: CONCLUSIONS AND RECOMMENDATIONS……………………..……..…..40
5.1 Conclusions ………………………………………………………….…………………....40
5.2 Recommendations ……………………………………………..……………………..….40
REFERENCES …………………………………………………………………………………….…..42
APPENDIX ……………………………………………………..……………………………………....43

vii
List of Tables
Table 4.1: Cancer cases recorded in every constituency of Uasin Gishu County
for years 2004 to 2012 …………………………………………………………...……………….......27
viii
List of Figures
Fig 1.1: Growth and spread of cancer cells ………………………………………..………………… 2
Fig 2.1: Growth of cancer cells…………………………………………………...……………………10
Fig 3.1: Area of study ………………………………………….……………………………………….21
Fig 4.1: Cancer trends in Uasin Gishu County for years 2004 to 2012………………….………..30
Fig 4.2: Spatial distribution of cancer cases (aggregated) …………………..…………………….31
Fig 4.3: Spatial distribution of cancer cases for years 2004 to 2012…………..………….32
Fig 4.4: Cancer prevalence among gender from year 2004 to 2012 in
Uasin Gishu County………………………………………………...…………………………33
Fig 4.5: Ratio of male to female cancer cases in Uasin Gishu County………….……….34
Fig 4.6: Ratio of alive to deceased cancer patients in Uasin Gishu County…………….35
Fig 4.7: Spatial distribution and trend of death cases for years 2004 to 2012………….36
Fig 4.8: Number of cancer cases whose location was not known………………….…….37

ix
List of abbreviations
CT – Computer Tomography
DCR - Department of Civil Registration
DNA – Deoxyribonucleic acid
ECR – Eldoret Cancer Registry
GIS – Geographic Information System
HIV – Human Immunodeficiency Syndrome
HPV - Human Papilloma Virus
ILRI – International Livestock Research Institute
KEMRI – Kenya Medical Research Institute
LMICs - low and middle income countries
MRI - magnetic resonance imaging
NCI - National Cancer Institute
NCR - Nairobi Cancer Registry
TB - Tuberculosis
WRI - World Research Institute

1
CHAPTER ONE: INTRODUCTION
1.1 Background
Cancer is a broad group of diseases involving unregulated cell growth. In cancer, cells
divide and grow uncontrollably, forming malignant tumors, which may invade nearby parts
of the body (though, not all tumors are cancerous). The cancer may also spread to more
distant parts of the body through the lymphatic system or bloodstream. There are over
200 different known cancers that affect humans but certain types are more life-threatening
than others. (Holland, James F. (2009)
The causes of cancer are diverse, complex, and only partially understood. What is known
is that there are many things that increase the risk of cancer which include; exposure to
radiation, environmental pollutants, dietary factors, use of tobacco, certain infections, lack
of physical exercise and obesity. Some of these factors can directly damage genes or
combine with existing genetic faults within cells to cause cancerous mutations. However,
a small percentage of cancer cases can be traced directly to inherited genetic defects.
These defects predispose the hosts to cancerous infections even without having
interacted with the other cancer causative agents.
Cancer cells are very similar to cells of the organism from which they originated and have
similar DNA; though not identical. This is why they are not often detected by the immune
system especially if weakened (Marek Roland, 2006). Cancer cells usually have an
increased ability to divide rapidly and uncontrollably leading to the formation of large
masses of tissue which may result to disruption of bodily functions due to destruction of
organs or vital structures. Cancer begins in the genes - bits of biochemical instructions
composed of deoxyribonucleic acid (DNA). Genes act as instructions to make molecules
called proteins that serve as building blocks of cells, control chemical reactions and
transport materials to and from cells. These proteins determine the function of each cell
and ultimately the function of the entire body. A modification or mutation of the DNA
results to formation of cancer cells. These mutations occur spontaneously or they may be
caused by viruses, bacteria, fungi, parasites, nuclear and electromagnetic radiations,
heat, chemicals in the air, water and food, mechanical cell injury, evolution and aging of
DNA.

2
Fig 1.1 Growth and spread of cancer (University of North Carolina, 2012)
Cancer cells are formed continuously in the body (it is estimated that there are about
10,000 cancer cells at any given time in a healthy person). However those with the
potential to form cancer are effectively destroyed by the immune system, but if the
immune system is weak or the amount of cells produced is too much for the immune
system to eliminate, this results to development of cancer. The cancerous growth forms
tumor which later bud and spread throughout the body. Not all tumors are malignant,
some do not extend into neighboring tissue, however the malignant tumors extend to
neighboring tissue and break through a blood vessel and travel distant organs through
the circulatory system or the lymphatic system.
Cancer develops across all ages, gender, geographic regions and races. However the
trend is different for specific cancer types such as breast cancer which is more common
in wealthy nations, whereas cervical cancer is common in poor countries. While cancer
affects people of all ages, a few types of cancer are common in children but the risk of
developing cancer generally increases with age. Though the causes of cancer are not
known, researchers believe that many cancers can be prevented by not smoking, eating
more vegetables, fruits and whole grains, eating less meat and refined carbohydrates,

3
maintaining a healthy weight, exercising, minimizing sunlight exposure and being
vaccinated against infectious diseases. With a positive change of lifestyle and healthy
environment, the growth of cancerous cells can be reversed in majority of cases (probably
in 90% - 95%) and shrink and eventually disappear. (Marek Roland, 2006)
1.2 Problem Statement
Cancer has recently become one of the main killer diseases in Kenya. There are more
cancer cases being reported today than 10 years ago and cancer is now the fourth highest
killer disease in the country. In 2011, statistics from the Department of Civil Registration
(DCR) showed that the disease claimed 11,907 lives amounting to 10.3 percent of the
total deaths recorded in that year alone. Medical experts claim that the number of cancer
patients could increase, noting that cancer-related complications claim up to 50 lives
daily.
Cancer develops gradually over many years and if not detected early enough, it becomes
difficult to treat. Most of the reported cancers are detected at late stages when the cancer
has spread to other vital organs, a point at which little can be done for the patient.
Moreover there is a shortage of health centers and personnel to handle the disease.
More effort has been put into improving detection mechanisms thus the increase in cases
being recorded but little is done on cancer prevalence (Daily Nation, 2014). Cancer
prevalence studies require detailed data from all over the country about the cancer types,
age, gender, location and status of health facilities dedicated to cancer cases. Kenya is
lagging behind in this situation as there are only two cancer registries in the country;
Nairobi Cancer Registry (NCR) and Eldoret Cancer Registry (ECR). This has grossly
hindered the cancer prevalence studies.
Prevention is better than cure thus the need to map the spread and correlate it with the
possible causes so as to prevent new cases and device methods to deal with existing
cases. The spatial distribution of cancer cases in Kenya varies erratically in relation to
ethnicity, gender, age and environmental factors. The distribution also varies in time with
most regions indicating an increase in number of detections recorded. However these
4
findings have resulted from very few and inadequate studies and this calls for better
studies to give an indication of the cancer prevalence in all aspects; spatial and temporal.
Geographical Information System offers the opportunity to do so by use of interactive
maps which when combined with the cancer records, patterns and trends can be
generated to show the prevalence of cancer.
In this project, Uasin Gishu County is the case study which will be used to show the
prevalence of cancer with data (obtained from the Eldoret Cancer Registry) applied in
GIS.
1.3 Objectives of the Study
Main objective: to show the spatial variation of cancer incidence and mortality using Uasin
Gishu County as a case study. (Units of analysis are constituencies)
Specific objectives
1. Identify suitable data for cancer prevalence
2. Develop spatial cancer database
3. Apply the spatial cancer database to come up with useful information for
counteracting the spread of cancer.
1.4 Overview of the Methodology
Digital maps of Uasin Gishu County and its six constituencies were obtained (shape files).
Cancer data in tabular form were joined to the attribute tables for the maps to create a
cancer database. The database together with the shape files are subjected to processing
which results to thematic maps which finally depicted the cancer prevalence.

5
1.5 Scope and Limitations of the Study
The project is focused on the study of cancer prevalence using attribute data for cancer
cases recorded. The case study for the project is Uasin Gishu County where the Eldoret
Cancer Registry (ECR) is located. This area is suitable due to the increased cases of
cancer recorded there. The data used in this project has been collected from the year
2004 to 2012 by the ECR
1.6 Report Organization
The report is organized into five chapters: chapter one is the introduction to the study,
chapter two focusses on the literature review, chapter three discusses the methodology
applied, chapter four presents the results, analysis and discussions and finally chapter
five addresses the conclusions and recommendations.
6
CHAPTER TWO: LITERATURE REVIEW
2.1 Introduction
Any disease adversely affects the society directly or indirectly. The patient and immediate
family are affected directly and the society at large is affected indirectly especially in
economic matters. All disease result to loss of income for the government and the
individual in attempts to eradicate the illness. Cancer specifically is very expensive to deal
with starting from diagnosis up to treatment.
Moreover, poor health results to reduced work force which eventually affects the economy
2.2 Global Cancer Situation
Cancer is the leading cause of death worldwide. According to the World Health
Organization, the disease accounted for 7.9 million deaths (about 13% of all deaths
worldwide) in 2009. More than 70% of all cancer deaths occur in low- and middle-income
countries. The overall burden of cancer in the world is projected to continue rising,
particularly in developing countries. It is projected that an estimated 15.5 million people
will be diagnosed, and 12 million will die of cancer in the year 2030. The annual mortality
attributed to main types of cancer includes: lung cancer (1.3 million deaths), stomach
cancer (803 000 deaths), colorectal cancer (639 000 deaths), liver cancer (610 000
deaths) breast cancer (519 000 deaths) cervical cancer (450,000) and oesophageal
cancer (380,000). The most frequent types of cancer among men affect the lung,
stomach, liver, colorectal, oesophagus and prostate. Among women the most common
areas affected are breast, lung, stomach, colorectal and cervix.
The increased cases in developing countries result from adoption of western lifestyles
which include; high-fat and low-fibre diets, increased consumption of tobacco and less
physical activities. In many of these countries the silence that accompanies the disease
is often the result of a complete lack of meaningful information for those affected by
cancer—the disease may go undetected and untreated until it leads to death. Even then,

7
the cause of death may remain undiagnosed. In other places, the situation is worsened
by medical practitioners who make wrong diagnosis which leads to treating of the wrong
illness instead of cancer. This reveals that cancer is a hidden epidemic. (National Cancer
Control Strategy, 2011)
Also in the developing world, most cancer cases are detected at advanced stages when
very little can be done to successfully eliminate the disease and most times very
expensive.
2.3 Kenyan Cancer Situation
In Kenya, cancer ranks third as a cause of death after infectious diseases and
cardiovascular diseases. It causes 7% of total national mortality every year. Although
population based data does not exist in the country, it is estimated that the annual
incidence of cancer is about 28,000 cases and the annual mortality to be over 22,000.
Over 60% of those affected are below the age of 70 years. In Kenya, the risk of getting
cancer before the age of 75 years is 14% while the risk of dying of cancer is estimated at
12%. In many developing countries the rapid rise in cancers and other non-communicable
diseases has resulted from increased exposure to risk factors which include tobacco use,
harmful use of alcohol and exposure to environmental carcinogens. Other risk factors for
some cancers include infectious diseases such as HIV/AIDS (Kaposi’s sarcoma and
lymphomas), Human Papilloma Virus (HPV), Hepatitis B & C (Liver cancer), bacterial
infections such as Helicobacter Pylori (cancer of stomach) and parasitic infestations such
as schistosomiasis (cancer of bladder)
The leading cancers in women are breast, oesophagus and cervical cancers. In men,
oesophagus and prostate cancer and Kaposi sarcoma are the most common cancers.
Based on 2002 data from the Nairobi Cancer Registry, of all the cancers registered breast
cancer accounted for 23.3%, cervical cancer for 20% and prostate cancer for 9.4%. In
2006, around 2,354 women were diagnosed with cervical cancer and 65% of these died
of the disease. (National Cancer Control Strategy, 2011)
8
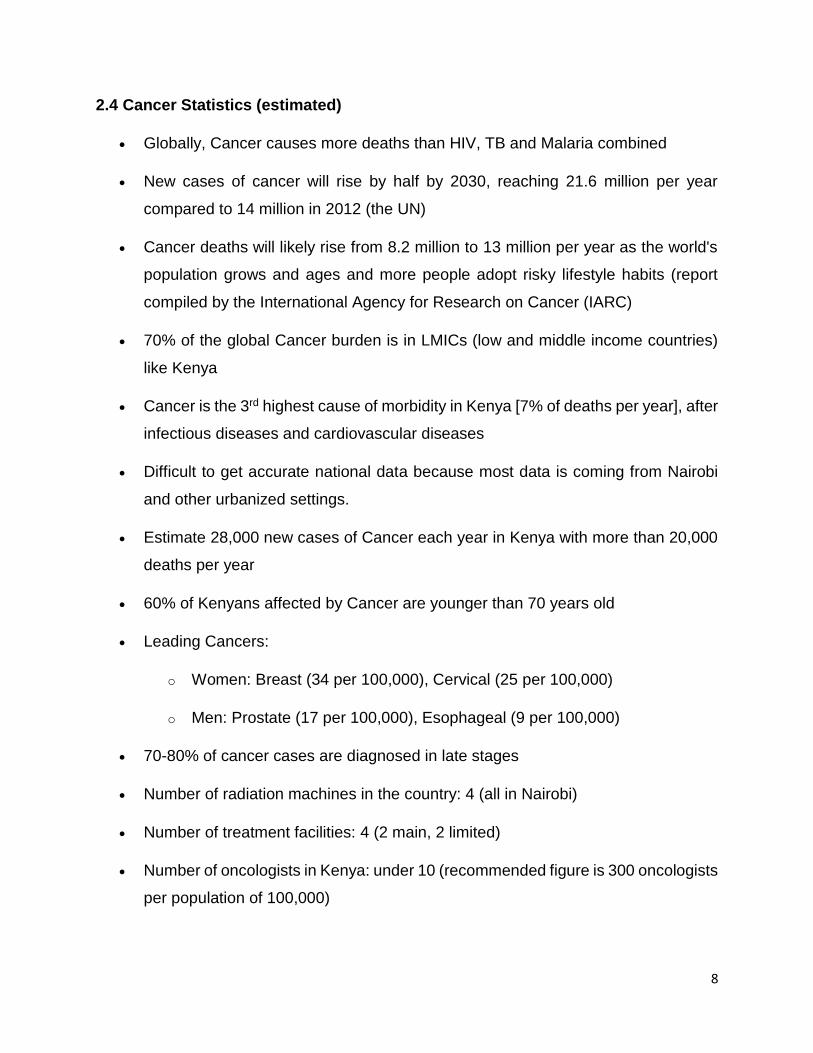
2.4 Cancer Statistics (estimated)
Globally, Cancer causes more deaths than HIV, TB and Malaria combined
New cases of cancer will rise by half by 2030, reaching 21.6 million per year
compared to 14 million in 2012 (the UN)
Cancer deaths will likely rise from 8.2 million to 13 million per year as the world's
population grows and ages and more people adopt risky lifestyle habits (report
compiled by the International Agency for Research on Cancer (IARC)
70% of the global Cancer burden is in LMICs (low and middle income countries)
like Kenya
Cancer is the 3rd highest cause of morbidity in Kenya [7% of deaths per year], after
infectious diseases and cardiovascular diseases
Difficult to get accurate national data because most data is coming from Nairobi
and other urbanized settings.
Estimate 28,000 new cases of Cancer each year in Kenya with more than 20,000
deaths per year
60% of Kenyans affected by Cancer are younger than 70 years old
Leading Cancers:
o Women: Breast (34 per 100,000), Cervical (25 per 100,000)
o Men: Prostate (17 per 100,000), Esophageal (9 per 100,000)
70-80% of cancer cases are diagnosed in late stages
Number of radiation machines in the country: 4 (all in Nairobi)
Number of treatment facilities: 4 (2 main, 2 limited)
Number of oncologists in Kenya: under 10 (recommended figure is 300 oncologists
per population of 100,000)
9
Childhood Cancer in Kenya (data from Feb 2013 presentation by Dr. Jessie Githanga,
pediatric oncologist at Kenyatta National Hospital)
Childhood cancer accounted for 15% of cancer admissions at KNH [1998-2008]
1 in 10 children survive cancer in Kenya [compared to 7 in 10 in the developed
countries]
Challenges in childhood cancer care: poor access to care for patients in
remote/rural areas; limited specialist treatment centers; prohibitive cost of anti-
cancer drugs; low levels of awareness in clinicians and public;
Possible signs of childhood cancer: lumps/swellings; unexplained weakness or
paleness; easy bruising/nose or gum bleeding; persistent unexplained
fever/illness; constant pain; frequent headaches, often with vomiting; sudden eye
or vision changes; sudden unexplained weight loss; limping/inability to walk
properly (Kenya Network of Cancer Organizations, 2012)
2.5 Definition of cancer
Cancer is a term used for diseases in which abnormal cells divide without control and
are able to invade other tissues. Cancer is not just one disease but many diseases.
There are more than 100 different types of cancer. Most cancers are named for the
organ or type of cell in which they start - for example, cancer that begins in the colon
is called colon cancer. All cancers begin in cells, the body’s unit of life. The body is
made up of many types of cells. These cells grow and divide in a controlled way to
produce more cells as they are needed to keep the body healthy. When cells become
old or damaged, they die and are replaced with new cells. However, sometimes this
orderly process goes wrong. The genetic material (DNA) of a cell can become
damaged or changed, producing mutations that affect normal cell growth and division.
When this happens, cells do not die when they should and new cells form when the
body does not need them. The extra cells may form a mass of tissue called a tumor.

10
Not all tumors are cancerous; tumors can be benign or malignant. (National Cancer
Institute, 2013)
Benign tumors aren't cancerous. They can often be removed, and, in most cases,
they do not come back. Cells in benign tumors do not spread to other parts of the
body.
Malignant tumors are cancerous. Cells in these tumors can invade nearby tissues
and spread to other parts of the body. The spread of cancer from one part of the
body to another is called metastasis.
Some cancers do not form tumors. For example, leukemia which is a cancer of the
bone marrow and blood.
Fig 2.1 Growth of cancer cells (National Cancer Institute, 2013)

11
2.6 Types of Cancer
Cancer types can be grouped into broader categories. The main categories of cancer
include:
Carcinoma - cancer that begins in the skin or in tissues that line or cover internal
organs. There are a number of subtypes of carcinoma, including adenocarcinoma,
basal cell carcinoma, squamous cell carcinoma, and transitional cell carcinoma.
Sarcoma - cancer that begins in bone, cartilage, fat, muscle, blood vessels, or
other connective or supportive tissue.
Leukemia - cancer that starts in blood-forming tissue such as the bone marrow
and causes large numbers of abnormal blood cells to be produced and enter the
blood.
Lymphoma and myeloma - cancers that begin in the cells of the immune system.
Central nervous system cancers - cancers that begin in the tissues of the brain
and spinal cord.
2.7 Causes of cancer
Cancers are primarily an environmental disease with 90–95% of cases attributed to
environmental factors and 5–10% due to genetics. Environmental, as used by cancer
researchers, means any cause that is not inherited genetically, not merely pollution.
Common environmental factors that contribute to cancer death include tobacco (25–
30%), diet and obesity (30–35%), infections (15–20%), radiation (both ionizing and non-
ionizing, up to 10%), stress, lack of physical activity, and environmental pollutants.
It is nearly impossible to prove what caused a cancer in any individual, because most
cancers have multiple possible causes. For example, if a person who uses tobacco
heavily develops lung cancer, then it was probably caused by the tobacco use, but since
everyone has a small chance of developing lung cancer as a result of air pollution or
radiation, then there is a small chance that the cancer developed because of air pollution
or radiation. (Holland, James F. (2009)

12
Chemicals
Cancer pathogenesis is traceable back to DNA mutations that impact cell growth and
metastasis. Substances that cause DNA mutations are known as mutagens, and
mutagens that cause cancers are known as carcinogens. Particular substances have
been linked to specific types of cancer. Tobacco smoking is associated with many forms
of cancer, and causes 90% of lung cancer.
Diet and exercise
Diet, physical inactivity, and obesity are related to approximately 30–35% of cancer
deaths. Physical inactivity is believed to contribute to cancer risk not only through its effect
on body weight but also through negative effects on immune system and endocrine
system. More than half of the effect from diet is due to over-nutrition rather than from
eating too little healthy foods. Diets that are low in vegetables, fruits and whole grains,
and high in processed or red meats are linked with a number of cancers. A high-salt diet
is linked to gastric cancer, aflatoxin B1, a frequent food contaminate, with liver cancer,
and Betel nut chewing with oral cancer.
Infections
Worldwide approximately 18% of cancer deaths are related to infectious diseases. This
proportion varies in different regions of the world from a high of 25% in Africa to less than
10% in the developed world. Viruses are the usual infectious agents that cause cancer
but bacteria and parasites may also have an effect. A virus that can cause cancer is called
an oncovirus. These include human papillomavirus (cervical carcinoma), Kaposi's
sarcoma herpesvirus (Kaposi's sarcoma and primary effusion lymphomas), hepatitis B
and hepatitis C viruses (hepatocellular carcinoma). Bacterial infection may also increase
the risk of cancer, as seen in Helicobacter pylori-induced gastric carcinoma. Parasitic
infections strongly associated with cancer include Schistosoma haematobium (squamous
cell carcinoma of the bladder) and the liver flukes.
13
Radiation
Up to 10% of invasive cancers are related to radiation exposure, including both ionizing
radiation and non-ionizing ultraviolet radiation. Additionally, the vast majority of non-
invasive cancers are non-melanoma skin cancers caused by non-ionizing ultraviolet
radiation. Sources of ionizing radiation include medical imaging, and radon gas. Radiation
can cause cancer in most parts of the body, in all animals, and at any age, although
radiation-induced solid tumors usually take 10–15 years, and can take up to 40 years, to
become clinically manifest, and radiation-induced leukemias typically require 2–10 years
to appear. Unlike chemical or physical triggers for cancer, ionizing radiation hits
molecules within cells randomly. If it happens to strike a chromosome, it can break the
chromosome, result in an abnormal number of chromosomes, inactivate one or more
genes in the part of the chromosome that it hit, delete parts of the DNA sequence, cause
chromosome translocations, or cause other types of chromosome abnormalities. Major
damage normally results in the cell dying, but smaller damage may leave a stable, partly
functional cell that may be capable of proliferating and developing into cancer, especially
if tumor suppressor genes were damaged by the radiation. Even if the radiation particle
does not strike the DNA directly, it triggers responses from cells that indirectly increase
the likelihood of mutations. Medical use of ionizing radiation is a growing source of
radiation-induced cancers. Ionizing radiation may be used to treat other cancers, but this
may, in some cases, induce a second form of cancer. Prolonged exposure to ultraviolet
radiation from the sun can lead to melanoma and other skin malignancies. Clear evidence
establishes ultraviolet radiation, especially the non-ionizing medium wave UVB, as the
cause of most non-melanoma skin cancers, which are the most common forms of cancer
in the world.
Non-ionizing radio frequency radiation from mobile phones, electric power transmission,
and other similar sources have been described as a possible carcinogen by the World
Health Organization's International Agency for Research on Cancer. However, studies
have not found a consistent link between cell phone radiation and cancer risk.

14
Heredity
The vast majority of cancers are non-hereditary (sporadic cancers). Hereditary cancers
are primarily caused by an inherited genetic defect. Less than 0.3% of the population are
carriers of a genetic mutation which has a large effect on cancer risk and these cause
less than 3–10% of all cancer. Some of these syndromes include: certain inherited
mutations in the genes BRCA1 and BRCA2 with a more than 75% risk of breast cancer
and ovarian cancer, and hereditary nonpolyposis colorectal cancer (HNPCC or Lynch
syndrome) which is present in about 3% of people with colorectal cancer, among others.
Hormones
Some hormones play a role in the development of cancer by promoting cell proliferation.
Insulin-like growth factors and their binding proteins play a key role in cancer cell
proliferation, differentiation and apoptosis, suggesting possible involvement in
carcinogenesis.
Hormones are important agents in sex-related cancers such as cancer of the breast,
endometrium, prostate, ovary, and testis, and also of thyroid cancer and bone cancer.
For example, the daughters of women who have breast cancer have significantly higher
levels of estrogen and progesterone than the daughters of women without breast cancer.
These higher hormone levels may explain why these women have higher risk of breast
cancer, even in the absence of a breast-cancer gene. Similarly, men of African ancestry
have significantly higher levels of testosterone than men of European ancestry, and have
a correspondingly much higher level of prostate cancer. Men of Asian ancestry, with the
lowest levels of testosterone-activating androstanediol glucuronide, have the lowest
levels of prostate cancer.
Diagnosis and Detection
Early warning signs of cancer include changes in bowel or bladder habits, a sore that
does not heal, unusual bleeding or discharge, thickening or a lump in the breast or any
other part of the body, indigestion or difficulty swallowing, change in appearance of a wart
or mole, or a nagging cough or hoarseness.

15
Detection is done by medical imaging techniques such as computed tomography (CT)
and magnetic resonance imaging (MRI) scans which use computers to form a three
dimensional image of the tumor and neighboring tissues. Also X-ray images of the breasts
(mammograms) are used to detect and evaluate breast cancer. Ultrasound 17 scanning
bounces high-frequency sound waves off a tumor and surrounding tissue to create an
image of the tumor. The multimodality display technique combines the images from
several imaging tools into one picture, providing a final three-dimensional image with
much greater detail.
2.8 Cancer treatment
Traditional Treatment of Cancer
Cancer can be a very scary thing. The survival rates of some cancers is very low and
treatments are not very effective, if one uses traditional medicine (one estimate puts it at
3%). On top of that, cancer is demonized as this scary thing which is growing in you and
is going to kill you. Many people feel helpless and put blind trust in traditional medicine
for treatment. Traditional medicine is very good in detecting and monitoring cancer but it
is very poor and ineffective in the treatment of cancer. Detection is good and aided by
imaging techniques such as NMR, CT-scan, ultrasound, PET, etc. and many other
chemical, genetic, tissue, etc. tests. Below a few conventional medical treatments
techniques are mentioned:
Radiation Therapy
Attempts to locally destroy cancer cells with the various types of radiation such as X-ray,
Gamma-ray, particle beams, isotopes, ultrasound, etc. Beams of radiation are focused
mainly on the cancer growth and doses are calculated to minimize the collateral damage
to surrounding tissues, which nevertheless occurs. This kind of treatment increases the
entropy of the organism, suppresses the immune system, destroys healthy cells and
potentially forms new mutated cells some of which could become cancerous (and possibly
more dangerous than original cancer cells).

16
Chemotherapy
This aims to destroy the cancer cells with various types of chemicals. The substances
used are supposed to target mainly the cancer cells (sometimes via direct injection to
cancer tissue) and doses are calculated to minimize the collateral damage to surrounding
tissues, which nevertheless occurs. This kind of treatment increases the entropy of the
organism, suppresses the immune system, forms a toxic cell environment, destroys
healthy cells and potentially forms new mutated cells some of which could become
cancerous (and more dangerous than original cancer cells).
Surgery
This is another very invasive technique. Underlying logistics is to locally remove cancer
cells with as few healthy cells as possible. This in turn should stop any further growth,
since there are no cancer cells left in the body. This is a wrong assumption, since it is
very difficult to find the exact boundaries of the cancer growth and remove all cells.
Besides that, cancer cells can enter the blood stream and lymphatic fluid during an
operation and spread to other parts of the body. This kind of treatment also increases the
entropy of the organism, suppresses the immune system and destroys healthy cells and
organs.
All mentioned above methods are very invasive, destroy healthy cells and suppress the
immune system. This approach leads to an increase of entropy of the organism and
lowers the chances of recovery from cancer. All these methods are designed to treat
symptoms (cancerous growth), not the cause of cancer (non-functioning immune system
and factors contributing to cancer cells formation). Since the cause of cancer is not
addressed and treatment is not provided, cancer will, in the majority of cases, spread and
recur (Holland, James F. (2009)

17
New Research in Cancer Treatment
Genetically engineered bacteria and viruses
Some new promising research uses genetically engineered bacteria and viruses to infect
and destroy cancer cells. This could be useful when cancer is already advanced and there
are large masses of cancer cells. The potential drawback of these methods is the
generation of large amounts of toxins from dying cancer cells, which in turn can suppress
the immune system or even kill the patient. Also bacteria and viruses very often mutate
which in turn can lead to infection and attack on healthy, non-cancerous cells.
Anti-cancer vaccines
Anti-cancer vaccines or even custom-made anti-cancer vaccines for a particular patient
and cancer type are also a very promising line of research. By providing fragments of
cancer cells to the immune system, one can potentially get the immune system response
to destroy live cancer cells.
Cancer markers
Another promising line of research is related to chemical substances which could be used
to mark cancer cells. This in turn will allow easier recognition of these cells by the immune
system.
Cancer growth retarders / inhibitors
This line of research is related to the use of chemical substances which could retard /
inhibit the growth of cancer cells. An interesting research topics are the substances
blocking activity of telomerase, the enzyme responsible for the management/elongation
of telomeres. Telomerase is found in high concentrations in 80% of tumors and allows
tumor cells to gain "immortality" by removing restrictions on the number of cell divisions.
This enzyme may also be useful in extending the lifespan of healthy cells and in turn
extend the lifespan of the organism (cancer cells and their growth may hold much valuable
information about fountain of youth and immortality).
All the above mentioned methods show some promise. However these methods by
themselves do not provide reliable cancer treatment

18
Prevention
Though the causes of cancer are not known, researchers believe that many cancers can
be prevented by not smoking, eating more vegetables, fruits and whole grains, eating less
meat and refined carbohydrates, maintaining a healthy weight, exercising, minimizing
sunlight exposure and being vaccinated against infectious diseases. With a positive
change of lifestyle and healthy environment, the growth of cancerous cells can be
reversed in majority of cases (probably in 90% - 95%) and shrink and eventually
disappear. (Marek Roland, 2006)
2.9 Role of GIS in Health Management
A geographic information system (GIS) integrates hardware, software, and data for
capturing, managing, analyzing, and displaying all forms of geographically referenced
information. Events that occur are associated with location and time thus spatial and
temporal components can be combined to demonstrate aspects of when and where, from
which analysis can be done to answer questions like how and why such events occur in
space and time. GIS allows us to view, understand, question, interpret, and visualize data
in many ways that reveal relationships, patterns, and trends in the form of maps, globes,
reports, and charts. A GIS helps you answer questions and solve problems by looking at
your data in a way that is quickly understood and easily shared. (ESRI, 2013)
With improvements in computer hardware and widespread availability of software for
geographic information systems (GIS), mapping is no longer limited to academic
cartographers or to national agencies with extensive computer resources.
GIS is comprised of three general areas: database development (building the GIS),
spatial analysis and visualization of georeferenced data. Diseases such as Cancer cases
occur in space and time, thus GIS can be applied in collection, management, analysis
and displaying of the cancer data. Mapping of cancer helps in understanding the trend
and patterns that cancer cases appear to take. This is useful in figuring out how to deal
with the spread of cancer and of more importance is revealing the possible causes of
cancer development thus avoiding future occurrences.
19
GIS has been extensively and intensively used by the National Cancer Institute (NCI) in
the United States of America (U.S.A) in investigating the geographic patterns of cancer.
Of particular interest are the significant advances in understanding the regional
differences of cancer rates in the U.S.A. (Mason 1975; Mason 1976; Mason 1981; Pickle
1987; Pickle 1990; Devesa 1999) Although mortality rates had been published for
decades in tabular form, it wasn’t until Mason and colleagues mapped the rates at the
county level that striking geographic patterns were evident. For example, high lung cancer
mortality rates that were seen in coastal cities were later found to be due to asbestos
exposure from shipyard work during World War II (Blot 1978). Also, high oral cancer rates
among white women in southeastern states were found to be caused by their habit of
dipping snuff (smokeless tobacco) (Winn 1981).
The role of NCI has changed to one of facilitator for localized geographic studies and
developer of geographic methods widely applicable to cancer data, in addition to its
traditional role of producing national statistics and conducting studies to determine the
cancer causes and effective prevention, diagnosis and treatment.
Environmental exposure assessment
A GIS can be a useful tool for estimating exposure to environmental contaminants by
providing information about potential exposures that cannot be obtained through
traditional epidemiologic methods. NCI used GIS to estimate indirect exposure to
agricultural pesticides and nitrate levels in private wells in two cancer epidemiology
studies done in Nebraska and Northern Colorado respectively.
Spatial data analysis
NCI has used GIS for spatial data analysis for example in identifying significant clusters
of high rates of several cancers at the zip code level in New York and has been used
numerous times to evaluate cancer clusters brought to their attention by the public
(Kulldorff 1997b, Kulldorff 1998). A more standard type of spatial analysis is exemplified
by a study of the geographic patterns of late stage breast cancer in Los Angeles County.
NCI modeled the proportion of all incident breast cancer cases in the county who were

20
diagnosed with late stage disease for the purpose of identifying population subgroups
and geographic areas that could benefit from additional mammographic screening.
Communication of cancer statistics
In addition to designing tools that are useful to researchers, there is a need to
communicate georeferenced data to policy makers, clinicians, patients, and the general
public. GIS develops maps, globes, reports, and charts that are an efficient method of
communicating the cancer statistics to medical experts, patients, policy makers and the
general public thus sensitizing everyone in ways to deal with existing cancer cases and
avoiding possible future occurrences. NCI has used Conditional choropleth maps to show
the geographic distribution of counties within a state that have high versus low cancer
mortality rates cross-classified with the direction of change in these rates.
21
CHAPTER THREE: METHODOLOGY
3.1 Overview
This chapter describes materials and methods used in the study. This basically involves
the materials needed to develop spatial database, develop attribute data for Uasin Gishu
County and methods used in the analysis of cancer prevalence. In addition, there is data
identification, collection and preparation so as to be fit for use. Data preparation includes
conversion and manipulation of tabular data while data extraction involves joining attribute
tables so as to facilitate thematic mapping of attributes.
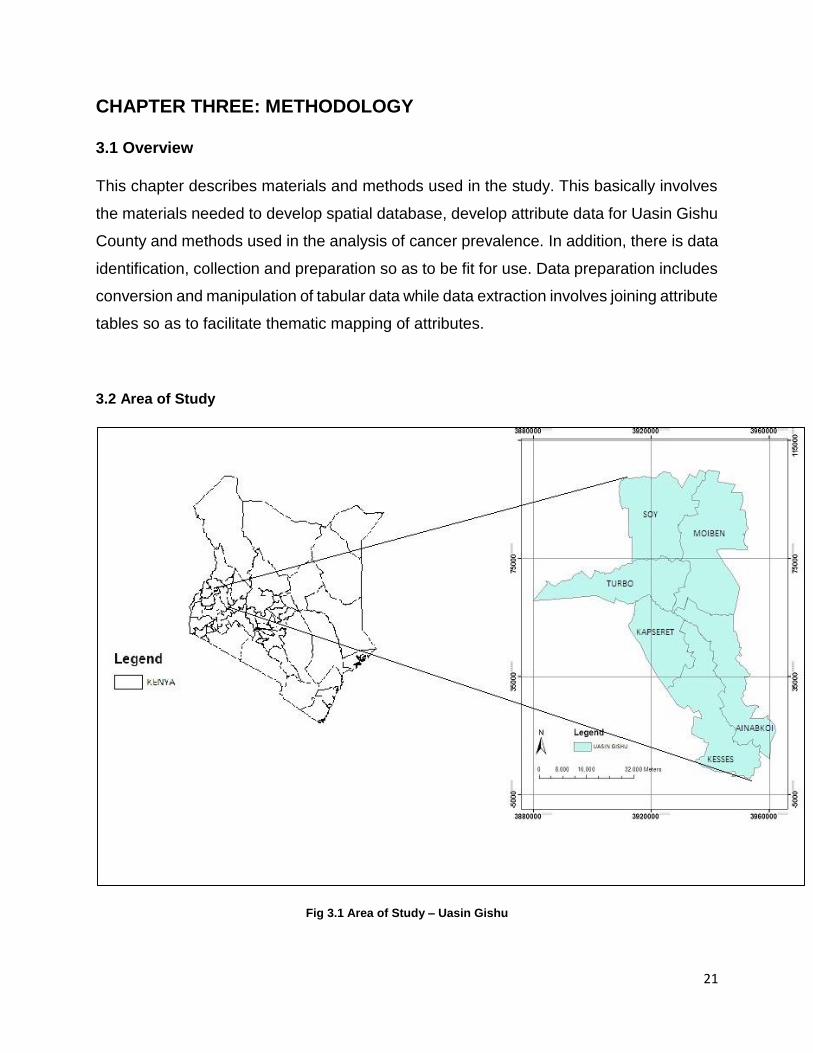
3.2 Area of Study
Fig 3.1 Area of Study – Uasin Gishu

22
The area of study is Usin Gishu County which lies 00° 30' 00" N and 35° 20' 00" E. In
Uasin Gishu County elevation varies between 2100 metres above sea level to about 2700
metres above sea level.and its spatial extent is approximately 3345.2 square kilometres.
Uasin Gishu is located in the Rift Valley province and its administrative headquarters are
in Eldoret town which is approximately 330 kilometres from Nairobi City which is the
capital city of Kenya. Uasin Gishu is bordered by Trans-Nzoia and Marakwet districts to
the north, Elgeyo district to the east, Kericho and Nandi districts to the south and
Kakamega district to the west.
3.3 Data sources and Tools
Cancer data used was obtained from the Eldoret Cancer Registry as excel files
Administrative boundaries data were obtained from World Resource Institute
Tools used:
Hardware
Computer; 1GB ram, 120GB hard drive, 2.0 GHz dual core.
flash disk 4GB
Software
ArcMap 10
Quantum GIS 2.0
Microsoft office 2007

23
3.4 Mapping Spatial Distribution of Cancer
3.4.1 Data Collection
1. Administrative Boundaries
The administrative boundaries map covering the area of study was obtained from
ILRI and World Resource Institute (www.wri.com). It was in form of shape file
showing Constituency boundaries in Uasin Gishu County.
2. Cancer Data
Cancer data was obtained from the Eldoret Cancer Registry (KEMRI). The data
consisted of location, gender and status of the cancer patients diagnosed from
year 2004 to year 2012.
More cancer data on causes of cancer and future projections of its spread was
obtained from the World Health Organization website.
3. Population data
Population data for the 6 constituencies was obtained from the Kenya Bureau of
Statistics
3.4.2 Data Preparation
Sorting tabular data
All the tabular cancer data obtained from ECR and population data from KNBS was sorted
in a suitable format in excel sheets for each constituency and also aggregates for the
whole county.
24
3.4.3 Cancer Spatial Database Development
a. Clipping
The maps obtained from ILRI were in shape file format (shp). The units of analysis
were constituencies therefore the area of study was clipped in Arc Map. All the
constituency boundaries and the county boundaries were used as base.
b. Editing of Attribute Tables
Attribute tables were edited for relevant fields using Arc Map and exported to the
database
c. Spatial cancer database
A spatial cancer database was created using Arc Map and the cancer prevalence
tables created as spreadsheets were imported and linked to their respective unit
of analysis in the area of study. A GIS database for cancer prevalence was
therefore developed with relevant attributes joined and related.
3.4.4 Database validation
It was necessary to test the database on its functionality after it had been developed.
Various analytical functions were performed on the database to verify its efficiency. This
was done by querying the database and performing functions such as overlays and
developing simple graphs and comparing them to the original data obtained from ECR.

25
3.5 Mapping of cancer prevalence
3.5.1 Spatial prevalence
To demonstrate the spatial distribution of cancer, six constituencies of Uasin Gishu
County were considered (Turbo, Soy, Kapseret, Ainabkoi, Moiben and Kesses). The data
obtained consisted of total cases for each constituency, gender and status (alive or
deceased).
Bar graphs were developed to show the variation of total cancer cases in all six
constituencies. Bar lengths reflected the number of total cancer cases in each
constituency. In one situation, pie charts were used to portray the total number of cancer
patients in every constituency.in this case, different sizes of pie charts(in diameter and
thickness) gave a clear indication of which constituencies had more cancer cases than
others and comparison was easy.
Pie charts were then developed to show the variation of the cancer cases between gender
and status of cancer patients for every constituency.in this case, the pie charts contained
total male and female cases to be compared in each constituency. The pie chart sizes
were equal for all constituencies as they were to only portray the male to female ratio.
The final analysis was done for cancer status (alive or deceased). This was also done
using pie charts and total cancer cases for each constituency. Pie chart sizes were also
equal because the intention was to portray the ratio of deceased patients to the alive
patients.
Finally, a combination of line graphs was developed in Microsoft office to display the trend
and numeric values of total cancer cases for every constituency.

26
3.5.2 Temporal prevalence
Cancer cases registered from the year 2004 to 2012 by the Eldoret Cancer Registry were
used for each constituencies. The data obtained from ECR consisted of cancer cases
registered from the year 2004 to 2012 therefore bar graphs were developed to show the
temporal variation of cancer cases for every constituency from year 2004 to 2012. These
bar graphs had different sizes according to the total number of cancer cases in each
constituency. The bar lengths depicted the number of cancer cases for each year since
2004 to 2012. The graphs were a clear indication of the trend of cancer cases through
the 8 year period. Combinations of line graphs were developed using Microsoft office to
clearly show the trend and also display the numeric values of the cases for every year in
each constituency.
Bar graphs were also developed to illustrate the temporal trend of death cases throughout
the 2004 to 2012 epoch. This was an indicator of whether they were increasing or
decreasing for each constituency.
All the pie charts and bar graphs were displayed in the base maps containing
administrative boundaries. They were placed midway in the area bounded by the
boundaries.
A large number of the cancer cases had no location. There was no way to show this on
a map but there was a temporal aspect in the data as it was also collected from the year
2004 to 2012. However bar graphs generated in Microsoft office were used to show the
trend of the unknown location cases.

27
CHAPTER FOUR: RESULTS AND DISCUSSIONS
4.1 RESULTS
4.1.1 Cancer Prevalence
a. Cancer prevalence by Spatial and Temporal distribution
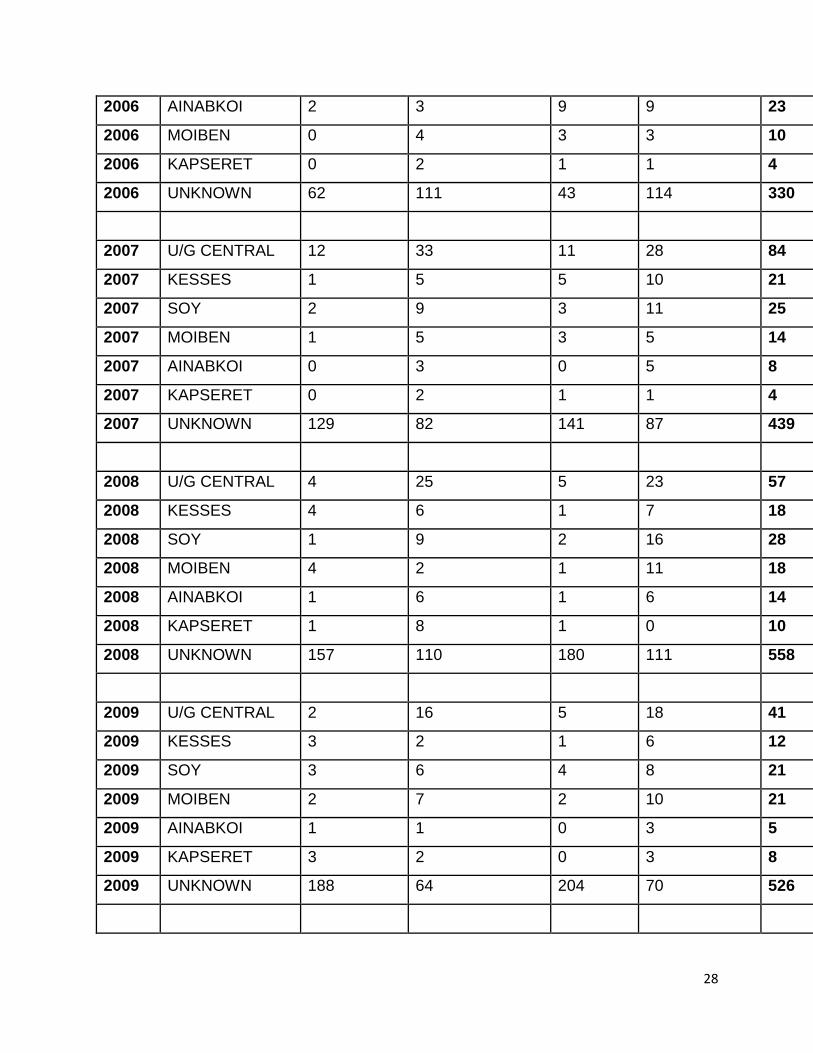
Table 4.1 Cancer cases reported in every constituency from years 2004 to 2012 in Uasin Gishu County
YEAR CONSTITUENCY
FEMALES
ALIVE
FEMALES
DECEASED
MALES
ALIVE
MALES
DECEASED TOTAL
2004 U/G CENTRAL 4 7 3 6 20
2004 KESSES 2 5 3 5 15
2004 SOY 5 5 6 3 19
2004 MOIBEN 1 2 7 1 11
2004 AINABKOI 1 3 5 3 12
2004 KAPSERET 1 5 2 1 9
2004 UNKNOWN 80 35 65 51 231
2005 U/G CENTRAL 4 15 5 17 41
2005 KESSES 6 7 3 3 19
2005 SOY 7 6 2 14 29
2005 MOIBEN 3 4 4 5 16
2005 AINABKOI 5 4 2 2 13
2005 KAPSERET 3 5 2 4 14
2005 UNKNOWN 131 93 84 70 378
2006 U/G CENTRAL 14 16 13 17 60
2006 KESSES 1 9 2 7 19
2006 SOY 8 17 9 18 52
28
2006 AINABKOI 2 3 9 9 23
2006 MOIBEN 0 4 3 3 10
2006 KAPSERET 0 2 1 1 4
2006 UNKNOWN 62 111 43 114 330
2007 U/G CENTRAL 12 33 11 28 84
2007 KESSES 1 5 5 10 21
2007 SOY 2 9 3 11 25
2007 MOIBEN 1 5 3 5 14
2007 AINABKOI 0 3 0 5 8
2007 KAPSERET 0 2 1 1 4
2007 UNKNOWN 129 82 141 87 439
2008 U/G CENTRAL 4 25 5 23 57
2008 KESSES 4 6 1 7 18
2008 SOY 1 9 2 16 28
2008 MOIBEN 4 2 1 11 18
2008 AINABKOI 1 6 1 6 14
2008 KAPSERET 1 8 1 0 10
2008 UNKNOWN 157 110 180 111 558
2009 U/G CENTRAL 2 16 5 18 41
2009 KESSES 3 2 1 6 12
2009 SOY 3 6 4 8 21
2009 MOIBEN 2 7 2 10 21
2009 AINABKOI 1 1 0 3 5
2009 KAPSERET 3 2 0 3 8
2009 UNKNOWN 188 64 204 70 526

29
2010 U/G CENTRAL 11 11 5 12 39
2010 KESSES 2 6 2 4 14
2010 SOY 2 8 2 4 16
2010 MOIBEN 1 9 1 7 18
2010 AINABKOI 1 4 0 4 9
2010 KAPSERET 2 2 4 3 11
2010 TURBO 0 0 1 1
2010 UNKNOWN 292 32 216 40 580
2011 U/G CENTRAL 21 16 10 6 53
2011 KESSES 4 3 1 4 12
2011 SOY 10 10 8 13 41
2011 MOIBEN 8 9 5 19 41
2011 AINABKOI 5 2 1 5 13
2011 KAPSERET 2 7 3 2 14
2011 TURBO 1 4 0 2 7
2011 UNKNOWN 319 41 320 33 713
2012 U/G CENTRAL 18 6 8 11 43
2012 KESSES 6 1 5 6 18
2012 SOY 7 4 7 4 22
2012 MOIBEN 8 3 1 6 18
2012 AINABKOI 6 2 1 2 11
2012 KAPSERET 7 5 4 7 23
2012 TURBO 2 4 0 2 8
2012 UNKNOWN 61 26 38 30 155
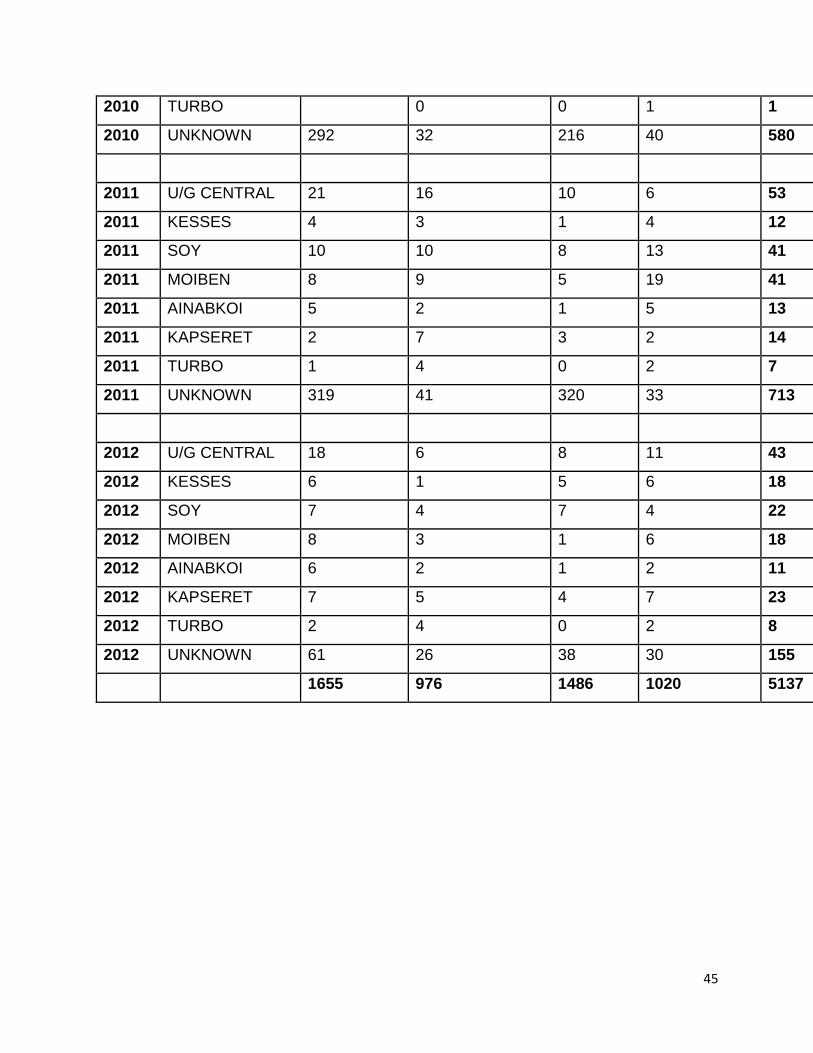
1655 976 1486 1020 5137
Table 4.1 shows the number of cancer cases reported in the six constituencies of Uasin
Gishu County (i.e Turbo, Kesses, Soy, Moiben, Ainabkoi and Kapseret) from the year
2004 to 2012. The table also contains the number of female and male cases (alive and
deceased) for each constituency during the same period.

30
4.1.2 Cancer Prevalence Analysis
Cancer trends and their spatial distribution
Fig 4.1 Cancer trends in Uasin Gishu County for years 2004 to 2012
Figure 4.1 shows the trend of total number of cancer cases for each constituency from
year 2004 to 2012. It is observed that Turbo constituency had the most cases followed
by Soy, Moiben, Kesses, Ainabkoi and finally Kapseret which had the least cases. This
may be attributed to the large population in Turbo as compared to the other constituencies
in that order.
0
10
20
30
40
50
60
70
80
90
2004 2005 2006 2007 2008 2009 2010 2011 2012
Nu
mb
er o
f ca
ses Kesses
Soy
Kapseret
Turbo
Moiben
Ainabkoi

31
Fig 4.2: spatial distribution of cancer cases – aggregated
It is observed from figure 4.2 that Turbo constituency had the most cancer cases and
Kapseret had the least.
32
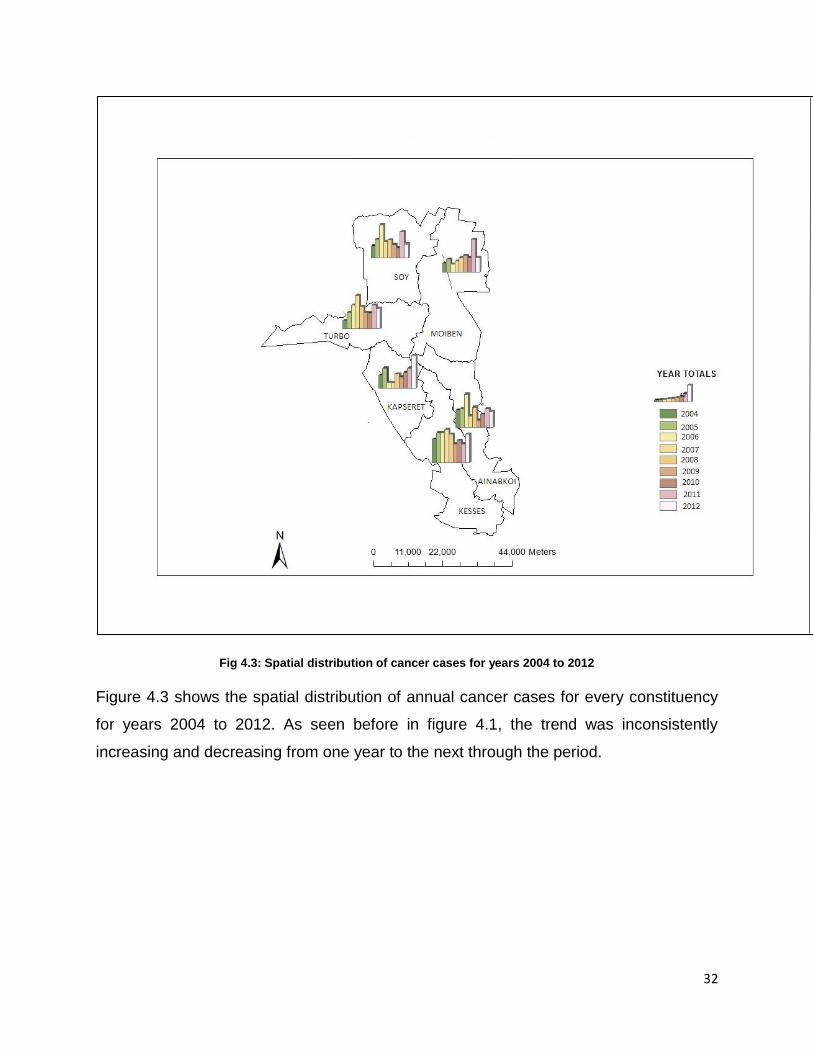
Fig 4.3: Spatial distribution of cancer cases for years 2004 to 2012
Figure 4.3 shows the spatial distribution of annual cancer cases for every constituency
for years 2004 to 2012. As seen before in figure 4.1, the trend was inconsistently
increasing and decreasing from one year to the next through the period.

33
b. Cancer Prevalence Among Gender
Fig 4.4 cancer prevalence among gender from year 2004 to 2012 in Uasin Gishu County
From figure 4.4, it was observed that there were more cancer cases corresponding
to female gender compared to male gender. However the trend is inconsistent
throughout the 2004 to 2012 period, as the cases increased and decreased from
one year to the other. There were a total of 613 female cases as compared to 600
male cases.
0
20
40
60
80
100
120
2004 2005 2006 2007 2008 2009 2010 2011 2012
Nu
mb
er o
f ca
ses
Female
Male

34
c. Ratio of Male to Female cancer cases
Fig 4.5 Ratio of male to female cancer cases in Uasin Gishu County
From figure 4.5 the ratio of male to female cases vary in every constituency. In Soy,
Moiben and Ainabkoi, there were more males suffering from cancer than females, while
in Turbo and Kapseret there were more female cases than male cases and finally in
Kesses there were equal number of male and female cases.
35
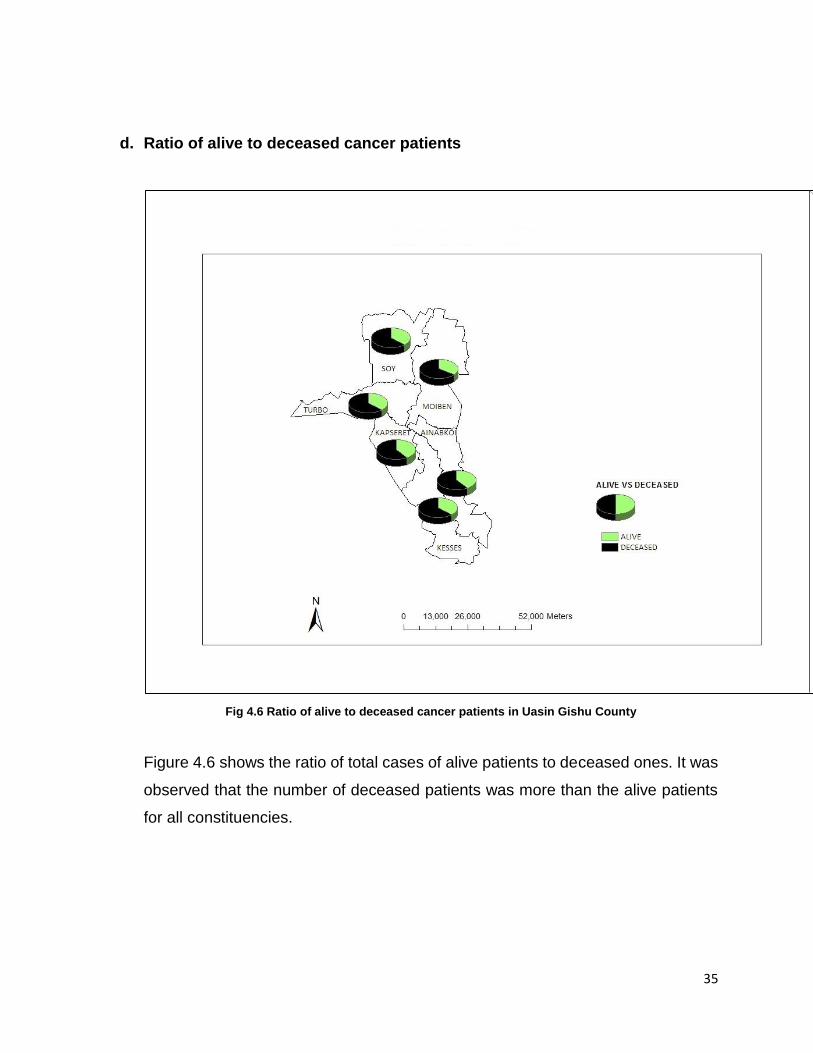
d. Ratio of alive to deceased cancer patients
Fig 4.6 Ratio of alive to deceased cancer patients in Uasin Gishu County
Figure 4.6 shows the ratio of total cases of alive patients to deceased ones. It was
observed that the number of deceased patients was more than the alive patients
for all constituencies.
36
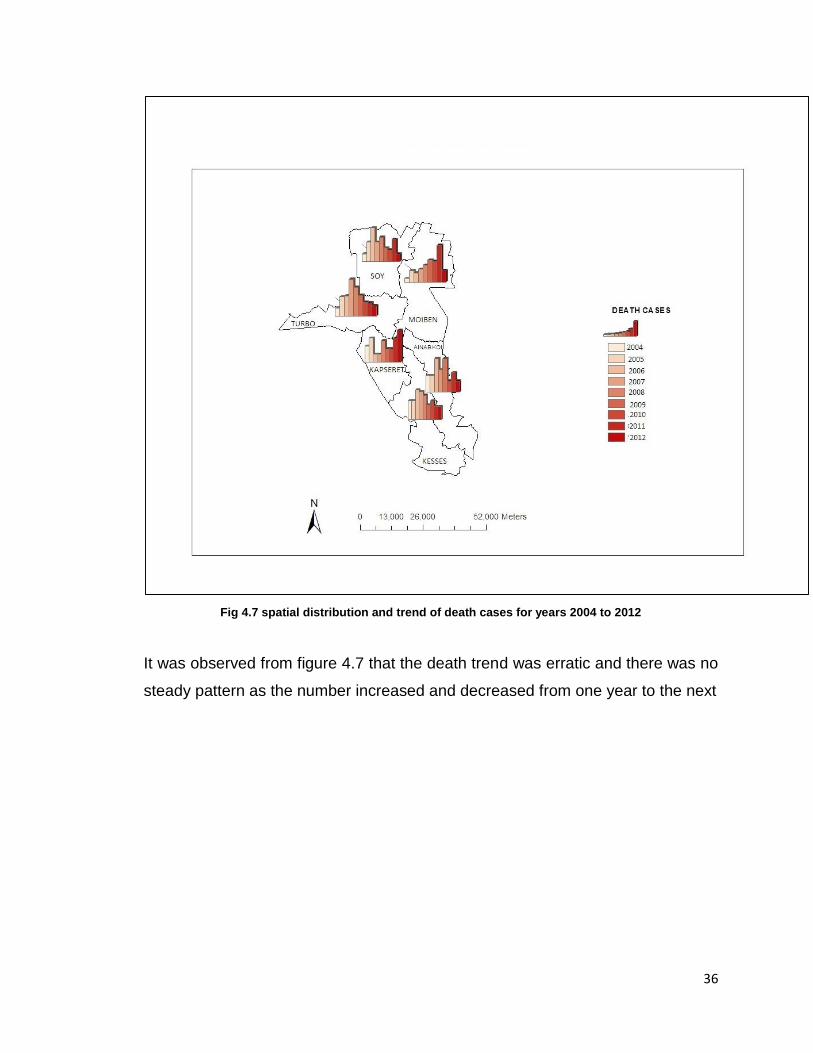
Fig 4.7 spatial distribution and trend of death cases for years 2004 to 2012
It was observed from figure 4.7 that the death trend was erratic and there was no
steady pattern as the number increased and decreased from one year to the next

37
e. Number of recorded cases whose location was unknown
Fig 4.8 number of cancer cases whose location was not known
It was observed that 3910 cases out of the total 5137 cases recorded were of unknown
location. That was more than two thirds of the total cancer cases recorded in the Eldoret
Cancer Registry were of unknown location. The number increases from the year 2004 to
2011 and reduces drastically in 2012.
0
50
100
150
200
250
300
350
400
2004 2005 2006 2007 2008 2009 2010 2011 2012
UNKNOWN LOCATION
FEMALE MALE

38
4.2 Discussions
Mapping is an important tool that portrays the trends and patterns followed by an event
or certain occurrences. In this case, cancer was mapped thus showing its occurrence in
time and space (spatial and temporal distribution). In the process, the probable causes of
cancer can be determined. Mapping thus facilitates decision making in terms of figuring
out how to deal with the cancer cases already detected and coming up with strategies to
avoid future infections.
The results above indicate an increase in cancer cases reported every year. The totals
vary between the constituencies with Turbo constituency having the most cases and
Kapseret constituency with the least cases reported. This can be attributed to the large
population in Turbo constituency as compared to the rest of the constituencies.
It was also observed that some constituencies (Soy, Moiben and Ainabkoi) had more
male cases than others (Turbo and Kapseret ) while Kesses had equal numbers of male
and female cases reported. However, the overall number of female cases reported were
more than the male cases.
The number of deaths reported every year was higher than the number of surviving
cancer patients for all the constituencies. The death trend was however erratic and there
was no steady pattern as the number increased and decreased from one year to the next.
Of particular interest, is the trend and number of reported cancer cases whose location
was not known. The number increases from the year 2004 to 2011 after which there’s a
sharp decrease in that number. There were a total of 3910 cases of unknown location out
of a total of 5137 cases recorded. This can be discusses from two perspectives, the first
being that record keeping in the Eldoret Cancer Registry was very poor, and the second
being that patients did not give their locations due to personal reasons. Both situations
result to a serious deficit and hindrance to mapping as the locations are the basis of
mapping. This made the project difficult to develop at the mapping stage. This further
results to difficulties in determining the extent to which cancer has spread and as a result
it’s difficult to mobilize resources to cater for the detected cases and more resources to
sensitize the public so as to avoid future infections. The drastic reduction in the unknown

39
location cases may be attributed to the increased sensitization of the seriousness of the
cancer situation in Kenya in the past few years.

40
CHAPTER FIVE: CONCLUSIONS AND RECOMMENDATIONS
5.1 Conclusions
The main objective of this study which was to show the spatial variation of cancer
incidence and mortality using Uasin Gishu County as a case study was achieved.
Constituencies were the units of analysis. Maps showing the spatial and temporal
distribution of cancer cases among gender were produced. More analysis was done using
map and graph combinations to show trends and patterns of cancer prevalence and the
overall cancer situation in Uasin Gishu County. Specific objectives were also achieved as
a spatial cancer database was created and applied in coming up with information to
facilitate counteracting the spread of cancer.
5.2 Recommendations
More data was required pertaining to specific cancer types, health facilities and personnel
but it was not available. Even worse, as stated in the results and discussions, large
numbers of the reported cases were of unknown location thus hindering complete
mapping of the cancer prevalence. Cancer being an epidemic and the increasing number
of cases being reported annually, it should be treated more seriously. Among the most
effective methods of dealing with an epidemic, is determining the extent of prevalence
both in time and space so as to figure out how to deal with the reported cases and even
better, prevent future cases (prevention is better than cure). This can be achieved by
mapping the spatial and temporal prevalence of cancer and therefore the following are
recommended:
41
1. Cancer Registry – cancer registries are the main source of cancer data which is
essential for mapping. The government should develop cancer registries in all
counties and employ the relevant workforce to facilitate cancer data collection.
2. Cancer mapping – since the project was successful, similar projects should be
carried out for the whole country in order to determine the extent which cancer has
spread in the country thus coming up with strategies to hinder its spread.
3. Cancer prevention – as stated ‘’prevention is better than cure’’ therefore the public
should be sensitized on the cancer situation especially in matters concerning
diagnosis, treatment and of great importance, ways by which cancer can be
avoided.

42
REFERENCES
1. Daily Nation, (2014, February 3rd). Cancer cases set to rise by half by 2030
2. ESRI, (2012). Applications of GIS to cancer research,
http://proceedings.esri.com/library/userconf/health01/papers/hc01_p01a/hc01_p0
1a.html
3. Holland, J. F. (2009). Holland-Frei cancer medicine. (8th edition) New York:
McGraw-Hill Medical.
4. Kenya Network of Cancer Organizations, (2012). Cancer statistics,
http://kenyacancernetwork.wordpress.com/kenya-cancer-facts/
5. Kleinsmith, L. J. (2006). Principles of cancer biology. Pearson Benjamin
Cummings.
6. Macmillan, (2011). Cancer information,
http://www.macmillan.org.uk/Cancerinformation/Aboutcancer/Typesofcancer.asp
x
7. Manfred S. (2008). Encyclopedia of Cancer (4 Volume Set). Berlin: Springer.
8. Marek R. (2006). Digital Recordings, Cancer – A Biophysicist’s Point of View,
http://www.cancer.gov/cancertopics/cancerlibrary/what-is-cancer
9. National Cancer Institute, (2013). What is cancer?,
http://www.cancer.gov/cancertopics/cancerlibrary/what-is-cancer
10. University of North Carolina, (2012). Cancer Research for Drug Development,
http://www.unc.edu/depts/our/hhmi/hhmi-
ft_learning_modules/cancermodule/pages/cancer.html
43
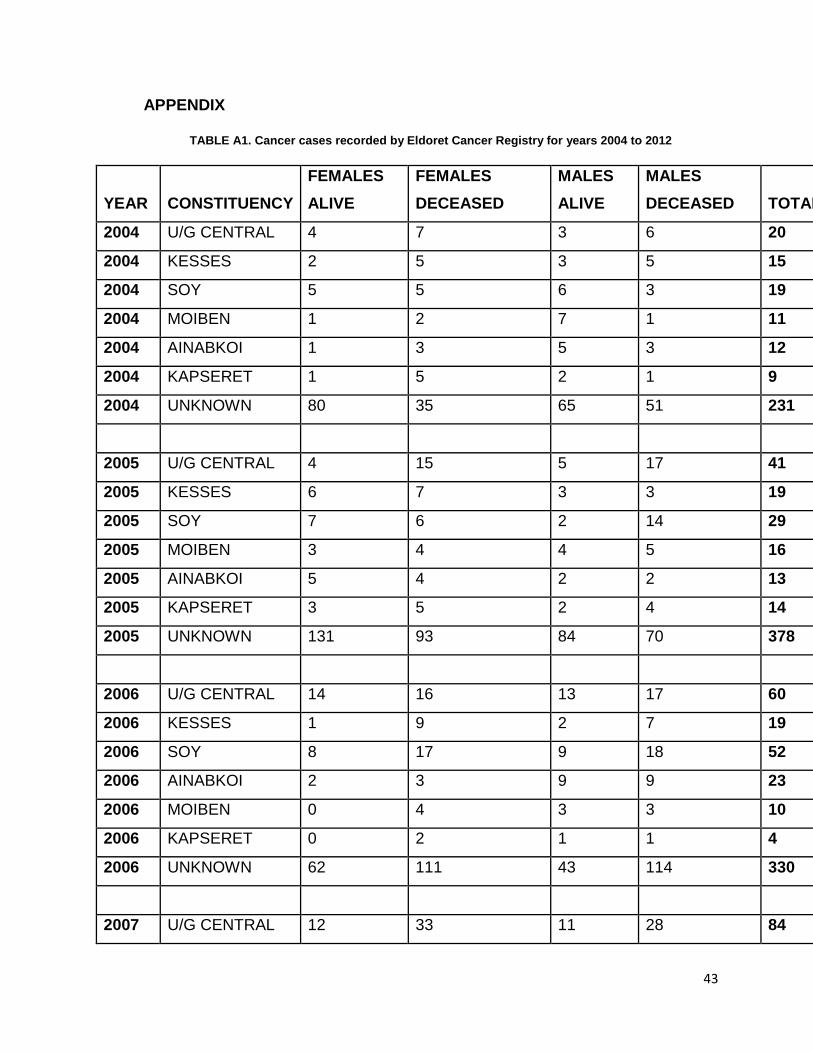
APPENDIX
TABLE A1. Cancer cases recorded by Eldoret Cancer Registry for years 2004 to 2012
YEAR CONSTITUENCY
FEMALES
ALIVE
FEMALES
DECEASED
MALES
ALIVE
MALES
DECEASED TOTAL
2004 U/G CENTRAL 4 7 3 6 20
2004 KESSES 2 5 3 5 15
2004 SOY 5 5 6 3 19
2004 MOIBEN 1 2 7 1 11
2004 AINABKOI 1 3 5 3 12
2004 KAPSERET 1 5 2 1 9
2004 UNKNOWN 80 35 65 51 231
2005 U/G CENTRAL 4 15 5 17 41
2005 KESSES 6 7 3 3 19
2005 SOY 7 6 2 14 29
2005 MOIBEN 3 4 4 5 16
2005 AINABKOI 5 4 2 2 13
2005 KAPSERET 3 5 2 4 14
2005 UNKNOWN 131 93 84 70 378
2006 U/G CENTRAL 14 16 13 17 60
2006 KESSES 1 9 2 7 19
2006 SOY 8 17 9 18 52
2006 AINABKOI 2 3 9 9 23
2006 MOIBEN 0 4 3 3 10
2006 KAPSERET 0 2 1 1 4
2006 UNKNOWN 62 111 43 114 330
2007 U/G CENTRAL 12 33 11 28 84

44
2007 KESSES 1 5 5 10 21
2007 SOY 2 9 3 11 25
2007 MOIBEN 1 5 3 5 14
2007 AINABKOI 0 3 0 5 8
2007 KAPSERET 0 2 1 1 4
2007 UNKNOWN 129 82 141 87 439
2008 U/G CENTRAL 4 25 5 23 57
2008 KESSES 4 6 1 7 18
2008 SOY 1 9 2 16 28
2008 MOIBEN 4 2 1 11 18
2008 AINABKOI 1 6 1 6 14
2008 KAPSERET 1 8 1 0 10
2008 UNKNOWN 157 110 180 111 558
2009 U/G CENTRAL 2 16 5 18 41
2009 KESSES 3 2 1 6 12
2009 SOY 3 6 4 8 21
2009 MOIBEN 2 7 2 10 21
2009 AINABKOI 1 1 0 3 5
2009 KAPSERET 3 2 0 3 8
2009 UNKNOWN 188 64 204 70 526
2010 U/G CENTRAL 11 11 5 12 39
2010 KESSES 2 6 2 4 14
2010 SOY 2 8 2 4 16
2010 MOIBEN 1 9 1 7 18
2010 AINABKOI 1 4 0 4 9
2010 KAPSERET 2 2 4 3 11
45
2010 TURBO 0 0 1 1
2010 UNKNOWN 292 32 216 40 580
2011 U/G CENTRAL 21 16 10 6 53
2011 KESSES 4 3 1 4 12
2011 SOY 10 10 8 13 41
2011 MOIBEN 8 9 5 19 41
2011 AINABKOI 5 2 1 5 13
2011 KAPSERET 2 7 3 2 14
2011 TURBO 1 4 0 2 7
2011 UNKNOWN 319 41 320 33 713
2012 U/G CENTRAL 18 6 8 11 43
2012 KESSES 6 1 5 6 18
2012 SOY 7 4 7 4 22
2012 MOIBEN 8 3 1 6 18
2012 AINABKOI 6 2 1 2 11
2012 KAPSERET 7 5 4 7 23
2012 TURBO 2 4 0 2 8
2012 UNKNOWN 61 26 38 30 155
1655 976 1486 1020 5137