university of minnesota computerized car pool system: fall ...
21
university of minnesota computerized car pool system: fall 72 analysis office of physical planning
Transcript of university of minnesota computerized car pool system: fall ...

university of minnesota computerized car pool system: fall 72 analysis
office of physical planning

university of minnesota computerized car pool system: tau· 72 analysis
office~ of physical planning
clinton n. hewitt, director david r. Iicht, assistant director
project staff
barbara I. gilbertson, planner
14 february 1973

contents
introduction fall quarter car pool statistics fall quarter follow-up questionnaire fall and winter quarter comparison summary appendix

introduction

During Fall Quarter 1972, the University began implementation of a Computerized Car Pool System. Due to time limitations, the new system received relatively little promotion and car pool application forms were distributed solely through the Minnesota Daily. In spite of these apparent drawbacks, nearly 1,000 University students, faculty and staff applied to the Car Pool System. The following report presents a summary analysis of car pool statistics compiled from the individual applications and an analysis of the results of a follow-up questionnaire sent to each Fall Quarter applicant. The report also includes a comparison between Fall and Winter Quarter application statistics.

fall quarter car pool statistics

Since individuals with varying schedules could make more than one application to the Car Pool System, several categories of statistics were developed in two forms, the first form being based on the total number of applications received and the second on the actual number of individuals who applied. Relative to University classification, statistics were developed in both forms. By comparing these two sets of statistics, it can be seen that undergraduates, by virtue of their more varied schedules, made up a larger proportion of the total applications received than of the actual number of individuals who applied. It is interesting to note that the percentage breakdown among students, faculty and staff who applied to the Car Pool System is similar to their breakdown among the total University population on the Twin Cities Campus. Approximately 78 percent of the campus population are students, while 75 percent of those who applied to the Car Pool System are students. Staff applied in slightly greater numbers than their proportion of the total population, and faculty in slightly fewer. These latter figures are consistent with recognized mode of travel patterns for faculty and staff. Faculty are more likely to travel to the University in a single occupant car, while staff tend more toward car pooling and mass trarisportation.
In addition to University classification, Fall Ouarter car pool statistics covered preferred arrival points, days of travel, travel preference, arrival and departure times, and zip code locations of applicants.
Nearly two-thirds of the applications received indicated the East Bank Campus as the preferred arrival point. This figure is similar to the data that is available re9ardinq University Express Bus stops, where Coffman Union is the most popular on-off point. An additional 16.5 percent of the applications marked West Bank for arrival, with the bulk of the remaining applications indicating the Health Sciences area and the St. Paul Campus.
Considering the large percentage of undergraduates who applied to the System and the variable nature of class schedules, it was somewhat unusual that over 42 percent of the applications received stated Monday through Friday as their days of travel. Almost one-third did mark the Monday-Wednesday-Friday category; while a somewhat lesser percentage indicated the Tuesday-Thursday category, an occurance which is consistent with class scheduling patterns.

Regarding travel preferences, there was virtually no difference in the percentage breakdown between the number of applications received and the actual number of individuals who applied. A relatively small number, less than 10 percent, witnessed a willingness to drive. However, nearly 43 percent said they would drive or ride. Here it is possible that a significant number had access to an automobile on only a limited basis. Not auite 50 percent of those who applied indicated that they wanted to ''ride only''. Although this was a substantial number, in all but about 5 percent of the cases, those individuals who said that they would drive were dispersed enough to adequately match riders with drivers.
Arrival and departure times largely paralleled Civil Service hours and class scheduling patterns. Forty seven percent of the applications received gave an arrival time between 7:30 am and 8:00 am. Those indicating 7:45 am approximated the number of staff applications received. An additional 23 percent gave arrival times between 8:30 am and 9:00 am. Nearly 80 percent of the applications stated arrival times of 9:00 am or earlier. Afternoon departures were somewhat more spread out, although 71 percent of the applications gave preferred times of 2:00 pm or later. In the case of students, this can be chiefly attributed to the fact that class schedulinq is most heavily concentrated between 9:00am and 2:00 pm. As in the morning, the number of applications indicating Civil Service hours was similar to the number of staff applications received.
Of the 100 zip codes in the Metropolitan Area, 25 zip codes accounted for nearly two-thirds of those who applied to the Car Pool System. Although one of the goals of the System is to reach those people especially who live in areas with little or no transit service, this goal was only partially realized during Fall Quarter. Among those zip codes where the majority of individual applicants resided, approximately one-half are areas with good MTC bus service or University Express Bus Service. It should be noted that no restrictions were placed on car pool participation for Fall Quarter. However, the above statistics led the Planning Office and Transit Office to urge Winter Quarter applicants in good transit service areas to patronize the buses rather than use the Car Pool System. It is likely that continuing attention will have to be given to this matter.
fall quarter follow-up questionnaire

In an effort to determine both the strengths and weaknesses of the new Car Pool System, a follow-up auestionnaire was sent to each Fall Quarter applicant. (See appendix). Slightly more than 15 percent of the questionnaires were returned. Although this was considered a respectable return, it must not be looked at as a necessarily representative response. In light of this fact, the questionnaire results will be presented in somewhat general terms, concentrating more on the applicant's comments.
Among those who returned the questionnaires, one-third said that they were participating in a Car Pool formed through the University System, while two-thirds indicated that they were not. Of those who were not participating, approximately 26 percent had either formed their own car pool before they received their matches from the University or were unable to particir;ate due to schedule changes, moving, etc. Two respondents stated that they had not contacted any of their natches. Although a substantial number did not indicate whether or not they would reapply to the System Winter Quarter, nearly 40 percent of the respondents did state that they would reapply.
From a composite point of view, the majority of those individuals who were participat1ng in the Car Pool System were either very satisfiE·d or satisfied with their matches, parked in a University lot other than the car pool lot, paid a set fee to the driver, did not alternate drivers, and did not ride with the same people in the afternoon as in the morning. Approximately 34 percent had driven alone previously, while 37 percent had riden a local MTC bus or the University Express Bus. The average size of a car pool formed throuqh the System was 2.58 persons. Two-thirds of the participants said they would reapply Winter Quarter and the remaining one-third said they either did no~ need to reapply or would stay in the same car pool.
Perhaps the most beneficial result of the follow-up questionnaire were the comments and suggestions made by the respondents. A number of these suggestions were incorporated into the matching process for Winter Quarter. For example, several people suggested collapsing the East Bank and West Bank into a single destination - East Bank. This was done Winter Quarter when no satisfactory matches could be made for applicants desiring to go to West Bank. In addition, when it proved more beneficial to the applicants, an anticipated route of travel approach was used as the basis for matching. These two changes alone helped to limit the number of matches which Fall nuarter applicants considered 11 out of their way 11
• In several cases, it also helped limit the number of matches which did not take into account natural or man-made barriers.

Relative to arrival and departure times, several respondents suggested larger time groupings, especially in the morning. Since a greater emphasis was placed on the applicant's residence location during Winter Quarter matching, a corresponding increase in time groupings resulted. For those individuals Fall Quarter who did witness a high degree of schedule inflexibility, it was hoped that better origin matching would offset the somewhat greater variations in arrival and departure times.
In addition to the many comments lauding the initiation of a Car Pool System, several respondents suggested that more information on the System be printed in the Minnesota Daily. According to several car pool studies, good public information and promotion are necessary to the success of any Car Pool System. In an effort to make the University community more aware of the new service, the Planning Office and the Transit Office have solicited Daily coverage on the System. However, a mass advertising campaign has not as yet been developed. When the sophisticated program becomes operational, promotion will necessarily become an integral part of the Car Pool System.

fall and winter quarter comparison

The number of individuals who applied to the Car Pool System for Winter Quarter exceeded the Fall Quarter figure by 4Q percent. An additional 200 some individuals submitted aoplications after the announced deadline and after the aoplications had been sent to Data Processing for sorting.
There was very little variation in the breakdown by University classification between Fall and lvinter Quarter. A slightly lower percentage of students applied Winter Ouarter with a corresponding slight increase among faculty and staff. East Bank remained the most popular destination point, while the percentage of those applications indicating the other srec1fied destinations stayed about the same.
A marked percentage change was noted relative to days of travel. 42.4 percent of the Fall Quarter applications i1dicated Monday through Friday as preferred days of travel. Winter Quarter, 56.8 percent indicated the MJnday throuqh Friday category. Only a portion of this increase can be accounted for by the increase in the number of faculty and staff applications. Since scheduling r~tterns are largely the same for both auarters, the rest of the increase can probably be attributed to students w~o checked five days of travel per week in anticipation of gaining more and better matches.
Another significant variation between Fall and Winter Quarter statistics concerned travel preferences. Althouoh a slightly higher percentage of Winter Ouarter annlicants witnessed a willingness to drive, fewer checked the drive or ride cateqory, while a substantially greater percentaqe indicated "r·ide only". This qeneral shift away from driving during Winter Ouarter is most likely a factor of the weather. It has been established that during the winter months people are more hesitant about driving per se and less confident about the reliability of their automobiles.
With reference to arrival and departure times, Winter Quarter statistics were basically similar to Fall Ouarter. Times largely paralleled Civil Service hours and class patterns. Nearly 80 percent of the applications stated arrival times of 9:00 a.m. or earlier. In the afternoon, however, there was a slight shift toward later depar~ure times. Whereas 71 percent indicated departu}e times of 2:00p.m. or later Fall Quarter, over 77 pPrcent fell into this category Winter Quarter. The increase here can probably be attributed to the increase in the number of faculty and staff applications.

The distribution of Winter Quarter car pool applicants by zip code was similar to that experienced Fall Quarter. That is, one quarter of the zip codes in the Metropolitan Area accounted for nearly two-thirds of those who anplied to the System. The disturbing factor was the increase in the number of applicants who live in neighborhoods adjacent to the Universi~y. As mr.ntioned previously, a letter was attached to all Winter Ouarter matches, informing applicants that for some pr.ople the University had noted that the Express Bus System or the local MTC bus system provides service at least as beneficial, if not better than the Car Pool System. These people were urged to patronize the buses.

summary

During the two quarters the Computerized Car Pool System has been in operation, people who have applied have exhibited travel behavior characteristics very similar to those previously identified in the Inventor of Trans ortation (part of the St. Paul Campus Master Plan and the University Express Bus System Reports. For example, car pooling and mass transit appeal more to students and Civil Service staff than to faculty. Staff, almost without exception, want to arrive and depart from Campus at 7:45 a.m. and 4:30p.m., respectively. Although student schedules vary significantly, students generally want to arrive on campus between 8:00 a.m. and 9:00 a.m. and leave between 2:00 p.m. and 4:00 p.m. By far the greatest majority of commuters have an East Bank destination point.
The proportionately large number of individuals who were seeking rides through the Car Pool System is consistent with car ownership data found in the Inventor* of Transportation. Furthermore, the zip codes w ere the greatest concentration of car pool arplicants were found are areas that have been identified as having a high University student, faculty and staff population.
Relative to the applicants who live in good transit service areas, it is not unusual for people to seek a more personalized mode of transportation than public transportation offers. However, it is the feeling of the University that the Car Pool System should concentrate on reaching commuters in outlying areas where the residential density is such that bus service cannot be economically provided.
As stated in one car pool study, "Large employment areas should be able to support both car pool and bus pool concepts simultaneously". The University•s relatively unique position of being both a large employer and a commuter school, reinforces this possibility. Moreover, on the basis of car pool results up to the present, it emphasizes the fact that policies must be developed regarding each concept. Questions such as 11 Who should be using the Car Pool System and who should be patronizing the Express Bus System 11 must be dealt with by the University administration if both concepts are to be successful.
Since the Car Pool System is in an interim stage, with a sophisticated program yet to be developed, the response to date can only be considered positive and many of the operational problems temDorary.

appendix
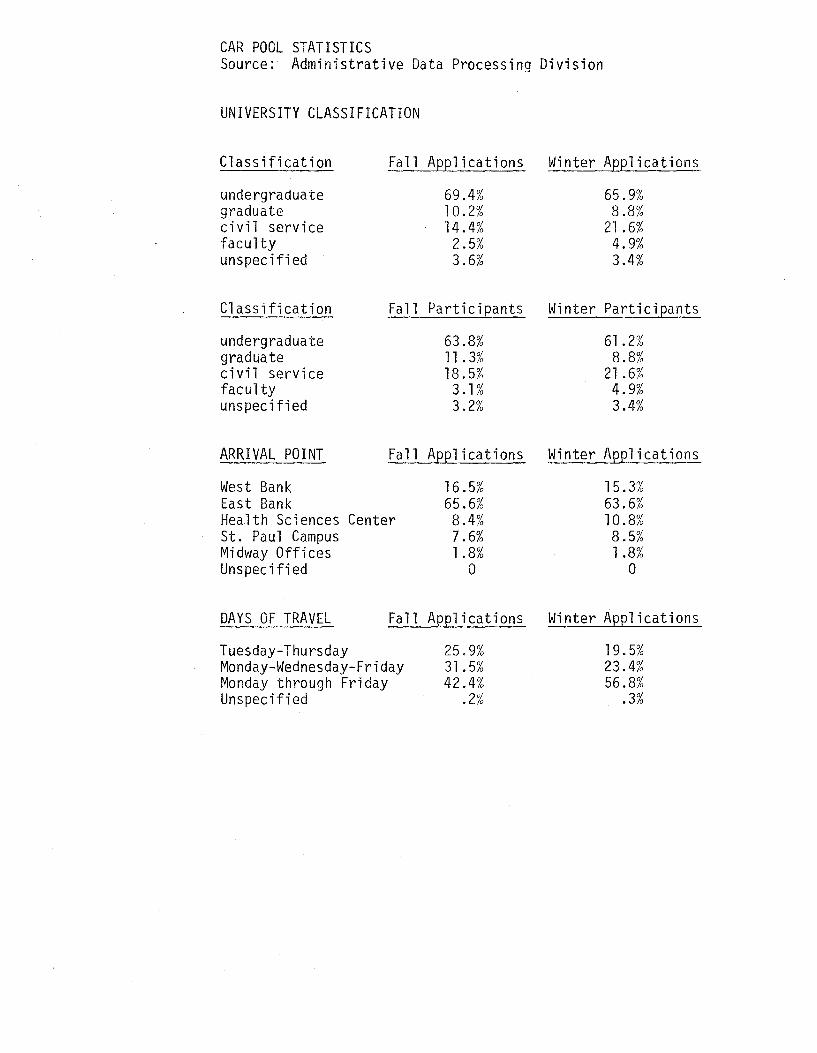
CAR POOL STATISTICS Source: Administrative Data Processing Division
UNIVERSITY CLASSIFICATION
Classification Fa 11 Applications Winter Applications
undergraduate 69.4% 65.9% graduate 10.2% 8.8% civil service 14.4% 21 .6% faculty 2.5% 4.9% unspecified 3.6% 3.4%
Classification Fall Participants Winter Participants
undergraduate 63.8% 61 .2% graduate 11 . 3% 8.8% civil service 18.5% 21 .6% faculty 3 .l% 4.9% unspecified 3.2% 3.4%
ARRIVAL POINT Fall Applications Winter Applications
West Bank 16.5% 15.3% East Bank 65.6% 63.6% Health Sciences Center 8.4% l 0.8% St. Paul Campus 7.6% 8.5% Midway Offices 1.8% 1.8% Unspecified 0 0
DAYS OF TRAVEL Fall Applications Winter Applications
Tuesday-Thursday 25.9% 19.5% Monday-Wednesday-Friday 31.5% 23.4% Monday through Friday 42.4% 56.8% Unspecified .2% .3%
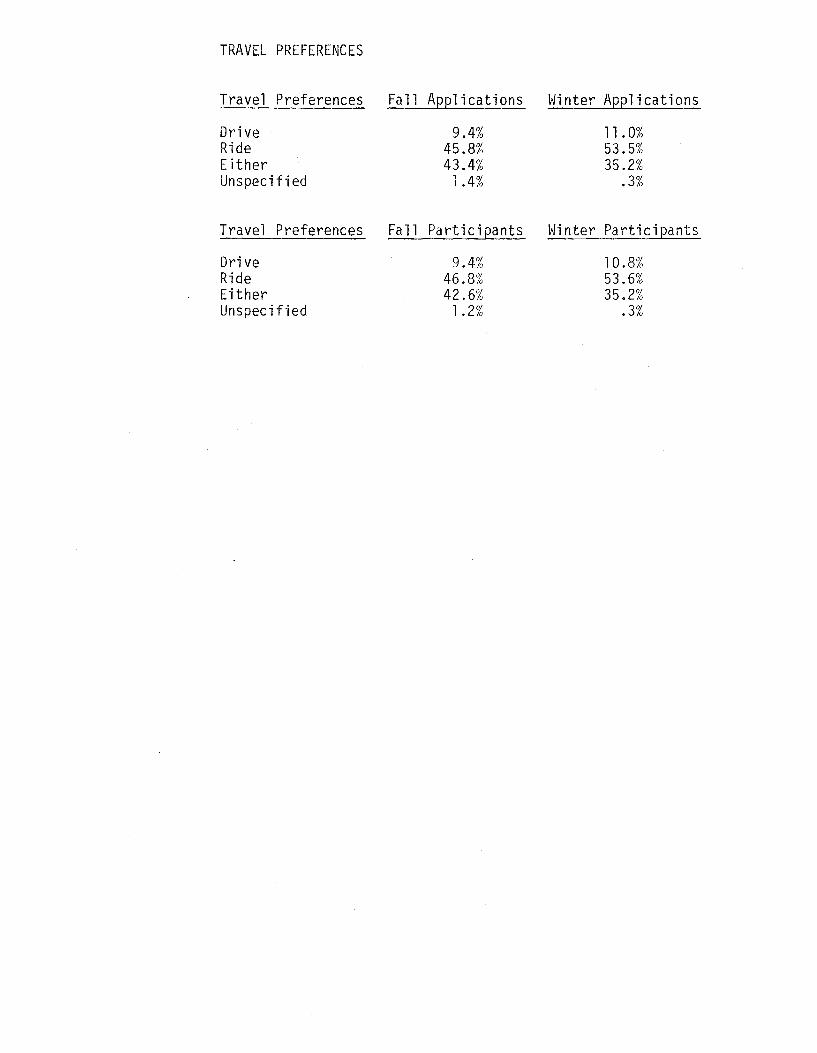
TRAVEL PREFERENCES
Travel Preferences Fall Applications Winter Applications
Drive 9.4% ll. 0% Ride 45.8% 53.5% Either 43.4% 35.2% Unspecified 1.4% .3%
Travel Preferences Fall Participants Winter Participants
Drive 9.4% 10.8% Ride 46.8% 53.6% Either 42.6% 35.2% Unspecified 1.2% .3%

TIMES APPLIED FOR
Arrive Fall Applications Winter Applications
6:00 .2% .3% 6:30 .5% .6% 7:00 2.1% 3.0% 7:15 2.3% l. 5% 7:30 10.6% 10.1% 7:45 16.2% 15.1% 8:00 20.2% 20.8% 8:15 2. l% 1. 9% 8:30 4.4% 4.1% 8:45 6.7% 4.7% 9:00 12.9% 14.5% 9:15 .6% 1.5% 9:30 2.3% 2".8% 9:45 2.3% 1.8%
10:00 6.6% 6.5% 10:30 l. 3% l.O% 11:00 6.5% 6.0% unspec. 2.3% 3.8%
Leave Fall Applications Winter Applications
l 0:00 1.3% .8% 10:30 .6% .3% 11 :00 2.7% l. 7% ll: 30 1.5% 1.0% 12:00 5.8% 7.4% 12:30 3.9% 3.4% 1:00 7.1% 6.2% l: 30 3.5% 1.8% 2:00 7.5% 9.0% 2:30 4.9% 3.9% 3:00 10.3% l 0.2% 3:30 5.4% 4.6% 4:00 l 0.1% 7.9% 4:30 17.7% 19.5% 5:00 8.3% 10.2% 5:30 3.9% 5.0% 6:00 3.9% 2.3% unspec. 2.5% 4.8%

10 November 1972
Dear University Car Pooler:
Please complete the following questionnaire and return it through the Campus Mail to: Office of Physical Planning
503 Morrill Hall Minneapolis Campus
QUESTIONNAIRE
1. What is your designation within the University? undergraduate student
___ graduate student faculty staff
2. Are you currently in a car pool formed through the computerized Car Pool System? ___ yes
no If you answered Yes to question #2, please answer the following:
3. How did you get to the University before you joined the Car Pool System? drove a 1 one rode the bus rode the Express Bus
----- other {please state) ---------------------------------------------4. To what degree were you satisfied with your matches?
___ Very satisfied Satisfied Dissatisfied Very Dissatisfied
5. Where does your car pool park? University Lot #33 (car pool lot) Another University Lot (identify street or building location) A private lot (identify street or building location) -----------Park on the Street (identify street location) ___________ _ Other (please state) -------------------------------------------
6. How many people, including yourself, are participating in your car pool on a regular basis? (circle one)
2 3 4 5 6 More than 6
7. How are car pool costs shared? The riders pay for both gas and parking The driver pays for both gas and parking The riders pay for parking, the driver for gas The driver pays for parking, the riders pay for gas The riders each pay a set fee The driver for the day pays all expenses, and the members of the car pool take turns driving
8. Does your car pool alternate drivers? yes no
9. Do you ride with the same people in the afternoon as in the morning? yes no
10. Do you intend to reapply next quarter? I was satisfied this quarter and will reapply I was satisfied this quarter, but do not need to reapply I was satisfied this quarter and will stay in the same car pool I was not satisfied this quarter, but will reapply I was not satisfied this quarter and will not reapply
11. Please write any comments you may have on the back of this questionnaire.