University of London Imperial College of Science, Technology & … · 2017. 6. 19. · EVANGELOS...
277
University of London Imperial College of Science, Technology & Medicine THE LARGE DEFLECTION BEHAVIOUR OF STIFFENED DECKS UNDER LATERAL PATCH LOADING by EVANGELOS PANTELIS VASSILIKOS A thesis submitted for the degree of Doctor of Philoshophy in the Faculty of Engineering of the University of London Engineering Structures Section Department of Civil Engineering May 1990
Transcript of University of London Imperial College of Science, Technology & … · 2017. 6. 19. · EVANGELOS...

University of London
Imperial College of Science, Technology & Medicine
T H E L A R G E DEFLECTION BEHAVIOUR O F
STIFFENED DECKS U N D E R LATERAL P A TCH LOADING
by
EVANGELOS PANTELIS VASSILIKOS
A t h e s i s s u b m i t t e d f o r the degree o f Doctor o f P h i loshophy
in the F a c u l t y o f E n g in e e r in g o f the U n i v e r s i t y o f London
E n g in e e r in g S t r u c t u r e s S e c t i o n
Department o f C i v i l E n g in e e r in g
May 1990

To my parents and Theodora

3
ABSTRACT
The large deflection behaviour of stiffened decks under lateral patch loading is
studied by means of numerical and experimental methods. The behaviour of a bay
forming part of a multi-bay assembly is investigated by studying two limiting
cases; one bay fully restrained against rotation and in-plane movement at the
supports, and another bay simply supported and free to draw-in.
Initially, the restrained deck is studied numerically and as a consequence the main
actions are identified. The deck is then represented as a series of axially
restrained beams subjected to two idealized loading patterns. First, the response of
axially restrained beams on an elastic foundation to centrally applied loading is
studied. A second analysis enables the prediction of the behaviour of axially
restrained beams under symmetric distributed loading to be made. Comparisons
between analytical and numerical results for both beam studies show very good
agreement. As a result of these studies, simple bilinear mechanisms are proposed
for use in the analysis of stiffened decks restrained against pull-in. Finally, the
mathematical formulation of a proposed model for the restrained deck is
presented, and its predictions again compare favourably with numerically generated
results.
Next, the behaviour of three simply supported and free to draw-in decks is
studied. For the first deck experimental evidence is used to validate the finite
element modelling. Numerical results from all three decks are used to study the
importance of membrane action and to propose a suitable model. Subsequently, the
proposed model is presented analytically and its predictions show good correlation
with the numerical results.
The analyses presented, can be used to calculate the ultimate limit state and
energy absorption capacity of stiffened decks subjected to patch loading.

4
ACKNOWLEDGEMENTS
This work was carried out under the supervision of Prof. P. J . Dowling and Dr
B. F. Ronalds. Their great help, expert advice, encouragement and arrangement of
funding are deeply and sincerely appreciated.
The financial support of the State Scholarships Foundation of Greece and the
Marine Technology Directorate of the Science and Engineering Research Council
are gratefully acknowledged.
The author wishes to acknowledge the assistance of Dr D. Bates and Dr B.
Burgan in using the finite element program FIN AS.
My thanks go also to Dr C. Poggi for the fruitful discussions we had.
I am indebted to all my colleagues and friends in the Department of Civil
Engineering at Imperial College for many discussions and arguments. In particular,
I should like to mention Dr W. Aritenang, Dr P. Davidson, Dr L. Simoes da
Silva, Mr G. Stanway and Mr H. Subbarao.
The effort of the Civil Engineering Library staff in tracking down many of the
references is also appreciated.
Life at Imperial would not have been quite so enjoyable without the laboratory's
Supervisor Mr J. Neale. Many thanks Jack.
Last but not least my thanks go to my wife Theodora for being a constant source
of support and encouragement; words of thanks to her are quite inadequate.

NO TATIO N
A cross-sectional area of a beam
a distance of the spreading hinge tip from the support
a 0 value for a when y 0(L) is a minimum
b stiffener spacing
b jj+ i spacing between stiffeners j and j+1
B, coefficient defined by Eqn. (5.19)
B 2 coefficient defined by Eqn. (5.19)
C coefficient used in Eqn. (4.7)
Zp .C q - ( — ) (C®fi + ( X - l ) C ^ ) , fo r C - 2 , 3 , 4
AL
C q coefficients C q modified according to Eqn. (4.10) (G=l, 2, 3, 4)
1 ac = ( i + _ ) _y
1 u Er i
C 0 q coefficients used in Eqn. (4.3) (£=2, 3, 4)
C 5(a) coefficient defined by Eqn. (C.3)
C q coefficients defined by Eqn. (5.12) (G=2, 3, 4)
D coefficient used in Eqn. (6.3)
D j j +i coefficients used in Eqns (6.1) and (6.2)
D 3 coeffifient used in Eqn. (8.3)
D 4 coefficient used in Eqn. (8.5)
E elastic modulus
e total extension of a beam centroidal axis
F coefficient defined by Eqn. (5.8)
f (x) mode-shape
f'(x) df(x)/dx
H, h depth of a rectangular cross-section
k axial spring stiffness
k Q initial stiffness at the centre of the beam for a given loading pattern
kg elastic foundation stiffness
L half-span length of a beam/deck
Q dummy index

6
M bending momentm non-dimensionalized bending moment = M / M 0M 0 plastic moment (=OyZp)Mx transverse bending stress resultant in the plateM x 0 Mx plastic value (=(Tyt /4)M y longitudinal bending stress resultant in the plateM y 0 My plastic value (=<jyt /4)N horizontal component of axial forcen non-dimensionalized horizontal component of axial force = N/N0N 0 squash load (=OyA)Nx transverse membrane stress resultant in the plateN x 0 Nx plastic value (=Oyt)Nxy membrane shear stress resultant in the plateNxy0 Nxy plastic value (=o'yt/</3)Ny longitudinal membrane stress resultant in the plateNy0 Ny plastic value (=<Tyt)P concentrated or total patch loadP 0 limit load causing plastic collapse of a beam in bendingQ shear force in a beamq characteristic distributed load intensityq distributed load intensityQ 0 Q plastic value {=UyAJ y3)q0 characteristic distributed load intensity at limit loadRf reduction factor given by Eqn. (B.8)s arc lengtht plate thicknessx beam longitudinal coordinate measured from supportXy value of x, corresponding to the current y value, defined in Section
B.2y distance from the transverse support as shown in Fig. 3.19(a)y(x) lateral deflection at xy0(L) generalized deflection of segment following the mode-shape f(x)y 0( x ) = y 0 ( L ) f (x )Zp plastic modulusz distance between the instantaneous centre of rotation and the centroidal
axis

7
«i
<*2
“ j . j+ 10
01
02
y
Tx
a
5* 1f2(y)
5C
53
5cx
5jcr
r
QX
Mi
f*2Pcr
(Ty
<p* i>
coefficient used in Eqn. (4.11) coefficient used in Eqn. (C.5)angle of inclination for a transverse plate strip shown in Fig. 3.23 = t/bpatch load half-width non-dimensionalized with respect to the beamspacingplate strip half-width non-dimensionalized with respect to the beamspacingscalar denoting the horizontal projection of the elastic segment of abeam on an elastic foundation, expressed as a fraction of L value of y when the deflection at x ceases to increase, defined in Section B.2elastic pull-in at the supports deflection at x = adifferential deflection between stiffeners 1 and 2 at y central deflectionthreshold central deflection for a beam on an elastic foundation central deflection in a beam on an elastic foundation at which thedeflection at x stops increasing central deflection for stiffener jcentral deflection for stiffener j when a plastic mechanism in stiffener j+1 is formedscalar denoting the vertical projection of the elastic segment of a beam on an elastic foundation, expressed as a fraction of the central deflection 5C = nj/n,slope at supportsdenotes support conditions; X = 1, 2 for pinned and clamped supports respectively
k L
E A
scalar characteristic of the applied load pattern, used in Eqn. (5.1)load factor (=P/P0)stressyield stress defined in Fig. 6.5
8
Superscripts
ehi1
Pst
elastichoggingdenotes sign of the bending moment (i = s, h)longitudinalplasticsaggingtransverse
Subscript
c centralcr criticalf flangeI initialj index used to identify a particular beamw web
Abbreviations
BEF Beam on an elastic foundationFE Finite element
9
CO NTENTS
ABSTRACT 3
ACKNOWLEDGEMENTS 4
NOTATION 5
CHAPTER 1: INTRODUCTION
1.1 Background 18
1.2 Scope 19
1.3 Layout of the thes is 19
CHAPTER 2: REVIEW OF THE LITERATURE
2.1 Introduction 21
2.2 Unstiffened p lates and beams under la te ra l loading 212.2.1 Evolution of the e la s to -p la s t i c methods 212.2.2 Rigid-plast ic methods 232.2.3 Experimental work on beams under uniform loading 26
2.3 Stiffened plat ing under la te ra l loading 27
2.4 Stiffened p la t ing under combined la te ra l and in-planeloading 29
2.4.1 Combined compression and la te ra l pressure loading 292.4.2 Combined compression and la tera l patch loading 31
2.5 Concluding remarks 31

10
CHAPTER 3: BEHAVIOUR OF STIFFENED DECKS RESTRAINED AGAINSTPULL-IN
3.1 Introduction 33
3.2 Model geometry 33
3.3 Numerical analysis 343.3.1 Description of the f in i t e element program 343.3.2 Description of the elements used 35
3.3.2.1 Shell element 353.3 .2 .2 Beam element 363.3 .2 .3 The bond-slip element 36
3.3.3 Mesh convergence study 36
3.4 Loading 37
3.5 Observed behaviour 383.5.1 St i f fener deflections 383.5.2 Stress resu l tan ts in the plate 38
3.5 .2 .1 Transverse membrane forces 393.5 .2 .2 Longitudinal membrane forces 393.5 .2 .3 Membrane shear forces 403.5 .2 .4 Transverse bending moments 403.5 .2 .5 Longitudinal bending moments 413.5 .2 .6 Transverse shears 41
3.5.3 Stress resu l tan ts in the beams 413.5 .3 .1 Axial forces 413.5 .3 .2 Bending moments 42
3.5.4 Discussion of the observed behaviour 43
3.6 Proposed simple model for fu l ly restained longitudinallys t i f fened deck 44
3.6.1 Behaviour of the plate between s t i f f e n e r s 443.6 .1 .1 Loading applied along the s t i f f e n e r 463.6 .1 .2 Loading along a s t i f f en e r with increasing
deflect ion 463.6 .1 .3 Plate reaction on the s t i f f en e r s 47

3.6.2 Bilinear mechanism assumption 483.6.2.1 Effect on the axial forces in the beams 483.6 .2 .2 Effect on the loading along the beams 48
3.6.3 In teract ion between the s t re ss resu l tan ts in the'notional beams' 49
3.6.4 Structural elements in the longitudinal d i rec t ion 503.6.4.1 S t i f feners with external ly applied load 503.6 .4 .2 St i f feners not external ly loaded 51
3.7 Conclusions 51
Table 3.1 52
Figures 3.1 - 3.25 53
CHAPTER 4: AXIALLY RESTRAINED BEAMS ON AN ELASTIC FOUNDATION
4.1 Introduction 78
4.2 Choice of the geometry 78
4.3 Numerical analysis 79
4.4 Analytical model 804.4.1 Assumptions 804.4.2 Compatibility equation 804.4.3 Equilibrium equation 85
4.5 Comparison between analytical and numerical r e su l ts 854.5.1 Applied load versus central deflect ion 864.5.2 Axial force along the beams 86
4.6 Deflected shape p lots 87
4.7 Determining the spreading of the curved segment 88
4.8 Results from the modified compatibili ty equations 89
4.9 Use of non-linear mode-shape in the equilibrium equation 90
12
4.10 Spreading of the support hinge 91
4.11 Conclusions 92
Tables 4.1 - 4.4 94
Figures 4.1 - 4.21 96
CHAPTER 5: AXIALLY RESTRAINED BEAMS UNDER SYMMETRIC DISTRIBUTEDLOADING
5.1 Introduction 116
5.2 General assumptions 116
5.3 Mode-shape choice 117
5.4 Analysis of spreading hinge phase 1185.4.1 Geometry 1185.4.2 Normality 1205.4.3 Compatibility 1215.4.4 Equilibrium 1215.4.5 Solution 1225.4.6 Remarks 122
5.5 Analysis of membrane phase 123
5.6 Numerical analysis 1245.6.1 Choice of element type 1245.6.2 Mesh-refinement study 125
5.7 Comparison of the d ifferent predictions and f i n i t eelement resu l ts 126
5.7.1 Uniform loading 1265.7.1.1 Beams with pinned supports 1265.7 .1 .2 Beams with fixed supports 127
5.7.2 Triangular load 128
5 .8 Development o f p l a s t i c i t y 128
5.9 Bending moment d i s t r ib u t io n 129
5.10 Simplified mode of deformation 130
5.11 Material rupture 131
5.12 Conclusions 132
Figures 5.1 - 5.16 134
CHAPTER 6: ANALYTICAL MODEL FOR STIFFENED DECKS RESTRAINEDAGAINST PULL-IN
6.1 Introduction 151
6.2 Development of analytical model 1526.2.1 Assumptions 1526.2.2 Compatibility equations 1526.2.3 Equilibrium equations 153
6.2.3.1 Directly loaded beams 1536.2 .3 .2 Indirec t ly loaded beams 1546.2.3 .3 Further considerations 154
6.2.4 I n i t i a t io n of mechanism in ind irec t ly loaded beams 1566.2.5 Method of solution 156
6.3 F i rs t simplif ied method of analysis 157
6.4 Second simplif ied method of analysis 158
6.5 Comparison of analytical and numerical r e su l ts 1596.5.1 Load-deflection predictions 1596.5.2 Adjacent s t i f f e n e r deflections 1606.5.3 Axial forces in the s t i f f e n e r s 160
6.6 Model implementation using f i n i t e elements 161
6.7 Comparisons with other deck geometries 162

14
6.8 Conclusions 163
Figures 6.1 - 6.13 165
CHAPTER 7: BEHAVIOUR OF UNRESTRAINED STIFFENED DECKS UNDERPATCH LOADING
7.1 Introduction 182
7.2 Analysis of deck S2 1827.2.1 Geometric d e ta i l s of the model 1837.2.2 Fini te element modelling 1847.2.3 Loading 1857.2.4 Comparison of experimental and numerical r e su l ts 185
7.2 .4 .1 Load h is to r ie s of the s t i f f e n e r central deflections 1857.2 .4 .2 Relative s t i f f e n e r deflections 1867.2.4.3 Transverse membrane act ion in the p la te 1867.2 .4 .4 Transverse bending moments 1867.2.4.5 Bending moments in the beams 1877.2 .4 .6 Axial forces in the beams 1877.2.4 .7 In teract ion between the s t re ss resu l tan ts in the
•notional beams' 1877.2.5 Discussion 188
7.3 The influence of bay aspect r a t io on membrane action 1887.3.1 Geometries analysed 1887.3.2 Deck SI 189
7.3.2.1 Transverse membrane act ion in the p la te 1897.3 .2 .2 Transverse bending moments in the p la te 1907.3.2.3 Bending moments in the 'notional beams' 1907.3 .2 .4 Axial forces in the 'notional beams' 1907.3.2 .5 In teract ion between s t re ss resu l tan ts in the
'notional beams' 1917.3 .2 .6 Contribution of s t i f f en e r s to the to ta l s trength 191
7.3.3 Deck S3 193
7.4 The d is t r ib u t io n of axial forces in the 'notional beams' 1947.4.1 Axial force in the loaded beam 194

7 . 4 . 2 Axial f o r c e in the o t h e r beams 195
7 . 4 . 3 G e o m e t r i c a l l y n o n - l i n e a r e l a s t i c a n a l y s i s 196
7 . 4 . 4 In - p l a n e a n a l y s i s 196
7 .5 C onc lus ions 196
T ab les 7 .1 - 7 .3 198
F ig u re s 7 .1 - 7 .26 200
CHAPTER 8: ANALYTICAL MODEL FOR UNRESTRAINED STIFFENED DECKS
8.1 I n t r o d u c t i o n 230
8 .2 Proposed model 230
8 .3 Development o f a n a l y t i c a l model 231
8 . 3 .1 Assumptions 231
8 . 3 . 2 E q u i l i b r i u m e q u a t io n s 231
8 . 3 . 2 . 1 E q u i l i b r i u m o f th e loaded s t i f f e n e r 231
8 . 3 . 2 . 2 E q u i l i b r i u m o f a s t i f f e n e r away from th e load 232
8 . 3 . 2 . 3 Las t s t i f f e n e r in the model 233
8 . 3 . 2 . 4 S o l u t i o n o f th e govern ing e q u a t io n s 234
8 . 3 . 3 P r e d i c t i o n o f f o r c e s in the beams 234
8 .4 Comparison o f the a n a l y s i s w i th numerica l r e s u l t s 235
8 . 4 .1 Load v e r s u s d e f l e c t i o n o f the loaded s t i f f e n e r 235
8 . 4 . 1 . 1 The i n f l u e n c e o f p l a t e e f f e c t i v e w id th 235
8 . 4 . 1 . 2 The in f l u e n c e o f the assumed membrane fo r c e
d i s t r i b u t i o n 236
8 . 4 . 2 R e l a t i v e s t i f f e n e r d e f l e c t i o n s 237
8 .5 Remarks on th e range o f a p p l i c a b i l i t y o f the p roposed model 238
8 .6 Development o f a s i m p l i f i e d a n a l y t i c a l model 239
8 . 6 .1 M o d i f i c a t i o n o f th e p r e c e d in g a n a l y s i s 239
8 . 6 . 2 D i s c u s s i o n o f the r e s u l t s 240

16
8.7 L i m i t a t i o n s due to a l lo w a b le s t r a i n s 241
8 .8 C onc lus ions 242
F ig u re s 8.1 - 8 .14 244
CHAPTER 9: CONCLUSIONS AND RECOMMENDATIONS FOR FUTURE WORK
9.1 Genera l c o n c l u s i o n s 258
9 . 1 . 1 F u l l y r e s t r a i n e d bay 258
9 . 1 . 1 . 1 A x i a l l y r e s t r a i n e d beams on an e l a s t i c f o u n d a t i o n 259
9 . 1 . 1 . 2 R e s t r a i n e d beams under t r i a n g u l a r l o a d in g 259
9 . 1 . 1 . 3 Bay model 259
9 . 1 . 2 U n r e s t r a i n e d bay 259
9 . 1 . 3 P a r t i a l l y r e s t r a i n e d bays 260
9 .2 F u tu re r e s e a r c h 260
REFERENCES 262
APPENDIX A: INTERACTION FORMULAE FOR AN ASYMMETRIC I-SECTION
A . l I n t r o d u c t i o n 268
A.2 Geometric p r o p e r t i e s f o r the c r o s s - s e c t i o n 268
A. 3 I n t e r a c t i o n formulae 269
APPENDIX B: PREDICTION OF THE DEFLECTION SHAPE
B . l I n t r o d u c t i o n 270
B.2 The d e f l e c t i o n p r o f i l e 270
B . 3 M o d i f i c a t i o n o f the s p r i n g fo r c e c o n t r i b u t i o n in
Eqn. ( 4 .9 ) 272
APPENDIX C: EXTENSIONS OVER THE PLASTIC BEAM SEGMENT
C . l I n t r o d u c t i o n 273
C.2 Geometric e x t e n s i o n s a t s p r e a d in g p l a s t i c h inge t i p s . 273

C. 3 Reduction o f the extensions ca lcu la ted over the curvedsegment
C.4 Examp1e
274
276
F ig u re s C . 1 - C .2 277

18
CHAPTER ONE
INTRODUCTION
1.1 B A C K G R O U N D
Stiffened structures are widely used nowadays with a variety of applications in
offshore, onshore, marine and aircraft structures. The effectiveness of the structure
can be increased by rearranging the material available and using the concept of
stiffening. This is also apparent in nature, in the corrugated or ribbed structure of
some sea-shells and leaves for instance.
In man-made structures on the other hand, the stiffening will usually take the
form of parallel and orthogonal stiffeners, attached to one side of a plate of
uniform thickness. Very often, the spacing of the stiffeners will be quite different
in the two orthogonal directions. In one direction relatively light stiffeners, the
stringers or just stiffeners, will be spaced quite closely together, whereas in the
other direction a much heavier stiffener, the cross-girder or web-frame, will be
spaced more widely. The rectangular plate elements enclosed by these stiffeners
are termed panels, and the group of adjacent panels enclosed by two orthogonal
pairs of heavier stiffeners is referred to as a bay.
Extreme loads can occasionally be applied to stiffened structures by accident, such
as impact loads. Under extreme loads structures experience large deformations
which in many cases, particularly of metallic plated structures, give rise to
significant membrane action. In such cases this membrane action may be the main
contributor to the strength of plated structures at large deflections and cannot be
neglected.
This dissertation contributes to the estimation of the ultimate strength of stiffened
plating subjected to lateral patch static loading developing significant membrane
action as they undergo large deflections.

19
1.2 SCOPE
The research presented in this thesis has two aims; to understand the large
deflection response of stiffened decks under lateral patch load, with emphasis on
the importance of the membrane action, and to propose simplified models to
predict such behaviour.
To that end, the cases of single-bay decks fully restrained and unrestrained
against in-plane movements at their supports are considered. These two cases
bound the behaviour of an internal bay of a multi-bay assembly.
To gain insight into the behaviour, numerical results are generated through a finite
element package and studied together with experimental results. By examining the
observed behaviour, the decks are idealized as sets of parallel beams which form
plastic mechanisms. The behaviour of such beam elements is studied analytically in
detail and bilinear mechanisms are developed for use in a more composite model
proposed to predict deck behaviour.
1.3 L A Y O U T O F T H E THESIS
In Chapter 2 the available literature concerning stiffened decks under lateral
loading either alone or in combination with compression is reviewed. Literature on
the behaviour of restrained beams is also studied in order to facilitate the
development of analytical models for stiffened structures.
Chapter 3 investigates the behaviour of a fully restrained deck under patch
loading. Numerical results are presented first and the main actions are identified.
The deck is then idealized as a series of axially restrained beams of two types in
terms of the applied loading pattern. The first type of beam (Type I) can be
considered as a beam on an elastic foundation subjected to a centrally applied
patch load, whereas the second type of beam (Type II) can be regarded as being
subjected to a symmetric triangular loading distributed over the whole span. The
former case is subsequently used to represent strips of stiffened deck under the
patch load and the latter to represent strips of stiffened deck further removed
from the patch load.
The behaviour of Type I beams, that is, axially restrained beams on an elastic
foundation under centrally applied loading, is the subject of Chapter 4. An
approximate bilinear model is proposed and its results are compared with

20
numerical results.
In Chapter 5 the behaviour of Type II beams, that is, axially restrained beams
under symmetric distributed loading, is investigated. Initially, an extension of
existing methods concerning uniform loading is made to cover beams under
symmetric distributed loading. Subsequently, a bilinear model is proposed.
In Chapter 6 the restrained deck strip model identified in Chapter 3 is described
analytically using the beam models developed in Chapters 4 and 5. The behaviour
of the analytical model for the complete bay, is compared with numerical results
for three different deck geometries.
Chapter 7 concerns the behaviour of unrestrained simply supported decks,
beginning with a comparison between numerical and experimental results. These
results, together with further numerical analyses, are used to identify the key
parameters, which could usefully be incorporated in a simplified analytical model
for unrestrained deck bays. Alternative methods to estimate the parameters
involved in the model for other deck geometries are also discussed.
Chapter 8 proposes a simplified analytical model for the analysis of unrestrained
deck. The mathematical formulation is followed by a parametric study investigating
the sensitivity of the proposed model to variation in its controlling parameters. A
comparison between the model and advanced elasto-plastic finite element results is
also made.
Chapter 9 presents the conclusions drawn from the work and outlines areas for
further research.

21
CHAPTER TWO
REVIEW O F T H E LITERATURE
2.1 INTRODUCTION
The membrane action induced in plates and beams restrained against pull-in by
changes in geometry, can increase their load carrying capacity to many times the
limit load obtained in the presence of bending action alone. There is a
fundamental difference, however, between plates and beams. The latter, require
external axial restraints to develop membrane action when they experience large
deflections. On the other hand, metal plates exhibit membrane action when they
take on a non-developable shape, irrespective of the presence of any in-plane
restraint provided at the boundary. This occurs because in the formation of the
non-developable shape, some regions of the plate mid-surface are stretched at the
expense of others that are compressed. The presence of any boundary restraint
may, of course, make the membrane action more marked.
In this chapter, the literature on the large deflection behaviour of stiffened plates
and restrained beams subjected to lateral loads, with or without in-plane loading,
is reviewed.
2.2 UNSTIFFENED PLATES A N D BEAMS U N D E R LATERAL LOADING
2.2.1 Evolution of the elasto-plastic methods
The considerable reserve of strength which exists in plating loaded laterally beyond
the elastic limit has been well understood since the beginning of this century, see
Boobnov (1902) and Inglis (1925). Originally, interest was focused on slender
structures, that is, structures with high span to depth ratios in the case of beams
with rectangular cross-section, or high slendernesses in the case of plates. Specific
attention was given to thin plates supported around their boundary by more rigid
22
elements such as stiffeners and restrained in their plane by the surrounding
structure. Such structures exhibit some membrane behaviour while still elastic.
Under increasing lateral load they are transformed into plastic membranes. Elastic
deformations, however, may not be insignificant and an elasto-plastic analysis is
often to be preferred to a rigid-plastic one.
The first attempt to exploit the post-elastic load carrying capacity of an initially
flat clamped rectangular plate subjected to uniform lateral pressure, appears to be
due to Hovgaard (1940), who produced empirical design curves. In the case of
infinitely long plates, the one-dimensional nature of the problem considerably
simplifies the analysis. A beam under Uniformly Distributed Loading (UDL) can be
studied instead. It was for this type of plate that the first practically useful
solutions were obtained by Clarkson (1956). These ideas were followed by Wah
(1958) and Jaeger (1958) who produced similar types of analyses. Jaeger also
indicated how a square plate could be treated as a long rectangular plate through
modification of its thickness. With the exception of Jaeger's, the aforementioned
studies extended the elastic large deflection analysis for long rectangular plates, for
instance as described by Timoshenko & Woinowsky-Krieger (1959), up to the point
where the central plastic hinge is formed.
Young (1959) presented an analysis which extended Clarkson's method for larger
deflections up to an ultimate point where the long plate becomes a plastic
membrane. The main contribution attributable to Young was the incorporation of
the plastic extensions which take place at the plate plastic hinges, in addition to
the extensions due to the elastic stretching. It can be said that Young presented
the first complete treatment of long rectangular plates under distributed loading, by
analysing and testing equivalent beams. Young's analysis can be considered as
complete since it considered all three phases which a beam experiences up to and
including the plastic membrane stage, with the incorporation of the plastic
extensions that are very important during the third phase. These three phases are,
the elastic non-linear range, which comes to an end with the formation of plastic
hinges at the supports, a second phase that ends when an additional hinge is
formed at the centre of the beam, and a third phase that ends once the beam
becomes a plastic membrane. Young used two different analyses for the second
and third phases. The absence of plastic extensions at the support hinges during
the second phase causes a transitional jump in the load-deflection response,
between the second and the third phase, in the solution presented by Young. It is
worth mentioning that the more slender the plate, the more non-linear the first
two phases become. For stockier plates or beams, on the other hand, the linear
elastic response, governed by bending, is closely followed and plasticity reduces the

23
stiffness gradually.
For these stockier plates or beams, the extent of the second phase is much less
than for more slender beams. The support and central hinges tend to occur
simultaneously in the case of a very stocky structure subjected to symmetric
loading. If such is the case, the first and third phases described above are those
needed to describe the behaviour up to the stage the plate becomes a membrane.
The linearity of the first phase, as a result of stockiness, makes the large
deflection elastic treatment of the first phase unnecessary. In the third phase,
elastic extensions may be only small fractions of their plastic counterparts,
therefore they may be neglected. This last point justifies the evolution of
rigid-plastic methods for the analysis of stocky beams rather than of generally
slender plates. These rigid-plastic methods are discussed in the next section.
Although Young's analysis was, at that time, the best contribution to the analytical
treatment of long rectangular plates, by considering slender beam behaviour, it was
not relevant to plates with aspect ratios between one and two. Hook & Rawlings
(1969a) however, provided experimental data for plates within that aspect ratio
range.
Labib (1971) analysed clamped plate strips subjected to uniform pressure using
dynamic relaxation. The analysis covered both elastic non-linear and elasto-plastic
behaviour. Investigation into the beneficial effects of initial dishing and
pre-stressing was also made. Campbell & Charlton (1973) considered a clamped
beam under point loading in the elastic and elasto-plastic range. Backlund (1976)
used Finite Elements (FE) in a flexibility approach to solve the elasto-plastic
problem for beams and frames of any cross-section. Finally, Kamtekar (1981)
extended much of this earlier work, in developing an elasto-plastic analysis of
beams and plates using the collocation technique. Kamtekar's analysis also included
imperfection effects, and the influence of movements at the supports.
2.2.2 Rigid-plastic methods
Following the early work on slender structures, attention was focused on stockier
structures, for example rectangular beams with relatively low span to depth ratios.
A stiffener and its associated plate in stiffened structures of typical geometries falls
into this category, provided that the surrounding material still provides the axial
restraint necessary for the development of membrane action. For such structures,
the initial elastic deflections are reasonably small. Thus, very little membrane force

24
is built up in the elastic range. Subsequently, the extensions necessary for the
build-up of the membrane forces take place mainly over the plastic segments of
the structure. Therefore, a rigid-plastic analysis neglecting elastic bending and
membrane effects may be used to represent the main characteristics of the
behaviour. Its simplicity renders it an attractive option compared to other types of
analysis.
In conventional small deflection analysis, equilibrium equations are developed for
the original undeformed configuration of the structure. In large deflection analyses,
geometric changes are taken into account in the equilibrium equations. As
mentioned before, these geometric changes in axially restrained beams produce
membrane forces which increase the load carrying capacity many times beyond the
limit load.
The pioneer in the rigid-plastic analysis of axially restrained beams appears to be
Haythornthwaite (1957), who analysed a rectangular beam subjected to a centrally
applied point load. Haythomthwaite (1961) analysed a sandwich beam and a
rectangular beam both subjected to uniformly distributed loading. The sandwich
beam analysis took into account two distinct modes of deformation. During the
first mode, the central plastic hinge at the limit load configuration splits into two
hinges which travel outwards under increasing lateral deflection until they reach
the third points of the span. At this stage the second mode begins. The travelling
hinges split again and spread towards the supports and the middle, giving the
intermediate plastic segments of the stucture a parabolic shape. For the rectangular
beam, Haythomth waite assumed a single mode of deformation. During this mode,
the central hinge, formed at the limit load, splits into two and spreads towards
the supports under increasing lateral deflection. Small deflection assumptions are
made by Haythornthwaite and the results are compared with experiments
undertaken by Young (1959).
Martin (1962) analysed axially restrained grids under point loads. Martin also
presents the analysis of beams under a number of evenly spaced lateral point
loads. The method can be extended to predict the behaviour of beams under
uniformly distributed loading by using a large number of point loads.
Gill (1973) followed Haythornthwaite (1961) in the two mode treatment for the
sandwich beam, and analysed a rectangular beam under uniformly distributed
loading having either rotationally restrained or unrestrained ends. Gill presumably
thought that the two mode solution would improve the results for the rectangular
section. The second mode, which is treated approximately, does not lead exactly

25
to pure membrane action at finite deflections. This problem, and the extent to
which the two mode solution is an improvement on Haythomth waite's single mode
solution, for a rectangular beam under uniform loading, are further discussed in
Chapter 5.
Gtirkdk & Hopkins (1973) presented the complete solution for a pin ended beam
under uniformly distributed loading, using a Lagrangian formulation to monitor the
changes in the geometry of the beam. This treatment allows all curvature changes
along the curved segments to be measured and is the most rigorous analysis
developed to date. GUrkOk & Hopkins presented two solutions considering both
small and large strain expressions in the strain-displacement relationship. Two
modes similar to those considered by Gill were assumed. Although this analysis is
very complex, it converges to the membrane solution at finite deflections, which
both Haythomthwaite's and Gill's analyses are unable to predict. This solution*
shows that membrane yield occurs at about five times the limit load level, for the
geometry considered.
Onat & Haythomthwaite (1956) appear to have been the first to incorporate the
membrane action in the rigid-plastic analysis of plates. They considered the
analysis of circular plates under lateral pressure loading. The geometry of the
plate facilitated the incorporation of the membrane action in the plate very
conveniently, with the deflected plate forming a shell of revolution.
Sawczuk (1964) presented a rigid-plastic analysis of polygonal plates under lateral
pressure. The method is based on an admissible displacement field similar to that
assumed in the yield line theory of plates, Johansen (1962). The energy dissipated
along the yield lines is due to both bending and membrane action, while no
energy is absorbed by the rigid parts of the plate contained within the yield lines.
As an application, Sawczuk presented the analysis of a rectangular plate under
uniform pressure with supports free to rotate but not allowed to draw-in. Sawczuk
appears to be the first who presented a rigid-plastic analysis of unstiffened
polygonal plates, with boundaries restrained against in-plane movements.
Jones & Walters (1971) developed Sawczuk's work and presented a rigid-plastic
analysis of plates under static distributed loading. Jones (1971) presented an
analysis of unstiffened plates under static and dynamic loading and extended the
analysis to beams by considering them as long rectangular plates.
Dean (1975) presented a rigid-plastic analysis of plate panels subjected to various
combinations of in-plane loading and boundary conditions. The analysis also

26
included lateral pressure loading and the effect of in-plane shear deformation
along the yield lines.
In addition, some analyses are reviewed which can be classified as hybrid methods.
They evolved from the necessity to incorporate pull-in at the supports. If an
elastic spring law can be assigned to the support, then the methods can be said to
be elasto-plastic. Jones (1973), Hodge (1974) and Ronalds (1985) have also
considered the effects of partial restraint on beams under a centrally applied point
load. Low (1981, 1982) analysed a beam loaded by a rigid circular indenter. Low
considered the effects of partial axial restraint by incorporating a linear spring in
the longitudinal direction at each support. Under increasing deflection the curved
segment of the beam was assumed to follow the indenter's shape.
Finally, membrane action may also be present in concrete slabs, with the
requirement that in-plane restraint exists at the plate boundary, see Park &
Gamble (1980). It is of a different nature to that present in metallic plates and
passes through two phases. The initial increase in strength is due to arching action
(or jamming) of the concrete as the plate develops some out of plate deflection.
After a fall off in strength to the yield line prediction, a second increase in
strength occurs, due to the development of membrane action in the anchored
reinforcement. This is not reviewed any further because of its lack of relevance to
the problem under discussion.
2.2.3 Experimental work on beams under uniform loading
Few test results are available on the large deflection behaviour of rectangular
beams under distributed loading. Young (1959) conducted a series of tests in which
uniformly distributed loading was simulated by four point loads. The span to depth
ratios were 48, 96 and 132. The results corresponding to the first of the
geometries tested by Young can be compared with a rigid-plastic analysis, while
the latter two geometries are slender enough to require predictions from an
elasto-plastic analysis. Haythomthwaite (1961), found very good agreement between
his rigid-plastic analysis and the results corresponding to the first of the
geometries tested by Young.
Pang & Millar (1978) tested a rectangular aluminium beam with span to depth
ratio of 16.7. The uniformly distributed loading was simulated by ten equal point
loads. The results compare favourably with the rigid-plastic analyses by
Haythomthwaite (1961), Gill (1973) and Jones & Walters (1971). It may be of

27
importance to note that the beam failed prematurely at the supports due to shear.
2.3 STIFFENED PLATING U N D E R LATERAL LOADING
The collapse load of stiffened plates under patch or uniformly distributed loading
is calculated by the use of the upper- and lower-bound theorems of plastic limit
analysis. In such an analysis, the idealization of stiffened plating was found to be
similar to the one used for elastic analysis of this type of structural form. Two
main approaches, for this idealization, can be noted in the literature.
The first recognizes the discrete nature of the stiffening, and considers the deck as
a grid of beams. Each beam is composed of the stiffener and the associated
effective plate. For the latter the values suggested by Clarkson (1963) can be
used. Heyman (1953), demonstrated the methods of plastic limit analysis leading to
upper and lower bounds of the so called grillages. More recently, Grigorian (1972)
and Chowdhury (1985) presented limit analyses for torsionless grillages.
In the second approach the deck is visualized as an orthotropic plate. This is
achieved by smearing out the discrete properties of the stiffeners. In addition, the
limit problem is treated along the lines of limit analysis of unstiffened plates, see
Johansen (1962). Recently, Manolakos & Mamalis (1988) presented upper- and
lower-bound soloutions in which the torsional moments are also considered.
The approaches mentioned above disregard completely the presence of membrane
action in the plate, as the deck experiences large deflections. In general they are
more applicable to reinforced concrete rather than to metallic structures. In metal
plates, membrane action is associated with geometry changes at large deflections.
There has been little progress in the design of laterally loaded plates towards the exploitation of the additional strength due to membrane action in the elasto-plastic
range. Cox (1953) presented a method of analysis, based on the energy method,
for stiffened decks under patch loading, which allowed for a moderate amount of
inelastic action to occur. A simply supported uniaxially stiffened deck is viewed as
an elastic plate strip spanning transversely across a limited number of stiffeners,
while the stiffeners involved in the model are represented by bilinear springs. Each
spring models the stiffener and an associated plate width which, for the geometries
considered, was taken to be equal to the beam spacing. The transverse plate strip
has the same thickness as the deck plate, but different effective widths are taken
when calculating the flexural and membrane rigidities. This was necessary to
28
represent the experimental behaviour observed by Cox. Two cases were considered,
one with the patch loading applied over a beam and the other with load applied
to the plate midway between two beams. The method predicts the behaviour of
the deck in the vicinity of the applied loading, from first yield of the beam close
to or under the applied loading up to first yield of the next adjacent stiffener.
Information is provided by the method about the load distribution (in the
elasto-plastic range) between the two beams adjacent to the loading, and the
maximum strains in the plate and the stiffener. In addition, the method predicts
the total central deflection under the load and the permanent set on removal of
load.
Cox also described the behaviour of tests in the plastic range up to collapse. For
all the specimens, yielding of the central beams was followed by outward spreading
of load as evidenced by the increased deflections of the beams adjacent to the
central beams. The difference between deflection under load and permanent set
became greater as the loads increased. The membrane stresses in the plate were
tensile in the centre of the plate and compressive near the supports. These
stresses are balanced if they are integrated along a centre line, as no in-plane
loading is applied to the plate externally. The effective tensile width of plate in
the transverse direction appeared to be approximately equal to the spacing of the
beams. After yielding of the centre beams occurred, the membrane tensile strains
rapidly increased and they became large in comparison with the flexural
component of strain, thus indicating the importance of membrane action in helping
to distribute load outward from the centre beams.
Each specimen was loaded until a maximum load was attained. This load was
between 10 and 12 times the load causing first yield, which occurred either in the
plate or in the beam depending on the position of the applied loading. Thus,
application of the load midway between two beams caused first yield to occur in
the plate. When the load was applied at midspan directly over a centre beam,
yielding first began in the bottom fibres of the beam under the load. The
specimens failed in a secondary manner by buckling of the plate over the end
supports between the centre beams. The strains in the plate never became very
large. On the contrary, beam strains attained very high values. When the load
applied to a specimen was above about five times the load causing first yield, the
large deformations had a drastic influence on the cross-sectional shape of the
structure. Hence, the specimen began to behave somewhat as one simple beam
whose moment of inertia continually changed with increased deflections. The
neutral axis of the entire system rose above the top flanges of the centre beams,
as was evidenced by the fact that the upper flanges of the centre beams were in
29
tension rather than compression for very large loads. The stiffening effect of the
change in geometry explains why the maximum load taken by each specimen was
considerably greater than the sum of the loads that would be required to produce
a fully plastic moment in each of the beams made up from a stiffener and a fully
effective plate.
Dowling (1968) tested a single-bay longitudinally stiffened deck under lateral patch
loading positioned midway between the central stiffeners. The deck was supported
at the four comers. Two very strong girders were used along the longitudinal
edges, while for the transverse ends, cross-girders were used. Yield was initiated
in the deck plate under the wheel loading. The bottom flanges of the loaded
stiffeners yielded next. Following the collapse of the loaded stiffeners, the applied
load was carried to the adjacent stiffeners by a combination of transverse bending
and membrane action in the plate. A width of plate of the order of two to three
times the spacing of the stringers was estimated to be under transverse membrane
tension. These tensile membrane forces were balanced by compressive forces in the
plate over the cross-girders. Buckling of the plate over the cross-girder was
followed by the collapse of the entire deck due to the formation of plastic hinges
at the centres of the cross-girders. The collapse load was approximately 10 times
the load at first yield. It was the analysis of these experimental results that
prompted the investigations contained in this thesis.
2.4 STIFFENED PLATING UNDER COMBINED LATERAL AND IN-PLANE
LOADING
2.4.1 Combined compression and lateral uniform loading
The effect of lateral pressure on the ultimate strength of stiffened plates under
combined compression and lateral pressure loading is distinctively marked between
single- and multi-bay stiffened plates. In single-bay models the presence of lateral
pressure of any magnitude generally reduces the ultimate compressive strength
obtained in the presence of compression alone, see Webb & Dowling (1980) and
Ostapenko & Lee (1960). In multi-bay models, the presence of a moderate lateral
pressure may improve the compressive strength obtained in the absence of the
lateral load, while at some higher lateral pressure a reduction in the compressive
strength has been observed, Smith (1975). The increase in the compressive
strength, in the presence of moderate pressure, is achieved as the application of
the latter load component suppresses the buckling mode developed under the
30
action of compression alone. Pure compression acting alone causes bays to buckle up and down alternately, while lateral pressure applied alone imposes a single bow in all the bays in the direction of the pressure.
Dean (1975) tested three stiffened models representative of ship's bottom plating subjected to combined compression and lateral pressure. Each of the models had three bays with the plate in the end bays reinforced in order for the failure to occur in the centre bay. Stocky stiffener properties were used so that they failed in a stocky column mode. The modes of failure observed in the tests were used to calculate interaction curves between the applied load components. For this, the interaction between longitudinal forces and bending moments was used. Good agreement was found between the load component interaction curves produced and the test results (see also Dean & Dowling (1977)).
Carlsen (1978) compared numerical and analytical predictions of the collapse load of stiffeners subjected to compression and hydrostatic lateral load. The analysis presented gives conservative results with respect to the numerical predictions. In general two modes should be tried, one with pure compression (mode I) and the other with simultaneous action of both load components (mode II). The lower of the two strength predictions should be used. It was found that under dominating compression the lateral load can be neglected. This analysis is proposed by Carlsen (1977) for the prediction of the ultimate load in stiffened flanges subjected to combined compression and hydrostatic loading.
Webb & Dowling (1980) studied the behaviour of stiffened plates both experimentally and analytically. As an analytical tool, the theory of discretely stiffened plates was used. The governing large deflection equations were expressed in their finite difference forms and a dynamic relaxation numerical technique was employed to solve the equations. Plasticity in the plate was treated by a single-layer yield criterion, while for the stiffener a multi-layer approach was used. The bulk of the parametric study was devoted to the behaviour of a single-bay stiffened plate under in-plane loading. Two parameters were varied, that is, plate and stiffener slenderness ratios, and only flat bar stiffeners were considered.
From the main study one stiffened plate with plate slenderness, b/t, of 60 and stiffener slenderness, 2L/r, of 30 was re-analysed under the combined action of lateral and in-plane loading. The lateral load was applied first, followed by increasing in-plane loading to failure. It was concluded that, for the single-bay studied, application of the lateral load leads to a reduction in the in-plane

capacity in proportion to the lateral load applied. This is because application of the lateral load does not alter the mode of deformation of the primary supporting elements, that is the stiffeners. In addition the mode of plate deformation resulting from compressive forces alone can be considerably modified by the application of lateral pressure.
The behaviour of stiffened flanges under combined loading was also investigated by Kristek et al (1982). These authors used large deflection folded plate theory. The parameter investigated was the stiffener configuration. It was found that closed-section stiffeners are beneficial to the post-buckling behaviour of the stiffened flange. This is due to the additional bending restraint offered to the unsupported width of panel by the enhanced torsional rigidity of this type of stiffener.
2.4.2 Combined compression and lateral patch loading
Wheel loading of the usual magnitude specified in codes of practice for bridge deck design such as BS 5400 (Part 2, 1978), has little adverse effect on the ultimate in-plane strength obtained under the sole action of compression. This is corroborated by tests undertaken by Chan et al (1977) on 1/4 scale models of stiffened steel decks representative of those met in bridges. BS 5400 (Part 3, 1982), states that the strength obtained by the Perry-Robertson formula, adopted in the code when compression acts alone, can be also used for the case of compression acting in combination with wheel loading. This is supported by the fact that the column approach ignores any redistribution of applied compression. Such redistribution may be considered by analysing the deck as an orthotropic deck. A rational approach for the case of combined loading that is consistent with the column model is not as yet available.
2.5 CONCLUDING REMARKS
This chapter has presented a review of the literature on beams and plates both stiffened and unstiffened developing membrane action at large deflections under lateral loading, or combined with compression in the case of stiffened plates.
First, the elasto-plastic methods for the analysis of unstiffened plates and slender beams under lateral load was reviewed. For the stockier beams, such as the stiffener and associated effective plating in a stiffened structure, rigid-plastic

32
methods are more readily applicable. Such methods are well developed and if necessary, can include the effects of elastic stretching and pull-in at the supports. The validity of the rigid-plastic analysis for beams is corroborated by available experimental evidence. Beam models following rigid-plastic material laws can be used as components in the analysis of more composite structures such as the stiffened plating.
Next, approaches based on limit analysis, as they have been used for the stiffened plating under lateral loads, were presented. The methods currently available appear to disregard completely the membrane action in the plate which exists at large deflections. Little progress has been made towards incorporating this membrane action in the analysis of plates, both stiffened and unstiffened. Membrane action has been included in the cases of unstiffened polygonal plates restrained against pull-in at their supports, and circular plates free to draw-in. Also for stiffened plating under patch loading, membrane action has been incorporated in the analysis concerning the very early stages of the elasto-plastic response.
Lateral distributed load on stiffened plating, such as bridge or ship decks, combined with predominant compression, has a marked effect on single- and multi-bay decks. However, localized loads like those applied by the wheels of vehicles, usually have a minor effect on the compressive strength of such decks.
A rigid-plastic analysis of stiffened decks subjected to predominant patch lateral load is presented in this thesis. The analysis includes the membrane action which is developed in the plate at large deflections. In this context, two analytical beam models are also presented. One generalizes previous work on axially restrained beams subjected to distributed loading and the other concerns elasto-plastic beams on an elastic foundation.

33
C H A P T E R T H R E E
BEHAVIOUR O F STIFFENED DECKS RESTRAINED AGAINST PULL-IN
3.1 INTRODUCTION
The behaviour of stiffened decks which are fully restrained against pull-in in their
plane, under concentrated loading, is investigated using an existing finite element
package in this chapter. Membrane stresses are built up rapidly with increasing
plate deflections, and membrane behaviour quickly prevails. This behaviour is used
as a basis for a proposed model that treats the stiffened plate as a series of
beams loaded with the vertical components of the transverse membrane forces and
connected transversely by plate strips.
3.2 M O D E L G E O M E T R Y
An eight stiffener single bay deck was analysed. Due to the presence of double
symmetry on plan, only one quarter of the deck, as shown in Fig. 3.1(a) was
modelled by non-linear finite elements.
The boundary conditions along all supported edges prevented any translation or
rotation. Stocky stiffener proportions were employed in order to minimize
reductions in strength due to local buckling effects occuring in practice. The
stiffener cross-section is shown in Fig. 3.1(b). Details of the particular geometry
examined in this chapter are given in Table 3.1.

34
3.3 NUMERICAL ANALYSIS
3.3.1 Description of finite element program
The numerical analysis was undertaken using the finite element program FINAS
originally developed by Trueb (1983). The program is particularly suited to
structural stability problems and has been extensively used for the modelling of
structural components or their assemblages encountered in bridge or offshore
structures. A variety of element modules are available in the package library, but
only the isoparametric shell, isoparametric beam and bond-slip elements have been
used.
The elements forming the structure can be divided into different element groups,
each containing any number of elements of the same type. There is no limitation
on the number of elements used or on the number of geometric and material
properties used within an element. A variety of material laws such as linear
elastic, elasto-plastic based on Ivanov's yield criterion, concrete material behaviour
including cracking and crushing and the elasto-plastic multi-layer technique can be
used.
The element stiffness matrices are generated by Gauss numerical integration with
allowance for up to 10 integration stations in any one direction. The set of the
resulting simultaneous equations is solved using Gauss elimination and it is not
restricted to positive definite matrices. In this way, load-deflection paths can be
followed into the unloading range.
Storage requirements are reduced by storing only the non-zero coefficients of the
upper triangle in the stiffness matrix, while solution time is optimized by node
re-numbering. In addition, the stiffness matrix is automatically subdivided into
blocks that are stored on mass storage devices. Only the two blocks currently
reduced are stored in-core. Therefore, the maximum problem which can be solved
depends only on the out-of-core storage available.
Different solution strategies are available for tracing the equilibrium path which
could be non-linear. Such non-linear techniques are based on the Newton-Raphson
iterative technique and differ in the stage at which the stiffness matrix is
reformed. No single strategy is suitable for the whole non-linear path and
convergence difficulties are overcome by switching to a strategy more appropriate
to the type of non-linearity, with simultaneous subdivision of the applied step size.

35
Switch back to the initial minimum solution strategy, specified by the user, takes
place once the difficulty has been overcome.
Both load and displacement increments can be applied to the structure with the
latter being necessary to trace unloading paths. The size of each increment may
either be specified by the user or dynamically controlled by the program. Crossing
of limit points requires a constraint equation to be satisfied in addition to the
equilibrium equations. Three types of constraint equations are available in FINAS
such as, displacement control, automatic selection of the constraint equation
(displacement) and the constant arc-length method.
3.3.2 Description of the elements used
From the existing element library three elements, all of the isoparametric type
were used, in this thesis. They include, the doubly curved 8-noded shell element,
the 3-D beam element and the bond-slip element. The first two elements were
developed by Bates (1987), while the third was developed by Elnashai (1984).
3.3.2.1 Shell element
The shell element was used in modelling the deck plate of the stiffened decks
studied. It is a doubly curved 8-noded isoparametric element with six degrees of
freedom per node. The element formulation is based on Mindlin's theory which
assumes zero direct stress in the thickness direction and uniform transverse shear
stress distribution through the thickness.
Shear locking is eliminated by preventing the transverse shear stiffness from
exceeding a certain threshold value. Plasticity is based on the von Mises yield
criterion and the Prandtl-Reuss flow rule with linear isotropic hardening. Large
displacement and rotation effects are included through the coupling of membrane
and bending terms. A constraint equation is used to express the incremental
out-of-plane rotation as a function of the rotation of the mid-surface obtained in
terms of the mid-surface displacements.
36
3.3.2.2 Beam element
This element was used either alone for the beam analyses undertaken or jointly
with the shell element to model the stiffeners of the decks analysed. It is a
3-noded 3-D space beam suitable for large deflection elasto-plastic analysis. The
kinematic model is based on a unified theory which combines Mindlin type models
for transverse shear deformation with classical thin-walled beam theory. The
element has seven degrees of freedom, that is, three translations, three rotations
and a warping degree of freedom. As the kinematic models for the 8-noded shell
described above and the 3-noded beam elements are compatible they are well
suited for the analysis of stiffened plates or shells. In this way the modelling is
very economical as the beam element shares the same nodes with the shell
element. Only phenomena that cause distortion of the stiffener's initial
cross-sectional geometry cannot be modelled.
The cross-section of the beam element is divided into straight segments each of
uniform thickness. In such a way any open cross-section composed of up to 20
segments can be modelled. The cross-section of each segment is subdivided into
stations through the thickness and along the length in order to improve modelling
of plasticity based on the von Mises yield criterion with linear isotropic hardening.
Geometric non-linearity is accurately predicted even under a combination of large
rotations and translations. This is achieved with a formulation that allows third- as
well as second-order terms to be included.
3.3.2.3 The bond-slip element
This bond-slip element due to Elnashai (1984) was originally used as a contact
element between concrete and steel. Subsequently, it was modified by Burgan
(1987) to a 2-D global spring element. The element can be assigned any
non-linear law. In the present thesis, it was mainly used as a linear spring to
represent the surrounding structure in the analysis of beams on an elastic
foundations.
3.3.3 Mesh convergence study
The mesh chosen for the finite element analysis is shown in Fig. 3.2. Five
8-noded shell elements were used along the length and ten across the width of
the plate. For the stiffeners, the 3-noded 3-D beam element was used. The two
37
elements are compatible as stated in Section 3.3.2.2. The 'two elements per
buckling half-wave length' rule was used as a guide in the choice of the mesh in
the transverse direction. This rule is frequently applicable when buckling of the
plate elements is possible, although in this case buckling of the plate was not
anticipated. In the longitudinal direction the first and the last elements were made
shorter than the other elements, their length being equal to 0.1 L in anticipation of
plastic hinges forming at those positions.
As described in the following section, in the large deflection regime the plate
forms kinks along stiffener lines as shown in Fig. 3.4. In investigating the
significance of these localized curvatures, an alternative mesh, with four shell
elements in the transverse direction between stiffeners and six elements along the
length, was tried. The shell elements on either side of the stiffener were
approximately 0.14b wide. Throughout the numerical analysis undertaken in this
thesis the number of layers in the shell element was kept at six. As the
differences in the load carrying capacity at any given central deflection of stiffener
1 in Fig. 3.1(a) were within 0.5%, the accuracy of the mesh in Fig. 3.2 for
investigating the behaviour in the large deflection regime was established.
3.4 LOADING
The loading is applied over the two central stiffeners as a pair of patch line
loads. Figure 3.1(a) shows the line load on the quarter of the deck analysed with
the finite elements. Each of these loads has a total length of 1.26b, where b is
the spacing of the stiffeners. This spacing is uniform for all the decks examined
in this thesis.
The load factor, p, that appears in Chapters 3, 4 and 6 expresses the applied
load on a stiffener non-dimensionalized with respect to the limit load, P 0, causing
a mechanism in bending of an encastre beam. This beam cross-section comprises
a stiffener and the associated fully effective deck plate. Subsequently, a beam with
such a cross-section is referenced as 'notional beam'. Following the definition
above, the total load carried at any instant by the deck is equal to 2p, since two
line loads are applied on the deck.

3.5 OBSERVED BEHAVIOUR
The central deflections of the various stiffeners are plotted in Fig. 3.3 as functions
of the applied load. Stiffener numbering increases by moving away from the
longitudinal centre line towards the support, see Fig. 3.1(a). The load is
non-dimensionalized with respect to the limit load - obtained assuming a plastic
mechanism in bending - of the loaded stiffener plus its associated effective plating.
The latter was taken to have a width equal to the beam spacing. The load versus
stiffener 1 deflection curve is a continuously softening curve, shown in Fig. 3.3.
Positions where it changes slope correspond to the incipient collapse of subsequent
stiffeners 2, 3 and 4. Figure 3.4 illustrates the deformation of the deck in a
schematic manner. Dashed lines depict the deck in the undeflected state. Stiffener
positions are easily traced, as they cross the transverse central line at positions
where the latter shows discontinuity in slope. The forces applied to the stiffener
by the stretched plate are also shown.
3.5.1 Stiffener deflections
In Fig. 3.5, the central deflection of each stiffener is plotted versus the deflections
of the adjacent one. Referring to Fig. 3.5(a) which shows the deformation histories
of stiffeners 1 and 2, a slope of 1 :2 is noticeable over the first part of this
history. This indicates that when stiffeners 1 and 2 experience the slope 1:2, their
incremental deflections lie on a straight line which pivots about stiffener 3 for as
long as this ratio holds. Thereafter, a ratio of 2:3 is observed which signifies that
stiffeners 1 and 2 pivot about stiffener 4, with corresponding incremental
deflections in that ratio. This is further discussed, in Section 6.2.3.3.
Figure 3.5(b) presents the deflections of stiffeners 2 and 3. The slope 1:2 signifies
that the incremental deflections of stiffeners 2 and 3 lie on a straight line which
pivots with respect to stiffener 4.
3.5.2 Stress resultants in the plate
For a better understanding of the plate behaviour the stress resultants in the plate
without the stiffeners were plotted (shown in figures 3.6 to 3.8, 3.10, 3.12 and
3.13) and the observed behaviour is discussed in the following sections. The
general convention followed in the plots for the stress resultants produced, is that
continuous lines are used for positive quantities and dashed lines for negative
39
values. In the plots of membrane stress resultants, tension is considered to be positive. Positive bending moment gives tension in the top plate fibres, and thus hogging moments are considered to be positive. All the plate stress resultants with their positive values are shown on Fig. 3.1(a). The total height of the box surrounding each plot is twice the scale value, where this is defined in each diagram. The plots are based on the value of the various quantities at Gauss point positions connected with straight segments, that is, no stress smoothing process was used. As the 2 by 2 integration rule was used in the shell elements, stiffeners are located after every fourth plotted line across the width. Stiffener positions are marked along the transverse central line. The stress resultants at different load steps are presented in the following sections, aiming to show the main trends in the behaviour. It should again be noted that, the values are plotted at the Gauss points which are located within the elements, and not at the nodes which are located at the element boundaries, as shown on Fig. 3.2.
3.5.2.1 Transverse membrane forces
The build-up of the transverse membrane tension Nx is shown in Figs 3.6(a) and 3.6(b), where Nx0 is the full plastic value of the stress resultant. Attention is drawn to the distribution of the transverse stresses along the longitudinal centre line. This distribution is the sum of two components, one consisting of tension in the middle of the plate and compression near the supports, and the other being uniform tension along the longitudinal centre line. The first component stems from the plate deflecting in a non-developable shape, which results in tensile radial stresses at the centre and compressive hoop stresses around the perimeter of the plate. The second component is due to overall stretching of the plate as it behaves like a membrane anchored at the boundary. The transverse edge tries to shorten as the plate deflects into a non-developable surface. The restraint of movements along the transverse edge is responsible for inducing an additional transverse tension along this support, as it prevents the plate from contraction.
3.5.2.2 Longitudinal membrane forces
Distributions of the longitudinal membrane forces in the plate are plotted at two load steps. One, early in the loading history, is shown in Fig. 3.7(a), while the second is at a load stage where all but the outmost stiffener have formed plastic mechanisms, Fig. 3.7(b). The scale used is the Ny0 value, which is equal to the stress resultant fully plastic value per unit plate width.

40
Figure 3.7(a) corresponds to the early bending-governed behaviour in the longitudinal direction with the plate acting as the top flange of the stiffener. In Fig. 3.7(b) the presence of stretching in the longitudinal direction, causing an overall tension, is evident.
3.5.2.3 Membrane shear forces
Membrane shear distributions are given in Figs 3.8, with Nxy0 being the stress resultant plastic value per unit plate width. As Fig. 3.8(a) shows, shear is mainly developed in the panel between stiffeners 1 and 2 at this early stage. Onlystringer 1 experiences considerable deflection and the shearing is due to large deflection strains. The membrane shear pattern when more stringers experiencesubstantial deflections is given in Fig. 3.8(b).
Shears in the panel between stiffeners 1 and 2 are shown schematically in Fig.3.9(a). Their reactions cause an axial force distribution on stringer 1 of the type shown in Fig. 3.9(b). These membrane shears play an important role as theyincrease the stiffener axial force in the middle of the deck.
3.5.2.4 Transverse bending moments
Typical plots of transverse moments are shown in Fig. 3.10 where M x 0 is theplastic moment per unit plate width. At low loads the plate bends with a significant hogging moment at the location of stiffener 2 and a sagging moment at stringer 1, see Fig. 3.10(a). The load transfer between stiffeners occurs through transverse shear action in the plate. At a later stage, Fig. 3.10(b), the membrane action is highly developed and the bending contribution diminishes where the membrane forces are close to yield. Significant bending is still present near theouter stiffeners however, where the membrane stresses are less than yield.
An interesting feature is the scalloped shape of the bending moment distribution, which is very pronounced in Fig. 3.10(b). This is due to a P-5 effect in theplate. In Fig. 3.11(b) Mxj and M xj+j are the transverse bending moments in theplate at stiffener j and j+1 positions. As no load is applied externally to the plate between these two stiffeners, the bending moment between stiffeners j and j+1 should vary linearly. The plate is also under transverse membrane forces and its shape is locally curved between stiffeners j and j+1, as indicated in Fig. 3.11(a).

41
This results in a P-5 moment component between stiffener positions and the bending moment variation becomes curved as shown in Fig. 3.11(b). This P-5 effect is of a stabilizing nature as the tension applied to the ends of a curved plate segment tries to straighten it out.
3.5.2.5 Longitudinal bending moments
Longitudinal bending moment plots are given in Fig. 3.12. The scale value M y 0 equals the plastic moment per unit width. The moments are generally distributed in a similar way to transverse bending moments.
3.5.2.6 Transverse shears
Finally, the pattern of transverse shears existing at a rather early stage is plotted in Fig. 3.13. It can be seen that the transverse shear relieves stiffener 1 and loads stiffener 2. When the membrane stresses are fully developed the contribution of transverse shears in transferring the load from stiffener to stiffener diminishes. In these later stages the load is mainly transferred via the vertical component of the transverse membrane force.
3.5.3 Stress resultants in the beams
The structure is now visualized as a series of longitudinal beams, each comprising a stiffener and the section of plate between the centre lines of the two adjacent plate panels. Reference to these beams is subsequently made by the term 'notional beams'. Stress resultants along these beams are presented in the next sections. The same sign convention as for the plate stress resultants is followed in these plots.
3.5.3.1 Axial forces
Axial force distributions along the 'notional beams' are shown in Figs 3.14(a) and 3.14(b). The scale value N 0 equals the squash load of the 'notional beam' cross-section. The first of the figures corresponds to an early stage in the load history. Stiffener 1 is shown loaded partially in tension and compression. This is due to the presence of shearing stresses in the plate, developed due to the larger deflection of stiffener 1 relative to stiffener 2. This behaviour was explained in

42
Section 3.5.2.3.
In Fig. 3.14(b) well-developed membrane action is seen, corresponding to a stage when all the stiffeners have developed plastic mechanisms. It is worth noting the non-uniform tension along the 'notional beams'. Axial displacements of the 'notional beams' are resisted not only by the supports but also by the transverse continuity of the plate. Any differential extension between the stiffeners, mainly due to differential central deflections, causes shearing in the plate and ultimately alters the axial force distribution along the stiffeners.
3.5.3.2 Bending moments
Bending moments along the 'notional beams' are presented in Figs 3.15(a) and 3.15(b), with M 0 being the plastic moment for the nominal beam section. Figure 3.15(a) corresponds to the early bending-governed phase in the plate-stiffener units. In Fig. 3.15(b) the bending moments in the presence of the axial forces shown in Fig. 3.14(b), are given. The reduction in the sagging moments near the centre of stiffeners 1 and 2 is in agreement with the interaction between the flexural and axial stress resultants for the 'notional beam' cross-section. This interaction is given in a non-dimensionalized form in Fig. 3.16. It is easy to verify that the axial forces and the bending moments in Figs 3.14 and 3.15 follow this interaction curve. Identical observations can be made for the hogging moments of the inner stiffeners.
It is worth noting the shape of the curve connecting the centre and the support moments of the stiffeners in Fig. 3.15(b). Along stiffener 1 the curve is convex, indicating the presence of an upwards distributed loading. This opposes the externally applied load, as seen in Fig. 3.17(a). In contrast, a downwards distributed loading is indicated on stiffener 2 and subsequent stiffeners, of the type drawn in Fig. 3.17(a). Bending moments and shear forces on a simply supported beam produced by the loading in Fig. 3.17(a) are illustrated in Figs. 3.17(b) and 3.17(c) respectively. The direction of loading on the stiffeners is corroborated by the shape of shear force distributions along the 'notional beams', as plotted in Fig. 3.18. The curved distribution of shear along stiffeners 2 to 4 shows that the net load applied along the stiffeners has a higher magnitude near the centre of the beams. This behaviour is very similar to the purely elastic behaviour of stiffened plates, as described by Scordelis & Meyer (1969) in the case of multi-cell bridge structures. The only difference is in the source of the distributed forces. In the elastic range the deflections are usually small and transverse shears
produce the distributed force. However, in a fully developed membrane state the vertical component of the membrane forces provides most of the loading, caused by the existence of differential deflections between the stiffeners. In general, the loading on the stiffeners is the sum of these two components.
3.5.4 Discussion of the observed behaviour
A fully restrained longitudinally stiffened deck of single bay appears to develop membrane action from the early stages of the loading history. The magnitude of the transverse membrane stress reaches the yield value in the middle region of the deck when the central deflection is about three times the plate thickness.
In the longitudinal direction, the plate behaves as the upper flange of thelongitudinal stiffeners. If longitudinal beams are adopted to help visualize the structural response then their loading, and the behaviour of the 'notional beams' under this loading, is of interest. They appear to be subjected to distributedloading, as shown in Fig. 3.17(a). The distributed loading is initially due totransverse shear but at moderate deflections the vertical component of the transverse membrane force becomes dominant.
Based on the observed behaviour a new model is proposed in the followingsections of this chapter.
44
3.6 PROPOSED SIMPLE M O D E L F O R FULLY RESTRAINED LONGITUDINALLY STIFFENED D E C K
A model that incorporates the main actions mentioned briefly in the previous section could treat the stiffened deck as a series of longitudinal beams which are fully clamped at their ends. Each beam comprises the stiffener and its effective plate. These beams are connected along their length by transverse plate strips, that is the plate longitudinal bending and extensional rigidities are neglected. As these plate strips are independent from one another, any shearing and torsion action which exists in the deck plate, is also neglected.
Under the action of lateral loading each of the longitudinal beams forms a plastic mechanism with the same mode. This is the characteristic three-hinged mechanism, occurring at limit load. With further loading, axial forces are built up in the beams due to changes in geometry and the extensions associated with these changes. The load on each beam is then carried by a combination of axial force and bending moment. Each of these longitudinal beams is loaded by the externally applied load and the reactions of the plate strips.
In the following sections all the assumptions made in developing the model are checked in turn, differences from the actual behaviour are discussed and further assumptions are made, where appropriate.
3.6.1 Behaviour of the plate between stiffeners
A strip of the deck plate spanning across three panels is shown in Fig. 3.19(a). If this strip is isolated from the rest of the deck plate by two transverse cuts, a model which expresses its behaviour is that shown in Fig. 3.19(b). The end springs in this figure model the axial rigidity of the adjacent panels plus some shearing restraint of the extension of this strip in the panels beyond stiffener 2, see Fig. 3.19(a).
Attention is drawn to the similarity of the systems in Figs 3.19(b) and 3.19(c). Under rigid-plastic assumptions they are identical, as they have the same compatibility and equilibrium equations. Because the rigid-plastic analysis commences at the limit load, the stress resultants at any point along the middle segment of the system in Fig. 3.19(b) are on the yield surface right from the beginning. As this middle segment experiences no changes in rotation, normality postulates that it experiences no changes in extension either. Therefore, the

45
contribution of the middle segment to the compatibility equation is zero and the
system is identical to the one in Fig. 3.19(c).
If the end springs, in Fig. 3.19(c), are assumed to be stiff enough, such that
pull-in is not allowed at the supports, the behaviour of such a strip can be found
in the literature. Haythomthwaite (1957) and Campbell & Charlton (1973)
undertook tests of axially fixed encastre beams of rectangular cross-section under a
centrally applied loading. Load-deflection results obtained by Haythomthwaite
(1957) are presented in Fig. 3.20(a). Both the applied load and the central
deflection are presented non-dimensionalized with respect to the limit load and the
beam depth, respectively. The membrane solution is also indicated in Fig. 3.20(a)
by a dashed line. Test results corresponding to the span to depth ratio of 64, due
to Campbell & Charlton (1973), are indicated by the small circles in Fig. 3.20(b).
Comparison between the test results and the membrane solution shows that the
latter is a good aproximation of the behaviour of beam strips, similar to the one
shown in Fig. 3.20(a), especially for span to depth ratios in the range of 20-65.
Whether the membrane solution represents the plate behaviour in the transverse
direction is investigated next. For this, the load applied by the plate on a stiffener
in deck R02 is calculated. From FINAS analyses the transverse shear and the
vertical component of the transverse membrane force were summed up and plotted
against the differential deflection between two adjacent stiffeners. For the
membrane component, the shape of the deflected plate was considered to be linear
between the stiffeners. Results are presented in Fig. 3.21(a). The data points in
this figure correspond to various locations in the plate along stringer 1 at various
load steps. The positions of the sampling points are given in Fig. 3.2. The
deflection 5 1 2 (y) on the horizontal axis in Fig. 3.21(a) is the differential
deflection between stiffeners 1 and 2 at the longitudinal position y defined in Fig.
3.19(a). Six values are given for each point in Fig. 3.2, corresponding to the load
factors 1.21, 1.32, 1.56, 2.35, 3.15 and 3.50.
The two straight lines also plotted in Fig. 3.21(a) are based on the assumption
that the behaviour of deck plate follows the membrane solution in the transverse
direction. The continuous line in this figure assumes that the transverse stress in
the plate reaches the yield stress Oy, while the dashed line assumes the stress
reaches 1.155<Ty. It is seen that the data points from the numerical analysis of
deck R02 lie within the two lines when 5 1>2(y) is m excess of 2 to 3 times the
plate thickness. This strongly supports the idea that the plate strips can be
assumed to be represented by the membrane solution.
46
Figure 3.21(a), also shows that, the data points eventually converge on the dashed
line. This is as a result of stress biaxiality in the plate. As shown in Fig. 3.21(b)
a transverse stress equal to 1.155oy is reached on the yield locus at point A.
Normality postulates that sampling point positions as shown in Fig. 3.2 experience
excessive straining in the transverse direction as compared to the longitudinal
direction. The last point supports the assumption of having transverse plate strips
connecting the 'notional beams' spanning in the longitudinal direction.
Figure 3.6(b) shows the transverse membrane forces in the plate to be arround
the yield value Nx0. In the following the assumption is made that each of the
transverse plate strips is modelled by the membrane solution and is under stress of
0*.
3.6.1.1 Loading applied along the stiffener
Figure 3.22(a) shows, schematically, the complete load versus deflection relationship
of a plate strip spanning between stiffeners, where the horizontal axis represents
the differential deflection between the stiffeners, non-dimensionalized with respect
to the plate thickness, at any longitudinal location of the beam strip. After the
initial discrepancy the actual behaviour is close to the membrane solution. Provided
that the stiffeners remain straight as they deflect, the load applied along the
stiffener can easily be calculated using Fig. 3.22(a), as shown in Fig. 3.22(b).
3.6.1.2 Loading along a stiffener with increasing deflection
As the difference between the central deflections of two adjacent stiffeners
becomes larger, the part of the plate near the centre of the stiffener attains the
membrane solution. In this case the load pattern on the stiffener has the shape
shown by the solid line on Fig. 3.22(c). It can be seen that the loading consists
of two parts: a linearly varying part over the centre of the beam and a
non-linear part near the support. In the proposed model the loading is assumed to
be linearly distributed between the support and the centre line, as shown by the
dashed line in Fig. 3.22(c). As the difference in the stiffener central deflections
increases, a larger segment of the stiffener experiences the assumed loading. More
importantly, the assumed membrane loading coincides with the actual load over the
central part of the stiffener, which is the region contributing more significantly to
the equilibrium equation. Thus, as the difference in the central deflections
increases, the extent of the region over which the loading is overestimated is

reduced and its contribution to the equilibrium equation diminishes.
3.6.1.3 Plate reaction on the stiffeners
The assumption of purely membrane behaviour for the plate in the transverse
direction has been seen to be close to the behaviour observed in numerical
analysis. The effects of the assumption on the load applied by the plate to the
stiffeners is now explained.
The plastic plate behaves like a membrane. It lacks flexural rigidity, but it has
geometric stiffness, that is, stiffness due to its shape. Figure 3.23 shows a plate
strip of unit width between two stiffeners. The vertical reaction q of such a strip
is given by:
q - t o^sina. . - t crt s in( tan *(—A— ) (3.1)J>J j , j + l
where 5j and 5j+j are the deflections of stiffeners j and j+1, b j j+ j is the
spacing between stringers j and j+1 which is assumed to remain constant, and
o'j.j+l is the angle of inclination of the plate in the transverse direction between
stiffeners j and j+1. The plate thickness is t and <7* is the plate stress in the
transverse direction. For small transverse angles we have:
s i n ( a . . . 1) - a . . , 1 J.J+1 J . J + l
Considering the horizontal equilibrium of plate forces on both sides of a stiffener,
the two components cancel each other if the membrane stress is the same on both
sides of the stiffener (small angle approximation).
The vertical component of the loading applied by a plate strip of unit width
spanning between the centres of stiffeners j and j+1 can be approximated as:
q -b j J +1
.J V i >
(3 .2 )
using the simplification made above, that is,
48
s , n < « j ) j+ 1 ) ( 5 .i - V i >
b j . j +i
(3 .3 )
Figure 3.24 shows that the effect of this approximation is to overestimate the
vertical component of the transverse plate stress. However this overestimation is
small, being essentially zero for small deflections and increasing to nearly 1 % at:
5 . J
bj »j +1
0.40
3.6.2 Bilinear mechanism assumption
Any difference between the assumed bilinear mechanism and the actual deflected
shape of the stiffener has a double effect. It affects the way in which the axial
forces are built up in the 'notional beams'. It also alters the distribution of the
reacting forces along the stiffeners provided by the plating.
3.6.2.1 Effect on the axial forces in the beams
To enable comparison between the bilinear shape assumption made and the
behaviour observed in the numerical analysis of deck R02, the deflected shapes of
two adjacent stiffeners 1 and 2 are given in Fig. 3.25. It is clear that the bilinear
mechanism is a simplification of the actual behaviour. For a particular central
deflection the curved stiffener shapes in Fig. 3.25 need bigger extensions than
those required by the bilinear mechanism. Therefore, one could expect the bilinear
mechanism to predict smaller axial forces than those in the actual structure.
However, it is rather inappropriate to draw any conclusion from this brief
discussion. The effect of the 'notional beams' bilinear mechanisms is further
discussed in Chapters 4 and 5.
3.6.2.2 Effect on the loading along the beams
In a simplified model, the bilinear mechanism is the simplest assumption that
could be made. With this mechanism the difference in the deflections between two
adjacent stiffeners is distributed triangularly along the stiffeners. It was pointed out
in Section 3.6.1.3 that the vertical component of the transverse membrane force
varies linearly with the differential deflection between two stiffeners, provided that

49
the differential deflections between the stiffeners are small. The implication of this
linearity is that the loading along a stiffener is distributed triangularly.
The error in the loading calculated by adopting the bilinear mechanism is the
difference between the 6,-62 curve in Fig- 3.25 and a straight line connecting
the central differential deflection with the support. Generally the load along the
stiffener is slightly overestimated if the bilinear mechanism is adopted, for a
particular difference in the central deflections.
3.6.3 Interaction between the stress resultants in the 'notional beams'
The plate is under plane stress conditions. Elastic stresses can be estimated from
strains. Once the plate develops plasticity the incremental flow rule is adopted,
implying that the ratio of the strain increments at a point defines the ratio of
stresses. In this way biaxiality affects both the magnitude of the transverse
membrane stresses and also the width of the effective plate which acts together
with the stiffeners. The plate can be assumed to follow the membrane solution in
the transverse direction, as was discussed in Section 3.6.1. The effect of stress
biaxiality in the plate on the uniaxial interaction for the 'notional beam'
cross-section represented in Fig. 3.16 by the continuous line, is discussed next.
The stress resultants for a stiffener and the associated plate are compared with the
uniaxial interaction discussed in Section 3.5.3.2. This comparison is made in Fig.
3.16. Data points at five load steps corresponding to the four stiffeners are shown
in this figure. The points on the lower part of this figure correspond to the Gauss
points closer to the transverse central line, and are under sagging moments. On
the upper part, the stress resultants of the Gauss points closer to the transverse
support are shown. It can be concluded, that the uniaxial interaction between the
stress resultants for a stiffener and the associated fully effective plate can still be
used to represent the interaction between the stress resultants of the longitudinal
stresses, even if the plate is under biaxial stress state.
Some of the points, located at the upper part of Fig. 3.16 and corresponding to
Gauss points which are closer to the transverse support, lie just outside the
uniaxial interaction. This is due to the biaxial stress state in the plate. Points in
the plate, located close to the transverse support, experience nearly zero straining
in the transverse direction. In the longitudinal direction, the plate is strained as it
forms the top flange of the 'notional beams'. Excessive straining in the
longitudinal direction relative to that in the transverse gives a stress point near

50
point B on the biaxial interaction between the principal stresses, as shown in Fig.
3.21(b). Point B has a longitudinal stress of 1.155 times the yield stress. The
uniaxial interaction, shown on Fig. 3.16, has been drawn for the 'notional beam'
cross-section on the assumption of a top flange width of b and stress block at the
yield level. Accounting for stresses higher than yield, in the top flange, an
alternative interaction can be drawn. This should consider the modified stress
resultants obtained for a cross-section in which the top flange is 1.115b wide and
the stress block at yield. If an interaction is drawn, in which the modified stress
resultants are normalized with respect to their plastic values for the 'notional
beam' cross-section, all the points shown on Fig. 3.16 are deemed to lie within
it.
3.6.4 Structural elements in the longitudinal direction
The beams can be classified into two categories. The first comprises the externally
loaded stiffeners and the second comprises the stiffeners loaded by the plate only.
3.6.4.1 Stiffeners with externally applied load
The central stiffeners experience two types of loading, one is the externally
applied load and the other is the deck reaction. If an axially restrained beam is
under a pattern of distributed loading it attains a given shape, which is function
of the applied loading pattern. This is explained in Chapter 5. An additional
problem with the system under consideration is that these two load components
are not proportional. As the ratio of the magnitudes of the two components of
the load changes, it is difficult to predict precisely the behaviour of such a system
by assuming a single deformation mode for the structure. Under a continuously
changing pattern of loading, there is no simple method, in terms of generalized
coordinates, that could accurately predict the behaviour of the beam. For such a
problem a method that could account for continuous mode-shape changes is more
appropriate.
Assuming that the deflected shapes of both stiffeners 1 and 2 can be approximated
by bilinear mechanisms, and further that the ratio of the central deflections 5 2/ 5 ,
is fairly constant throughout the deformation history, then the load applied by the
deck on beam 1 as the vertical component of the transverse membrane forces, can
be assumed to be given by linear springs. Then the analogy of an axially
restrained beam on elastic foundation arises and this behaviour is studied in
51
Chapter 4. It is also shown in Chapter 4 that the bilinear mode assumption can
be adopted for a simplified analysis.
3.6.4.2 Stiffeners not externally loaded
If all the stiffeners are assumed to form bilinear mechanisms as it was assumed
above for the two inner stiffeners of the bay, this results in stiffeners loaded by
triangularly distributed loading along their length. This triangular loading is applied
on both sides of a stiffener and comes as a reaction of the plate strips. The
stiffener is axially restrained and is loaded by triangularly distributed loading.
The behaviour of axially restrained beams under symmetric distributed loading is
studied in Chapter 5. The case of triangular loading is studied as a special case,
and further comments on the biaxial mode of deformations are made.
3.7 CONCLUSIONS
A fully restrained longitudinally stiffened bay exhibits similar structural behaviour in
the large deflection regime as under small deflections. By this it is meant that a
similar distributed loading exists along the beams, although the source of the
loading differs in the small and large deflection regions.
The restraint against pull-in produces considerable membrane action. For example
stresses of the order of the yield stress are generated at deflections of about twice
the plate thickness.
Transverse shear forces and the vertical component of the transverse membrane
force in the plate combine to transfer the load between adjacent stiffeners. The
latter becomes dominant at deflections in excess of twice the plate thickness.
On the basis of these observations a simplified model of the behaviour was
proposed. In this, the deck is considered as a series of longitudinal beams
connected in the transverse direction by plate strips that follow the membrane
solution. The assumptions made were discussed and compared with the behaviour
observed in the finite element analysis, and the differences were found to be
acceptable for a simplified analysis. The formulation of the proposed model and
checks of its validity are presented in Chapter 6.

52
TABLE 3.1 C ross-sectional geometry
DECK G E O M E T R Y ( MATERIAL
No. ( 0 St (mm) b /t h / tvr w b f / t f L/b E/O-y
R 0 2 ^ 4.76 26.67 14.99 10.50 6 837
(O t w t
( 2 ) For notation see Fig. 3.1(b)

53
b
Fig. 3.1 Deck and stiffener geom etry

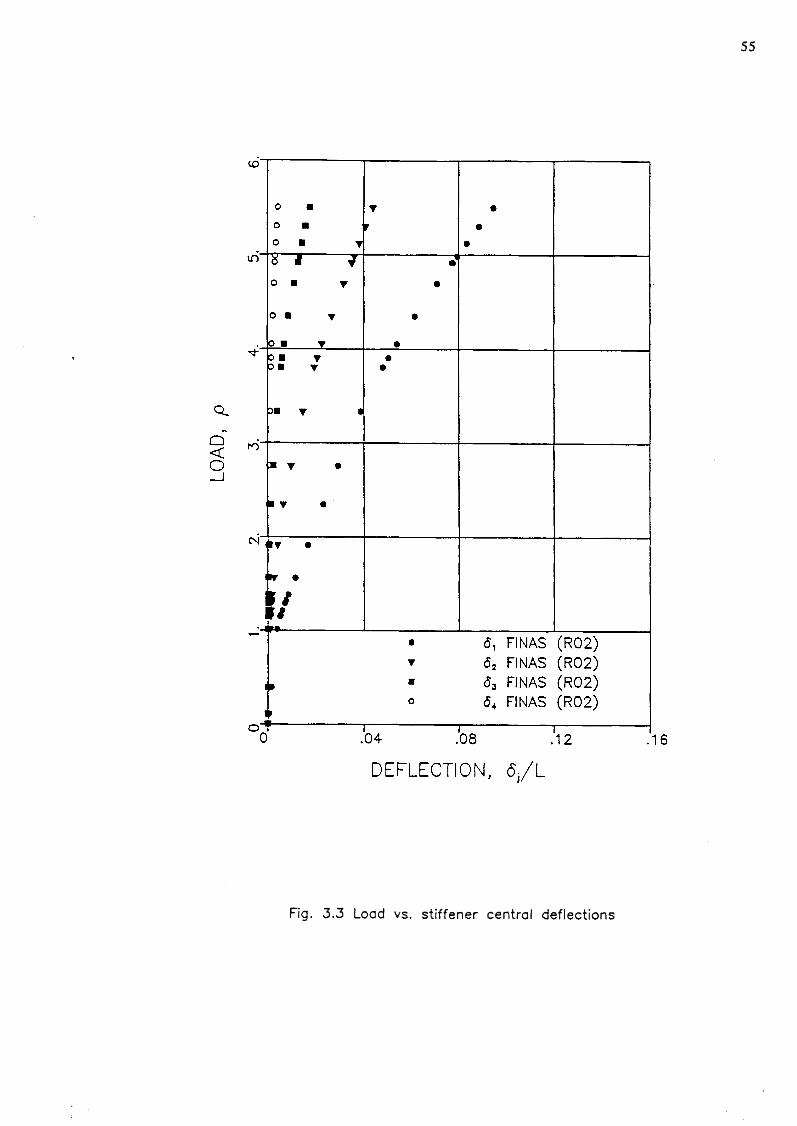
55
F ig . 3 . 3 L o a d v s . s t i f f e n e r c e n t r a l d e f l e c t i o n s

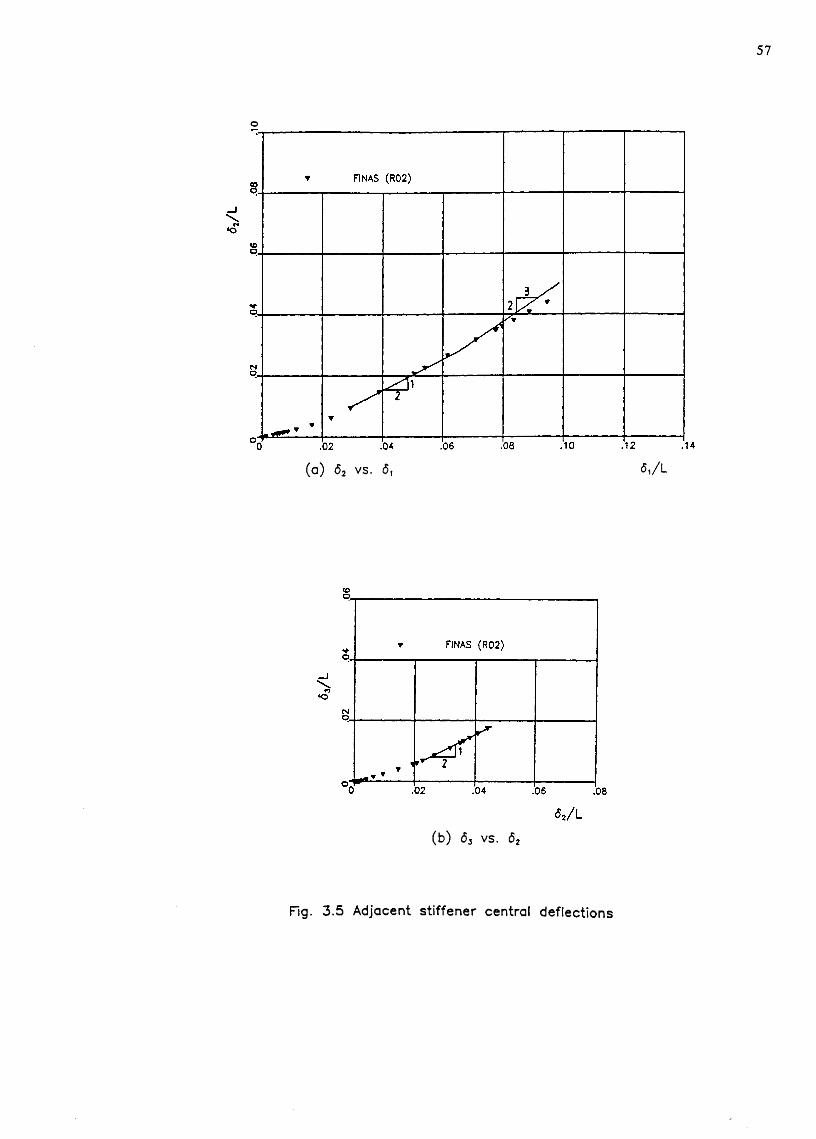
o
(a) <52 vs. 5, <5,/L
(b) <53 vs. d2
Fig. 3.5 Adjacent stiffener central deflections
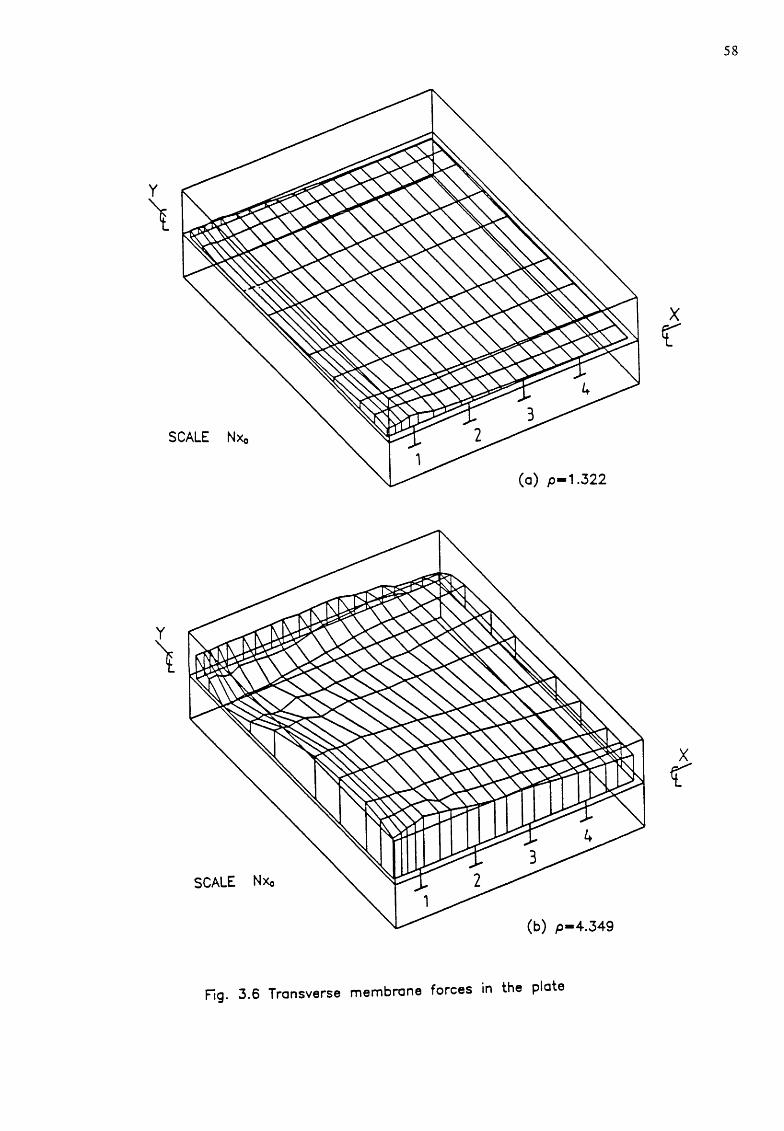
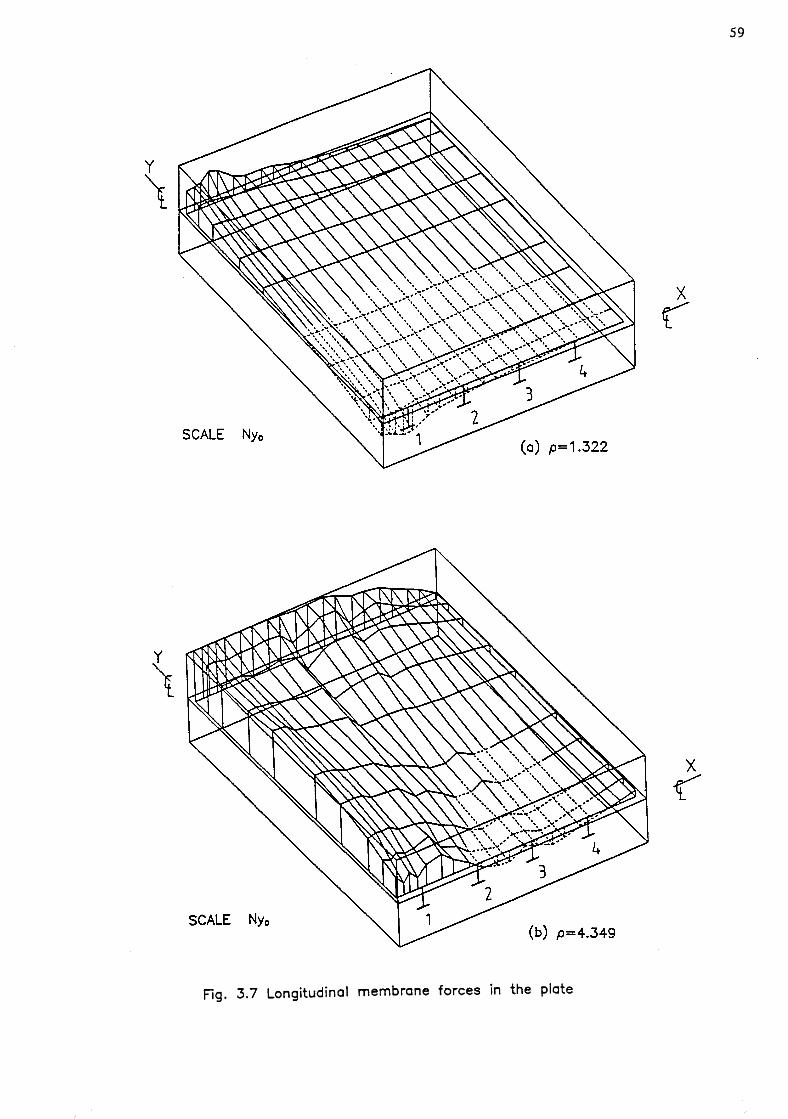
59
Fig. 3.7 Longitudinal membrane forces in the plate


(a) Shearing in the plate loads adjacent stiffeners
(b) Axial forces in stiffener 1 due to shearing in the plate
Fig. 3.9 Effect of shearing in the plate on stiffener 1


63
(b ) Bending m om ents
Fig. 3.11 P—5 e ffect in the plate

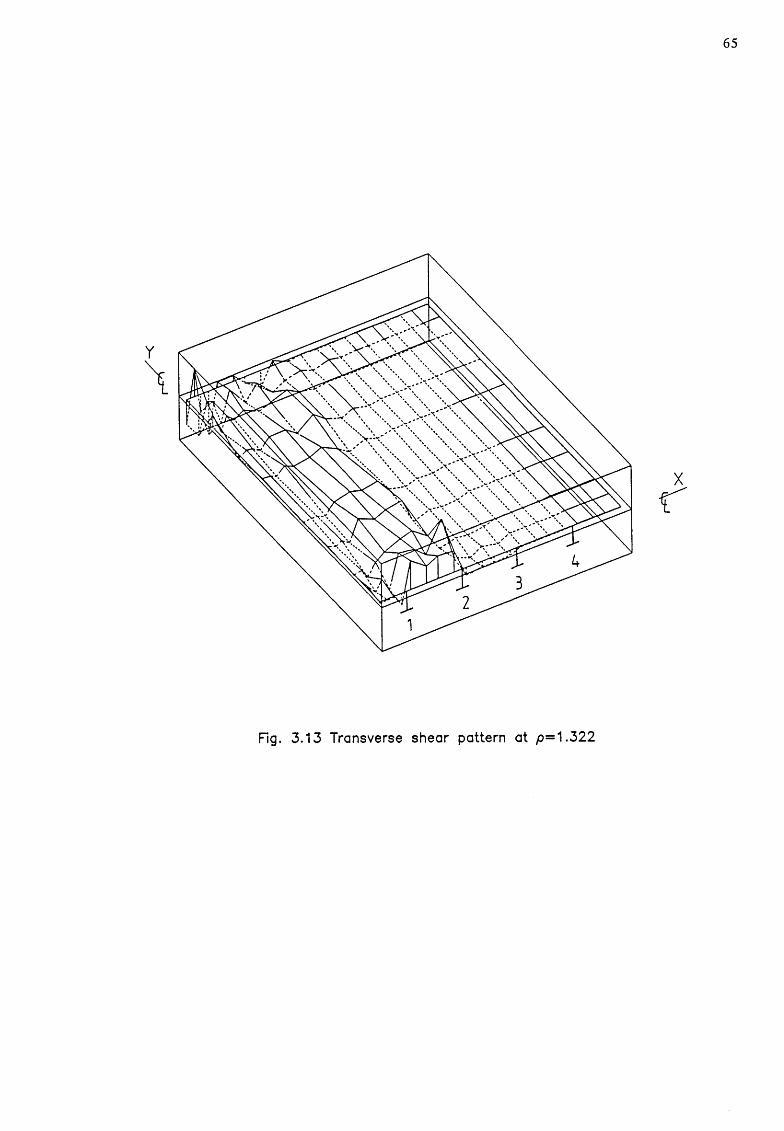


67
Fig. 3.15 Bending moments along the notional beams

At p= 1.3222 At p=2.3457
68
oo
► ■
• O
x
Fig. 3 . 1 6 S t r e s s r e s u l t a n t s i n t e r a c t i o n fo r t h e n o t io n a l b e a m c r o s s - s e c t i o n
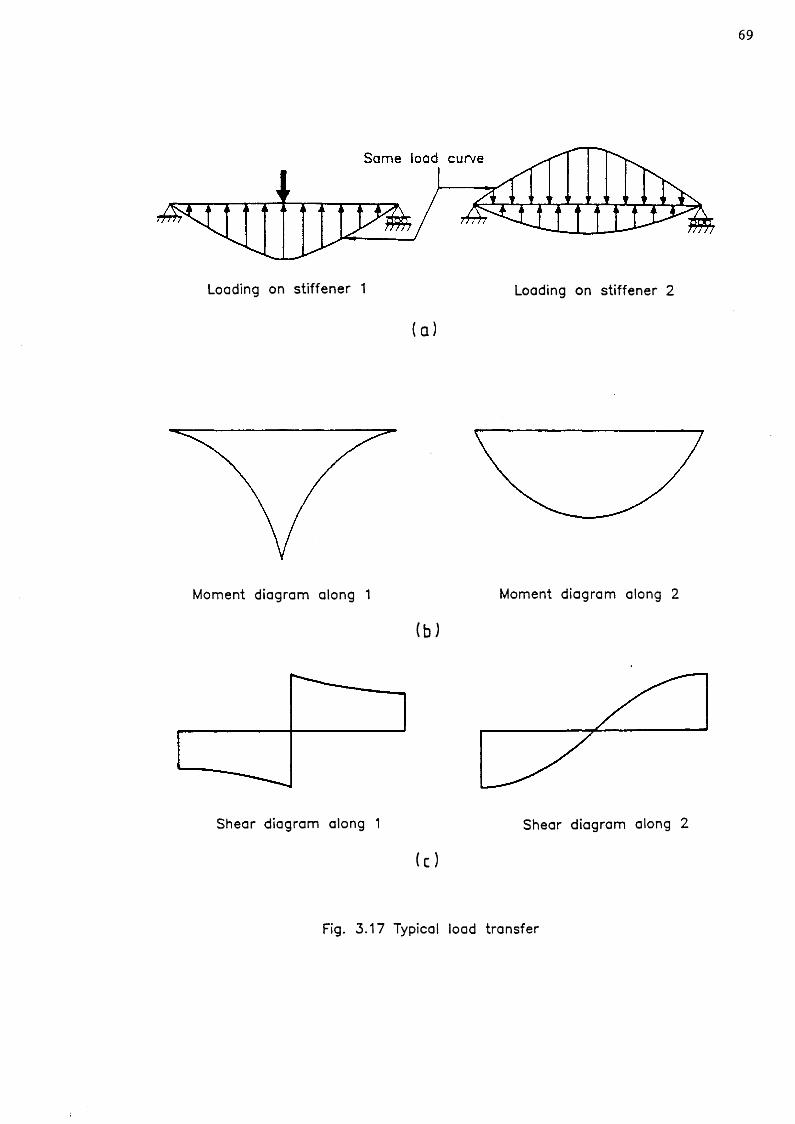
Loading on stiffener 1 Loading on stiffener 2
(a)
Moment diagram along 1 Moment diagram along 2
(b)
Shear diagram along 1 Shear diagram along 2
(c)
Fig. 3 .17 Typical load transfer


72
Q.
Fig. 3 .2 0 Load-deflection predictions fo r an encastre beam under point load.

LOA
D.
<7,tV
b
DEFLECTION, <5u (y)/t
Fig. 3 .2 1 (a ) Load on stiffener 1 vs. differential deflection
* See Fig. 3.2
Fig. 3 .2 1 (b ) Biaxial interaction between the principal stresses
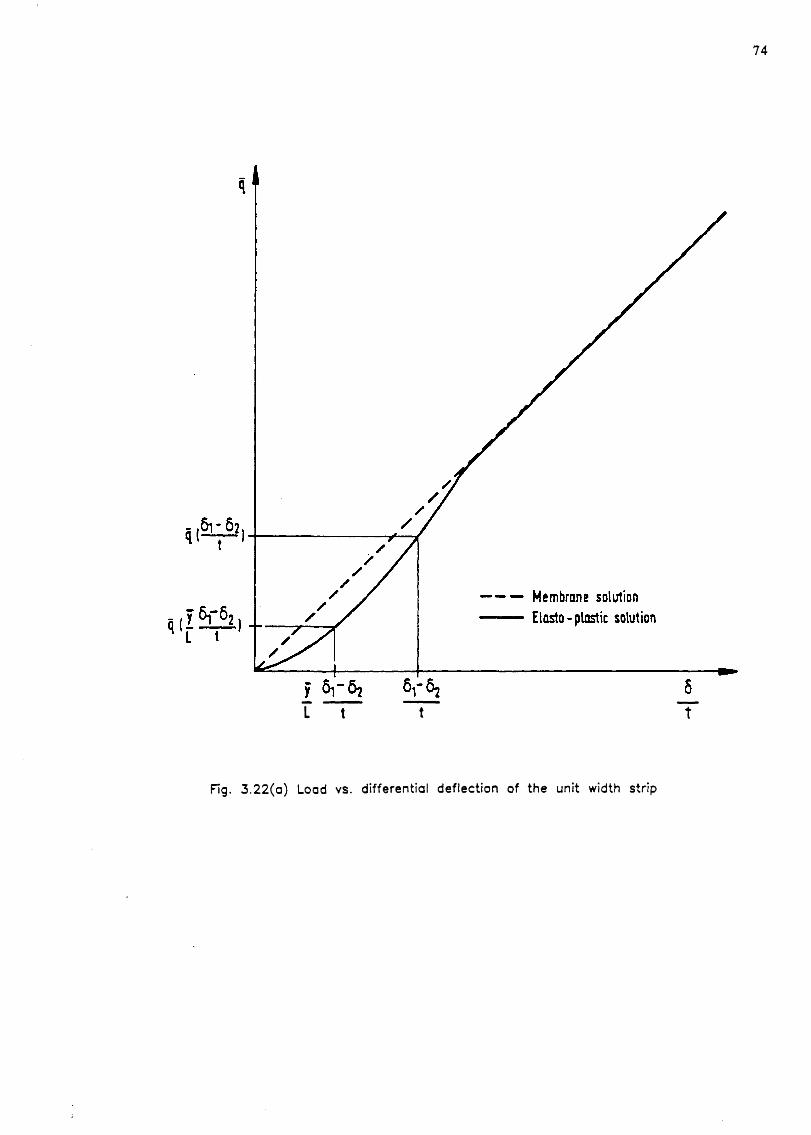
74
L t t t
Fig. 3 . 2 2 ( a ) L o a d v s . d i f f e r e n t i a l d e f l e c t i o n o f t h e u n i t w id th s t r i p

75
i
Fig. 3.22(b) Load applied on a stiffener
Fig. 3.22(c) Load on the stiffener after the plate strips close tothe middle of the beam attain the membrane solution.

76
Fig. 3.23 Unit width plate strip under a*
Fig. 3.24 Investigation into the actual angle effects
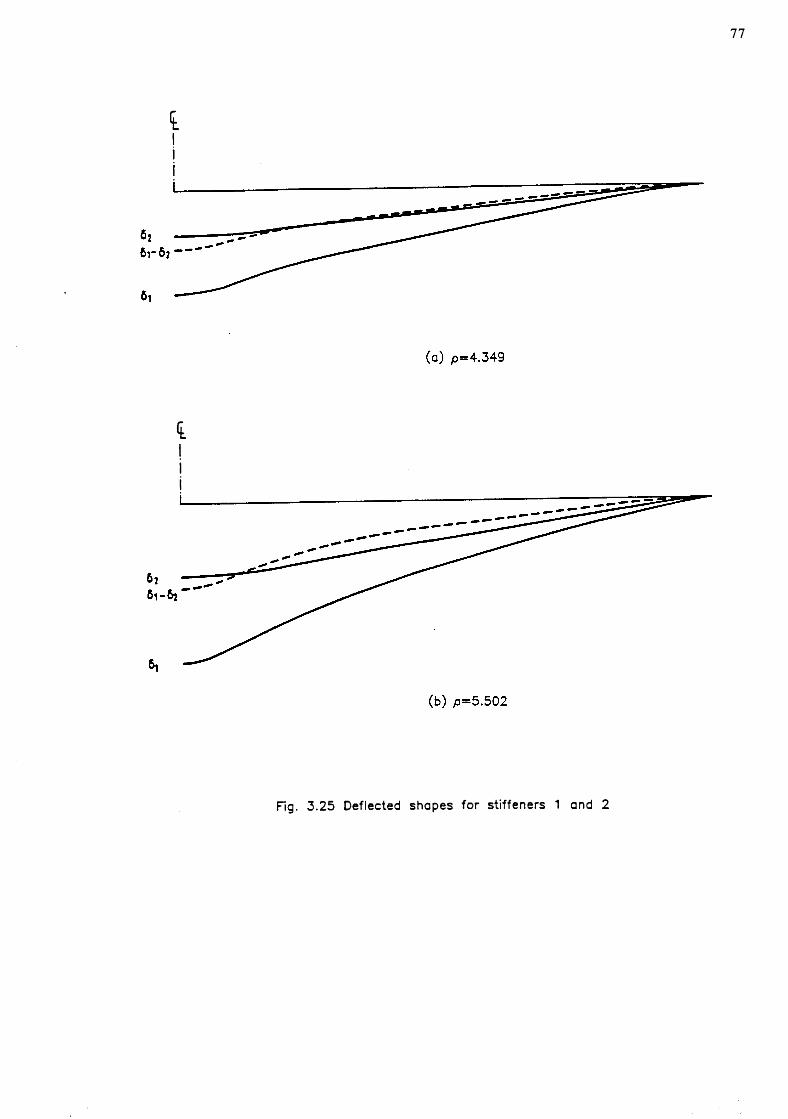
77
i
1i
Fig. 3.25 Deflected shapes for stiffeners 1 and 2

78
CHAPTER FOUR
AXIALLY RESTRAINED BEAMS O N A N ELASTIC F O U N D A T I O N
4.1 INTRODUCTION
If a stiffened deck restrained against pull-in is subjected to a centrally applied
patch loading, the stiffeners directly under the patch loading can be viewed as
beams on elastic foundations as discussed in Chapter 3. The objective of this
chapter is to obtain an insight into the behaviour of axially restrained Beams on
an Elastic Foundation (BEFs), under centrally applied lateral patch loading using
finite elements as a reference and comparing the results with those obtained from
an analysis assuming a bilinear deformation mode as discussed in Section 3.6.
4.2 CHOICE O F T H E G E O M E T R Y
Three geometries concerning BEFs are considered in this chapter. The first,
corresponds to the cross-sectional configuration of a notional beam in deck R02,
analysed in Chapter 3. This geometry is called BEFR02 and its cross-sectional
configuration is shown in Fig. 3.1(b) with the proportions given in Table 3.1. The
other two geometries, correspond to typical plate-stiffener units existing in decks
R03 and R04 considered in Section 6.7. These two geometries are called BEFR03
and BEFR04 respectively. The cross-sectional configuration of BEFR03 is shown in
Fig. 4.1, with the proportions given in Table 4.1, while the BEFR04 configuration
is similar to BEFR02, but with the proportions given in Table 4.2.
The elastic foundation simulates the reaction of surrounding deck plate on the
stiffener and may be modelled in the finite element analysis via linear springs of
constant stiffness distributed along the beam length. The distributed spring stiffness
kg is derived from Eqn. (3.2), which involves the deflections of stiffeners 1 and 2
with the notation shown in Fig. 3.4. As the present analysis involves the central
deflection of stiffener 1 only, an average value for the 8 2/ 5 A ratio was determined
after the analyses of decks R02, R03 and R04 had been undertaken. The

79
distributed spring stiffness was calculated using the formula:
k t o,t 5
y 1,2 y 1
with the notation as described in Sections 3.6.1 and 3.6.1.3, and values for kg
corresponding to the various beams analysed are shown in Table 4.3.
As the distributed springs model the reactions of the deck plate on the externally
loaded stiffener 1, according to the notation in Fig. 3.4, the overall load versus
central deflection behaviour of the decks studied in Chapter 3 and 6 can be
predicted by analysing this BEF model. Comparisons between the response of the
deck and the BEF representation are presented later in this chapter.
The patch loadings applied to the BEFs analysed by finite elements were identical
to those applied in decks R02, R03 and R04. In the analytical model presented
this loading is considered as a point loading.
4.3 NUMERICAL ANALYSIS
The finite element program FINAS, described in Section 3.3, was used for these
analyses. The 3-D beam element, developed by Bates (1987), was chosen to
model the beams. For the modelling of the springs, the spring element,
implemented initially by Elnashai (1984) as bond-slip or contact element, was
used.
The mesh chosen in the present analyses corresponds to the one shown in Fig.
3.2 along the stiffeners. Mesh convergence studies were also undertaken with
different meshes having five, six and twelve elements along the semi-span
analysed. The twelve element mesh was uniform, as opposed to those with five
and six elements. In the graded mesh cases the nodal spring stiffnesses were
properly weighted in order to give uniform stiffness along the beam length. It was
found that the difference in the load versus central deflection predictions between
the five and twelve element meshes was less than 0.5% throughout the range.
Therefore the five element mesh, as shown in Fig. 4.2(b), was adopted for the
BEF study. The cross-section is provided with a number of sampling points
(stations) through its depth for the better modelling of plasticity. These stations
are also shown in Fig. 4.2(a) for the two cross-sectional configurations considered
80
in this chapter.
4.4 ANALYTICAL M O D E L
Under the centrally applied point load the BEF is assumed to deform following
the incipient velocity field, that is, the collapse mode at limit load. This is a
bilinear mode with a central plastic hinge and hinges at the supports. These
hinges may be either real hinges at the ends of a simply supported beam or be
plastic hinges which would form at encastre supports.
4.4.1 Assumptions
The following assumptions are made in this first derivation (although some will be
revised in a later section):
1) As customary in this type of analysis, a rigid-plastic material law for plastic
hinges is adopted.
2) The rotations undertaken by the longitudinal beam segments, in order to form
the bilinear mechanism, are assumed to be small.
3) The beam deforms in a single mode, described by the bilinear mechanism
discussed in Section 3.6.
Several assumptions can be made in the formulation of the compatibility
equation of the beam. In increasing order of complexity these are:
4a) The ends are fully restrained and there are only rigid-plastic
contributions to the compatibility equation.
4b) The ends are fully restrained and both elastic extensibility of the beam
between plastic hinges and rigid-plastic contributions are included in the
compatibility equation.
4c) The ends can pull-in elastically, in addition to the allowances made in
(b).
4.4.2 Compatibility equation
Assumption 4(c) is made here. In this derivation Ronalds' (1985) approach, after
the analyses presented by Jones (1973) and Hodge (1974), is used.
For the bilinear mechanism shown in Fig. 4.3(a), the spring stiffness k models the
stiffness of the support. Simple geometry gives:

81
(L-A)2 + 5C2— (L+e)2
where
Pe + e r
After expansion in a Taylor series and truncation we get the approximation:
1 5 ^ A e6- * - ( - £ ) ------------L 2 L L L
e S + (X - l) e h-------------- (4.1)L
Here A is the elastic pull-in at the support, ee is the elastic extension of the
beam between the support and the central hinge, 5C is the central deflection, L is
the half-span of the beam and es, e*1 are the plastic extensions at the sagging
and hogging plastic hinges, respectively, which together give the total plastic
extension eP. Finally, X is the number of plastic hinges (X=l, 2, for simple
supports and encastre supports respectively).
The axial force in the beam is approximately equal to its horizontal component,
N, shown on Fig. 4.4. This force is non-dimensionalized with respect to the
squash load N 0=OyA and denoted by n. Here A is the beam cross-sectional area
and <Ty is the yield stress. The combined elastic contributions in the compatibility
Eqn. (4.1) are
ee+ A - n ^ E
1(1+ - )L
where E is the elastic modulus and /i, is defined as:
k L
E A
Differentiating Eqn. (4.1) with respect to 5C yields:

82
1 aa + - >
/i E
dn deS+ ( \ - l ) d e ^-------- + ---------------------d$c/L (d5c/L )L
5(4 .2 )
The interaction between the axial and flexural stress resultants at a plastic hinge
can be expressed as
m* — C* + C* n + C* (4 .3 )02 03 04
where C l0 2 , Cl03> 4 are coefficients depending on the cross-sectional geometry,
as described in Appendix A. Equation (4.3) is applicable to cross-sections made
up by the assembly of up to three rectangles, I-sections for example. Expressions
for the coefficients are given by Ronalds (1985, 1990). The superscript i takes the
values s and h for sagging and hogging plastic hinges respectively. Finally, m1 is
defined as follows:
ii M m — —
Mo
with Ml being the moment at a plastic hinge i and M 0 the plastic moment of the
beam cross-section in the absence of axial force. The ratio
de*
d8c/L
is the ratio of the centroidal axis extension/contraction increment at a plastic hinge
i to the corresponding infinitesimal change of beam inclination d5c/L=d0. As
shown in Fig. 4.3(b)
d e 1 l-------- = zd 5 c / L
where z1 is the distance between the instantaneous centre of rotation and the
centroidal axis. This approach is based on the incremental theory of plasticity, Hill
(1950). From normality,
izdM1 Z dm1___ ______ P ___dN A dn
(4 .4 )

83
In the above expression Zp is the cross-sectional plastic modulus. Equation (4.2)
then becomes:
1 o' dn z S+ ( X - l ) z ^ 5( l + - > JL -------- + --------------------------£ - o
/x E d5c/L L L
Using Eqn. (4.3) and defining the coefficients as:
Ci
1 <7d + - ) - 2
u Ei
(4 .5 )
CQZ
<-*>AL
+ (X-l)C for Q - 2, 3, 4
Equation (4.5) becomes:
dn 5C ------------2 C n - C -------- = 0 (4 .6 )
d5c /L L
making use of Eqn. (4.4) as well. Equation (4.6) is the full compatibility equation,
with general solution of the form:
2 C 8 1 8 C C2 C C 3 1n = C exp(------------ ) -------------------------------------- j (4 .7 )
C T 2C L 2C 4C1 ^ 2 2 2
where, C is a coefficient calculated from the initial values for the horizontal
component of the axial force, nj, and the central deflection, 5jc . In the particular
case of rigid supports which cannot pull-in (assumption 4(b) in Section 4.4.1)
then:
00 and C i = (ry/E
If, further, only rigid-plastic extension contributions are considered (assumption
4(a) in Section 4.4.1) then
C - 0

84
and Eqn. (4.6) can be solved to give the n value:
1 8n ---------- (— + C ) (4.8)
2C L2
For supports rigid against pull-in, the most suitable choice between (4.6) and (4.8)
is dependent on the cross-sectional geometry of the beam. If elastic extensions are
not very small in comparison with plastic extensions throughout the deformation
history Eqn. (4.6) should be used. Two cases were experienced by the author
where Eqn. (4.6) was significantly more accurate than Eqn. (4.8). The first is an
encastre beam with asymmetric I-section deforming from the initial condition nj =
0. In this case the extensions at the support and centre hinges are of opposite
sign at early stages of the behaviour and, therefore, the elastic extensions may be
considerable in comparison with the net plastic extensions. The second case is a
cruciform section with wide horizontal segments, see Fig. 4.1. As this cross-section
is symmetric, the centroidal axis lies inside the horizontal segment. For much of
the response, the instantaneous centre of rotation also lies inside the horizontal
part of the section and thus its distance from the centroidal axis is small.
Therefore the increment of plastic extensions corresponding to a small increase in
the deflection 5C, that is,
<zs + (X - l) z h ) (d 6 c/L )
is proportional to the term
z s + (X -l)z*1
which is small and therefore the plastic extensions are comparable with their
elastic counterparts.
Finally, an extreme case is mentioned. It occurs when only one plastic hinge is
present and the beam centroidal axis contracts at the hinge location. This
happens, for example, in the case of a simply supported beam of an asymmetric
I-section having the bottom (tension) flange bigger than the top one, while nj «
0. Here elastic extensions must be considered. The axial force build-up shifts the
plastic neutral axis towards the centroidal axis. Plastic extensions, therefore,
become increasingly less for a given change in the rotation of the mechanism, as
the centroidal axis is approached. The conclusion drawn from this discussion is

85
that rigid-plastic analysis, without elasticity effects, should be used with care, as its
accuracy is very dependent on the geometry under consideration.
It is noted that in all the above remarks concerning the choice between Eqns
(4.6) and (4.8) a bilinear mode is assumed. As discussed in later sections this
mode is an approximation for BEFs.
4.4.3 Equilibrium equation
The structure under loading is shown in Fig. 4.4. Consideration of the equilibrium
of moments with respect to the support yields
PL k 5 L2 ,------ — + MS + ( \ - l ) M h + 5 N
2 3 C
because of no shear at mid-span due to symmetry in both the structure and the
loading. Here P is the externally applied concentrated loading. If we
non-dimensionalize the applied load with respect to
2XM
where P 0 is the limit load of the beam under central point loading, we obtain:
P1
X
■ k L3 5 AL 2 5—5----- £ + — (c r i + C n + C + — n)
. 3cr Z L Z 2 3 4 Ly P P
(4 . 9 )
4.5 COMPARISON B E T W E E N ANALYTICAL A N D NUMERICAL RESULTS
The analytical model proposed in Section 4.4 was used to predict the behaviour of
the BEF geometries mentioned in Section 4.2. The results obtained from the
analytical models are compared with numerical results generated using finite
element analysis. This comparison concerns the applied load histories and the axial
force with increasing central deflection.

86
4.5.1 Applied load versus central deflection
The predicted strength increases with increasing deflection for the three beam
geometries considered are illustrated in Figs 4.5 to 4.7. The results of the analysis
are plotted as continuous lines, while the numerical predictions for the BEF are
represented by full circles. Both compare very well at the early stages of the
behaviour, up to a deflection of the order of 6 % of the half-beam length L.
Subsequently, the two predictions diverge with the analysis always predicting higher
values than those obtained by finite elements. This phenomenon is investigated in
detail in a later section of this chapter.
Comparison between the behaviour of a deck and its corresponding BEF model is
also made. The central deflection from a BEF analysis is compared with the
central deflection of a loaded stiffener in the deck (stiffener 1). Results
corresponding to the deck behaviour is plotted using full squares. The comparison
shows that at moderately large central deflections, that is, in the range of
deflections 0.02L-0.06L, the deck exhibits slightly higher strength than the
corresponding BEF model. At deflections in excess of 0.10L approximately,
however, the deck response falls closer to the numerical predictions of the BEF.
The elastic prediction, as obtained from Hetenyi (1946) after modification of the
central deflection due to transverse shear deformation, is also given in these plots
by a line under the key 'elastic'. For the geometries studied here the transverse
shear deformation appeared to be a significant percentage of the total elastic
deflection, accounting for as much as 15% of the deflection in one of the cases
studied.
4.5.2 Axial force along the beams
Figures 4.8 to 4.10 illustrate the manner in which axial force builds up in the
BEFs under increasing central deflection. The same symbols are used as in Figs
4.5 to 4.7. The agreement between the analysis and the finite element results is
very good for central deflections less than about 0.06L, but at higher deflections
the divergence can become considerable, especially for the cruciform geometry
BEFR04, as shown in Fig. 4.10. The source of the discrepancy between the
predictions for the axial force is further investigated in the next sections.
87
4.6 DEFLECTED SHAPE PLOTS
To understand the discrepancies which occur in the predicted growth of axial force
with deflection, it is worth re-examining the assumptions made in deriving the
compatibility equations and comparing them with those implicit in the numerical
analysis. The assumption concerning the deflected shape is re-examined in this
section.
The deflected shapes at the various load levels for the three BEFs analysed are
shown in Figs 4.11 to 4.13, corresponding to numerical analyses BEFR02, BEFR03
and BEFR04, respectively. These figures show a gradual departure from the
assumed bilinear mode-shape as the deflection increases. Following the initial stage
of bilinear deformation, the segments near the supports cease to deflect. This
results in a shorter length of the beam experiencing rotation, as illustrated
schematically in Fig. 4.14(a). These observations suggest that the support hinge is
spreading towards the middle of the beam. The elastic segment between the beam
centre and the inner edge of the plastic segment experiences higher incremental
rotation than that assumed by the bilinear mechanism. This incremental rotation is
schematically shown in Fig. 4.14(b). The increment of rotation at the ends of the
elastic segment BC having a horizontally projected length equal to y L ( y < l ) , is a
1 / y multiple of the rotation increment experienced by segment AC.
The changing geometry is considered in Fig. 4.14(b). Assuming that the curved
segment AB, is plastic and does not experience changes in its shape, it can be
postulated from normality that no extensions take place along its length. Thus,
from simple geometry:
( y L - A ) ^ + ( r s c )2=. («yL+e)2
with f defined in Fig. 4.14(b). With reference to the same figure, and following a
procedure similar to that outlined in Section 4.4.2, an equation can be derived
equivalent to Eqn. (4.2): 1
1 (T*2 <7 + - > - * t n e1
dn y deS+ ( \ - l ) d e h
d5c/L r 2 (d5c/L )L
As the incremental rotation is d 0 / y = ( d 8 c / y L ) , the ratio of the extensions at a
plastic hinge to this rotation is

88
---------- - zd6c/7 L
with z1 as in Section 4.4.2.
Finally, an equation similar to (4.6) is obtained but with the C q coefficients
replaced by the following C q values:
* 7 1 (JC, - *7 (? + - > — ( 4 .1 0 ( a ) )
' r ft E1
C* ~ 3 CC , f o r e - 2, 3, 4 ( 4 .1 0 ( b ) )
The axial force expression (Eqn. (4.7)) is similarly modified by updating the C q
values.
4.7 DETERMINING THE SPREADING OF THE CURVED SEGMENT
In this section a simplified relationship which allows linear spreading of the
support hinge is proposed. By defining a threshold level, 5q , to represent the
limiting value of central deflection beyond which the bilinear mode is no longer
applicable, the parameter y can be written as:
6 d 'T - 1 - a (— - — ) (4 .11)
L L
Various approaches can be used to define the unknown values for the scalar a ,
and 5 /L in Eqn. (4.11). It could even be assumed that the point about which the
elastic part pivots moves away from the support right from the beginning of the
central deflection history, that is, 5(I/L=5ic/L.
The aim of the approach followed here is to trace the threshold deflection 5 (Vi
and to give a more rational method for the prediction of the spreading hinge
process. The bilinear mode is assumed and the bending moment diagram between
the support and the central hinges predicted by the analytical method of Section
4.4 is plotted at various load steps in Fig. 4.15. In this figure, three typical

bending moment diagrams are shown. The first, Fig. 4.15(a), concurs with the
bilinear mode assumed above. However Figs 4.15(b) and 4.15(c) show that the
assumption of the bilinear mode becomes invalid after some central deflection 5q/L
is exceeded because yield is violated. It is noted here that yield is violated at any
position where the moment exceeds the current ms and m*1 values. Figures 4.15(b)
and 4.15(c) also show that the point of maximum moment travels from the
support towards the centre of the beam. If the value of (1 ~7)L is assigned to the
distance between the support and the position of maximum moment, or the
distance over which yield is violated, and these values are plotted against the
central deflection, a series of curves, as shown in Fig. 4.16, is obtained. Any
linear or piecewise linear curve can be fitted to the curves in Fig. 4.16, and
values for a , and 5^/L in Eqn. (4.11) can be determined. This procedure was
followed with ( l—y)L being the distance between the support and a point defined
as the mid-point between the position of peak hogging moment, m^ax* and the
position where the moment is equal to the support moment, m*1 (Fig. 4.15(c)).
The values for a 1 and S^/L after a straight line was fitted to each set of data
points, as shown in Fig. 4.16, are given in Table 4.4.
4.8 RESULTS F R O M T H E MODIFIED COMPATIBILITY EQUATIONS
This section discusses the predictions obtained by the preceding analysis using the
compatibility Eqn. (4.6) modified to account for the curvilinear shape of the
deformation mode. This modification has been presented in Section 4.6 in relation
to the parameters C \ and 7 . Values for the latter are obtained from Eqn. (4.11),
using the values given in Table 4.4.
Plots of the axial forces versus central deflection are given in Figs 4.8 to 4.10 by
dashed lines. They closely follow the finite element predictions for the BEF and,
particularly in Fig. 4.10, remove the large discrepancy between the numerical
prediction and the analysis using the Cg values. These axial force values were
further implemented in the strength Eqn. (4.9) but with the bilinear mode
assumption retained in the calculation of the component accounting for the spring
forces, that is, the first term within the square brackets. It was found that
although the improvement in the prediction of strength was proportional to the
improvement in the n value, the analysis still substantially overestimated the
numerical prediction for strength at very large deflections. Therefore, this
overestimation cannot be attributed to inaccuracies in the prediction of the axial
force only.

90
As mentioned above, the first term inside the square brackets of the equilibrium
Eqn. (4.9) accounts for the spring forces generated by a bilinear mode-shape. If,
however, the shape postulated by (4.11) is adopted, then this term has to be
modified. This is discussed in the following section, leading to re-calculation of
the spring forces acting on the curved beam shape.
4.9 USE OF NON-LINEAR MODE-SHAPE IN THE EQUILIBRIUM EQUATION
The shape of the beam, as predicted by Eqn. (4.11) for the values of a 1 and
5q/ L given in Table 4.4, is calculated by the method described in Appendix B.
Calculating the shape from Eqn. (4.11) results in lower values for the spring
forces corresponding to the same central deflection 5C/L. The contribution of these
forces to the equation of equilibrium is less than the value given by Eqn. (4.9)
(the first term inside the square brackets). To account for this, the reduction
factor Rf calculated in Appendix B is used and Eqn. (4.9) becomes:
1p -----
X
V 5C AL * 2 * * 5cR- — --------- + — (C n + C n + C + — n)f 3<r Z L Z 2 3 4 L
y p p
(4 .12 )
The predictions obtained from Eqn. (4.12) are represented in Figs 4.5 to 4.7 by
dashed lines. It is remarkable how close these predictions are to those obtained by
the finite analysis, in all three cases considered. The difference between the two
predictions of strength given by the continuous and the dashed lines in Figs 4.5 to
4.7 is mainly due to the modification of the first term in Eqn. (4.12) by the
reduction factor Rf As shown in Chapter 5 the strength is almost insensitive to
inaccuracies in the axial force value.
In general, this modified prediction can be considered to be very accurate over
the entire large deflection range. In addition it is conservative with respect to the
overall behaviour of stiffened decks if the dashed line predictions are compared
with the full squares in Figs 4.5 to 4.7.
The deflected shapes, as predicted in Appendix B, have been compared with the
shapes given by the numerical analysis. This comparison is made at the central
deflection corresponding to the final step of the numerical analysis for which
results appear in Figs 4.5 to 4.10. Figures 4.17, 4.18 and 4.19 illustrate this
comparison for beams BEFR02, BEFR03 and BEFR04, respectively. The deflected

shapes compare favourably given the approximate relationship described by Eqn.
(4.11). Near the support, the spread of the hinge is predicted very accurately in
all three plots. The length of the curved plastic segment is predicted slightly less
accurately, but nonetheless the main features of the shape are clearly present.
Further refinement of an approximate relationship like Eqn. (4.11) is not
worthwhile. The further discussion and modification of the analysis presented
originally in Section 4.4 had the aim of achieving a better understanding of the
phenomena occurring, and shows how a very simple model, after some
modification, can represent all the important facets of the actual behaviour. To
deal with the behaviour of such BEF models, where the shape changes
continuously due to changes in the pattern of loading, a method is required that
can predict all these changes (as explained in Section 3.6.4.1). Such facilities exist
in a finite element or finite difference package.
In practice, even the simple analysis presented in Section 4.4 can be used for
predicting the strength corresponding to a given central deflection. There are two
reasons for this. Firstly, the accuracy of the strength prediction at moderate
deflections is acceptable for preliminary analysis. Secondly, impending material
rupture due to strains occurring at very large deflections limits the maximum
deflections, even for ductile materials. Thus, accurate predictions at very large
deflections are unnecessary.
As discussed in Chapter 6, the main issue is to predict the strength at a given
central deflection. For this, the approximate analysis presented in Section 4.4 can
be used. Of course, the refined method presented in Sections 4.6 to 4.9 can also
be used if the additional effort is warranted. If queries concerning the history of
axial force versus central deflection arise, the refinement of Section 4.7 should be
used.
4.10 SPREADING OF THE SUPPORT HINGE
In order to investigate the possibility of hinge spreading in axially restrained
beams, it is helpful to consider the bending moment diagram of an equivalent
simply supported beam under the externally applied load. In the case of a beam
on an elastic foundation this should also include the spring forces. Hinge spreading
is expected to start from the region where the bending moment diagram of the
equivalent simply supported beam is nearly flat and to progress towards the
position where the moment diagram exhibits its maximum slope. In the case of a
92
beam on an elastic foundation the moment diagram is nearly flat in the region of
the supports after some initial central deflection (see Fig. 4.15) and the hinge
spreads from the support towards the centre of the beam. This process is
corroborated by the bending moment and shear force diagrams obtained by
numerical analysis of model BEFR03 presented in Figs 4.20 and 4.21, respectively.
In these figures the notation adopted in Chapter 3 is used, that is, the total
height of the frame surrounding these plots equals twice the plastic values for the
bending moment and shear force corresponding to the cross-sections under
consideration. As shown in Fig. 4.20, cases (a) through (c), the initially localized
support hinge spreads towards the beam centre line. Over the plastic segment the
bending moment is virtually constant. Therefore the shear force along this
segment, seen in Figs 4.21(b) and 4.21(c), is zero. As the beam is nearly
horizontal under the assumption of small rotations, the axial force along the plastic
segment is also approximately constant.
Hinge spreading in axially restrained beams subjected to a symmetrically distributed
loading is discussed in Chapter 5. The remarks made above concerning the
spreading of plastic hinges hold for this case as well. However, for plates this may
not be the rule. Hook & Rawlings (1969b) illustrate the process of spreading
plasticity in an unstiffened plate under distributed lateral pressure which is
restrained against pull-in. These authors show the spreading process occurring from
the support towards the centre of the plate, while in the case of a beam under
uniformly distributed loading, the spreading would have started from the centre.
4.11 CONCLUSIONS
A simple bilinear mode-shape mechanism has been presented in this chapter to
predict the behaviour of BEFs restrained at their supports against pull-in. The
agreement between the analysis and corresponding finite element results is very
good, especially for strength predictions.
In its original form, the analysis failed to adequately predict the history of the
axial force along the beam under increasing central deflection. This weakness was
found to be associated with higher rotational increments experienced at the ends
of the elastic segment, and their effect was incorporated into the compatibility
equation. Predictions for the axial force based on this modified expression compare
favourably with the numerical results.
93
As an additional refinement to the method, an alternative shape to the originally
assumed bilinear mode-shape was considered in both the equilibrium and
compatibility equations. The prediction for strength based on this shape follows the
finite element results very closely.
Under distributed loading, axially restrained beams exhibit the phenomenon of
spreading plasticity along their length. In a BEF under centrally applied patch or
point loading, plasticity spreads from the supports towards the beam centre line.
Finally, this BEF model can be used to predict the load-deflection history of an
axially restrained single bay stiffened deck under centrally applied patch loading,
provided the proper distributed spring stiffness is used, as discussed in Sections 4.2
and 4.5.1.

94
TABLE 4.1 C ross-sectional geometry
DECK G E O M E T R Y MATERIAL
No. t (mm) t (mm) w b /t L/b E/o-y
R03 1^ 4.76 8.72 6.72 26.67 6 837
(i) For no tation see Fig. 4.1(b)
TABLE 4.2 C ross-sectional geometry
DECK
No.
G E O M E T R Y MATERIAL
t (mm) <0 N t (mm) w b /t h / t w7 w bf / t f L/b E/o-y
R 0 4 ^ 4.76 8.72 26.67 8.18 5.73 6 837
(O t f t w( 2 ) For no tation see Fig. 3.1(b)

TABLE 4 .3 D is t r ib u te d spring s t i f f n e s s
BEAM
No.k sA ’y X 10
BEFR02 21.0BEFR03 2 3 . 4
BEFR04 2 1 .5
TABLE 4.4 Values for the parameters in Eqn. (4.11)
BEAM t
No.a1 5 /L c'
BEFR02 3 .5 0 0 0.000BEFR03 3 .1 8 2 0 .0 3 0
BEFR04 3 .2 7 8 0 . 0 5 0

b
Fig. 4.1 C ross-sectional geom etry fo r BEFR03
BEFR02 & BEFR04 BEFR03
(a ) Stations
i
T(b ) Mesh
Fig. 4 .2 Finite elem ent modelling

Fig. 4 .3 (a ) B eam d efo rm ation g eo m etry
b
STRESS BLOCK
Fig. 4 .3 (b ) C ro s s -s e c tio n a l defo rm ation s and resulting stress block

98
uUD
Rg. 4 .4 Forces acting on the beam
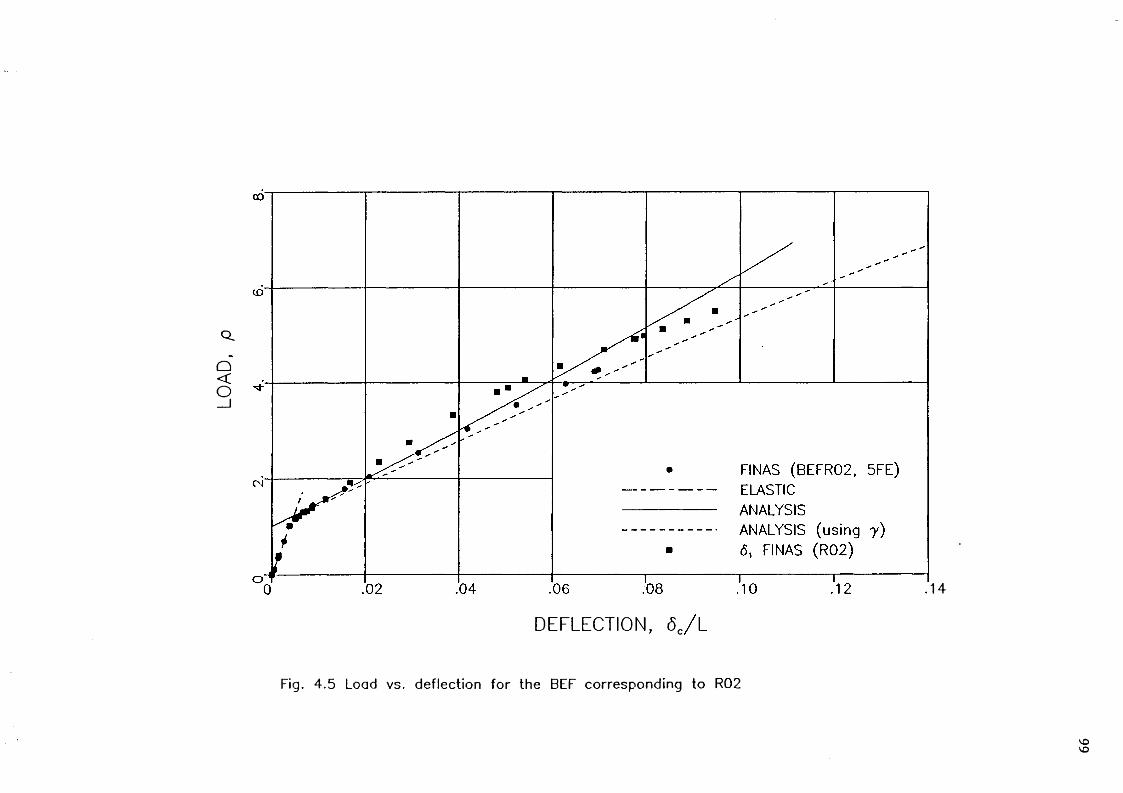
99
o«ooi—oLU_
JL_LUQ
d
‘av
oi
Fig. 4.5 Load vs. deflection for the BEF corresponding to R02

100
d
‘QV
01
D E F L E C T IO N , <5C/ L
Fig. 4.6 Load vs. deflection for the BEF corresponding to R03

101
V<0oI—oLU_
JU_LxJQ
Fig. 4.7 Load vs. deflection for the BEF corresponding to R04

102
Tj-
U
‘30
d0
J
1V
IXV
D E F L E C T IO N , <5e/ L
Fig. 4.8 Axial force vs. deflection for the BEF corresponding to R02

103
u ‘3oaoj nvixv
D E F L E C T IO N , 6 C/ LFig. 4.9 Axial force vs. deflection for the BEF corresponding to R03
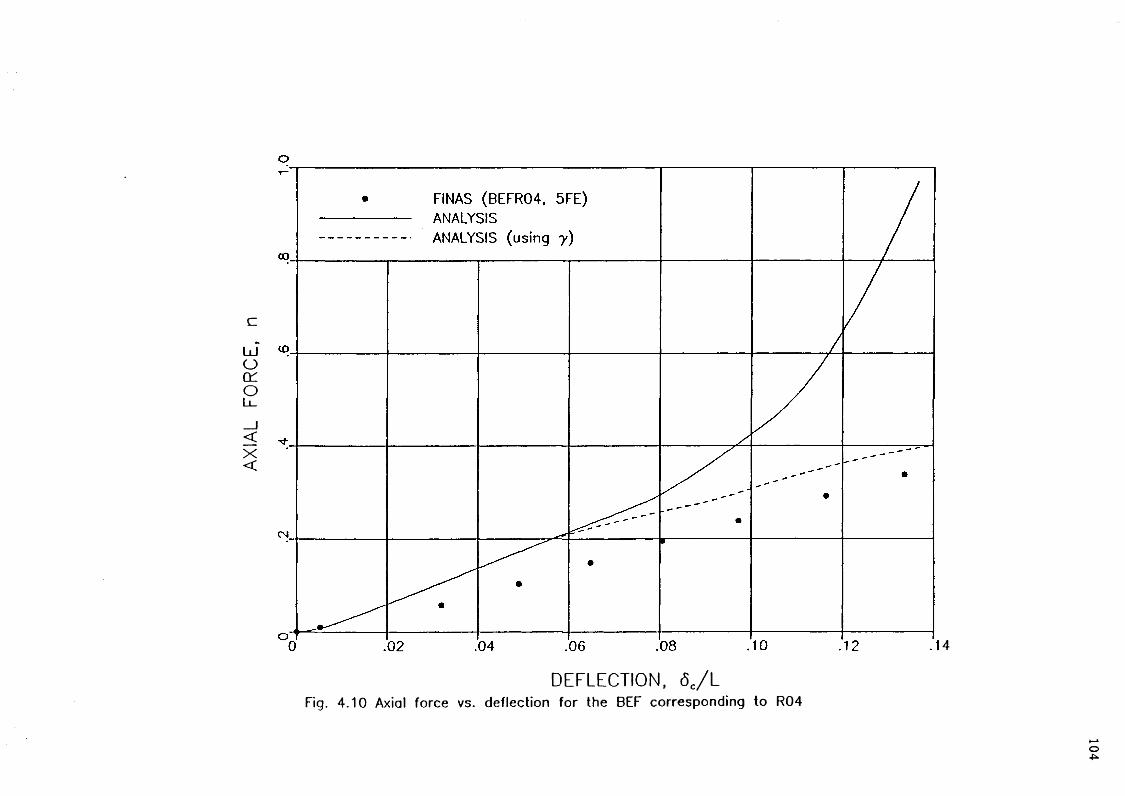
104
u
430
d0
J
1V
IXV
D E F L E C T IO N , 5 C/ L
Fig. 4 .10 Axial force vs. deflection for the BEF corresponding to R04

105
K)to
a>IO3
§o
too»n
oK)
c4la
ci1art1a
1aIa

106
l=H —
CMOCO
o>00
Oo
Ooo
oo
oo
CNK>
Vin
<o|
11
il
1l
Q.a
aQ.
Q.Q.
Q.
Fig. 4.12 Deflection shapes from BEFR03

107
<u-M~
«*■05
to05
.05
T“HII
Q.a
COCMincmIIa
CMOtoIIQ.
05intonala
fvtoinItQ.
Fig. 4.13 Defleclion shapes from BEFR04

108
Fig. 4 .1 4 S c h em a tic representation of d eflec ted shape

109
AL $L If L n ‘m1
(c) p « 6.858
Fig. 4 .1 5 Typical BMDs for BEFR03 if the bilinear m o d e - s h a p e is a s su m e d

110
ooooo-e—
; \
• \
A\
r\
cm
ooo0oooo
\\
\\\
. \
■ \
\\
\
\\
\\
■ *
\oo
\\
00o
S’
\\
cC
Co
oo
Oo
oo
^ o
EE
EO
XX
XJZ
JZJZ.
oo
ou
uo
CLClL_ClCl
L-a.Ql <vEa)E
a)Ea
Oa
uL-
L-o
U.L_
oa
oo
oo
a><D
<dm
CDm
<uc
cc
Cc
c—
'—*—
_l_l
CDCD
CD'w
''
'C7>IZ
CNro
CMro
OO
OO
OO
cQCDCDC DCDCDCLi_
Ll.Ll.
Ll.Ll.
Ll.c
LJLd
LJU
LdLd
sCD
CDCD
CDCD
CDomw
11
ja
1i
11
iii11
1O
•■
lil11
11
\\
\A.
CDo\
\\
oCM_o
YZ'
r
0^
-0
D EFLEC T IO N , <5C/ L
Fig. 4 .1 6 Estim ation o f the p a ram e te rs in Eqn. ( 4 .1 1 )
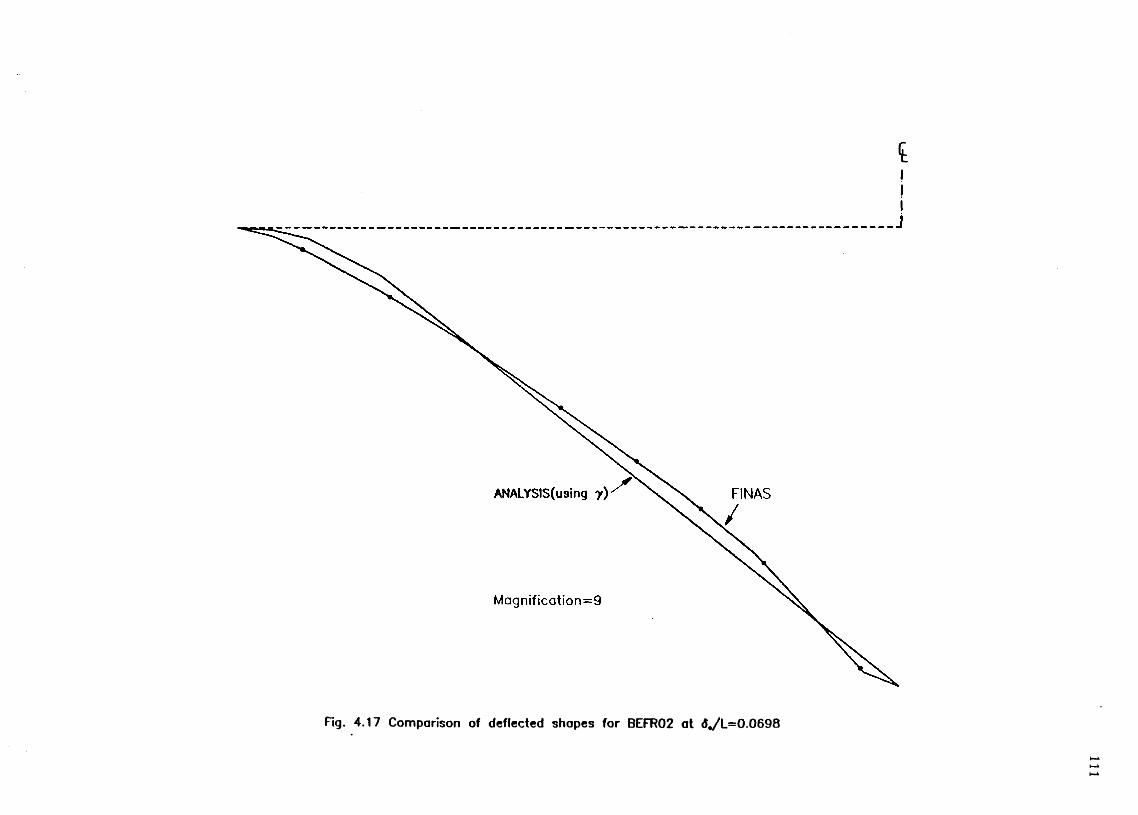
Ill
Fig. 4.17 Comparison of deflected shapes for BEFR02 at d«/L=0.0698

112
Fig. 4.18 Comparison of deflected shapes for BEFR03 at d,/L=0.1392

113
Fig. 4.19 Comparison of deflected shapes for BEFR04 at 6«/L*0.1336

support (a ) p = 2 .0 0 6 centre
support (b ) p = 6 .0 1 8 cen tre
support (c ) p m 8 .7 7 6
L
centre
SCALE M0
Fig. 4 .2 0 Bending m o m en t d iag ram s fo r BEFR03 showing spreading of p lastic ity (fro m FINAS)

I__ T
support (a ) p = 2 .0 0 6 centre
support (b ) p = 6 .0 1 8 centre
-------- ----------------------------- ----***'*., /
support (c ) p = 8 .7 7 6 Centre
Lm-----------------------_________________ L________________________________ -
SCALE Q0
Fig. 4 .21 S h ear fo rce d iagram s fo r BEFR03 corresponding to the m o m e n t distributions shown in Fig. 4 .2 0 (fro m FINAS)

116
CHAPTER FIVE
AXIALLY RESTRAINED BEAMS U N D E R SYMMETRIC DISTRIBUTEDLOADING
5.1 INTRODUCTION
As explained in Section 3.6 the stiffeners and the plate in a longitudinally
stiffened deck bay with full end restraint can be regarded as a series of clamped
beams. The vertical component of the transverse membrane forces in the plate is
distributed in a triangular fashion along the stiffeners remote from the patch
loading. Axially restrained beams under triangularly distributed loading are
therefore examined in some detail within this chapter.
A generalization of Haythomth waite's (1961) rigid-plastic analysis for rectangular
beams under uniformly distributed loading is described. It is applicable to axially
restrained beams under various patterns of symmetric distributed loading and with
various end conditions. The prediction of membrane yield at infinite deflections by
Haythomth waite's (1961) and Gill's (1973) analyses is explained. The results of the
various analyses are compared with experimental and numerical results.
5.2 G E N E R A L ASSUMPTIONS
For the beam under consideration, shown in Fig. 5.1(a), it is assumed that:
1) The material law is rigid-plastic.
2) The applied loading is conservative. This load applied on a simply supported
substitute structure produces a moment distribution with the maximum value
in the middle of the beam.
3) Under the action of the externally applied load, the structure changes shape
in a single deformation mode starting from the limit load configuration with
three hinges; the central plastic hinge spreads towards the supports altering
the shape of the structure.
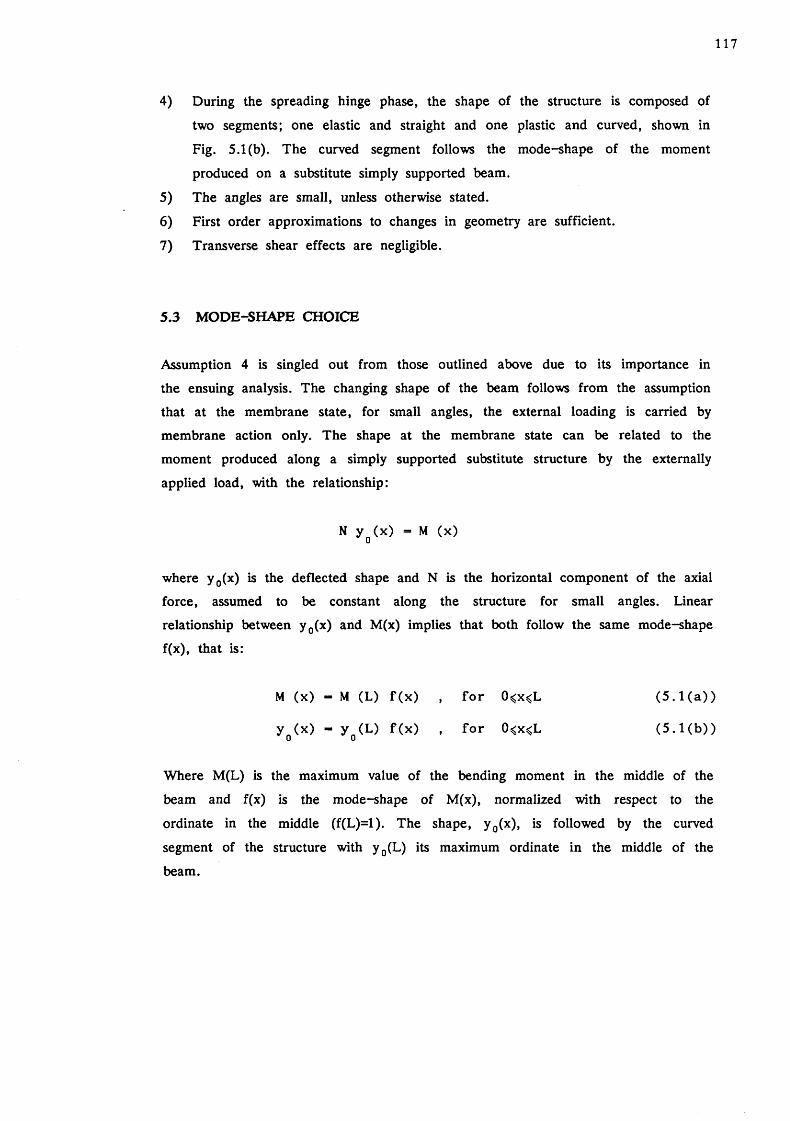
117
4) During the spreading hinge phase, the shape of the structure is composed of two segments; one elastic and straight and one plastic and curved, shown in Fig. 5.1(b). The curved segment follows the mode-shape of the moment produced on a substitute simply supported beam.
5) The angles are small, unless otherwise stated.6) First order approximations to changes in geometry are sufficient.7) Transverse shear effects are negligible.
5.3 M O D E - S H A P E CHOICE
Assumption 4 is singled out from those outlined above due to its importance in the ensuing analysis. The changing shape of the beam follows from the assumption that at the membrane state, for small angles, the external loading is carried by membrane action only. The shape at the membrane state can be related to the moment produced along a simply supported substitute structure by the externally applied load, with the relationship:
N yQ(x) - M (x)
where y0(x) is the deflected shape and N is the horizontal component of the axial force, assumed to be constant along the structure for small angles. Linear relationship between y0(x) and M(x) implies that both follow the same mode-shape f(x), that is:
M (x) - M (L) f(x) , for 0<x<L (5.1(a))
yQ(x) - y 0 ( L ) f(x) , for 0<x<L (5.1(b))
Where M(L) is the maximum value of the bending moment in the middle of thebeam and f(x) is the mode-shape of M(x), normalized with respect to theordinate in the middle (f(L)=l). The shape, y0(x), is followed by the curvedsegment of the structure with y0(L) its maximum ordinate in the middle of thebeam.

118
5.4 ANALYSIS O F SPREADING HINGE PHASE
The analysis commences from the bilinear configuration at limit load of intensity, q0. Applying the principle of virtual work to the structure in Fig. 5.1(a), q0 is obtained as:
qo
\i. X M(5.2)
where \ i 2 is a scalar quantity related to the pattern of loading and q is a characteristic load ordinate. In Fig. 5.1(a), for example, q is the magnitude of the loading in the middle of the beam.
5.4.1 Geometry
From the bilinear configuration at limit load, the structure is transformed under increasing deflection to a plastic membrane with shape dictated by the mode-shape f(x). Due to symmetry, only half of the beam is considered. The deflection shape of the structure at some stage of this transformation, shown in Fig. 5.1(b), can be expressed as:
y(x) - - 5 , for x<a (5.3(a))d-
y(x) - 5 + yQ(L) [ f ( x ) - f ( a ) ] , for a<x<L (5.3(b))
where y0(L) is the instantaneous depth of the curved segment measured from the reference level y0(0). From Eqn. (5.3(b)) it follows that the central deflection is:
y(L) - 5 - 5 + y (L )[ l - f (a ) ] (5.4)w 0
Continuity of the slope at x=a, the junction between the straight and curved parts, yields:
5- - yQ(L) f ' (a) (5.5)a
Changes in geometry and associated extensional requirements of the beam centroidal line are considered next. The extensions required for the structure to

119
follow the shape assumed above are treated separately for the elastic and plastic parts of the beam.
A small change in geometry is shown in Fig. 5.2(a). Close inspection of the regions 0 A MEA'0 and OE'A'O in Fig. 5.2(b) shows that the latter can be used for the evaluation of the extension, de,, associated with an increase d6 in the angle of segment O A \ Considering the triangle D'E'A':
F T ' de1ta n 0 - ---------- - —- -----
O ' / a2+52 d 9
However,
tan 6 - — a
therefore:
--- - - / l + (5/a)2 6 (5.6(a))d0
For small slopes Eqn. (5.6(a)) simplifies to:
de _— - 5 (5.6(b))d e
The main difference between a point hinge of zero length and a hinge of finite length, is that the latter may have extensional requirements if curvature changes take place over its finite length. Extensional requirements for the curved length A'B' in Fig. 5.2(a) are based on the need for the curved segment to increase its length under increasing curvature. The incremental extensions over the curved segment, de2, are considered in Appendix C and are expressed by Eqn. (C.5) as:
de _— - - ct C (a) 52 5

120
Summation of Eqns (5.6(b)) and (C.5) gives the total incremental extension to be:
de _------- (1 + « C ( a ) ) 5 (5 .7 )de 2 5
where C 5(a) accounts for the extensional requirements over the curved length and
a 2 is a parameter. Both quantities are explained in Appendix C.
Defining
then,
F - 1 + a C (a )2 5 (5 .8 )
d e _— - F 6 (5 .9 )d 6
Two assumptions can be made about the parameter F. The first is that as the
curved length extends towards the support the previously developed curved profile
does not change. This corresponds to F=1 and is the assumption made by
Haythomthwaite (1961). The second assumption is that some curvature changes
occur over the curved length and, therefore, F * l.
5.4.2 Normality
In a rigid-plastic analysis, where elastic extensions are disregarded, the extensions
required for changes in geometry take place at or along plastic hinges. Normality
postulates that:
d e 1 dM1
d0 dN(5 .10)
The interaction between the flexural and axial stress resultants at a plastic hinge,
i, has been expressed by Eqn. (4.3) as:
m1 — C1 n2 + C* n + C*02 03 04
The total extension is then given as:

121
de Z------------E (2C n + C )
. 2 3(5 .11)
where
C - CS + (X-l)Ch , f o r Q =* 2, 3, 4 £ °G
(5 .12)
Superscripts s and h refer to sagging and hogging hinges respectively.
5.4.3 Compatibility
For compatibility the extensions provided at the plastic hinges will balance the
extensions required for changes in geometry. Combining Eqn. (5.9) with Eqn.
(5.11) gives:
5.4.4 Equilibrium
A combination of bending moment and axial force in the beam resists the applied
load. Moment equilibrium of the half structure, Fig. 5.3(a), gives:
Here p is the load factor, with p = 1 at the limit load. The bending moment is
envisaged as being constant for x^a.
Because M(x) and y 0(x) have the same shape the following expression may be
derived (using the equations of Section 5.3):
ZF 5 -------- - (2C n + C ). 2 3 (5 .13)
M(L) - p X M - MS + (X-l)Mh + 5 N o c (5 .14)
M(L) p X MoN N
(5.15)

122
5.4.5 Solution
The previously derived equations are further processed to arrive at a solution.
Combining Eqns (5.5) and (5.15) gives:
A 5 1p -------- n ----------
XZ a f ' ( a )P
(5 .16)
Using Eqns (5.4), (5.15) and the interaction formula (4.3), Eqn. (5.14) becomes:
1 _ 2 _ A 5 p f ( a ) — - (C n + C n + C ) - J ------- n
X 2 3 4 XZp
(5 .17)
Substituting Eqn. (5.16) into Eqn. (5.17) gives:
B f ( a ) - B a f ' ( a ) - 01 2 (5 .18)
where,
5 A n
XZ
1B = B + - ( C n 2 + C n + C )
2 1 2 3 4A
(5 .19 )
The previous equations can be solved in the following order:
For a particular value of the axial force, n, the deflection at the junction between
the elastic and plastic segments, 5, follows from Eqn. (5.13). Consequently, Eqn.
(5.18) yields the distance of the spreading hinge tip from the support, a. The
values of the load factor, p, the deflection, y 0(L), and the central deflection, 5C,
follow from Eqns (5.16), (5.5) and (5.4) respectively.
5.4.6 Remarks
1) Haythornthwaite's (1961) solution is obtained from the above for the case of
uniformly distributed loading with F=1 in Eqn. (5.8). Solutions with F=1 and

123
loading other than uniformly distributed will also be termed 'Haythomthwaite
solutions' in this thesis for convenience.
2) The extensions occurring within the curved segment are considered in
Appendix C. These extensions can be taken into account by altering the F
value, as shown by Eqn. (5.8). Solutions with F*1 are referred to as 'analysis
(F * l) \
3) Either value of F (F=l or F*l) can be used up to the point where the
predicted response crosses the membrane solution given by Eqns (5.20) and
(5.21), derived in the following section.
5.5 ANALYSIS OF MEMBRANE PHASE
Under increasing deflection, during the spreading hinge phase, the beam becomes
plastic over its entire length and arrives at the membrane phase. Due to this
finite deflection, the angles are no longer small. Their actual values are therefore
considered in this section.
During the membrane phase shown in Fig. 5.3(b), the beam over its entire length
is assumed to develop the shape dictated by the mode-shape f(x). The beam
behaves essentially as a string, due to the loss of flexural stiffness caused by
extensive plastification. Figure 5.3(b) shows the axial force in the middle of the
beam to be lower than the squash load, N 0, as the angle there is less than the
angle at the support. Therefore, for the structure to be plastic in this region,
bending should coexist with tension to satisfy the yield condition. In summary,
during the membrane phase the parts of the beam where the angle of inclination,
6 , is maximum are plastic under axial force only, while the rest of it is plastic
under combined axial force and bending moment.
From the condition of full membrane yield at the supports and using Eqn.
(5.1(b)), the horizontal component of the axial force is given by:
n a* cos ( t a n * ( f ' ( 0 ) 5C)) (5 .20)
In deriving Eqn. (5.20) the shear at the support was approximated to be zero.
According to the assumptions made about the shape of the beam during the
membrane phase, both the shear at the support and its horizontal component
should be almost zero when the deflections are small. As deflection increases, both
values are increased and the approximation becomes gradually inaccurate. On the
other hand, the finite element analyses undertaken show the assumption for

124
negligible shear at the supports to be a good one for the entire range of
deflections for which results are presented in this chapter (up to four times the
beam depth).
The load factor, p, is evaluated from equilibrium considerations similar to Eqn.
(5.17). It is evident that M^=0 in this case. Hence,
1 2 A5cp = - (CS r i + CS n + CS ) + ----- n (5 .21)
x 02 03 04 xzp
Equations (5.20) and (5.21) can be solved for particular values of the central
deflection, 5C. It is apparent from Eqn. (5.20) that the horizontal component of
the axial force, n, decreases with increasing 5C
Under the assumption of small deflections Eqn. (5.21) simplifies to the linear
equation
A5__ __c
XZP
(5 .22)
because n=l and Ms=0. This is the linear membrane solution and is presented in
Figs 5.4 to 5.11.
5.6 NUMERICAL ANALYSIS
The finite element program FINAS described in Section 3.3 was used to undertake
large deflection analyses of beams under different loads and boundary conditions.
The numerical results are first checked against existing experimental and analytical
results and then compared with the results of the preceding analysis.
5.6.1 Choice of element type
By restricting the analysis to model the behaviour in one plane, either plane stress
elements or beam elements would be used. The choice was made on the basis of
computational efficiency for a required accuracy of results. For the rectangular
cross-section analysed, the key requirement for accuracy is to provide the structure
with a sufficient number of sampling points (stations) through the depth to

125
adequately model the plastic hinges. To comply with this requirement a number of
plane stress elements need to be used through the depth since each element has
only two sampling points in this direction. On the other hand, a beam element
allows for a very refined mesh of sampling points through the depth. It was thus
preferable to the plane stress elements and it was selected for the numerical
analysis. An additional advantage of the beam element is that it allows sampling
points at the extreme fibres, while for plane stress elements the sampling points
are the nearest Gauss points.
This beam element cannot, however, model certain secondary effects. For example,
it has been observed in tests (Murray (1973), Ronalds (1986)) that when the beam
comprises a plate segment and an attached flat-bar stiffener the latter may tend
to trip locally where the beam experiences localized curvatures and the stiffener
outstand is in compression. A second effect not modelled in these analyses is any
twisting of the beam as the elements were restrained to deflect in a vertical
plane.
5.6.2 Mesh-refinement study
Once the element type was chosen, the required mesh size was investigated. One
half-span was analysed due to the symmetry of the structure and the loading.
Different number of elements along the length of the half-span and different
number of stations through the depth were considered, as well as both uniform
and graded meshes. The number of elements was varied between 5 to 20 along
the half-span. The number of stations through depth was varied between 9 and
39.
Comparison of the various analyses showed that in the range of large deflections
even the smallest number of elements tried, that is 5, can predict the behaviour
with very good accuracy. The only requirement for such a coarse mesh is to place
short elements, less than 5 % of the span, where localized curvatures occur, that is
at plastic hinge locations at limit load. Thus a similar mesh to the one shown in
Fig. 4.2 is established, but without the spring elements. It was also found that, a
suitable number of stations through the depth for rectangular beams is about 20.
126
5.7 COMPARISON O F DIFFERENT PREDICTIONS A N D FINITE E L E M E N T RESULTS
There are solutions for the case of uniformly distributed loading in the literature
(Haythomthwaite (1961), Gill(l973), Glirkbk & Hopkins (1973)). The particular
case of a beam with pinned supports and uniformly distributed loading was used to
compare different predictions since this was the only case for which GUrkdk &
Hopkins (1973) developed a rigorous solution. All the analyses are based on
rigid-plastic theory, and therefore they should ideally be compared with numerical
results assuming the same rigid-plastic material law. This was achieved in the
finite element analysis by specifying a very high value for the elastic modulus.
This results in the elimination of early elastic deflections due to bending and
transverse shear, and also of axial extensions in the elastic segments between
plastic hinges. The central deflection is non-dimensionalized with respect to the
beam depth h throughout.
Following the comparison between the various predictions, information about the
elasto-plastic behaviour and the spreading of plasticity obtained from the numerical
analyis, is presented.
5.7.1 Uniform loading
5.7.1.1 Beams with pinned supports
Existing predictions for the load history are shown in Fig. 5.4(a) for uniformly
distributed loading and pinned supports. The numerical predictions with a rigid
material law, that is when the elastic modulus has a very high value, can be
regarded as the reference solution of the problem for correlation with the various
rigid-plastic analyses. It can be seen, firstly, that all approaches are capable of
predicting the behaviour with considerable accuracy. It should be noted that, in
figures 5.4 to 5.11 predictions are only shown in the region where they do not
coincide with Haythomthwaite's (1961) solution. In particular, Haythomthwaite's
(1961) and Gill's (1973) predictions are indistinguishable in Figs 5.4(a) and 5.6(a),
therefore, they are represented by one curve.
Figure 5.4(a) shows also that there is negligible difference in the overall
load-deflection prediction between a structure made of a material that follows a
rigid-plastic law and one with an elasto-plastic law, provided the latter has

127
adequately high elastic stiffness. This is measured by the parameter k 0, which is
defined as the initial stiffness at the beam centre. The beam geometry for which
results are illustrated in Figs 5.4(a) and 5.4(b) corresponds to a
non-dimensionalized value for k 0/Oy of 0.0161. A rigid-plastic analysis will give
similar accuracy when k 0/O y is about 0.0067. For beams with lower k 0/cry values,
the accuracy is reduced and an elasto-plastic analysis is more suitable. The
membrane solution given by Eqn. (5.21), however, is fairly accurate for all
geometries.
At small deflections Glirkdk & Hopkins' (1973) prediction is the most accurate
and, being rigid-plastic, it always lies just slightly to the left of the responses
obtained by the finite elements. The same trend is exhibited by the present
analysis when extensions over the curved length are included as described in
Appendix C, shown in Fig. 5.4(b) as 'analysis (F * l) \ Thus the present small
deflection analysis, combined with the membrane solution given by Eqn. (5.21),
gives very accurate results throughout the response. Haythornthwaite's (1961) and
Gill's (1973) predictions cross the FE results and so do not exhibit any fixed
trend in under- or over-estimating the numerically estimated behaviour.
In Fig. 5.5 the trends of the different predictions become clearer. The present
analysis is approximate but it exhibits the trends of the reference solution, as well
as being considerably simpler. It is also obvious that Gill's modification of
Haythomthwaite's original analysis produces virtually no alteration to the response.
As shown in this figure, Gill's prediction is slightly different from
Haythornth waite's only when n=O.60. At higher axial force values the two curves
are coincident. This is because Gill's second mode is identical with the single
mode assumed by Haythomthwaite. The extra computational effort of Gill's two
mode analysis is therefore unwarranted. The large deflection membrane solution
correlates extremely well with the numerical analysis as seen in Figs 5.4(b) and
5.5. This membrane solution given by Eqns (5.20) and (5.21) was not considered
by any of the previous authors, as they produced small rotation analyses.
5.7.1.2 Beams with fixed supports
The load versus deflection responses for uniformly distributed loading and fixed
supports are illustrated in Figs 5.6(a) and 5.6(b). The predictions are corroborated
by tests on an aluminium beam carried out by Pang & Millar (1978) with k 0/Oy
of 0.0303 and on a steel beam by Young (1959) with k 0/o-y of 0.0087. Tests,
finite elements and theory are in very good agreement. It can be seen that

128
Young's beam is near the lower end of k 0/Oy values, for a rigid-plastic analysis
to give comparable results. The membrane solution given by Eqn. (5.21) presented
in Fig. 5.6(b) corresponds to the geometries analysed by finite elements which had
2L/h=12.5 but various k 0/Oy values, as different values were assigned to the elastic
modulus.
The development of membrane tension is plotted against deflection in Fig. 5.7.
Haythomthwaite's and Gill's predictions correlate very well with the finite element
results in this case. As seen in this figure the analysis presented in this thesis,
including the effects of extension changes over the curved length, does not
improve the Haythornthwaite prediction, although the opposite can be observed in
Fig. 5.5.
It is worth mentioning that the aluminium beam tested by Pang & Millar, under
this type of loading and boundary conditions, ruptured at the supports. Material
rupture limits the range of deflections attained in practice and is further discussed
in Section 5.11.
5.7.2 Triangular loading
The analysis was also used to predict the behaviour of a beam under triangularly
distributed loading, indicated in Fig. 5.8. As mentioned above Haythomthwaite's
solution is based on the mode-shape f(x) given by Eqn. (5.2) for triangular
loading, and setting F=l. Predictions for the load and the axial force versus
central deflection for a pin ended beam are illustrated in Figs 5.8 and 5.9
respectively, while Figs 5.10 and 5.11 correspond to fixed supports. The same
conclusions, as for the uniformly distributed loading case, can be drawn concerning
the relative accuracy of the analyses presented.
5.8 D E V E L O P M E N T O F PLASTICITY
Figures 5.12(a) through 5.12(d) show the gradual development of plasticity with
increasing deflection in a typical encastr6 beam under uniformly distributed
loading.
By studying these diagrams it is possible to verify the assumptions made regarding
travelling and spreading hinges. In Fig. 5.12(a) it is seen that the location of one
of the plastic hinges is close to the centre of the beam. Under increasing loading,
129
Fig. 5.12(b), the hinge position moves towards the support while the centre of the
beam begins to unload in bending. The depth of the plastic zone in tension at
the hinge position is increasing due to increasing axial tension. In Fig. 5.12(c) it
is observed that a significant length of the beam is now a plastic sagging hinge.
Thus, a change of mode from travelling to spreading plastic hinge has taken place
somewhere between the stages in Figs 5.12(b) and 5.12(c). This is consistent with
Gill's (1973) and Gtlrkok & Hopkins' (1973) predictions that the mode change
occurs at p=1.66.
This mode change from travelling hinge to spreading hinge can also be predicted
by the approximate analysis presented here. With reference to Fig. 5.1(b), the
value of deflection y 0(L) decreases as the curved segment expands from the centre
towards the supports. When the change in the mode occurs y 0(L) is a minimum
as discussed in Appendix C. Plots of y 0(L) versus the non-dimensionalized
horizontal projection of the curved segment, 1-a/L, are shown in Figs 5.13(a) and
5.13(b) for uniform and triangular loading, respectively. The first of these figures
agrees with Gill's and Glirkdk & Hopkins' predictions, that the change in mode
for a beam under uniformly distributed loading occurs at a/L=0.667. Figure 5.13(b)
shows that under triangularly distributed loading the mode changes when the hinge
position is at a/L=0.73. This corresponds to p=1.55.
Finally, Fig. 5.12(d) illustrates the spreading of plasticity to the supports with
further increase in the axial tension. This figure corresponds to the membrane
phase, as indicated by the load factor, p. It is evident that the support section is
under pure membrane yield whereas a small amount of bending coexists with the
axial tension elsewhere in the beam. This agrees with the assumptions made in
Section 5.5 regarding the horizontal component of the axial force.
It may be noted that the plastic hinges at the supports do not exhibit any
spreading. From observations on the behaviour of axially restrained beams under
other types of loading (Section 4.10), it may be concluded that spreading or
travelling is likely to occur from positions where the bending moment diagram on
the simply supported substitute beam has zero or nearly zero slope. Thus,
plasticity can readily spread where the bending moment is nearly constant.
5.9 BENDING M O M E N T DISTRIBUTION
In addition to the information presented in the preceding section, it is useful to
illustrate the moment distribution along the beams. Such information is given in

130
Figs 5.14 and 5.15. The first figure corresponds to the encastre beam under
uniformly distributed loading and the second figure to the beam with pinned
supports and the same pattern of loading. Each figure relates to a given load
factor.
Comparison of Haythomth waite's analysis and of the present analysis modified to
include extensions over the curved part with the numerical results, shows that the
assumption of constant moment along the curved part is a good one. The degree
of accuracy with which the extent of the spreading of the curved segment is
predicted is also remarkable.
On close study, very small differences can be seen between the predictions of
Haythornthwaite and the finite elements. In Fig. 5.14(c) it is seen that
Haythornthwaite predicts the bending moment obtained by the numerical analysis
very accurately. The present analysis which includes the extensions occurring over
the curved length, indicated by 'analysis (F * l) ', slightly underestimates the
moment. In contrast, for the pin ended beam, both Haythornthwaite and the
preceding analysis exhibit slight discrepancies from the numerical results, seen in
Figs 5.15(b) and 5.15(c). The smaller moment predicted by the 'analysis (F*l)'
corresponds to the stiffer axial force versus central deflection relationship predicted
by this analysis as compared to the finite element solution.
The observed drop in the moment computed by finite elements in the middle of
the beam is a result of a travelling hinge. This behaviour corresponds to the first
mode of deformation assumed by Gill (1973) and GtirkO'k & Hopkins (1973). The
travelling hinge leaves the curved segment with a shape different from that
dictated by the mode-shape f(x) which produces constant moment on the structure.
5.10 SIMPLIFIED M O D E O F DEFORM A T I O N
An estimation of the accuracy of the simplified bilinear mode of deformation
proposed in Chapter 3 for the indirectly loaded stiffeners in a fully restrained
stiffened plate under lateral load is carried out in this section.
Comparison of the bilinear mode results with the other available predictions is
made in Fig. 5.16. As seen in this figure even a rough estimation of the
deformation mode gives acceptable accuracy. The bilinear mode of the deformation
overestimates the load by 5 % with respect to the Haythornthwaite's solution, when
the central deflection equals the depth of the rectangular cross-section. At
131
deflections in excess of the beam depth the solution coincides with the small
rotation membrane solution given by Eqn. (5.22).
This comparison helps to explain why Gill (1973) did not improve
Haythomthwaite's (1961) single mode prediction for the rectangular beam, during
the first mode assumed. The first mode assumed by Gill ends at a central
deflection of 0.866 times the beam depth. This is less than the deflection at which
the cruder bilinear mode differs from the reference analysis by just 5 % . In
addition, Haythomthwaite's parabolic shape assumption was closer to the actual
curved shape than the one by the bilinear mechanism.
This insensitivity occurs because at the early stages of the deformation of a beam,
which can be analysed by a rigid-plastic analysis, the behaviour is governed by
bending. The build-up of axial force in the beam is mostly affected by the
assumed mode of deformation.
It is worth mentioning that Haythomthwaite (1961) also outlined an analysis based
on a bilinear deformation mechanism to predict the behaviour. Relevant to the
approximation of bilinear mode considered in this section, is also the work by
Jones (1971).
The same investigation was also undertaken for the 'notional beam' cross-section
considered in Chapter 3 under triangular loading. The error made when the
bilinear mode of deformation is assumed is approximately 2 % compared to the
numerical solution when the central deflection equals the beam depth. Thus the
bilinear mechanism proposed in Section 3.6 for the beams remote from the patch
load is a suitable approximation at realistic deflections.
5.11 MATERIAL RUP T U R E
Material rupture limits the range of permissible deflections. The aluminium beam
tested by Pang & Millar (1978) failed quite early at the supports in a shearing
mode. Liu & Jones (1987) differentiate between tensile and shear failure with
respect to the flatness of the broken section. In a tensile tearing, the two faces of
the broken section have a convex-concave appearance. A shear failure lay in a
single plane.
Failure at the supports has also been reported by Hook & Rawlings (1969a) who
undertook experiments on clamped rectangular plate panels loaded by lateral

132
pressure. McDermott et al (1974) present test results on rectangular beams loaded
at midspan by an indenter. These results show that as the indenter becomes
increasingly blunt, the position of rupture changes from just under the indenter to
the supports. For a beam with rectangular cross-section, loaded by a patch or
distributed loading, rupture is more likely to occur at the supports. For asymmetric
cross-sections the position of maximum distance between the initial neutral axis
and the extreme fibre in tension should be considered as well.
Knowledge of the permissible strain causing material rupture, requires calculation
of extreme fibre strains. Extreme fibre extensions can be calculated using a
mechanism approach. Thus, calculation of the extreme fibre strains requires a
notional hinge length. To that end the work by Ronalds (1990) may be useful. A
discussion on the permissible rupture strains is presented in Section 8.7.
5.12 CONCLUSIONS
The rigid-plastic mechanism approach presented in this chapter extends
Haythomthwaite's (1961) analysis of the large deflection behaviour of beams under
uniformly distributed loading to any symmetrically distributed loading on a beam of
arbitrary cross-section with encastre or pinned supports.
Two very simple analyses, the 'Haythomthwaite solution' and the 'membrane
solution' expressed by Eqn. (5.21), give excellent agreement with the finite
elements over the complete load versus deflection response. Similar agreement is
also found in comparisons of the development of membrane tension. The latter is
very sensitive to assumptions made in the analysis and is thus the best measure of
the accuracy of the various methods. If additional refinement is needed in the
analysis, especially for pin ended cases, the extensions associated with curvature
changes over the curved segment can be incorporated using the method given in
Appendix C.
The differences between the rigid-plastic predictions of the analyses and the
elasto-plastic behaviour predicted by finite elements is negligible for the geometries
analysed. The structures were rectangular beams with span to depth ratios, 2L/h,
of 12.5 and k 0/Oy between 0.0161 and 0.1123, but the analysis can be used
without significant loss of accuracy for values of k 0/Oy as low as 0.0067. For
beams with more slender proportions, with lower k Q/Oy values, the accuracy of a
rigid-plastic analysis decreases. An elasto-plastic analysis becomes more suitable in
these cases. Though, it is the simplicity of the rigid-plastic analysis that makes it

133
attractive.
Finally, detailed finite element studies verify the assumptions made by Gill and
Glirkdk & Hopkins concerning travelling and spreading hinges. For a simplified
model as the one proposed in Chapter 3, a bilinear mode for the deformation of
the indirectly loaded beams can be adopted without significant loss of accuracy.

134
( o ) S t r u c t u r e u n d e r l o a d i n g
( b ) D e f l e c t e d s h a p e
Fig. 5 .1 D e fle c tio n s u n d e r lo ad in g

135
B’B"
L
(o )
(■a
(b)
Fig. 5.2 Deflection geometry
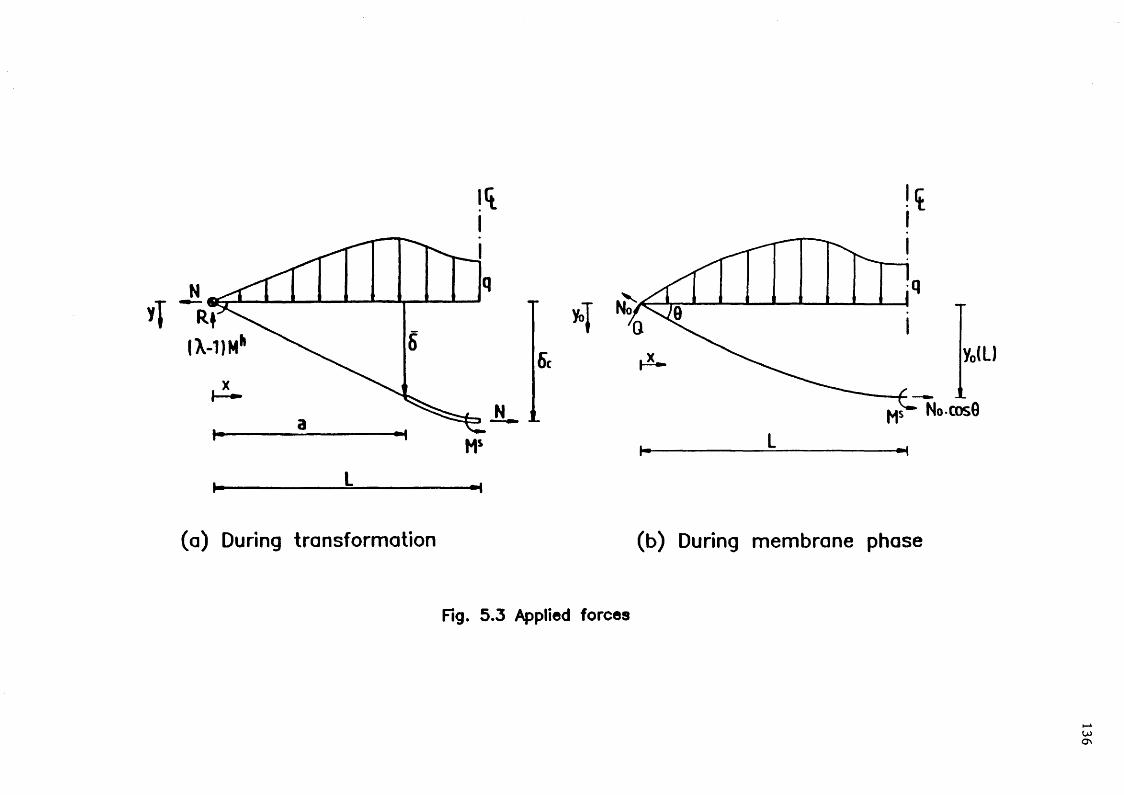
136
O
Fig. 5.3 Applied forces

LOAD
, p
L0A
D-
137
Fig . 5 . 4 ( a ) L o a d v s . d e f l e c t i o n ( p i n n e d s u p p o r t s )
o-f---------1----------- 1----------- 1---------- 1---------- 1----------- 1-----0 .2 .4 .6 .8 1.0 1.2
DEFL ECTION, 6 c/ h
MEMBRANE (Eqn (5.21). 2t/h-l2.5) ANALYSIS (F*1)TINAS (6 FE. RIGID. 2L/M-12.5)FINAS (5 FE. 2L/n«12.5)---1----------- 1-----------1-----------1
1.4 1.6 1.8 2.0
Fig. 5 . 4 ( b ) L o a d v s . d e f l e c t i o n ( p i n n e d s u p p o r t s )

138
oo
JC\o
°ooh~oLd_I
Ll.UQ
Fig. 5 .5 Axial fo rce vs. deflection (pinned supports)

LOA
D,
p LO
AD
.
139
Fig. 5 .6 (a ) Load vs. deflection (fixed supports)
+
ITTJl
+
X*°°T+
> y
X4*
.5 1.0 1.5 “ I— 2.0
++
+
.53"
«r' -cr'
MEMBRANE (Eqn. (5 .2 1 ) . 2 L /h = 1 2 .5 ) ANALYSIS (F * 1 )PANG k MILLAR ( k . / a , = 0 .0 3 0 3 )YOUNG ( k . / c = 0 .0 0 8 7 )FINAS (10 FE. RIGID, 2 L /h = 1 2 .5 )FINAS (5 FE. k . / a , = 0 .0 7 8 6 , 2 L /h = 1 2 .5 )
T T o T> ""14.0
D EFL E C T IO N , <5e/ h
Fig. 5 .6 (b ) Load vs. deflection (fixed supports)
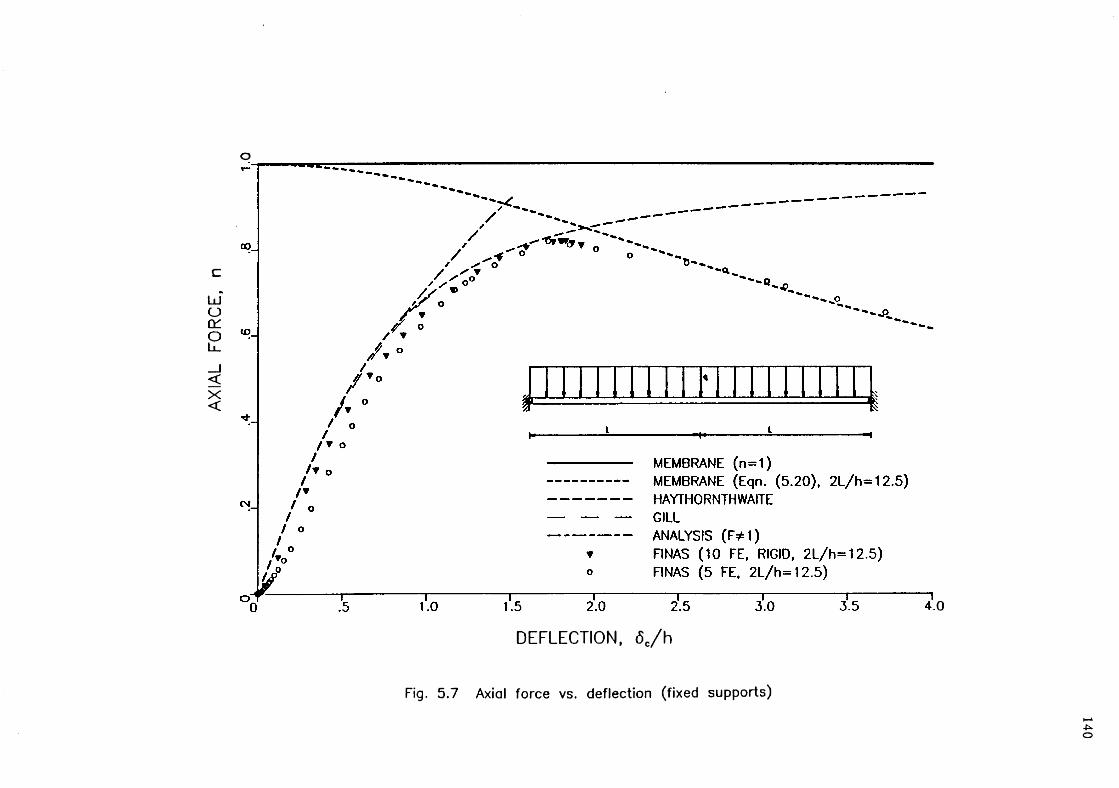
140
o
JCooi—ou_JLi_UQ
u ‘3
0d
0J
1VIX
V
F ig . 5 . 7 A x ia l f o r c e v s . d e f l e c t i o n ( f i x e d s u p p o r t s )

141
l£>
jCuoI—oLd_JLi_LJQ
Fig. 5 .8 Load vs. deflection (pinned supports)

142
CO
«oOI—OLjJLJQ
u ‘B
oa
oj
nv
ixv
Fig. 5 .9 Axial fo rce vs. deflection (p inned supports)

143
m
OKDoh—oLjJ_
ILi_U
JQ
Fig. 5 .1 0 Load vs. deflection (fixed supports)

144
m
JZ
F ig . 5 . 1 1 A x ia l f o r c e v s . d e f l e c t i o n ( f i x e d s u p p o r t s )

145
Fig. 5 .1 2 Spreading o f plasticity in an encastre beam under uniformly distributed loading

146
Fig. 5 .1 2 Spreading of plasticity in an encastre beam under uniformly distributed loading

o
Fig. 5 .1 3 (a ) R elationship betw een the deflection y0(L ) and the
horizon ta l pro jection o f the curved seg m ent ( L - a ) for uniform ly d istributed loading
o
Fig. 5 .1 3 (b ) Relationship between the deflection y0(L ) and the horizon ta l p ro jection of the curved seg m ent ( L - a ) fo r triang u larly d istributed loading

148
Fig. 5 .1 4 Bending m o m e n t d iagram s of an en castre beam under uniform ly d istributed loading
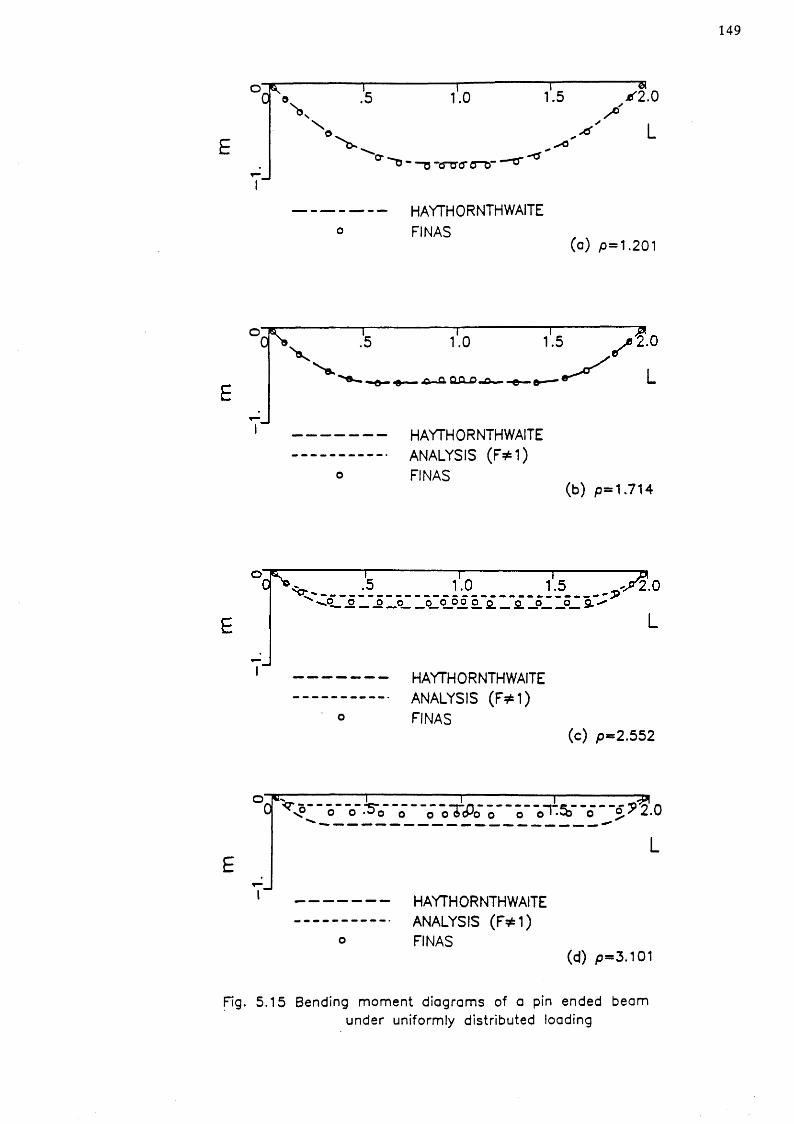
149
E
n------------------ a1 .5 * 2 .0
X^ L
O -JT" 0 ®
V.5 1 .0
\
----D ~<S~C(T C~b----Tr’
HAYTH OR NTH WAITE
FINAS(a) p = 1 .201
o o SX
i ----------------------1--------------------- r~.5 1 .0 1 .5
“ — A—Q. Q 0. D mAm0m O ■■ ■— L
O
HAYTH ORNTH WAITE
ANALYSIS ( F * 1 )
FINAS(b ) p = 1 .7 1 4
o
HAYTHORNTHWAITE
ANALYSIS ( F * 1 )
FINAS(c ) p = 2 .5 5 2
«rr0 o o •"5”o o o oT<flo o 9T :5 f
EL
O
HAYTHORNTHWAITE
ANALYSIS (F^fel)
FINAS(d ) p - 3 .1 0 1
Fig. 5 .1 5 Bending m o m en t d iag ram s of a pin ended beam under uniform ly d istributed loading

LOAD
,
150
Fig. 5 .1 6 Load vs. deflection (fixed sup p o rts )
151
CHAPTER SIX
ANALYTICAL MODEL FOR STIFFENED DECKS RESTRAINED AGAINSTPULL-IN
6.1 INTRODUCTION
A qualitative model of a fully restrained deck with longitudinal stiffeners under
patch lateral loading was proposed in Chapter 3. Figure 6.1 shows a quarter
model of the deck, which consists of two types of axially restrained beams. Type I
beams represent those loaded by the patch loading and the reactions of the
transverse plate strips. One such beam is shown as beam 1 in Fig. 6.1. Type II
beams are those remote from the patch loading and are shown as beams 2 to 4
in Fig. 6.1. As explained in Chapter 3, Type I beams can be idealized as beams
on an elastic foundation and Type II beams can be envisaged as being under
triangularly distributed loading. The analysis of Type I beams has been given in
Chapter 4 while Type II beams have been investigated in Chapter 5.
This chapter presents an analysis of the model for a single bay stiffened deck
fully restrained against pull-in under patch lateral loading. Two additional
simplified analyses are also given. The simplifications concern the assumptions
made about the axial forces in the beams. The first simplified analysis assumes
zero axial forces in the beams, while presence of axial force in the loaded beam
only gives the second simplified analysis. Predictions obtained from all three
alternative analyses are compared with the numerical results of the deck examined
in Chapter 3. Further comparisons are made for two additional decks with
different geometries.
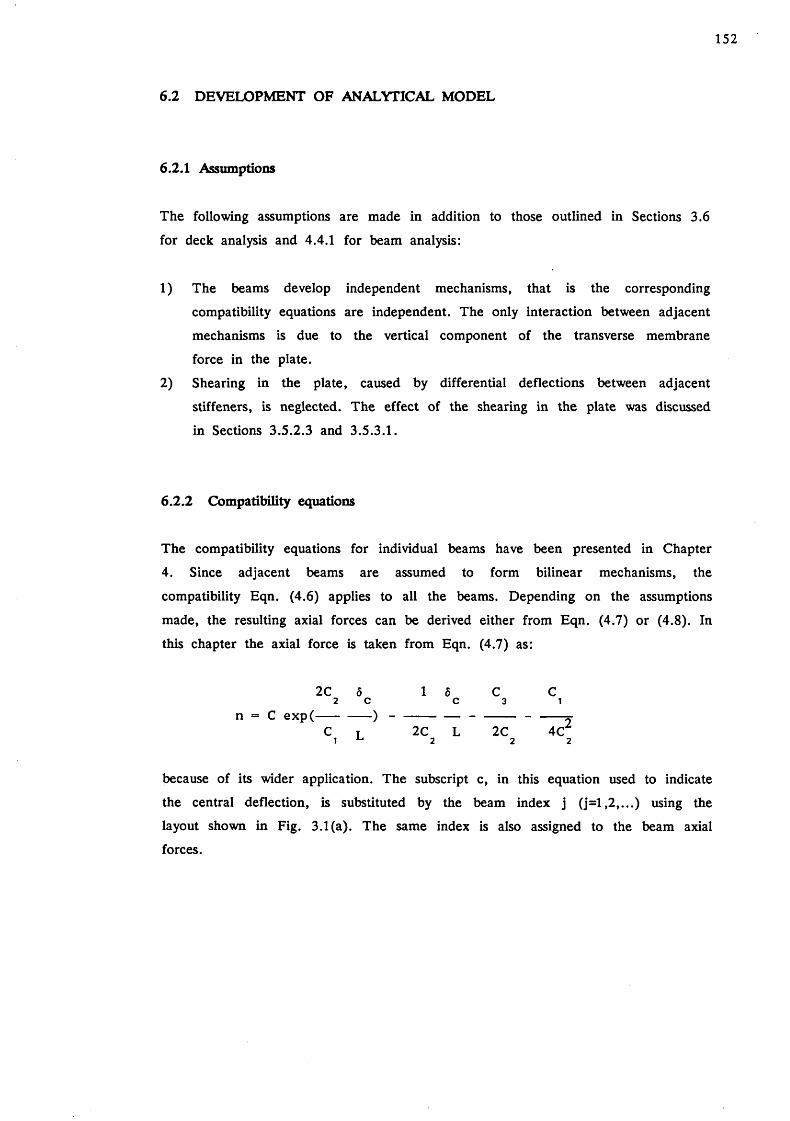
152
6.2 DEVELOPMENT OF ANALYTICAL MODEL
6.2.1 Assumptions
The following assumptions are made in addition to those outlined in Sections 3.6
for deck analysis and 4.4.1 for beam analysis:
1) The beams develop independent mechanisms, that is the corresponding
compatibility equations are independent. The only interaction between adjacent
mechanisms is due to the vertical component of the transverse membrane
force in the plate.
2) Shearing in the plate, caused by differential deflections between adjacent
stiffeners, is neglected. The effect of the shearing in the plate was discussed
in Sections 3.5.2.3 and 3.5.3.1.
6.2.2 Compatibility equations
The compatibility equations for individual beams have been presented in Chapter
4. Since adjacent beams are assumed to form bilinear mechanisms, the
compatibility Eqn. (4.6) applies to all the beams. Depending on the assumptions
made, the resulting axial forces can be derived either from Eqn. (4.7) or (4.8). In
this chapter the axial force is taken from Eqn. (4.7) as:
2C 8 1 8 C C2 C C 3 1
n = C ex p (------------) -------------------------------------- ~C t 2C L 2C 4C1 2 2 2
because of its wider application. The subscript c, in this equation used to indicate
the central deflection, is substituted by the beam index j (j= l,2 ,...) using the
layout shown in Fig. 3.1(a). The same index is also assigned to the beam axial
forces.

153
6.2.3 Equilibrium equations
6.2.3.1 Directly loaded beams
The total patch loading applied to the deck is carried by longitudinal action of the loaded beams and transverse action of the plate which then transfers load to the unloaded beams. Figure 6.2(a) shows stiffener 1 under loading. The width of the patch load is 2/3 jb, where b is the spacing of the stiffeners. Moment equilibrium of the applied forces with respect to the support gives:
P ( L " “^ “ ) L 1 t 9 h----------------------------------- ^ <T ( 5 - 5 ) L + MS + ( X - l ) M + 5 N2 3 b 1 2 1 1 1 1
1 , 2
where t12 is the plate thickness between stiffeners 1 and 2, b 1>2 has been defined in Section 3.6.1.3 for j=l, o* was defined in Section 3.6.1 and P is the the total patch load. Non-dimensionalizing the applied loading with respect to
Po
2XM o 1
(L )
where P 0 is the limit load for beam 1 when loaded centrally with a patch load of width 2/3 jb, the above equation gives:
p ------X
5 5 A L - 5D (— ----) + ^ - ( C n + C n + C + — - n )1,2 _ . Z 21 1 311 41 T 1
L L pi L( 6. 1 )
In Eqn. (6.1), the value for D 1>2 is calculated from the general expression for D j, j + i given by ;
Dj. j+1
* t t 31 t . . , 1 a L 1 J>J+13 b cr Z
j j + i y p 1
for j=l.

154
6.2.3.2 Indirectly loaded beams
The loading system for stiffener 2 and subsequent stiffeners (j >2) is shown in Fig. 6.2(b). Taking moments about the support:
6 . 1 5 . 5 .). , . -A — - - (D. , . + D. ) - A + D .J-l.J T J-1^ J.J+1 T J>J+1 T
A.LJZ
Pi
(C 2.n. + C ,n. + C .+ 2J J 3J J 4J
5 ._JL V
( 6. 2)
The formulation of the above equation in terms of the coefficient D jj+j allows variations in plate thickness, stiffener spacing and transverse membrane force from panel to panel to be modelled. In the case where the value of the transverse membrane force also varies a* should be replaced by Ojj+i-
6.2.3.3 Further considerations
When the transverse membrane stress, cr*, equals the yield stress, the plate thickness is uniform and stiffeners are evenly spaced, Eqns (6.1) and (6.2) may be simplified as follows:
P5 AL y— ) + — (C n + C n + CL Z 21 1 31 1P
(6.3(a))
5 . 6 . ,- 2 J + J + 1
L L
AL 7 5 •— (C . n . + C . n . + C . + - A n . ) z 2J J 3J J 4J L J
p
f o r j > 2 (6.3(b))
1 t LD -------
3 b Z
3
P
where

155
The term in square brackets on the left hand side of Eqn. (6.3(b)) indicates that, if the central deflections of three successive stiffeners lie on a straight line, there is no loading on the middle stiffener since the loads cancel out as shown in Fig.6.3. The right hand side of Eqn. (6.3(b)) gives the load carrying capacity of the beam comprising both bending and longitudinal membrane action. As shown in Fig. 5.16, at early stages of the behaviour, before significant membrane action builds up, the strength in a beam forming a longitudinal mechanism is not significantly higher than the limit load value. When the strength does not vary with increasing deflection the following equation relating incremental deflections holds:
d5 . . J - l
L0
L L(6.4)
The above equation implies that the incremental deflections of adjacent stiffeners lie on a straight line. This is characteristic of a bending-governed behaviour occurring at early stages of the deflection history. If such a behaviour is assumed, then the slopes, expected in Fig. 3.5(a), are those represented by continuous lines.
Figure 6.4 shows schematically the load-deflection behaviour of an axially restrained beam under transverse loading. The increase in stiffener strength with increasing deflection indicates that incremental deflections of adjacent stiffeners do not satisfy Eqn. (6.4), which holds for constant strength only. Figure 6.4 also shows that for a stiffener, the larger the central deflection, the higher the increase in the strength due to an increase in the central deflection. The incremental deflection of stiffener j-l is made up of three components, while stiffener Q has not yet formed a mechanism, as shown in Fig. 6.5. The first component follows Eqn. (6.4), the second corresponds to equal increases in the strength of stiffeners j and j+1, and the third is due to different increases in the strength of stiffener j and j+1. Therefore, the expected ratio of the incremental central deflection of stiffeners j-l and j is:
d 5 j _ j / L ( G - j + l ) / ( £ - j ) + 3<p + \f/
d 5 j / L 1 + <p
d5 / L f i - j + 1 ----J-------- ----------
d5 ./L Q- jJ J
(6.5(a))
(6.5(b))

According to expression (6.5(b)) the deflection curves for the actual deck may be expected to be under the continuous lines drawn in Fig. 3.5(a). These are observed to be so.
156
6.2.4 Initiation of mechanism in indirectly loaded beams
The rigid-plastic analysis of indirectly loaded beams ( j > 2 ) commences when the loading on the directly loaded beam (j=l) reaches the limit load. Hence, the deck starts to deflect under initial conditions:
P 5 u ■ n jn
Ij
where 5 jj and njj are the initial values for deflection and prestress respectively of beam j. The initial value for the load factor, pj, is obtained from consideration of Eqn. (6.1) using the initial conditions.
Stiffener j+1 (j >1) forms a mechanism when the central deflection in stiffener j obtains the critical value, 5 jc r . This value can be determined by consideration of Eqn. (6.2) for stiffener j+1, giving:
*jc r , j+1 51, j+2L L L
Aj+1LD . Z J,J+1 Pi
2 * • , -Ic - . 1 + C . .n_ . 1 + C .^+ J n_ ..2, J + 1 I »J+1 3,J+1 I,J+1 4,J+1 I , J+1
(6.7)
The state of the deflections can be expressed as:
if 5. < 6. then - 6Trt , for & - j+1, j+2 . j N jcr G Ifi ’ j > j
6.2.5 Method of solution
The solution technique is given below:1) The analysis starts assuming that stiffener 1 has formed a mechanism and
pivots with respect to stiffener 2 which is intact. Steps 2 to 5 are followed starting with j=l.

157
2) An increment, d5j, in the central deflection of stiffener j which pivots with respect to the stiffener j+1, is applied. The total deflection of stiffener j should not exceed the critical deflection, 5jcr, indicating collapse of stiffener j+1 and given by Eqn. (6.7). If 5jcr is exceeded, the index j is advanced by one, and this step is repeated. When the outmost stiffener collapses it pivots with respect to the support and the check through Eqn. (6.7) is no longer applicable.
3) Equation (4.7) yields the axial force in stiffener j, nj, which upon substitution into Eqn. (6.3(b)) gives the deflection of stiffener j—1, 5j_i.
4) Step 3 is repeated until the values for the central deflection and the axial force in the loaded stiffener 1, 51 and n 1, are found.
5) Upon substitution of n, and 6, in the equilibrium equation (6.3(a)) the value for the load factor, p, is obtained.
6.3 FIRST SIMPLIFIED M E T H O D O F ANALYSIS
This simplified analysis is based on the assumption that no axial tension is developed along the beams (in the longitudinal direction). It is still assumed that the beams remain straight between the support and central hinges. The behaviour of the plate is represented by the membrane solution in the transverse direction and all the assumptions made in Section 6.2 are valid.
Stiffener j+1 starts to deflect once the deflection of stiffener j attains the critical value 5jcr, given by Eqn. (6.7). As no additional loading in excess of that initiating the plastic mechanism can be carried by the beams, each of them is equally loaded once lateral deflections take place.
It was pointed out in Section 6.2.3.3 that the condition necessary for no additional loading on a stiffener which has formed a mechanism, is given by Eqn. (6.4). Assuming that stiffener j+1 has not experienced any deflection while stiffeners j, j—1, j-2, etc. have formed mechanisms, consideration of equations similar to (6.4) for the deflecting stiffeners gives:
L
d5
L L L
158
Application of these equations to all the stiffeners results in:
d5. 0 1 d5 .J - (C+2) — i , forC -0,1,2.... j-2
L L
The incremental deflections of stiffeners 1 to j between the incipient collapse of stiffeners j and j+1 can be obtained from the above equation by setting:
L L
The load carrying capacity when a mechanism is formed in stiffener j+1, is the sum of the limit loads of the stiffeners forming mechanisms, which is equal to (j+l)P0. Once all the stiffeners have collapsed, the incremental central deflections are pivoting with respect to the supports. Reference to this analysis is made by the term 'simplified 1'.
6.4 SE C O N D SIMPLIFIED M E T H O D O F ANALYSIS
Figure 6.4 shows that the biggest increment in strength due to longitudinal membrane action occurs for beam 1. Since the compatibility equations for the beams are independent, it can be assumed that one or two of them develop longitudinal membrane action, whereas no such action takes place in the remainder of the beams.
This simplified analysis is based on the assumption of longitudinal membrane action in beam 1 only. The remaining assumptions and all the equations set in Section 6.3 are still valid. The only difference with the previously described simplified analysis is that the load carrying capacity is derived by consideration of the equilibrium of stiffener 1, that is, from Eqn. (6.1) or (6.3(a)). In the later sections, the present analysis is referenced as 'simplified 2'.

159
6.5 COMPARISON O F ANALYTICAL A N D NUMERICAL RESULTS
6.5.1 Load-deflection predictions
Figures 6.6(a) to 6.6(d) show the load versus central deflection response for the stiffeners, determined by finite elements as well as the three analyses.
In Fig. 6.6(a) the predictions for stiffener 1 are presented. The initial linear elastic behaviour of the stiffener can be predicted using a grillage analysis(Clarkson (1959)). Beyond the linear elastic region, the responses predicted by the finite elements and the analysis presented in Section 6.2, are comparable. Initially, the strength is overestimated by the analysis. At the point of maximumdiscrepancy, when the deflection of stiffener 1 is approximately two times the plate thickness or 0.013L, the finite elements predict 22% less load than that expected by the analysis. This overestimation of strength is attributed to the assumption that the transverse membrane stress is equal to the yield stress. The rigid-plastic analysis is more applicable to the large deflection region where it becomes slightly conservative with a maximum difference of the order of 8%.
The response predicted by the first simplified analysis, is initially identical to that which considers longitudinal membrane action. As the deflection increases,longitudinal membrane action becomes increasingly important, and therefore the behaviour predicted by the simplified analysis diverges. However, this analysis has its own merit in being simple and giving a conservative strength estimate at deflections in excess of several times the plate thickness.
The response predicted by the second simplified analysis, is virtually identical to the result obtained by the full analysis presented in Section 6.2. This can be explained by referring to Fig. 6.4. For the range of deflections shown in figures6.6, only stiffener 1 attains a significant enhancement in strength above that corresponding to the limit load due to longitudinal membrane action. At very high deflections however, the two predictions begin to differ as membrane action begins to take effect in stiffener 2.
The responses of indirectly loaded stiffeners are compared in Figs 6.6(b) to 6.6(d). The same general conclusions as for stiffener 1 can be drawn about the degree of conservatism in the predicted behaviour by the analyses. As shown in these figures, the predictions for the indirectly loaded stiffeners show higher discrepancies than those for stiffener 1. However, the accuracy with which the response of the
160
directly loaded stiffeners is predicted, is of primary importance.
In general, the second simplified analysis seems the most attractive of all. It has the advantage of avoiding complexity of the analysis and improving the accuracy over the first simplified analysis.
6.5.2 Adjacent stiffener deflections
The estimated deflections of the adjacent stiffeners are compared in Figs 6.7. Figure 6.7(a) shows stiffeners 1 and 2 pivoting with respect to stiffener 3 for a significant part of the deflection history presented. The simplified analyses predict slopes 1:2, 2:3 and 3:4 for stiffeners 1, 2 and 3 respectively as there is noincrease in the strength of beams 2, 3 etc. above their limit load value. Therefore, the slopes can be predicted by using the limiting value of the relationship (6.5(b)). The full analysis predicts some differential increase in thestrength of the beams and therefore the predicted slopes are slightly altered but in accordance to (6.5(a)). The data points obtained from the finite element analysis of the deck R02 show the stiffeners 1 and 2 pivoting with respect to stiffener 3 for a considerable part of the deformation history. This can be explained by the increased axial force in both stiffeners 1 and 2 in R02 due to shearing in thedeck plate. This in turn causes the increase in strength in the same stiffeners.
Good agreement between the theoretical analyses and the numerical results is shown in Figs 6.7(b) and 6.7(c) in the range of deflections where results from all the analyses exist. This is because the outer stiffeners have much smallerdeflections than the inner one, and therefore, their strengths are close to those at limit load.
6.5.3 Axial forces in the stiffeners
Axial forces in the middle of the stiffeners are plotted against stiffener central deflections in figures 6.8. Figure 6.8(a) shows the response for stiffener 1, where the axial force predicted by the finite element solution grows faster than that predicted analytically. At a value of axial force slightly higher than 60% of the squash load, the predictions follow two completely opposite trends. The initially higher axial force values in the numerical model for deck R02 may be a consequence of plate shearing which is not considered in the analysis. The following plateau in the numerical prediction for deck R02 is probably due to

161
plastification in the plate panel between stiffeners 1 and 2.
The axial force for stiffener 2 is given in Fig. 6.8(b). At small deflections, the axial force in the centre of the stiffener can be compressive due to shearing in the plate panel between stiffeners 1 and 2. The higher values of axial force in R02 observed thereafter, are due to plate shearing in the panel between stiffeners 2 and 3.
Although the discrepancies in the axial force values are considerable at small deflections their effect on the strength is not significant because their contribution to the product n5/L is small though. When the values of n5/L become higher, the discrepancies in n are smaller, particularly for stiffener 1.
6.6 M O D E L IMPLEMENTATION USING FINITE ELEMENTS
In order to isolate the influence of the assumption of a bilinear mode mechanism the proposed model was generated using finite elements. By using flexible beam finite elements to model the longitudinal beams, any difference in shape from the straight line assumed in the analytical model can be followed. To model the vertical component of the transverse membrane force, the linear spring element was used. As explained in Section 3.6.1.3, the vertical component of the transverse membrane force is assumed to vary linearly with the differential deflection between two adjacent stiffeners at the same longitudinal position.
The load-deflection response as predicted by both finite elements and the analytical model is shown in Fig. 6.9, where it can be seen that the agreement is very good. The more flexible response of the finite element model is anticipated as a result of elasticity effects incorporated in the beam element. Therefore, the analytical model presented in this chapter is acceptable, for the range of deflections shown in Fig. 6.9, even if the bilinear mode of deformation is assumed.
The build-up of axial force with increasing deflection for stiffener 1 is shown in Fig. 6.8(a). The agreement with the full analysis is good up to a value of n higher than 60% of the squash load. Thereafter the predictions diverge. Comparison of the predicted deflection responses for stiffener 2 in Fig. 6.8(b) shows fairly good agreement both in terms of values and general trends.
162
The observed discrepancy in the values of the axial force is due to the difference in the mode-shapes assumed, as explained in Chapter 4. Additional evidence showing that the beams do not follow the bilinear mode assumed in the analysis, is given in Figs 6.10 and 6.11. These plots illustrate the mode-shapes for stiffener 1 at various stages of the deformation history. Figure 6.10 is produced from the numerical analysis of deck R02, while Fig. 6.11 is produced from the numerical analysis of model MR02. Comparison of the two figures shows that both mode-shapes undergo incremental rotations in excess of those assumed by the bilinear mode-shape.
6.7 COMPARISONS W I T H O T H E R D E C K GEOMETRIES
Two other decks with different geometries were also analysed. The first deck, namely R03, had four longitudinal stiffeners across the entire width of the deck. The stiffeners were flat bar sections symmetrically placed with respect to the plate mid-surface. This results in 'notional beams' of cruciform cross-section. The parameters of this cross-sectional geometry were given in Table 4.1. The various predictions for the central deflection of the loaded stiffener (stiffener 1) are plotted in Fig. 6.12(a). The agreement between the numerical analysis and the analytical model is excellent. As in Section 6.5.1, the same general conclusions can be drawn for the simplified analyses. Analytical predictions for stiffener 2 are given in Fig. 6.12(b) and have similar degree of accuracy as for stiffener 1. Predictions of adjacent stiffener deflection for the two stiffeners in this quarter-deck are given in Fig. 6.12(c). As in the case of deck R02, stiffener 1 deflects more relative to stiffener 2 than predicted by considering both stiffeners to pivot with respect to the support.
The second deck, namely R04, had a similar cross-sectional geometry to deck R02, but different proportions for the 'notional beams', as given in Table 4.2. The predictions for the load versus stiffener central deflections are given in Figs 6.13(a) to 6.13(d). Good agreement is observed between the analyses and the finite element results. Finally, the deflections of adjacent stiffeners are given in Figs 6.13(e) to 6.13(g). The same conclusions as for the previous decks can be drawn for the deflections of adjacent stiffeners.

163
6.8 CONCLUSIONS
A fully restrained deck with longitudinal stiffeners can be visualized as a series of longitudinal beams and transverse plate strips.
Three types of analysis were presented. A common assumption in all analyses was that the behaviour of the plate strips is represented by the membrane solution in the transverse direction. The first analysis considered longitudinal axial force development in the beams and gave a very good agreement with the finite element results for the behaviour of the deck. The second analysis disregarded the longitudinal axial force development and resulted in a simple prediction which diverged from the analysis with increasing deflection. The third analysis considered longitudinal membrane force development in the directly loaded beam only and could be regarded as an optimum, with regard to complexity and accuracy.
The decks considered in this chapter help verify the wider applicability of the proposed analysis, although a full parametric investigation is beyond the scope of this thesis. An insight into the phenomena occurring in this type of deck under the localized loads considered and an attempt to model the main actions governing the behaviour of a simple model were given primary importance.
The load history of restrained decks can be estimated using the analyses presented. Other limit analyses, which disregard the membrane action, give a single value for the ultimate load sustained by the stiffened plating. Therefore, the advantage of the analyses presented in this thesis is that the plastic energy absorbed during the deformation of the deck can be calculated. Furthermore, the load carrying capacity estimated without including the contribution of membrane action in the decks, is expected to be different to that predicted by the present analyses.
The range of declections over which the analyses are applicable was shown to be of the order of twenty five times the thickness of the deck plate and probably even higher. This range is enormous and its upper end may not be of practical interest. At very large deflections, of the order of many times the plate thickness, it is likely that material rupture due to excessive straining will govern the behaviour. This limits the range of acceptable deformations, and therefore, any extension of the analyses to account for even higher deflections, is rather unnecessary.
Finally, it is worth mentioning that two aspects of the actual deck behaviour were not modelled in any of the analyses presented. The first aspect is shearing in the

164
plate that results from the deck taking on a non-developable shape. The effect of plate shearing is to enhance the longitudinal tension force near mid-span. The second aspect is that the directly loaded stiffener does not follow exactly the bilinear mechanism shape assumed. In Chapter 4 an approximate method to consider this effect was discussed. Both aspects could be the subject of further research.


166
Ni1X-1)m{
Fig. 6.2(a) Forces acting on stiffener 1
iX-llMf
Fig. 6.2(b) Forces acting on stiffeners other than 1

167
d6j*i/L d6j/L d6j-i/L\-i i— t i— i
Fig. 6.4 Strength increments of longitudinal mechanisms

168
tOtO
*
9-
-w'N-
©« 81 D k. .C *
©« —>
i|±O ©.5 S
c e l.*” !£ ©
coIf
i_'X co "
© © ©x
5:o-.E -
CT> CccrUJ
vjz +
o tz.•£— (0 o 5 c
EoC ®
§SoX O'— §! ©
Li_Q %
5
Fig . 6 . 5 C o m p o n e n t s o f s t i f f e n e r d e f l e c t i o n i n c r e m e n t

L O
• / /
• / /
• / ' '
\
\
\
\
_________________\
J
U ) •
• / /
• /
7 //
/
«
: / /
/ // /
/
K )
1 / , / *
1 /
C N
o 1
/ / *
f •
/ /' • F I N A S ( R 0 2 )
; -------------------------------------------- A N A L Y S I S
1 ........................................................ s i m p l i f i e d 2
J ----------------------------------------- S I M P L I F I E D 1
-------------------------------------------- E L A S T I C
------------------------------------------ 1-------------------------------------------1-------------------------------------------i-------------------------------------------
0 . 0 4 . 0 8 . 1 2 . 1 6
DE FL E CT IO N , <5, /L
F ig . 6 . 6 ( a ) L o a d v s . s t i f f e n e r 1 c e n t r a l d e f l e c t i o n
t o
•
•
/ ' '
/ // /
' ' ss '
s '
t o
•
•
/ '
s 'S ' s 'r /
s 's
s 's '
<
• / // /
/ /
\
\
__________
o
/ •
C N •
•
1
I
• F I N A S ( R 0 2 )
-------------------------------------------- A N A L Y S I S
, ........................................................ S I M P L I F I E D 2
----------------------------------------- S I M P L I F I E D 1
o ' t i I0 . 0 2 . 0 4 . 0 6 . 0 8
D EF LE CT ION , <52/ L
F ig . 6 . 6 ( b ) L o a d v s . s t i f f e n e r 2 c e n t r a l d e f l e c t i o n

I D
•
•
•s '
s '/
/s '
/s '
s '
v n “ I
• / ,
• / • ' /
■ /• / /
V / " ^
/
//
• / /
• / /
/ /
r >
•
•
C N •
►
• F I N A S ( R 0 2 )
-------------------------------------------- A N A L Y S I S
, ......................................................... S I M P L I F I E D 2
------------------------------------------ S I M P L I F I E D 1
o i i r0 . 0 2 . 0 4 . 0 6 . 0 8
D E F L E C T IO N , 6 3/ L
F ig . 6 . 6 ( c ) L o a d v s . s t i f f e n e r 3 c e n t r a l d e f l e c t i o n
l O
• /
• / /
• / ' '
7 7
s ' ' '
s '/
/
S'
s ^
u S “* / /
/ / ✓
r / // > /
( / • / '/
/ •••
•
r o
•
I
CM ►
►
• F I N A S ( R 0 2 )
-------------------------------------------- A N A L Y S I S
( ........................................................ S I M P L I F I E D 2
------------------------------------------S I M P L I F I E D 1
o ' "" ' I I I0 . 0 1 . 0 2 . 0 3 . 0 4
DE FL E CT IO N , <54/ L
F ig . 6 . 6 ( d ) L o a d v s . s t i f f e n e r 4 c e n t r a l d e f l e c t i o n
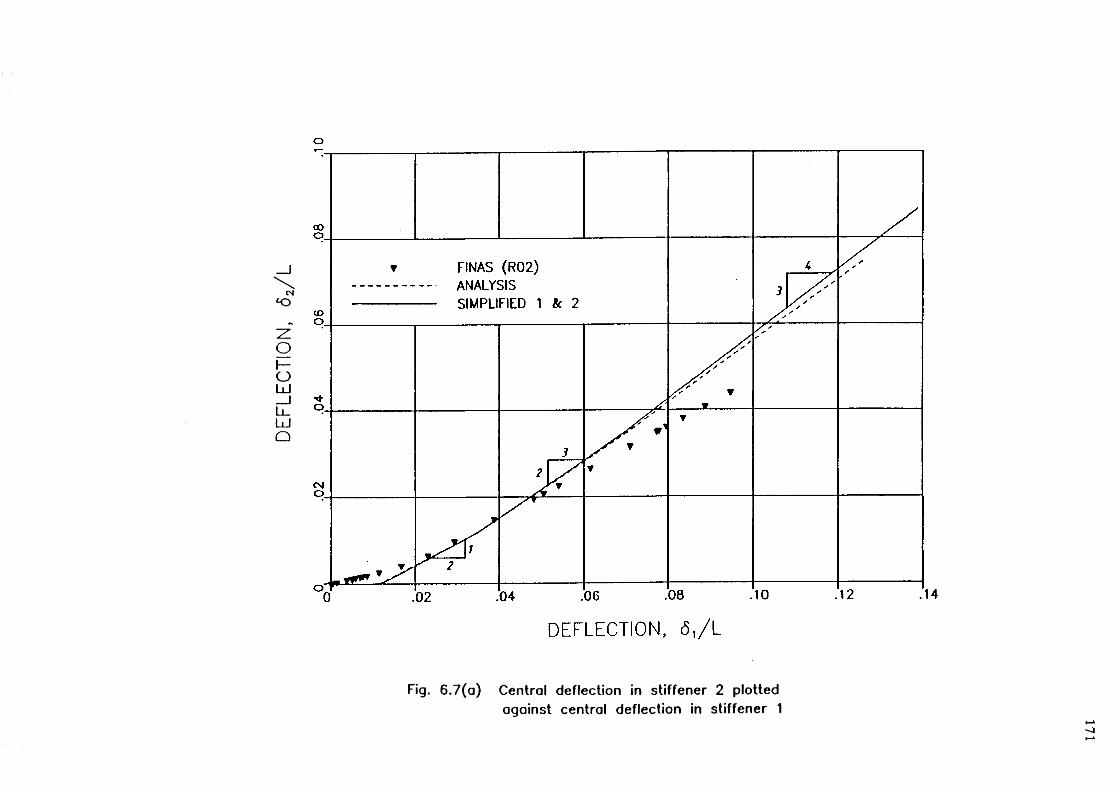
171
1/
ZS> ‘N
OIi0
31
J3
Q
Fig. 6 .7 (a ) C entra l deflection in s tiffen e r 2 p lotted aga in s t cen tra l deflection in s tiffen e r 1

DE
FL
EC
TIO
N,
<54/
L
DE
FL
EC
TIO
N,
63/
L
172
IDO.
t FINAS (R02)...................... . ANALYSIS------------------ SIMPLIFIED 1 & 2
3
✓ *✓
2 /
T ✓i m r T X
2
° 0 ! o 2 !o4 .06 .08
D E F L E C T IO N , 6 2/ L
Fig. 6 .7 (b ) C entral deflection in s tiffen er 3 p lotted
against cen tra l deflection in s tiffe n e r 2
D E F L E C T IO N , 6 3/ L
Fig. 6 .7 (c ) C entral deflection in s tiffen e r 4 p lotted
against cen tra l deflection in s tiffe n e r 3

173
o
00
*---------- FINAS (R02, MAX) J -------------- ANALYSIS & SIMPLIFIED 2
• FINAS (MR02) /
tO ■ ■ • / •
• «
■ /
•
••
CM /
/ •
■ /
/ •/ •
•
o0 04 08 12 16
DEFLECTION, <5,/L
Fig. 6 .8 (a ) Axial fo rce vs. deflection fo r s tiffe n e r 1
o
CO
■ FINAS (R02, MAX) /-------------- ANALYSIS /
• FINAS (MR02) /
to /■
■
<N
■/ •
/ •■ /
/ • / •
•
° 0 , i o 4 . 0 8 . 1 2 . 1 6
DEFLECTION, <52/L
Fig. 6 .8 (b ) Axial fo rce vs. deflection fo r s tiffe n e r 2

t o
Q.
CD<O
to'
ro'
CN|'
/..../
7
///
/ i/ // •/ // // '
—^--------------y
I I //
I f / /;f I f 17
/ff*
/ '/ >/ // /
/ •/ // // yy
i f ,7
i ' f H
1; # -f f /T '?>* / T / 1
/ /
/«r
II / / /> '
I n / /7 Y
>4
i /- - r f
6 , ANALYSIS62 ANALYSIS <53 ANALYSIS 64 ANALYSIS6 , FINAS (MR02) 6Z FINAS (MR02)63 FINAS (MR02)64 FINAS (MR02)
.04 .08 .12 16
D E F L E C T IO N , 6 / L
Fig. 6.9 Load vs. stiffener central deflections fo r deck R02

175
*
Rg. 6.10 Stiffener 1 mode—shapes from R02
i
Rg. 6.11 Stiffener 1 mode—shapes from MR02

176
c.<ooLJL
d
Q
o
2:ooUJli-UJQ
01
Fig. 6.12(a) Load vs. stiffener 1 central deflection Fig. 6.12(b) Load vs. stiffener 2 central deflection

177
l/
z9
‘N0
I10
3U
3C
]
Fig. 6 .1 2 (c ) Central deflection in stiffener 2 plotted against central deflection in stiffener 1

<0
••
••
••
i r i
/•
# ••
•• /
» X 'y'/
•• / Vs'
X ' /
/
r »
/
/ %(S
......
......
......
......
.....
• F I N A S ( R 0 4 )
• ------------------------------ A N A L Y S I S
...................................... S I M P L I F I E D 2
1 -----------------------------S I M P L I F I E D 1
o n ------------------ 1------------------ 1------------------ 1------------------0 .02 .04 .06 .08
DEFLECTION, <52/ L
Fig. 6 .1 3 ( b ) Load vs. s t if fen er 2 cen tra l deflection

179
ID
••
••
Bu>
* // /
• /
\
\
____
_\_
____ /
s '/
V: / /
* / / V /
1 /
£n••
•
•
•CN
■
•»•*>
• F I N A S ( R 0 4 )
-------------------- A N A L Y S I S
.......................... S I M P L I F I E D 2
’ -------------------- S I M P L I F I E D 1
cn--------------------1------------------- 1------------------- 1-------------------0 .02 .04 .06 .08
DEFLECTION, <53/ L
Fig. 6 . 1 3 ( c ) Load vs. s t if fen er 3 c en tra l deflection
DEFLECTION, <54/ L
Fig. 6 . 1 3 ( d ) Load vs. s t if fen er 4 c en tra l deflection

180
<c
oi—CJLULJQ
Fig. 6.13(e) Central deflection in stiffener 2 plotted against central deflection in stiffener 1

DEFL
ECTI
ON,
64
/L
DEFL
ECTI
ON,
<53
/L
181
CDo .
▼ FINAS (R04)..................— ANALYSIS------------------ SIMPLIFIED 1 & 2
3 s2 /
2
° 0 ! u 2 . 0 4 . 0 6 / 08
D E F L E C T IO N , <52/ L
Fig. 6 .1 3 ( f ) C entral d eflection in s tiffen e r 3 plotted aga in s t cen tra l deflection in s tiffe n e r 2
Fig. 6 .1 3 (g ) C entra l deflection in s tiffen e r 4 p lotted aga in s t cen tra l deflection in s tiffe n e r 3

182
CHAPTER SEVEN
BEHAVIOUR O F UNRESTRAINED STIFFENED DECKS U N D E R PATCHLOADING
7.1 INTRODUCTION
In Chapters 3 to 6 the behaviour of a single-bay stiffened deck with full in-plane restraint under lateral patch loading was studied and an analytical model was proposed. The behaviour of an unrestrained stiffened deck is studied in this chapter, whilst an analytical model describing this type of end conditions is developed in Chapter 8. In practice, the behaviour of a bay incorporated in a multi-bay assembly lies between these two extreme cases studied in this chapter.
Three simply supported and free to pull-in single-bay deck geometries subjected to lateral patch loading are studied in the inelastic range by means of numerically generated data and, in one case, available test results. The effect of bay width to length ratio, called bay aspect ratio, on the distribution of the membrane action is primarily investigated. The three geometries considered have bay aspect ratios of 9:12, 12:12 and 15:12 and are labelled as SI, S2 and S3 respectively. Two alternative geometries are used for the stiffeners, with geometries SI and S3 having identical stiffeners. The panel aspect ratio, b/2L, and the panel slenderness, b/t, are kept constant.
The increasing contribution of the membrane action to the load carrying capacity of the deck as deflection increases, is studied. Methods to predict such action are also investigated.
7.2 ANALYSIS O F D E C K S2
Dowling (1968) performed a series of tests on simply supported single bay decks under centrally applied patch loading. Most of the tests were carried out to investigate the differences in load distribution between adjacent stiffeners in the

183
elastic range caused by the variation in deck flexural and torsional rigidities. Of interest to the work in this thesis is a half-scale model which was initially tested elastically but was subsequently loaded in the inelastic range up to collapse. This geometry is referred to as deck S2.
7.2.1 Geometric details of the model
The main feature of the model deck tested by Dowling was that the torsional rigidity of the model should be varied without significantly altering the longitudinal and transverse flexural rigidities. For this reason the rather unusual stiffener geometry (wide flanges), shown in Fig. 7.1, was chosen.
The deck cross-section was originally of the twin-skin type, in which the vertical stiffeners were confined by the top and bottom plates, with high torsional rigidity. After this model had been tested in the elastic range, the longitudinal weldsjoining the bottom flange panels of the inverted T-sections were opened by sawing. This modified model was then loaded in the elastic and inelastic range up to collapse.
The deck plate was 4.76mm (3/16H) thick, spanning over the stiffeners spaced at 127mm (5M) centres, giving a panel slenderness for the deck plate of 26.7. The stiffeners spanned over flexible cross-girders 1524mm (60") apart. The depth to span ratio for the stiffeners was 1:20 and both the flanges and the webs hadthicknesses of 2.54mm (0.1"). Table 7.1 gives the proportions of thecross-sectional configuration for a 'notional beam' in deck S2.
Flexible cross-girders were used, comprising inverted T-sections, spanning over a distance of 1397mm (4' 7") between the supports at the corners of the model and giving a depth to span ratio of 1 in 8.8. The web was cut from a 152.4mm x4.76mm (6" x 3/16") plate and the flanges were 63.5mm x 6.35mm (2.5" x0.25") in cross-section. A particular feature was the openings in the cross-girder web between the stiffener support positions. These were 101.4mm x 50.8mm (4" x 2") each and mounted access for the strain gauge wiring. In the longitudinal direction deep thin girders supported the deck edges. The overall deck geometry is shown in Fig. 7.2.
Two test coupons, taken from the deck plate, gave an average yield stress of 229N/mm^ and an elastic modulus of 195kN/mm^. The yield stress for the cross-girder was higher and a value of 340N/mm^ is used in the numerical model described in the following section.

184
7.2.2 Finite Element modelling
The finite element package FIN AS, described in Section 3.3, was employed. The 8-noded isoparametric shell element and the 3-noded isoparametric space beam element were selected from the element library. The deck plate was modelled with shell elements while the beam element was used for the stiffeners and the cross-girder. The longitudinal-girder was assumed to respond stiffly and remain elastic throughout the load history. Therefore, it was excluded from the finite element model and 'its location was modelled as being rigid to out-of-plane deflections but rotationally free.
The quarter deck analysed by finite elements is shown in Fig. 7.3. Two rows of shell elements, each having six elements along the length, were used between the stiffeners. Two rows of elements were also used between the longitudinal centre line and the adjacent stiffener, while one row of shell elements was employed for the overhanging portion of the deck over the longitudinal-girder. The layout of shell elements is shown in Fig. 7.3.
Proper modelling of the openings in the cross-girder web requires the use of shell elements. Such a model, however, is very costly in computational time, especially when non-linearity in the material is also modelled. In addition, numerical difficulties are frequently associated with elasto-plastic finite element analyses involving a large number of admissible degrees of freedom. It was decided therefore to use the beam element for the cross-girder. While the hanging portion of the deck over the cross-girder contributes fully to the cross-girder top flange, its contribution to the behaviour of the longitudinal stiffeners is negligible. Since the behaviour of the stiffeners relative to that of the cross-girder was to be compared, this portion of the deck was not modelled.
As part of a mesh convergence study the number of shell elements along the length was increased to eight by using shorter elements close to the cross-girder. Modelling of the longitudinal-girder with beam elements was also undertaken. These alterations to the mesh had very little effect on the central deflections of the stiffeners relative to those at their supports on the cross-girder. Therefore, the simpler shell element layout first described above and shown in Fig. 7.3, was adopted for detailed examination of the deck behaviour.

185
Finally, a model using shell elements to model the cross-girder webs, including their openings was devised and compared with the above model and the test in the elastic range only. This model also incorporated the portion of the deck hanging over the cross-girder. Reference to this model is subsequently made by the term 'elastic', in contrast with the model described above for use in the elasto-plastic range, labelled 'S2\
7.2.3 Loading
The total loading in the test was a central patch covering an area 152.4mm wide by 31.75mm long. On the quarter deck, shown in Fig. 7.3, the loaded area is shown hatched. This results in three partially loaded shell elements. The equivalent nodal loads were found by performing the appropriate integrations. Load increments are applied as a function of the load factor, p, defined as the lateral patch load acting on half deck divided by the limit load of a simply supported stiffener and its associated fully effective plating spanning between cross-girders.
7.2.4 Comparison of experimental and numerical results
7.2.4.1 Load histories of the stiffener central deflections
The growth in the central deflections of the three inner-most stiffeners (stiffeners 1 to 3 in Fig. 7.3) under increasing loading is illustrated in Figs 7.4 to 7.6. The elastic response, obtained from the numerical model in which the openings in the cross-girder were modelled, is shown by a continuous line. There is excellent agreement between the 'elastic' numerical model and the early experimental response. The elasto-plastic finite element analysis for deck S2, however, gave an unconservative response with respect to the test results in both the elastic and elasto-plastic ranges for stiffeners 1 and 2. For stiffener 3 the numerical analysis was unconservative in the elasto-plastic range only. This may be attributed to the distortion of the cross-sections of the stiffeners from their initial shape. Such change in the cross-section cannot be accounted for when the stiffener is modelled with beam elements. The distortion of the stiffener from its initial shape is expected to be significant, especially when the stiffener has very thin and wide flanges. The loss of stiffness observed in the load-deflection history of stiffener 1 due to successive collapse of the stiffeners across the width of the deck is also observed.

186
In general, it may be concluded that a very good agreement between the finite
elements and the experimental results is observed in Figs 7.4 to 7.6.
7.2.4.2 Relative stiffener deflections
The central deflections of stiffeners 1 and 2 are plotted against the central
deflections of adjacent stiffeners in Figs 7.7 and 7.8. Slopes of 1:2 and 2:3 are
observed in Fig. 7.7, indicating that stiffener 1 pivots with respect to stiffeners 3
and 4 respectively. As stated earlier in Section 6.2.3.3, this behaviour is
characteristic of stiffener responses governed by bending. The load spreads
outwards by means of combined transverse shear and transverse membrane
mechanism. However, the longitudinal membrane distribution across the deck width
cannot increase the load significantly above the plastic collapse load value of a
stiffener and its associated plating.
7.2.4.3 Transverse membrane action in the plate
The growth of transverse membrane action with increasing deflection is shown in
Figs 7.9(a) to 7.9(d). In these and all the following figures concerning stress
resultants in the plate, the notation assumed is the one adopted in Section 3.5.2
and shown on Fig. 3.1(a). It is worth noting that the transverse compressive forces
do not balance the transverse tensile forces along a longitudinal section of the
plate because the cross-girder action contributes to the former. At higher loads,
the maximum tensile stress resultant per unit width corresponds to membrane yield
in the deck plate. Another interesting point is that the effective width of the
tensile transverse membrane action (on the quarter of the deck shown in these
figures) appears to increase from b to 1.5b as the load is increased.
7.2.4.4 Transverse bending moments
Transverse bending moment distributions in the plate at various load levels are
illustrated in Figs 7.10(a) to 7.10(d). Two trends can be noted by close inspection
of these figures. The first is the overall growth of bending moments, and the
second is the reduction of bending action near the transverse centre line. The
latter is due to the development of high longitudinal and transverse membrane
action in the plate at large deflections.

187
A particular feature not present in the transverse bending moment plots presented
in Section 3.5.2.4, is the opposite sign of the bending moment values at either
side of a stiffener. This is because of the torsional restraint that the cross-girder
provides at the end of the stiffeners. On the other hand, the scalloped pattern
described in 3.5.2.4 can also be observed in this case.
7.2.4.5 Bending moments in the beams
The same idealization, as in Section 3.5.3, where each stiffener and its associated
fully effective plate is viewed as a 'notional beam', is used here. Figures 7.11(a)
and 7.11(b) show the bending moment distribution along such beams at two load
levels. The distribution at an early stage is shown in Fig. 7.11(a), with most of
the load carried by stiffeners 1 and 2. As the applied load increases in magnitude,
load is spread to the other stiffeners, as seen in Fig. 7.11(b). It is worth noting
that the support moments of these 'notional beams' are not zero. This is due to
the rotational restraint, applied by the cross-girder as an eccentric force at the
beam ends.
7.2.4.6 Axial forces in the beams
The distribution of the axial force along the 'notional beams', normalized with
respect to the squash load, is shown in Figs 7.12(a) and 7.12(b). The axial force
distribution at an early stage is shown in Fig. 7.12(a), where only stiffener 1 is
subjected to a modest axial force. At higher loads (Fig. 7.12(b)), there is
significant membrane action, with the value of the axial force in beam 1 being
much higher than elsewhere. The compressive force existing near the end of beam
1 is applied by the cross-girder.
7.2.4.7 Interaction between stress resultants in the 'notional beams'
The theoretical fully-plastic interaction between the non-dimensionalized stress
resultants on a 'notional beam' cross-section under a uniaxial stress state is plotted
in Fig. 7.13 with a continuous line. The stress resultants of the various stiffeners
observed at the Gauss point closest to the transverse central line are also plotted
for comparison. It can be seen that, once a 'notional beam' becomes plastic, the
uniaxial stress resultant interaction is followed fairly closely.

188
7.2.5 Discussion
The comparison presented above between numerical analysis and the test
undertaken by Dowling (1968), is a validation of the finite element package FINAS
for this type of analysis. Additional features of deck behaviour, including the effect
of cross-girders were also illustrated. In the test deck S2 failed at p-5.5 due to
the collapse of the cross-girder. Assuming a rigid cross-girder, the deck would
experience larger relative deflections and the phenomena occurring in this range
are investigated in the following.
7.3 T H E INFLUENCE O F BA Y ASPECT RATIO O N M E M B R A N E ACTION
The aim of the two analyses presented here, is to obtain further information
concerning the development of membrane action in a deck, and to investigate
ways in which the behaviour of such a deck can be predicted analytically. Both
decks analysed in this section are simply supported along all four boundaries and
free to draw-in. This investigation is not a parametric study of membrane action,
but an attempt to devise a procedure by which the behaviour of any given deck
can be predicted. It was thought that one of the main parameters affecting the
distribution of the membrane forces in the deck is the bay aspect ratio. Thus the
width to length ratio of the entire bay is the only variable in the finite element
analyses presented next.
7.3.1 Geometries analysed
The aspect ratio of the bay was altered by varying the number of stiffeners across
the width. The two configurations SI and S3 had 8 and 14 stiffeners across the
entire width respectively, while the stiffeners spanned over a distance of twelve
times the stiffener spacing. The stiffeners comprised inverted tee sections. Typical
geometric parameters, defining the cross-section of a stiffener and associated plate
are given in Table 7.2. The finite element mesh and the loading applied to deck
SI are identical to those in deck R02 (shown in Figs 3.2 and 3.4 respectively),
while the mesh in deck S3 contained two rows of shell elements for each additional panel.

189
7.3.2 Deck SI
In the following, attention is drawn to the overall behaviour of the deck under
coexisting membrane and bending action. The deck is visualized as a series of
'notional beams', each having the cross-section of a stiffener and the associated
plate. The investigation is focused on the behaviour exhibited by the 'notional
beams' and the deck plate. Information on both issues is obtained from deck SI
which had the advantage that its strength, achieved by the numerical analysis, was
in excess of the load carried by the 'notional beams' under bending action only.
7.3.2.1 Transverse membrane action in the plate
The development of transverse membrane action in the plate at four stages of the
load history is shown in Figs 7.14. Where plots similar to those in the preceding
chapters are made, the same notation is adopted. Comparison between Figs 7.14(a)
and 7.14(b) shows that the transverse membrane action tends to increase in
magnitude at any point along the transverse centre line approaching tensile yield
near the centre of the deck. At points further away from the centre of the deck
in the transverse direction, the membrane action is reduced with zero value at the
edge of the deck. In attempting to quantify an effective width for the tensile
membrane forces along the longitudinal centre line, a value between b and 1.3b
can be assigned for the quarter deck shown in Figs 7.14.
Comparison of Figs 7.14(a) and 7.14(b) with Figs 7.14(c) and 7.14(d) shows a
different trend in the values of the transverse membrane action along the
transverse central line. In the latter two figures, the values for the transverse
membrane action near the intersection between the transverse central line and the
longitudinal support drop to zero. This tendency spreads towards the centre of the
deck with increasing loading, as indicated by further comparison between Figs
7.14(c) and 7.14(d). It can be attributed to a secondary phase in the large
deflection behaviour of the deck. During the first phase, transverse membrane and
transverse bending action facilitate the outward distribution of the loading. In the
following phase, which commences with the collapse of the outermost stiffener, a
different process takes place and this is discussed further in Section 7.3.2.6.

190
7.3.2.2 Transverse bending moments in the plate
Distributions of the transverse bending moments in the deck plate are illustrated in
Figs 7.15. The first two figures are associated with the spreading phase of the
loading away from the loaded stiffener, while the last two correspond to the
secondary phase of the deck load history at very large deflections.
7.3.2.3 Bending moments in the 'notional beams'
The bending moments along the 'notional beams' are presented in Figs 7.16. The
load levels used are identical with those in Figs 7.14 and 7.15. The loading phase
of the stiffeners in bending is shown in Figs 7.16(a) and 7.16(b). In the last two
figures 7.16(c) and 7.16(d), development of further bending action is hardly seen,
as compared to the first two plots. Therefore, the increase in strength is not
associated with bending acting in the beams.
7.3.2.4 Axial forces in the 'notional beams'
Longitudinal membrane action in the deck is better presented by the axial force
distribution along the 'notional beams' in Figs 7.17. The first two figures, (a) and
(b), show the growth in longitudinal membrane action. As no load is applied
externally in the longitudinal direction, the resulting force in this direction should
be zero from equilibrium requirements. However, the same forces result in an
in-plane moment applied on the quarter deck shown in these figures. This
in-plane bending should be balanced by its counterpart, produced by the transverse
membrane forces acting along the longitudinal centre line, shown in Figs 7.14.
Comparison between the first two and last two plots in Figs 7.17, shows a trend
for increasing membrane action in stiffener 1 with the appropriate redistribution of
the forces in the other stiffeners. This trend is in contrast to the one observed
from comparison between Figs 7.17(a) and 7.17(b) showing growth in the stiffener
axial forces across the width. Hence, during the second phase, at very large
deflections the tension in the loaded stiffener can keep increasing, with the
necessary redistribution of the axial forces in the other beams.

191
7.3.2.5 Interaction between stress resultants in the 'notional beams'
It is worth developing the yield locus, obtained from the interaction between the
axial and bending stress resultants, assuming uniaxial stress state in the 'notional
beams'. Such a locus, obtained for the geometry of a typical beam in deck SI, is
shown by the continuous line in Fig. 7.18. The interaction between the stress
resultants in the 'notional beams', obtained at the Gauss points closer to the
transverse centre line, is also shown. It is remarkable to observe how closely the
uniaxial yield surface is followed. Hence, the biaxiality in the plate hardly affects
the uniaxial interaction between the stress resultants in the 'notional beams'. This
is a useful observation if a plastic analysis employing the 'notional beams' is to be
used.
7.3.2.6 Contribution of stiffeners to the total strength
The maximum load sustained by deck SI, as calculated from the last step of the
numerical analysis, was about 7.3 times the limit load carried by a 'notional
beam' forming a plastic hinge at the centre. An upper bound to the load factor
can be estimated by assuming that all the 'notional beams' form plastic
mechanisms in bending with hinges lying along the transverse central line. As
there are four such beams across the deck half-width, the load factor predicted by
such analysis should be just in excess of 4, since some reactions are applied along
the longitudinal support.
Considering moment equilibrium for the quarter deck with respect to a transverse
axis passing through the supports of the stiffeners, it is of interest to determine
the contribution to the strength of every stiffener across the width. As equilibrium
of the entire deck is being considered, any interaction between the 'notional
beams' through the deck plate is neglected. The actions contributing to the
equilibrium are the axial force and bending moment in the 'notional beams’, and
the vertical reactions along the longitudinal edge of the deck. For stress resultants,
the values obtained at the Gauss points nearest the transverse centre line, were
used to approximate the values on the centre line. This results in a very small
error. Considering the equilibrium of stiffener j alone, the following expression is
obtained for the contribution to the total strength made by each stiffener:
Pjm
A.L
Pi
5 . J
L(7 .1 )
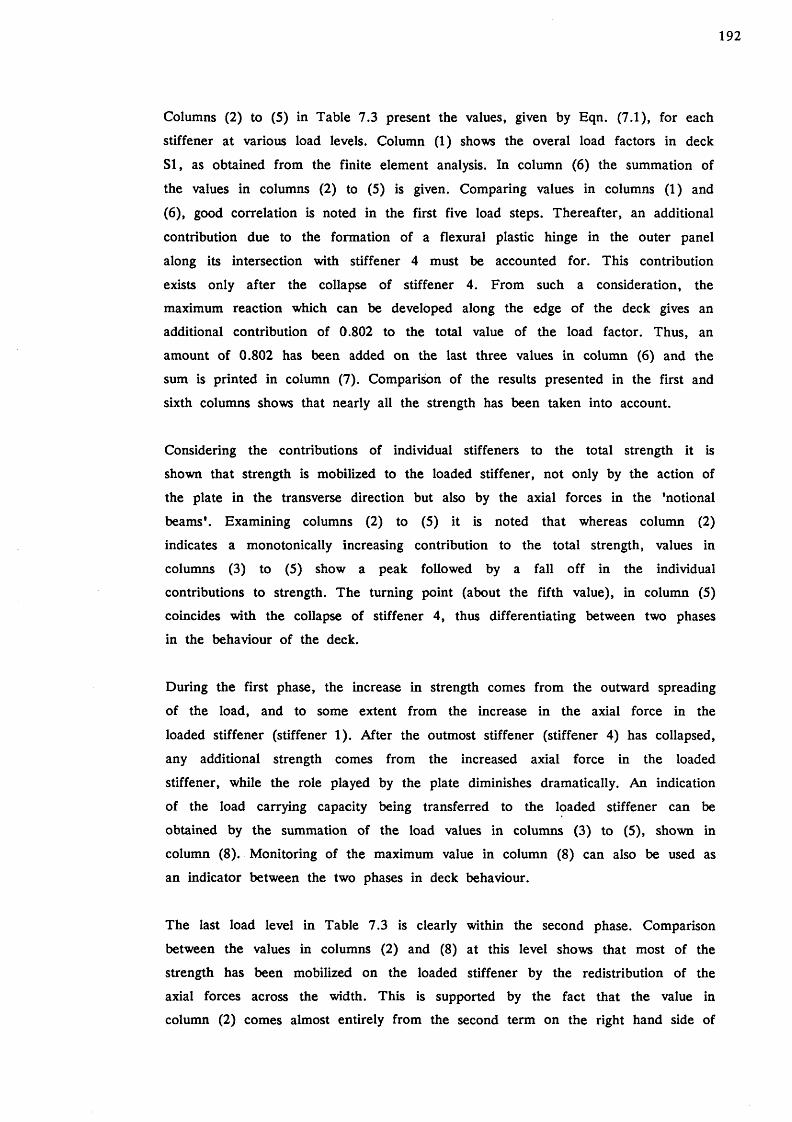
192
Columns (2) to (5) in Table 7.3 present the values, given by Eqn. (7.1), for each
stiffener at various load levels. Column (1) shows the overal load factors in deck
SI, as obtained from the finite element analysis. In column (6) the summation of
the values in columns (2) to (5) is given. Comparing values in columns (1) and
(6), good correlation is noted in the first five load steps. Thereafter, an additional
contribution due to the formation of a flexural plastic hinge in the outer panel
along its intersection with stiffener 4 must be accounted for. This contribution
exists only after the collapse of stiffener 4. From such a consideration, the
maximum reaction which can be developed along the edge of the deck gives an
additional contribution of 0.802 to the total value of the load factor. Thus, an
amount of 0.802 has been added on the last three values in column (6) and the
sum is printed in column (7). Comparison of the results presented in the first and
sixth columns shows that nearly all the strength has been taken into account.
Considering the contributions of individual stiffeners to the total strength it is
shown that strength is mobilized to the loaded stiffener, not only by the action of
the plate in the transverse direction but also by the axial forces in the 'notional
beams'. Examining columns (2) to (5) it is noted that whereas column (2)
indicates a monotonically increasing contribution to the total strength, values in
columns (3) to (5) show a peak followed by a fall off in the individual
contributions to strength. The turning point (about the fifth value), in column (5)
coincides with the collapse of stiffener 4, thus differentiating between two phases
in the behaviour of the deck.
During the first phase, the increase in strength comes from the outward spreading
of the load, and to some extent from the increase in the axial force in the
loaded stiffener (stiffener 1). After the outmost stiffener (stiffener 4) has collapsed,
any additional strength comes from the increased axial force in the loaded
stiffener, while the role played by the plate diminishes dramatically. An indication
of the load carrying capacity being transferred to the loaded stiffener can be
obtained by the summation of the load values in columns (3) to (5), shown in
column (8). Monitoring of the maximum value in column (8) can also be used as
an indicator between the two phases in deck behaviour.
The last load level in Table 7.3 is clearly within the second phase. Comparison
between the values in columns (2) and (8) at this level shows that most of the
strength has been mobilized on the loaded stiffener by the redistribution of the
axial forces across the width. This is supported by the fact that the value in
column (2) comes almost entirely from the second term on the right hand side of

193
Eqn. (7.1). Hence, the strength of the deck above that predicted by pure bending
action is attributed to the development of the longitudinal membrane forces in the
deck.
As mentioned above, the axial force in the loaded stiffener increases
monotonically, while the axial force in the outer stiffener increases during phase 1
and decreases within phase 2, as shown in Figs 7.17. During the first phase, the
tensile and compressive forces increase, as indicated in Figs 7.17(a) and 7.17(b).
On the contrary, the compressive axial forces in the outer stiffener do not
increase in magnitude, while the axial force in the loaded stiffener is still
increasing, as Figs 7.17(c), 7.17(d) and 7.18 show.
In conclusion, it can be argued that the additional strength above that based
purely on bending action comes from the membrane action in the deck and the
way in which it is distributed across the transverse centre line.
7.3.3 Deck S3
Following the discussion above, it becomes clear that central to a successful
prediction of the large deflection response of stiffened decks is the history of the
membrane forces. Having covered deck aspect ratios of less or equal to one by
analysing decks SI and S2 respectively, data for a deck with bay aspect ratio
greater than one is obtained from the analysis of deck S3. Additional information
obtained from deck S3, pertaining to aspects of the behaviour already presented
for deck SI, follows next. The information from all three decks is subsequently
used to study the build-up of membrane forces with increasing deflection and the
influence of the deck aspect ratio on their distribution.
The transverse membrane action in the plate at two stages in the loading history,
is shown in Figs 7.19. The first of the figures corresponds to an intermediate load
level while the second corresponds to the last load step in the numerical analysis.
A larger effective width for the tensile membrane forces than that suggested for
deck SI can be seen, with a value of about 2b.
Figures 7.20 present the distribution of the transverse bending moments in the
plate at the same load levels as Figs 7.19. It can be seen from Fig. 7.20(b) that
the bending phase in the plate has not fully developed across the entire width.
This is an indicator that the second phase has not yet been reached.

194
Bending action along the 'notional beams' is shown in Figs 7.21. The first of the
figures shows significant bending in stiffener 2 while, in the second figure, load is
transferred by means of the transverse mechanism further away from the centre.
Distributions of the axial forces along the 'notional beams' at the two load steps
are illustrated in Figs 7.22. Once more, stiffener 1 attracts the maximum tensile
forces while, it is stiffener 5 and not the outermost stiffener which is under the
maximum compressive force.
From the behaviour shown above, it becomes clear that the second phase has not
been reached by deck S3. Effort was made to pursue the numerical analysis to
higher load, though unsuccesful due to numerical difficulties. In this respect, since
the second phase (following the collapse of the outmost stiffener) has not been
reached for this wide deck, it is not possible to determine its onset as a function
of aspect ratio.
7.4 THE DISTRIBUTION OF AXIAL FORCES IN THE 'NOTIONAL BEAMS*
Information concerning the longitudinal membrane forces in the 'notional beams',
may be obtained by studying the development of the axial force in the loaded
stiffener with increasing deflection and the distribution of forces across the width.
In the following, the axial forces are non-dimensionalized with respect to the
squash load and further normalized with respect to the axial force in the loaded
stiffener.
7.4.1 Axial force in the loaded beam
Results from all three numerical analyses undertaken are used in Fig. 7.23 to
devise a relationship between the axial force in the loaded stiffener, n t , and the
central deflection, 5 , , non-dimensionalized with respect to the plate thickness. All
three analyses predict points distributed close enough for the relationship to be
approximated by a straight line up to membrane yielding. Alternatively, a
piecewise linear curve can be fitted. From Fig. 7.23 it appears that the axial
force developed in the loaded stiffener, under increasing deflection, is almost
independent of the deck aspect ratio, at least for values of n t less or equal to
0.75.

195
7.4.2 Axial force in other beams
Distributions of the longitudinal forces in the stiffeners across the deck width are
illustrated in Figs 7.24(a), 7.24(b) and 7.24(c) for the decks SI, S2 and S3
respectively. In these figures, the stiffener index is plotted along the horizontal
axis. Along the vertical axis the axial force in the stiffeners is plotted at various
load levels normalized with respect to the axial force in stiffener 1. The objective
of this discussion is to show how the distribution of these forces varies during the
loading process.
Figure 7.24(a) shows the distribution of the longitudinal forces at p=5.342 and also
at the last load step of the numerical analysis, corresponding to p=7.357. The
broken line corresponds to the stage on deck SI when it changes phase, while the
continuous line corresponds to the second phase. The distribution of forces at
p=5.342 exhibits a strong linearity implying that the deck experiences in-plane
bending as a deep beam. The span and depth of this deep beam seem to be
equal to the length and half-width of the deck respectively. At p=7.357 a relative
reduction in the compressive forces in stiffener 4, associated with the reduction of
tension in stiffener 2 can be observed. This redistribution is associated with the
second phase in deck behaviour and may not occur for decks which do not reach
this phase. This phase is more likely to occur in narrow decks with aspect ratios
less than one.
The distribution of longitudinal forces in deck S2 is shown in Fig. 7.24(b). At
p=2.298, stiffener 3 is under the maximum compressive force, while at p=4.547
stiffener 4 is under maximum compression. The redistribution occurring is
attributable to plasticity, that is gradual development of plastic mechanisms across
the width.
Distributions for deck S3 are shown in Fig. 7.24(c). Stiffener 5 is seen to succeed
stiffener 4 as the most compressed stiffener, whilst stiffeners 6 and 7 are
comparatively under less compression. This is in sharp contrast to the behaviour of
the outmost stiffeners in the narrow deck shown in Fig. 7.24(a).
This seems to indicate that, in wide decks, the stiffeners under maximum
compression are confined to be within a region of deck which is approximately of
square plan, having sides equal to the bay length. The correctness of this
statement must be validated by further numerical or experimental evidence.

196
Following this discussion, two alternative methods for predicting the membrane
forces across the width, other than by performing an elasto-plastic analysis, will be
investigated. The first examines the distribution of forces across the width as a
geometrically non-linear elastic problem, and the second investigates the
distribution of forces as an analogy of the in-plane problem of the deck to a
cantilevered beam loaded in the plane of the plate. This investigation is carried
out on the geometry of deck S3.
7.4.3 Geometrically non-linear elastic analysis
An elastic, but geometrically non-linear analysis may give, in some cases, guidance
on the distribution of stresses in the elasto-plastic range. Deck S3 was analysed
allowing for geometric non-linearity but neglecting material plasticity. Figure 7.25
compares distributions of the longitudinal forces across the width of the deck
obtained from the various analyses. Comparison between the distribution labelled
'non-linear elastic' and the distribution at p=6.548 obtained from the elasto-plastic
analysis of deck S3, indicates the role of plasticity in the redistribution process.
These distributions have been plotted for the same central deflection in the loaded
stiffener.
7.4.4 In-plane analysis
The transverse membrane forces, acting along the longitudinal centre line of the
quarter deck analysed, apply a stress resultant similar to in-plane bending of a flat
deck. The load distribution, idealized in Fig. 7.26, applies an in-plane bending
moment on the quarter deck as indicated in this figure. The resulting distribution
of longitudinal membrane forces across the width is shown in Fig. 7.25. This
distribution, labelled 'in-plane', has a different shape than that shown for deck S3
at p=6.548, with the maximum compression in the position of the outer stiffener
(stiffener 7), as expected. However, this analysis predicts the magnitudes of the
forces in stiffeners 2 and 3, relative to those in stiffener 1, fairly accurately.
7.5 CONCLUSIONS
A simply supported longitudinally stiffened single-bay deck, subjected to lateral
patch loading, may experience two distinct phases at large deflections. During the
first phase, the load is shed outwards, initially by means of the transverse bending

197
action in the plate and subsequently by means of its transverse membrane action.
The strength in the deck is primarily due to bending action in the beams but the
longitudinal membrane forces also contribute. The latter become of increasing
importance as the deflection increases. This phase ends, in a narrow deck, with
the collapse of the outer stiffener. In the second phase, the load carrying capacity
is increased primarily by the increasing longitudinal membrane force and deflection
in the loaded beam, while the contribution to the strength from the other
stiffeners diminishes. It is possible that the second phase may occur only in
narrow decks.
A simply supported single-bay deck with longitudinal stiffening loaded to collapse
by Dowling (1968), compares favourably with a numerical model. This deck
geometry was used to validate the application of the finite element program
FIN AS to this type of analysis.
Two more decks were analysed, which had the same panel slenderness and aspect
ratio, while the deck aspect ratio was variable. A relationship between the axial
force in the loaded stiffener and its central deflection was found. This relationship
appears to be largely independent of the deck aspect ratio and the way in which
the patch loading is applied. Its dependence on the aspect ratio and slenderness of
the panel remains to be investigated.
The importance of the longitudinal membrane action in enhancing the total load
carrying capacity of the deck above the limit load, derived from a yield line type
of analysis ignoring such action, was recognized. Ways to predict the distribution
of longitudinal membrane action other than by performing a full elasto-plastic
analysis were investigated.
Based on the observed behaviour two analytical models are proposed in the following chapter.

198
TABLE 7.1 C ross-sectiona l geometry
DECK
No.
G E O M E T R Y MATERIAL
t (mm) ( }} . t (mm) w b/tV ' w bf / t f L/b E/a
y
s2 ( 2) 4.76 2.54 26.67 30 48.75 6 852
(O t f t w
( 2) For n o ta t io n see F ig . 3 .1 (b )
TABLE 7.2 C ross-sectiona l geometry
DECK G E O M E T R Y MATERIAL
No. ( ) ) , t (mm) b /t V * w b f / t f L/b E/ay
. ( 2) ( 2) S I, S3 4.76 26.67 8.57 10.50 6 837
( 2) For n o ta t io n see F ig . 3 .1 (b )

TABLE 7 .3 Strength co n tr ib u t io n s in deck SI
p p , p2 P3 P 4 EpjI p .+0.802
JP +P +P2 3 4
(1) (2) (3) (4) (5) (6) (7) (8)
1.359 0.786 0.351 0.142 0.057 1.336 0.5502.458 1.011 0.835 0.349 0.158 2.353 _ 1.3423.385 1.263 0.961 0.660 0.267 3.160 _ 1.8974.465 1.691 1.054 0.904 0.416 4.065 _ 2.3745.342 2.254 1.158 0.900 0.478 4.790 _ 2.5366.236 3.215 1.196 0.735 0.315 5.461 6.263 2.2466.890 4.144 1.116 0.552 0.098 5.910 6.712 1.7667.357 5.072 0.971 0.422 -0.150 6.315 7.117 1.243

200
123.825
Fig. 7.1 C ro s s -s e c tio n a l g eo m etry fo r a s tiffe n e r and associa ted
plate in deck S2 (d im ensions in m m )
Fig. 7 .2 Test bay on plan


LOAD
, p
LOAD
.
i n
T
▼
▼■
4
*
▼
▼
V ”
Tr ■
nT
▼
▼▼ *
r
T ■
CN #
▼ /
▼ /
T J
▼ /
▼ /
L______
■ T E S T
▼ F I N A S ( S 2 )
------------------------------ F I N A S ( S 2 . E L A S T I C )
0 5 l !o2 5 5 i o 4 *05 *06
DEFLECTION, <5,/L
Fig. 7.4 Load vs. deflection for stiffener 1
DEFLECTION, <52/L
Fig. 7.5 Load vs. deflection for stiffener 2

203
o' ‘avoi
Fig. 7.6 Load vs. deflection for stiffener

204
o
1—(JLd_JLi_LUQ
Fig. 7 .7 C entral deflection in s tiffen e r 2 p lotted
aga in s t cen tra l deflection in s tiffen er 1

205
on
CM<001
C
JLlJ_JLi_L
JQ
l/
rS> ‘N
OI1
D3
1J
3G
Fig. 7 .8 C entral deflection in s tiffen e r 3 p lotted aga in s t cen tra l deflection in s tiffen e r 2


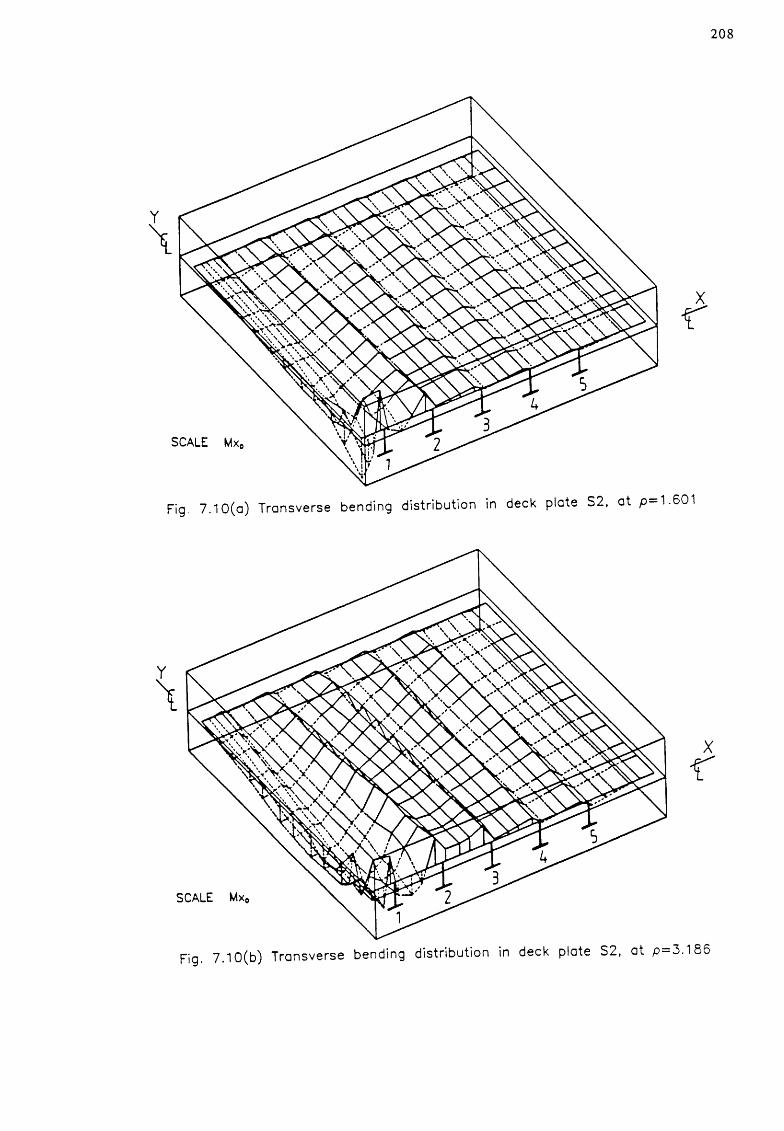
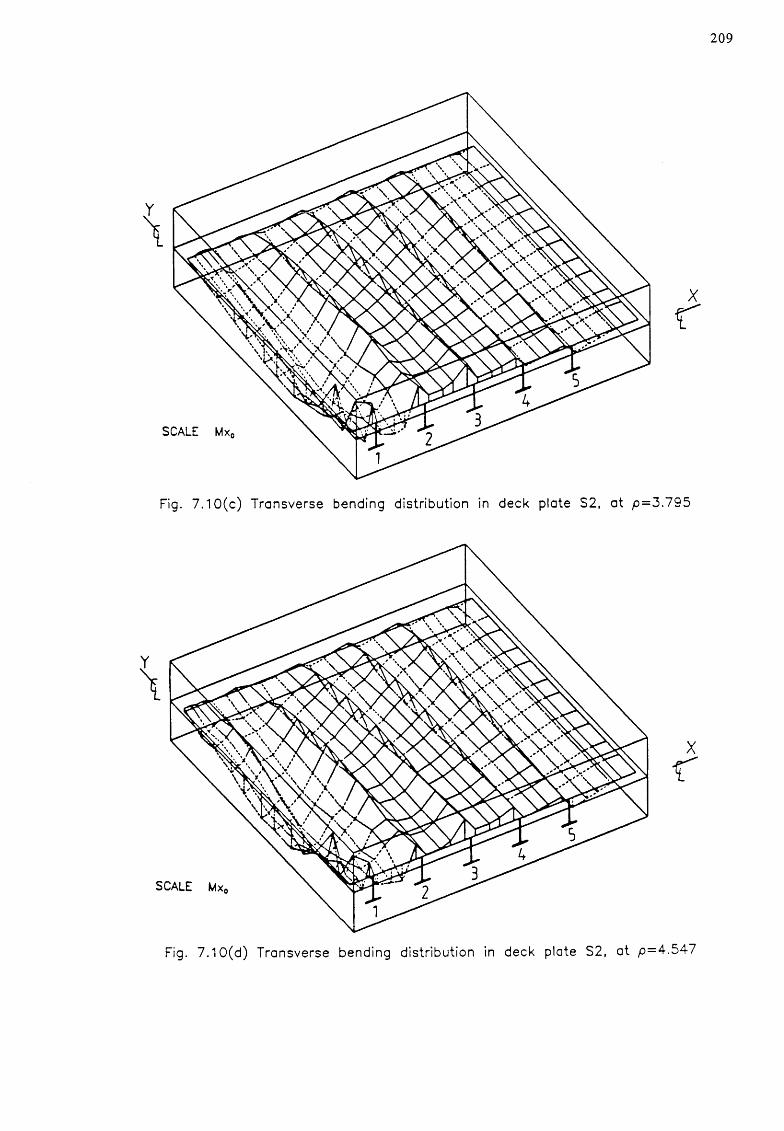

210
Fig. 7 .11(b) Bending moment along the notional beams in S2, at p -4 .5 4 7


212
coo
F ig . 7 . 1 3 C o m p a r i s o n b e t w e e n t h e s t r e s s r e s u l t a n t s in d e c k S 2 a n d t h e
u n i a x i a l m —n i n t e r a c t i o n f o r t h e n o t i o n a l b e a m c r o s s - s e c t i o n

213
Xr
Fig. 7 .1 4 ( a ) Transverse m e m b ra n e forces in deck plate S 1, a t p —2 .4 5 8
Fig. 7.14(b) Transverse membrane forces in deck plate S1, at p=4 .465

214
Fig. 7.14(d) Transverse membrane forces in deck plate S1, at p—7.356

215
Xr
Fig. 7.15(a) Transverse bending distribution in deck plate S1,at p=2.458
Fig. 7.15(b) Transverse bending distribution in deck plate SI, at p=4.465
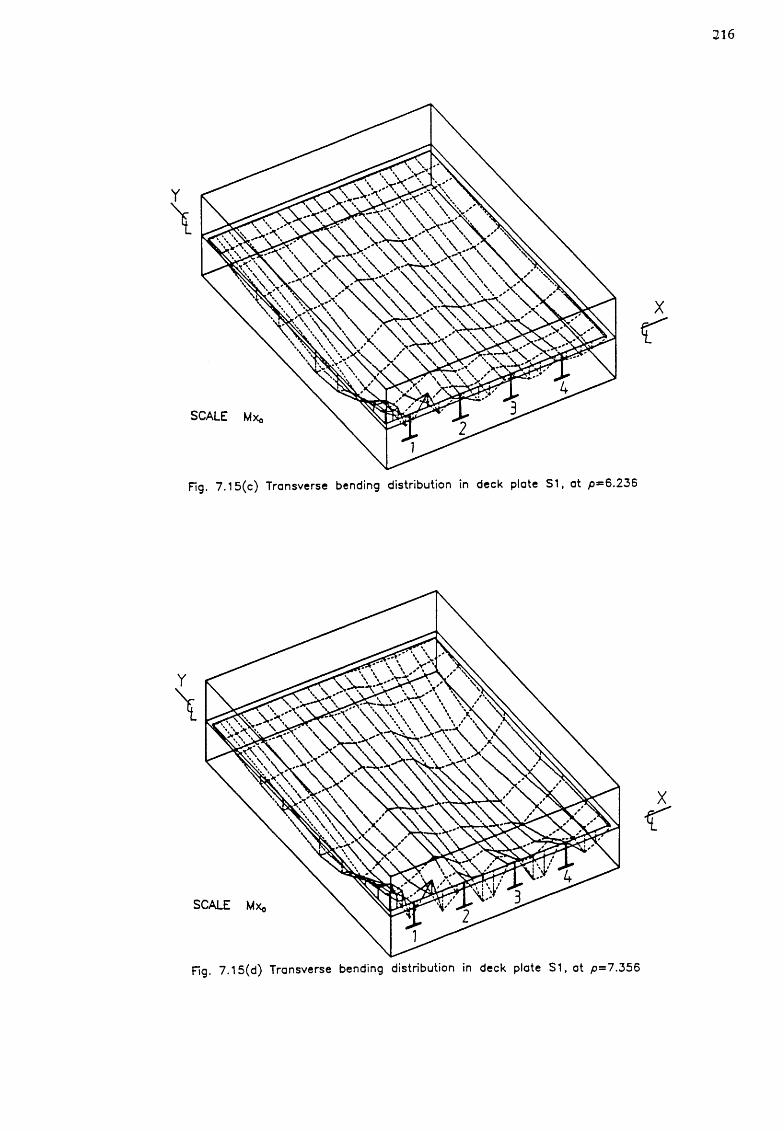
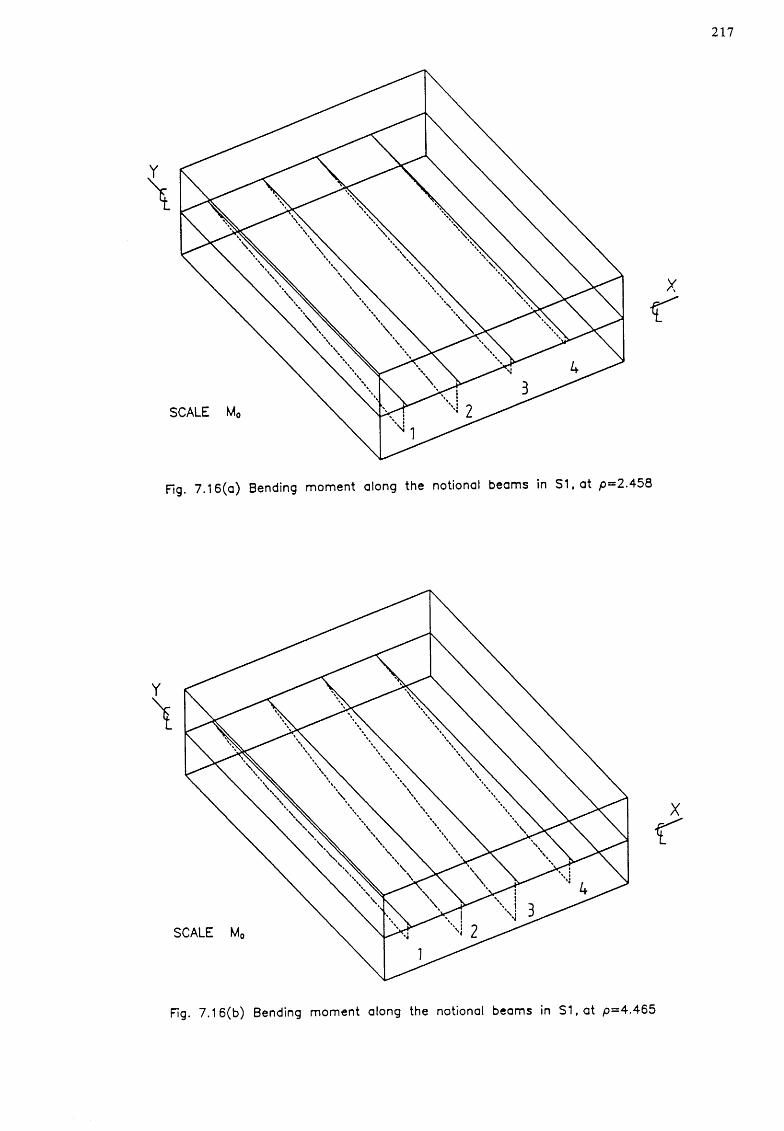
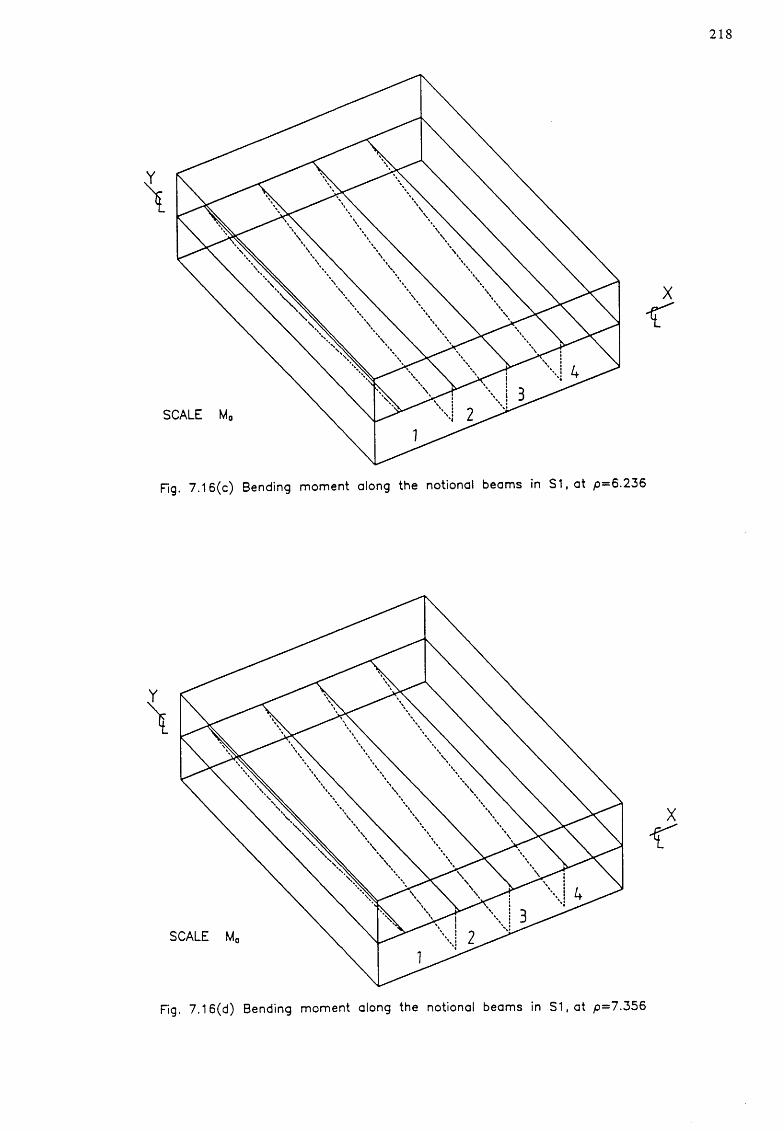


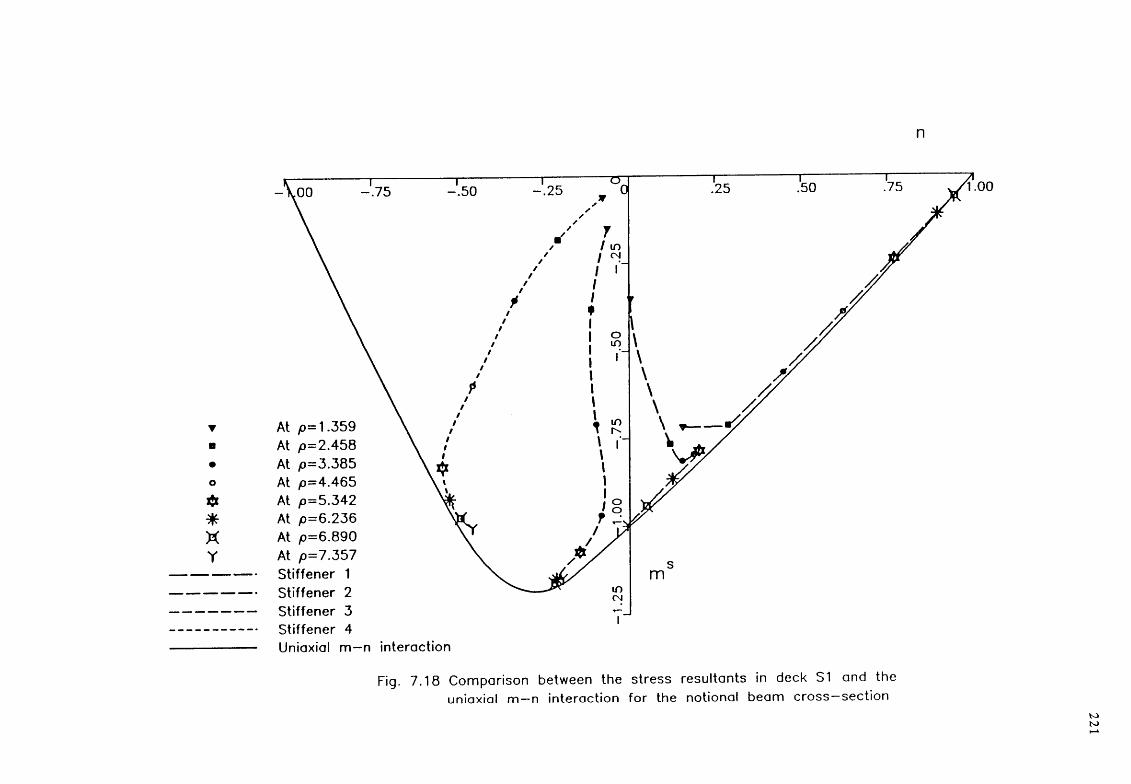


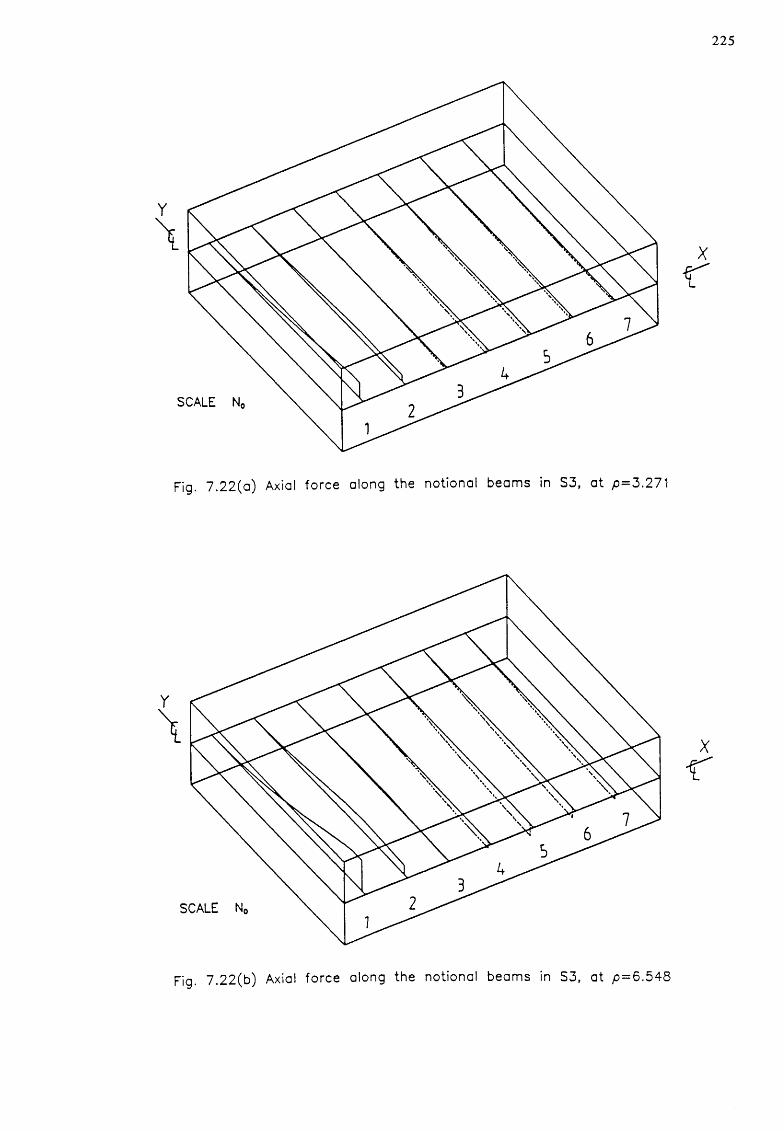

AX
IAL
F
OR
CE
,
226
o
Fig. 7 .2 3 Axial fo rce in s tiffen er 1 with increasing deflection
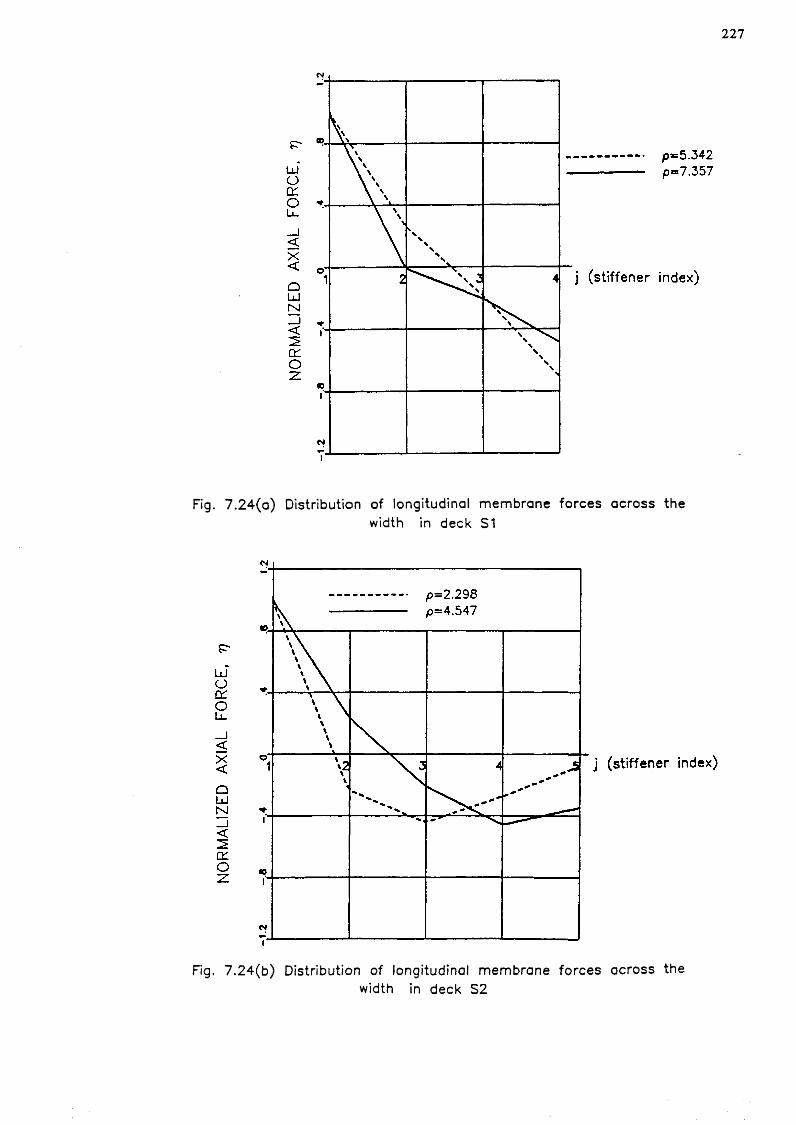
227
Fig. 7 .2 4 (a ) D istribution of longitudinal m em b ran e fo rces across thewidth in deck S1
Fig. 7 .2 4 (b ) D istribution of longitudinal m em b ran e fo rces across thewidth in deck S2

NORM
ALIZ
ED A
XIAL
FO
RCE,
i)
NORM
ALIZ
ED A
XIAL
FO
RCE,
228
Fig. 7.24(c) Distribution of longitudinal membrane forces across thewidth in deck S3
(stiffener index)
Fig. 7.25 Distribution of longitudinal membrane forces across thewidth in deck S3

h7.5b
Fig. 7.26 Deck S3 under in—plane bending loading analysed as a deep cantilevered beam

230
CHAPTER EIGHT
ANALYTICAL M O D E L F O R UNRESTRAINED STIFFENED DECKS
8.1 INTRODUCTION
The behaviour of a single-bay longitudinally stiffened deck under lateral patch
loading was studied in the previous chapter. An analytical model for this type of
deck is proposed in this chapter.
The mathematical formulation is followed by a study of the model sensitivity to
some of its parameters. As a result of this study, the parameters necessary for a
successful prediction for other geometries are identified. In addition, a simplified
version of the model similar to the one presented in Section 6.3 is proposed and
its results are compared with numerical data obtained in the previous chapter. The
closing section of the chapter is concerned with a discussion on the permissible
strains which limit the mechanism analyses presented in this thesis.
8.2 PROPOSED M O D E L
A model of the unrestrained simply supported bay comprises a plate strip running
in the transverse direction and supported by springs which represent simply
supported beams, as illustrated in Fig. 8.1. The strip is required to transfer
loading transversely and can be considered as a membrane strip, anchored at the
outer panels. Each beam comprises a stiffener and its associated effective plate,
and forms a plastic mechanism under coexisting bending moment and axial force
(at the central hinge). The stress resultants at such a hinge follow the uniaxial
yield surface, discussed in Sections 7.2.4.7 and 7.3.2.5.
The principal phenomenon during the first phase of deck response discussed in the
previous chapter, is the sequential failure of stiffeners across the width. During
mode j only stiffeners with indices less than or equal to j experience deflection
increments.

231
8.3 D E V E L O P M E N T O F ANALYTICAL M O D E L
8.3.1 Assumptions
The following assumptions were utilized in formulating the problem:
1) The analysis is based on a rigid-plastic material law.2) The stiffener spacing, b, is uniform.3) The plate strip that transfers load to the stiffeners is assumed to follow the
membrane solution and has a width of 2/3 2b and a thickness of t.4) Under the action of the external loading, P, of patch width 2/S,b, applied at
the centre of stiffener 1, the stiffeners collapse successively across the width.5) The distribution of axial forces in the stiffeners across the width is assumed
to be known.6) The only interaction between adjacent stiffeners is through the membrane
plate strip.7) From the two phases identified in Section 7.3.2.6, only the first phase is
considered in this model.
8.3.2 Equilibrium equations
8.3.2.1 Equilibrium of the loaded stiffener
Stiffener 1 is shown in Fig. 8.2(a) under the action of the applied patch loadingand the vertical reaction of the transverse membrane plate strip. Consideration ofequilibrium with respect to the line of support at the end of the bay gives:
0 bP (L -
2 2
2+
bt a * 0 b (L - — ) +
2 2
MS + (X-l)Mh + 5 N - 0 (8.1)

232
The limit load for a 'notional beam' under a centrally applied patch load of total width 2 31 b, obtained by the application of virtual work, is:
2 X MoP ----------- (8.2)
° L - 0 tb/2
Assuming that the stress in the transverse strip, a*, equals the yield stress, <Ty, and that the interaction formula between the stress resultants is given by Eqn. (4.3), equations (8.1) and (8.2) lead to
5 5 AL ~ 5- p + - D ( — ------ - ) + — ( C n + C n + C L n )
xl 3 L L Z 21 ’ 31 ’ 41 L 10 (8.3)
where the coefficient D 3 is given by:
e 2 b(3 t L ( L ----— )3 2
D 3 ZP
Equation (8.3) is similar to Eqn. (6.3(a)) derived for the restrained bay, differing only to the latter by the coefficient D 3. Both coefficients D and D 3 reflect the pattern of plate strip reaction along the stiffeners, corresponding to triangular and central patch patterns respectively.
8.3.2.2 Equilibrium of a stiffener away from the load
Figure 8.2 illustrates any stiffener not directly subjected to externally applied loading, (that is j*l), but acted upon by the loads transferred by the transverse membrane strip. Consideration of equilibrium with respect to the line of the supports of the beams will lead to:
5 . 1 - 2 5 . + 5 . , 1 /3 bJ - l J J + l 2------------------------------------ t <j 1 0 b ( L ------------ ) - MS - ( X - l ) M . - 5 . N . - 0b 2 j J J J
Using the coefficient D 3, the interaction formula between the stress resultants at a plastic hinge as expressed by Eqn. (4.3) and the assumption that the membrane stress in the plate strip is at yield, the above equation can be rewritten as:

233
3- D5
J+lL
AL 2 8 *+ — (C .n. + C .n. + C . + -J-n.) - 0 , for \> 2 (8.4)z 2 *J J 3J J 4J L JP
Equations (8.4) and (6.3(b)) are similar differing only in the definition of the coefficients D and D 3.
8.3.2.3 Last stiffener in the model
In a deck with bay aspect ratio less or equal to one Q. is the outer stiffener, while in a wide deck (aspect ratio greater than one) Q is the outermost stiffener contained in a square plan. An additional term can be assumed contributing to the strength of the outer stiffener in the series. This additional strength stems from the transverse action in the plate. It is assumed that the variation of the transverse bending across the outermost panel, assumed in the model, equals its plastic value. This transverse membrane action applies an upward transverse shear along stiffener G, having magnitude equal to:
2t a____y4 b
per unit length of the stiffener. Equilibrium of moments with respect to the transverse line of support results in:
se-i ‘ s e P bt a b(L - •) - M" - (X-l)Mfi -
---- y ----0 (8.5)4 b 2
Introducing the coefficient
D -4 8 b A

and following the sam e procedure as in deriving Eqn. (8 .4 ), Eqn. (8 .5 ) becom es:
52-1 5Q. ALD
3+ (8 .6 )
L L ZP
Inclusion of the term D 4 in Eqn. (8.6) with its full value may violate yield in
some cases. This is because the panel to which this transverse bending distribution
is applied, is also under longitudinal compression. Under such circumstances, it
becomes more appropriate to reduce the contribution of the term D 4 by a certain
percentage, in order for yield not to be violated anywhere in the outmost panel
assumed in the model.
8.3.2.4 Solution of the governing equations
Equation (8.3), along with (j-1) equations similar to (8.4) form a system of j
simultaneous equations. There are j+1 unknowns (that is, the j stiffener deflections
and the load factor p) and a solution can be obtained by increasing the value of
one of them in steps. Increasing the value of 51 enables the calculation of the
remaining unknown quantities during mode j.
At first, a mode is assumed, starting with mode 1. The value of 5 1 is increased,
and a solution for the j unknowns considered in mode j is obtained. The solution
arrived at is checked for mode violation. Considering the equilibrium equation for
stiffener j+1 , as given by Eqn. (8.4), the mode is not violated provided the left
hand side of Eqn. (8.4) is non-negative. If the currently assumed mode j is
violated, it is updated to mode j+1, and the above process is repeated. This
solution strategy can be applied until collapse is attained of the outermost stiffener
assumed in the model. In narrow decks, this marks the end of the first phase.
The resulting simultaneous equations can be solved using any of the available
techniques. Reduction of the equations through Gauss elimination is probably the
most appropriate technique, and was the approach used.
8.3.3 Prediction of forces in the beams
The force in the loaded stiffener (j=l) was found to vary with deflection following
the piecewise linear curve, shown in Fig. 7.23. This relationship is used in

235
association with different patterns of axial force distribution across the width, as
those shown in Figs 7.24 and 7.25, to define the actual forces in the stiffeners.
The axial force nj in stiffener j is obtained as:
n . - n 17.J 1 J
Here 17j is the value of the axial force in stiffener j normalized with respect to
the axial force in stiffener 1. Values for the tjj should be taken from the analyses
undertaken in Chapter 7, as discussed further in Section 8.5.
8.4 COMPARISON O F T H E ANALYSIS WITH NUMERICAL RESULTS
In this section, the predictions of the proposed analytical model are compared with
the numerical analyses and test results presented in Chapter 7. The sensitivity of
the model to the various parameters involved is also investigated.
8.4.1 Load versus deflection of the loaded stiffener
8.4.1.1 The influence of plate effective width
The load histories of the loaded stiffeners in decks SI, S2 and S3 are compared
and the sensitivity of the predictions to the assumed value for the effective width
of the transverse membrane strip is examined. Five values of /32 were chosen for
the comparison, corresponding to effective width values in the range from b to
3b. The distributions of membrane force across the width are those given by
continuous lines in Figs 7.24(a), 7.24(b) and 7.24(c) for decks SI, S2 and S3
respectively.
Figure 8.3 shows the predictions of the analytical model for deck SI. An increase
in the value of /32 gives a stiffer response, but also reduces the maximum
deflection at the end of the first phase considered here. This is because higher /32 values facilitate the rapid spread of the loading across the width. Comparison of
the predictions with the numerical results shows that a value of {32 between 1 and
1.25 is the most appropriate. It is remarkable how similar in shape the finite
element prediction and the curve corresponding to (32=1.25 are. The deflection
predicted by the model, which is based on a rigid-plastic material law, should
always be less than the deflection obtained by elasto-plastic finite element analysis.

236
Referring to Fig. 8.3, it can be seen that the numerically predicted curve can be
divided into two parts. The first part corresponds to the first phase, while the
change into the second phase occurs at a deflection of 5 , /IX ). 05. It is reiterated
that the scope of analytical predictions is limited to the first phase. The second
phase is, however, important for narrow decks only, having few stiffeners across
the width.
In Fig. 8.4, comparison of analytical, numerical and experimental results for deck
S2 is made. The analytical predictions in Fig. 8.4 indicate a softer response
throughout the 0 2 range, when compared with the finite element and test results.
This is because of the presence of the cross-girder in both the test and the
numerical model, which applies a significant hogging moment at the supports of
the stiffener 1 (as shown in Figs 7.11). Therefore, direct comparison is not strictly
possible. Alternatively, two curves for each /32 value, could have been presented.
The first would assume pin supports, which is in fact the assumption made for the
curves in Fig. 8.4, whilst the other would consider rotationally fixed supports.
Both numerical and test results would lie between the two predictions. The range
of the elasto-plastic model proposed by Cox (1953) is also shown in Fig. 8.4. As
can be seen, the model proposed in this thesis is valid over a much wider range
of deflections.
Finally, comparison between the model and the numerical results for deck S3 is
made in Fig. 8.5. The finite element analysis, labelled as S3, did not continue
into the very large deflection range and therefore the prediction presented is only
part of the full response.
From all three comparisons, presented in this section, it is evident that /S2 is a
very important parameter affecting the results of the proposed model. Cox (1953)
proposed a value of /32-.50, which seems rather low in the light of the numerical
analyses. Dowling (1968) suggests a value for /32 between 1.0 and 1.5. A value of
(32-1.0 is advocated as a starting value.
8.4.1.2 The influence of the assumed membrane force distribution
Various distributions of the membrane forces across the width of the deck were
presented in Chapter 7 for deck S3. The sensitivity of the model to those
distributions is investigated next.

237
Figure 8.6 presents the behaviour predicted by the model for /32=1.0, based on
the four distributions of the membrane forces across the width of the deck, shown
in Figs 7.24(c) and 7.25. The model seems rather insensitive to these distributions.
This opposes the argument, made in the previous chapter, that accurate
representation of the distribution of the membrane forces is central to a successful
prediction of the deck behaviour. However it should be noted that all the
distributions assume the same axial force history in the loaded stiffener. As the
actual distribution across the width is not very important, it is recommended that
the simplest method, that is the 'in-plane' prediction, should be used to obtain
the coefficients for other deck aspect ratios.
8.4.2 Relative stiffener deflections
The deflections of adjacent stiffeners are given in Figs 8.7 to 8.10. This
comparison helps in understanding the growth of stiffener central deflections across
the width.
The first two figures correspond to deck geometry SI. Figure 8.7 illustrates the
deflection of stiffener 2 relative to that for stiffener 1. Three model predictions
corresponding to values for /32 of 0.75, 1 and 1.25 are given. Comparison with
the finite element results shows agreement with slopes of 1:2 and 2:3, indicating
pivoting of the two stiffeners with respect to stiffeners 3 and 4 respectively. It is
also shown, from the numerical results, that the second phase results in both
stiffeners increasing their deflections equally.
Figure 8.8 shows the deflections for stiffeners 2 and 3 for the same three |S2
values. The slope of 1:2 is achieved during mode 3, while both stiffeners pivot
with respect to stiffener 4.
Similar comparisons are made in Figs 8.9 and 8.10 for the geometry of deck S3.
Four values of 0 2 are used and, in this case, /32=1.50 seems the most
appropriate. The higher value for the plate effective width in S3 compared to SI
has been also observed in Chapter 7. It can be argued that the higher the value
of (32f the more rapid the outward spreading of the load, and consequently, the
first phase ends at lower deflections.
The distributions of the membrane forces across the width, used in Figs 8.7 to
8.10, were identical with those used for obtaining the load histories in Figs 8.3
and 8.5, for decks SI and S3 respectively.

238
8.5 REMARKS ON THE RANGE OF APPLICABILITY OF THE PROPOSED
MODEL
For the prediction of the behaviour of a deck with a geometry differing from
those studied, the distribution of the axial forces across the width is needed. These
forces can be obtained using the axial force history for the loaded stiffener and
the normalized axial force values, tjj, for the other stiffeners.
Following the discussion in Section 8.4.1.2, it can be argued that the actual rjj
values are not crucial. Therefore, values from Figs 7.27(a), 7.27(b) and 7.27(c)
can be used for decks with aspect ratios less than one, one and greater than one,
respectively.
To determine how the axial force develops in the loaded stiffener under increasing
central deflection, a parametric study needs to be undertaken. Two parameters
should be varied. One is the panel slenderness and the other is the panel aspect
ratio. The stiffener size and the bay aspect ratio should be invariant. It is not
necessary for this parametric study to be very detailed as the proposed analysis is
approximate. Three values for each of the parameters involved in the study are
deemed to be sufficient to cover the range of values for these parameters met in
practice. Having this information, the behaviour of any geometry can be predicted.
There is an additional restriction for decks with aspect ratios greater than one
(wide decks). Figure 8.11 shows the stress blocks of the in-plane forces on the
quarter deck considered. A maximum value of
4
for the in-plane moment acting at the narrow side of the deck can be assumed.
A reduction must be imposed to the allowable in-plane moment if the plate
slenderness is such that the compression on the narrow side cannot reach this
value.

239
8.6 DEVELOPMENT OF A SIMPLIFIED ANALYTICAL MODEL
The preceding analysis requires knowledge of the axial force growth in the loaded
stiffener with increasing deflection. As explained in Section 8.5 information about
the axial forces in the beams can be obtained through a parametric study.
However, it is of interest to investigate the predictions obtained from the
preceding analysis assuming that the axial forces in the beams may be ignored. A
similar simplification has also been proposed for the restrained bay in Section 6.3.
8.6.1 Modification of the preceding analysis
In the following analysis the assumptions listed in Section 8.3.1 are still valid.
However, since the axial forces in the stiffeners are assumed to be zero,
assumption 5 is no longer relevant. The equilibrium equations developed in
Sections 8.3.2.1, 8.3.2.2 and 8.3.2.3 are still valid and can be further simplified as
follows:
Equation (8.3), which is for the loaded stiffener (j=l), becomes:
1 5 6- P + - D ( - 1 - _£) + 1 - 0 (8 .7 )
X 3 L L
Equation (8.4), which is for a stiffener remote from the applied load, is simplified
to:
- D3
+ X - 0 (8 .8 )
Equation (8.6), which is for the outmost stiffener Q. involved in the model, can be
written as:
- D3
A L+ X + —
ZP
D - 0 (8 .9 )
The above equilibrium equations can be solved in a simpler way than that
described in Section 8.3.2.4. This simplified approach has been described in
Section 6.3 for the restrained deck.

240
Use of the technique described in Section 6.3, requires estimation of the critical deflection, 5jcr, experienced by stiffener j, which has formed a mechanism, necessary to cause the formation of a plastic mechanism in stiffener j+1. The critical deflection can be obtained from Eqn. (6.7) after replacing coefficient
Djj+ i by D a-
Alternatively the critical deflection can be obtained from the simplified Eqn. (8.8), written for stiffener j+1. If the deck is further assumed to be flat, without initial geometric imperfections, Eqn. (8.8) results in:
L D3
The increment in deflection 5jcr is experienced by stiffener j between the
formation of mechanisms in stiffeners j and j+1. When the latter stiffener has just formed a mechanism, the total load carried by the deck is (j+l)P0. During mode j, characterized by incremental deflections in j stiffeners only, the increments in the deflections of stiffeners 1 to j lie on a straight line pivoting with respect to stiffener j+1. This results in total incremental deflections during mode j, of j 5jcr in stiffener 1, (j—1 )5jcr in stiffener 2, (j—2)5jcr in stiffener 3, etc.
8.6.2 Discussion of the results
Results obtained by the use of the simplified analysis are compared with numerical and previous analytical results. For this comparison, only two values for the effective width of the transverse membrane forces, |32, are considered. Figures 8.12, 8.13 and 8.14 illustrate the comparison for the deck geometries SI, S2 and S3 respectively. The maximum load which is predicted by the simplified analysis is equal to the sum of the limit loads of the stiffeners involved in the model. Initially, the simplified analysis overestimates slightly the strength. This is more evident in Fig. 8.13. The overestimation occurs as the assumed axial force in the loaded beam, N 1t reduces the sagging moment, more than the momentexpressed by the term N l 5 1 enhances the strength, in Eqn. (8.1). The reduction in the sagging moment can be seen from Figs 7.13 and 7.18. As deflection increases further, the contribution of term N 15, to the equilibrium equation (8.1) overcomes the reduction in the sagging moment, M^. Therefore, the analysis of Section 8.3 predicts higher strength than its simplified version.

241
The simplified analysis can be used to obtain a conservative estimation of the load-deflection behaviour for the unrestrained bay compared with the behaviour predicted by the analysis of Section 8.3. It is also more attractive to the latter since knowledge of the axial forces in the beams are not needed.
8.7 LIMITATIONS DUE TO ALLOWABLE STRAINS
A further limitation to the analyses presented in this thesis based on a mechanism
approach is the magnitude of allowable strains. From the analyses presented, it can be concluded that stiffened plates under lateral patch loading exhibit a stable load path even at very large deflections. This could happen in a real structure, provided that the deck plate does not fail in the compressive zones and the rupture strain is not exceeded. In the following a brief discussion of the latter is
presented.
It is first assumed that the maximum strain can be achieved under ideal conditions. A flawless steel coupon in a tensile test ruptures at strains of 0.2~0.3. This strain is gauge length dependent, as McDermott et al (1974) remark. They suggest a local strain of 0.49 at rupture. This is corroborated by test results, undertaken by Ronalds (1985, 1990), showing rupture strains of the order of 0.80 for welded specimens. Therefore, it can be argued that under ideal conditions very large rupture strains can be achieved and that the rupture strain obtained from a tensile test is a minimum value.
On the other hand, defects in the weld metal, low ambient temperatures and high rates of strains can severely curtail the aforementioned ductilities, as Valsgdrd & Pettersen (1982) and Jones (1984) state. It is important to examine the significance of the above three factors in relation to the mechanism analysis.
Defects in the weld metal can cause premature fracture. As nothing is flawless, a crack of a given size may be assumed. The methods of Fracture Mechanics can be employed to indicate whether a crack is critical. If the flaw is of considerable size the member could fracture before developing a mechanism. In a welded structure, therefore, it is more important to determine whether a mechanism will develop in a member, rather than whether the member would fracture after a mechanism has developed.
The significance of fracture in a member depends on redundancy and reliability considerations. In a system with members assembled in series, failure of one of
242
the members causes global collapse. Parallel systems will benefit from redundancy
so that fracture in some of the members that make up an assembly, allows the remaining members to develop mechanisms. It can be concluded, therefore, that for structures made up by welding, the number of members which develop mechanisms is influenced by Fracture Mechanics considerations.
Low temperatures can alter the energy absorbed during rupture, so that steels which are ductile at 'normal' room temperatures can become brittle at 'low' temperatures. It is part of the designer's task to select an appropriate high toughness steel which performs in a sufficiently ductile energy-absorbing manner. This was achieved, in the past, by specification of the amount of energy stored at a given temperature during a Charpy-V test, and more recently by specification of
the fracture toughness.
Steel and titanium are notorious for their strain rate sensitivity. High rate of strain causes increase of the yield stress to its dynamic value with simultaneous reduction in ductility. Although effort has been expended in mathematically quantifying the dynamic yield stress as a function of the applied rate of strain (Symond (1965)), there is no equivalent analysis for the strains causing rupture. This may indicate that the reduction in the strain causing rupture is balanced by an increase in the yield stress and thus, the energy absorbed is not significantly different.
It can be argued that in the absence of a flaw of considerable size in a welded structure, the task of the designer is to ensure rupture strains of the order of those obtained from a tensile test.
8.8 CONCLUSIONS
A model for the prediction of the large deflection behaviour of simply supported stiffened decks which are free to pull-in under centrally applied patch loading has been presented. This model was analytically developed including the axial forces in the longitudinal stiffeners. Comparison of the predictions with numerical and experimental results showed a fair agreement. It showed also that the assumed value for the effective width of the transverse tensile forces in the plate affects significantly the results. On the other hand, the distribution of axial force in the stiffeners is not very important for the model. However, the relationship between the axial force and the deflection in the loaded stiffener is needed for use in the analysis of Section 8.3. This relationship can be obtained by a limited parametric study where the panel slenderness and aspect ratio are varied over the range of

243
practical importance.
A simplified version of the analytical model has also been presented. This analysis assumed no axial forces in the longitudinal stiffeners and gave slightlyunconservative results initially. At higher loads conservative results were obtained compared with the results of the more detailed analysis. It is a very simple analysis and enables the load-deflection for the loaded stiffener to be predicted. Either analysis can be used up to a load level at which strains would limit the development of the assumed mechanisms.
Rupture strain values, obtained from tests on steel coupons, can be used to estimate limiting maximum strains developed in a mechanism analysis. Provided the rupture strains are known, the designer can ensure the development of the mechanism.

244
*oxz«00.CN
I1'AiIVTir
oi_T>Oo0)-OVTDOETJ0)MoQ.
O00Oi

245
Fig. 8 .2 (a ) Forces acting on s tiffen er 1
Fig. 8 .2 (b ) Forces acting on s tiffen ers o th er than 1

CNI
o m
o
lo
o
in n
o
oj m
d
‘av
oi
Fig . 8 . 3 L o a d v s . d e f l e c t i o n f o r s t i f f e n e r 1, d e c k S I

247
■'t
OoUJ_ILl.LJO
s
Fig . 8 . 4 L o a d v s . d e f l e c t i o n f o r s t i f f e n e r 1, d e c k S 2

248
•<d"
\\\\\\\\\\\\\\
\
----------------- - FINA5 (S3)------------------ ANALYSIS (@2=0-50)----------------- ANALYSIS (02=0.75)------------------ANALYSIS (02=1.OO)------------------ ANALYSIS (0,= 1.25)------------------ ANALYSIS (02=1.50)
\\\
x
\\
\\\
V N
WW\\\
\.
\V\>\\\
x\ \
\\
\>\VW
\\ XV$\\'^\V
\
\N^
\
‘Zi
01 %
^
>
T
0
°
o' ‘a
ve
rt
of-OUJ_l1_L_
UJ
Q
F ig . 8 . 5 L o a d v s . d e f l e c t i o n f o r s t i f f e n e r 1 , d e c k S 3
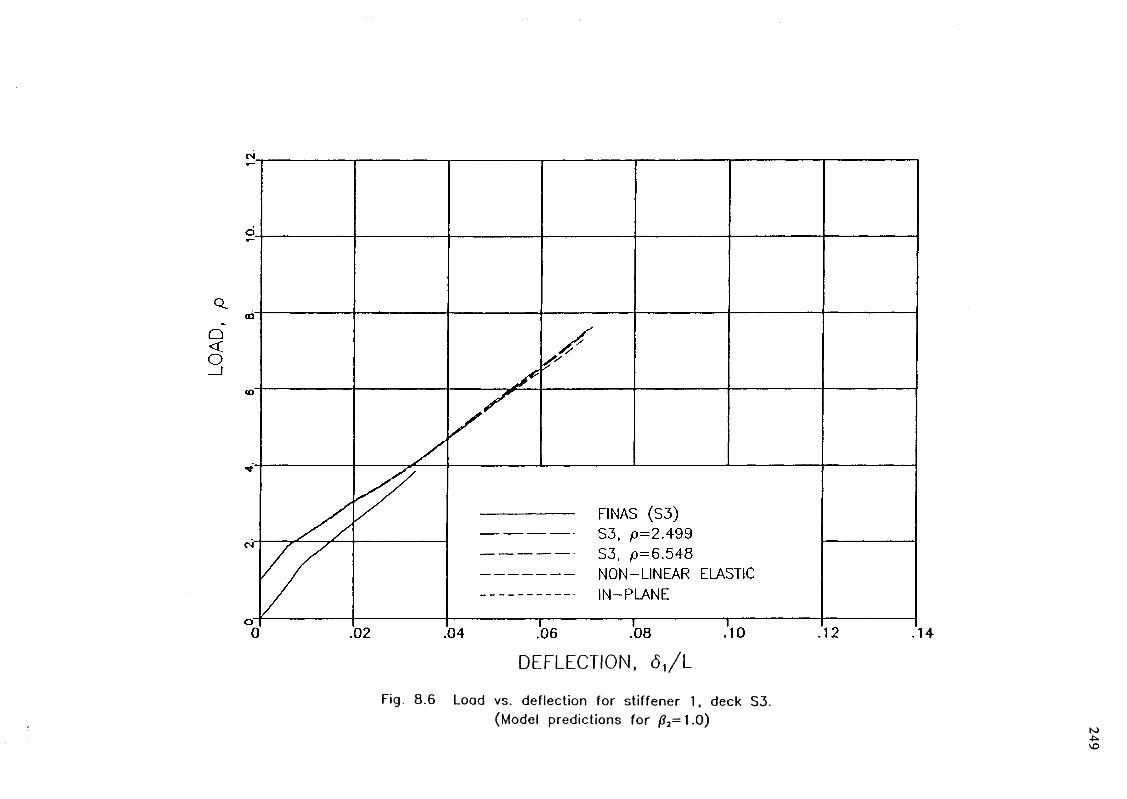
249
<0OI—oUJ
_lL
uL
dQ
Fig . 8 . 6 L o a d v s . d e f l e c t i o n f o r s t i f f e n e r 1, d e c k S 3 .
( M o d e l p r e d i c t i o n s f o r /J2= 1 . 0 )

250
\\\o
\s\\\\\\\\
--------------- PINAS (SI)o ANALYSIS (/?,=0.75) ■ ANALYSIS (0,= 1.00) ▼ ANALYSIS (/?,= 1.25)
60 80' Z0' 90 i i i __l__________l
\\\\\\\\\\\\\\\\\\\\\\NN\\\\\\N
o0000\\\.r\\ \
o \
--3 0
SO L_________________1
\ BO
v ■ o
\ ■ o
' ■ 0
' ■ 0
\
■ o\
M\
M
.00
1 1 04'
►\\\\N> • 'o
M o M
O M
O Ml O Ml 0 pm oM
0V
M 0
1---------------103
' 'pm o \ >m o\ >mo \ pm o \
HI =\
m o
\ M
3 \
M3
ZO1-----------------1
' MC
m-
\
-
I' 1 0 1
\ *
\
■
V ■
\ 1
\\\\ c9►T Oo
r
90
' 9
0'
f O
' Z
O'
0
\ooLd_JLi_LdQ
“l/39
'N0
I10
31
J3Q
Fig. 8 . 7 C e n t r a l d e f l e c t i o n in s t i f f e n e r 2 p l o t t e d a g a i n s t
c e n t r a l d e f l e c t i o n in s t i f f e n e r 1, d e c k S1

251
O)
D E F L E C T IO N , <52/ L
Fig . 8 . 8 C e n t r a l d e f l e c t i o n in s t i f f e n e r 3 p l o t t e d a g a i n s t
c e n t r a l d e f l e c t i o n in s t i f f e n e r 2 , d e c k S1

252
o
toOI—
CJ LUU
JQ
i/
zs> ‘
90
‘
N0
I10
31
33
Q
10‘
F ig . 8 . 9 C e n t r a l d e f l e c t i o n in s t i f f e n e r 2 p l o t t e d a g a i n s t
c e n t r a l d e f l e c t i o n in s t i f f e n e r 1 , d e c k S 3

253
CD
O
1—
oLJ
_J
Li_L
lJO
l/
c9
‘NO
I10
31
J3Q
F ig . 8 . 1 0 C e n t r a l d e f l e c t i o n in s t i f f e n e r 3 p l o t t e d a g a i n s t
c e n t r a l d e f l e c t i o n in s t i f f e n e r 2 , d e c k S 3
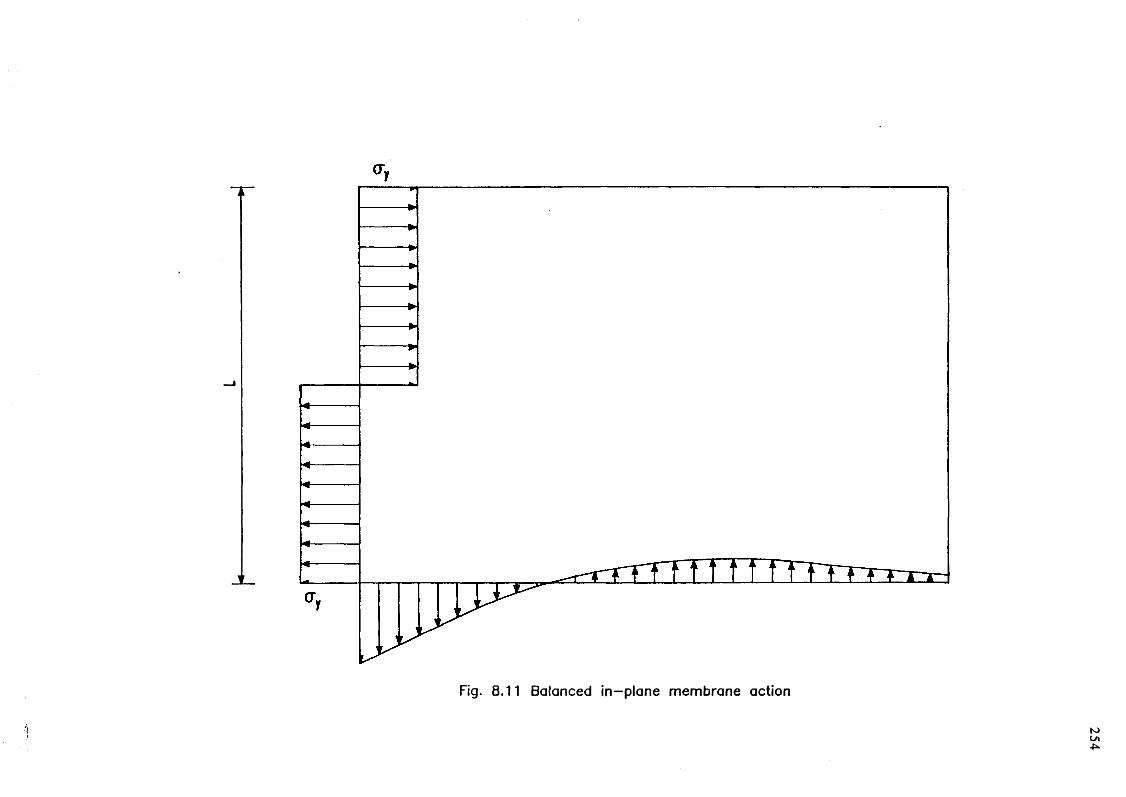
254
1**1
1
F ig . 8 . 1 1 B a l a n c e d i n - p l a n e m e m b r a n e a c t i o n

255
oI—(_)Ld_
IL±_LUQ
d
‘av
on
Fig. 8 .1 2 Load vs. d e flec tio n fo r s tif fe n e r 1, deck S1

256
OI—oUJ_j
Ll.
LJO
a
‘av
oi
Fig. 8 .1 3 Load vs. d eflec tio n fo r s tiffe n e r 1, deck S2

257
<oO1—
O
LULUQ
o' ‘a
vo
n
Fig. 8 .1 4 Load vs. d eflec tio n fo r s tiffe n e r 1, deck S3

258
CHAPTER NINE
CONCLUSIONS A N D R E C O M M E N D A T I O N S F O R F U T U R E W O R K
9.1 G E N E R A L CONCLUSIONS
The large deflection behaviour of a single-bay longitudinally stiffened deck under
lateral patch loading has been studied. This single bay is either the only element
of the deck under consideration, or may be part of a multi-bay assembly. In
general, the restraint conditions at the boundaries of any bay will lie between the
cases of clamped boundaries restrained against pull-in and simply supported
boundaries free to draw-in. Simplified models for both cases have been proposed.
9.1.1 Fully restrained bay
In a restrained bay, the deck plate follows closely the membrane solution after a
deformation in excess of two to three times the plate thickness has been reached.
This can be exploited to devise a simplified model based on the stiffeners acting
as a series of beams interacting via the deck plate which follows the membrane
solution. If the stiffeners can be assumed to form bilinear mechanisms, that is the
deformed shape of a beam varies linearly between the support and the central
hinges, the load applied by the deck plate on the stiffeners is related to the
differential deflection between adjacent stiffeners with an approximately linear
relationship and has a triangular distribution along the deck. Two models of axially
restrained beams were evolved which were subsequently used to predict the
response of the entire bay. One was a beam on elastic foundation under centrally
applied patch loading, and the other was a beam under triangularly distributed
loading.

259
9.1.1.1 Axially restrained beams on an elastic foundation
The behaviour of axially restrained beams on elastic foundation was studied using
the finite element method and was compared with the proposed model based on a
bilinear mechanism. It has been shown that this model gives good predictions
provided that a limitation is set to the maximum deflections allowed. For the
geometries considered, limiting the central deflection to 5 % of the span limits the
error made in estimating the strength within the 10% of the numerical prediction.
In order to expand the scope of this model a modified version is proposed to
cope with phenomena occurring at higher deflections.
9.1.1.2 Restrained beams under triangular loading
The problem was set more generally in an attempt to devise an analytical model
for beams under various patterns of symmetric distributed loading. This has led to
an expansion of Haythomthwaite's method for the case of uniformly distributed
loading. After developing an analytical solution based on a detailed deformation
mode, a bilinear mechanism model was compared as a simplified alternative. It
has been shown that the latter is a good approximation for central deflections up
to 8% of the span.
9.1.1.3 Bay model
Using the beam models summarized above, an analytical model for the entire deck
was developed consisting of a series of struts and plate strips. It was shown that
the results of the proposed model for the large deflection behaviour of the
stiffened bay compare favourably with results obtained by the finite element
analysis. Two simplified versions of analysis were also proposed and can be used
when accuracy is not of primary importance.
9.1.2 Unrestrained bay
An experimental model of a simply supported single-bay deck tested to collapse
was used to validate the finite element program FIN AS. Subsequently, the program
was used to produce further numerical data on other deck geometries. The
behaviour of these decks was studied up to very large deflections and it was found
that the distribution of membrane forces in the deck is central to the formulation

260
of a suitable analytical model.
Study of decks with identical panel parameters but different bay aspect ratios,
shows that the relationship between the axial force in the loaded stiffener and its
central deflection is independent of bay aspect ratio. This feature was used to
devise a model for these decks. The model, though semi-empirical in the sense
that it requires prior knowledge of the axial force history of the loaded stiffener,
gives a good first estimate of the behaviour of unrestrained decks. A proposed
simplified version of the analysis can be used to provide a quick answer to the
loading history.
9.1.3 Partially restrained bays
The above single-bay models can be used for predicting the load-deflection history
of a multi-bay deck. One aspect that gives additional flexibility to the models is
the treatment of the support moments. It is possible to choose the most
appropriate flexural boundary conditions to obtain reasonable lower- and
upper-bounds for bays with intermediate boundary conditions.
9.2 F U T U R E RESEARCH
There is scope for additional development in devising more accurate models for
axially restrained beams on an elastic foundation. In the more general case axially
restrained beams subjected to non-proportional loading need to be analysed.
The treatment of the unrestrained decks presented in this thesis can be further
developed. This is supported by the semi-empirical nature of the proposed model.
In its present form the model needs additional data for bays having different panel
parameters than those studied here. This can be obtained from a numerical
parametric study in which the panel parameters are systematically varied.
Both restrained and unrestrained deck models can be further developed to include
the effect of shearing in the deck plate between stiffeners.
For the unrestrained decks there is need to investigate the effect of the bay aspect
ratio on the second phase of the behaviour, as noticed in the narrow deck
analysed herein.

There is need for further experimental evidence concerning the maximum strains which can be developed and how this information can be used in association with the mechanism analysis.

262
REFERENCES
BACKLUND, J., (1976). 'Large deflection analysis of elasto-plastic beams and frames', Int. J. Mech. Sci., Vol.18, pp.269-277.
BATES, D.N., (1987). The mechanics of thin walled structures with special reference to finite rotations, Ph. D thesis, Univ. of London.
BOOBNOV, I.G., (1902). 'On the stresses in a ship's bottom plating due to water pressure', Trans. RINA, Vol.44, pp.15-52.
BS 5400, (1978). Steel, concrete and composite bridges. Part 2: Specification for loads, British Standards Institution.
BS 5400, (1982). Steel, concrete and composite bridges. Part 3: Code of practice for design of steel bridges, British Standards Institution.
BURGAN, B.A., (1987). Special problems in wide and narrow stiffenedcompression flanges, Ph. D thesis, Univ. of London.
CAMPBELL, T.I. and CHARLTON, T.M., (1973). 'Finite deformation of a fully fixed beam comprised of a non-linear material', Int. J. Mech. Sci., Vol.15, pp.415-428.
CARLSEN, C.A., (1977). 'Simplified collapse analysis of stiffened plates',Norwegian Maritime Research, No. 4, pp.20-36.
CARLSEN, C.A., (1978). 'Collapse analysis of stiffeners subjected to compression and hydrostatic lateral load', Det norske Veritas, Tecnical Report No. 78-549.
CHAN, K.S., LAW, C.L. and SMITH, D.W., (1977). 'Stability of stiffened compression flanges under in-plane forces and wheel loads', Second Int. colloqium on Stability of steel structures, Preliminary report, Liege, 13-15 April.

263
CLARKSON, J., (1956). 'A new approach to the design of plates to withstand lateral pressure', Trans. RINA, Vol.98, pp.443-458.
CLARKSON, J., (1959). 'Tests on flat plated grillages under concentrated loads', Trans. RINA, Vol.101, pp.129-140.
CLARKSON, J., (1963). 'Tests of flat plated grillages under uniform pressure', Trans. RINA, Vol.105, pp.467-480.
COX, H.L., (1953). 'Behaviour of plate-beam construction beyond the elastic range', Univ. of Illinois Civ. Engng Studies, Struct. Res. Series, No.60.
DEAN, J.A., (1975). The collapse behaviour of steel plating subject to complex loading, Ph. D thesis, Univ. of London.
DEAN, J.A. and DOWLING, P.J., (1977). 'Ultimate load tests on three stiffened plates under combined in-plane and lateral loading', in Steel Plated Structures, Dowling, P.J., Harding, J.E. and Frieze, P.A. (eds), Crosby Lockwood Staples, London, pp.743-763.
DOWLING, P.J., (1968). The behaviour of stiffened bridge decks under wheel loading, Ph. D thesis, Univ. of London.
ELNASHAI, A.S., (1984). Nonlinear analysis of composite tubular joints, Ph. D thesis, Univ. of London.
GILL, S.S., (1973). 'Effect of deflection on the plastic collapse of beams with distributed load', Int. J. Mech. Sci., Vol.15, pp.465-471.
GRIGORIAN, M., (1972). 'Plastic design of orthotropic grids with two adjacent edges fixed, free or hinged', J. Strain Anal., Vol.7, No.4, pp.279-284.
GURKOK, A. and HOPKINS, H.G., (1973). 'The effect of geometry changes on the load carrying capacity of beams under transverse load', SIAM J. App. Math., Vol.25, pp.500-521.
CHOWDHURY, M., (1985). 'Plastic collapse theory for rectangular grids', Int. J.Mech. Sci., Vol.27, pp.145-155.

264
HAYTHORNTHWAITE, R.M., (1957). ’Beams with full end fixity', Engineering,
Vol.183, pp.110-112.
HAYTHORNTHWAITE, R.M., (1961). ’Mode change during the plastic collapse of
beams and plates', Developments in Mechanics, Vol.l, pp.203-215.
HETENYI, M., (1946). Beams on elastic foundation, Univ. of Michigan Press.
HEYMAN, J ., (1953). 'The plastic design of grillages', Engineering Vol.176,
pp.804-807.
HILL, R., (1950). The mathematical theory of plasticity, Clarendon Press,
Oxford.
HODGE, P.G., (1974). 'Post-yield behaviour of a beam with partial end fixity',
Int. J . Mech. Sci., Vol.16, pp.385-388.
HOOK, R. and RAWLINGS, B., (1969a). 'An experimental investigation of the
behaviour of clamped, rectangular, mild steel plates subjected to uniform
transverse pressure', Proc. ICE, Vol.42, pp.75-103.
HOOK, R. and RAWLINGS, B., (1969b). 'Investigation into the methods of
predicting post-elastic load-carrying properties of clamped uniformly loaded,
rectangular mild steel plates', Proc. Inst. Civ. Eng., Suppl. Vol.,
pp.281-302.
HOVGAARD, W., (1940). Structural design of ships, US Naval Institute,
Annapolis, Maryland.
INGLIS, C.E., (1925). 'Stresses in rectangular plates clamped at their edges and
loaded with a uniform distributed pressure', Trans. RINA, Vol. 67,
pp.145-165.
JAEGER, L.G., (1958). 'An approximation analysis for plating panels under
uniformly distributed load', Proc. ICE, Vol.10, pp.137-144.
JOHANSEN, K.W., (1962). Yield-line theory, Cement and concrete association
(Translated from the Danish).
265
JONES, N. and WALTERS, N.M., (1971). 'Large deflection of rectangular plates',
J . Ship Res., Vol.15, No.2, pp.164-171.
JONES, N., (1971). 'A theoretical study of the dynamic plastic behaviour of
beams and plates with finite-deflections', Int. J. Solids Structures, Vol.7,
pp.l 007-1029.
JONES, N., (1973). 'Influence of in-plane displacements at the boundaries of
rigid-plastic beams and plates', Int. J . Mech. Sci., Vol.15, pp.547-561.
JONES, N., (1984). 'Structural aspects of ship collisions', in Structural
Crashworthiness, Jones, N. and Wierzbicki, T. (eds), First Int. Symp. on
Structural Crashworthiness, Liverpool, Butterworth & Co Ltd., pp.308-337.
KAMTEKAR, A.G., (1981). 'An approximate analysis of the behaviour of laterally
loaded, fully fixed beams and plates', Int. J. Mech. Sci., Vol.23, No.7,
pp.437-455.
KRISTEK, V., SKALOUD, M. and ZORNEROVA, M., (1982). 'Large deflections
of stiffened compression flanges by folded plate theory', Acta Technica
CSAV, No.4, pp.443-448.
LABIB, F., (1971). Elastic and post-elastic behaviour of a uniformly loaded
clamped strip, Msc. thesis, Univ. of London.
LIU, J . and JONES, N., (1987). 'Experimental investigation of clamped beams
struck transversely by a mass', Int. J . Impact Engng, Vol.6, No.4,
pp.303-335.
LOW, H.Y., (1981). 'Behaviour of rigid-plastic beam loaded to finite deflections
by a rigid circular indenter', Int. J . Mech. Sci., Vol.23, No.7, pp.387-393.
LOW, H.Y., (1982). Some structural aspects of collisions between ships and
offshore concrete platforms, Ph. D thesis, Univ. of Cambridge.
MANOLAKOS, D.E. and MAMALIS, A.G., (1988). 'Limit analysis of laterally
loaded stiffened plates', Int. J . Mech. Sci., Vol.30, No.6, pp.441-447.
MARTIN, J.B ., (1962). 'Large deflection on an encastre rigid-plastic grid', J.
Mech. Engng Sci., Vol.4, No.4, pp.322-333.
266
McDERMOTT, J .F ., KLINE, R.G., JONES, E.L., MANIAR, N.M. and CHIANG,
W.P., (1974). 'Tanker structural analysis for minor collisions', Trans.
SNAME, Vol.82, pp.382-407.
MURRAY, N.W., (1973). 'Buckling of stiffened panels loaded axially and in
bending', The Structural Engineer, Vol.51, No.8, pp.285-301.
ONAT, E.T. and HAYTHORNTHWAITE, R.M., (1956). 'The load-carrying
capacity of circular plates at large deflection', Trans. ASME, J . App.
Mech., Vol.30, pp.49-55.
OSTAPENKO, A. and LEE, T., (1960). 'Tests on longitudinally stiffened plate
panels subjected to lateral and axial loading', Fritz Engng Lab., Rep. No.
248.4, Lehigh University.
PANG, P.L.R. and MILLAR, M.A., (1978). 'Experimental behaviour of a fixed
ended beam under simulated uniformly distributed load', Int. J. Mech. Sci.,
Vol.20, pp.675-683.
PARK, R. and GAMBLE, W.L., (1980). Reinforced concrete slabs, John Wiley
& sons, pp.562-612.
RONALDS, B.F., (1985). Mechanics of dented orthogonally stiffened cylinders,
Ph. D thesis, Univ. of London.
RONALDS, B.F., (1986). 'Finite deformations of stringer stiffened plates and shells
under knife edge loading', Proc. Fifth Int. Symp. Offshore Mechanics &
Arctic Engineering, Tokyo.
RONALDS, B.F., (1990). 'Mode changes in the beam mechanism', (Submitted for
publication)
SAWCZUK, A., (1964). 'On initiation of the membrane action in rigid-plastic
plates', J . de Mechanique, Vol.3, N o.l, pp.15-23.
SCORDELIS, A.C. and MEYER, C., (1969). 'Wheel load distribution in concrete
box girder bridges', Structural Engineering and Structure Mechanics Rep. No.
69-1, Univ. of California, Berkeley.

267
SMITH, C.S., (1975). 'Compression strength of welded steel ship grillages',Trans. RINA, Vol.117, pp.325-347.
SYMONDS, P.S., (1965). 'Viscoplastic behaviour in response of structures to dynamic loading', Behaviour of materials under dynamic loading, ed. N. J. Huffington, ASME, pp.106-124.
TIMOSHENKO, S.P. and WOINOWSKY-KRIEGER, S., (1959). Theory of plates and shells, McGraw-Hill.
TRUEB, U., (1983). Stability problems of elasto-plastic plates and shells by finite elements, Ph. D thesis, Univ. of London.
VALSGARD, S. and PETTERSEN, E., (1982). 'Simplified nonlinear analysis of ship/ship collisions', Norwegian Maritine Research, Vol.10, No., pp.2-17.
WAH, T., (1958). 'Large deflection theory of elasto-plastic plates', Proc. ASME E M Div., Vol.84, Paper 1822.
WEBB, S.E. and DOWLING, P.J., (1980). 'Large-deflection elasto-plasticbehaviour of discretely stiffened plates', Proc. ICE, Part 2, pp.375-401.
YOUNG, A.G., (1959). 'Ship plating loaded beyond the elastic limit', Trans. RINA, Vol.101, pp.143-162.

268
A P P E N D I X A
INTERACTION F O R M U L A E F O R A N ASYMMETRIC I-SECTION
A.1 Introduction
The interaction formulae between the bending and axial stress resultants for a cross-section formed by up to three rectangles under uniaxial stress state are presented here. These formulae have been derived by Ronalds (1985, 1990) and the cross-section assumed is an asymmetric I-section with the notation shown in Fig. 3.1(b).
A.2 Geometric properties for the cross-section
Three expressions for the plastic modulus are derived with respect to the location of the equal area axis. The position of the latter can be determined by the relative size of the panel area, Ap, the web area, A w and the area of the bottom flange, Af.
The axis is in the panel, i f : A > A + A-
2
Z
The axis is in the web, i f : A < A + A„ andp N w f
1 K2
Z pw 4 tw

269
The axis is in the flange, i f : A_ > A + A° f w r
Pf1 A2 1 2 r1 1 1 0 1 1 7 r_ — - -A2 — + -(A + A ) ---------4 o* to r-
€ bJ 2 W P l t bPw f
A.3 Interaction formulae
The interaction between the stress resultants at a plastic hinge i is given as:
Neutral axis locat ion
Axialforce Moment in terac t ion
m1---- ^ [ - g n2+(- l ) i s ( l -g )n+l]Z p p P
Z Z t b p pw w
panel -l«n<KP
web Kp<n<Kj.
flange K ,<n<l ---- £^[-gfn2+(- l ) lh( l - g f )n+l]
ZP
Where Zp is the plastic modulus for the cross-section, i takes the values s and h for sagging and hogging moment respectively and 5js, 5^ are Kronecker deltas (5ss=l, 5hh=l» ^sh^)* The other coefficients involved in the table above are defined as follows:
KP
AP
A - wA
KfA + A p w
A
1 Ag " “
4 b Z
1 A
PP
2
SvT 4 t Z w pw
1 Agf= -
4 br Z p f pf

270
A P P E N D I X B
PREDICTION O F T H E DEFLECTION SHAPE
B.l Introduction
The deflection shape predicted by Eqn. (4.11) is considered here. Its contribution to the equilibrium Eqn. (4.9) is also calculated.
B.2 The deflection profile
The deflection at a distance x from the support is calculated in this section and is denoted by y(x).
1. For 5C/L < b 'Q!L
y(x) x 5------ - - — (B .l)L L L
2. For 5C/L ^ 5 /L,
there is always a curved segment in the range
0 ^ x ^ (1-7)L (B.2)
and a straight segment in the range
(l-Y)L < x ^ L (B.3 )
(i) The deflection of any point x in the range described by Eqn. (B.2) is
y(x)
L
'cx/Lx 5
L L
x-(1 -y)L d5
y L L(B. 4)

271
where 5CX is the central deflection at which the deflection at point x stops increasing, obtained by equating
x
L
with
5 51 - 7 - a (— - —)
x ' L L
(from Eqn. 4.11), which gives:
5 1 X 5cx _ - + -£L a L L1
(B. 5)
7 X in the above expression is the value of y when the deflection at x ceases to increase. Using Eqns (4.11) and (B.4), and performing the integration indicated in the latter, yields:
i • iy(x) x 5 5 5 1 5 5 xc , , cx c. , , , c cxNW1 .----------- + (--------- ) + - ln(l + a (---------)) ( 1 ---)L L L L L a L L L
1
By substituting for 5CX/L form Eqn. (B.5), the following expression is obtained
y(x) x 5 1 1 x x------------ ( _ £ + _ ) + _ (1 ----) ln ( l ---- ) (B.6)L L L a a L Li 1
(ii) The deflection of any point x in the range described by Eqn. (B.3) is given as
y(x) y(x ) (x - x )_________2 + ______y_L L (L - x )
7
5c y(V 'L L
(B.7)
where Xy is the distance from the support corresponding to the current value of y , taken as:

272
- 1 - l - 7 L
x
The value for y(x ) in Eqn. (B.7) is obtained from Eqn. (B.6) for x=x^.
B.3 Modification of the spring force contribution in Eqn. (4.9)
The ratio of the contribution of the actual spring forces in the equilibrium Eqn. (4.9) to the contribution obtained if the bilinear shape is assumed, denoted as Rf, is obtained as:
Rf
Ly(x) k x dx
<r_______ S
- k 5 L2 „ s c
r y(x) x dx QJ L L L
r~5___c3 L
(B. 8)
The numerator on the right hand side of Eqn. (B.8) was calculated numerically using Simpson's rule and the Rf values were implemented in the modified equilibrium Eqn. (4.12).

273
A P P E N D I X C
EXTENSIONS O V E R T H E PLASTIC B E A M S E G M E N T
C.l Introduction
A hinge of finite length may have extensional requirements if curvature changes
take place over its finite length. In this appendix, such requirements are calculated
for a curved beam segment representing a spreading hinge, as shown in Fig.
5.2(a), and an example for the case of triangular loading is given.
C.2 Geometric extensions at spreading plastic hinge tips
The geometric extensions over the curved length caused by an increment in the
maximum ordinate y 0(L) are now considered, Fig. C .l. Within the assumption of
small rotations the inclined length of an element dx in its deformed position is:
Here the slope dy0/dx is limited to a value less than 0.5 to limit the error in the
evaluation of the extension of an element dx at the steepest position x=a to below
6 % . The average error is obviously less than this. The extension over the curved
length between x=a and x=L, due to increase in the depth from 0 to y 0(L), is:
A UJf
ds * (1+ — (— -) )dx 2 dx
1 dy/ o
(C.l)
Differentiation of (C .l) gives:
x=a
It can be seen that if the entire rotation increment takes place over the previously
curved segment

274
d6 - dy0(L) f ' (a)
and combining the last two equations yields:
de— - a y0(L) f ' (a) C5(a) dd
(C. 2)
where
r 2j f ' (x) dxx=a (C .3)
a f ' (a)2
and 6 is the angle of inclination of the straight segment, as shown in Fig. 5.2(a).
Substitution of Eqn. (5.5), ensuring continuity of slope between straight and curved
segments, into Eqn. (C.2) gives:
The equation above gives the extensional requirement of the curved segment
assuming that the entire incremental rotation has occurred over this segment.
However, most of the incremental rotation is accommodated by the spreading of
the curved segment. Therefore, only a fraction of the extensions calculated by
Eqn. (C.4) should be included. The fraction of these extensions can be expressed
as:
de _— - - C (a) 55dd
(C .4)
de _— - = a C (a) 5 d0 2 5
(C .5)
where the reduction factor, a 2 , is discussed in the next section.
C.3 Reduction of the extensions calculated over the curved segment
An important objective of the analysis presented in Section 5.4 is to maintain a
relatively simple solution similar to Haythornthwaite's (1961) and yet determine the
relative importance of the enhancements made later by Gill (1973) and GtlrkO'k &

275
Hopkins (1973). Therefore, simplified assumptions are made about different aspects
of the behaviour. According to Gill's and GUrkOk & Hopkins' analyses the central
hinge travels, but it does not spread until it approaches the third points of the
span for the case of uniform loading. In the present analysis the assumption of a
spreading rather than a travelling hinge is made. If y 0(L) is reducing in
magnitude, as shown in Figs 5.13(a) and 5.13(b), the extensions associated with
the curved segment are not accounted for. This behaviour corresponds to the first
mode in Gill (1973). Once y 0(L) starts to increase in magnitude, these extensions
are incorporated to account for changes in geometry associated with the spreading
of the hinge towards the centre of the beam. This spreading occurs during the
second mode according to Gill (1973) and GUrkOk & Hopkins (1973). However,
incorporation of the total extension implied by increasing values of y 0(L) as
calculated by Eqn. (C.4) corresponds to the case where all the rotational
increment takes place over the previously developed curved length. That is, there
is no spreading of the plastic segment (a=constant) leading to an overstiff solution.
The change in slope along the beam represented by the difference in the rotation
along the beam for successive pairs of deflected shapes, is plotted in Fig. C.2.
The three curves presented were obtained from a finite element analysis of an
encastre beam under uniformly distributed loading with the corresponding p values
indicated. It is shown that the significant change in rotation is due to the
spreading of the plastic hinge. However, this does not account for the total change
in rotation. Some change occurs along the curved segment, with increasing
contribution as the curved segment spreads. When the membrane phase is reached,
the rotational increment is distributed along the length without the localizations
shown in Fig. C.2. At this phase, the cumulative rotational increment for
uniformly distributed loading is given by a straight line with zero value at the
centre of the beam and maximum value at the support. This is because the
mode-shape f(x) corresponding to the uniform loading is a parabola.
For these reasons the parameter a 2= (l-a /a 0), where a 2<l, has been introduced
since it is compatible with the limiting results at the two ends of the spreading
hinge phase. Here a 0 is the length of the straight segment when y 0(L) is
minimum, as shown in Figs 5.13. The important point is that additional extensions
take place over and above those taken into account by F= l, that is, by assuming
that the curved segment has a fixed shape.

276
C.4 Example
For the beam under triangular loading shown in Fig. 5.8 the application of the
principle of virtual work gives
3 X M
that is /i2= 3 in Eqn. (5.1). The free bending moment on a substitute simply
supported beam yields:
M(x) - M (L)[1 .5 (x /L ) - (x /L )3 ] , fo r 0<x<L
and therefore the mode-shape f(x) defined by Eqn. (5.1(a)) is expressed as:
f ( x ) - 1 .5 (x /L ) - 0 .5 (x /L )3
Finally, if the expression for F given by Eqn. (5.8), is used, the required C 5(a)
value is given by:
C5(a)(L -a) - (2 /3 ) (L 3- a 3 ) /L 2 + 0 .2 (L 5- a 5) /L 4
a [ l - ( a / L ) 2 ] 2
The predictions are shown in Figs 5.8 through 5.11.

(%)
<lp
277
Fig. C.1 A ssu m ed sh a p e
o
Fig. C .2 C u m u la tiv e c h a n g e in ro ta tio n a lo n g th e b e a m