UNIVERSITY OF LJUBLJANA FACULTY OF ECONOMICS · 2015. 3. 25. · ii AUTHORSHIP STATEMENT The...
86
UNIVERSITY OF LJUBLJANA FACULTY OF ECONOMICS MASTER'S THESIS JURE OTOREPEC
Transcript of UNIVERSITY OF LJUBLJANA FACULTY OF ECONOMICS · 2015. 3. 25. · ii AUTHORSHIP STATEMENT The...

UNIVERSITY OF LJUBLJANA
FACULTY OF ECONOMICS
MASTER'S THESIS
JURE OTOREPEC

UNIVERSITY OF LJUBLJANA
FACULTY OF ECONOMICS
MASTER'S THESIS
THE IMPACT OF INTERNATIONAL CAPITAL FLOWS ON
MACROECONOMIC INSTABILITY
Ljubljana, September 2014 JURE OTOREPEC
ii
AUTHORSHIP STATEMENT
The undersigned Jure Otorepec, a student at the University of Ljubljana, Faculty of
Economics (hereinafter: FELU), declare that I am the author of the master's thesis entitled
The impact of international capital flows on macroeconomic instability, written under the
supervision of Kostevc Črt, PhD, Associate Professor.
In accordance with the Copyright and Related Rights Act (Official Gazette of the Republic of
Slovenia, Nr. 21/1995 with changes and amendments) I allow the text of my master’s thesis to
be published on the FELU website.
I further declare
the text of my master’s thesis to be based on the results of my own research;
the text of my master’s thesis to be language-edited and technically in adherence with the
FELU’s Technical Guidelines for Written Works which means that I
o cited and / or quoted works and opinions of other authors in my master’s thesis in
accordance with the FELU’s Technical Guidelines for Written Works and
o obtained (and referred to in my master’s thesis) all the necessary permits to use the
works of other authors which are entirely (in written or graphical form) used in my
text;
to be aware of the fact that plagiarism (in written or graphical form) is a criminal offence
and can be prosecuted in accordance with the Copyright and Related Rights Act (Official
Gazette of the Republic of Slovenia, Nr. 55/2008 with changes and amendments);
to be aware of the consequences a proven plagiarism charge based on the submitted
master’s thesis could have for my status at the FELU in accordance with the relevant FELU
Rules on Master’s Thesis.
Ljubljana, August 29th
, 2014 Author’s signature:________________________

i
TABLE OF CONTENTS
INTRODUCTION .................................................................................................................... 1
1 THEORY OF THE LINK BETWEEN MONETARY POLICY AND
INTERNATIONAL CAPITAL FLOWS ............................................................................... 3
1.1 Definitions of Key Terms ................................................................................................. 3
1.2 International Capital Flows and Economic Crises ............................................................ 6
1.3 The Fragmented World Financial System and International Capital Flows ................... 10
1.4 Composition of Capital Inflows ...................................................................................... 13
1.5 The Influence of Exchange Rate Regimes ...................................................................... 16
2 THE RELATIONSHIP BETWEEN INTERNATIONAL CAPITAL FLOWS AND
CREDIT-INDUCED BUSINESS CYCLES ......................................................................... 18
2.1 Key Features and Dynamics of Credit-induced Business Cycles ................................... 18
2.2 Austrian Business Cycle Theory in a Closed Economy ................................................. 20
2.2.1 Introduction .............................................................................................................. 20
2.2.2 The Effects of Credit Expansion on the Structure of Production ............................. 23
3 THE INTERNATIONAL MONETARY TRANSMISSION MECHANISM ................ 27
3.1 Austrian Business Cycle Theory in the Open Economy ................................................. 27
3.2 Convergence through the Interest Rate Channel ............................................................ 29
3.3 Transmission of International Credit Booms through the Interest Rate Channel ........... 30
3.4 Transmission of International Credit Booms through the Foreign Exchange Rate
Channel ................................................................................................................................. 31
4 INTERNATIONAL CAPITAL FLOWS IN PERIODS OF GLOBALIZATION ........ 35
4.1 Empirical Methodology .................................................................................................. 35
4.2 Crises and International Capital Flows in the First Era of Financial Globalization (1880-
1914) ..................................................................................................................................... 36
4.3 Case Study: Argentina (1880-1890) ............................................................................... 37
4.3.1 Historical Context and the Dynamics of Key Indicators .......................................... 37
4.3.2 The Results of Increased Credit and Capital Inflows ............................................... 41
4.4 Financial Crises in the Modern Era of Financial Globalization (1980-today) ................ 42
4.5 Case Study: Central and Eastern Europe (2001-2008) ................................................... 43
4.5.1 Background and the Dynamics of Key Indicators .................................................... 43
4.5.2 The Effects on the Structure of Production .............................................................. 49
CONCLUSION ....................................................................................................................... 52
POVZETEK ............................................................................................................................ 54
REFERENCE LIST ............................................................................................................... 65
ii
LIST OF TABLES
Table 1: Present Value Calculations for Two Time-varying Cash Flows with Two Assumed
Interest Rates ............................................................................................................................ 21
Table 2: Cumulative Gross Capital Flows from Britain to Argentina in Millions of Pound
Sterling, 1880–1890 ................................................................................................................. 37
Table 3: Argentina’s Saving, Investment and the Current Account, 1885-1893 ..................... 41
Table 4: Key Indicators for Central and Eastern European Countries ..................................... 46
Table 5: Comparison of the Austrian Business Cycle Theory in the Open Economy with
Empirical Episodes ................................................................................................................... 51
Tabela 6: Ključni indikatorji za države Centralne in Vzhodne Evrope ................................... 61
LIST OF FIGURES
Figure 1: Simplified Illustration of Capital Flows within the Balance of Payments ................. 4
Figure 2: Macroeconomic Volatility around Sudden Stop Episodes in Emerging Market
Economies (Cross-country Medians of Deviations from Hodrick-Prescott (HP) Trends) ........ 8
Figure 3: Effect of non-sterilized capital flows between two different banking systems ........ 12
Figure 4: The Likelihood of a Crisis is Greater with Capital Inflows in the Form of Debt ..... 13
Figure 5: The Structure of Production with a Value-Dimension (Vertical Axis) and a Value-
Time-Dimension (Horizontal Axis) ......................................................................................... 22
Figure 6: The Framework and the Dynamics Induced by an Increase in Savings ................... 24
Figure 7: Consequences of Credit Expansion on the Structure of Production ......................... 25
Figure 8: Convergence of International Capital Market Interest Rates ................................... 29
Figure 9: Credit Expansion in the Creditor (Center) Economy being Transmitted through
International Capital Flows to Debtor (Periphery) Economy .................................................. 31
Figure 10: Effects of an Expansionary Monetary Shock on Relative Shares of Tradable Goods
and Non-Tradable Goods in the Center Economy and in the Periphery Economy under a
Fixed Exchange Rate ................................................................................................................ 33
Figure 11: Effects of an Expansionary Monetary Shock on Relative Shares of Tradable Goods
and Non-Tradable Goods in the Center Economy and in the Periphery Economy under a
Floating Exchange Rate ........................................................................................................... 34
Figure 12: Dynamics of Argentine Monetary Indicators in the Period 1880-1899 ................. 38
Figure 13: Discount Rates for Core Countries (UK, Germany and France) and Sudden Stops
for Emerging Countries 1880-1914 .......................................................................................... 39
Figure 14: Net Capital Inflows in Percent of GDP for Argentina 1880-1914 ......................... 40
Figure 15: Net Capital Flows to Emerging Countries 1880-1914 (Average % of GDP)......... 40
Figure 16: The pre-Baring Crisis Inflation in Argentina .......................................................... 42
Figure 17: GDP per Capita (in Constant PPP 2005 International Dollars) in Central and
Eastern European Countries as a Share of the Average EU-15 GDP per Capita ..................... 44

iii
Figure 18: Net Private Financial Flows in Central and Eastern Europe (% GDP) in the Period
1989-2009 ................................................................................................................................. 44
Figure 19: Money Market Interest Rates in the Euro Area, United States and Japan, 1995-
2008 .......................................................................................................................................... 45
Figure 20: Money market Interest Rates Spread between Euro area and Central and Eastern
European Countries, 1999-2007 ............................................................................................... 45
Figure 21: Investment in Percentage of GDP by Exchange Rate Regime in Central and
Eastern Europe, 2001-2009 ...................................................................................................... 47
Figure 22: Asset Prices in Central and Eastern Europe Compared to other Emerging Markets
.................................................................................................................................................. 48
Figure 23: Stock Market Indices by Exchange Rate Regime in Central and Eastern Europe,
2001-2011 (1/1/2011=100) ...................................................................................................... 48
Figure 24: Unit Labor Costs by Sectors, 1999Q1-2009Q4, 2000Q1=100 ............................... 49
Figure 25: Euro to Czech Koruna, Polish Zloty and Slovakian Koruna for the Period
December 29th
2003 – July 28th
2008 ....................................................................................... 50
Figure 26: Euro to Hungarian Forint and the Romanian Leu for the Period December 29th
2003 – July 28th
2008 ............................................................................................................... 50
Slika 27: Posledice kreditne ekspanzije na strukturo proizvodnje ........................................... 57
Slika 28: Kreditna ekspanzija v središčnem gospodarstvu prenesena prek mednarodnih
kapitalskih tokov v periferno gospodarstvo ............................................................................. 59
Slika 29: Neto zasebni finančni prilivi v centralno in vzhodno evropo (v % BDP), 1989-2009
.................................................................................................................................................. 60
Slika 30: Obrestne mere na denarnem trgu v Evroobmočju, ZDA in na Japonskem, 1995-2008
.................................................................................................................................................. 61
Slika 31: Stroški dela na enoto proizvoda po sektorjih, 1999Q1-2009Q4, 2000Q1=100 ........ 62


1
INTRODUCTION
Academic economists and economic experts in international institutions such as the
International monetary fund (IMF) are engaged in an active discussion on the impact of
capital flows on international economic stability. In the last few years, many economists have
expressed concern that international capital flows (flows of capital between countries) may be
responsible for the occurrence of so called sudden stop crises in emerging market economies.
Sudden stop crises are defined by Calvo et al. (2004) as periods, in which at least one
observation in year-on-year international capital flows lies at least two standard deviations
below its sample mean. Such crises have been a source of major macroeconomic instability in
emerging markets as measured by GDP variation from peak to trough. When capital inflows
into an emerging market rapidly slow down (or reverse) GDP variation can be massive in a
timeframe of just a couple of months.
Such has been the case in Indonesia (December 1997 – December 1998: -17.3% change in
GDP), Thailand (September 1996 – September 1998: -15.1% change in GDP), Morocco
(December 1994 – June 1995: -13.3% change in GDP) and many others which experienced a
double-digit or close to a double-digit decline in GDP in a matter of months (Ortiz, Ottonello,
Sturzenegger, & Talvi, 2009). Probably the most infamous sudden stop crisis involving a
group of emerging market economies1 was the Asian financial crisis of 1997.
More recently, in this millennium, emerging Europe (Central and Eastern European countries)
has experienced a crisis that is very reminiscent of the aforementioned East Asian financial
crisis in the 1990s. Similarly, in the 2000s, Central and East European countries received
massive capital inflows, which resulted in large current account deficits and high growth in
the supply of credit. However, with the advent of the Great Recession in 2008, the massive
capital inflows suddenly subsided, which culminated in major falls in GDP across Central and
Eastern Europe (although some countries fared better than others).
Although sudden stop crises like the ones mentioned are commonly seen as a relatively recent
phenomenon, this may not be the case. We have to remember that international capital flows
had been suppressed through a large part of the 20th
century, most notably in the Bretton
Woods period (1945-1971/73), hence during this period international capital flows were
largely a non-factor in economic affairs. However, as this thesis explores, sudden stops are by
no means limited to the modern period of liberalized international capital flows (1980s-
today). The case of Argentina in the late 1880s and early 1890s shows that these kinds of
crisis are by no means a new phenomenon.
Regardless of the period, however, what are now called sudden stop crises are seen to occur,
mostly due to the observation that international capital flows behave in a pro-cyclical manner.
In other words, they exacerbate economic expansions as well as economic contractions and
are thus often blamed for increased economic instability. This observation applies to small
open economies in particular, which are usually much more dependent on foreign trade and
inflows of foreign capital than large economies.
1 This group of countries included Indonesia, South Korea, Thailand, Malaysia and the Philippines.
2
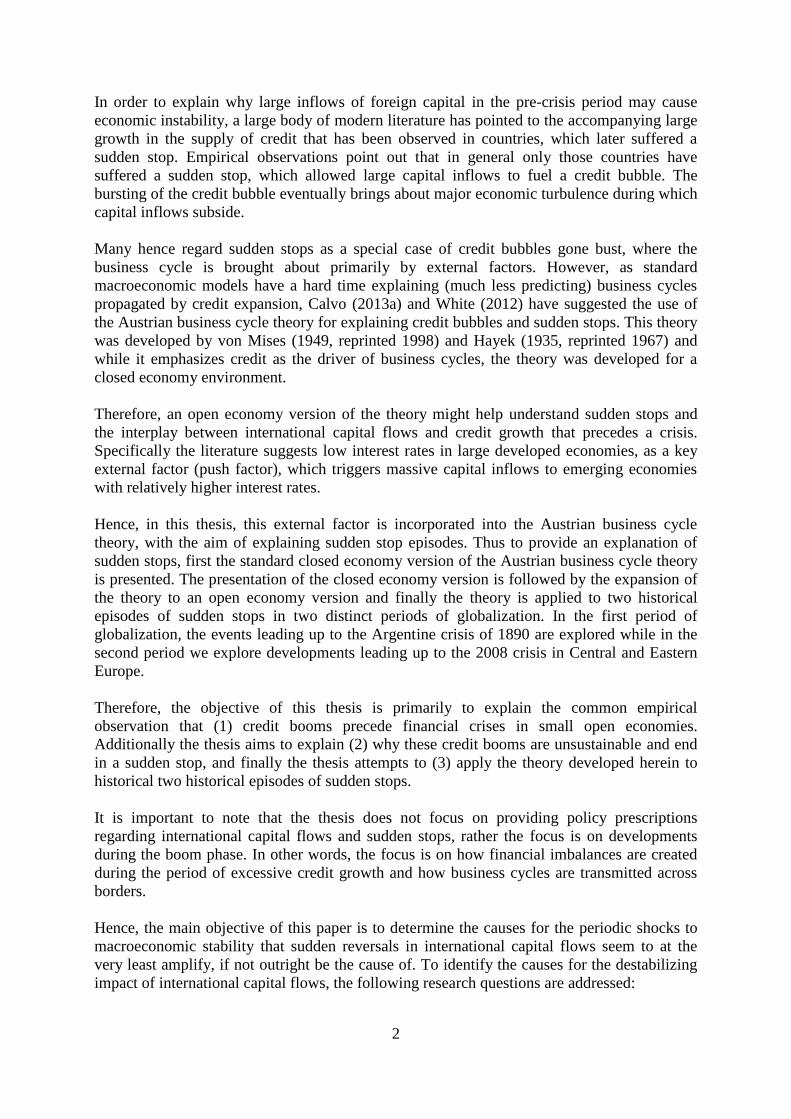
In order to explain why large inflows of foreign capital in the pre-crisis period may cause
economic instability, a large body of modern literature has pointed to the accompanying large
growth in the supply of credit that has been observed in countries, which later suffered a
sudden stop. Empirical observations point out that in general only those countries have
suffered a sudden stop, which allowed large capital inflows to fuel a credit bubble. The
bursting of the credit bubble eventually brings about major economic turbulence during which
capital inflows subside.
Many hence regard sudden stops as a special case of credit bubbles gone bust, where the
business cycle is brought about primarily by external factors. However, as standard
macroeconomic models have a hard time explaining (much less predicting) business cycles
propagated by credit expansion, Calvo (2013a) and White (2012) have suggested the use of
the Austrian business cycle theory for explaining credit bubbles and sudden stops. This theory
was developed by von Mises (1949, reprinted 1998) and Hayek (1935, reprinted 1967) and
while it emphasizes credit as the driver of business cycles, the theory was developed for a
closed economy environment.
Therefore, an open economy version of the theory might help understand sudden stops and
the interplay between international capital flows and credit growth that precedes a crisis.
Specifically the literature suggests low interest rates in large developed economies, as a key
external factor (push factor), which triggers massive capital inflows to emerging economies
with relatively higher interest rates.
Hence, in this thesis, this external factor is incorporated into the Austrian business cycle
theory, with the aim of explaining sudden stop episodes. Thus to provide an explanation of
sudden stops, first the standard closed economy version of the Austrian business cycle theory
is presented. The presentation of the closed economy version is followed by the expansion of
the theory to an open economy version and finally the theory is applied to two historical
episodes of sudden stops in two distinct periods of globalization. In the first period of
globalization, the events leading up to the Argentine crisis of 1890 are explored while in the
second period we explore developments leading up to the 2008 crisis in Central and Eastern
Europe.
Therefore, the objective of this thesis is primarily to explain the common empirical
observation that (1) credit booms precede financial crises in small open economies.
Additionally the thesis aims to explain (2) why these credit booms are unsustainable and end
in a sudden stop, and finally the thesis attempts to (3) apply the theory developed herein to
historical two historical episodes of sudden stops.
It is important to note that the thesis does not focus on providing policy prescriptions
regarding international capital flows and sudden stops, rather the focus is on developments
during the boom phase. In other words, the focus is on how financial imbalances are created
during the period of excessive credit growth and how business cycles are transmitted across
borders.
Hence, the main objective of this paper is to determine the causes for the periodic shocks to
macroeconomic stability that sudden reversals in international capital flows seem to at the
very least amplify, if not outright be the cause of. To identify the causes for the destabilizing
impact of international capital flows, the following research questions are addressed:
3
1. Is there a link between credit growth and international capital flows?
2. Can the Austrian theory of the business cycle provide a good explanation for credit
bubbles and can it be expanded to account for the international transmission of credit
bubbles?
3. Do buoyant capital inflows create credit bubbles in small open economies, followed by a
bust when capital flows come to a sudden stop? Is this a negative development due to the
distortion of relative prices caused by the credit bubble?
4. Are sudden stops a modern phenomenon or can similar historical episodes in previous
periods be identified and was the Argentine crisis of 1890 a sudden stop crisis?
In order to answer these questions, the thesis is structured in the following way. In Chapter 1
the problems associated with international capital flows are presented, and the hypothesis that
international capital flows are connected to excessive credit growth is offered. As excessive
credit growth is at the heart of the Austrian theory of the business cycle, the closed economy
version of this theory is presented in Chapter 2, with an analysis of the impact of credit
growth dynamics on the structure of production in the economy. In Chapter 3, this theory is
then expanded to an open economy, in order to ascertain the impact of international capital
flows on credit growth. Finally, the theory developed in Chapter 3, is applied in Chapter 4 on
two historical episodes to ascertain the empirical validity of the theory.
Empirical episodes are hence examined through the lens of the theory that we have developed.
Based on the theoretical and empirical examination, we find that the Austrian business cycle
theory is a useful tool in analyzing sudden stop episodes. By expanding the Austrian theory of
the business cycle to the open economy, we can explain many empirical observations of the
build-up of events leading to a sudden stop crisis. The distortion of relative prices and hence a
distorted structure of production, which are key features predicted by the Austrian business
cycle theory, are present in our empirical episodes. There are also indications that the
international transmission of credit expansions through the interest rate and foreign exchange
rate channel is at work, especially in the case of Central and Eastern European crisis of 2008.
It is important to note that using the Austrian business cycle theory in an open economy
context is a novel approach and one which has seldom been used in the literature hitherto. The
contribution of this thesis is hence the use of a new theory, which can shed new light on the
connection between credit growth, international capital flows and economic crises. An
additional contribution is the application of the theory on two historical episodes, which have
hitherto rarely been associated with the Austrian business cycle theory.
1 THEORY OF THE LINK BETWEEN MONETARY POLICY AND
INTERNATIONAL CAPITAL FLOWS
1.1 Definitions of Key Terms
In this chapter, the theory of the link between international capital flows and monetary policy
will be discussed. In order to guide the discussion on international capital flows and monetary
policy, it is appropriate to define the commonly used terms.
In order to better examine international capital flows let’s first discuss the meaning of the
word capital. The standard definition of the word capital as used in economics is a produced
means of production (Jackson, 2000). Of course, economists also use the term capital to mean
4
a sum of money. Therefore, it is useful to make a distinction between capital as a physical
concept - capital goods, and capital as a sum of money - financial capital (Murphy, 2014).
This distinction will be useful in discussing capital flows (especially capital flight) and later
monetary policy and business cycles.
Then what is a capital flow? Technically, capital flows emerge with any act of selling or
buying of a good or service with a monetary payment. However, economists usually use the
term capital flow in an international context, to describe the financial side of international
trade. For instance, if somebody imports goods and services, he has to pay for them by
transferring a monetary payment (Ott, 2008). This monetary payment is called a capital flow,
which emerges when the ownership of a financial asset is transferred from one country to
another. Most commonly the assets that are involved in such transactions are equity and debt
instruments. In international economic accounts these transactions are recorded in the
financial account of a country’s balance-of-payments accounts (Institute of International
Finance, 2013). The balance-of-payments accounts of a country record the payments and
receipts of the residents of the country in their transactions with residents of other countries
(Stein, 2008).
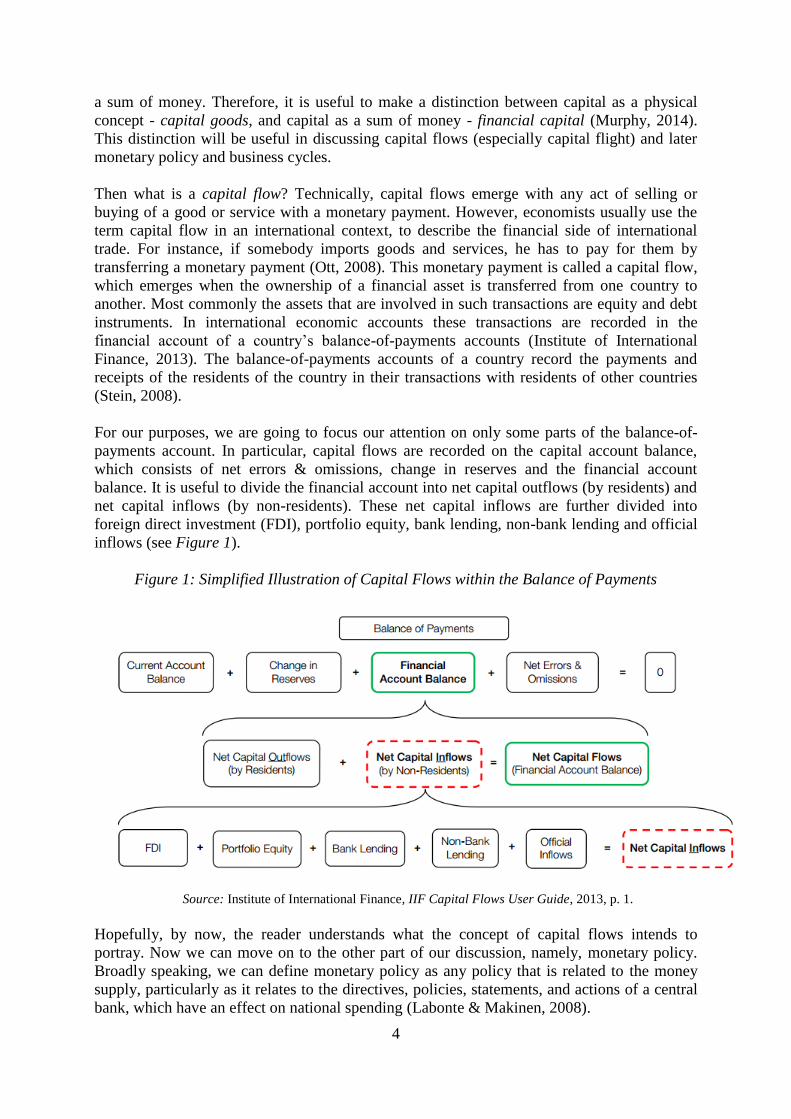
For our purposes, we are going to focus our attention on only some parts of the balance-of-
payments account. In particular, capital flows are recorded on the capital account balance,
which consists of net errors & omissions, change in reserves and the financial account
balance. It is useful to divide the financial account into net capital outflows (by residents) and
net capital inflows (by non-residents). These net capital inflows are further divided into
foreign direct investment (FDI), portfolio equity, bank lending, non-bank lending and official
inflows (see Figure 1).
Figure 1: Simplified Illustration of Capital Flows within the Balance of Payments
Source: Institute of International Finance, IIF Capital Flows User Guide, 2013, p. 1.
Hopefully, by now, the reader understands what the concept of capital flows intends to
portray. Now we can move on to the other part of our discussion, namely, monetary policy.
Broadly speaking, we can define monetary policy as any policy that is related to the money
supply, particularly as it relates to the directives, policies, statements, and actions of a central
bank, which have an effect on national spending (Labonte & Makinen, 2008).

5
While defining monetary policy might be pretty straightforward, it is non-trivial to answer the
question of: what is money? The answer is simple at first, by observing that money is the
most saleable good in society or the general medium of exchange, from which the secondary
functions of money such as a store of value, unit of account and a standard of deferred
payments are derived (Salerno, 1994). What constitutes money is harder to answer though. To
distinguish what is money and what is not is harder than it seems at first glance. The key
criteria for determining what is money and what is not, is liquidity or moneyness, which is
defined as the quality or state of being readily convertible to cash (Retrieved May 8, 2014,
Merriam-Webster: http://www.merriam-webster.com/dictionary/moneyness). In other words,
money substitutes have to be perfectly liquid to act as money in society. Therefore, as
Rothbard (1962, reprinted 2009) noted, the conclusive test of what is money is if it is used to
settle debts and if it is such a means of payment at par. Meaning that for something to be
money, it has to be accepted without any discount (at a one to one ratio with cash)
whatsoever, however small the discount might be, and used as the general medium of
exchange and accepted in the payments of debts.
However, some assets are so highly liquid that they enjoy the status of near-money. Near-
moneys are assets, which gain a higher price on the market because of their high
marketability. The existence of near-money lowers the demand for money, as holders of near-
money, can economize on money by keeping near-money as assets. The price of near-money
is higher than would be the case in the absence of their quasi-monetary status (Rothbard,
1962). In advanced economies near-moneys are usually short-term debts or securities that
have a broad market.
Defining and discussing liquidity is relevant for our purposes because, as Hayek (1937) and
Calvo (2013a) stress, the impact of liquidity considerations is significant, when dealing with
issues of capital flows, monetary policy and business cycles. Hayek (1937) in particular
stressed the influence of multiple layers of liquidity on the functioning of the international
monetary system. This system is influenced by the interplay between international capital
flows and monetary policies in individual countries in a major way.
As we will also be dealing a lot with international financial crises, it is also good to keep in
mind the different types of international financial crises (International Monetary Fund, 1998):
1. Currency Crises, which occur due to a loss of credibility of a fixed (or pegged) exchange
rate system;
2. Banking Crises, which occur when there is a sudden collapse of the domestic banking
system;
3. Systemic financial crises or sudden stops, which as defined in Calvo (1998) entail a large
and unexpected fall (sudden stop) of capital inflows (it need not result in outright capital
outflows);
4. Sovereign Debt Crises, which occur due to the government being unable to pay-off its
debts to international creditors.
6
1.2 International Capital Flows and Economic Crises
Without free movements of capital under the Bretton Woods system (1945-1971/73),
international capital flows were too small to have more than a minor impact on
macroeconomic performance.
However, with financial liberalization in the 1980s international capital flows have notably
increased in size and, as a result, their influence on national economies has increased. This is
particularly the case for small and medium-sized economies. In theory financial liberalization
should be a positive development, as with unrestricted capital flows; capital can get allocated
to countries that need it the most. Besides this optimal resource allocation, Bordo (2000) lists
additional benefits of open international capital markets enabling intertemporal optimization,
the international diversification of portfolios and imposing discipline on policymakers.
Unfortunately, freeing up capital flows has also brought about negative side effects. As
Krugman (2013) notes financial liberalization coincides with the appearance of financial
crises in small and medium-sized economies2. These crises are associated with large and
abrupt changes in international capital flows, which can cause systemic financial crises.
Such crises have been named sudden stops, which under the most common definition first
described by Calvo (1998), are characterized by a large and unexpected fall of international
capital inflows. Calvo et al. (2004) more formally qualify a fall in international capital inflows
as large, if the annual change in capital flows is at least one standard deviation below the
mean. While a fall in international capital inflows is deemed to be unexpected, if at least one
observation in the annual variation in capital flows is at least two standard deviations below
its sample mean.
As was mentioned above, sudden stop crises were practically unknown in the Bretton Woods
system when international capital flows were strictly regulated. However, the deregulation of
capital flows brought about recurring financial crises, a fact which certainly was not predicted
by the neoclassical theory regarding the determinants of international capital mobility, as we
will see.
Canonical neoclassical intertemporal models of the current account are built upon a small
open economy, which is populated by a representative agent who is subject to fluctuations in
his income. However, as Lubik (2007) notes, having access to international financial markets
enables the representative agent to reduce uncertainty by loaning out excess funds or by
borrowing funds in order to maintain a constant consumption path. As this story often fails to
stack up to empirics, the international macroeconomics literature has made a distinction
between an international asset market that is incomplete and one that is complete. In complete
markets risk sharing is perfect, because agents in such models have access to a complete set
of state-contingent securities.
However, foreign debts are not state-contingent, as foreign debts are commonly expressed in
nominal terms, regardless of their real value (Lubik, 2007). Therefore, international financial
markets have increasingly been regarded as incomplete. This incompleteness, as Calvo (2014)
notes, implies that debt deflation-type effects as described in Fisher (1933) arise, which might
2 Some examples of such financial crises are Mexico, Brazil, Argentina and Chile in 1982; Sweden and Finland
in 1991; the Mexican Tequila crisis in 1995; the Asian Financial Crisis in Thailand, Malaysia, Indonesia and
Korea in 1998.

7
magnify the damage caused by international capital flow volatility, with the accompanying
sudden floods and sudden stops of capital inflows.
Moreover, the assumption of internationally complete asset markets was found to be
unrealistic in a study by Obstfeld and Rogoff (2001). The main finding from their empirical
study was that financial markets perform better at promoting risk sharing across regions
within countries than across countries, which goes against the assumption of international
asset markets being complete.
However, regardless if the more realistic assumption of incomplete markets was incorporated
into the models, the standard Dynamic stochastic general equilibrium (DSGE) models still
find it difficult to account for sudden stop episodes occurring. As Mendoza (2010) notes, this
applies to frictionless real business cycle models, as well as to models with nominal rigidities.
The divergence between neoclassical theoretical predictions and real life experience soon
became apparent, as many unexplained phenomena (or puzzles) emerged. The following are
just some among many presented in the literature:
1. Lucas (1990) showed how the neoclassical theory cannot account for the lack of capital
flows from rich to poor countries (the Lucas paradox);
2. Feldstein and Horioka (1980) noted that in OECD countries, savings have not been
flowing to countries with the highest rate of return on investment as the neoclassical
theory predicts because the co-movement in domestic savings and investment remains
high (Feldstein-Horioka puzzle);
3. French and Poterba (1991) identified the equity home bias puzzle, the observation that
home country residents do not invest nearly as much in foreign capital markets as
predicted by theory;
4. According to neoclassical theory, consumption should be correlated higher across
countries than output. However, Backus, Kehoe and Kydland (1992) noted that the
correlations of consumption growth across countries are low, which indicates a lack of
risk sharing (the Backus–Kehoe–Kydland consumption correlation puzzle).
As Alfaro et al. (2008) point out, all these puzzles directly or indirectly relate to the small size
and the opposite direction of capital flows to what should have happened according to
neoclassical theory. This phenomenon of capital flows going into the opposite direction to the
theoretical benchmark has also been observed regarding sudden stop crises. As Prasad (2013)
noted, instead of capital flows behaving in a counter-cyclical manner as theory would predict,
capital flows behave in a pro-cyclical manner. Meaning that countries receive capital inflows
during good times, but the capital inflows decrease rapidly during bad times.
As pointed out by Mendoza (2010), these empirical regularities like large reversals in
international capital flows can be seen in the data as a sudden increase in net exports and the
current account. The consequence of a reversal in capital flows is often, as Cavallo and
Frankel (2007) note, a financial or currency crisis accompanied by a sharp fall in output.
These output collapses in emerging markets can be observed in the large declines in GDP and
investment, which are also reflected in a large collapse in private consumption.
Such dynamics were observed by Calvo et al. (2006), who identified 22 sudden stop episodes
(for a list of all the episodes see Appendix A) occurring in the 1980-2004 period. These
episodes are delineated from other crises by looking at changes in JP Morgan’s Emerging
Market Bond Index. Changes in the index were used to provide a connection to the level of
8
integration of world capital markets, which provided a basis for identifying crises that
stemmed from credit shocks rather than from other factors.
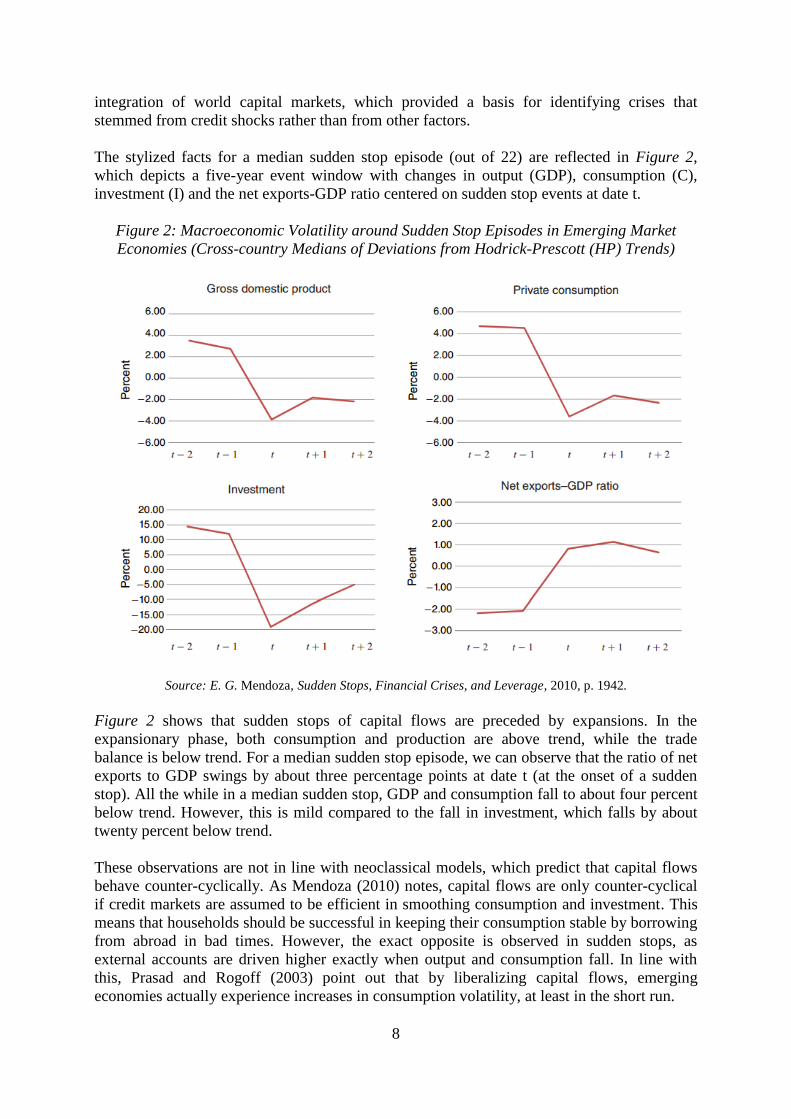
The stylized facts for a median sudden stop episode (out of 22) are reflected in Figure 2,
which depicts a five-year event window with changes in output (GDP), consumption (C),
investment (I) and the net exports-GDP ratio centered on sudden stop events at date t.
Figure 2: Macroeconomic Volatility around Sudden Stop Episodes in Emerging Market
Economies (Cross-country Medians of Deviations from Hodrick-Prescott (HP) Trends)
Source: E. G. Mendoza, Sudden Stops, Financial Crises, and Leverage, 2010, p. 1942.
Figure 2 shows that sudden stops of capital flows are preceded by expansions. In the
expansionary phase, both consumption and production are above trend, while the trade
balance is below trend. For a median sudden stop episode, we can observe that the ratio of net
exports to GDP swings by about three percentage points at date t (at the onset of a sudden
stop). All the while in a median sudden stop, GDP and consumption fall to about four percent
below trend. However, this is mild compared to the fall in investment, which falls by about
twenty percent below trend.
These observations are not in line with neoclassical models, which predict that capital flows
behave counter-cyclically. As Mendoza (2010) notes, capital flows are only counter-cyclical
if credit markets are assumed to be efficient in smoothing consumption and investment. This
means that households should be successful in keeping their consumption stable by borrowing
from abroad in bad times. However, the exact opposite is observed in sudden stops, as
external accounts are driven higher exactly when output and consumption fall. In line with
this, Prasad and Rogoff (2003) point out that by liberalizing capital flows, emerging
economies actually experience increases in consumption volatility, at least in the short run.
9
One common explanation for the trouble associated with capital flows to emerging markets
has been that the problems with international capital flows only arise due to underdeveloped
or inadequate institutions in emerging market economies. However, this explanation is not
satisfactory in explaining such episodes as the recent crisis in some euro area economies,
where institutions were relatively well-developed (Committee on International Economic
Policy and Reform, 2012).
Therefore, in the last few years, sudden stop crises in emerging markets have forced many
economists to reassess the theoretical models of international capital flows. First generation
models of speculative attacks, as described in Krugman (1979) dominated thinking about
capital flows and crises until the 1990s. For a time, these models were successful in
explaining several important features of balance of payments crises, pinpointing the problem
as one of fiscal profligacy on the part of crisis-stricken governments. However, as East Asian
countries were fiscally prudent, these models fell out of favor for their failure to predict the
Asian financial crisis 1997/1998. Therefore, second generation models were developed,
which incorporated more complicated assumptions about governments’ behavior were
incorporated into the models (Dooley & Walsch, 1999). Along with financial crises in the
1990s, the development of theories of international economic policy interdependence and its
applications was influenced by new movements in economics toward macroeconomic theories
with microeconomic foundations (Dias & Dias, 2013).
However, after 2008, considering that the Great Recession of 2008 was financial in origin,
economists started to shift their focus on the role of credit in the economy to better grasp the
origins of the crisis. Furthermore, as the economic (financial) crisis quickly permeated
throughout the global economy, understanding the transmission of credit-driven business
cycles across countries became paramount as well.
In line with this renewed focus on credit as the driving force of business cycles, Lane and
McQuade (2014) note some common developments prior to a financial crisis occuring. Such
as that (i) in the pre-crisis period some countries (e.g. Ireland and Spain) experienced rapid
growth in credit, and that there were (ii) excessive external imbalances in some countries.
Likewise, the importance of credit growth and external imbalances in the build-up to a
financial crisis has been acknowledged by a vast body of recent literature (amongst others:
Jorda, Schularick, & Taylor, 2011; Gourinchas & Obstfeld, 2012).
The international aspect of domestic credit booms is as Mendoza (2010) indicates that credit
booms are often fuelled by rapid capital inflows from abroad, which establishes a connection
between domestic credit booms and capital flows. However, to investigate this connection, it
might be unwise to resort to standard macroeconomic models. This is because standard
macroeconomic models, as Hume and Sentance (2009) caution, find it hard to account for
credit booms occurring, and it is hard to incorporate all the relevant macrofinancial elements
into the models. However, macrofinancial elements like credit are very important. As
Schularick and Taylor (2009) found in their econometric study of macroeconomic instability
for the 1870-2008 period, past credit growth is the single best predictor of future financial
instability.
On the other hand, as Calvo (2013a) observes, credit booms are the central theme of the
Austrian business cycle theory, as presented in Hayek (1935, reprinted 1967) and von Mises
(1949, reprinted 1998). These two authors focused on changes in relative prices that develop
during a boom in a closed economy setting.

10
However, as Calvo (2014) notes, although Hayek and von Mises focused on credit booms in a
closed economy setting, their reasoning equally applies to cycles involving capital inflows
and sudden stops. In fact White (2006) argues that the Hayek-Mises explanation of the
business cycle is even more applicable to small open economies as capital inflows can bring
about credit booms driven by foreign credit.
In a similar manner, McKinnon and Pill (1997) blame excessive foreign lending to lead to
unsustainable levels of investment in small open economies. With regards to the Asian
financial crisis of 1997/1998, Corsetti et al. (1999) came to the same conclusion that over-
borrowing and over-investment led to the crisis.
These arguments and observations are reminiscent of that of Hayek (1935) and von Mises
(1949). As White (2006) notes, these two authors focused on changes in relative prices that
are a result of the increase in the supply of credit and were concerned that changes in relative
prices will be costly to roll back when credit returns to normal. This process is triggered by an
increase in credit, which impacts interest rates and hence financial calculations (in particular
present value calculations). If the increase in credit is not based on changes in real conditions
(e.g. changes in intertemporal consumption preferences), unsustainable (temporary) credit
growth can falsify the financial calculations of economic agents, who might make unwise
investment decisions based on this new information.
With this process in mind and considering the appeal of the Austrian business cycle theory
from the standpoint of the theory’s success in explaining credit booms, this thesis aims to
describe the Austrian framework and apply it to an open economy setting. However, before
going to an open economy setting, we must look at the standard closed economy setting (in
Chapter 2) and in order to extend it to the open economy setting (in Chapter 3).
However, before analyzing the Austrian business cycle theory in the closed economy, there
are a few things that need mentioning in connection with credit and international capital
flows. First of all, there is something to be said about the impact of international capital flows
between different financial (banking) systems. While analyzing the influence of the
composition of international capital flows and the effects of exchange rate regimes on capital
flows is also important. Therefore, these factors are analyzed first, before going into the nitty-
gritty of the Austrian business cycle theory (Chapter 2) and its connection to credit booms and
international capital flows (Chapter 3).
1.3 The Fragmented World Financial System and International Capital
Flows
We have just seen that there exists the potential of sudden stops and the associated economic
instability, when international capital flows (especially to small open economies) turn out to
be excessive. However, it is interesting to note that hardly anyone pays any attention to
regional (within a single country) balances of payments and flows of capital between regions
like flows from New York to California or Bavaria to Brandenburg.
The lack of attention is certainly not due to the lack of capital flows between these regions, as
the flows are frequent and large, yet hardly any economic problems are associated with them.
This begs the question: why then should international capital flows be any different? In other

11
words, if large and abrupt changes in international capital flows are so disruptive that they
occasionally cause systemic financial crises (sudden stops), why are flows from let’s say New
York to California so harmless?
This question had been raised by Heilperin (1939) and more recently by Steil (2007). Given
that national borders are just as abstract as regional borders, it is conceivable that flows
between nations should have identical economic effects as flows between regions.
In practice, however, regions are integrated with other national regions by free trade, free
migration, free flows of capital, a common currency, a common fiscal policy and a common
banking system. While nations are less integrated and lack one or more of the aforementioned
features, which bind the economic and financial systems of regions together.
Nations are less connected than regions within countries, but one issue has been specifically
singled out as the ultimate source of the problems associated with international capital flows
by the Committee on International Economic Policy and Reform3 (2012) - the fragmentation
of the world financial systems. In other words, the existence of multiple banking systems with
different regulations and multiple monetary policies directed toward achieving domestic
goals.
The fragmentation of the world financial system was also identified as the main problem of
international capital flows by Hayek (1937), who blamed this fragmentation for deficiencies
in the operation of the classical gold standard (1870-1914). More specifically, Hayek (1937),
Heilperin (1939), von Mises (1949) and Salerno (2010) point to the institutional arrangement
of the one-reserve system as the root of the problem. The adoption of the one-reserve system
meant that commercial banks could now hold central bank liabilities, notes and deposits, as
their main reserves (Fischer, Schnadt, Capie, & Goodhart, 1994), instead of each commercial
bank holding their own reserves. What this development meant, as von Mises (1949) pointed
out, is that the commercial banks no longer needed to match the maturity of their liabilities
and their assets in order to meet their obligations to their creditors without the aid of the
central bank.
An additional problem is that under the one-reserve system, movements of capital between
countries can disturb the structure of the national money and credit system. The structure is
disturbed, if the central bank expands or contracts its liabilities (mostly cash or banknotes –
the base of the inverted pyramid in Figure 3) in the face of capital inflows or outflows. The
central bank can absorb capital inflows and outflows by buying or selling foreign exchange
reserves and expanding or contracting its liabilities in the process, or it can leave its liabilities
intact and simply let the currency appreciate or depreciate freely. However, this is often not
the case in emerging markets, where central banks are reluctant to let their currencies
fluctuate freely, a phenomenon named fear of floating by Calvo and Reinhart (2002).
3 Members of the Committee on International Economic Policy and Reform include: Markus Brunnermeier,
Philip R. Lane, Dani Rodrik, Jose de Gregorio, Jean Pisani-Ferry, Kenneth Rogoff, Barry Eichengreen, Eswar
Prasad, Hyun Song Shin, Mohamed El-Erian, Raghuram Rajan, Andres Velasco, Arminio Fraga, Maria Ramos,
Beatrice Weder di Mauro, Takatoshi Ito, Helene Rey and Yongding Yu.
12
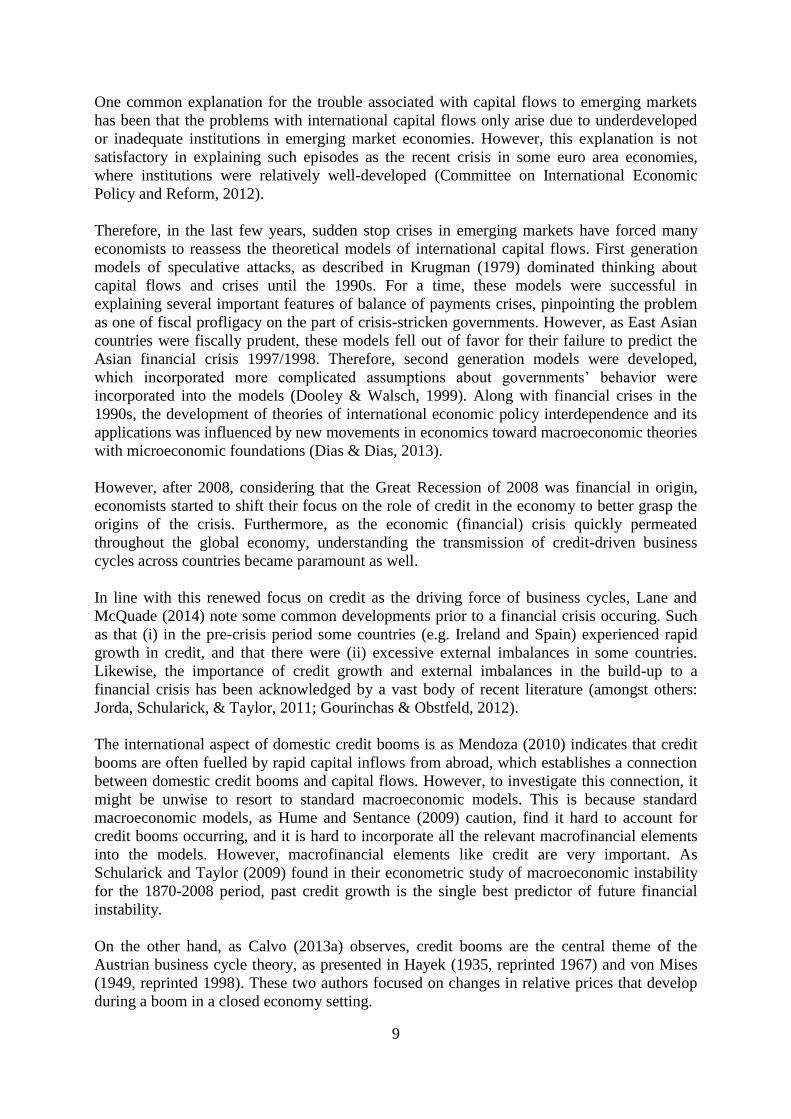
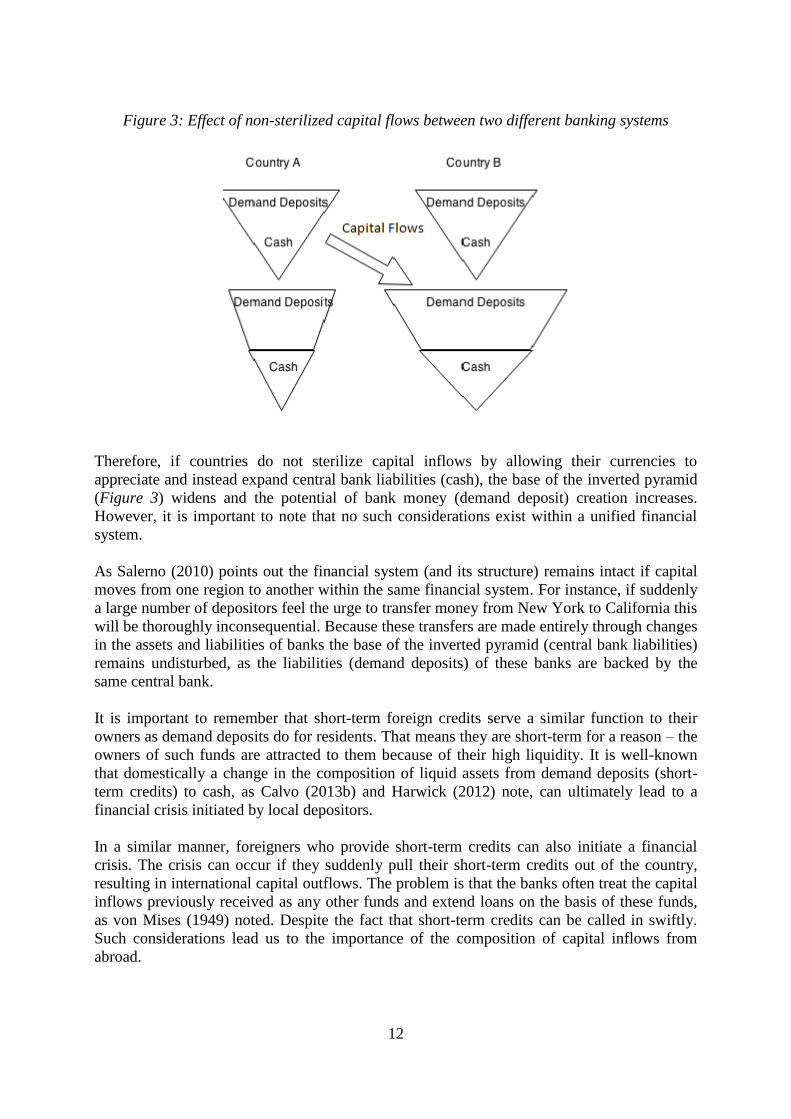
Figure 3: Effect of non-sterilized capital flows between two different banking systems
Therefore, if countries do not sterilize capital inflows by allowing their currencies to
appreciate and instead expand central bank liabilities (cash), the base of the inverted pyramid
(Figure 3) widens and the potential of bank money (demand deposit) creation increases.
However, it is important to note that no such considerations exist within a unified financial
system.
As Salerno (2010) points out the financial system (and its structure) remains intact if capital
moves from one region to another within the same financial system. For instance, if suddenly
a large number of depositors feel the urge to transfer money from New York to California this
will be thoroughly inconsequential. Because these transfers are made entirely through changes
in the assets and liabilities of banks the base of the inverted pyramid (central bank liabilities)
remains undisturbed, as the liabilities (demand deposits) of these banks are backed by the
same central bank.
It is important to remember that short-term foreign credits serve a similar function to their
owners as demand deposits do for residents. That means they are short-term for a reason – the
owners of such funds are attracted to them because of their high liquidity. It is well-known
that domestically a change in the composition of liquid assets from demand deposits (short-
term credits) to cash, as Calvo (2013b) and Harwick (2012) note, can ultimately lead to a
financial crisis initiated by local depositors.
In a similar manner, foreigners who provide short-term credits can also initiate a financial
crisis. The crisis can occur if they suddenly pull their short-term credits out of the country,
resulting in international capital outflows. The problem is that the banks often treat the capital
inflows previously received as any other funds and extend loans on the basis of these funds,
as von Mises (1949) noted. Despite the fact that short-term credits can be called in swiftly.
Such considerations lead us to the importance of the composition of capital inflows from
abroad.
13
1.4 Composition of Capital Inflows
To put the composition of capital flows into context, keep in mind that capital inflows consist
mostly of foreign direct investment (FDI), portfolio investment and international bank lending
(credit flows). Foreign direct investment and equity portfolio are seen as conducive to
international risk sharing by most economists (Committee on International Economic Policy
and Reform, 2012). On the other hand cross-border credit flows, especially when these credits
have a short maturity, are the most problematic from the point of view of macroeconomic
stability.
One reason for this difference may lay in the fact that, as Taleb (2010) put it, equity investors
have skin in the game, meaning that they share in the gains as well as in the losses that their
investments produce. On the other hand, there is a certain likelihood that losses from bank
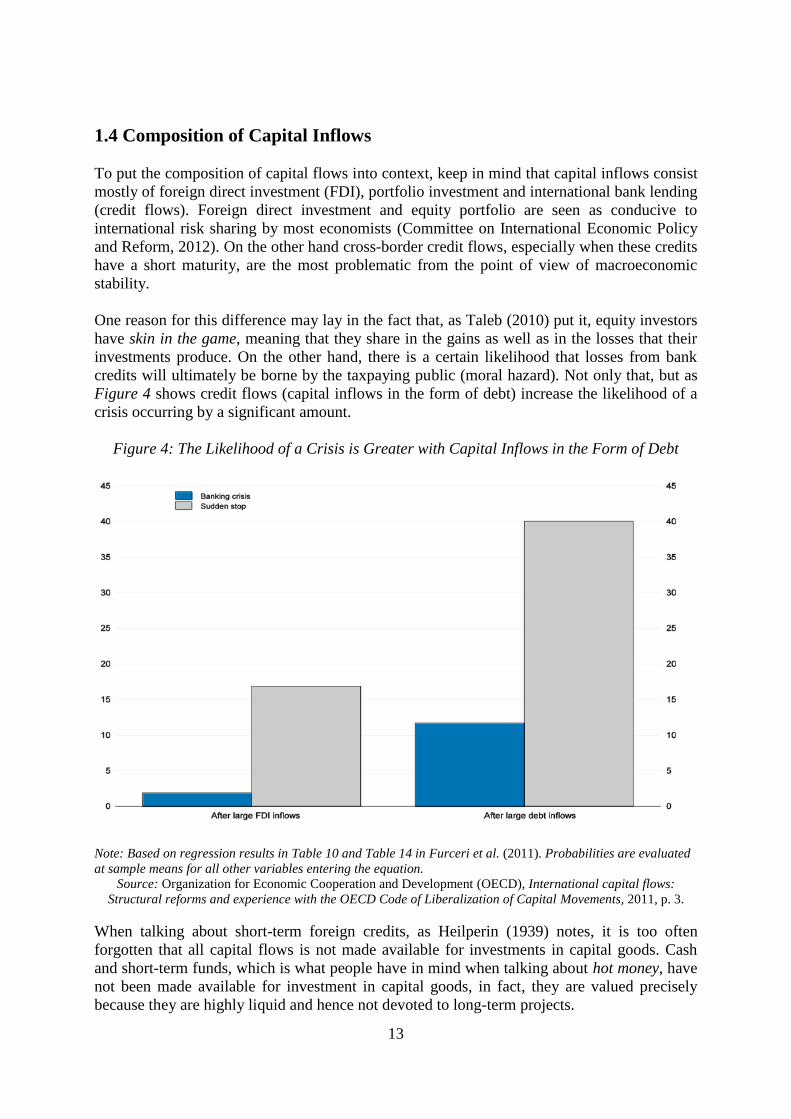
credits will ultimately be borne by the taxpaying public (moral hazard). Not only that, but as
Figure 4 shows credit flows (capital inflows in the form of debt) increase the likelihood of a
crisis occurring by a significant amount.
Figure 4: The Likelihood of a Crisis is Greater with Capital Inflows in the Form of Debt
Note: Based on regression results in Table 10 and Table 14 in Furceri et al. (2011). Probabilities are evaluated
at sample means for all other variables entering the equation.
Source: Organization for Economic Cooperation and Development (OECD), International capital flows:
Structural reforms and experience with the OECD Code of Liberalization of Capital Movements, 2011, p. 3.
When talking about short-term foreign credits, as Heilperin (1939) notes, it is too often
forgotten that all capital flows is not made available for investments in capital goods. Cash
and short-term funds, which is what people have in mind when talking about hot money, have
not been made available for investment in capital goods, in fact, they are valued precisely
because they are highly liquid and hence not devoted to long-term projects.

14
However, the commercial banks treat these inflows of short-term funds as if they were made
available for investment purposes. Hence, the banks extend credit, which finances long-term
investments, based on these short-term funds. As owners of these short-term funds have the
right to withdraw them on short notice, while loans to businesses cannot be recovered so
swiftly, the withdrawal of short-term funds (capital flight) can leave the banks illiquid.
Therefore, banks that fund their operations by acquiring debt from foreign banks face a real
possibility that they themselves will become illiquid. That is because international bank
lending is highly mobile, and the value of foreign credits is nominally fixed (Tong & Wei,
2009). Both of these facts together - that foreign credits are nominally fixed and highly liquid
- can bring about the problems of currency mismatching and maturity mismatching.
A maturity mismatch describes the situation, where an economic agent funds long-term
investments (assets) by taking on short-term (external) debts (liabilities). This practice of
borrowing short and lending long entails the risk of illiquidity if the debts are not rolled over,
which can have similar repercussions internationally, as a bank run does domestically. Like
domestic depositors who dump bank deposits in favor of cash in a typical bank run, foreign
creditors also increase their demand for liquidity in times of financial distress.
Therefore, as Hayek (1937) stresses short-term foreign credits are recalled because of changes
in the demand for money (i.e. liquidity preference) and not due to changes of demand for
investment capital. Investment capital can thus flow out of a country precisely when it is most
needed. Another factor is as Calvo (2013a) points out, is that there exist monies with different
degrees of liquidity. Therefore, whenever there is a rush for liquidity, less liquid monies such
as currencies of emerging markets are exchanged for more liquid monies such as the US
dollar, appreciating the US dollar in the process, which causes problems for economic agents
who have a currency mismatch in their balance sheet.
A currency mismatch from the point of view of the borrowers describes the situation of
economic agents, who have acquired debt (liabilities) in a foreign currency, while they receive
their income (assets) in their domestic currency. This is risky, as a fall in the value of their
domestic currency on the foreign exchange markets reduces their income in terms of the
foreign currency and makes it harder to service debt denominated in foreign currency.
On the other hand, a currency mismatch occurs from the point of view of a lender if economic
agents engage in carry trades. The term carry trade describes the practice of borrowing
money in the currency of a country where interest rates are low and lending that money in a
currency of a country with higher interest rates. The resulting interest rate differential presents
an opportunity to make a profit from the interest rate margin. This practice is very profitable
unless the currency in which you borrowed from (your liabilities) appreciates relative to the
currency you lent into (your assets). This is so because the proceeds from your loan come in
the form of a depreciated currency, which makes it harder to service your debt in the
appreciated currency.
To counteract such dangers of holding short-term debt in a foreign currency, it is hence
prudent according to Krugman (2007), to hold liquid assets in foreign currency as well.
Krugman (2007) is especially adamant to point out that sufficient reserves of foreign currency
or foreign exchange reserves in the form of liquid assets such as US Treasury bonds will

15
suffice to stave off any potential creditor run that might have arisen in the absence of such
reserves.
Creditor runs, as a consequence of maturity and currency mismatches, were a big problem
even in the first part of the 20th
century. During the pre-WWII period (1931-1945) of floating
exchange rates, foreign creditor runs caused large economic instability. Consequently, the
Bretton Woods system (1945-1971/73) institutionalized capital controls in order to prevent
capital flight (investors pulling out their capital) from national economies.
This term capital flight describes the idea that invested wealth leaves one country for another.
However, as von Mises (1949) noted, it is important to remember that capital cannot literary
flee the country. Only the value of the capital can fall, which is usually the case because
investors have lowered their expectations of the future value of this capital. It is important to
note that investors only profit from capital flight if their predictions about future market
values turn out to be correct.
Therefore, capital flight can most accurately be described as a loss in confidence that results
in a drop in values. The same applies to national fiat currencies, which usually do not leave
the country in a crisis; however, their value can drop (depreciate) significantly. This implies
that capital flight, far from being a conspiracy by foreign investors, involves foreign investors
taking on significant losses. Unless in the case, if foreign investors hold investments in the
form highly liquid assets (such as money and short-term credit) in which case investors may
avoid losses altogether and the country may have to fully absorb the losses.
Therefore, we must be careful to note that analyzing the composition of capital inflows in the
period that preceded the capital flight is crucial to determine if capital can fly out of a country.
Money and short-term credits can, in fact, leave the country swiftly, leaving nothing in their
place. However, foreign direct investments (FDI), portfolio inflows and long-term credits
share in the losses.
This leads us to conclude that only short-term funds can leave the country in times of
financial distress without the owners of these funds experiencing losses themselves. Whether
the owners of such funds will really pull out of a country swiftly depends on their
expectations.
These expectations of short-term creditors are seen to be formed by many factors, which have
been identified to act as incentives for investors to lend short-term rather than long-term.
Most observers base their suggestions on the experience of the East Asian crisis of
1997/1998, which was (at least partly) attributed to short-term capital movements (see
Furman and Stiglitz 1998; Radelet and Sachs 1998; Rodrick and Velasco 1999).
Rodrick and Velasco (1999) argue that one of the incentives for investors to lend short-term
rather than long-term is insolvency risk. In other words, creditors may prefer to only lend
short-term in order to have more control over borrowers’ actions in order to reduce the risk of
default. Rodrick and Velasco (1999) also point out that liquidity risk plays a role in the choice
between short-term and long-term lending. While Buch and Lusinyan (2000) also list
informational deficiencies in foreign lending as a reason to lend short-term, as lending short-
term reduces the cost of gathering information about the borrower.
16
In relation to the East Asian crisis of 1997/1998, Dadush et al. (2000) and Kaminsky and
Reinhart (1998) also highlight the role of high interest rate differentials. Such differentials
were a consequence of capital inflows sterilization and exchange rate pegging by East Asian
governments, which was one of the chief reasons for excessive short-term capital movements
in that period. Interest rate differentials were also emphasized by Hayek (1937), Heilperin
(1939) and Bloomfield (1963), as one of the key factors for short-term capital movements,
with another factor being the uncertainty about the future value of exchange rates in a
fluctuating exchange rate regime. Therefore, the influence of the exchange rate regimes on
short-term capital movements is explored further in the following chapter.
1.5 The Influence of Exchange Rate Regimes
The influence of the exchange rate regime employed on short-term capital movements was
one of the main topics Hayek (1937) was concerned about. He explored the causes behind
short-term capital movements and was in particular interested in the volume and the direction
of short-term capital movements under different exchange rate regimes.
Under the regime of fluctuating exchange rates the volume of short-term capital flows, which
as we saw can be a source of macroeconomic instability, becomes larger. That is because
there is uncertainty about the future movements of foreign exchange rates, while we must also
not forget, as Rothbard (1963b) noted, that just the existence of multiple currencies adds
additional uncertainty to the natural uncertainty that exists in the market. Market participants
hence protect themselves from the increased uncertainty by only providing short-term funds.
However, this can foster macroeconomic instability as we saw with the problems of maturity
and currency mismatching.
On the other hand, as Bloomfield (1963) found out in his research of short-term capital
movements under the classical gold standard, short-term movements had a benign effect on
receiving economies as they had a stabilizing effect rather than a destabilizing one.
Bloomfield (1963) attributes this to the commitment of monetary policy at the time to keeping
gold parity - external stability. Whereas modern monetary policy, more often aims at a
reasonable level of stability in economic activity and most of all to keep the price level
relatively stable - internal stability.
This dichotomy between internal stability and external stability has been at the heart of the
discussion of exchange rate regimes at the very least since the beginning of the 20th
century.
Back then Keynes (1924) put forth the argument that in choosing among fixed exchange rates
and independent monetary policies, countries are faced with a choice of external stability
(fixed exchange rates and balanced current accounts) and internal stability (stable
employment and domestic price level).
Easier pursuit of internal stability is one of the main arguments in favor of fluctuating
exchange rates. The main benefit, as Friedman (1953) noted, is in the ease of adjustment, as
exchange rates are much more flexible than internal prices. Internal prices are downward
sticky, which can inhibit the adjustment process. Furthermore, there should be no leakage of
inflationary monetary policy to other countries as Friedman (1953) and later Rogoff (1985)
argued.

17
In terms of adjustment it is important to remember though, that monetary policy cannot
prevent a real change in demand from taking place nor can monetary policy prevent the
effects of a fall in income for the domestic producer to gradually spread throughout the
economy. What monetary policy can do though, as Hayek (1937) observed, is to offset this
fall in a single price by making other prices rise in order for to maintain a stable price level.
This thinking in terms of the average price level instead in terms of the structure of prices is
the key error committed by supporters of fluctuating exchange rates according to Heilperin
(1939). Hayek (1937) argued along similar lines that the beneficial effects of fluctuating
exchange rates rely on the assumption that relative prices within each country are uniquely
determined by constant relative costs. However, we must remember that changes in demand
imply changes in the relative quantities of goods produced. This change in the structure of
production can only be achieved through changes in relative prices and the relative incomes.
Heilperin (1939) also argues that there are certain monetary policy spillovers (by way of
capital flows) to other countries even under fluctuating exchanges. He attributes this to the
fact that foreign prices also affect the formation of prices within any one country, especially
as the degree of openness increases. Along similar lines, Corsetti and Pesenti (2001) note that
adhering to domestic policy objectives such as the stabilization of domestic output is not
optimal if firms’ markups are exposed to currency fluctuations. That is because with
fluctuating currencies domestically focused monetary policies can induce excessive volatility
in exchange rates and foreign sales revenue. This hurts welfare, because the volatility leads
exporters to set higher prices in response to higher profit risk.
Despite these objections to fluctuating exchange rates, it does not necessarily follow that we
should favor fixed exchange rates over fluctuating exchange rates. One thing that fluctuating
exchange rates have got going for them is that supply and demand determine exchange rates.
On the other hand, if governments unilaterally fix the exchange rate it is a form of price
control. The prices of foreign exchange are usually fixed in a way, which undervalues the
domestic currency and in effect subsidizes exports. This is distortionary, as some companies
will become temporarily more profitable (as long as exchange rates can resist market
pressure) and will hence expand production. The expansion of production in export industries
occurs because exchange rates adjust before internal prices. However, this good fortune for
exporters will be reversed when their costs also rise.
Though these criticisms only apply if fixes are set unilaterally. If this is done by means of
independent monetary policy decisions, which are not part of a working system of
international monetary framework such as the classical gold standard. The classical gold
standard was a coherent international monetary framework. This stems from the fact that it is
coherent from the standpoint of the impossible trinity4 because countries on the classical gold
standard abandoned the pursuit of independent monetary policies in favor of fixed exchange
rates and the free flow of capital. There was also a coherent system under Bretton Woods
(1945-1971/73), in which the free flow of capital was inhibited to allow countries to run
independent monetary policies even under fixed exchange rates.
4 The impossible trinity (also known as the Trilemma) is a hypothesis in international economics that alludes to
the observation that countries cannot simultaneously have fixed exchange rates, free capital flow and an
independent monetary policy.

18
2 THE RELATIONSHIP BETWEEN INTERNATIONAL CAPITAL
FLOWS AND CREDIT-INDUCED BUSINESS CYCLES
2.1 Key Features and Dynamics of Credit-induced Business Cycles At the end of the previous chapter we noted that under Bretton Woods there were fixed
exchange rates, but the free flow of capital was inhibited. This leads to the effect that these
stringent capital controls had on the incidence of business cycles emanating from the financial
system. As Bordo and Eichengreen (2000) document credit-induced business cycles declined
internationally during the Bretton Woods period. While they documented that the incidence of
business cycles driven by credit rose again due to financial and capital account liberalization
and other structural changes in the world economy since the 1980s.
With international capital flows liberalized the effects that they have on financial systems and
macroeconomic instability in the form of business cycles, can no longer be ignored. Therefore
in this section the relationship between international capital flows and credit-induced business
cycles will be examined. There are certain developments during the run-up to sudden stop
episodes in emerging markets that they share in common with developments leading up to the
Great depression, the Great Recession of 2008 and the Japanese asset price bubble in the
1980s.
As White (2006) notes, the build-up to all of these crises was marked by large increases in
credit, asset prices and fixed investment, which was followed by a crash in all of these
categories. However, in the build-up to emerging market crises like the Asian financial crisis
of 1997, the process was also accompanied by large inflows of foreign capital. However, it is
interesting to note that in the run-up of the aforementioned crises, these major economic
disruptions occurred in environments of effective price stability.
This is surprising, especially considering the emphasis that policymakers and economists have
put on the stability of the aggregate level of prices for assuring macroeconomic stability in
recent decades. This suggests that focusing on aggregate measures such as the aggregate level
of prices in the economy, might neither be a necessary nor a sufficient condition for
macroeconomic stability. In any case, looking at aggregate price levels would not reveal the
build-up of macroeconomic imbalances in the aforementioned crises.
Therefore studying the co-movement of macroeconomic aggregates across countries like is
done in international business cycles models like the Backus–Kehoe–Kydland model (1992)
based on real business cycle theory, may be inadequate to explain empirical regularities of
sudden stop crises. Indeed, as Basu and Taylor (1999) note, the Backus–Kehoe–Kydland
model and other standard international business cycle models have a hard time explaining
empirical regularities and are very inconclusive when it comes to the channel by which
money and credit effect the economy.
In contrast, by focusing on the dynamics of relative rather than aggregate variables during the
run-up to these crises, empirical regularities such as increases in credit, asset prices and fixed
investment can be illuminated. By focusing on changes in relative prices and the market
process of a business cycle, which is the essence of the Austrian business cycles theory, some
common empirical features can be explained. For instance, such a feature is the
disproportionate increase in the quantity of capital goods (investment), another is the increase
19
in the prices of titles to capital goods (asset prices) prior to a crisis occurring. Both of these
features are connected to the growth in credit.
As Rothbard (1963a, reprinted 2000) notes the growth in credit triggers a rise in the quantity
and prices in the capital goods sector which will outpace the rise in the consumer goods
sector, which will change the structure of production.
This change in the structure of production is explained on the basis of Böhm-Bawerk’s (1889,
reprinted 1959) capital theory, which is the most distinguishing feature of the Austrian theory.
As Boettke (2010) points out, most other macroeconomic schools of thought usually treat
capital (and investment) as homogeneous, while Böhm-Bawerk’s capital theory emphasizes
the heterogeneous and multi-specific nature of capital. Distortions in capital allocation are at
the center of the theory, as credit expansion does not affect all prices at once or in some
random fashion. As Garrison (1989) notes, the price that clears the market for credit and
governs the allocation of capital - the interest rate - is affected first. The change in the interest
rate alters the terms of trade between present and future goods.
This is a problem if policy decisions make the capital market rate (financial or lending rate) of
interest deviate from the natural rate of interest, building upon Wicksell’s (1936, reprinted
1962) distinction between the capital market rate (financial or lending rate) of interest and the
natural rate of interest. When policy decisions make the capital market rate deviate from the
natural rate, an intertemporal coordination problem emerges. As Ebeling (2014) notes, this
happens because interest rates no longer accurately inform market participants about
underlying, real supply and demand conditions.
In line with this deviation of the capital market rate from the natural rate, the trigger of the
business cycle in the Austrian business cycle theory is the cyclical reduction in interest rates
(Garrison R., 1989). This aligns well with studies on sudden stop episodes in emerging
markets, as the dominant role of interest rates in major financial centers like the US in driving
capital inflows to emerging markets has been documented in Fernandez-Arias and Montiel
(1996) and Agenor (1998).
Another parallel between the Austrian theory and the literature on sudden stop episodes is the
recognition of the temporary (self-reversing) character of interest rates. In the context of an
open economy, as Fernandez-Arias and Montiel (1996) note capital flows driven by
temporarily low interest rates in financial centers like the US are likely to be reversed. The
self-reversing character of monetary shocks is also central to the Austrian theory.
Monetary shocks are self-reversing because, as Garrison (1989) explains credit expansion
disturbs the market's distribution of income, and hence spending patterns, which give rise to a
certain pattern of prices. Because the pattern of prices is changed by credit expansion, the
change in relative prices then induces economic agents to reallocate resources to sectors
where prices are rising fastest. However, the increase in these prices is impermanent. The
price increases are not permanent because subsequent rounds of spending of the newly created
money reflect the preferences of income earners, not policy objectives. Hence, prices that
were not initially affected by the monetary injection are eventually bid up, which causes a
reversal in the movement of resources.
These considerations seem to align well with the recognized reversals in international capital
flows, which are driven by changes in world capital market interest rates (Fernandez-Arias &
20
Montiel, 1996). Moreover, they are aligned with empirical regularities (increase in credit,
asset prices and fixed investment) associated with developments in the run up to a sudden
stop crisis. Therefore, the Austrian business cycle theory is used to explain the connection
between international capital flows and macroeconomic instability. This is a rarely used
approach, but there it shows promise that it will shine new light on developments in the run-
up to sudden stop crises.
However, as the Austrian business cycle theory is designed for a closed economy it will have
to be expanded to an open economy. In order to do that the thesis continues with an
exposition of Austrian business cycle theory in a closed economy before expanding it to the
open economy.
2.2 Austrian Business Cycle Theory in a Closed Economy
2.2.1 Introduction
For the originator of the Austrian business cycle theory, Ludwig von Mises (1949, reprinted
1998), the key question to be answered by his theory, was whether it was possible to
permanently lower interest rates through credit expansion? No, is the simple answer. This is
because the rate of interest can only be lowered in the short run, resulting in a temporary
period of prosperity. However, this is followed by a bust in the long run.
The interplay between the short run and the long run has long been a major weakness in the
core of mainstream macroeconomics according to Solow (1997). Solow continues that taking
into account the fact that the short run and the long run merge into one another; they can
never be completely independent. All the while, von Mises (1949) recognized that what
happens in the short run is just the first stage in the chain of successive transformations,
which tend to bring about the long run effects.
Because the long run emerges as a seamless consequence of short runs in Austrian theory, as
Garrison (2001) points out, the Austrian theory manages to couple some propositions of neo-
classical growth models5, which focus on the long run, and propositions derived from
Keynesian insights. The Keynesian idea by which consumption and investment move together
in the short run – to recession or to full employment – is coupled together with the classical
idea of a trade-off between current consumption and investment in each period. The trade-off
recognizes that the economy’s rate of growth can be increased, by foregoing current
consumption and increasing investment (and hence future consumption).
As for the trigger, Hayek (1935) focuses on a credit-induced artificial boom (credit-
expansion) as the cause of the business cycle. Credit is the focal point for Hayek, because
newly created money initially enters the economy by way of credit markets, as Garrison
(2001) points out. Therefore, it affects interest rates first and thus affects the intertemporal
allocation of resources through changes in interest rates.
The intertemporal allocation of resources can also, of course, be influenced by an underlying
real change, for instance, through an increase in savings. An increase in savings lowers
interest rates and shifts consumer purchasing power into the future. Lower interest rates affect
5 Examples of such models are the Solow-Swan model and the Ramsey-Cass-Koopmans model.
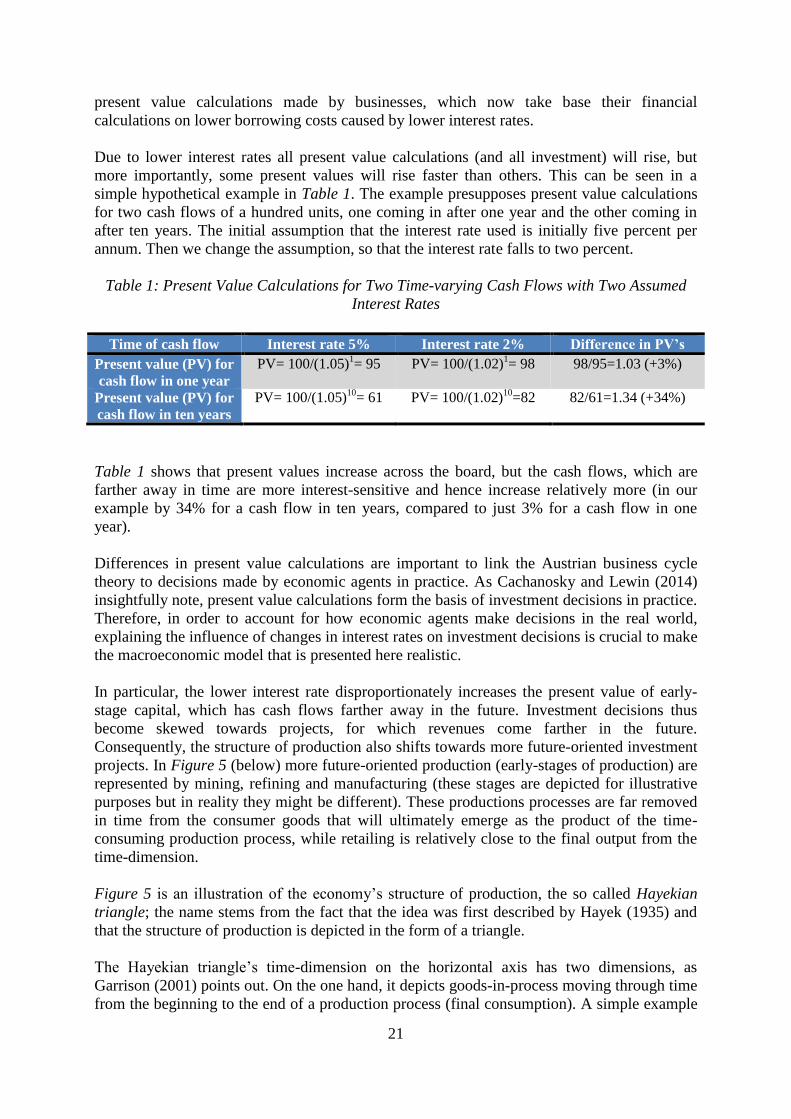
21
present value calculations made by businesses, which now take base their financial
calculations on lower borrowing costs caused by lower interest rates.
Due to lower interest rates all present value calculations (and all investment) will rise, but
more importantly, some present values will rise faster than others. This can be seen in a
simple hypothetical example in Table 1. The example presupposes present value calculations
for two cash flows of a hundred units, one coming in after one year and the other coming in
after ten years. The initial assumption that the interest rate used is initially five percent per
annum. Then we change the assumption, so that the interest rate falls to two percent.
Table 1: Present Value Calculations for Two Time-varying Cash Flows with Two Assumed
Interest Rates
Time of cash flow Interest rate 5% Interest rate 2% Difference in PV’s
Present value (PV) for
cash flow in one year
PV= 100/(1.05)1= 95 PV= 100/(1.02)
1= 98 98/95=1.03 (+3%)
Present value (PV) for
cash flow in ten years
PV= 100/(1.05)10
= 61 PV= 100/(1.02)10
=82 82/61=1.34 (+34%)
Table 1 shows that present values increase across the board, but the cash flows, which are
farther away in time are more interest-sensitive and hence increase relatively more (in our
example by 34% for a cash flow in ten years, compared to just 3% for a cash flow in one
year).
Differences in present value calculations are important to link the Austrian business cycle
theory to decisions made by economic agents in practice. As Cachanosky and Lewin (2014)
insightfully note, present value calculations form the basis of investment decisions in practice.
Therefore, in order to account for how economic agents make decisions in the real world,
explaining the influence of changes in interest rates on investment decisions is crucial to make
the macroeconomic model that is presented here realistic.
In particular, the lower interest rate disproportionately increases the present value of early-
stage capital, which has cash flows farther away in the future. Investment decisions thus
become skewed towards projects, for which revenues come farther in the future.
Consequently, the structure of production also shifts towards more future-oriented investment
projects. In Figure 5 (below) more future-oriented production (early-stages of production) are
represented by mining, refining and manufacturing (these stages are depicted for illustrative
purposes but in reality they might be different). These productions processes are far removed
in time from the consumer goods that will ultimately emerge as the product of the time-
consuming production process, while retailing is relatively close to the final output from the
time-dimension.
Figure 5 is an illustration of the economy’s structure of production, the so called Hayekian
triangle; the name stems from the fact that the idea was first described by Hayek (1935) and
that the structure of production is depicted in the form of a triangle.
The Hayekian triangle’s time-dimension on the horizontal axis has two dimensions, as
Garrison (2001) points out. On the one hand, it depicts goods-in-process moving through time
from the beginning to the end of a production process (final consumption). A simple example

22
of the goods-in-process from the earlier production process to the final consumer good: The
farmer sells grain to the miller; the miller sells flour to the baker; the baker sells cases of
bread to the grocer, and the grocer sells individual loaves to the consumer (Garrison, 2001).
On the other hand, it can represent the separate stages of production, each of which exists in
the present, each of which aims at consumption at different points in the future.
Figure 5: The Structure of Production with a Value-Dimension (Vertical Axis) and a Value-
Time-Dimension (Horizontal Axis)
Source: R. Garrison, Time and Money: The Macroeconomics of Capital Structure, 2001, p. 47.
As was already mentioned a change in interest rates affects every stage of production.
However, the early-stages of production are more sensitive to changes in interest rates than
the late-stages (closer to the consumer).
The main issue is, whether these interest rate changes are sustainable. In the case, where the
underlying change is an increase in real savings, these changes are sustainable. This is
because consumers have curtailed their consumption in the present in order to consume more
in the future. The intertemporal coordination of consumption decisions and investment
decisions is thus aligned. This is based on Wicksell’s (1936, reprinted 1962) idea of the
natural interest rate (it cannot be directly observed), which is consistent with the time
preferences of consumers and resource scarcities.
However, the capital market rate (which we can observe) can diverge from natural interest
rate because of monetary shocks. These monetary shocks, as Hayek (1937) explained, are
problematic that they are self-reversing in the sense that they trigger changes, which will have
to be reversed because they are not based on any corresponding change in the underlying real
facts.
The problem with changing the capital market rate is that economic agents have a hard time
distinguishing between a change in interest rates induced by an underlying real change – an
increase in savings (also technology or other factors), and when the underlying change is
monetary – the expansion of credit. This is because the expansion of credit depresses interest
rates, which send the same price signal to economic agents, as an increase in savings.
Therefore, people making investment decisions miscalculate the present values in favor of
more future-oriented (roundabout) production processes.

23
In this context of decision making of economic agents in real life, it is important to note that
the horizontal axis in Figure 5 does not measure pure time, but value-time (production time).
This concept of value-time was first developed by Böhm-Bawerk (1889, reprinted 1959), who
named it roundaboutness (labeled production time in Figure 5). As Cachanosky and Lewin
(2014) explain, the concept of value-time in the Austrian theory is similar to Hicks’s (1939)
concept of the average period of an asset, which was built upon Böhm-Bawerk’s work, while
both concepts are very similar to the more well-known concept of Macauley duration.
Therefore, one way to interpret the horizontal axis in Figure 5 would be that it represents
Macauley duration.
Going back to the model, it is important to note that if the expansion of credit is not based on
an increase in savings and is a consequence of an increase in the money supply, the
configuration of the economy’s production structure will ultimately prove to be unsustainable.
This is because of the aforementioned miscalculations of present values by entrepreneurs,
whose forecasts are now based on a lower interest rate (induced by money supply growth). In
time, their forecasts prove to be erroneous, as there has been no change in intertemporal
consumer preferences towards more future-oriented consumption (i.e. an increase in savings)
that would align with more future-oriented production structure that now exists.
Therefore, entrepreneurs err because their financial calculations are distorted by policy
decisions, as lower interest rates give a signal to entrepreneurs, who based on the interest rate
signal might be tempted to decide on a different investment project than they would have if
the interest rate had remained constant. Investors are now biased toward engaging in more
interest sensitive projects (more capital intensive and time intensive). Hence, the
overexpansion of production in more interest sensitive industries occurs (early-stage
industries, the example in Figure 5 is mining, which is a capital intensive and time intensive
industry).
The error is recognized when the lack of anticipated future demand is revealed. This
systematic cluster of entrepreneurial errors, as opposed to regular and relatively milder
business fluctuations, is the telltale sign of the business cycle according to Rothbard (1963a,
reprinted 2000).
As Boettke (2010) notes, Austrian theorists hence emphasize the mismatch between the
heterogeneous capital goods structure in place due to credit expansion and the structure,
which should exist to satisfying consumer demand. Therefore, the credit-induced boom turns
into a bust, not because of insufficient aggregate demand, but because there is not enough
demand for the consumer goods produced by the existing combinations of capital goods. A
costly reallocation must hence take place, to correct the mistakes made in the boom phase of
the business cycle.
2.2.2 The Effects of Credit Expansion on the Structure of Production
A simple graphical framework for analyzing the effects of credit expansion on the economy in
line with the Austrian theory of the business cycle was developed by Garrison (2001).
Garrison (2001) achieved this by combining the Hayekian triangle (illustrates the structure of
production), the credit market (represented by the loanable-funds market6) and an augmented
6 In the loanable funds market the interest rate is equivalent to the price of loans, which is determined by the
supply and demand such loans.
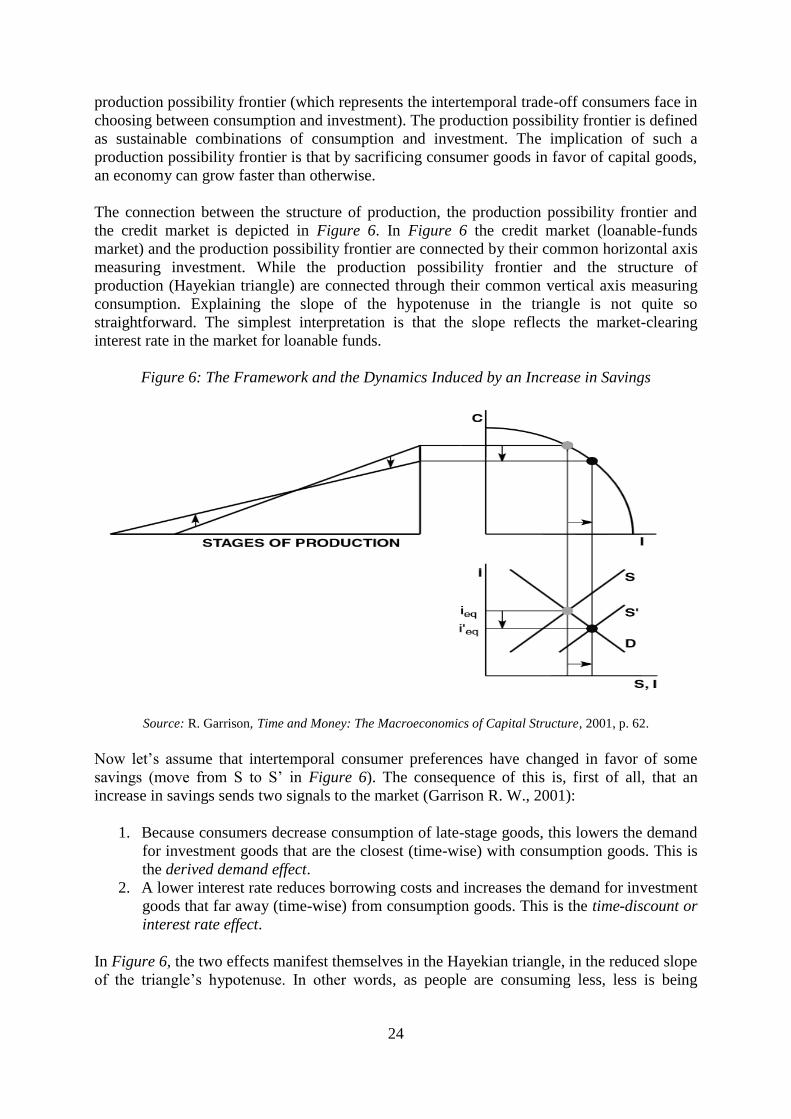
24
production possibility frontier (which represents the intertemporal trade-off consumers face in
choosing between consumption and investment). The production possibility frontier is defined
as sustainable combinations of consumption and investment. The implication of such a
production possibility frontier is that by sacrificing consumer goods in favor of capital goods,
an economy can grow faster than otherwise.
The connection between the structure of production, the production possibility frontier and
the credit market is depicted in Figure 6. In Figure 6 the credit market (loanable-funds
market) and the production possibility frontier are connected by their common horizontal axis
measuring investment. While the production possibility frontier and the structure of
production (Hayekian triangle) are connected through their common vertical axis measuring
consumption. Explaining the slope of the hypotenuse in the triangle is not quite so
straightforward. The simplest interpretation is that the slope reflects the market-clearing
interest rate in the market for loanable funds.
Figure 6: The Framework and the Dynamics Induced by an Increase in Savings
Source: R. Garrison, Time and Money: The Macroeconomics of Capital Structure, 2001, p. 62.
Now let’s assume that intertemporal consumer preferences have changed in favor of some
savings (move from S to S’ in Figure 6). The consequence of this is, first of all, that an
increase in savings sends two signals to the market (Garrison R. W., 2001):
1. Because consumers decrease consumption of late-stage goods, this lowers the demand
for investment goods that are the closest (time-wise) with consumption goods. This is
the derived demand effect.
2. A lower interest rate reduces borrowing costs and increases the demand for investment
goods that far away (time-wise) from consumption goods. This is the time-discount or
interest rate effect.
In Figure 6, the two effects manifest themselves in the Hayekian triangle, in the reduced slope
of the triangle’s hypotenuse. In other words, as people are consuming less, less is being

25
produced for immediate consumption. On the other hand, people are saving up for future
consumption, and hence, production is aligned to meet that future demand.
Analyzing the growth dynamics of the economy through this framework reveals that a change
in consumer intertemporal preferences, in this case – an increase in savings – can change the
structure of production. As an increase in savings increases the supply of loanable funds, the
new equilibrium interest rate is now lower, which induces the businesses to borrow more and
increase investment. As resources are limited, the increased investment has to come at the
cost of a decrease in consumption.
These changes also change the structure of production, as more investment goes into early-
stages of production (relatively far from the consumer in the time-dimension), which are the
most sensitive to changes in interest rates (the present values increase relatively faster than in
the early-stages). It is also important to note that increased savings imply increased
consumption sometime in the future (what for and when is uncertain) and therefore imply an
increase in the profitability of ventures aiming to meet that future consumption demand.
What is crucial here though, as Garrison (2001) states is that the lower interest rate, which
reflects itself in a shallower slope of the triangle’s hypotenuse, favors relatively long-term
investments. Resources are bid away from late-stages of production, where demand is weak
because of the currently low consumption, and into early-stages, where demand is strong
because of the lower rate of interest.
We can notice some of the same dynamics as an increase in savings induces, when it comes to
the effects of the expansion of credit on the economy, but there are some crucial differences.
Figure 7 depicts the economy’s response to a policy-induced expansion of credit, assuming
constant technology and consumption-savings preferences.
Figure 7: Consequences of Credit Expansion on the Structure of Production
Source: R. Garrison, Time and Money: The Macroeconomics of Capital Structure, 2001, p. 69.

26
The first point to make here is that an increase in the money supply first shows up in credit
markets. The second point is that the effects at first seem similar to the effects of an increase
in savings. However, there are crucial differences in the effects of credit expansion on the
economy. Here an attempt is made to explain the effects step-by-step.
In Figure 7, the direct effect of increased lending is a movement of the supply side in the
loanable-funds market (lower right diagram) rightward from S to S+ΔMc (ΔMc denotes new
money in the form of additional credit). Note that the movement of the supply curve appears
even though there is no sacrifice in reduced consumption, which would free up resources to
be used elsewhere in the economy.
Nevertheless an increased supply of credit (loanable funds) causes a fall in interest rates,
which causes an increase in business borrowing. In the diagram there is a move from the
black point (S, D) to the white point (S+ΔMc, D). All the while the lower interest rate
discourages savings, in the diagram this is shown as a move from the black point (S, D) to the
intersection between S and i’ (artificially low rate). Another effect of credit expansion (not
depicted in Figure 7) is that has uneven effects on different labor markets, with the early-
stage (the most interest-sensitive) production processes receiving a boost in employment and
wages relative to other stages of production.
Therefore, the key difference in Figure 6 and Figure 7 is between the dynamics of savings
and investment. With intertemporal preferences being constant, two opposing forces come
into play. The lower interest rate induces savings to decrease while the expanding supply of
credit increases investment. Whereas investment moved in the same direction as savings in
the case of a change in intertemporal preferences, investment now moves in the opposite
direction. In other words, the loanable funds market malfunctions and there is a wedge
between savings and investment. The market process fails to coordinate.
On the production possibility frontier (upper right diagram in Figure 7), higher investment
demand for credit translates to higher investment and a clockwise movement along the
production possibility frontier. However, as Salerno (2012) points out, over-consumption is
also another important feature of the boom.
There are two explanations for the over-consumption during the boom. The credit boom, as
von Mises (1949) noted, distorts monetary calculation and causes entrepreneurs and
households alike to overestimate their income and net worth (i.e. wealth effect). Garrison
(2001) provides an alternative explanation for overconsumption during the boom phase. He
attributes the growing consumption during the boom to the lower interest rate, which
incentivizes consumers to save less and consume more, which would translate to a
counterclockwise movement along the production possibility frontier. In any case, the
ultimate result is that both consumption and investment increase simultaneously, pushing the
economy above the production possibility frontier.
Focusing attention now on the Hayekian triangle (structure of production), the lower interest
rate stimulates investment in the early- (interest-sensitive) stages. On the other hand,
consumer demand draws resources to the late-stages. Thus, the boom is characterized by
overconsumption and overinvestment simultaneously.
However, the most important aspect of the boom is not over-investment, but malinvestment.
Malinvestment, which is defined as a misallocation of the capital structure, because the capital
27
is misallocated in the sense that it is no longer in line with the intertemporal preferences of
consumers. As Oppers (2002) points out, the capital structure is, therefore, unsustainable. The
unsustainability, as Rothbard (1995) notes, is the result of credit expansion which occurs
through loans to businesses and causes an overinvestment in capital goods, especially in such
areas as construction, long-term investments, machine tools, and industrial commodities.
Also, since the ownership of stocks and real-estate ownership is a title to capital goods, there
tends to be an excessive boom in the stock and real-estate markets as well. On the other hand,
there is a relative under-investment in consumer goods industries.
The result of this imbalance is that the temporary economic boom cannot last. This is the case
because investment projects that are initiated will experience disappointment in the future,
when the expected future demand will fail to materialize (the consumers did not postpone
their consumption as the interest rate signaled; hence, resources were misallocated). This will
become clear when the average default risk of investment will gradually increase. As
Hoffmann and Schnabl (2011) point out, the default rate goes up because resources in the
economy are not unlimited. Therefore, the capital market rate will have a tendency to return to
the natural rate in the long run (absent additional extra-market interventions).
This tendency persists as Rothbard (1963a, reprinted 2000) stresses because the suppression
of the capital market rate did not change intertemporal preferences. Hence, market forces push
the capital rate back towards the natural rate. A higher rate of interest now makes the
expanded investments in the higher stages unprofitable. However, consumers’ preferences
require a shift from capital goods to consumer goods industries. To achieve this requires the
liquidation of the unprofitable investments made, a most unfortunate consequence of the
boom, as this means a recession will ensue.
3 THE INTERNATIONAL MONETARY TRANSMISSION
MECHANISM
3.1 Austrian Business Cycle Theory in the Open Economy
In the previous chapter, a description of the Austrian business cycle theory in the closed
economy was given. The closed economy model of the theory is relatively well-known ever
since Hayek popularized it in his work Prices and Production (1935). However, an open
economy version of the theory is not well-developed yet. The development of an open
economy version of the theory that focuses on the effects of credit expansion in center (core)
economies on peripheral economies has only occurred very recently. The lion’s share of the
development has been made in the works of Hoffmann and Schnabl (2011) and Cachanosky
(2012a). Still, traces of the development of an open economy version of the Austrian business
cycle theory have already been found in Hayek (1937) and Heilperin (1939).
The main difference between the Austrian business cycle theory in a closed economy and an
open economy is that involves the cross-border transmission of the increased supply of credit
from the core economy to the periphery economy. Expanding the supply of credit, with the
accompanying low interest (funding) rates, in the core countries might not help to lift
domestic investment activity if investors have a bleak outlook for the domestic economy; thus
domestic investment demand remains low.

28
According to Steil (2007), the reason behind this is that the policy of creating new (additional)
credit to stimulate domestic growth in the core economies is ineffective if this new credit
leaks out in the form of capital outflows. In a similar manner, Portes (2012) emphasizes, that
with integrated world financial markets, the low funding rates in world financial centers can
spur investment demand in peripheral economies, for which investors forecast a highly
growing economy, with accompanying high yields for investors.
Peripheral economies are thus on the receiving end of large capital inflows from core
economies, which can be problematic due the instability of these capital inflows. As
Hoffmann (2014) points out, in countries with pegged currencies, foreign investment and
credit expansion translate into higher wages. However, if the exchange rates are floating, their
flexibility brings the danger of a currency’s rapid appreciation. To prevent rapid appreciation,
central banks in small (and medium) open economies often follow interest rates cuts in core
countries with their own cuts in interest rates.
The drop in interest rates then naturally encourages more investment, consumption and the
incentive to borrow against future income. This poses a problem of excessive borrowing,
because imports accelerate and the current account turns negative, with new money from
abroad fueling asset-price and CPI7 inflation at home. As Reinhart (2013) notes, the problem
with all this is that these credit booms are bound to end when market interest rates in the core
(funding) economies rise.
Following Hoffmann and Schnabl (2011) and Cachanosky (2012a) a simple model will be
developed building on the foundation of the Austrian business cycle theory in a closed
economy. In a closed economy, as has been seen, the expansion of credit is transmitted to
economic agents through the change in interest rates. Similarly, changes in interest rates by
major central banks affect international interest rates and in turn, major economies affect
economic conditions in small open economies.
However, when it comes to more than one economy, we also have to take into account the
foreign exchange channel (Cachanosky, 2013). While the interest rate channel implies a
change in the structure of production, the foreign exchange channel brings about a change in
the relative prices of tradable and non-tradable goods and services.
Therefore, the extended open economy framework, assumes two countries, a center (big)
country and a peripheral (small) country. Furthermore, these two countries each have their
own currencies, which are linked by exchange rates. The exchange rate regimes under the
modern institutional environment have to be taken into account. Historically, the exchange
rate regimes of peripheral countries have been pegged exchange rates (e.g. East Asian
countries in the 1990s), or a managed floating regime. Though, these managed floating
regimes are only de jure floating. Acknowledging the fear of floating phenomenon as
identified by Calvo and Reinhart (2002), they are very far from fully floating in reality.
The reason behind this is that assuming a credit expansion in the center economy, there will
be pressure for the periphery currency to appreciate. Appreciation can have negative effects
on domestic exporters, which entices the periphery central bank to intervene. The intervention
is in the form of exchanging domestic currency (monetary expansion) for foreign currency,
with the foreign currency accumulating in the balance sheet of the central bank. In this way,
7 CPI – Consumer Price Index.

29
the monetary policy of the center economy is in effect exported to the periphery economy. As
Hoffmann and Schnabl (2011) observe, in our modern asymmetric monetary system periphery
economies usually either follow a policy of fixed exchange rates to center currencies or a
policy of discretionary interventions in foreign exchange markets by periphery central banks
to stabilize exchange rates.
3.2 Convergence through the Interest Rate Channel
First, to set up a framework for analysis let’s show the effects of international borrowing, if
there are no monetary policy actions in either the core economy or the periphery economy.
Following Hoffmann and Schnabl (2011), let’s assume that we are dealing with two
economies, in the first individuals save more on average, while in the second they save
relatively less. With closed capital markets, this would imply a lower interest rate in the
country with higher savings. For now let’s assume that the center (core) economy has a higher
savings rate (it does not affect the analysis) and for the sake of simplicity, to avoid size
effects, let’s assume that the center and a group of periphery economies are of equal size.
However, with open capital markets, borrowers in the relatively high interest rate country
(debtor economy) can take advantage of lower interest rates in the creditor economy. While
investors in the low interest rate country can take advantage of the higher expected returns on
investment (interest rates) in the high interest economy. The international borrowing in this
case is the result of different preferences between consumption and savings (investment)
between the economies.
The high savings economy is an exporter of capital and becomes a creditor economy. On the
other hand, the periphery economy imports capital and becomes a debtor economy. A
convergence process takes place, with a common world interest rate.
This is illustrated in Figure 8 below. The convergence process is depicted under the
assumption that international capital markets are initially closed. With closed capital markets,
the creditor country has the capital market interest rate at icc0 (at which S
c0=I
c0) and the debtor
country at id
c0 (at which Sd0=I
d0). With open capital markets, the interest rates converge to a
common world capital market rate iw
c1=icc1=i
dc1.
Figure 8: Convergence of International Capital Market Interest Rates
Source: A. Hoffmann and G. Schnabl, National Monetary Policy, International Economic Instability and
Feedback Effects - An Overinvestment View, 2011, p. 7.

30
The creditor country exports CXc1 capital, while CM
d1 of capital is imported by the debtor
country. The interest rate in the creditor country increases from icc0 to i
cc1, which is equal to
iw
c1. The increased interest rate increases the incentive to save and saving increases from Sc0
to Sc1 while part of domestic investment is replaced by foreign investment (I
c1<I
c0).
Whereas in the debtor economy, the lower interest rate discourages savings (Sd
0<Sd1) and
promotes investment (Id
1>Id
0). The savings-investment gaps appear in each country from an
international perspective savings and investment are balanced. This balance, as McKinnon
and Pill (1997) observe, ensures that resources are efficiently allocated internationally.
Therefore, in this case, international capital mobility is beneficial as it provides capital from a
capital-abundant country to a country with a shortage of capital, in the process stimulating
investment and growth in the receiver of capital inflows and higher expected returns for
investors from the creditor country. International capital flows thus contribute to higher
welfare on both sides.
3.3 Transmission of International Credit Booms through the Interest Rate
Channel
Unfortunately, the optimistic scenario described above is not the only possible outcome of the
liberalization of international capital flows. As Hoffmann (2010) and Löffler et al. (2010)
point out, the problem arises when credit expansion and the consequent reduction in interest
rate in the center (funding) countries is transmitted into small open economies with
underdeveloped capital markets via capital inflows. The inflows of foreign capital can thus
serve as a vehicle for exporting credit booms in center economies abroad.
Therefore, while the trigger is now external, in the case where lower interest rate are a
consequence of an expansionary monetary policy of central banks, which aim to boost
domestic growth, the end results are similar as in the analysis of the Austrian business cycle
theory in the closed economy.
Following Hoffmann and Schnabl (2011), the starting point for analyzing the internationally
transmitted credit boom is the convergence of interest rates analyzed in Figure 8 above, where
the world natural rate (which equilibrates world savings with world investment) is the same
for both economies. The difference is that now the central bank in the center (creditor)
country lowers its policy rate iccb2 below the world natural rate i
wn1. In response to the lower
interest rate iccb2 the financial sector creates additional credit
c1. The supply of credit S
c2' is
now increased by c1 to S
c2. The additional credit has the same impact on the credit markets
as an increase in savings (without the underlying real change), thus the supply of credit
increases from Sc1 to S
c2. As a result, the world capital market interest rate falls from i
wc1 to
iw
c2 as is shown in Figure 9 below.
Due to lower world interest rates, investment activities are stimulated in both countries (from
Ic1 to I
c2 and from I
d1 to I
d2) while savings fall in both countries (from S
c1 to S
c2 and S
d1 to S
d2).
Capital exports of the center economy rise even more and that reflects itself in an even higher
current account surplus by moving from CAc1 to CA
c28 while in the periphery the current
8 The equation for the current account is now the following: CA
c2 = S
c2 - I
c2.
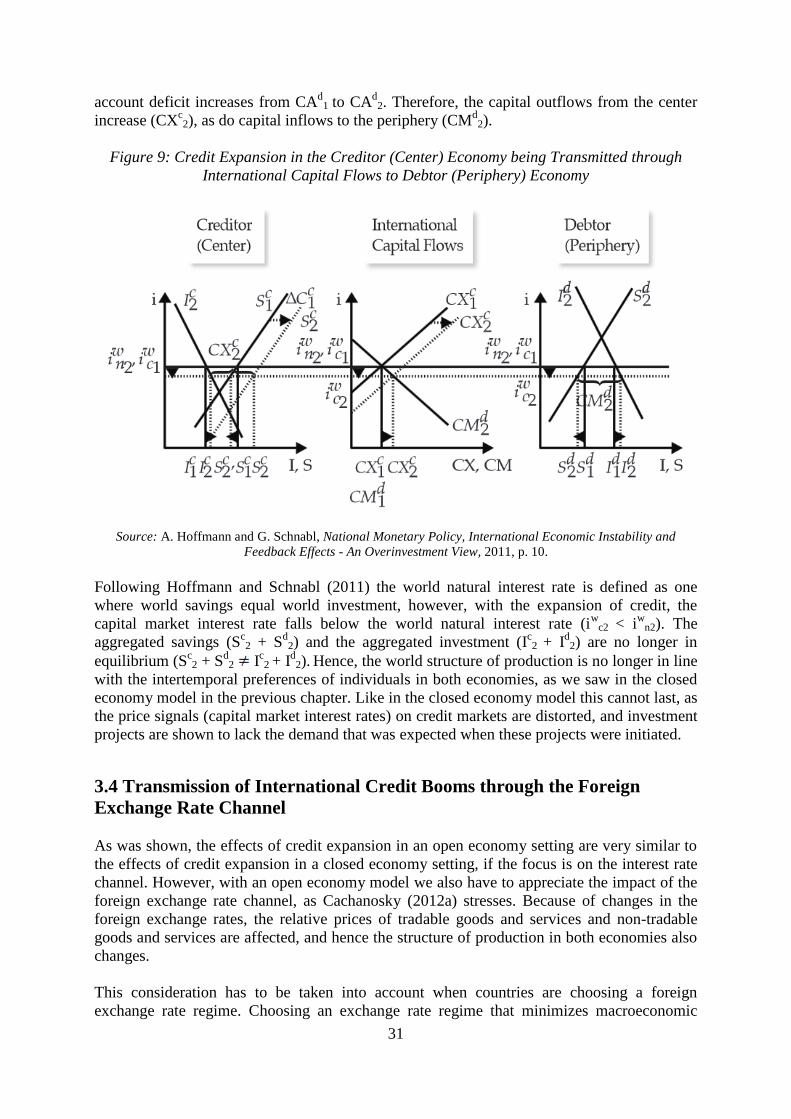
31
account deficit increases from CAd
1 to CAd
2. Therefore, the capital outflows from the center
increase (CXc2), as do capital inflows to the periphery (CM
d2).
Figure 9: Credit Expansion in the Creditor (Center) Economy being Transmitted through
International Capital Flows to Debtor (Periphery) Economy
Source: A. Hoffmann and G. Schnabl, National Monetary Policy, International Economic Instability and
Feedback Effects - An Overinvestment View, 2011, p. 10.
Following Hoffmann and Schnabl (2011) the world natural interest rate is defined as one
where world savings equal world investment, however, with the expansion of credit, the
capital market interest rate falls below the world natural interest rate (iw
c2 < iw
n2). The
aggregated savings (Sc2 + S
d2) and the aggregated investment (I
c2 + I
d2) are no longer in
equilibrium (Sc2 + S
d2 I
c2 + I
d2). Hence, the world structure of production is no longer in line
with the intertemporal preferences of individuals in both economies, as we saw in the closed
economy model in the previous chapter. Like in the closed economy model this cannot last, as
the price signals (capital market interest rates) on credit markets are distorted, and investment
projects are shown to lack the demand that was expected when these projects were initiated.
3.4 Transmission of International Credit Booms through the Foreign
Exchange Rate Channel
As was shown, the effects of credit expansion in an open economy setting are very similar to
the effects of credit expansion in a closed economy setting, if the focus is on the interest rate
channel. However, with an open economy model we also have to appreciate the impact of the
foreign exchange rate channel, as Cachanosky (2012a) stresses. Because of changes in the
foreign exchange rates, the relative prices of tradable goods and services and non-tradable
goods and services are affected, and hence the structure of production in both economies also
changes.
This consideration has to be taken into account when countries are choosing a foreign
exchange rate regime. Choosing an exchange rate regime that minimizes macroeconomic

32
volatility depends on the nature of the shock. Calvo and Mishkin (2003) outline the common
theory in modern literature, which suggests that a country should choose a fixed exchange
rate regime in the case of a monetary shock while a floating exchange rate regime is better for
dealing with real shocks. If the shock emanating in another country is not real, hence it is
monetary (nominal), then this monetary shock is transmitted into the real sector through a
change in the foreign exchange rate.
However, a change in the foreign exchange rate impacts tradable and non-tradable goods
differently. Therefore, the relative prices between tradable and non-tradable goods change as
well. While the change in relative prices would be desirable in the case of a real shock (e.g.
productivity change), as it would speed up the adjustment to real conditions, monetary shocks
only bring about a temporary change in conditions because they are unwarranted by real
conditions. It is in this vein that Hayek (1937) characterizes monetary shocks as self-reversing
because the change that the monetary shock triggered is out of line with consumer demand,
productivity and other real factors.
Not real factors, but monetary shocks are the primary driver of business cycles in the Austrian
business cycle theory as was described in previous sections. Therefore, to avoid the
transmission of business cycles through the foreign exchange channel, Calvo and Mishkin
(2003) would recommend that countries adopt a fixed exchange rate regime.
However, as has been stated in Cachanosky (2012a), using the Austrian business cycle theory,
which highlights the heterogeneous nature of capital goods and focuses on changes in relative
prices, can explain changes in the capital structure. By focusing on changes in the structure of
capital, further insights can be gained on the process by which monetary shocks in other
countries manifest themselves through the foreign exchange rate channel by changing the
relative prices, and therefore the relative shares of output between tradable and non-tradable
goods.
To analyze changes in the tradable and non-tradable goods sectors under an external monetary
shock, another dimension has to be added to the Hayekian triangle (Figure 5). The Hayekian
triangle is two-dimensional, which is enough to capture the effect of the interest rate channel
discussed in Chapter 4.1.2 (over-consumption, over-investment and a distorted structure of
production). However, as Cachanosky (2012a) stresses, simultaneously to this process, in an
open economy setting changes are also occurring through the foreign exchange channel.
Hence, a third dimension has to be added to the Hayekian triangle to capture the changes in
relative prices (and relative shares) between tradable and non-tradable capital goods.
Therefore, a three-dimensional framework is illustrated in Figure 10 and Figure 11 below,
with the Hayekian triangle and an additional third dimension measuring the share of capital
goods assigned to tradable and non-tradable industries. The share of capital goods assigned to
produce non-tradable industries is colored light grey, while the share of tradable industries is
colored dark grey. The medium grey represents the share that is reallocated to tradable (or
non-tradable) industries after the credit expansion in the center economy takes place. The
solid lines in Figure 10 and Figure 11 represent the starting point in both economies, while
the dashed lines represent the change due to the expansionary monetary policy in the center
economy.
For the sake of simplicity, at the starting point (pre-shock), both economies produce tradable
(1/2) and non-tradable goods (1/2) in an equal ratio. This ratio changes, after we introduce an
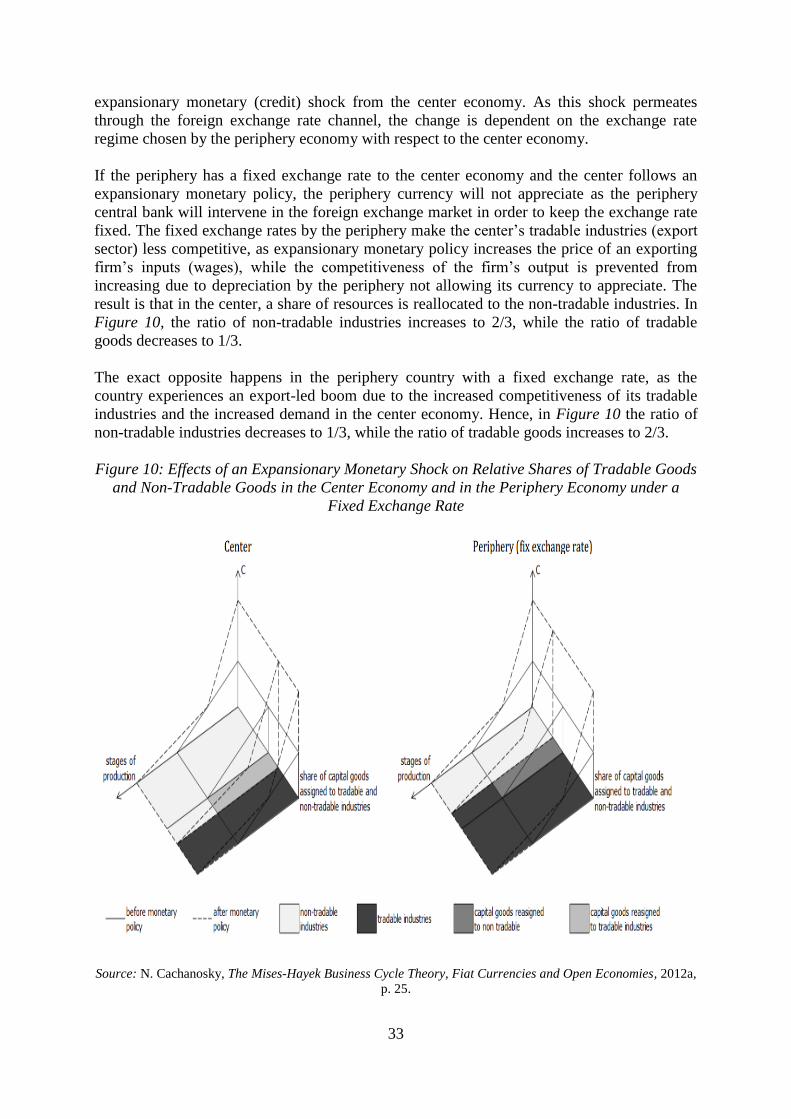
33
expansionary monetary (credit) shock from the center economy. As this shock permeates
through the foreign exchange rate channel, the change is dependent on the exchange rate
regime chosen by the periphery economy with respect to the center economy.
If the periphery has a fixed exchange rate to the center economy and the center follows an
expansionary monetary policy, the periphery currency will not appreciate as the periphery
central bank will intervene in the foreign exchange market in order to keep the exchange rate
fixed. The fixed exchange rates by the periphery make the center’s tradable industries (export
sector) less competitive, as expansionary monetary policy increases the price of an exporting
firm’s inputs (wages), while the competitiveness of the firm’s output is prevented from
increasing due to depreciation by the periphery not allowing its currency to appreciate. The
result is that in the center, a share of resources is reallocated to the non-tradable industries. In
Figure 10, the ratio of non-tradable industries increases to 2/3, while the ratio of tradable
goods decreases to 1/3.
The exact opposite happens in the periphery country with a fixed exchange rate, as the
country experiences an export-led boom due to the increased competitiveness of its tradable
industries and the increased demand in the center economy. Hence, in Figure 10 the ratio of
non-tradable industries decreases to 1/3, while the ratio of tradable goods increases to 2/3.
Figure 10: Effects of an Expansionary Monetary Shock on Relative Shares of Tradable Goods
and Non-Tradable Goods in the Center Economy and in the Periphery Economy under a
Fixed Exchange Rate
Source: N. Cachanosky, The Mises-Hayek Business Cycle Theory, Fiat Currencies and Open Economies, 2012a,
p. 25.

34
Figure 11: Effects of an Expansionary Monetary Shock on Relative Shares of Tradable Goods
and Non-Tradable Goods in the Center Economy and in the Periphery Economy under a
Floating Exchange Rate
Source: N. Cachanosky, The Mises-Hayek Business Cycle Theory, Fiat Currencies and Open Economies, 2012a,
p.26.
If the periphery chooses a floating exchange rate relative to the center, the transmission of an
expansionary monetary shock is just the opposite than in the case of fixed exchange rates.
With the periphery allowing its currency to appreciate in response to the center’s
expansionary monetary policy, the center’s depreciated currency stimulates its tradable goods
industry. The ratio of tradable industries in the center thus increases to 2/3, while the non-
tradable industries decrease to 1/3. On the other hand, the periphery’s non-tradable industries
are stimulated by the appreciated currency and purchasing power of the periphery’s citizens
while its tradable goods industries are hurt by the appreciation. The result is a reallocation
towards the non-tradable sector (2/3), while the tradable industries shrink (1/3).
Therefore, credit expansion in the center economy distorts the structure of production in
different ways depending on the exchange rate regime. However, the point is that credit
expansion will eventually have to come to an end as credit expansion cannot permanently
suppress the rate of interest. In the meantime though, entrepreneurs in both economies will
receive false price signals in two forms. First, in the form of suppressed interest rates that
will lead to overconsumption, overinvestment and a misallocation of resources towards more
future-oriented (interest-sensitive) early-stages of production. Second, in the form of changes
in the foreign exchange rate, which are due to monetary interventions from the center (in the
case of floating exchange rates) or a reactionary monetary intervention from the periphery (in
the case of fixed exchange rates).
35
4 INTERNATIONAL CAPITAL FLOWS IN PERIODS OF
GLOBALIZATION
4.1 Empirical Methodology
In Chapter 2, the Austrian business cycle theory in a closed-economy setting was presented
while in Chapter 3 the theory was extended to the open economy setting. In this chapter, the
aim is to determine how well the theory stacks up to empirics. Exploring empirics inevitably
leads to the question of what to look for given the theory. The main problem the theory is set
up to explore is whether credit expansion in a creditor (center) economy can create a credit-
induced business cycle in the debtor (periphery) economy by way of capital inflows to the
periphery economy.
That is why we have to look for evidence of (i) loose global liquidity conditions in key
financial centers, (ii) big international capital inflows to the periphery economies, (iii) high
growth of money and credit in the periphery economies and (iv) macroeconomic instability
due to the first three conditions being present.
Therefore, in line with the theoretical model, we have to look for relatively loose credit
conditions in the center (creditor) economy, large capital inflows to the periphery economy
and a credit boom in the periphery economy. When it comes to the credit boom, we have to be
cautious as high credit growth to the private sector could also be a consequence of financial
deepening (Beck et al. 2000), new technology or institutional change.
Likewise Eichengreen and Mitchener (2003) point out that a high growth rate of credit is not
necessarily an indication of a credit boom, even though high credit growth is a necessary
condition for a credit boom. However, there are some quantitative measures, which indicate
that a credit boom is occurring. When analyzing the boom in the 1920s prior to the Great
Depression, Eichengreen and Mitchener (2003) employ the following measures:
1. Money/GDP ratio,
2. Investment/GDP ratio,
3. The movement of asset prices.
We have to be careful in using the first measure, the Money/GDP ratio. As Schularick and
Taylor (2009) found out in their econometric study of credit booms from 1870 to 2008, in the
post-WWII period structural changes occurred in the financial system occurred that changed
the relationship between money and credit. These changes caused credit growth to decouple
from money supply growth. This implies that while money supply growth is a good measure
of credit growth in the 1870-1914 period, it is less so for the post-1980 era.
Additionally we have to look at changes in the structure of production. The theoretical
expectation of an increase in investment and consumption to occur simultaneously, but not
only that, as the production and prices of capital goods (early-stages of production), should
rise relative to the production and prices of consumer goods (late-stages of production).
In practice, however, delineating industries according to their position in the stages of
production (Hayekian triangle) is not straightforward. In the empirical literature, two
approaches have been identified. Cachanosky and Lewin (2014) list two approaches. The first
36
is to identify industries in the different stages of production and compare their dynamics. The
second approach is to identify industries according to their interest rate sensitivity, with the
expectation that the rate of growth in more interest-sensitive industries like finance, real
estate, construction should outpace other sectors like manufacturing, retail and services.
Finally, from the perspective of the transmission of credit booms through the foreign
exchange channel, we have to look for evidence of differences in allocation between the
tradable and non-tradable sectors. The expectation is that periphery countries that fix their
exchange rates to a center economy should experience higher growth in the tradable goods
sector relative to the non-tradable goods sector. On the other hand, a periphery country with a
fully floating exchange rate should experience higher growth in the non-tradable goods sector
relative to the tradable goods sector. That is because it allows capital inflows to have an
appreciation effect on its currency relative to the center country’s currency.
4.2 Crises and International Capital Flows in the First Era of Financial
Globalization (1880-1914)
The explanations of systemic financial crises connected with capital inflows from abroad
(sudden stops) are usually based on recent experience. However, remember that we are not
living in the first period of globalization. In the pre-WWI period, globalization was
comparable in scale to the modern globalization period and so was the size of international
capital flows. It is because of this similarity that we venture to study the first period of
financial globalization, to explore if such crises were also present back then.
At the time, increased lending from Great Britain and other major European countries was
underway in a time when the economic situation in Western Europe was depressed. The
depression led to low interest rates and sluggish investment in the core countries. Therefore,
as Bordo (2006) points out, the depressed situation in the core made the higher rates of return
in the periphery economies (the Americas and Australasia at the time) very attractive for
investors. However, the lending was significantly reduced at the end of the 1880s as the
European economy recovered, and investment opportunities reappeared.
In the 1879-1914 period the world had relatively free flows of capital between countries and
the financial markets of major industrial countries were integrated to a large extent. The
modern period of globalization resembles the late-nineteenth and early-twentieth century in
terms of the volume of international capital flows (scaled by GDP) and in the lack of
restrictions that inhibit the free international flow of capital. As the level of financial
integration back then was very similar to modern times, this begs the question as to whether
sudden stop crises were also present in the late-nineteenth century (Mitchener & Weidenmier,
2006).
Indeed, crises characterized by a sharp stop of capital flows, which we now call sudden stops,
have indeed occurred during the first era of globalization according to Bordo (2006). There is
a striking resemblance in the events in emerging markets in the late 1880s and the early 1890s
to the ones today. Namely, in the late nineteenth century many emerging markets experienced
drastic declines and reversals in capital flows from the core countries such as Great Britain,
Germany and France. Consequently many emerging markets experienced currency, financial
and debt crises, which are reminiscent of the modern era of globalization.
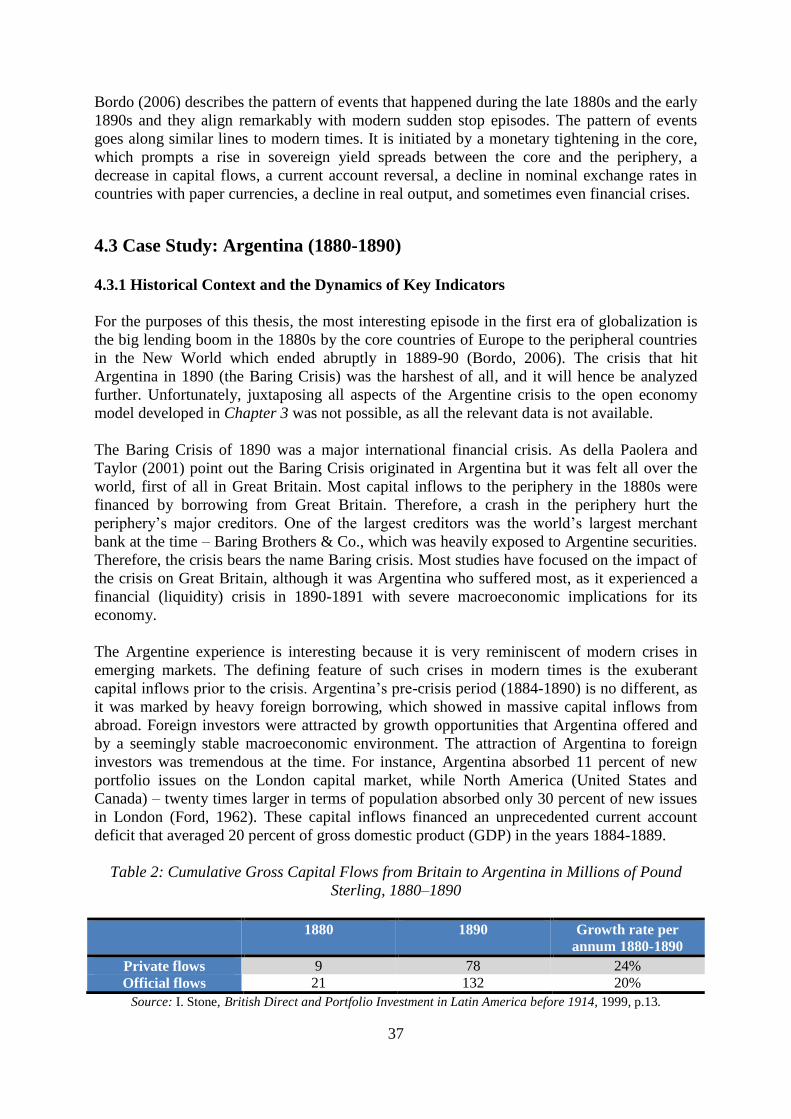
37
Bordo (2006) describes the pattern of events that happened during the late 1880s and the early
1890s and they align remarkably with modern sudden stop episodes. The pattern of events
goes along similar lines to modern times. It is initiated by a monetary tightening in the core,
which prompts a rise in sovereign yield spreads between the core and the periphery, a
decrease in capital flows, a current account reversal, a decline in nominal exchange rates in
countries with paper currencies, a decline in real output, and sometimes even financial crises.
4.3 Case Study: Argentina (1880-1890) 4.3.1 Historical Context and the Dynamics of Key Indicators
For the purposes of this thesis, the most interesting episode in the first era of globalization is
the big lending boom in the 1880s by the core countries of Europe to the peripheral countries
in the New World which ended abruptly in 1889-90 (Bordo, 2006). The crisis that hit
Argentina in 1890 (the Baring Crisis) was the harshest of all, and it will hence be analyzed
further. Unfortunately, juxtaposing all aspects of the Argentine crisis to the open economy
model developed in Chapter 3 was not possible, as all the relevant data is not available.
The Baring Crisis of 1890 was a major international financial crisis. As della Paolera and
Taylor (2001) point out the Baring Crisis originated in Argentina but it was felt all over the
world, first of all in Great Britain. Most capital inflows to the periphery in the 1880s were
financed by borrowing from Great Britain. Therefore, a crash in the periphery hurt the
periphery’s major creditors. One of the largest creditors was the world’s largest merchant
bank at the time – Baring Brothers & Co., which was heavily exposed to Argentine securities.
Therefore, the crisis bears the name Baring crisis. Most studies have focused on the impact of
the crisis on Great Britain, although it was Argentina who suffered most, as it experienced a
financial (liquidity) crisis in 1890-1891 with severe macroeconomic implications for its
economy.
The Argentine experience is interesting because it is very reminiscent of modern crises in
emerging markets. The defining feature of such crises in modern times is the exuberant
capital inflows prior to the crisis. Argentina’s pre-crisis period (1884-1890) is no different, as
it was marked by heavy foreign borrowing, which showed in massive capital inflows from
abroad. Foreign investors were attracted by growth opportunities that Argentina offered and
by a seemingly stable macroeconomic environment. The attraction of Argentina to foreign
investors was tremendous at the time. For instance, Argentina absorbed 11 percent of new
portfolio issues on the London capital market, while North America (United States and
Canada) – twenty times larger in terms of population absorbed only 30 percent of new issues
in London (Ford, 1962). These capital inflows financed an unprecedented current account
deficit that averaged 20 percent of gross domestic product (GDP) in the years 1884-1889.
Table 2: Cumulative Gross Capital Flows from Britain to Argentina in Millions of Pound
Sterling, 1880–1890
1880 1890 Growth rate per
annum 1880-1890
Private flows 9 78 24%
Official flows 21 132 20%
Source: I. Stone, British Direct and Portfolio Investment in Latin America before 1914, 1999, p.13.
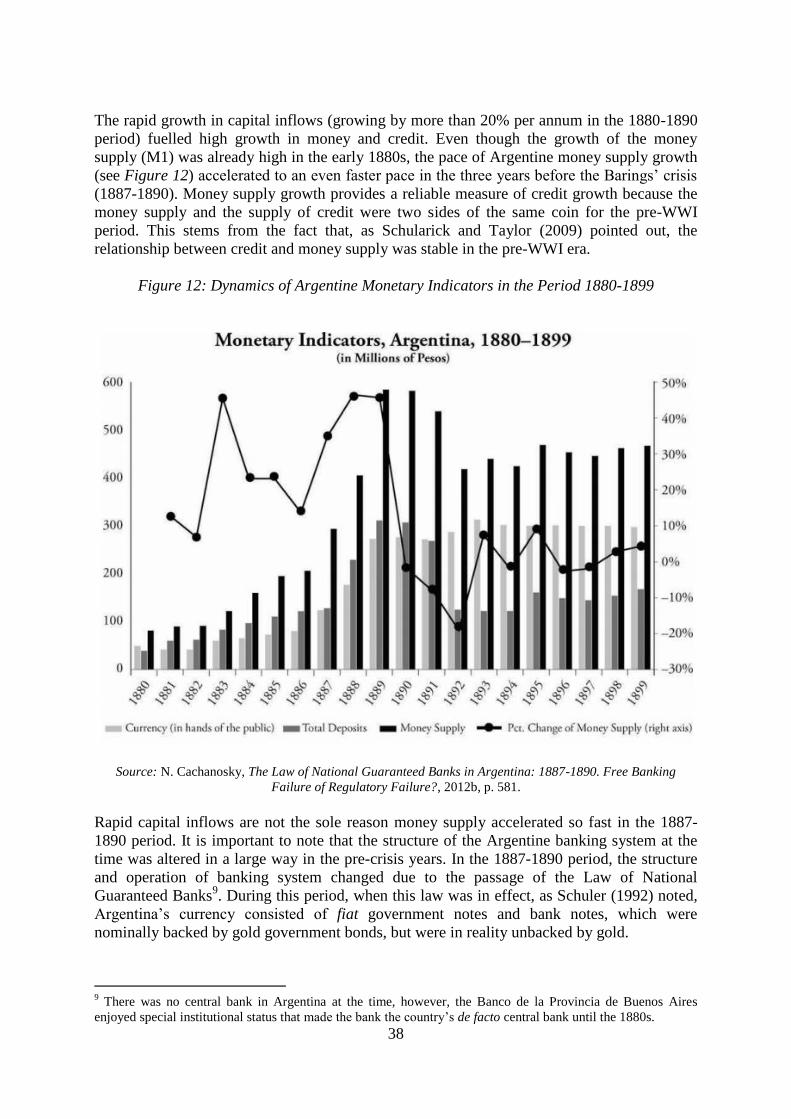
38
The rapid growth in capital inflows (growing by more than 20% per annum in the 1880-1890
period) fuelled high growth in money and credit. Even though the growth of the money
supply (M1) was already high in the early 1880s, the pace of Argentine money supply growth
(see Figure 12) accelerated to an even faster pace in the three years before the Barings’ crisis
(1887-1890). Money supply growth provides a reliable measure of credit growth because the
money supply and the supply of credit were two sides of the same coin for the pre-WWI
period. This stems from the fact that, as Schularick and Taylor (2009) pointed out, the
relationship between credit and money supply was stable in the pre-WWI era.
Figure 12: Dynamics of Argentine Monetary Indicators in the Period 1880-1899
Source: N. Cachanosky, The Law of National Guaranteed Banks in Argentina: 1887-1890. Free Banking
Failure of Regulatory Failure?, 2012b, p. 581.
Rapid capital inflows are not the sole reason money supply accelerated so fast in the 1887-
1890 period. It is important to note that the structure of the Argentine banking system at the
time was altered in a large way in the pre-crisis years. In the 1887-1890 period, the structure
and operation of banking system changed due to the passage of the Law of National
Guaranteed Banks9. During this period, when this law was in effect, as Schuler (1992) noted,
Argentina’s currency consisted of fiat government notes and bank notes, which were
nominally backed by gold government bonds, but were in reality unbacked by gold.
9 There was no central bank in Argentina at the time, however, the Banco de la Provincia de Buenos Aires
enjoyed special institutional status that made the bank the country’s de facto central bank until the 1880s.
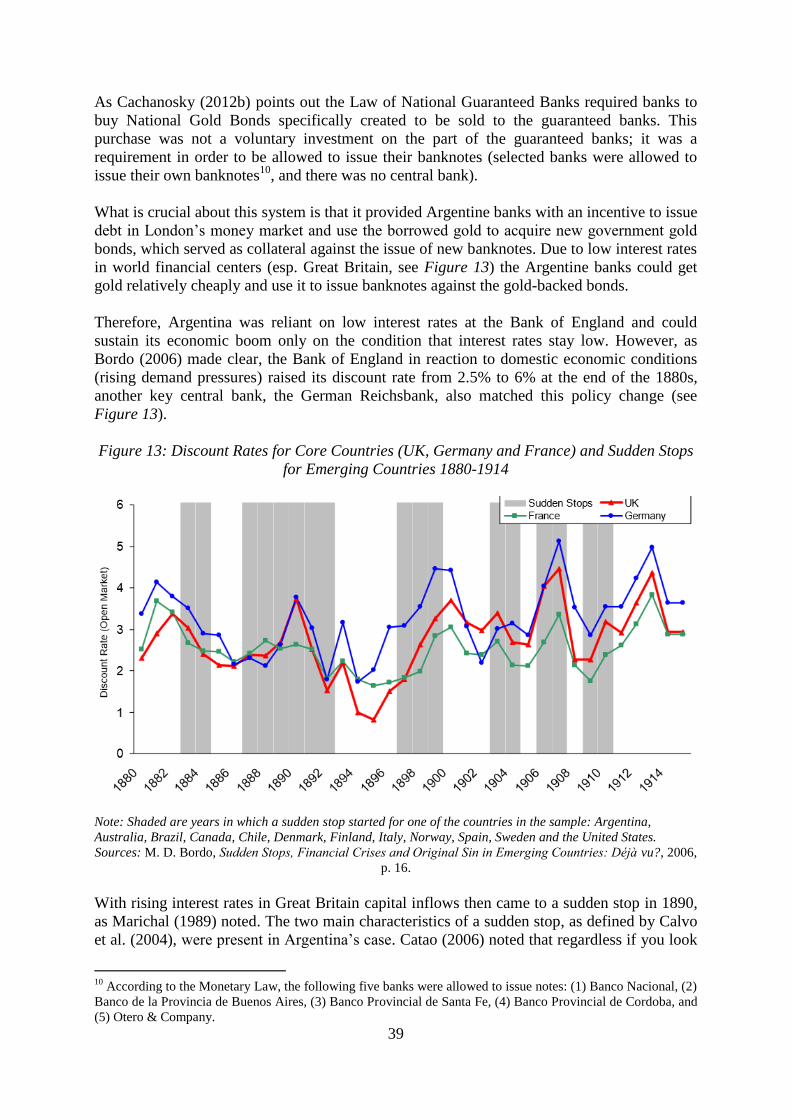
39
As Cachanosky (2012b) points out the Law of National Guaranteed Banks required banks to
buy National Gold Bonds specifically created to be sold to the guaranteed banks. This
purchase was not a voluntary investment on the part of the guaranteed banks; it was a
requirement in order to be allowed to issue their banknotes (selected banks were allowed to
issue their own banknotes10
, and there was no central bank).
What is crucial about this system is that it provided Argentine banks with an incentive to issue
debt in London’s money market and use the borrowed gold to acquire new government gold
bonds, which served as collateral against the issue of new banknotes. Due to low interest rates
in world financial centers (esp. Great Britain, see Figure 13) the Argentine banks could get
gold relatively cheaply and use it to issue banknotes against the gold-backed bonds.
Therefore, Argentina was reliant on low interest rates at the Bank of England and could
sustain its economic boom only on the condition that interest rates stay low. However, as
Bordo (2006) made clear, the Bank of England in reaction to domestic economic conditions
(rising demand pressures) raised its discount rate from 2.5% to 6% at the end of the 1880s,
another key central bank, the German Reichsbank, also matched this policy change (see
Figure 13).
Figure 13: Discount Rates for Core Countries (UK, Germany and France) and Sudden Stops
for Emerging Countries 1880-1914
Note: Shaded are years in which a sudden stop started for one of the countries in the sample: Argentina,
Australia, Brazil, Canada, Chile, Denmark, Finland, Italy, Norway, Spain, Sweden and the United States.
Sources: M. D. Bordo, Sudden Stops, Financial Crises and Original Sin in Emerging Countries: Déjà vu?, 2006,
p. 16.
With rising interest rates in Great Britain capital inflows then came to a sudden stop in 1890,
as Marichal (1989) noted. The two main characteristics of a sudden stop, as defined by Calvo
et al. (2004), were present in Argentina’s case. Catao (2006) noted that regardless if you look
10
According to the Monetary Law, the following five banks were allowed to issue notes: (1) Banco Nacional, (2)
Banco de la Provincia de Buenos Aires, (3) Banco Provincial de Santa Fe, (4) Banco Provincial de Cordoba, and
(5) Otero & Company.

40
at net or gross capital inflows, Argentina experienced a sudden stop in the 1889-1895 event
window. As Figure 14 shows, the fall in capital flows was in line with the Calvo et al. (2004)
definition of a sudden stop. As the initial fall in capital flows was large (recording an annual
fall of more than one standard deviation below the mean) and unexpected (at least one
observation in the annual variation in capital flows is at least two standard deviations below
its sample mean).
It is also important to note that this had a hugely contracting effect on Argentina’s money
supply, which contracted substantially in the 1890-1892 period (see Figure 12). What is also
important to mention is that the sudden stops were not limited to Argentina in this period,
with rising interest rates in Britain and Germany capital flows to emerging economies
decreasing dramatically, as Figure 15 depicts.
Figure 14: Net Capital Inflows in Percent of GDP for Argentina 1880-1914
Note: Data unavailable prior to 1880. The Figure is adapted to only capture Argentina.
Source: L. A. V. Catao, Sudden Stops and Currency Drops: A Historical Perspective, (2006), p. 28.
Figure 15: Net Capital Flows to Emerging Countries 1880-1914 (Average % of GDP)
Note: Sample includes Argentina, Brazil, Canada, Chile, Denmark, Italy, Spain, US, Canada, Australia, Norway
and Sweden.
Source: M. D. Bordo, Sudden Stops, Financial Crises and Original Sin in Emerging Countries: Déjà vu?, 2006,
p. 10.

41
4.3.2 The Results of Increased Credit and Capital Inflows
Many activities that sprung up as a result of a low interest rate environment were, hence,
found to be unsustainable. Therefore, investors realized their folly and with the Baring’s crisis
revealing that many of their investment projects initiated in the 1880s are unprofitable at the
new interest rates. In Argentina’s case, the large capital inflows in the 1880s were, as
Mitchener and Weidenmier (2006) note, mainly used to finance long-term investment projects
in infrastructure (see Table 3 for the growing share of investment towards the end of 1880s).
The main activities financed were the building of railroads and transportation networks and
the improvement of cultivable lands.
Table 3: Argentina’s Saving, Investment and the Current Account, 1885-1893
Y I CA S/Y I/Y CA/Y
1885 463 54 -42 2.5% 11.6% -9.1%
1886 478 44 -73 -6.1% 9.2% -15.3%
1887 513 44 -95 -10.0% 8.5% -18.5%
1888 565 64 -115 -9% 11.4% -20.4%
1889 795 93 -242 -18.7% 11.7% -30.4%
1890 1068 176 -262 -8.1% 16.5% -24.5%
1891 1482 181 16 13.3% 12.2% 1.1%
1892 1285 95 -3 7.1% 7.4% -0.03%
1893 1265 90 -95 -0.03% 7.1% -7.5%
Notes: Units of investment (I), gross domestic product (Y), savings (S) and the current account (CA) are millions
of pesos.
Source: A. Taylor, Capital Accumulation in della Paolera & Taylor, A New Economic History of Argentina,
2003, p.176.
All of these investments in railroads, the transportation network and in land development
were capital-intensive and time-intensive. Meaning that these industries are very sensitive to
changes in interest rates, and as the relevant interest rates in Argentina during this period were
British interest rates, the policy of the Bank of England seemed to have a big impact on the
Argentine economy. This is because the economy of Argentina was reliant on low interest
rates in Great Britain continuing indefinitely, for the highly interest sensitive investments to
remain sustainable. This seems to fit the story of the transmission of credit expansion through
the interest rate channel presented in Chapter 3.3.
It is important to note here that the low interest rates in Great Britain during the 1880s were
the result of monetary policy decisions and not due to an increase in thriftiness by British
citizens. Keep in mind that while Great Britain was under the gold standard in this period,
monetary policy decisions by the Bank of England still played a large role in the British
economy, as Cassel (1936) pointed out. For instance, the Bank of England prevented gold
outflows by raising discount rates or engaging in open market operations (Cassel, 1936).
As for Argentine monetary policy, Argentina went off the gold standard regime in 1884 and
had a paper currency prior and during the crisis. This caused a currency mismatch, as
Mitchener and Weidenmier (2006) note, because the Argentine banks went to borrow gold in
London (its liabilities), while it held assets in the form of loans denominated in domestic
paper currency (its assets). The maturity mismatch between the liabilities of Argentine banks
and its assets was also a problem, as its loans went towards long-term illiquid investments.
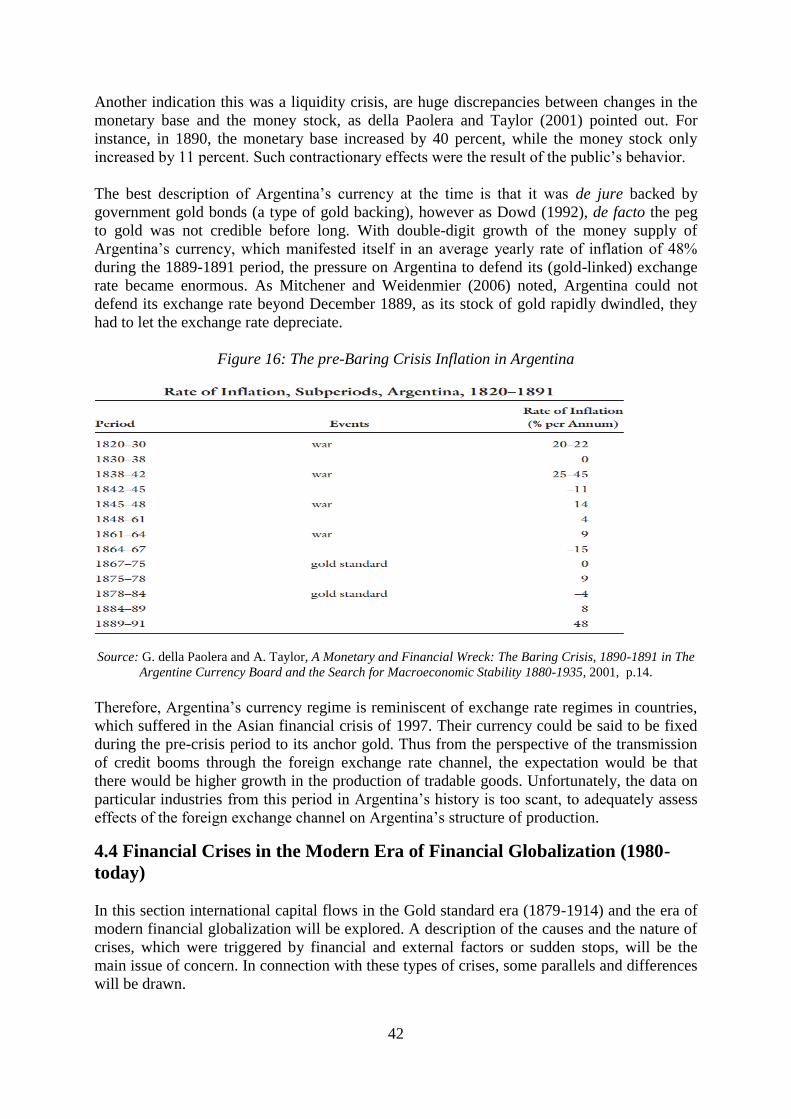
42
Another indication this was a liquidity crisis, are huge discrepancies between changes in the
monetary base and the money stock, as della Paolera and Taylor (2001) pointed out. For
instance, in 1890, the monetary base increased by 40 percent, while the money stock only
increased by 11 percent. Such contractionary effects were the result of the public’s behavior.
The best description of Argentina’s currency at the time is that it was de jure backed by
government gold bonds (a type of gold backing), however as Dowd (1992), de facto the peg
to gold was not credible before long. With double-digit growth of the money supply of
Argentina’s currency, which manifested itself in an average yearly rate of inflation of 48%
during the 1889-1891 period, the pressure on Argentina to defend its (gold-linked) exchange
rate became enormous. As Mitchener and Weidenmier (2006) noted, Argentina could not
defend its exchange rate beyond December 1889, as its stock of gold rapidly dwindled, they
had to let the exchange rate depreciate.
Figure 16: The pre-Baring Crisis Inflation in Argentina
Source: G. della Paolera and A. Taylor, A Monetary and Financial Wreck: The Baring Crisis, 1890-1891 in The
Argentine Currency Board and the Search for Macroeconomic Stability 1880-1935, 2001, p.14.
Therefore, Argentina’s currency regime is reminiscent of exchange rate regimes in countries,
which suffered in the Asian financial crisis of 1997. Their currency could be said to be fixed
during the pre-crisis period to its anchor gold. Thus from the perspective of the transmission
of credit booms through the foreign exchange rate channel, the expectation would be that
there would be higher growth in the production of tradable goods. Unfortunately, the data on
particular industries from this period in Argentina’s history is too scant, to adequately assess
effects of the foreign exchange channel on Argentina’s structure of production.
4.4 Financial Crises in the Modern Era of Financial Globalization (1980-
today)
In this section international capital flows in the Gold standard era (1879-1914) and the era of
modern financial globalization will be explored. A description of the causes and the nature of
crises, which were triggered by financial and external factors or sudden stops, will be the
main issue of concern. In connection with these types of crises, some parallels and differences
will be drawn.
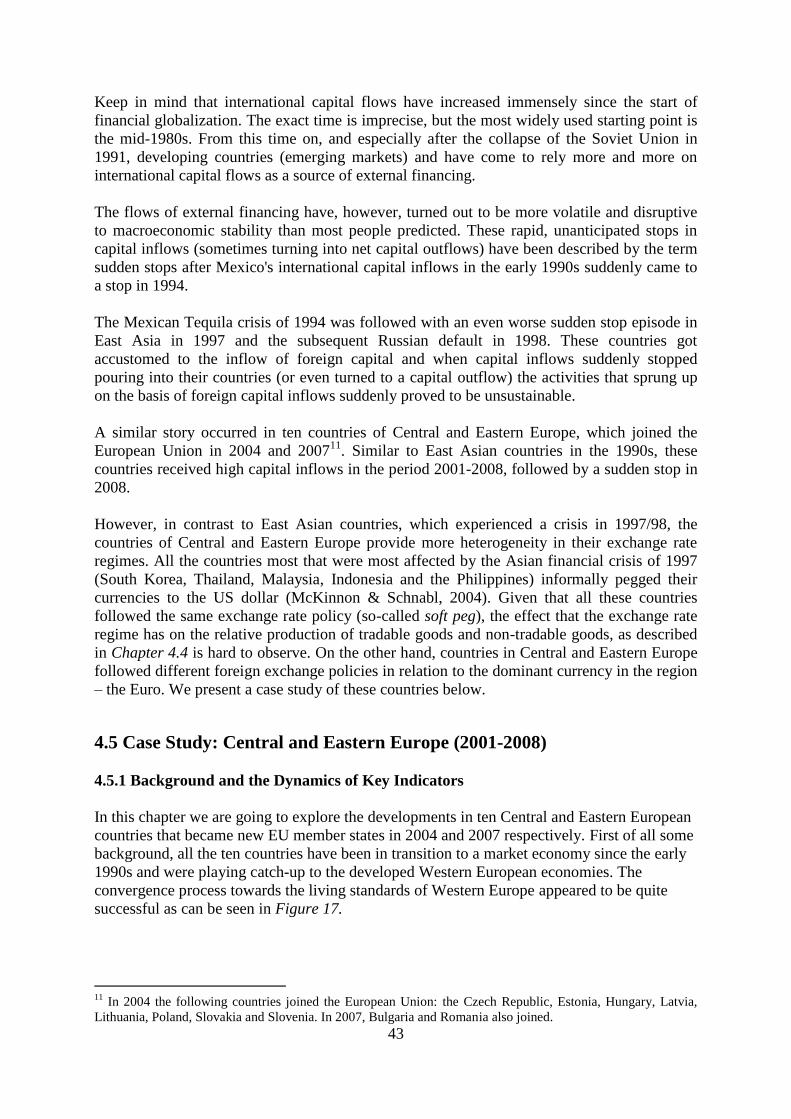
43
Keep in mind that international capital flows have increased immensely since the start of
financial globalization. The exact time is imprecise, but the most widely used starting point is
the mid-1980s. From this time on, and especially after the collapse of the Soviet Union in
1991, developing countries (emerging markets) and have come to rely more and more on
international capital flows as a source of external financing.
The flows of external financing have, however, turned out to be more volatile and disruptive
to macroeconomic stability than most people predicted. These rapid, unanticipated stops in
capital inflows (sometimes turning into net capital outflows) have been described by the term
sudden stops after Mexico's international capital inflows in the early 1990s suddenly came to
a stop in 1994.
The Mexican Tequila crisis of 1994 was followed with an even worse sudden stop episode in
East Asia in 1997 and the subsequent Russian default in 1998. These countries got
accustomed to the inflow of foreign capital and when capital inflows suddenly stopped
pouring into their countries (or even turned to a capital outflow) the activities that sprung up
on the basis of foreign capital inflows suddenly proved to be unsustainable.
A similar story occurred in ten countries of Central and Eastern Europe, which joined the
European Union in 2004 and 200711
. Similar to East Asian countries in the 1990s, these
countries received high capital inflows in the period 2001-2008, followed by a sudden stop in
2008.
However, in contrast to East Asian countries, which experienced a crisis in 1997/98, the
countries of Central and Eastern Europe provide more heterogeneity in their exchange rate
regimes. All the countries most that were most affected by the Asian financial crisis of 1997
(South Korea, Thailand, Malaysia, Indonesia and the Philippines) informally pegged their
currencies to the US dollar (McKinnon & Schnabl, 2004). Given that all these countries
followed the same exchange rate policy (so-called soft peg), the effect that the exchange rate
regime has on the relative production of tradable goods and non-tradable goods, as described
in Chapter 4.4 is hard to observe. On the other hand, countries in Central and Eastern Europe
followed different foreign exchange policies in relation to the dominant currency in the region
– the Euro. We present a case study of these countries below.
4.5 Case Study: Central and Eastern Europe (2001-2008)
4.5.1 Background and the Dynamics of Key Indicators
In this chapter we are going to explore the developments in ten Central and Eastern European
countries that became new EU member states in 2004 and 2007 respectively. First of all some
background, all the ten countries have been in transition to a market economy since the early
1990s and were playing catch-up to the developed Western European economies. The
convergence process towards the living standards of Western Europe appeared to be quite
successful as can be seen in Figure 17.
11
In 2004 the following countries joined the European Union: the Czech Republic, Estonia, Hungary, Latvia,
Lithuania, Poland, Slovakia and Slovenia. In 2007, Bulgaria and Romania also joined.
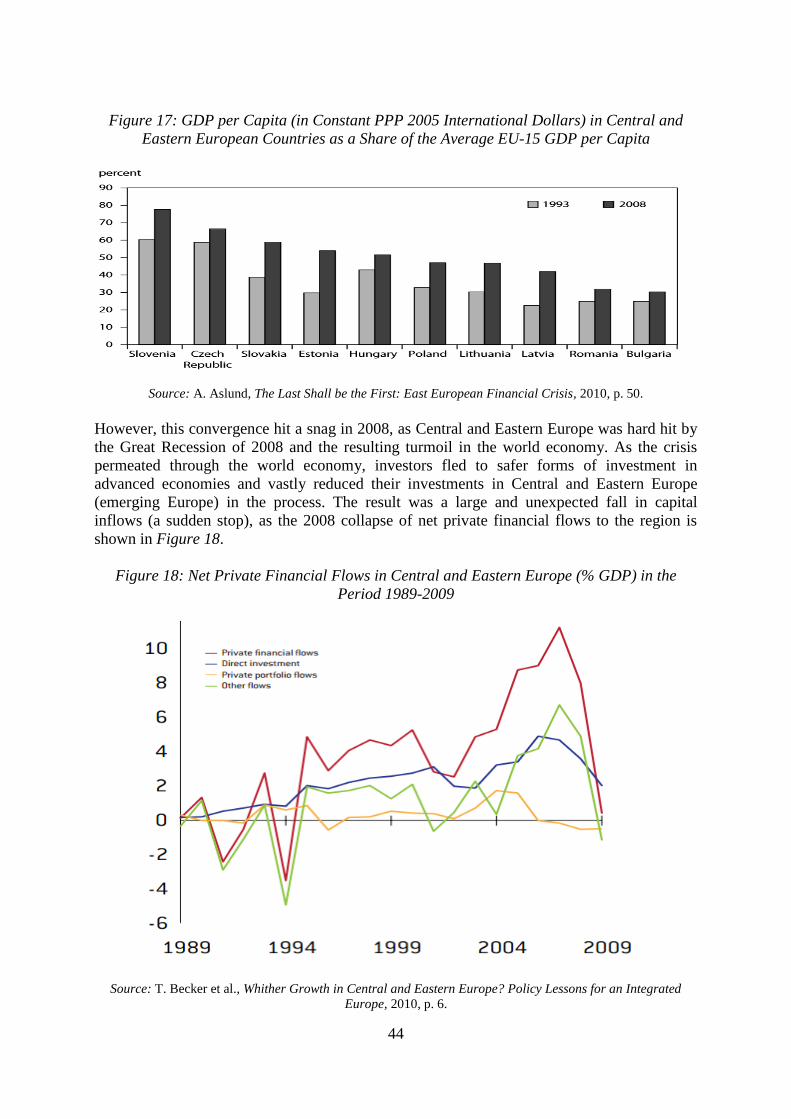
44
Figure 17: GDP per Capita (in Constant PPP 2005 International Dollars) in Central and
Eastern European Countries as a Share of the Average EU-15 GDP per Capita
Source: A. Aslund, The Last Shall be the First: East European Financial Crisis, 2010, p. 50.
However, this convergence hit a snag in 2008, as Central and Eastern Europe was hard hit by
the Great Recession of 2008 and the resulting turmoil in the world economy. As the crisis
permeated through the world economy, investors fled to safer forms of investment in
advanced economies and vastly reduced their investments in Central and Eastern Europe
(emerging Europe) in the process. The result was a large and unexpected fall in capital
inflows (a sudden stop), as the 2008 collapse of net private financial flows to the region is
shown in Figure 18.
Figure 18: Net Private Financial Flows in Central and Eastern Europe (% GDP) in the
Period 1989-2009
Source: T. Becker et al., Whither Growth in Central and Eastern Europe? Policy Lessons for an Integrated
Europe, 2010, p. 6.

45
The collapse of net capital inflows came on the back of massive capital inflows in the 2004-
2008 period (see Figure 18). These capital inflows, in turn, were largely funded by low
interest rates (see Figure 19 and Figure 20) in the US and the euro area (the core), from where
credit was transmitted to the Central and Eastern European economies (the periphery).
Figure 19: Money Market Interest Rates in the Euro Area, United States and Japan, 1995-
2008
Source: G. Schnabl and A. Hoffmann, Monetary Policy, Vagabonding Liquidity and Bursting Bubbles in New
and Emerging Markets: An Overinvestment View, 2007, p. 3.
Figure 20: Money market Interest Rates Spread between Euro area and Central and Eastern
European Countries, 1999-2007
Note: The arithmetic average is taken for the ten Central and Eastern European countries.
Source: G. Schnabl and A. Hoffmann, Monetary Policy, Vagabonding Liquidity and Bursting Bubbles in New
and Emerging Markets: An Overinvestment View, 2007, p. 4.

46
As Table 4 shows, these capital inflows resulted in large current account deficits prior to the
crisis. In 2007, countries with floating exchange rate regimes (Poland, Czech Republic,
Hungary, Romania, and Slovakia12
) averaged a current account deficit of 6.7% (as a rule of
thumb 4.5% is sustainable). While countries with fixed exchange rate regimes (Baltic
countries, Bulgaria and Slovenia) averaged a staggering 17.3% current account deficit.
Table 4: Key Indicators for Central and Eastern European Countries
Countries
with
floating
exchange
rates
Countries with fixed exchange
rates
Current Account Balance/GDP 2007 (%) -6.7 -17.3
Inflation average of 2004-2008 (%) 4.7 6.2
Credit/GDP, change from 2004-2008 20.7 37.4
FDI to finance and real estate sectors, 2007 (% of
total FDI stock)
30.6 44.8
Gross external debt, 2009 (% of GDP) 86.6 123.6
Real interest rate, average of 2004-2008 (%) 1.4 -2.5
GDP growth, 2009 (%) -4.1 -11.1
Change in unemployment rate from 2007-2010
(%)
2.5 8.9
Note: Group of five countries with floating exchange rate: Czech Republic, Hungary, Poland and Slovakia
(Slovakia had a de facto floating exchange rate regime until July 2008), Romania; Group of five countries with
fixed exchange rate regimes: Bulgaria, Estonia, Latvia, Lithuania and Slovenia.
Source: T. Becker et al., Whither Growth in Central and Eastern Europe? Policy Lessons for an Integrated
Europe, 2010, p. 51.
In order to finance these deficits, countries had to import capital from abroad. This imported
capital, in turn, fuelled the growth in the amount of credit. As in the 2004-2008 period a
cumulative increase in the credit to GDP ratio is recorded to be on average 20.7% in floating
exchange rate countries (which could sterilize their capital inflows – at least somewhat) and
37.4% in countries with fixed exchange rates.
Consequently, as the supply of credit was steadily growing, it did not take long for inflation to
flare up as well, with inflation running way above the 2% level13
in the 2004-2008 period.
With rising inflation and low nominal interest rates as a result of plentiful credit, real interest
rates were low as well. However, real interest rates by and large remained positive in
countries with floating exchange rate regimes, while in countries with fixed exchange rates
real interest delved deep into negative territory as they averaged a real interest rate of -2.5%
(see Table 4). Aslund (2010) attributes this divergence to better monetary policies of floaters
(in particular Poland, the Czech Republic and Slovakia), which did not let their economies
overheat as much as, for instance, the Baltic countries.
12
Even though it adopted the Euro in 2009, Slovakia ran a de facto floating exchange rate regime until July
2008. 13
This 2% level of inflation in the Consumer price index (CPI) is the target for most major central banks in the
world and it is a level deemed appropriate by most economists.

47
With low and negative real interest rates, the attractiveness of investment in Central and
Eastern Europe increased. However, as real interest rates across the region diverged, so did
the growth in investment.
Hence, countries on fixed exchange rates to the Euro had little choice but to allow its capital
inflows to translate into credit expansion, with the accompanying negative real interest rates
and stimulus to investment. On the other hand, countries with floating exchange rates like
Poland did not run such a loose monetary policy, keeping real interest rates higher and
damping the growth in investment. As a result, Poland’s investment to GDP ratio was quite
stable in the pre-crisis period, while Estonia’s investment as a percentage of GDP peaked at
38% prior to the crisis (see Figure 21). Interestingly though, the two countries with managed
floating regimes (Romania and Hungary) record large differences in the dynamics of their
investment to GDP ratio (Figure 21) and asset prices dynamics (Figure 23). Hoffmann (2010)
suggests that this might be due to macroeconomic instability in Hungary at the time, which
damped investment demand.
Figure 21: Investment in Percentage of GDP by Exchange Rate Regime in Central and
Eastern Europe, 2001-2009
Note: Arithmetic means are calculated for each group of countries. The countries are grouped in the following
way: fixed exchange rate countries – Estonia, Latvia, Lithuania, Bulgaria and Slovenia, floating exchange rate
countries – Poland, Czech Republic and Slovakia. Two countries with managed floating exchange rates –
Romania and Hungary, are shown separately because of a large difference in their investment to GDP dynamics
in this time period. Investment is expressed as a ratio of total investment in current local currency and GDP in
current local currency. Investment or gross capital formation is measured by the total value of the gross fixed
capital formation and changes in inventories and acquisitions less disposals of valuables for a unit or sector. Data source the International monetary fund database (2012).
Thus far it has been noted that credit and investment have expanded in proportion to GDP,
following the methodology of Eichengreen and Mitchener (2003). Another sign of a credit
bubble is a rapid acceleration of asset prices in the countries of Central and Eastern Europe
(see Figure 22), even compared to other emerging markets such as Latin America and Asia.
As predicted by theory the growth of asset prices in fixed exchange rate countries and

48
Romania outpaced that of countries with floating exchange rates, and Hungary (see Figure
23).
Figure 22: Asset Prices in Central and Eastern Europe Compared to other Emerging Markets
Source: M. Cali et al., The Global Financial Crisis: financial flows to developing countries set to fall by one
quarter, 2008, p. 10.
Figure 23: Stock Market Indices by Exchange Rate Regime in Central and Eastern Europe,
2001-2011 (1/1/2011=100)
Note: Arithmetic means of stock market indices are calculated for each group of countries. The countries are
grouped in the following way: fixed exchange rate countries – Estonia, Latvia, Lithuania, Bulgaria and
Slovenia, floating exchange rate countries – Poland, Czech Republic and Slovakia. Two countries with managed
floating exchange rates – Romania and Hungary, are shown separately because of a large difference in the
dynamics of their stock market prices in this time period. Local equity markets are valued in US$ terms. * Under floating exchange rates in the period 2001-2005, the data for Slovakia was unavailable, hence only the
mean of the Czech and Polish stock markets is calculated for the 2001-2005 period. Data source: The World Bank database (2014).
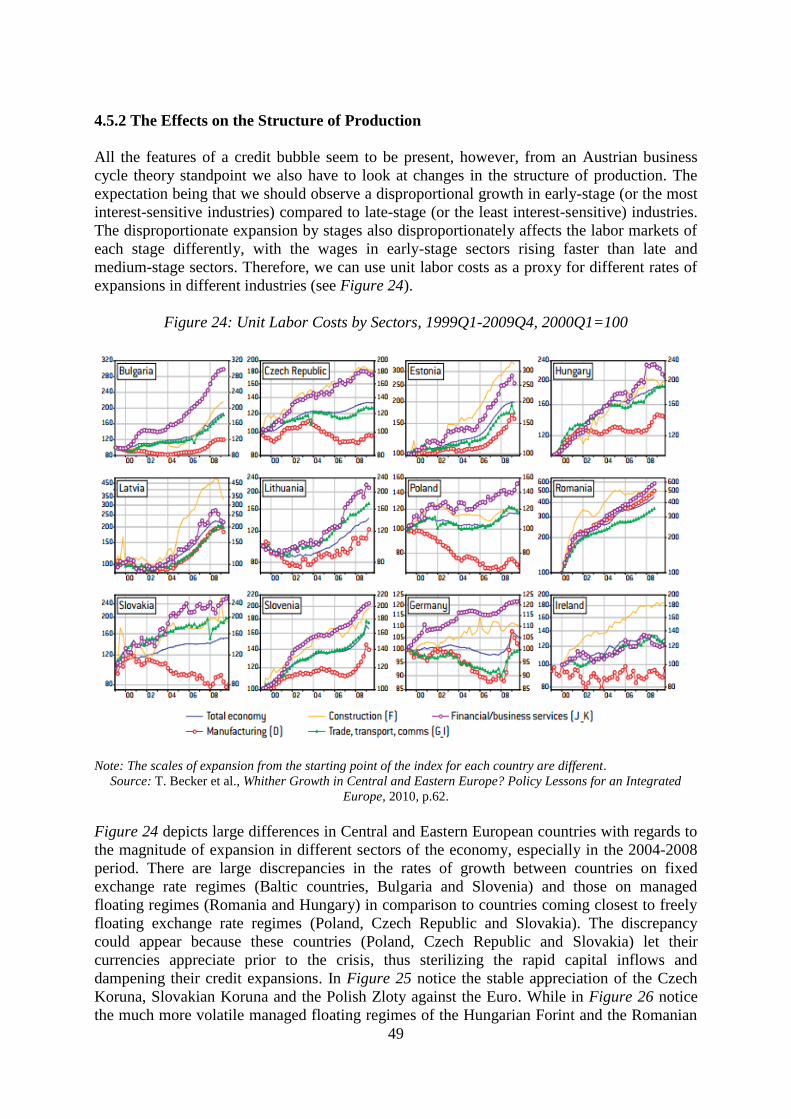
49
4.5.2 The Effects on the Structure of Production
All the features of a credit bubble seem to be present, however, from an Austrian business
cycle theory standpoint we also have to look at changes in the structure of production. The
expectation being that we should observe a disproportional growth in early-stage (or the most
interest-sensitive industries) compared to late-stage (or the least interest-sensitive) industries.
The disproportionate expansion by stages also disproportionately affects the labor markets of
each stage differently, with the wages in early-stage sectors rising faster than late and
medium-stage sectors. Therefore, we can use unit labor costs as a proxy for different rates of
expansions in different industries (see Figure 24).
Figure 24: Unit Labor Costs by Sectors, 1999Q1-2009Q4, 2000Q1=100
Note: The scales of expansion from the starting point of the index for each country are different.
Source: T. Becker et al., Whither Growth in Central and Eastern Europe? Policy Lessons for an Integrated
Europe, 2010, p.62.
Figure 24 depicts large differences in Central and Eastern European countries with regards to
the magnitude of expansion in different sectors of the economy, especially in the 2004-2008
period. There are large discrepancies in the rates of growth between countries on fixed
exchange rate regimes (Baltic countries, Bulgaria and Slovenia) and those on managed
floating regimes (Romania and Hungary) in comparison to countries coming closest to freely
floating exchange rate regimes (Poland, Czech Republic and Slovakia). The discrepancy
could appear because these countries (Poland, Czech Republic and Slovakia) let their
currencies appreciate prior to the crisis, thus sterilizing the rapid capital inflows and
dampening their credit expansions. In Figure 25 notice the stable appreciation of the Czech
Koruna, Slovakian Koruna and the Polish Zloty against the Euro. While in Figure 26 notice
the much more volatile managed floating regimes of the Hungarian Forint and the Romanian
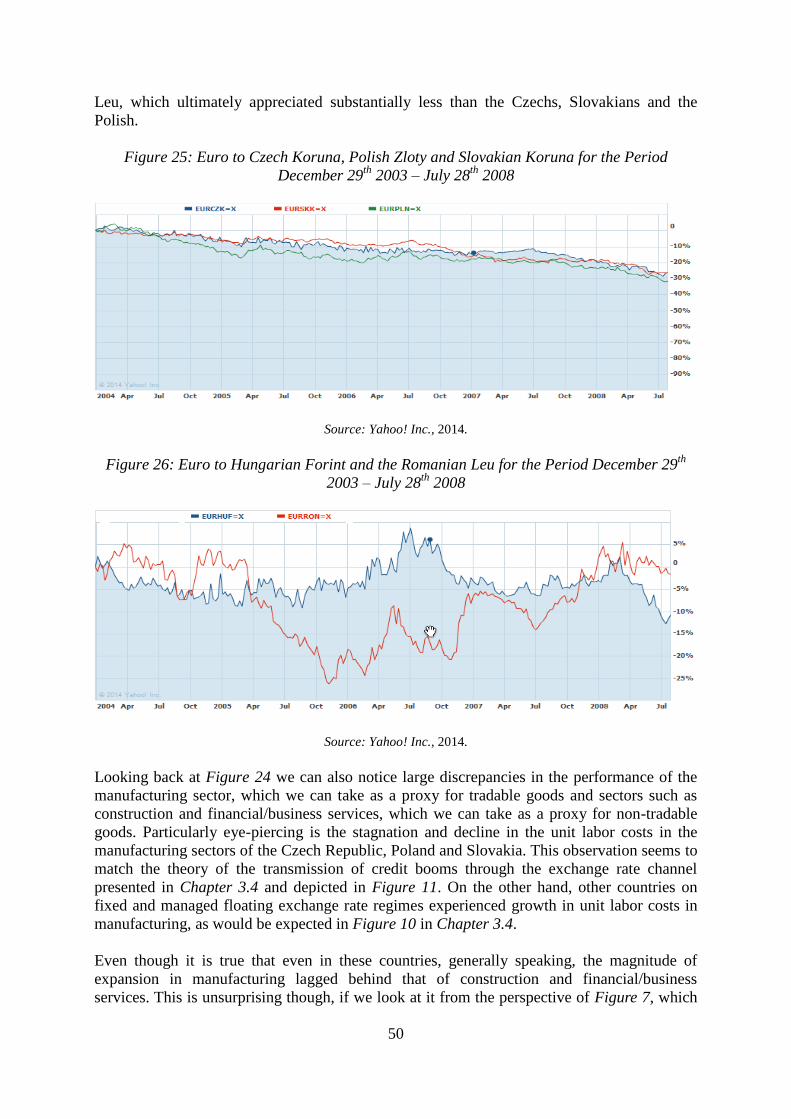
50
Leu, which ultimately appreciated substantially less than the Czechs, Slovakians and the
Polish.
Figure 25: Euro to Czech Koruna, Polish Zloty and Slovakian Koruna for the Period
December 29th
2003 – July 28th
2008
Source: Yahoo! Inc., 2014.
Figure 26: Euro to Hungarian Forint and the Romanian Leu for the Period December 29th
2003 – July 28th
2008
Source: Yahoo! Inc., 2014.
Looking back at Figure 24 we can also notice large discrepancies in the performance of the
manufacturing sector, which we can take as a proxy for tradable goods and sectors such as
construction and financial/business services, which we can take as a proxy for non-tradable
goods. Particularly eye-piercing is the stagnation and decline in the unit labor costs in the
manufacturing sectors of the Czech Republic, Poland and Slovakia. This observation seems to
match the theory of the transmission of credit booms through the exchange rate channel
presented in Chapter 3.4 and depicted in Figure 11. On the other hand, other countries on
fixed and managed floating exchange rate regimes experienced growth in unit labor costs in
manufacturing, as would be expected in Figure 10 in Chapter 3.4.
Even though it is true that even in these countries, generally speaking, the magnitude of
expansion in manufacturing lagged behind that of construction and financial/business
services. This is unsurprising though, if we look at it from the perspective of Figure 7, which
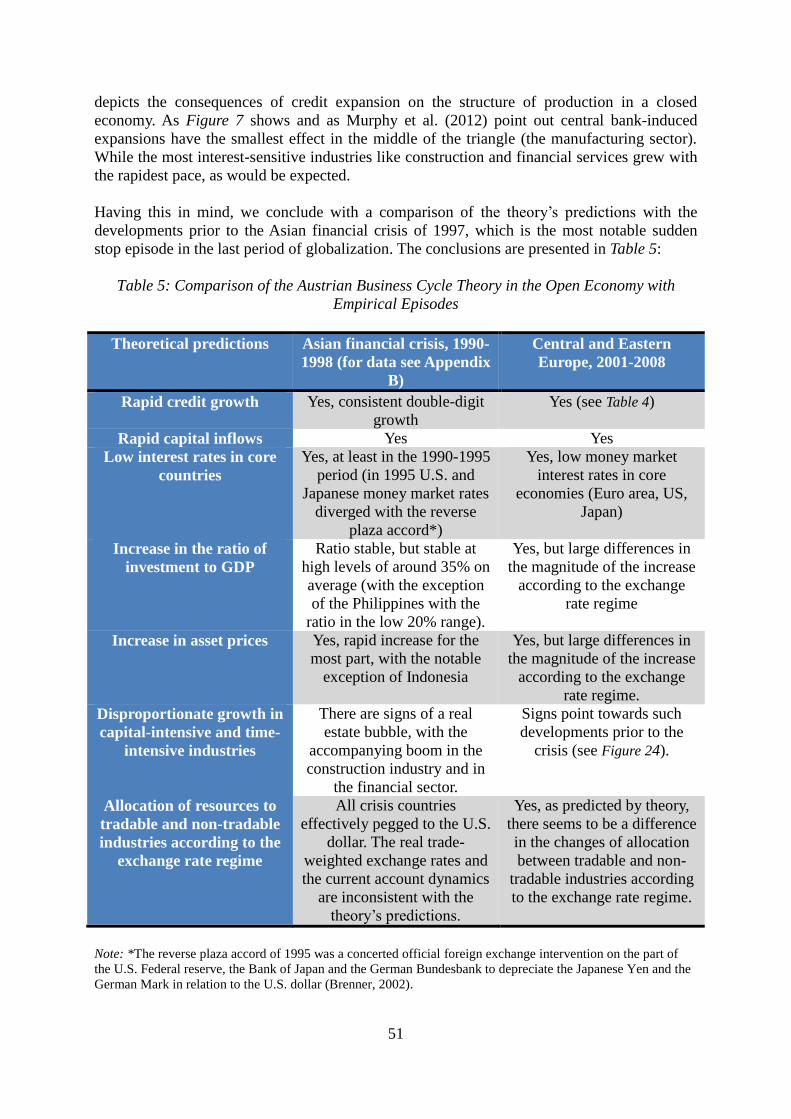
51
depicts the consequences of credit expansion on the structure of production in a closed
economy. As Figure 7 shows and as Murphy et al. (2012) point out central bank-induced
expansions have the smallest effect in the middle of the triangle (the manufacturing sector).
While the most interest-sensitive industries like construction and financial services grew with
the rapidest pace, as would be expected.
Having this in mind, we conclude with a comparison of the theory’s predictions with the
developments prior to the Asian financial crisis of 1997, which is the most notable sudden
stop episode in the last period of globalization. The conclusions are presented in Table 5:
Table 5: Comparison of the Austrian Business Cycle Theory in the Open Economy with
Empirical Episodes
Theoretical predictions Asian financial crisis, 1990-
1998 (for data see Appendix
B)
Central and Eastern
Europe, 2001-2008
Rapid credit growth Yes, consistent double-digit
growth
Yes (see Table 4)
Rapid capital inflows Yes Yes
Low interest rates in core
countries
Yes, at least in the 1990-1995
period (in 1995 U.S. and
Japanese money market rates
diverged with the reverse
plaza accord*)
Yes, low money market
interest rates in core
economies (Euro area, US,
Japan)
Increase in the ratio of
investment to GDP
Ratio stable, but stable at
high levels of around 35% on
average (with the exception
of the Philippines with the
ratio in the low 20% range).
Yes, but large differences in
the magnitude of the increase
according to the exchange
rate regime
Increase in asset prices Yes, rapid increase for the
most part, with the notable
exception of Indonesia
Yes, but large differences in
the magnitude of the increase
according to the exchange
rate regime.
Disproportionate growth in
capital-intensive and time-
intensive industries
There are signs of a real
estate bubble, with the
accompanying boom in the
construction industry and in
the financial sector.
Signs point towards such
developments prior to the
crisis (see Figure 24).
Allocation of resources to
tradable and non-tradable
industries according to the
exchange rate regime
All crisis countries
effectively pegged to the U.S.
dollar. The real trade-
weighted exchange rates and
the current account dynamics
are inconsistent with the
theory’s predictions.
Yes, as predicted by theory,
there seems to be a difference
in the changes of allocation
between tradable and non-
tradable industries according
to the exchange rate regime.
Note: *The reverse plaza accord of 1995 was a concerted official foreign exchange intervention on the part of
the U.S. Federal reserve, the Bank of Japan and the German Bundesbank to depreciate the Japanese Yen and the
German Mark in relation to the U.S. dollar (Brenner, 2002).

52
CONCLUSION
In conclusion, we find that the expanded open economy version of the Austrian business
cycle theory that we have developed in Chapter 3 stacks up rather well to empirics when
applied to the Central and Eastern European crisis of 2008. On the other hand, we can be less
certain in the case of the Argentine crisis of 1890. This is because the lack of appropriate data
precludes us from analyzing all the important aspects of the crisis in terms of the theory.
However, some telltale signs of a credit bubble are present (credit expansion, a
disproportionate expansion in capital-intensive and time-intensive sectors) in the Argentine
experience that align well with the theory. This is similar to the Asian financial crisis,
although our representation of the transmission of the credit bubble through the foreign
exchange channel seems to be inconsistent with the experience prior to the Asian financial
crisis.
However, we have succeeded in developing the Austrian business cycle theory in an open
economy and the transmission mechanisms involved on the basis of the standard Austrian
business cycle theory in order to address the problematic of sudden stops presented in
Chapter 1. As we have seen in Chapter 1, since the liberalization of international capital
flows in the 1980s, many emerging market economies have suffered sudden stop crises,
which were linked to the dynamics of international capital flows.
These international capital flows are nowadays seen by many prominent economists to be
fuelling credit bubbles in emerging economies and have suggested using the insights of the
Austrian business cycle theory to explain the developments during credit bubbles. The
expansion of credit through policy measures, as the Austrian business cycle theory explains
(Chapter 2), is unsustainable, as it impacts relative prices and hence alters the structure of
production towards more capital-intensive and time-intensive (interest-sensitive) industries.
As interest rates cannot be permanently maintained below their natural rate (which depends
on the time preferences of consumers) by policy measures, the expansion of production in
interest-sensitive industries turns out to be unsustainable when interest rates rise.
Though, as we have seen in the expanded open economy version of the Austrian business
cycle theory in Chapter 3, the expansion of credit is not necessarily triggered by domestic
policy measures. Credit expansion can also be put into motion on the basis of credit
expansions in big financial centers, which is then transmitted to small open economies tied to
the big financial center.
We identified two major transmission channels, which transmit credit expansion from one
economy to another economy. One is the interest rate channel, where investors are driven by
interest rate differentials to over-invest in periphery (small-medium) economies. This can lead
to credit expansion in the periphery economy, which brings about all the features described in
the standard version of the Austrian business cycle theory. The other is the foreign exchange
channel, which brings another layer on top of the standard Austrian business cycle theory, as
the effects of the foreign exchange rate policy on the relative production of tradable and non-
tradable goods and services are examined.
From applying these theories to the empirical cases of Central and Eastern Europe in the 21st
century and Argentina in the 19th
century, we can draw several conclusions. The first is that
the Austrian business cycle theory seems to be a useful tool to analyze sudden stop crises as it
aligns well with empirical observations. At least when it comes to the Argentine crisis of
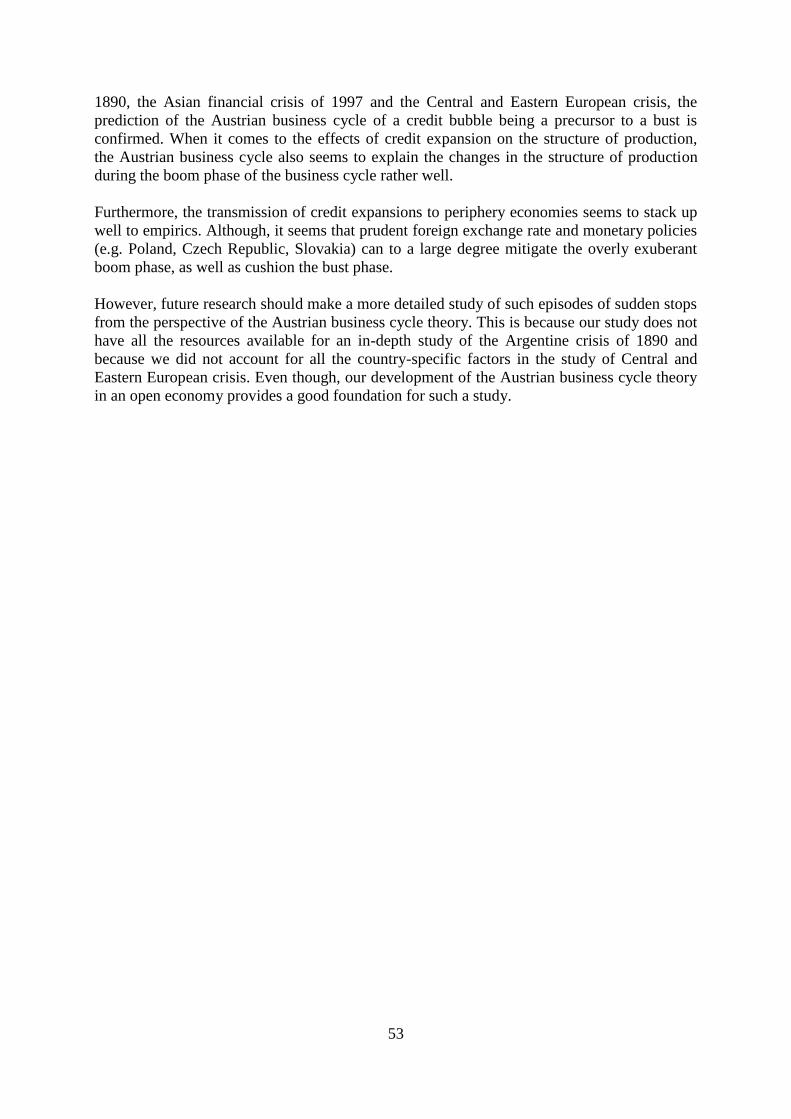
53
1890, the Asian financial crisis of 1997 and the Central and Eastern European crisis, the
prediction of the Austrian business cycle of a credit bubble being a precursor to a bust is
confirmed. When it comes to the effects of credit expansion on the structure of production,
the Austrian business cycle also seems to explain the changes in the structure of production
during the boom phase of the business cycle rather well.
Furthermore, the transmission of credit expansions to periphery economies seems to stack up
well to empirics. Although, it seems that prudent foreign exchange rate and monetary policies
(e.g. Poland, Czech Republic, Slovakia) can to a large degree mitigate the overly exuberant
boom phase, as well as cushion the bust phase.
However, future research should make a more detailed study of such episodes of sudden stops
from the perspective of the Austrian business cycle theory. This is because our study does not
have all the resources available for an in-depth study of the Argentine crisis of 1890 and
because we did not account for all the country-specific factors in the study of Central and
Eastern European crisis. Even though, our development of the Austrian business cycle theory
in an open economy provides a good foundation for such a study.

54
POVZETEK
Mnogi akademski ekonomisti in ekonomski strokovnjaki v mednarodnih inštitucijah, kot je
Mednarodni denarni sklad (MDS), so vpleteni v aktivno debato o učinku mednarodnih
kapitalskih tokov na mednarodno ekonomsko stabilnost. V zadnjih letih so številni ekonomisti
izrazili zaskrbljenost, da mednarodni kapitalski tokovi (tokovi kapitala med državami)
povzročajo pojav tako imenovanih kriz nenadnih ustavitev (ang. sudden stop) v državah v
razvoju.
Krize nenadne ustavitve (ang. sudden stop) so definirane kot obdobja, v katerih vsaj eno
opazovanje kapitalskih tokov na letni ravni leži vsaj dva standardna odklona pod svojo
vzorčno mediano (Calvo in drugi, 2004). Takšne krize so bile vir velike makroekonomske
nestabilnosti v državah v razvoju, merjeno z variacijo BDP od vrha do dna. Ko se kapitalski
tokovi v države v razvoju hitro upočasnijo (ali obrnejo smer) je lahko variacija BDP-ja
ogromna v razmaku nekaj mesecev.
Takšni primeri so bili v Indoneziji (December 1997 – December 1998: -17,3% sprememba v
BDP), na Tajskem (September 1996 – September 1998: -15,1% sprememba v BDP), v
Maroku (December 1994 – Junij 1995: -13,3% sprememba v BDP) in mnogih drugih državah,
v katerih so doživeli dvoštevilčni padec BDP v obdobju nekaj mesecev (Ortiz, Ottonello,
Sturzenegger, & Talvi, 2009). Najbolj zloglasna kriza nenadne ustavitve, ki je vključevala
skupino držav v razvoju, je Azijska finančna kriza leta 1997 v kateri so jo najhuje odnesle
Indonezija, Tajska in Južna Koreja.
Pozneje, v tem tisočletju, je tudi Srednja in Vzhodna Evropa doživela krizo, ki zelo spominja
na omenjeno Azijsko finančno krizo v 1990-ih letih. Podobno kot v Aziji pred krizo, je tudi
Srednja in Vzhodna Evropa v 2000-tih letih prejela ogromne prilive tujega kapitala. Prilivi
tujega kapitala so se odrazili v velikih deficitih na tekočih računih, poleg tega so povzročili
visoko rast v ponudbi kredita. Nakar so se kapitalski tokovi nenadoma zaustavili ob začetku
Velike recesije 2008, kar se je odražalo v velikih padcih BDP v Srednji in Vzhodni Evropi
(čeprav je bil padec v nekaterih državah manjši kot v drugih).
Pri čemer je potrebno poudariti dejstvo, da krize nenadne ustavitve niso nov fenomen, kot se
morda zdi na prvi pogled. Potrebno si je zapomniti, da so bili mednarodni kapitalski tokovi
zatrti v velikem delu 20. stoletja, še najbolj opazno v obdobju Bretton Woods (1945-
1971/1973), zato so imeli mednarodni kapitalski tokovi zelo majhen vpliv na gospodarstva.
Vendar, si je potrebno zapomniti, da krize nenadne ustavitve niso omejene na naše moderno
obdobje liberaliziranih kapitalskih tokov (1980-danes). Že primer Argentine v poznih 1880-ih
in zgodnjih 1890-ih kaže, da takšne krize vsekakor niso nov fenomen.
Vendar, ne glede na časovno obdobje, se (čemur zdaj pravimo) krize nenadne ustavitve
večinoma pojavljajo zaradi procikličnosti mednarodnih kapitalskih tokov. Z drugimi
besedami, mednarodni kapitalski tokovi potencirajo tako gospodarske ekspanzije kot tudi
gospodarska krčenja in se jih zato pogosto krivi za povečano gospodarsko nestabilnost. To
opažanje še posebej velja za majhna odprta gospodarstva, ki so v splošnem veliko bolj
odvisna od tuje trgovine in pritokov tujega kapitala kot velika gospodarstva. Da bi pojasnili zakaj lahko veliki prilivi tujega kapitala v obdobju pred krizo povzročijo
ekonomsko nestabilnost, velik del sodobne literature izpostavlja sočasno hitro rast v ponudbi

55
kredita, ki je bila opažena v državah pred nastankom kriz nenadnih zaustavitev. Empirična
opazovanja namreč kažejo, da so krize nenadne zaustavitve v splošnem doživele samo tiste
države, ki so dovolile, da so se veliki prilivi kapitala prelevili v kreditni balon. Pok kreditnega
balona sčasoma vodi do velike turbulence v gospodarstvu med katero se kapitalski prilivi
močno znižajo.
V skladu z osredotečnjem na kredit kot gonilno silo poslovnih ciklov, Lane in McQuade
(2014) ugotavljata, da so (i) pred nastankom kriz nekatere države (npr. Irska in Španija)
doživele hitro rast kredita, ter da so bila prisotna (ii) velika zunanja neravnotežja v nekaterih
državah. Pomembnost rasti kredita in zunanjih neravnotežjih v obdobju pred finančnimi
krizami je bila ugotovljena v velikem delu sodobne literature (med drugimi: Jorda,
Schularick, & Taylor, 2011; Gourinchas & Obstfeld, 2012).
Mednarodni vidik domačih kreditnih balonov je, kot izpostavlja Mendoza (2010), da so
domači kreditni baloni mnogokrat napihnjeni s hitrimi prilivi tujega kapitala, kar vzpostavi
povezavo med domačimi kreditnimi baloni in mednarodnimi kapitalskimi tokovi. Zato bi bila
za raziskovanje te povezave uporaba standardnih makroekonomskih modelov verjetno
neprimerna, saj imajo standardni makroekonomski modeli, kot opozarjata Hume in Sentence
(2009), težavo s pojasnjevanjem kreditnih balonov in z vključevanjem vseh relevatnih
makrofinančnih elementov v modele. Medtem Schularick in Taylor (2009) ugotavljata v svoji
ekonometrični študiji makroekonomske nestabilnosti v obdobju 1870-2008, da je pretekla rast
kredita najboljši pokazatelj bodoče finančne nestabilnosti.
Na drugi strani, Calvo (2013a) ugotavlja, da so kreditni baloni osrednja tema Avstrijske
teorije poslovnega cikla, kot je predstavljena v Hayek (1935, ponatisnjeno 1967) in v von
Mises (1949, ponatisnjeno 1998). Slednja avtorja sta se osredotočala na spremembe v
relativnih cenah, ki se dogajajo med gospodarsko ekspanzijo v okolju zaprtega gospodarstva.
Res je sicer kot ugotavlja Calvo (2014), da sta se Hayek in von Mises osredotočala na
kreditne balone znotraj zaprtega gospodarstva, vendar je njuno argumentiranje prav tako
lahko uporabljeno za prilive kapitala in krize nenadne zaustavitve. Še več, White (2006)
ugotavlja, da je Hayekovo in von Misesovo pojasnjevanje poslovnih ciklov celo še bolj
uporabno pri majhnih odprtih gospodarstvih, ko kapitalski prilivi vodijo do kreditnih balonov,
katerih gonilna sila je tuj kredit.
Podobno McKinnon in Pill (1997) krivita prekomerno tuje kreditiranje, ki vodi do nevzdržne
ravni investicij v majhnih odprtih gospodarstvih. V povezavi z Azijsko finančno krizo iz leta
1997/1998, so tudi Corsetti in drugi (1999) prišli do istega zaključka, da je prekomerno
zadolževanje in prekomerno investiranje vodilo do krize.
Skladno s takšnimi pomisleki, sta se tudi Hayek (1935) in von Mises (1949) bala, da bo
kreditni balon povzročil velike spremembe v relativnih cenah, ki bodo predstavljale velik
strošek, ko se bo kredit vrnil na normalne ravni. Mehanizem, ki sta ga imela v mislih
vključuje napačno kalkulacijo na strani ekonomskih agentov, ki zaradi kreditnega balona
živijo v zmoti in zamenjajo umetne pogoje za realne pogoje (White, 2006).
S tem mehanizmom v mislih in glede na atraktivnost Avstrijske teorije poslovnega cikla s
stališča uspeha teorije v razlaganju kreditnih balonov, namerava ta teza opisati Avstrijski
teoretični okvir in ga aplicirati na okolje odprtega gospodarstva. Vendar, preden se spustimo

56
na okolje odprtega gospodarstva, moramo pogledati standardno različico teorije v okolju
zaprtega gospodarstva.
Za izumitelja Avstrijske teorije poslovnega cikla, Ludwiga von Misesa (1949), je ključno
vprašanje na katerega njegova teorija odgovarja ali je možno permanentno znižati obrestne
mere preko kreditne ekspanzije? Preprosti odgovor je ne, ker so obrestne mere lahko znižane
samo na kratki rok (začasno), kar povzroči začasno obdobje blaginje, kateremu pa sledi zlom
na dolgi rok.
Torej je glavno vprašanje ali so spremembe obrestnih mer vzdržne. V primeru, kjer je
sprememba osnovana na povečanju realnega varčevanja, so takšne spremembe vzdržne.
Vzdržne so, ker so potrošniki znižali njihovo sedanjo potrošnjo in lahko zato potrošijo več v
prihodnosti. Medčasovna koordinacija potrošniških odločitev in investicijskih odločitev se
zato poklaplja. To razmišljanje je osnovano na Wicksellovi (1936, ponatisnjeno 1962) ideji
naravne obrestne mere (direktno je ne moremo opazovati), ki je konsistentna z medčasovnimi
preferencami potrošnikov in stvarnimi omejitvami (npr. redkost resursov).
Vendar lahko obrestna mera na kapitalskih trgih (ki jo lahko direktno opazujemo) odstopa of
naravne obrestne mere zaradi monetarnih šokov. Ti monetarni šoki, kot pojasnjuje Hayek
(1937), so problematični ker delujejo le začasno. Delujejo le začasno v smislu, da bodo
spremembe, ki jih sprožijo le začasne, zato ker niso osnovane na skladnih spremembah v
realnih dejavnikih.
Problem pri spremembah obrestne mere na kapitalskih trgih je, da ekonomski subjekti težko
ločijo med spremembo povzročeno s strani realnih dejavnikov, kot je večje varčevanje (tudi
tehnologija in drugi faktorji), in s strani monetarnih dejavnikov – ekspanzije kredita. Namreč
kreditna ekspanzija zniža obrestne mere, kar pošlje enak cenovni signal ekonomskim
subjektom kot povečano varčevanje. Zato investitorji napačno kalkulirajo sedanje vrednosti
projektov v prid bolj v prihodnost usmerjenim (ang. roundabout) produkcijskim procesom.
Z drugimi besedami, če ekspanzija kredita ni osnovana na povečanem varčevanju in je
posledica povečane ponudbe denarja, se bo konfiguracija produkcijske strukture gospodarstva
sčasoma izkazala za nevzdržno. To se zgodi zaradi prej omenjene napačne kalkulacije
sedanjih vrednosti s strani podjetnikov, katerih napovedi so zdaj osnovane na nižjih obrestnih
merah (ki so rezultat rasti ponudbe denarja). Sčasoma se te napovedi izkažejo za napačne, ker
dejansko ni bilo sprememb v medčasovnih potrošniških preferencah v smeri bolj v prihodnost
usmerjene potrošnje (povečano varčevanje), ki se bi skladala z zdaj obstoječo bolj v
prihodnost usmerjeno produkcijsko strukturo.
Podjetniki se napačno odločajo, ker so njihove finančne kalkulacije izkrivljene zaradi
odločitev monetarne politike, ki z nižanjem obrestne mere daje napačen cenovni signal
podjetnikom. Ti se lahko na osnovi te informacije odločijo za drugačen investicijski projekt
kot če bi obrestna mera ostala konstantna, saj so sedaj pristranski do projektov, ki so bolj
občutljivi na spremembe obrestne mere (bolj kapitalsko in časovno intenzivni projekti). Zato
se prekomerno investira v panoge, ki so bolj občutljive na spremembe v obrestni meri.
Takšna napaka je prepoznana, ko postane očitno, da predvideno prihodnje povpraševanje ne
obstaja. Ta sistematična množica podjetniških napak, v nasprotju s samo običajnimi in
relativno milimi poslovnimi nihanji, je značilen znak poslovega cikla po Rothbardu (1963a,
ponatisnjeno 2000).
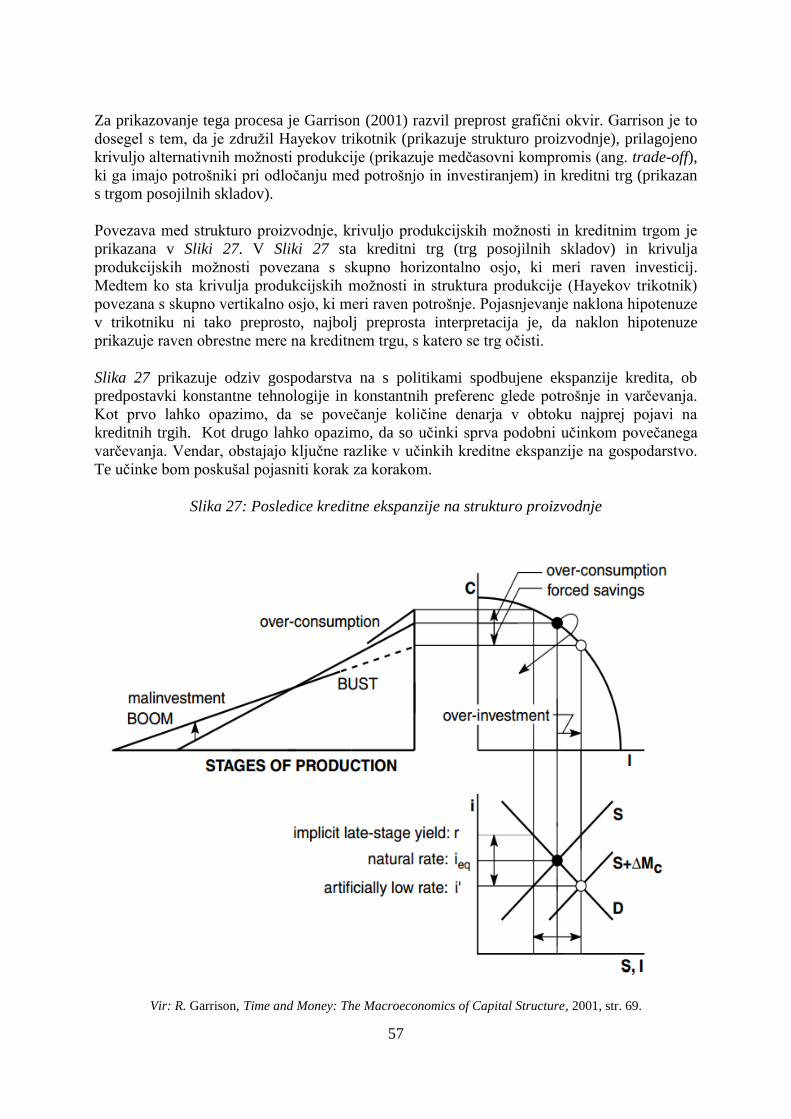
57
Za prikazovanje tega procesa je Garrison (2001) razvil preprost grafični okvir. Garrison je to
dosegel s tem, da je združil Hayekov trikotnik (prikazuje strukturo proizvodnje), prilagojeno
krivuljo alternativnih možnosti produkcije (prikazuje medčasovni kompromis (ang. trade-off),
ki ga imajo potrošniki pri odločanju med potrošnjo in investiranjem) in kreditni trg (prikazan
s trgom posojilnih skladov).
Povezava med strukturo proizvodnje, krivuljo produkcijskih možnosti in kreditnim trgom je
prikazana v Sliki 27. V Sliki 27 sta kreditni trg (trg posojilnih skladov) in krivulja
produkcijskih možnosti povezana s skupno horizontalno osjo, ki meri raven investicij.
Medtem ko sta krivulja produkcijskih možnosti in struktura produkcije (Hayekov trikotnik)
povezana s skupno vertikalno osjo, ki meri raven potrošnje. Pojasnjevanje naklona hipotenuze
v trikotniku ni tako preprosto, najbolj preprosta interpretacija je, da naklon hipotenuze
prikazuje raven obrestne mere na kreditnem trgu, s katero se trg očisti.
Slika 27 prikazuje odziv gospodarstva na s politikami spodbujene ekspanzije kredita, ob
predpostavki konstantne tehnologije in konstantnih preferenc glede potrošnje in varčevanja.
Kot prvo lahko opazimo, da se povečanje količine denarja v obtoku najprej pojavi na
kreditnih trgih. Kot drugo lahko opazimo, da so učinki sprva podobni učinkom povečanega
varčevanja. Vendar, obstajajo ključne razlike v učinkih kreditne ekspanzije na gospodarstvo.
Te učinke bom poskušal pojasniti korak za korakom.
Slika 27: Posledice kreditne ekspanzije na strukturo proizvodnje
Vir: R. Garrison, Time and Money: The Macroeconomics of Capital Structure, 2001, str. 69.
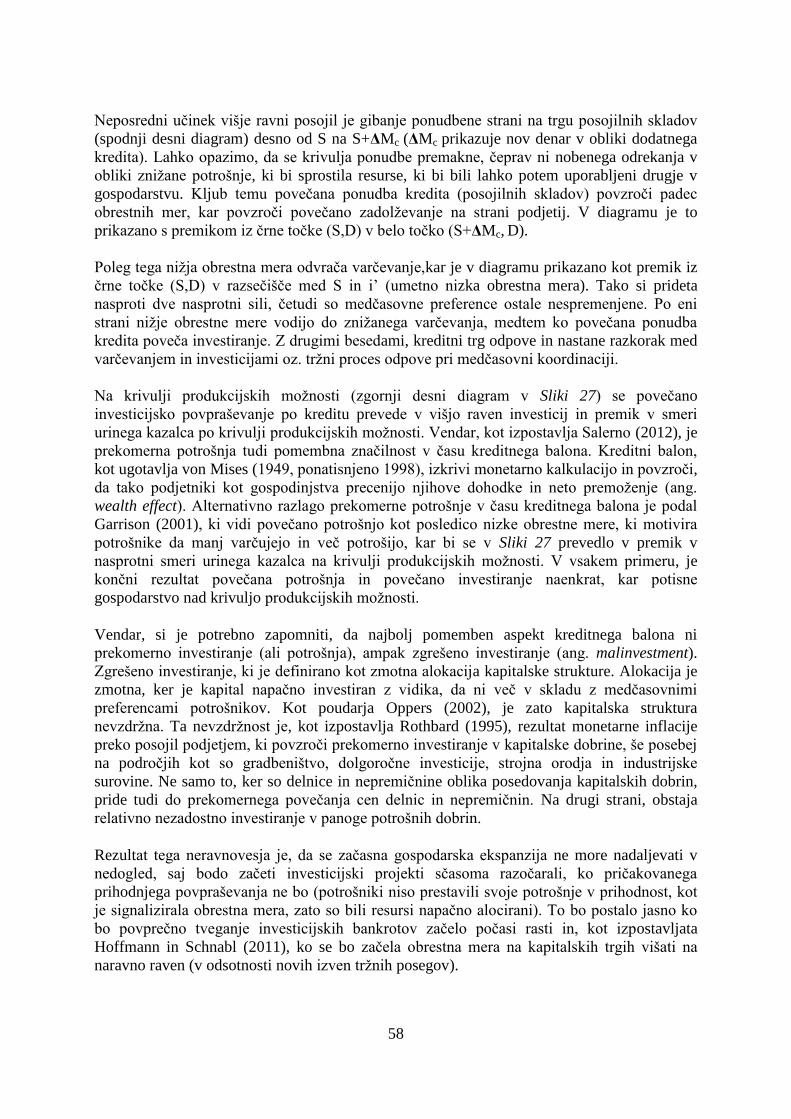
58
Neposredni učinek višje ravni posojil je gibanje ponudbene strani na trgu posojilnih skladov
(spodnji desni diagram) desno od S na S+ΔMc (ΔMc prikazuje nov denar v obliki dodatnega
kredita). Lahko opazimo, da se krivulja ponudbe premakne, čeprav ni nobenega odrekanja v
obliki znižane potrošnje, ki bi sprostila resurse, ki bi bili lahko potem uporabljeni drugje v
gospodarstvu. Kljub temu povečana ponudba kredita (posojilnih skladov) povzroči padec
obrestnih mer, kar povzroči povečano zadolževanje na strani podjetij. V diagramu je to
prikazano s premikom iz črne točke (S,D) v belo točko (S+ΔMc, D).
Poleg tega nižja obrestna mera odvrača varčevanje,kar je v diagramu prikazano kot premik iz
črne točke (S,D) v razsečišče med S in i’ (umetno nizka obrestna mera). Tako si prideta
nasproti dve nasprotni sili, četudi so medčasovne preference ostale nespremenjene. Po eni
strani nižje obrestne mere vodijo do znižanega varčevanja, medtem ko povečana ponudba
kredita poveča investiranje. Z drugimi besedami, kreditni trg odpove in nastane razkorak med
varčevanjem in investicijami oz. tržni proces odpove pri medčasovni koordinaciji.
Na krivulji produkcijskih možnosti (zgornji desni diagram v Sliki 27) se povečano
investicijsko povpraševanje po kreditu prevede v višjo raven investicij in premik v smeri
urinega kazalca po krivulji produkcijskih možnosti. Vendar, kot izpostavlja Salerno (2012), je
prekomerna potrošnja tudi pomembna značilnost v času kreditnega balona. Kreditni balon,
kot ugotavlja von Mises (1949, ponatisnjeno 1998), izkrivi monetarno kalkulacijo in povzroči,
da tako podjetniki kot gospodinjstva precenijo njihove dohodke in neto premoženje (ang.
wealth effect). Alternativno razlago prekomerne potrošnje v času kreditnega balona je podal
Garrison (2001), ki vidi povečano potrošnjo kot posledico nizke obrestne mere, ki motivira
potrošnike da manj varčujejo in več potrošijo, kar bi se v Sliki 27 prevedlo v premik v
nasprotni smeri urinega kazalca na krivulji produkcijskih možnosti. V vsakem primeru, je
končni rezultat povečana potrošnja in povečano investiranje naenkrat, kar potisne
gospodarstvo nad krivuljo produkcijskih možnosti.
Vendar, si je potrebno zapomniti, da najbolj pomemben aspekt kreditnega balona ni
prekomerno investiranje (ali potrošnja), ampak zgrešeno investiranje (ang. malinvestment).
Zgrešeno investiranje, ki je definirano kot zmotna alokacija kapitalske strukture. Alokacija je
zmotna, ker je kapital napačno investiran z vidika, da ni več v skladu z medčasovnimi
preferencami potrošnikov. Kot poudarja Oppers (2002), je zato kapitalska struktura
nevzdržna. Ta nevzdržnost je, kot izpostavlja Rothbard (1995), rezultat monetarne inflacije
preko posojil podjetjem, ki povzroči prekomerno investiranje v kapitalske dobrine, še posebej
na področjih kot so gradbeništvo, dolgoročne investicije, strojna orodja in industrijske
surovine. Ne samo to, ker so delnice in nepremičnine oblika posedovanja kapitalskih dobrin,
pride tudi do prekomernega povečanja cen delnic in nepremičnin. Na drugi strani, obstaja
relativno nezadostno investiranje v panoge potrošnih dobrin.
Rezultat tega neravnovesja je, da se začasna gospodarska ekspanzija ne more nadaljevati v
nedogled, saj bodo začeti investicijski projekti sčasoma razočarali, ko pričakovanega
prihodnjega povpraševanja ne bo (potrošniki niso prestavili svoje potrošnje v prihodnost, kot
je signalizirala obrestna mera, zato so bili resursi napačno alocirani). To bo postalo jasno ko
bo povprečno tveganje investicijskih bankrotov začelo počasi rasti in, kot izpostavljata
Hoffmann in Schnabl (2011), ko se bo začela obrestna mera na kapitalskih trgih višati na
naravno raven (v odsotnosti novih izven tržnih posegov).
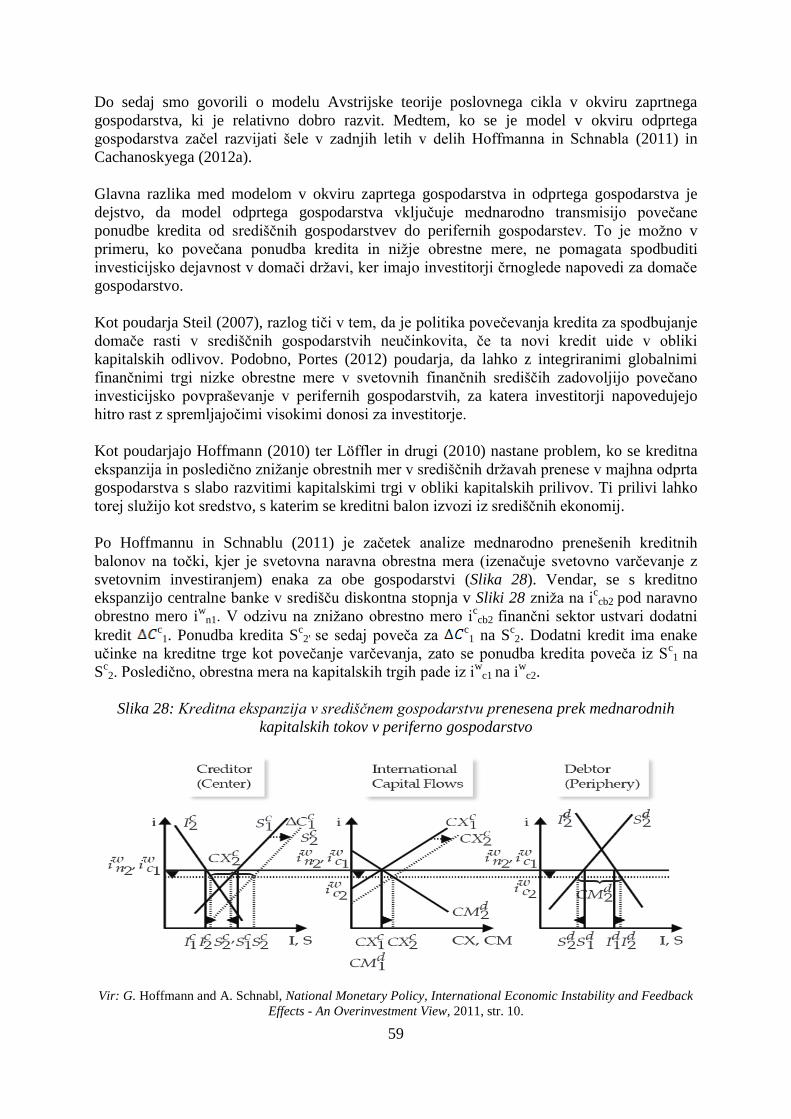
59
Do sedaj smo govorili o modelu Avstrijske teorije poslovnega cikla v okviru zaprtnega
gospodarstva, ki je relativno dobro razvit. Medtem, ko se je model v okviru odprtega
gospodarstva začel razvijati šele v zadnjih letih v delih Hoffmanna in Schnabla (2011) in
Cachanoskyega (2012a).
Glavna razlika med modelom v okviru zaprtega gospodarstva in odprtega gospodarstva je
dejstvo, da model odprtega gospodarstva vključuje mednarodno transmisijo povečane
ponudbe kredita od središčnih gospodarstvev do perifernih gospodarstev. To je možno v
primeru, ko povečana ponudba kredita in nižje obrestne mere, ne pomagata spodbuditi
investicijsko dejavnost v domači državi, ker imajo investitorji črnoglede napovedi za domače
gospodarstvo.
Kot poudarja Steil (2007), razlog tiči v tem, da je politika povečevanja kredita za spodbujanje
domače rasti v središčnih gospodarstvih neučinkovita, če ta novi kredit uide v obliki
kapitalskih odlivov. Podobno, Portes (2012) poudarja, da lahko z integriranimi globalnimi
finančnimi trgi nizke obrestne mere v svetovnih finančnih središčih zadovoljijo povečano
investicijsko povpraševanje v perifernih gospodarstvih, za katera investitorji napovedujejo
hitro rast z spremljajočimi visokimi donosi za investitorje.
Kot poudarjajo Hoffmann (2010) ter Löffler in drugi (2010) nastane problem, ko se kreditna
ekspanzija in posledično znižanje obrestnih mer v središčnih državah prenese v majhna odprta
gospodarstva s slabo razvitimi kapitalskimi trgi v obliki kapitalskih prilivov. Ti prilivi lahko
torej služijo kot sredstvo, s katerim se kreditni balon izvozi iz središčnih ekonomij.
Po Hoffmannu in Schnablu (2011) je začetek analize mednarodno prenešenih kreditnih
balonov na točki, kjer je svetovna naravna obrestna mera (izenačuje svetovno varčevanje z
svetovnim investiranjem) enaka za obe gospodarstvi (Slika 28). Vendar, se s kreditno
ekspanzijo centralne banke v središču diskontna stopnja v Sliki 28 zniža na iccb2 pod naravno
obrestno mero iw
n1. V odzivu na znižano obrestno mero iccb2 finančni sektor ustvari dodatni
kredit c1. Ponudba kredita S
c2' se sedaj poveča za
c1 na S
c2. Dodatni kredit ima enake
učinke na kreditne trge kot povečanje varčevanja, zato se ponudba kredita poveča iz Sc1 na
Sc2. Posledično, obrestna mera na kapitalskih trgih pade iz i
wc1 na i
wc2.
Slika 28: Kreditna ekspanzija v središčnem gospodarstvu prenesena prek mednarodnih
kapitalskih tokov v periferno gospodarstvo
Vir: G. Hoffmann and A. Schnabl, National Monetary Policy, International Economic Instability and Feedback
Effects - An Overinvestment View, 2011, str. 10.

60
Zaradi nižjih svetovnih obrestnih mer je investicijska dejavnost spodbujena v obeh državah
(iz Ic1 na I
c2 in iz I
d1 na I
d2), medtem ko varčevanje pade v obeh državah (iz S
c1 na S
c2 in iz S
d1
na Sd2). Izvoz kapitala iz središčnega gospodarstva naraste, kar se vidi v visokem presežku na
tekočem računu (CAc1 to CA
c2), medtem ko v periferiji deficiti na tekočem računu narastejo
(CAd
1 na CAd2). Torej se kapitalski odlivi (CX
c2) iz središčnega gospodarstva povišajo, kot
tudi kapitalski prilivi v periferijo (CMd
2).
Svetovno naravno obrestno mero smo definirali kot takšno v kateri je svetovno varčevanje
izenačeno s svetovnim investiranjem, vendar z ekspanzijo kredita, obrestna mera na
kapitalskih trgih pade pod naravno obrestno mero (iw
c2 < iw
n2). Agregirano varčevanje (Sc2 +
Sd2) in agregirano investiranje (I
c2 + I
d2) nista več v ravnotežju (S
c2 + S
d2 I
c2 + I
d2). Torej
svetovna struktura proizvodnje ni več v skladu z agregiranimi medčasovnimi preferencami
posameznikov v obeh gospodarstvih, kot smo videli v okviru zaprtega gospodarstva. Ravno
tako kot v okviru zaprtega gospodarstva je nova struktura proizvodnje nevzdržna, ker so
cenovni signali (obrestne mere na kapitalskih trgih) izkrivljeni, zato se tudi investicijski
projekti sčasoma izkažejo za nevzdržne.
Empirično smo preverili model odprtega gospodarstva na dveh študijah primerov. Na primeru
Argentine v letih 1880-1890 v prvem obdobju globalizacije, kot tudi na primeru Srednje in
Vzhodne Evrope v letih 2001-2008. V povzetku bo na kratko predstavljen primer Srednje in
Vzhodne Evrope v letih 2001-2008.
V študiji obravnamo 10 držav: Slovenijo, Slovaško, Češko, Poljsko, Estonijo, Latvijo, Litvo,
Romunijo, Madžarsko in Bolgarijo. Vse te države so tranzicijske države že od zgodnjih 1990-
ih in so se v obdobju po tranziciji približevala (konvergirala) k življenski ravni v razvitih
gospodarstvih Zahodne Evrope.
Vendar, je približevanje naletelo na oviro leta 2008, ko je Srednjo in Vzhodno Evropo močno
prizadela Velika recesija 2008. S tem, ko se je kriza širila skozi svetovno gospodarstvo, so
investitorji začeli preferirati bolj varne oblike investicij v razvitih gospodarstvih in so znatno
znižali investicije v Srednji in Vzhodni Evropi. Posledica je bil velik in nepričakovan padec v
kapitalskih prilivih (kriza nenadne zaustavitve), kot kaže Slika 29.
Slika 29: Neto zasebni finančni prilivi v centralno in vzhodno evropo (v % BDP), 1989-2009
Vir: T. Becker in drugi, Whither Growth in Central and Eastern Europe? Policy Lessons for an Integrated
Europe, 2010, str. 6.
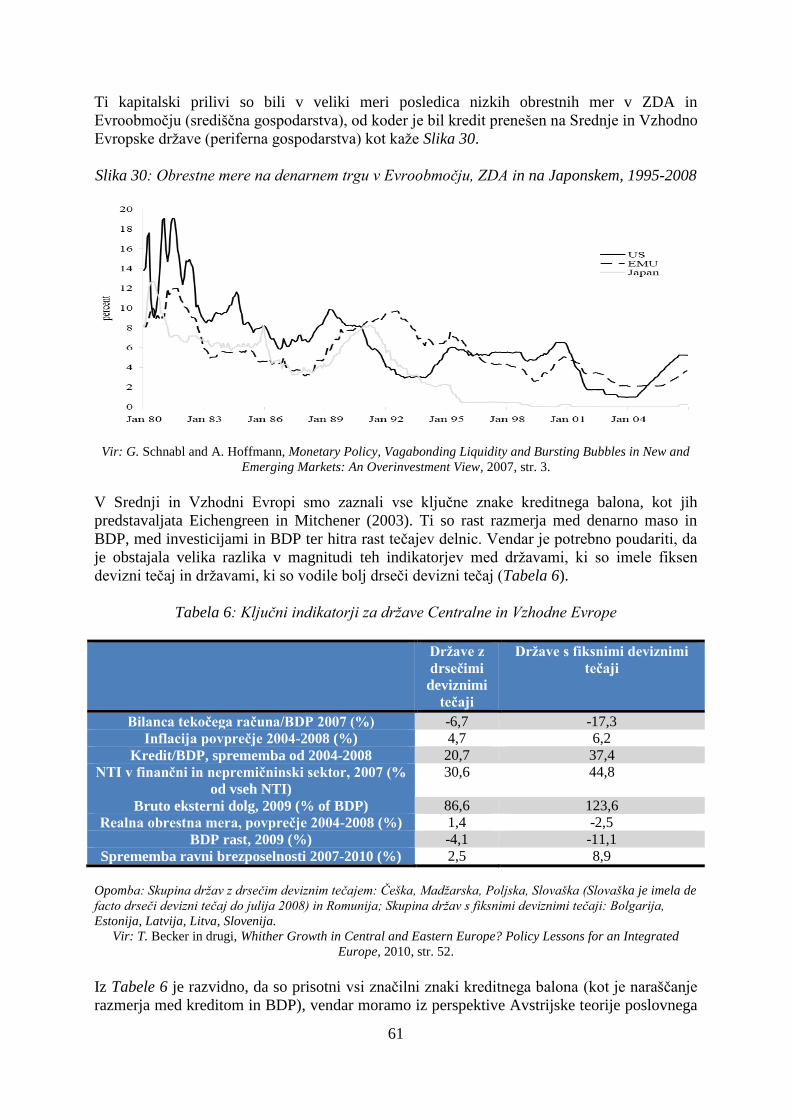
61
Ti kapitalski prilivi so bili v veliki meri posledica nizkih obrestnih mer v ZDA in
Evroobmočju (središčna gospodarstva), od koder je bil kredit prenešen na Srednje in Vzhodno
Evropske države (periferna gospodarstva) kot kaže Slika 30.
Slika 30: Obrestne mere na denarnem trgu v Evroobmočju, ZDA in na Japonskem, 1995-2008
Vir: G. Schnabl and A. Hoffmann, Monetary Policy, Vagabonding Liquidity and Bursting Bubbles in New and
Emerging Markets: An Overinvestment View, 2007, str. 3.
V Srednji in Vzhodni Evropi smo zaznali vse ključne znake kreditnega balona, kot jih
predstavaljata Eichengreen in Mitchener (2003). Ti so rast razmerja med denarno maso in
BDP, med investicijami in BDP ter hitra rast tečajev delnic. Vendar je potrebno poudariti, da
je obstajala velika razlika v magnitudi teh indikatorjev med državami, ki so imele fiksen
devizni tečaj in državami, ki so vodile bolj drseči devizni tečaj (Tabela 6).
Tabela 6: Ključni indikatorji za države Centralne in Vzhodne Evrope
Države z
drsečimi
deviznimi
tečaji
Države s fiksnimi deviznimi
tečaji
Bilanca tekočega računa/BDP 2007 (%) -6,7 -17,3
Inflacija povprečje 2004-2008 (%) 4,7 6,2
Kredit/BDP, sprememba od 2004-2008 20,7 37,4
NTI v finančni in nepremičninski sektor, 2007 (%
od vseh NTI)
30,6 44,8
Bruto eksterni dolg, 2009 (% of BDP) 86,6 123,6
Realna obrestna mera, povprečje 2004-2008 (%) 1,4 -2,5
BDP rast, 2009 (%) -4,1 -11,1
Sprememba ravni brezposelnosti 2007-2010 (%) 2,5 8,9
Opomba: Skupina držav z drsečim deviznim tečajem: Češka, Madžarska, Poljska, Slovaška (Slovaška je imela de
facto drseči devizni tečaj do julija 2008) in Romunija; Skupina držav s fiksnimi deviznimi tečaji: Bolgarija,
Estonija, Latvija, Litva, Slovenija.
Vir: T. Becker in drugi, Whither Growth in Central and Eastern Europe? Policy Lessons for an Integrated
Europe, 2010, str. 52.
Iz Tabele 6 je razvidno, da so prisotni vsi značilni znaki kreditnega balona (kot je naraščanje
razmerja med kreditom in BDP), vendar moramo iz perspektive Avstrijske teorije poslovnega
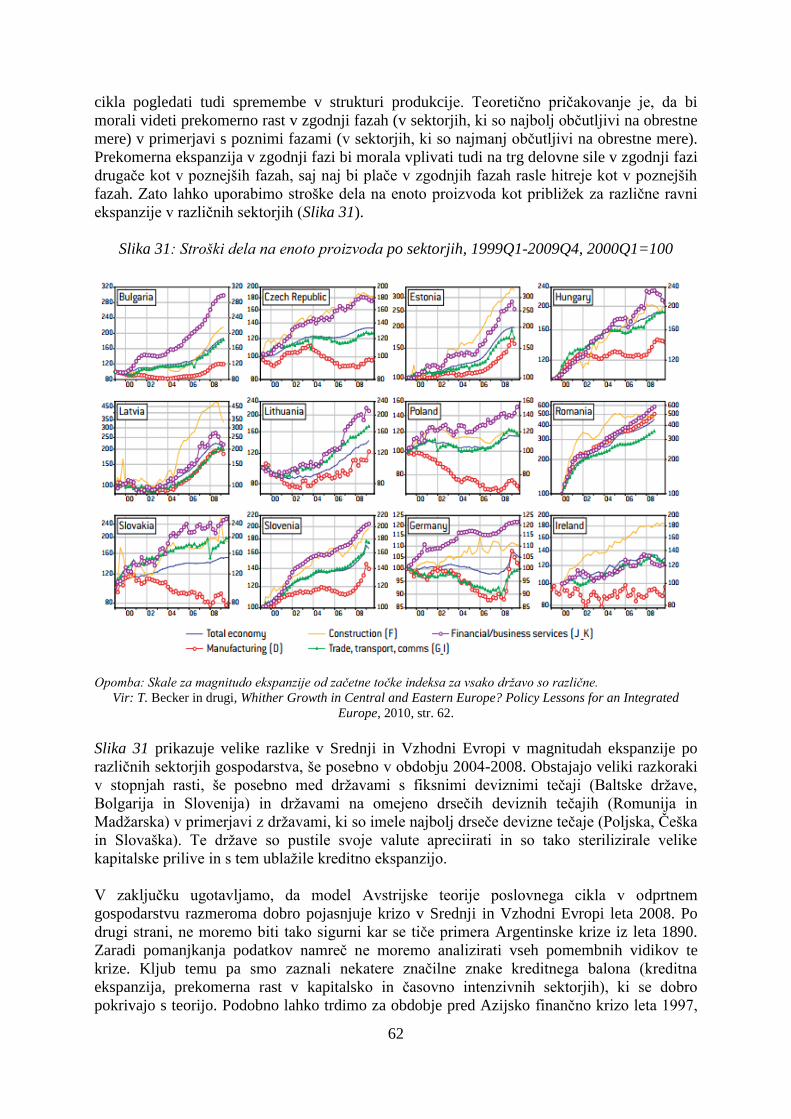
62
cikla pogledati tudi spremembe v strukturi produkcije. Teoretično pričakovanje je, da bi
morali videti prekomerno rast v zgodnji fazah (v sektorjih, ki so najbolj občutljivi na obrestne
mere) v primerjavi s poznimi fazami (v sektorjih, ki so najmanj občutljivi na obrestne mere).
Prekomerna ekspanzija v zgodnji fazi bi morala vplivati tudi na trg delovne sile v zgodnji fazi
drugače kot v poznejših fazah, saj naj bi plače v zgodnjih fazah rasle hitreje kot v poznejših
fazah. Zato lahko uporabimo stroške dela na enoto proizvoda kot približek za različne ravni
ekspanzije v različnih sektorjih (Slika 31).
Slika 31: Stroški dela na enoto proizvoda po sektorjih, 1999Q1-2009Q4, 2000Q1=100
Opomba: Skale za magnitudo ekspanzije od začetne točke indeksa za vsako državo so različne.
Vir: T. Becker in drugi, Whither Growth in Central and Eastern Europe? Policy Lessons for an Integrated
Europe, 2010, str. 62.
Slika 31 prikazuje velike razlike v Srednji in Vzhodni Evropi v magnitudah ekspanzije po
različnih sektorjih gospodarstva, še posebno v obdobju 2004-2008. Obstajajo veliki razkoraki
v stopnjah rasti, še posebno med državami s fiksnimi deviznimi tečaji (Baltske države,
Bolgarija in Slovenija) in državami na omejeno drsečih deviznih tečajih (Romunija in
Madžarska) v primerjavi z državami, ki so imele najbolj drseče devizne tečaje (Poljska, Češka
in Slovaška). Te države so pustile svoje valute apreciirati in so tako sterilizirale velike
kapitalske prilive in s tem ublažile kreditno ekspanzijo.
V zaključku ugotavljamo, da model Avstrijske teorije poslovnega cikla v odprtnem
gospodarstvu razmeroma dobro pojasnjuje krizo v Srednji in Vzhodni Evropi leta 2008. Po
drugi strani, ne moremo biti tako sigurni kar se tiče primera Argentinske krize iz leta 1890.
Zaradi pomanjkanja podatkov namreč ne moremo analizirati vseh pomembnih vidikov te
krize. Kljub temu pa smo zaznali nekatere značilne znake kreditnega balona (kreditna
ekspanzija, prekomerna rast v kapitalsko in časovno intenzivnih sektorjih), ki se dobro
pokrivajo s teorijo. Podobno lahko trdimo za obdobje pred Azijsko finančno krizo leta 1997,

63
čeprav so teoretične napovedi kar se tiče transmicijskega kanala deviznega tečaja
nekonsistentne z Azijsko izkušnjo.
Po drugi strani, smo uspeli razviti Avstrijsko teorijo poslovnega cikla v odprtem gospodarstvu
in znotraj tega transmicijski mehanizem, ki smo ga razvili na osnovi standardne Avstrijske
teorije poslovnega cikla, zato da lahko analiziramo problematiko kriz nenadnih zaustavitev
(ang. sudden stop). Krize nenadne zaustavitve so se začele pojavljati z liberalizacijo
kapitalskih tokov v 1980-ih letih, po kateri so mnoge države v razvoju trpele za krizami, ki so
bile povezane z dinamiko mednarodnih kapitalskih tokov.
Mednarodni kapitalski tokovi danes po mnenju mnogih eminentnih ekonomistov predstavljajo
gorivo za nastanek kreditnih balonov v državah v razvoju, zato so predlagali uporabo naukov
Avstrijske teorije poslovnega cikla za razlago dogajanja med kreditnimi ekspanzijami.
Ekspanzija kredita prek monetarne politike, kot pojasnjuje teorija, je nevzdržna, saj vpliva na
relativne cene in zato izkrivi strukturo proizvodnje v smeri bolj kapitalsko in časovno
intenzivnih (občutljivih na obrestne mere) sektorjev. Ker obrestne mere ne morejo biti
permanentno znižane pod naravno raven (te so odvisne od medčasovnih preferenc
potrošnikov) z ukrepi monetarne politike, se izkaže ekspanzija v sektorjih, ki so občutljivi na
spremembe obrestnih mer za nevzdržno, ko se obrestne mere dvignejo.
Vendar, kot kaže Avstrijska teorija poslovnega cikla v odprtem gospodarstvu, ekspanzija
kredita ni nujno sprožena s strani domače monetarne politike, saj je lahko rezultat ekspanzije
kredita v velikih finančnih središčih, katera je potem prenesena na majhna odprta
gospodarstva, ki so vezana na velika finančna središča.
Identificirali smo dva velika transmicijska kanala, ki prenašata kreditno ekspanzijo iz enega
gospodarstva v drugega. Eden je kanal obrestne mere, kjer so investitorji motivirani z
razlikami v obrestnih merah, da prekomerno investirajo v periferna gospodarstva. To lahko
vodi do kreditne ekspanzije v perifernem gospodarstvu, ki s sabo prinese vse značilnosti
opisane v standardni verziji Avstrijske teorije poslovnega cikla. Drug kanal je kanal
deviznega tečaja, ki doda še eno plast k teoriji, saj so analizirani še učinki politike deviznih
tečajev na relativno produkcijo menjalnih ter nemenjalnih dobrin in storitev.
Z uporabo teorij na empirična primera Srednje in Vzhodne Evrope v 21. stoletju in Argentine
v 19. stoletju, lahko pridemo do več zaključkov. Prvi je, da je Avstrijska teorija poslovnega
cikla uporabno orodje za analizo kriz nenadnih zaustavitev, saj se dobro pokriva z
empiričnimi opazovanji. Vsaj kar se tiče kriz v Argentini 1890, v Azijski finančni krizi 1997
in v Srednji in Vzhodni Evropi 2008, je moč opaziti hitro rast kredita v skladu s teorijo. Ko
pride do učinkov kreditne ekspanzije na strukturo proizvodnje, se teorija ponovno relativno
dobro izkaže v pojasnjevanju sprememb v strukturi produkcije med konjukturno fazo
poslovnega cikla.
Nadalje, se tudi transmisija kreditne ekspanzije v periferna gospodarstva ujema z empiričnimi
opazovanji. Čeprav kaže, da lahko kombinacija preudarne politike deviznih tečajev in
preudarne monetarne politike (kot na Poljskem, Češki in Slovaški) v veliki meri ublaži
prekomerno segrevanje gospodarstva med konjukturo in posledično tudi padec med recesijo.
Vendar, bi prihodnje študije morale podati bolj podrobne analize takšnih kriz nenadne
zaustavitve iz perspektive Avstrijske teorije poslovnega cikla. To je zato, ker naša študija ni
imela na voljo vseh resursov za bolj poglobljeno analizo Argentinske krize leta 1890 in tudi ni

64
zajela vseh dejavnikov specifičnih za posamezne države v študiji Srednje in Vzhodne Evrope.
Vendarle, naš razvoj Avstrijske teorije poslovnega cikla v okviru odprtega gospodarstva daje
dobro podlago za takšno študijo.

65
REFERENCE LIST
1. Agenor, P.-R. (1998). The Surge in Capital Flows: Analysis of "Pull" and "Push" Factors.
International Journal of Finance and Economics, p. 39-57.
2. Alfaro, L., Kalemli-Ozcan, S., & Volosovych, V. (2008). Patterns, Paradoxes, and Puzzles
of International Capital Flows Revisited: The Role of Diversification. Annual Conference
on Financial Globalization and Adjustment (CEGE). Davis, California: University of
California.
3. Aslund, A. (2010). The Last Shall be the First: East European Financial Crisis.
Washington, DC: Peterson Institute for International Economics.
4. Backus, D. K., Kehoe, P. J., & Kydland, F. E. (1992). International Real Business Cycles.
The Journal of Political Economy, 100 (4), p. 745-775.
5. Basu, S., & Taylor, A. (1999). Business Cycles in International Historical Perspective.
Journal of Economic Perspectives, 13 (2), p. 45-68.
6. Becker, T., Daianu, D., Darvas, Z., Gligorov, V., Landesmann, M., Petrovic, P., et al.
(2010). Whither Growth in Central and Eastern Europe? Policy Lessons for an Integrated
Europe. Brussels: Bruegel Institute - Bruegel Blueprint Series.
7. Bloomfield, A. (1963). Short-term Capital Movements under the pre-1914 Gold Standard.
Princeton, NJ: International Finance Section, Dept. of Economics, Princeton University.
8. Boettke, P. J. (2010). Handbook on Contemporary Austrian Economics. Cheltenham, UK:
Edward Elgar Publishing limited.
9. Böhm-Bawerk, E. (1889, reprinted 1959). Capital and Interest, 3 volumes. South Holland,
Illinois: Libertarian Press.
10. Bordo, M. (2000). The Globalization of International Financial Markets: What Can
History Teach Us? International Financial Markets: The Challenge of Globalization.
College Station, TX: Texas A and M University.
11. Bordo, M. (2006). Sudden Stops, Financial Crises and Original Sin in Emerging
Countries: Déjà vu? NBER Working Paper No. 12393. Cambridge, Massachusetts:
National Bureau of Economic Research.
12. Bordo, M., & Eichengreen, B. (2000). Is the Crisis Problem Growing more Severe? Asset
Prices and Monetary Policies. Stockholm: Sveriges Riksbank.
13. Brenner, R. P. (2002). The Boom and the Bubble. New York: Verso.
14. Buch, C. M., & Lusinyan, L. (2000). Determinants of Short-term Debt. Working Paper
No. 994. Kiel, Germany: Kiel Institute of World Economics.
15. Cachanosky, N. (2012a). The Mises-Hayek Business Cycle Theory, Fiat Currencies and
Open Economies. Boston: Suffolk University.
16. Cachanosky, N. (2012b). The Law of National Guaranteed Banks in Argentina: 1887-
1890. Free Banking Failure of Regulatory Failure? The Independent Review, 16 (4), p.
569-590.
17. Cachanosky, N. (June 2013). Easy Money, the Fed, Latin America. Auburn, Alabama:
The Free Market.
18. Cachanosky, N., & Lewin, P. (2014). Financial Foundations of the Austrian Business
Cycle. 2014 Wirth Institute Workshop on Austrian Economics. Edmonton, Canada: Wirth
Institute for Austrian and Central European Studies.
19. Cali, M., Massa, I., & te Velde, D. W. (2008). The Global Financial Crisis: financial
flows to developing countries set to fall by one quarter . London: Overseas Development
Institute.

66
20. Calvo, G. (1998). Capital Flows and Capital-Market Crises: The Simple Economics of
Sudden Stops. Journal of Applied Economics, 1 (1), p. 35-54.
21. Calvo, G. (2013a). Puzzling Over the Anatomy of Crises: Liquidity and the Veil of
Finance. Mayekawa Lecture at the Institute for Monetary and Economic Studies
Conference. Tokyo: Bank of Japan.
22. Calvo, G. (2013b). The Liquidity Approach and the Price Theory of Money:
Disentangling the Mysteries of Financial Crises. New York, NY: Columbia University.
23. Calvo, G. (2014). Sudden Stop and Sudden Flood of Foreign Direct Investment: Inverse
Bank Run, Output and Welfare Distribution. Scandinavian Journal of Economics, 116 (1),
p. 5-19.
24. Calvo, G. A., & Mishkin, F. S. (2003). The Mirage of Exchange Rate Regimes for
Emerging Market Countries. Journal of Economic Perspectives, 17 (4), p. 99-118.
25. Calvo, G., & Reinhart, C. (2002). Fear of Floating. Quarterly Journal of Economics 107
(2), p. 379-408.
26. Calvo, G., Izquierdo, A., & Mejia, L.-F. (2004). On the Empirics of Sudden Stops: The
Relevance of Balance-Sheet Effects. Washington, DC: Inter-American Development
Bank.
27. Calvo, G., Izquierdo, A., & Talvi, E. (2006). Phoenix Miracles in Emerging Markets:
Recovering Without Credit From Systemic Financial Crises. Inter-American Development
Bank Research Department Working Paper 570. Washington, DC: Inter-American
Development Bank
28. Cassel, G. (1936). The Downfall of the Gold Standard. Oxford: Oxford University Press.
29. Catao, L. A. (2006). Sudden Stops and Currency Drops: A Historical Perspective.
Washington, DC: International Monetary Funds.
30. Cavallo, E. A., & Frankel, J. A. (2007). Does openess to trade make countries more
vulnerable to sudden stops, or less? Journal of International Money and Finance, p. 1-24.
31. Collyns, C., & Senhadji, A. (2003). Lending Booms, Real Estate Bubbles, and the Asian
Crisis. In W. C. Hunter, G. G. Kaufman, & M. Pomerleano, Asset Price Bubbles: The
Implications for Monetary, Regulatory, and International Policies (p. 101-127). Boston,
MA: Massachusetts Institute of Technology.
32. Committee on International Economic Policy and Reform. (2012). Banks and Cross-
Border Capital Flows: Policy Challenges and Regulatory Responses. Washington, DC:
Brookings Institute.
33. Corsetti, G., & Pesenti, P. (2001). International Dimensions of Optimal Monetary Policy.
NBER Working Paper No. 8230. Cambridge, Massachusetts: National Bureau of
Economic Research.
34. Corsetti, G., Pesenti, P., & Roubini, N. (1999). What caused the Asian currency and
financial crisis? Japan and the World Economy, 11, p. 305-373.
35. Dadush, U., Dasgupta, D., & Ratha, D. (December 2000). The Role of Short-term Debt in
Recent Crises. Finance & Development (a quarterly magazine of the IMF), 37 (4).
36. de Brouwer, G. (1999). Capital Flows to East Asia - the Facts. Capital Flows and the
International Financial System (p. 76-88). Kirribilli, Australia: Reserve Bank of Australia.
37. della Paolera, G., & Taylor, A. M. (2001). A Monetary and Financial Wreck: The Baring
Crisis, 1890-1891. In G. della Paolera, & A. M. Taylor, The Argentine Currency Board
and the Search for Macroeconomic Stability, 1880-1935 (p. 67-79). Chicago: University
of Chicago Press.
38. Dias, M. H., & Dias, J. (2013). Macroeconomic policy transmission and international
interdependence: A SVAR application to Brazil and US . EconomiA, 14 (2), p. 27-45.
67
39. Dooley, M. P., & Walsch, C. E. (1999). Academic Views of Capital Flows: An Expanding
Universe. Capital Flows and the International Financial System (p. 89-109). Kirribilli,
Australia: Reserve Bank of Australia.
40. Dowd, K. (1992). The Experience of Free Banking. London and New York: Routledge.
41. Ebeling, R. (August 18, 2014). Epic Times. Retrieved August 24, 2014, from
http://www.epictimes.com/2014/08/federal-reserve-policies-cause-booms-and-busts/
42. Feldstein, M., & Horioka, C. (1980). Domestic Saving and International Capital Flows.
The Economic Journal, 90, p. 314-329.
43. Fernandez-Arias, E., & Montiel, P. J. (1996). The Surge in Capital Inflows to Developing
Countries: An Analytical Overview. World Bank Economic Review, 10 (1), p. 51-77.
44. Fischer, S., Schnadt, N., Capie, F., & Goodhart, C. (1994). The Future of Central
Banking. Cambridge, UK: Press Syndicate of the University of Cambridge.
45. Fisher, I. (1933). The Debt-Deflation Theory of Great Depressions. Econometrica, 1, p.
337-357.
46. French, K., & Poterba, J. (1991). Investor Diversification and International Equity
Markets. American Economic Review, 81 (2), p. 222-226.
47. Friedman, M. (1953). The Case for Flexible Exchange Rates. In M. Friedman, Essays in
Positive Economics. Chicago: University of Chicago.
48. Furceri, D., Guichard, S., & Rusticelli, E. (2011). The Effect of Episodes of Large Capital
Inflows on Domestic Credit. Paris: Organization for Economic Cooperation and
Development (OECD).
49. Garrison, R. (1989). The Austrian Theory of the Business Cycle in Light of Modern
Macroeconomics. Review of Austrian Economics, 3, p. 3-29.
50. Garrison, R. W. (2001). Time and Money: The Macroeconomics of Capital Structure.
London and New York: Routledge.
51. Gourinchas, P.-O., & Obstfeld, M. (2012). Stories of the Twentieth Century for the
Twenty-first. American Economic Journal: Macroeconomics, 4, p. 226-265.
52. Harwick, C. (2012). Confidence in the Pyramid: Speculation, Calculation and
Stabilization in Hayek's Monetary Dilemma. Montreux, Switzerland: The Mont Pelerin
Society.
53. Hayek, F. A. (1935, reprinted 1967). Prices and Production, 2nd ed. New York: Augustus
M. Kelley.
54. Hayek, F. A. (1937). Monetary Nationalism and International Stability. Fairfield, NJ:
Augustus M. Kelley Publishers.
55. Heilperin, M. (1939). International Monetary Economics. London, New York, Toronto:
Longmans, Green and Co.
56. Hoffmann, A. (2010). An Overinvestment Cycle in Central and Eastern Europe?
Metroeconomica, 61 (4), p. 711-734.
57. Hoffmann, A. (2014). Zero-Interest Rate Policy And The Unintended Consequences In
Emerging Markets. Torino: International Center for Economic Research - Working Paper
Series, Working Paper No.2/2014. Torino: International Center for Economic Research.
58. Hoffmann, A., & Schnabl, G. (2011). National Monetary Policy, International Economic
Instability and Feedback Effects - An Overinvestment View. Global Financial Markets,
19, p. 1-21.
59. Hume, D. (1752). Political Discourses. London: The Walter Scott Publishing Co., Ltd.
60. Hume, M., & Sentance, A. (2009). The Global Credit Boom: Challenges for
Macroeconomics and Policy. Journal of International Money and Finance 28, p. 1426-
1461.
61. Institute of International Finance. (2013). IIF Capital Flows User Guide. Retrieved May
8, 2014 from IIF.com: http://www.iif.com/download.php?id=ZbHbVs3YbdA=
68
62. International Monetary Fund. (1998). World Economic Outlook 1998. Washington, DC:
International Monetary Funds.
63. International Monetary Fund. (2012). World Economic Outlook 2012. Washington, DC:
International Monetary Fund.
64. Jackson, D. (2000). The New National Accounts: An Introduction to the System of
National Accounts 1993 and the European System of Accounts 1995. Cheltenham, UK:
Edward Elgar Publishing.
65. Jorda, O., Schularick, M., & Taylor, A. M. (2011). When Credit Bites Back: Leverage,
Business Cycles and Crises. San Francisco: Federal Reserve Bank of San Francisco
Working Paper Series 27. San Francisco: Federal Reserve Bank of San Francisco.
66. Kaminsky, G., & Reinhart, C. (1998). Financial Crises in Asia and Latin America: Then
and Now. American Economic Review, 88, p. 444-448.
67. Keynes, J. M. (1924). A Tract on Monetary Reform. London: Macmillan and co.
68. Krugman, P. (1979). A Model of Balance-of-Payments Crises. Journal of Money, Credit
and Banking, 11 (3), p. 311-325.
69. Krugman, P. (2007). Currency Crises. Chicago: University of Chicago Press.
70. Krugman, P. (March 24, 2013). The New York Times. Retrieved June 29, 2014 from
www.nytimes.com: http://www.nytimes.com/2013/03/25/opinion/krugman-hot-money-
blues.html?_r=0
71. Labonte, M., & Makinen, G. E. (2008). Monetary Policy and the Federal Reserve:
Current Policy and Conditions. Washington, DC: Congressional Research Service.
72. Lane, P. R., & McQuade, P. (2014). Domestic Credit Growth and International Capital
Flows. Scandinavian Journal of Economics, 116 (1), p. 218-252.
73. Löffler, A., Schnabl, G., & Schobert, F. (2010). Inflation Targeting by Debtor Central
Banks in Emerging Market Economies. CESifo Working Paper 3138.
74. Lubik, T. A. (2007). Non-Stationarity and Instability in Small Open-Economy Models
Even When They Are "Closed". Economic Quarterly, 93 (4), p. 393-412.
75. Lucas, R. E. (1990). Why Doesn't Capital Flow from Rich to Poor Countries? The
American Economic Review, 80 (2), p. 92-96.
76. Marichal, C. (1989). A Century of Debt Crises in Latin America: From Independence to
the Great Depression, 1820-1930. Princeton, NJ: Princeton University Press.
77. McKinnon, R. (2003). Why Japan should Fix its Exchange Rate at ¥120 to the US$1.
Vancouver, Canada: APF Canada Publications.
78. McKinnon, R., & Pill, H. (1997). Credible Economic Liberalizations and Overborrowing.
American Economic Review 87 (2), Papers and Proceedings of the 104th Annual Meeting
of the American Economic Association, p. 189-193. New Orleans: American Economic
Association.
79. McKinnon, R., & Schnabl, G. (2004). The Return to Soft Dollar Pegging in East Asia:
Mitigating Conflicted Virtue. International Finance, 7 (2), p. 169-201.
80. Mendoza, E. G. (2010). Sudden Stops, Financial Crises, and Leverage. The American
Economic Review, 100 (5), p. 1941-1966.
81. Mitchener, K. J., & Weidenmier, M. D. (2006). The Baring Crisis and the Great
American Meltdown of the 1890s. Washington, DC: NBER.
82. Murphy, R. P. (May 5, 2014). The Importance of Capital in Economic Theory. Retrieved
May 8, 2014 from Library of Economics and Liberty:
http://www.econlib.org/library/Columns/y2014/Murphycapital.html
83. Murphy, R. P., Barnett, W., & Block, W. E. (2012). Testing Austrian Business Cycle
Theory? A Second Rejoinder to Andrew Young. Romanian Economic Business Review, 7
(3), p. 7-20.
69
84. Oppers, S. E. (2002). The Austrian Theory of Business Cycles: Old Lessons for Modern
Economic Policy? Paris: International Monetary Fund.
85. Organization for Economic Cooperation and Development (OECD). (2011). International
capital flows: Structural reforms and experience with the OECD Code of Liberalisation of
Capital Movements. Paris: OECD.
86. Ortiz, A., Ottonello, P., Sturzenegger, F., & Talvi, E. (2009). Dealing with an
International Credit Crunch, Policy Responses to Sudden Stops in Latin America.
Washington, DC: Inter-American Development Bank.
87. Ott, M. (2008). The Concise Encyclopedia of Economics. Retrieved May 8, 2014 from
Library of Economics and Liberty:
http://www.econlib.org/library/Enc/InternationalCapitalFlows.html
88. Portes, R. (2012). Monetary Policies and Exchange Rates at the Zero Lower Bound.
Journal of Money, Credit and Banking, 44, p. 157-164.
89. Prasad, E. (2013). Managing Capital Flow Volatility. BIS-Bank of Russia High-Level
Seminar. Moscow: BIS.
90. Prasad, E. S., & Rogoff, K. (2003). Effects of financial globalization on developing
countries. Washington, DC: IMF.
91. Radelet, S., & Sachs, J. (1998). The Onset of the East Asian Financial Crisis. In P.
Krugman ed., Currency Crises (p. 105-163). Chicago: The University of Chicago Press.
92. Reinhart, C. (2013). Goodbye Inflation Targeting, Hello Fear of Floating? Latin America
after the Global Financial Crisis. MPRA Working Paper 51282.
93. Rodrick, D., & Velasco, A. (1999). Short-term Capital Flows. Cambridge, MA: National
Bureau of Economic Research.
94. Rogoff, K. (1985). Can International Monetary Policy Cooperation be Counterproductive?
Journal of International Economics, 18, p. 199-217.
95. Rothbard, M. (1962, reprinted 2009). Man, Economy, and State with Power and Market,
Second edition. Auburn, Alabama: The Ludwig von Mises Institute.
96. Rothbard, M. (1963a, reprinted 2000). America's Great Depression. Auburn, Alabama:
Ludwig von Mises Institute.
97. Rothbard, M. (1963b). What has the Government Done to our Money? Auburn, Alabama:
The Ludwig von Mises institute.
98. Rothbard, M. (1995). Making Economic Sense. Auburn, Alabama: The Ludwig von Mises
Institute.
99. Salerno, J. (1994). Ludwig von Mises's Monetary Theory in Light of Modern Monetary
Theory. The Review of Austrian Economics, 8 (1), p. 71-115.
100. Salerno, J. (2010). Money, Sound and Unsound. Auburn, Alabama: The Ludwig von
Mises Institute.
101. Salerno, J. (2012). A Reformulation of Austrian Business Cycle Theory in Light of the
Financial Crisis. The Quarterly Journal of Austrian Economics, 15 (1), p. 3-44.
102. Schnabl, G., & Hoffmann, A. (2007). Monetary Policy, Vagabonding Liquidity and
Bursting Bubbles in New and Emerging Markets: An Overinvestment View. Munich:
CESifo Working Paper, No. 2100.
103. Schularick, M., & Taylor, A. (2009). Credit Boom Gone Bust: Monetary Policy,
Leverage Cycles and Financial Crises, 1870-2008. Cambridge, MA: National Bureau of
Economic Research.
104. Schuler, K. (1992). The World History of Free Banking: An Overview. In K. Dowd,
The Experience of Free Banking (p. 7-47). London: Routledge.
105. Solow, R. (1997). Is There a Core of Usable Macroeconomics We Should All Believe
In? American Economic Review, p. 230-232.
106. Steil, B. (May/June 2007). The End of National Currency. Foreign Affairs.

70
107. Stein, H. (2008). The Concise Encyclopedia of Economics. Retrieved May 8, 2014
from Library of Economics and Liberty.
108. Stone, I. (1999). British Direct and Portfolio Investment in Latin America before 1914.
Journal of Economic History, 37, p. 690-722.
109. Taleb, N. N. (2010). The Black Swan. London: Penguin Books Ltd.
110. Taylor, A. (2003). Capital Accumulation. In G. della Paolera, & A. Taylor, A New
Economic History of Argentina (p. 170-197). Cambridge, UK: Cambridge University
Press.
111. The World Bank. (August 13, 2014). Stock Markets, US$. Retrieved August 20, 2014
from The World Bank Website: http://data.worldbank.org/indicator/DSTKMKTXD
112. Tong, H., & Wei, S.-J. (2009). The Composition Matters: Capital Inflows and
Liquidity Crunch During a Global Economic Crisis. Washington, DC: IMF.
113. von Mises, L. (1949, reprinted 1998). Human Action. Auburn, Alabama: The Ludwig
von Mises Institute.
114. White, W. R. (2006). Is Price Stability Enough? Basel, Switzerland: Bank for
International Settlements.
115. White, W. R. (2012). Ultra Easy Monetary Policy and the Law of Unintended
Consequences. Dallas: Federal Reserve Bank of Dallas.
116. Wicksell, K. (1936, reprinted 1962). Interest and Prices ("Geldzins und Guterpreise"):
A Study of the Causes Regulating the Value of Money. New York, NY: Sentry Press.
117. Yahoo! Inc. (July 28, 2014). Yahoo! Inc. Retrieved August 5, 2014 from Yahoo!
Finance: finance.yahoo.com/

APPENDIXES

i
TABLE OF APPENDIXES
APPENDIX A: Table of Sudden Stop Episodes as Defined by Calvo et al. (2006), 1980-2006
.................................................................................................................................................... 1
APPENDIX B: Data on the Asian financial crisis of 1997 ........................................................ 1

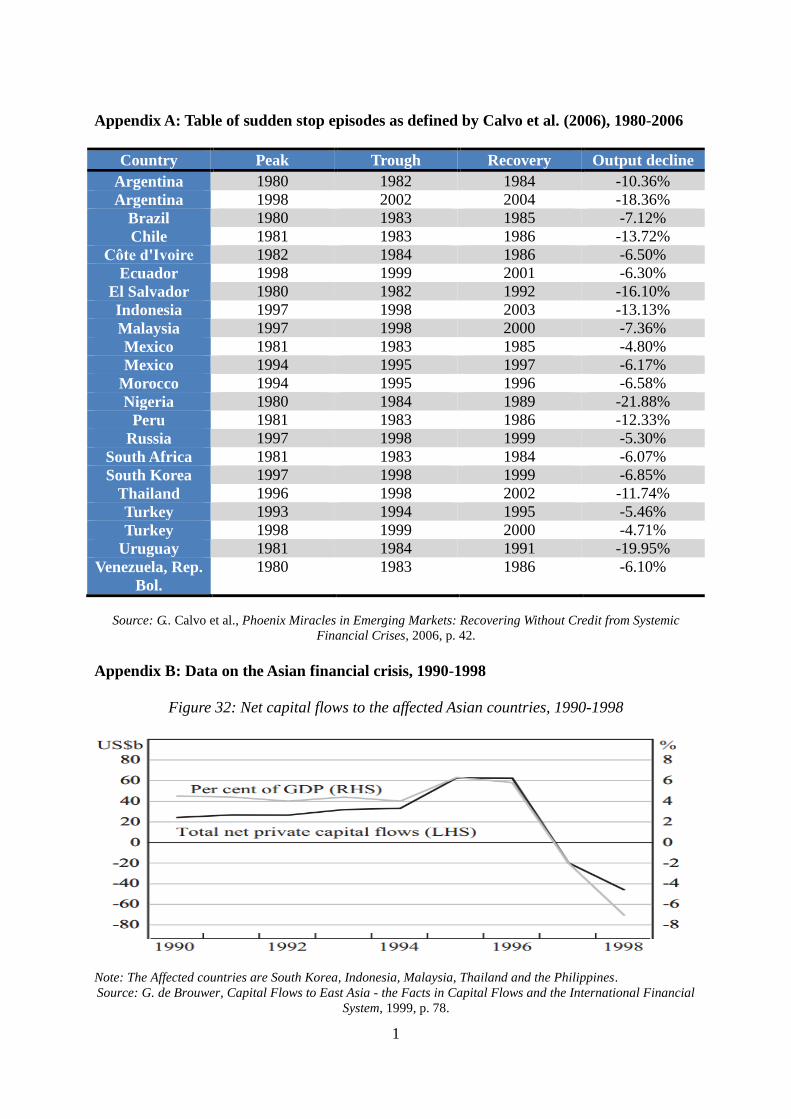
1
Appendix A: Table of sudden stop episodes as defined by Calvo et al. (2006), 1980-2006
Country Peak Trough Recovery Output decline
Argentina 1980 1982 1984 -10.36%
Argentina 1998 2002 2004 -18.36%
Brazil 1980 1983 1985 -7.12%
Chile 1981 1983 1986 -13.72%
Côte d'Ivoire 1982 1984 1986 -6.50%
Ecuador 1998 1999 2001 -6.30%
El Salvador 1980 1982 1992 -16.10%
Indonesia 1997 1998 2003 -13.13%
Malaysia 1997 1998 2000 -7.36%
Mexico 1981 1983 1985 -4.80%
Mexico 1994 1995 1997 -6.17%
Morocco 1994 1995 1996 -6.58%
Nigeria 1980 1984 1989 -21.88%
Peru 1981 1983 1986 -12.33%
Russia 1997 1998 1999 -5.30%
South Africa 1981 1983 1984 -6.07%
South Korea 1997 1998 1999 -6.85%
Thailand 1996 1998 2002 -11.74%
Turkey 1993 1994 1995 -5.46%
Turkey 1998 1999 2000 -4.71%
Uruguay 1981 1984 1991 -19.95%
Venezuela, Rep.
Bol.
1980 1983 1986 -6.10%
Source: G.. Calvo et al., Phoenix Miracles in Emerging Markets: Recovering Without Credit from Systemic
Financial Crises, 2006, p. 42.
Appendix B: Data on the Asian financial crisis, 1990-1998
Figure 32: Net capital flows to the affected Asian countries, 1990-1998
Note: The Affected countries are South Korea, Indonesia, Malaysia, Thailand and the Philippines.
Source: G. de Brouwer, Capital Flows to East Asia - the Facts in Capital Flows and the International Financial
System, 1999, p. 78.
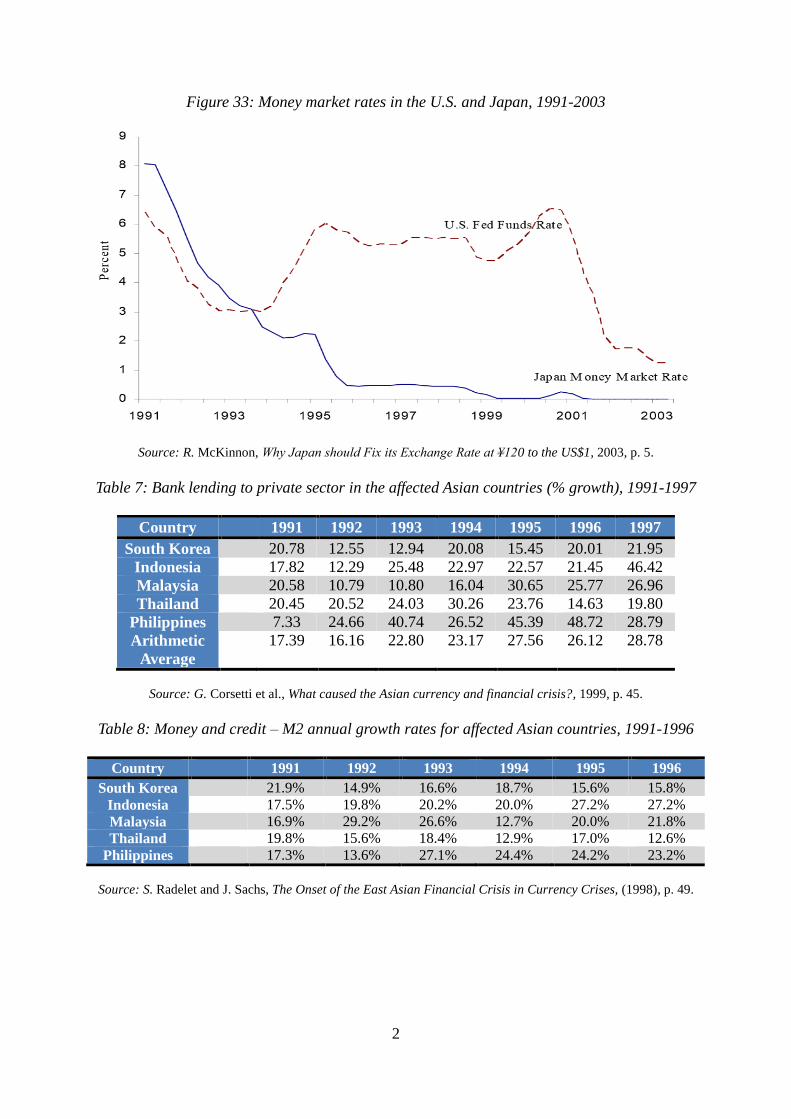
2
Figure 33: Money market rates in the U.S. and Japan, 1991-2003
Source: R. McKinnon, Why Japan should Fix its Exchange Rate at ¥120 to the US$1, 2003, p. 5.
Table 7: Bank lending to private sector in the affected Asian countries (% growth), 1991-1997
Country 1991 1992 1993 1994 1995 1996 1997
South Korea 20.78 12.55 12.94 20.08 15.45 20.01 21.95
Indonesia 17.82 12.29 25.48 22.97 22.57 21.45 46.42
Malaysia 20.58 10.79 10.80 16.04 30.65 25.77 26.96
Thailand 20.45 20.52 24.03 30.26 23.76 14.63 19.80
Philippines 7.33 24.66 40.74 26.52 45.39 48.72 28.79
Arithmetic
Average
17.39 16.16 22.80 23.17 27.56 26.12 28.78
Source: G. Corsetti et al., What caused the Asian currency and financial crisis?, 1999, p. 45.
Table 8: Money and credit – M2 annual growth rates for affected Asian countries, 1991-1996
Country 1991 1992 1993 1994 1995 1996
South Korea 21.9% 14.9% 16.6% 18.7% 15.6% 15.8%
Indonesia 17.5% 19.8% 20.2% 20.0% 27.2% 27.2%
Malaysia 16.9% 29.2% 26.6% 12.7% 20.0% 21.8%
Thailand 19.8% 15.6% 18.4% 12.9% 17.0% 12.6%
Philippines 17.3% 13.6% 27.1% 24.4% 24.2% 23.2%
Source: S. Radelet and J. Sachs, The Onset of the East Asian Financial Crisis in Currency Crises, (1998), p. 49.
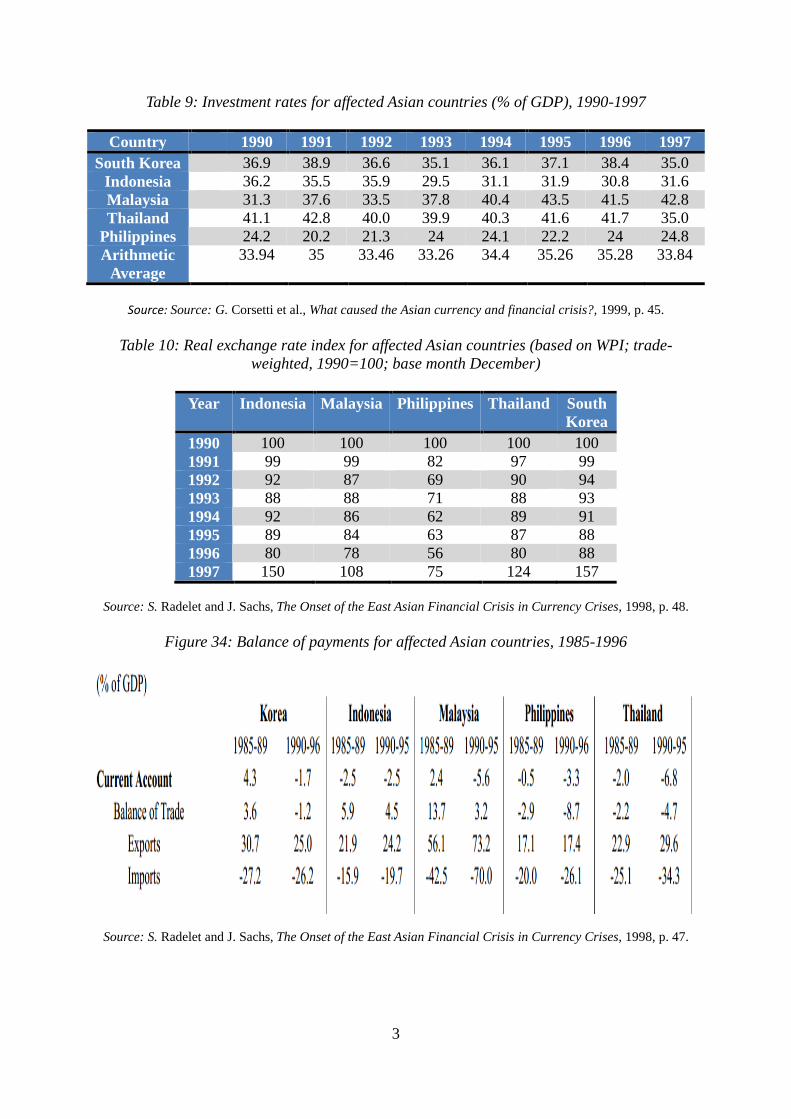
3
Table 9: Investment rates for affected Asian countries (% of GDP), 1990-1997
Country 1990 1991 1992 1993 1994 1995 1996 1997
South Korea 36.9 38.9 36.6 35.1 36.1 37.1 38.4 35.0
Indonesia 36.2 35.5 35.9 29.5 31.1 31.9 30.8 31.6
Malaysia 31.3 37.6 33.5 37.8 40.4 43.5 41.5 42.8
Thailand 41.1 42.8 40.0 39.9 40.3 41.6 41.7 35.0
Philippines 24.2 20.2 21.3 24 24.1 22.2 24 24.8
Arithmetic
Average
33.94 35 33.46 33.26 34.4 35.26 35.28 33.84
Source: Source: G. Corsetti et al., What caused the Asian currency and financial crisis?, 1999, p. 45.
Table 10: Real exchange rate index for affected Asian countries (based on WPI; trade-
weighted, 1990=100; base month December)
Year Indonesia Malaysia Philippines Thailand South
Korea
1990 100 100 100 100 100
1991 99 99 82 97 99
1992 92 87 69 90 94
1993 88 88 71 88 93
1994 92 86 62 89 91
1995 89 84 63 87 88
1996 80 78 56 80 88
1997 150 108 75 124 157
Source: S. Radelet and J. Sachs, The Onset of the East Asian Financial Crisis in Currency Crises, 1998, p. 48.
Figure 34: Balance of payments for affected Asian countries, 1985-1996
Source: S. Radelet and J. Sachs, The Onset of the East Asian Financial Crisis in Currency Crises, 1998, p. 47.

4
Figure 35: Stock market prices indices for affected Asian countries, 1991-2001
Source: C. Collyns and A. Senhadji, Lending Booms, Real Estate Bubbles, and the Asian Crisis in Asset Price
Bubbles: The Implications for Monetary, Regulatory, and International Policies, 2003, p. 25.
Figure 36: Property stock index for affected Asian countries, 1991-2001
Source: C. Collyns and A. Senhadji, Lending Booms, Real Estate Bubbles, and the Asian Crisis in Asset Price
Bubbles: The Implications for Monetary, Regulatory, and International Policies, 2003, p. 27.
Figure 37: Stock market indices for banks and financial institutions for affected Asian
countries, 1991-2001
Source: C. Collyns and A. Senhadji, Lending Booms, Real Estate Bubbles, and the Asian Crisis in Asset Price
Bubbles: The Implications for Monetary, Regulatory, and International Policies, 2003, p. 26.