University of Groningen The education divide in Indonesia ... file5 Organizational and ideological...
33
University of Groningen The education divide in Indonesia Muttaqin, Tatang IMPORTANT NOTE: You are advised to consult the publisher's version (publisher's PDF) if you wish to cite from it. Please check the document version below. Document Version Publisher's PDF, also known as Version of record Publication date: 2017 Link to publication in University of Groningen/UMCG research database Citation for published version (APA): Muttaqin, T. (2017). The education divide in Indonesia: Four essays on determinants of unequal access to and quality of education. [Groningen]: University of Groningen. Copyright Other than for strictly personal use, it is not permitted to download or to forward/distribute the text or part of it without the consent of the author(s) and/or copyright holder(s), unless the work is under an open content license (like Creative Commons). Take-down policy If you believe that this document breaches copyright please contact us providing details, and we will remove access to the work immediately and investigate your claim. Downloaded from the University of Groningen/UMCG research database (Pure): http://www.rug.nl/research/portal. For technical reasons the number of authors shown on this cover page is limited to 10 maximum. Download date: 18-08-2019
Transcript of University of Groningen The education divide in Indonesia ... file5 Organizational and ideological...

University of Groningen
The education divide in IndonesiaMuttaqin, Tatang
IMPORTANT NOTE: You are advised to consult the publisher's version (publisher's PDF) if you wish to cite fromit. Please check the document version below.
Document VersionPublisher's PDF, also known as Version of record
Publication date:2017
Link to publication in University of Groningen/UMCG research database
Citation for published version (APA):Muttaqin, T. (2017). The education divide in Indonesia: Four essays on determinants of unequal access toand quality of education. [Groningen]: University of Groningen.
CopyrightOther than for strictly personal use, it is not permitted to download or to forward/distribute the text or part of it without the consent of theauthor(s) and/or copyright holder(s), unless the work is under an open content license (like Creative Commons).
Take-down policyIf you believe that this document breaches copyright please contact us providing details, and we will remove access to the work immediatelyand investigate your claim.
Downloaded from the University of Groningen/UMCG research database (Pure): http://www.rug.nl/research/portal. For technical reasons thenumber of authors shown on this cover page is limited to 10 maximum.
Download date: 18-08-2019

5
Organizational and ideological differences between private Islamic schools in Indonesia and their effects on
student achievement and the achievement gap10
Abstract
The expansion of private secondary schools in Indonesia is a double-edged sword,
particularly when inequality is high on the development agenda. On the one hand, private
secondary schools are becoming more important providers and are thus important in
improving access to education. On the other hand, the quality of private schools is lower
than that of public schools. In our study, one of the first to examine the effects of different
types of private Islamic schools on student achievement and achievement gaps, we
develop a typology of Indonesian private Islamic schools, divided along track and stream.
We formulate hypotheses, drawing on an education production function approach that
outlines differences in investment and resource allocation decisions across these tracks
and streams. We contend that devoting more time, money and attention to students will
lead to greater numbers of students learning, and to higher student performance and
smaller achievement gaps. We tested our hypotheses using Indonesian data collected in
2013 on 156,952 students nested in 3,150 schools in 366 municipalities. Using multilevel
regression analyses, we found that student achievement and achievement gaps vary over
private Islamic school tracks and streams. Even though student achievement and
achievement gaps are strongly determined by student and family characteristics, our
findings suggest that differences between school tracks and streams also play an
important role. Moreover, our study revealed a large variability in student achievement
and achievement gaps between municipalities.
10 This chapter is co-authored with Rafael Wittek, Liesbet Heyse and Marijtje van Duijn and is
currently under review at an international peer-review journal.

110
5.1 Introduction
The number of private secondary schools in Indonesia is growing. Almost 60 percent of
Indonesian secondary schools are private in nature, as are more than half of junior
secondary schools and almost 70 percent of senior secondary schools (Bappenas, 2015).
Private secondary schools are thus becoming more important education service providers
in Indonesia.
Within the group of private secondary schools, more than 90 percent are Islamic in
nature, meaning that there is explicit attention to the spirit of Islam in the curriculum
(calculated from the MoEC, 2013). Private Islamic schools are argued to be popular
because they are less expensive and have a higher level of religious instruction than public
schools (Woodward, Rohmaniyah, Amin, & Coleman, 2010). This is illustrated by the fact
that in Indonesia the number of private madrasah schools (a particular kind of private
Islamic school) annually increases by an average of 3.9 percent while the average growth
of public schools is only 1.5 percent (USAID, 2007).
However, students’ achievement in Indonesian private schools is lower than
students' achievement in public schools. For example, Newhouse and Beegle (2006)
examined the impact of school type on the academic achievement of junior secondary
school students in Indonesia. After controlling for a variety of other characteristics, the
conclusion was that private school students’ scores in the national exam were 0.15 to 0.3
standard deviations lower than those of their comparable public school peers. These
lower students’ scores are puzzling as well as challenging because of their potential
negative impact on student achievement in general.
Studies on differences in student achievement focus predominantly on the
difference between public and private schools (e.g. Bernando et al., 2015; Braun et al.,
2006). Interestingly, there is little attention to differences between private schools in
general, and between Islamic private schools in particular, even though these differences
are quite pronounced and might matter for explaining differences in student
achievement, as we will later argue. This study therefore asks whether and how
differences between private Islamic schools in Indonesia affect student achievement as
well as achievement gaps for boys and girls, and for groups of different social economic
status (SES).
Though inequalities have decreased during the past years, the achievement gap
across SES and gender in Indonesia is still large (Tobias, Wales, Syamsulhakim, &
Suharti, 2014; World Bank, 2013). Our study defines the achievement gap as: the
observed differences in student achievement, measured by cognitive test scores between
groups of students, especially groups defined by socioeconomic status (SES) and gender
(Reardon, 2011; Kafir, 2007). Seminal studies examined achievement gaps across SES
and gender, also in the Indonesian context. For instance, high SES is linked to higher
student achievement (Suharti, 2013). According to the OECD international benchmark
with a 1000-point scale, the average scores of students from families in the bottom

111
income quintile are 350 in mathematics and 400 in reading (Tobias et al., 2014; World
Bank, 2013) whereas average scores of their peers in the top income quintile are 390 and
420, respectively (Tobias et al., 2014). Interestingly, in Indonesia, girls perform better
than boys in all subjects (Suharti, 2013; Suryadarma, 2010). However, there is no study
that examines the possible effects of differences between various types of Islamic private
schools on student achievement and the student achievement gaps across SES and gender
in Indonesia.
This paper identifies two key differences in private Islamic schools in Indonesia
that might affect student achievement and achievement gaps. First, there are ideological
differences relating to how private Islamic education providers interpret their religion in
the Indonesian social and educational context. These ideological differences are reflected
in three streams in Indonesian private Islamic schools, which we will elaborate in the
remainder of this paper: Traditionalists, Modernists and Integrationists (Ishomudin,
2014; Bryner, 2013; Hassan, 2009). Second, there are organizational differences related
to the role of the government in managing private Islamic schools. Here the distinction
between madrasah and non-madrasah is relevant, resulting in two tracks in private
Islamic schools. Non-madrasah private Islamic schools are coordinated by the Ministry of
Education and Cultre (MoEC), whereas madrasah private Islamic schools are managed by
the Ministry of Religious Affairs (MoRA).
Based on the above two distinctions, this paper identifies six types of private
Islamic schools: (1) Traditional madrasah; (2) Traditional non-madrasah; (3) Modernist
madrasah; (4) Modernist non-madrasah; (5) Integrationist madrasah; and (6)
Integrationist non-madrasah. More specifically, this paper addresses the question: How
do various tracks and streams in Indonesian Islamic private schools affect students’
academic achievements and achievement gaps across gender and parental SES?
We base the answer to our research question on an education production function
approach, which assumes that student achievement is a function of a school's investment
in teaching-related activities and resources (Hanushek, 2007; Coates, 2003; Bowles,
1970). Hence the amount of time, money and attention devoted to students will affect
how much they learn, as well as their performance and the gaps in their achievements.
Using this point of departure, we reason that the above-mentioned ideological and
organizational differences between Islamic private schools have consequences for
investment and resource allocation decisions within the six different types of schools.
We specify our theoretical expectations by distinguishing four dimensions of
investments: (1) investments in the primary process, such as the amount of time spent on
teaching and the amount of emphasis on particular subjects; (2) investments in teachers,
including selection of high quality teachers and improving teachers by training; (3)
investments in students by financially supporting poorer students and implementing
single sex classrooms; and (4) investments in organization and coordination. We
categorize the six types of private Islamic schools with regard to these investment
dimensions and analyze which school type makes most investments and thus can be

112
expected to have better student achievements and smaller achievement gaps. Multilevel
regression analyses (e.g. Snijders and Bosker, 2012) are used to test to what degree the six
types of private Islamic schools, and the associated differences in investments and
resource allocation decisions, affect student achievement and the achievement gap in
Indonesia. The focus is on junior secondary schools in 2013.
Our study enriches the current literature in at least three respects. First, this is to
our knowledge the first quantitative study that systematically compares differences
within the Islamic private school sector in Indonesia, the country with the highest Muslim
population in the world. While several systematic reviews on track and stream differences
between private Islamic schools in Indonesia have been undertaken (see e.g. Ishomudin,
2014; Barton, 2014; Hassan, 2009), none directly tested the relation between these
differences and student achievement and achievement gaps in terms of gender and
parental SES. Second, by testing the education production function construct in relation
to track and stream differences between various types of Islamic private schools in
Indonesia, we enrich the literature that deals with how investment and resource
allocation differences between schools affect student achievement. Third, by offering a
more fine-grained understanding of the effect of organizational and ideological
differences in private Islamic schools this study may contribute to the development of
policy recommendations aimed at strengthening the Indonesian national education
system (Kingham & Parsons, 2013).
The next section describes Indonesia’s school system. Section 3 sketches our
theoretical framework and derives testable hypotheses. Then it follows an explanation of
our data, method and results. We conclude with a discussion of policy recommendations
and avenues for future research.
5.2 Organizational and ideological differences in private Islamic school
The school system in Indonesia consists of nine years of compulsory basic education,
combining six years of primary school (grades 1-6) and three years of junior secondary
school (grades 7-9). After completing their basic education, students follow three years of
senior secondary school (grades 10-12).
As stated previously, schools in Indonesia are either private or public. Within the
private education sector, most schools are Islamic. Islamic private schools can be under
management of the MoRA or the MoEC, resulting in two possible private Islamic school
tracks: madrasah versus non-madrasah. Next to this organizational difference, private
Islamic schools also differ ideologically. This is reflected in the presence of three streams
in private Islamic education, which are coordinated and run by three large non-
governmental Muslim organizations that play an important role in the delivery of
educational services: a Modernist stream, a Traditionalist stream and an Integrationist
stream (USAID, 2007; Hasan, 2009).

113
The modernist stream is run by Muhammadiyah, Indonesia’s oldest Muslim mass
organization. It was established in 1912 in Yogyakarta based on the principles of
modernist and moderate Islam (Suharto, 2014). It is called modernist because it rejects
local customs in favor of the universal practices of modern Islam (Palmier, 1954). For
instance, it initially established modern schools replicating Dutch schools by
implementing graded classes with a curriculum of secular subjects by including religious
education (Burhani, 2005). Currently, it is the largest private education provider, running
4,623 preschools and 5,691 educational institutions from primary to higher education11.
The traditionalist stream, called Nahdatul Ulama (NU), which means the
awakening of Islamic scholars, has played a significant role in the provision of education
in Indonesia since the late colonial era (USAID, 2007). NU is the largest Muslim mass
organization in the country and was established on 31 January 1926 in Surabaya. It is
called traditionalist because it emphasizes the traditional meaning of Islam in the
Indonesian context. It manages and coordinates about 6.000 educational institutions
from preschools to universities and colleges.12
The integrationist stream is the third stream. This stream is represented by the
network of Integrated Islamic schools (Jaringan Sekolah Islam Terpadu/JSIT), a fairly
new consortium that was established on 31 July 2003 in Yogyakarta. Integrationist
schools offer an integrated secular curriculum within an Islamic moral framework
(Bryner, 2013). They integrate general and religious subjects by incorporating religious
values in almost all subjects. Currently, the JSIT consortium includes 1,926 member
schools and more than 500 affiliated schools (interview with Chairman JSIT,
16/12/2015).
While the Modernist movement is primarily a social welfare organization devoted
to serving the community in education and healthcare and is characterized by egalitarian
and non-hierarchical relations (Palmer & Burgess, 2012; Thachil, 2014), the
Traditionalists are dedicated to protecting the interests of clerical elites (Thachil, 2014;
Millie, 2013). The new- comers, the Integrationists, resemble the Traditionalists with
their focus on clerical elites; however, this is combined with a modern agenda that is
slightly similar to that of the Modernist movement (Hasan, 2009).
Based on the above-mentioned ideological and organizational differences we can
distinguish six types of private Islamic schools: (1) Traditionalist non-madrasah; (2)
Traditionalist madrasah; (3) Modernist non-madrasah; (4) Modernist madrasah; (5)
Integrationist non-madrasah; (6) Integrationist madrasah.
11 Data available at http://www.muhammadiyah.or.id/content-8-det-amal-usaha.html 12 Available at http://www.maarif-nu.or.id/Profil.aspx

114
5.3 Theory
In order to answer the research question of how the various private Islamic school tracks
and streams affect student achievements and achievement gaps, we use an input-based or
“production function” approach. This assumes that student achievement is a function of
the school's investments in activities and resources related to teaching, like time for
instruction (Hanushek, 2007): the higher these investments, the more students will learn,
and the better they will perform (Coates, 2003). Our study uses the typology of school
tracks and streams to assess variations in such investments, and relates them to
achievement of individual students as output (Hanushek, 2007; Bowles, 1970).
Hanushek (2007) distinguished two inputs that significantly contribute to student
achievement: investments directly controlled by policy makers, such as teachers, and
inputs not controlled by policy makers, such as those provided by families (e.g. parental
education and income). Most research focuses on inputs like school resources, such as the
effects of teacher qualification and experience, or financial resources, on student
achievement (Hanushek, 2007).
Next to schools and families, there is another level of input. These are investments
that are partly determined by the individual schools but also by the streams, as
represented by the three Muslim umbrella organizations. This includes, for example, the
choice of whether to have boys and girls together in the classroom, or decisions about how
much time is spent on religious education next to the examination subjects. Beside the
stream, schools also are divided by two tracks, madrasah versus non-madrasah. This
track relates to government policy, which also influences the schools’ investment and in
turn affects student achievement. For instance, in the US, the way state governments
provide sources of funding and regulate rules for certification affects student achievement
(Hanushek, 2007). Likewise, the central and local governments in Indonesia play a very
crucial role in educational policy and practice.
Adopting Hanushek’s classification of inputs and organizational approaches, we
distinguish four dimensions of school investments: (1) investments in the primary
process, such as how much time is spent on teaching and whether particular subjects
receive more attention than others (Coates, 2003); (2) investments in teachers, including
selecting high quality teachers and training teachers; (3) investments in students by
financially supporting poorer students and implementing single sex classrooms; and (4)
investments in organization and coordination.
Our main argument is that tracks and streams of Indonesian private Islamic
schools differ in their decisions with regard to these four types of investment.
Consequently, we expect that they also are the primary factor explaining between-school
variations in student achievement and gender and SES achievement gaps.

115
5.3.1 School track differences and student achievement
If we look at investments in the primary process, all Islamic private schools, both
madrasahs and non-madrasahs, follow the national curriculum. However, madrasahs
teach a core curriculum of general subjects supplemented by an additional 30 percent of
religious education subjects (SKB Tiga Menteri No. 6/1975). In non-madrasah schools,
there is less attention to religious subjects. Consequently, students in non-madrasah
schools spend more time on National Examination subjects. More teaching significantly
enhances student performance (Stinebrickner & Stinebrickner, 2008), especially in
mathematics and science (Grave, 2010). Consequently, we expect student achievement in
madrasahs to be lower than in non-madrasahs.
In terms of investments in teachers, the Ministry of Education and Culture
(MoEC), as well as local governments, facilitate both public and private non-madrasah
teachers to enhance their professional skills and qualifications (USAID, 2007). The
Ministry of Religious Affairs (MoRA) fully supports public madrasah schools, but does
not provide as much funding and training for private madrasahs (Kingham & Parsons,
2013).
Moreover, Law 14/2005 concerning Teachers and University Lecturers states that
all teachers at the junior secondary level must have a four-year post-secondary diploma or
a bachelor’s degree in the relevant subject. The fulfillment of this teachers’ qualification in
non-madrasah schools is higher, with 61 percent as compared with 55 percent of teachers
meeting this qualification in madrasahs; this means that almost 45 percent of madrasah
teachers do not have a four-year post-secondary diploma (USAID, 2007). Teacher
development and qualification may influence subject matter knowledge and pedagogical
skills, which in turn may bolster or undermine teacher performance and student
achievement (Darling-Hammond, 2000). Consequently, lower teacher qualifications are
assumed to be related to lower teacher performance and lower quality of learning in
madrasahs (Kingham & Parsons, 2013).
Concerning investments in students, private Islamic madrasahs invest less in their
students than private Islamic non-madrasahs, with an average annual cost per pupil of
IDR 9,706,000 (US$970,6) compared to IDR 10,930,000 (US$1,093) in their non-
madrasah counterparts. In addition, parents of students in Islamic private non-madrasah
schools contribute a higher proportion to learning budgets than their counterparts in
madrasahs (USAID, 2007). The more money a school has, the better the teaching can be,
and the better the achievement (Hanushek & Raymond, 2005).
In terms of investments in organization and coordination, while madrasahs are
centrally managed by the MoRA, non-madrasahs are decentralized from the MoEC to the
municipalities (Permani, 2009). This means that non-madrasahs are able to focus more
on local conditions and government arrangements, whereas madrasahs also need to
coordinate with the central government. Such coordination may divert money to
bureaucracy, decreasing a school’s investment in teaching, which in turn may negatively

116
affect student performance (ACDP, 2013). Conversely, decentralization has a positive
impact on teachers’ working environments because it enables teachers to connect and
share their motivation and skills (Louis, Dretzke, & Wahlstrom, 2010). Competent and
motivated teachers improve the quality of teaching and learning and thus advance
student achievement (Darling-Hammond, 2000). Therefore, we expect the centralized
system of madrasahs to have a negative impact on student achievement.
Overall, due to their focus on religious subjects, private madrasah schools in
Indonesia – as compared to private non-madrasah schools – devote fewer hours to
teaching on the national curriculum. Furthermore, investments in teachers and students
and the quality of teachers are lower. Madrasahs also receive fewer parental monetary
contributions and need to divert resources into coordination tasks. All these factors are
expected to affect students’ learning and achievement. Based on these arguments, we
expect that students who attend private madrasah schools will have a lower level of
achievement than students who attend private non-madrasah schools (H1).
5.3.2 School streams differences and student achievement
With regard to investments in the primary process, the integrationists teach more hours,
with 35 hours a week, compared to the traditionalists and the modernists, who each teach
30 hours. Teaching time is more productive than time spent on self-study (Dolton,
Marcenaro, & Navarro, 2003) and more teaching time has been found to improve
students’ performance (Stinebrickner & Stinebrickner, 2008), particularly in
mathematics and science (Grave, 2010).
In addition, the integrationists pay extra attention to the national exam subjects,
especially to English, mathematics and science, whereas the traditionalists and the
modernists do not (Hasan, 2009). Integrationists also teach religious subjects, but only as
an extracurricular activity. This extra attention to national exam subjects helps to advance
the understanding of the students in those specific subjects to be tested. This can be
expected to lead to an increase in their test scores.
In terms of investments in teachers, as mentioned above, the law requires that all
teachers at the junior secondary level must have a four-year post-secondary diploma or a
bachelor’s degree in the relevant subject. Fulfillment of this qualification in the
integrationist stream is higher (76%) than in the traditionalist (71%) and modernist (70%)
schools (MoEC, 2010), resulting in slight variations in knowledge and pedagogical skills,
which might contribute to the variation in achievements across streams (Darling-
Hammond, 2000).
Likewise, in the integrationist stream school personnel and teachers spend more
time mainly to implement the full-day school system. This means that schools have to pay
additional salary for overtime teaching by their teachers, leading to a general increase in
school costs. Because private school operation costs rely mainly on parental

117
contributions, they increase school fees to cover their operational costs (USAID, 2007).
For instance, the average integrationist tuition fee is IDR 1,973,000 ($197) per student
per year while the average tuition fee in the modernist and traditionalist streams is IDR
983,000 ($98) and IDR 676,000 ($67), respectively (calculated from MoEC, 2010). These
additional investments in teaching time may improve student achievement (Hanushek,
2006).
Overall, the integrationist schools devote more teaching time and provide extra
attention to national exam subjects. Additionally, they also invest more in teachers’
development and qualification, and have greater budgets for teaching. These arguments
lead us to predict that students in integrationist streams will attain higher academic
achievement than those in modernist and traditionalist streams (H2).
5.3.3 The gender achievement gap across school tracks and streams
Gender differences in student achievement have been subject of extensive study and
debate (Stoet & Geary, 2013; Suryadarma, 2010; Machin & Pekkarinen, 2008). There are
stereotypes that girls are superior in reading skills but inferior in mathematics skills.
Findings from the United States on eighth graders, for instance, confirm that girls
consistently had lower mathematics scores but higher scores in reading (Stoet & Geary,
2013; Machin & Pekkarinen, 2008). Similarly, a cross-country study in 2003 using data
from PISA among 15-year-old students showed that girls performed better in reading
while boys performed better in mathematics (Machin & Pekkarinen, 2008). However,
findings from Indonesia reveal that girls perform better than boys in numeracy
(Suryadarma, 2010). Suryadarma (2010) argues that the girls’ superiority in numeracy
can be explained because there is a higher labor market return for female-led families to
invest more resources in girls. It is also because teachers are mainly females, which may
stimulate girls to perform better and lead to increased female achievement (Suryadarma,
2010).
In relation to the gender achievement gap, an important difference between the
various types of private Islamic schools is the choice to implement single sex education
(SSE). Compared to non-madrasahs, in terms of teaching and learning rules, madrasahs
tend to be stricter (Woodward, 2015). They also have a tradition of single sex education
(SSE), which has been found to make girls freer and more competitive (Woodward 2015).
The same holds for integrationist schools: they also implement single sex education,
which can minimize distractions and reduce discipline problems (Gurian & Henley,
2001). Although the standards of discipline in a single sex environment (Jeffrey, Jeffery,
& Jeffery, 2008) are similar, girls tend to be more closely supervised than boys (Parker &
Raihani, 2009), which may enable girls to focus more on learning than when they are in a
mixed class. In addition, single sex education has been shown to benefit girls because it

118
boosts their self-esteem and confidence (Bracey, 2006), which is linked to educational
achievement (Piper, 2008; March, Byrne & Yeung, 1999).
Based on these arguments related to single sex education, we assume that in the
madrasah track and the integrationist stream, girls will perform better than boys,
reinforcing the gender achievement gap in both the madrasah track and the integrationist
stream, compared to the non-madrasah track, the traditionalist and the modernist
streams. Overall, girls attending madrasah and integrationist schools are expected to
profit more from implementation of single sex education than are boys. In these school
types this is expected to widen the gender gap in favor of the girls. We thus predict that
gender based achievement gaps in private madrasahs are greater than in private non-
madrasah (H3a) and that gender-based achievement gaps in the integrationist stream
are greater than in traditionalist and modernist streams (H3b).
5.3.4 The SES achievement gap across school tracks and streams
Unlike madrasahs that are centrally managed by the Ministry of Religious Affairs
(MoRA), non-madrasahs are decentralized and fall under the Ministry of Education and
Culture (MoEC) and local governments (Permani, 2009). This has consequences for
investments in education, since non-madrasahs have more resources than madrasah
because they receive investments from both the central and local governments.
Since the non-madrasah schools have more resources they can provide more
financial support to low SES students. For instance, scholarships for low SES students are
more adequate in non-madrasahs than in madrasahs because, as mentioned above, non-
madrasahs have at least two sources of resources, namely the MoEC and the district
education office (USAID, 2007). Financial support via scholarships for low SES students
could prevent them from leaving school for a temporary job, such as harvesting. This can
improve the attendance of low SES students, which may advance their learning; this
would reduce the SES achievement gap more in non-madrasah schools than in madrasah
schools. Moreover, although the MoRA fully supports public madrasahs, it does not
provide sufficient scholarships to private madrasahs (Kingham & Parsons, 2013). This
could make it difficult for private madrasahs to boost the motivation and opportunity of
low SES students to heighten their achievements.
In addition, although there are contradicting opinions as to the effect of
decentralization in the education sector (e.g. Devins, 1987), in the Indonesian context
decentralization has influenced local governments to respond better to local needs for
educational services (Sumarto, Suryahadi, & Arifianto, 2004; UNDP, 2002; Usman,
2001). When decentralization leads local governments to respond to the local people’s
needs and people’s aspirations for children’s education are high, the municipality may
invest more in education. This investment leads to improved learning environments and
119
may equalize the performance of low SES students in non-madrasahs. Thus, it can lead to
improved educational outcomes (Simatupang, 2009).
With regard to financial or other support for low SES pupils, unlike integrationist
schools, traditionalist and modernist schools financially support low SES students. Both
traditionalist and modernist schools collect Islamic alms (zakat) and donations from their
members (Burhanudin, 2015). These financial resources are partly distributed amongst
low SES students. This may increase the daily school attendance of low SES students and
in this way improve their learning and performance, in turn reducing the advantage of the
high SES students over low SES students and thus the SES achievement gap in modernist
and traditionalist schools becomes smaller.
Based on these reasons, we predict that the SES achievement gap in private
madrasahs is greater than in private non-madrasahs (H4a) and the SES achievement
gap in the integrationist stream is greater than the gaps in both the traditionalist and
modernist streams (H4b).
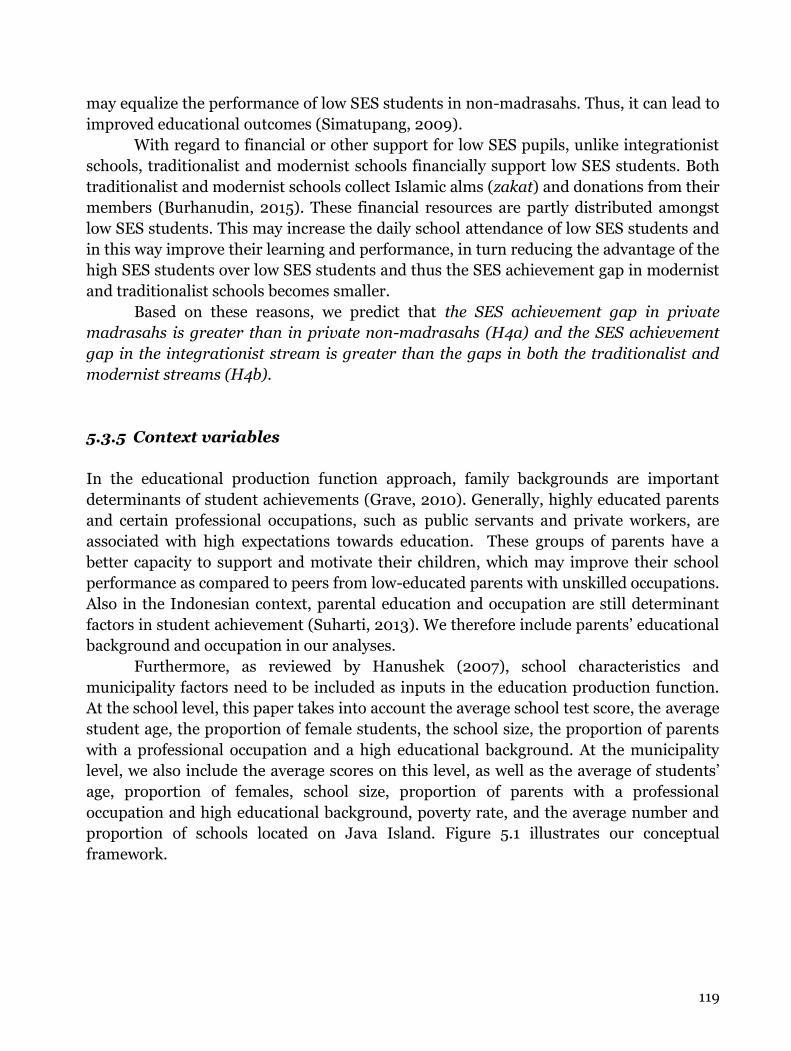
5.3.5 Context variables
In the educational production function approach, family backgrounds are important
determinants of student achievements (Grave, 2010). Generally, highly educated parents
and certain professional occupations, such as public servants and private workers, are
associated with high expectations towards education. These groups of parents have a
better capacity to support and motivate their children, which may improve their school
performance as compared to peers from low-educated parents with unskilled occupations.
Also in the Indonesian context, parental education and occupation are still determinant
factors in student achievement (Suharti, 2013). We therefore include parents’ educational
background and occupation in our analyses.
Furthermore, as reviewed by Hanushek (2007), school characteristics and
municipality factors need to be included as inputs in the education production function.
At the school level, this paper takes into account the average school test score, the average
student age, the proportion of female students, the school size, the proportion of parents
with a professional occupation and a high educational background. At the municipality
level, we also include the average scores on this level, as well as the average of students’
age, proportion of females, school size, proportion of parents with a professional
occupation and high educational background, poverty rate, and the average number and
proportion of schools located on Java Island. Figure 5.1 illustrates our conceptual
framework.
120
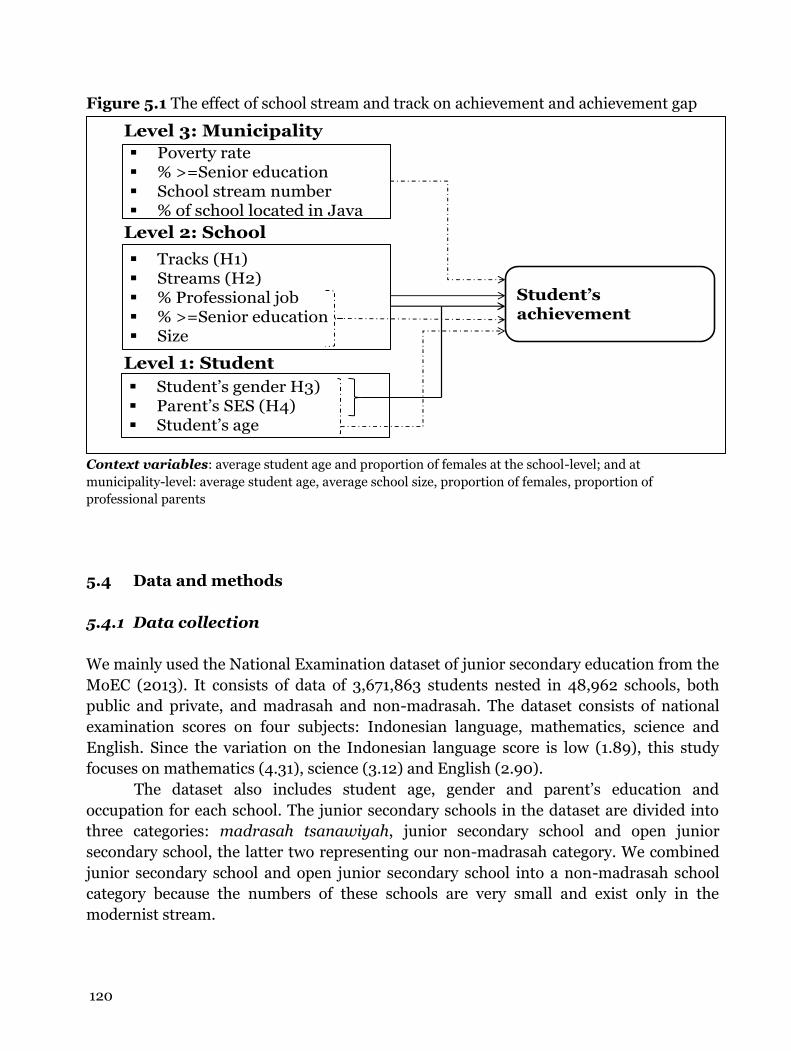
Figure 5.1 The effect of school stream and track on achievement and achievement gap
Context variables: average student age and proportion of females at the school-level; and at
municipality-level: average student age, average school size, proportion of females, proportion of
professional parents
5.4 Data and methods
5.4.1 Data collection
We mainly used the National Examination dataset of junior secondary education from the
MoEC (2013). It consists of data of 3,671,863 students nested in 48,962 schools, both
public and private, and madrasah and non-madrasah. The dataset consists of national
examination scores on four subjects: Indonesian language, mathematics, science and
English. Since the variation on the Indonesian language score is low (1.89), this study
focuses on mathematics (4.31), science (3.12) and English (2.90).
The dataset also includes student age, gender and parent’s education and
occupation for each school. The junior secondary schools in the dataset are divided into
three categories: madrasah tsanawiyah, junior secondary school and open junior
secondary school, the latter two representing our non-madrasah category. We combined
junior secondary school and open junior secondary school into a non-madrasah school
category because the numbers of these schools are very small and exist only in the
modernist stream.
Level 1: Student
Level 2: School
Student’s gender H3) Parent’s SES (H4) Student’s age
Tracks (H1) Streams (H2) % Professional job % >=Senior education Size
Student’s achievement
Poverty rate % >=Senior education School stream number % of school located in Java
Level 3: Municipality

121
To categorize the various schools according to the three streams of private Islamic
schools, we consulted with and interviewed a number of experts in three rounds, i.e. the
chairperson or vice chairperson of the modernist, the traditionalist and the integrationist
umbrella organizations. First, based on an initial consultation and interview, we selected
data from all private non-madrasahs as well as madrasahs from the MoEC dataset and
coded “1” for Traditionalist, “2” for Modernist, “3” for Integrationist and “4 for other,
which could be traditionalist, modernist or integrationist if the identity could not be
verified. This category consists of 39.4 percent of all schools in the dataset (16,436).
Second, using the selected data of the three streams of Islamic schools, we again
consulted the chairperson or vice chairperson of each umbrella organization. They
partially confirmed the first school list and provided an additional school list to be
checked with the MoEC dataset. Based on this data confirmation, we included additional
school information calculated from Data Pokok Pendidikan (Dapodik) 2010 and linked
this to the MoEC dataset 2013. Finally, we sent the new selected school data to the chair
or vice chair of the organizations for a final reliability check.
The modernist and traditionalist informants confirmed that the new school data
sets were correct but the integrationist informant proposed dropping some madrasahs in
the dataset because they were not part of the integrationist madrasahs. Based on this
confirmation, we constructed the final dataset consisting of 156,952 students nested in
3,150 schools. Those students are distributed over three school streams: 47.2 percent in
the traditionalist, 47.0 percent in the modernist, and 5.8 percent in the integrationist
institutions.
Furthermore, three experts (Vice Chairman of Primary and Secondary Education
Council of Muhammadiyah/Modernist; Vice Chairman of LP Maarif NU/Traditionalist,
and the Chairman of JSIT/Integrationist) were approached to elicit background
information about each stream’s unique features as indicated by their vision and mission
and how the schools incorporate the national curriculum, as well as issues such as the
number of teaching hours, teacher training, teaching qualification, extra attention for
specific subjects, investments in coordination, financial or other support for low SES
pupils, and implementation of single sex classes.
5.4.2 Data description
The dataset is described in terms of variables and levels (student/family, school and
municipality). Summaries of the variables (means, standard deviations and proportions)
and distributions over the school tracks and streams are given in Table 5.1, at all three
levels; of these the most important findings are mentioned in the text.

122
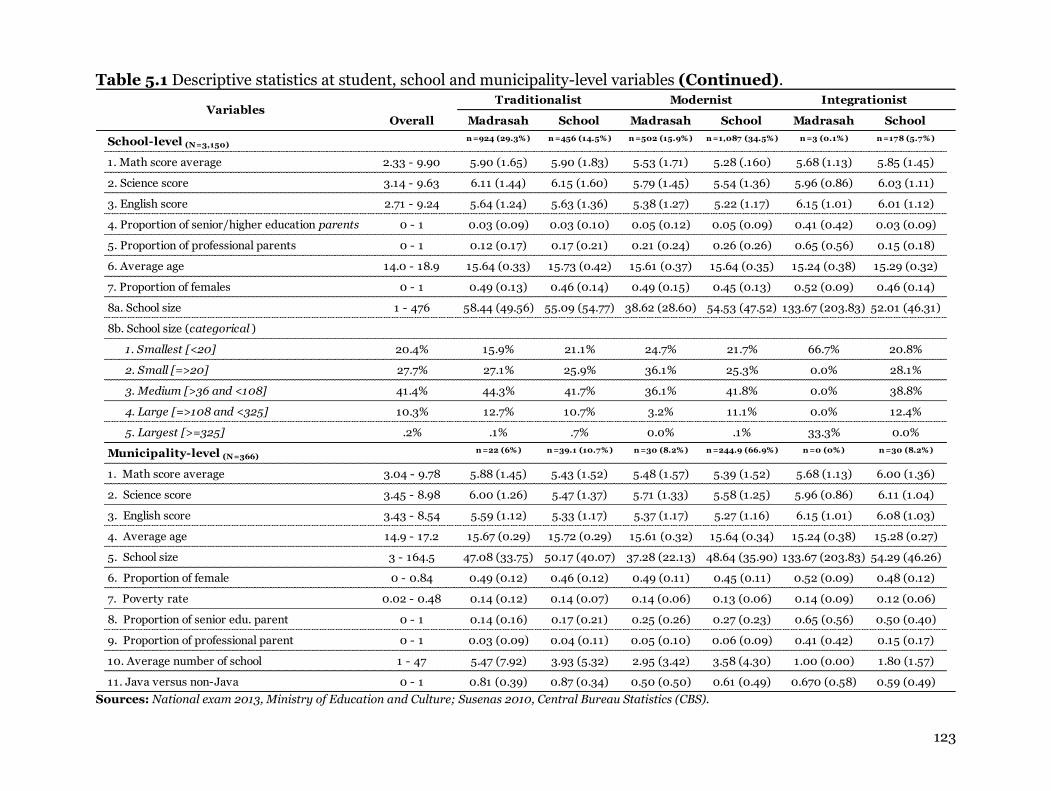
Table 5.1 Descriptive statistics at student, school and municipality-level variables
Sources: National exam 2013, Ministry of Education and Culture; Susenas 2010, Central Bureau Statistics (CBS).
Overall Madrasah School Madrasah School Madrasah School
Student-level (N=156,952) µ (SD) n=50,618 (32,3%) n=23,540 (15%) n=18,188 (11,6%) n=55,547 (35,4%) n=375 (.2%) n=8,684 (5.5%)
1. Math score 5.55 (2.12) 5.74 (2.06) 5.66 (2.21) 5.39 (2.07) 5.28 (2.09) 6.34 (2.05) 6.26 (2.17)
2. Science score 5.79 (1.83) 5.95 (1.82) 5.93 (1.99) 5.67 (1.74) 5.53 (1.78) 6.20 (1.45) 6.31 (1.67)
3. English score 5.45 (1.70) 5.52 (1.65) 5.46 (1.76) 5.31 (1.63) 5.28 (1.68) 6.39 (1.44) 6.36 (1.71)
4. Student age 15.56 (0.85) 15.58 (0.84) 15.63 (0.86) 15.57 (0.87) 15.55 (0.86) 15.17 (0.57) 15.23 (0.62)
5. Student gender (1=female) .51 .47 .50 .46 .45 .49
6. Parent education:
(0) Unknown 25.20% 27.7% 18.4% 22.7% 26.6% 7.2% 25.8%
(1) Primary or below 34.40% 43.6% 44.1% 36.8% 25.6% 1.1% 6.8%
(2) Junior secondary 16.10% 15.5% 17.0% 18.6% 17.0% 1.6% 7.2%
(3) Senior secondary 17.50% 10.9% 16.2% 17.0% 23.0% 22.4% 25.4%
(4) Higher education 6.80% 2.3% 4.2% 4.8% 7.7% 67.7% 34.7%
7. Parent job:
(0) Unknown 23.00% 25.1% 16.0% 21.4% 24.7% 4.8% 23.0%
(1) Farmer/worker 36.10% 41.3% 39.8% 43.8% 31.0% .3% 12.9%
(2) Civil servant/professional 5.30% 3.2% 3.4% 5.4% 5.7% 40.0% 17.4%
(3) Private workers 12.00% 9.4% 13.9% 7.5% 13.1% 21.3% 23.4%
(4) Self-employed 17.50% 15.1% 19.8% 15.6% 19.1% 25.6% 18.5%
(5) Other 6.20% 5.8% 7.1% 6.2% 6.4% 8.0% 4.8%
VariablesTraditionalist Modernist Integrationist
123
Table 5.1 Descriptive statistics at student, school and municipality-level variables (Continued).
Sources: National exam 2013, Ministry of Education and Culture; Susenas 2010, Central Bureau Statistics (CBS).
Overall Madrasah School Madrasah School Madrasah School
School-level (N=3,150)n=924 (29.3%) n=456 (14.5%) n=502 (15.9%) n=1,087 (34.5%) n=3 (0.1%) n=178 (5.7%)
1. Math score average 2.33 - 9.90 5.90 (1.65) 5.90 (1.83) 5.53 (1.71) 5.28 (.160) 5.68 (1.13) 5.85 (1.45)
2. Science score 3.14 - 9.63 6.11 (1.44) 6.15 (1.60) 5.79 (1.45) 5.54 (1.36) 5.96 (0.86) 6.03 (1.11)
3. English score 2.71 - 9.24 5.64 (1.24) 5.63 (1.36) 5.38 (1.27) 5.22 (1.17) 6.15 (1.01) 6.01 (1.12)
4. Proportion of senior/higher education parents 0 - 1 0.03 (0.09) 0.03 (0.10) 0.05 (0.12) 0.05 (0.09) 0.41 (0.42) 0.03 (0.09)
5. Proportion of professional parents 0 - 1 0.12 (0.17) 0.17 (0.21) 0.21 (0.24) 0.26 (0.26) 0.65 (0.56) 0.15 (0.18)
6. Average age 14.0 - 18.9 15.64 (0.33) 15.73 (0.42) 15.61 (0.37) 15.64 (0.35) 15.24 (0.38) 15.29 (0.32)
7. Proportion of females 0 - 1 0.49 (0.13) 0.46 (0.14) 0.49 (0.15) 0.45 (0.13) 0.52 (0.09) 0.46 (0.14)
8a. School size 1 - 476 58.44 (49.56) 55.09 (54.77) 38.62 (28.60) 54.53 (47.52) 133.67 (203.83) 52.01 (46.31)
8b. School size (categorical )
1. Smallest [<20] 20.4% 15.9% 21.1% 24.7% 21.7% 66.7% 20.8%
2. Small [=>20] 27.7% 27.1% 25.9% 36.1% 25.3% 0.0% 28.1%
3. Medium [>36 and <108] 41.4% 44.3% 41.7% 36.1% 41.8% 0.0% 38.8%
4. Large [=>108 and <325] 10.3% 12.7% 10.7% 3.2% 11.1% 0.0% 12.4%
5. Largest [>=325] .2% .1% .7% 0.0% .1% 33.3% 0.0%
Municipality-level (N=366)n=22 (6%) n=39.1 (10.7%) n=30 (8.2%) n=244.9 (66.9%) n=0 (0%) n=30 (8.2%)
1. Math score average 3.04 - 9.78 5.88 (1.45) 5.43 (1.52) 5.48 (1.57) 5.39 (1.52) 5.68 (1.13) 6.00 (1.36)
2. Science score 3.45 - 8.98 6.00 (1.26) 5.47 (1.37) 5.71 (1.33) 5.58 (1.25) 5.96 (0.86) 6.11 (1.04)
3. English score 3.43 - 8.54 5.59 (1.12) 5.33 (1.17) 5.37 (1.17) 5.27 (1.16) 6.15 (1.01) 6.08 (1.03)
4. Average age 14.9 - 17.2 15.67 (0.29) 15.72 (0.29) 15.61 (0.32) 15.64 (0.34) 15.24 (0.38) 15.28 (0.27)
5. School size 3 - 164.5 47.08 (33.75) 50.17 (40.07) 37.28 (22.13) 48.64 (35.90) 133.67 (203.83) 54.29 (46.26)
6. Proportion of female 0 - 0.84 0.49 (0.12) 0.46 (0.12) 0.49 (0.11) 0.45 (0.11) 0.52 (0.09) 0.48 (0.12)
7. Poverty rate 0.02 - 0.48 0.14 (0.12) 0.14 (0.07) 0.14 (0.06) 0.13 (0.06) 0.14 (0.09) 0.12 (0.06)
8. Proportion of senior edu. parent 0 - 1 0.14 (0.16) 0.17 (0.21) 0.25 (0.26) 0.27 (0.23) 0.65 (0.56) 0.50 (0.40)
9. Proportion of professional parent 0 - 1 0.03 (0.09) 0.04 (0.11) 0.05 (0.10) 0.06 (0.09) 0.41 (0.42) 0.15 (0.17)
10. Average number of school 1 - 47 5.47 (7.92) 3.93 (5.32) 2.95 (3.42) 3.58 (4.30) 1.00 (0.00) 1.80 (1.57)
11. Java versus non-Java 0 - 1 0.81 (0.39) 0.87 (0.34) 0.50 (0.50) 0.61 (0.49) 0.670 (0.58) 0.59 (0.49)
VariablesTraditionalist Modernist Integrationist

124
5.4.3 Variables
Student/family
National examination (NE) scores. NE results on mathematics, science and English are
scored from 0 to 10.
Age. In years. Students are mostly 15 years old when taking the exams, with ages ranging
from 14 to 28. We use centered age for the analysis, meaning that a value within the age is
equal to zero.
Parental education. Five categories are distinguished: “1” for primary education or lower
(34.4%), “2” for junior secondary education (16.1%), “3” for senior secondary education
(17.5%), and “4” for higher education (6.8%). If parental educational level was unknown,
it was coded “0”.
Parental occupation. Six categories are distinguished: “1” for farmer/worker (36.0%), “2”
for civil servant/professional (5.3%), “3” for private worker (12.0%), “4” for self-employed
(17.5%), and “5” for other (6.2%). If parent’s occupation was unknown, it was coded “0”.
School
Size. In number of students. School size ranges from 1 to 476, with an average of 53.
School size category. Based on the MoEC standard of class and school, five categories are
distinguished: “1” for <20; “2” for =>20 and <36; “3” for >36 and <108; “4” for =>108
and =<325; “5” for >325.
Average age. Computed as the mean student age, ranging from 14 to 18.9.
Proportion of female students. Ranges from 0 to 0.84.
Proportion of well-educated parents. Computed as the number of parents with senior
secondary and higher education (summing categories “3” and “4”).
Proportion of parents with high-status jobs. Computed as the number of parents who are
civil servants or have a professional job like lawyer or doctor (category “2”).
Municipality
Poverty rate. Calculated from the national socio-economic survey (CBS, 2010), ranging
from 2.48 percent to 48 percent with an average of 13.3 percent.
Location. Categorical variable, distinguishing municipalities on Java Island vs non-Java
municipalities.
Average school size. Mean over all schools in the municipality, ranging from 3 to 164.5.

125
Mean school proportion of female students. Mean over all schools in the municipality,
ranging from 0 to 0.84
Mean school proportion of well-educated parents. Ranges from 0 to 1, with an average of
27.8 percent.
Mean school proportion of parents with high-status jobs. Ranges from 0 to 1, with an
average of 24.9 percent.
The exam scores of modernist madrasahs and schools are the lowest at student, school
and municipality levels. These schools are, more than the other streams, located outside
Java. Parental education and job status is highest in integrationist institutes, and in the
traditionalist and modernist non-madrasah schools somewhat higher than in the same
stream madrasahs, also at all three levels. Pupils in madrasahs have higher test scores in
the traditionalist and modernist streams and in all subjects. School and municipality
average exam score differences between madrasahs and non-madrasahs are similar for
the modernist streams, whereas the average school score differences in the traditionalist
stream almost vanish but the average municipality score differences increase.
5.4.4 Analytical strategy
As a preparatory step to a multivariate analysis, bivariate association measures were
computed at the three levels. The hypotheses set forth in the previous sections were
investigated using multilevel analysis (see, e.g. Snijders & Bosker, 2012). Multilevel
analysis is appropriate because it takes into account the inherent dependent nature of
scores of students in the same classroom or school, in the same region, allowing proper
testing of the hypotheses formulated at the student, school, and municipality levels.
For each of the three National Exam subject scores, in math, science, and English,
a model is built in four steps, using a forward selection strategy to take into account more
potential confounders. The first model contains student-level variables, i.e., age and
parental SES characteristics education and occupation. In the second step school-level
variables, i.e. school type as characterized by stream and track, school size and aggregated
SES variables are added, followed by district-level characteristics, i.e., poverty rate and
aggregated SES variables expressed as percentage of well-educated parents and
percentage of parents working as professionals (including civil servants), in the third step.
To investigate whether the model parameters are constant across school type and
to test hypotheses 3 and 4, within-level and cross-level interactions are added in a final
step of which significant effects are retained.

126
5.5 Results
Table 5.2 gives a description of the correlations between factors at the student, school and
municipality levels. Not surprisingly, the three NE scores are highly correlated at all
levels, with the strongest association between math and science. Most correlations are in
the expected direction, but rather low. Overall, the correlations for all subjects at the
school and municipality levels are about equal and higher than those correlations at the
student level. This confirms that it is important to distinguish effects of explanatory
factors at all levels in the multilevel modelling as laid out in the analytical strategy.
Table 5.2 Correlations at student, school and municipality-level variables
Note: * p < 0.05, ** p < 0.01.
Variables 1 2 3 4 5 6 7
1. Math score and its average .677**
.596**
-.107**
.036**
.076**
.056**
2. Science score and its average .895**
.575**
-.105**
.027**
.079**
.050**
3. English score and its average .828**
.817**
-.139**
.087**
.120**
.068**
4. Student age and its average -.150**
-.155**
-.213**
-.124**
-.118**
-.055**
5. Student gender (1=girl and proportion of girl) .047**
.042*
.059**
-.169**
-.018**
-.009**
6. Parent education (1=senior/higher and its proportion) .045*
.051**
.112**
-.235**
-.059**
.284**
7. Parent job (1=professional and its proportion) .073**
.093**
.122**
-.167**
-.035*
.548**
8. School size (continuos) -.048**
-.057** -.022 -.208
**.082
**.123
**.146
**
Municipality-level variables (N=366) 1 2 3 4 5 6 7
1. Math score average 1
2. Science score average .878** 1
3. English score average .842**
.805** 1
4. Municipality poverty rate .122* .090 .046 1
5. Student age, average -.181**
-.162**
-.222**
.130* 1
6. Proportion of females .051 .060 .065 -.014 -.225** 1
7. Proportion of senior/higher education parents -.063 -.045 .004 -.176**
-.285** -.026 1
8. Proportion of professional parents -.022 .003 -.015 .039 -.174** .066 .553
**
Sc
ho
ol (
N=
3,15
0)
Student (N=156,952)

127
5.5.1 Multilevel analysis
We started our analysis by estimating a Null Model with the intercept variances at the
student, school and municipality levels. The intercept-only model from the Null Model
estimates the intercept as 5.58, 5.76 and 5.43, which are simply the weighted average
scores for mathematics, science and English across students, schools and municipalities
and (almost) equal to the means represented in Table 5.1. The variances of the student,
school and municipality-level residual errors for all subjects are highest at the individual
level with 1.96 for math, 1.54 for science and 1.50 for English. The lowest variances at the
school level are 1.08, 0.74 and 0.61, respectively. Calculated from the school variance
divided by the total variance, i.e. the sum of the student, school and municipality
variances, the intra-class correlation at the school level equals 0.32 for mathematics, 0.32
for science and 0.28 for English. These numbers can be considered substantial, and an
extra justification for using multilevel analysis. In the final model, the total variance is
only slightly reduced, which implies that although the variables included in the model
significantly contribute to explaining the variance, the total explained variance is low.
Table 5.3 displays the estimation results for the four different specifications of the
educational production function: Model 1 includes only the student-level variables: age,
gender, parental education and occupation. Model 2 additionally includes the school-level
variables: track, stream, proportion of students from at least a senior educational
background, proportion of parents in a professional occupation and school size
categorization. Model 3 takes into account the municipality-level characteristics: poverty
rates, proportion of students from at least a senior educational background, and
proportion of parents in a professional occupation. Finally, Model 4 also includes the
cross-level interactions between the student and school-level factors, and between the
municipality and school-level factors.
From Model 1 in Table 5.3 it becomes clear that female students have significantly
higher scores than male students in all subjects. The largest score differences between
girls and boys are in English by 0.3 points, and the smallest difference is in science by 0.1
points. Similarly, children of higher educated parents and professional parents have
significantly higher scores, leading to a difference of about 0.2 points and 0.1 points,
respectively. However, scores for all subjects decrease as students become older. These
results are stable after taking into account the variables at the school level (Model 2), the
municipality level (Model 3) and the within- and between-level interactions (Model 4).

128
Table 5.3 Multilevel results on student achievement: student and school-level factors
Nlevel1=156,952; Nlevel2=3,150; Nlevel3=366.
Note: * P < 0.05; ** P < 0.01; *** P < 0.001.
β S.E. β S.E. β S.E. β S.E. β S.E. β S.E.
Fixed Part
Intercepts 5.510 0.071 5.703 0.061 5.268 0.054 5.944 0.112 6.097 0.095 5.889 0.084
Student-level variables
Age -0.136 0.004 *** -0.121 0.004 *** -0.139 0.004 *** -0.136 0.004 *** -0.120 0.004 *** -0.139 0.004 ***
Gender: Boy (ref.)
Girl 0.108 0.007 *** 0.065 0.006 *** 0.259 0.006 *** 0.108 0.007 *** 0.065 0.006 *** 0.259 0.006 ***
Parent's education: Junior and below (ref.)
- Senior/higher edu 0.101 0.011 *** 0.112 0.010 *** 0.184 0.010 *** 0.101 0.011 *** 0.112 0.010 *** 0.182 0.010 ***
Parent's occupation: Non-professional (ref.)
- Professional 0.138 0.018 *** 0.084 0.016 *** 0.134 0.016 *** 0.137 0.018 *** 0.083 0.016 *** 0.132 0.016 ***
School-level variables
Track: Non madrasah (ref.)
- Madrasah 0.278 0.046 *** 0.238 0.038 *** 0.227 0.034 ***
Stream: Integrationist (ref.)
- Tradisionalist -0.486 0.104 *** -0.454 0.086 *** -0.715 0.077 ***
- Modernist -0.639 0.097 *** -0.565 0.080 *** -0.799 0.072 ***
Random Part
- Municipality-level 1.445 0.134 1.089 0.100 0.817 0.076 1.454 0.134 1.098 0.100 0.841 0.077
- School-level 1.068 0.030 0.729 0.021 0.593 0.017 1.030 0.029 0.702 0.020 0.556 0.016
- Student-level 1.938 0.007 1.526 0.006 1.465 0.005 1.938 0.007 1.526 0.006 1.465 0.005
-2*loglikelihood: 559,538 521,682 514,785 559,445 521,586 514,627
Variables Math English
Model 1 Model 2
Science English Math Science

129
The first hypothesis predicts that students who attend private madrasahs attain a lower
level of achievement than students who attend private non-madrasahs. Results provide
evidence contradictory to our expectation. Data show that children attending madrasahs
perform better than their non-madrasah counterparts. The findings in Model 2 Table 5.3
reveal that scores of students attending private non-madrasahs generally have
significantly lower scores in math, science and English compared to those enrolled in
private madrasahs, by 0.3, 0.2 and 0.2 points, respectively.
These findings are quite stable, as shown in Model 3 and Model 4. For instance,
after controlling for municipality factors (Model 3) and adding interaction effects (Model
4), the effects of attending madrasahs remain similar. Moreover, in madrasahs, girls
perform better in science than boys, whereas children of well-educated parents perform
slightly less well in English compared to children of parents with lower education (see
Table 5.4).
Interestingly, whereas in municipalities with a higher poverty rate, student
performance in non-madrasahs is higher in math and science, in madrasahs this effect is
absent in science and less strong in math. Student achievement in English in
municipalities with a higher poverty rate is higher in traditionalist and modernist
madrasahs and non-madrasahs, and lower in integrationist madrasahs (compared to
integrationist non-madrasahs). Municipalities with a large number of schools have higher
math and English student performance.

130
Table 5.4 School track and stream on student achievement: student, school, municipality-level factors and their interaction effects Nlevel1=156,952; Nlevel2=3,150; Nlevel3=366.
Note: * P < 0.05; ** P < 0.01; *** P < 0.001.
Variables
β S.E. β S.E. β S.E. β S.E. β S.E. β S.E.
Fixed Part
Intercepts 6.419 0.189 6.540 0.163 5.948 0.096 5.791 0.216 6.044 0.185 5.479 0.131
Student-level variables
Age -0.136 0.004 *** -0.120 0.004 *** -0.139 0.004 *** -0.136 0.004 *** -0.121 0.004 *** -0.139 0.004 ***
Gender: Boy (ref.)
- Girl 0.108 0.007 *** 0.065 0.006 *** 0.259 0.006 *** 0.389 0.030 *** 0.238 0.027 *** 0.359 0.026 ***
Parent's education: Junior and below (ref.)
- Senior/higher edu 0.101 0.011 *** 0.113 0.010 *** 0.183 0.010 *** 0.101 0.011 *** 0.112 0.010 *** 0.208 0.012 ***
Parent's occupation: Non-professional (ref.)
- Professional 0.137 0.018 *** 0.083 0.016 *** 0.132 0.016 *** 0.138 0.018 *** 0.084 0.016 *** 0.133 0.016 ***
School-level variables
Track: Non madrasah (ref.)
- Madrasah 0.269 0.046 *** 0.231 0.038 *** 0.223 0.034 *** 0.267 0.046 *** 0.202 0.039 *** 0.243 0.035 ***
Stream: Integrationist (ref.)
- Tradisionalist -0.507 0.104 *** -0.472 0.087 *** -0.727 0.078 *** 0.209 0.174 0.154 0.145 -0.146 0.134
- Modernist -0.671 0.097 *** -0.589 0.081 *** -0.813 0.072 *** 0.014 0.154 -0.058 0.128 -0.344 0.121 **
Municipality-level variables
Poverty rate 2.179 1.082 * 1.319 0.934 0.625 0.835 2.944 1.134 ** 2.434 0.983 ** -1.930 1.519
Parents with senior education -0.393 0.322 -0.365 0.278 -0.247 0.249 -0.364 0.322 -0.170 0.287 -0.197 0.248
Number of schools 0.010 0.006 0.012 0.005 ** 0.006 0.004 0.009 0.006 0.011 0.005 * 0.007 0.004
Region: Non Java (ref .)
Java -0.622 0.166 *** -0.475 0.144 *** -0.271 0.129 * 0.212 0.240 0.208 0.204 0.215 0.183
Model 3 Model 4
Math Science English Math Science English

131
Table 5.4 School track and stream on student achievement (Continued).
Note: * P < 0.05; ** P < 0.01; *** P < 0.001.
Math
β S.E. β S.E. β S.E. β S.E. β S.E. β S.E.
Cross-level interaction effects
School and student-level
- Madrasah x Girl 0.047 0.015 ***
- Madrasa x well-educated parent -0.068 0.019 ***
- Tradisionalist x Girl -0.316 0.032 *** -0.222 0.030 *** -0.103 0.028 ***
- Modernist x Girl -0.282 0.032 *** -0.190 0.028 *** -0.111 0.028 ***
Municipality and school-level
- Municipality poverty rate x Madrasah -1.580 0.819 -2.358 0.741 *** -1.313 0.639 *
- Municipality poverty rate x Traditionalist 3.548 1.491 **
- Municipality poverty rate x Modernist 3.320 1.361 **
- Proportion of well-edu. parents x Madrasah -0.510 0.234 **
- School number at municipality x Madrasah 0.003 0.001 ** 0.003 0.001 **
- Java x Tradisionalist -0.920 0.210 *** -0.818 0.175 *** -0.653 0.158 ***
- Java x Modernist -0.924 0.195 *** -0.730 0.162 *** -0.507 0.147 ***
Random Part
- Municipality-level 1.348 0.126 1.031 0.095 0.821 0.076 1.348 0.126 1.027 0.094 0.810 0.075
- School-level 1.030 0.029 0.702 0.020 0.556 0.016 1.019 0.029 0.693 0.020 0.550 0.016
- Student-level 1.938 0.007 1.526 0.006 1.465 0.005 1.936 0.007 1.526 0.006 1.465 0.005
-2*loglikelihood: 559,422.7 521,567.9 514,619.2 559,294.9 521,474.0 514,561.1
Model 3 Model 4
Math Science English Math Science English
132
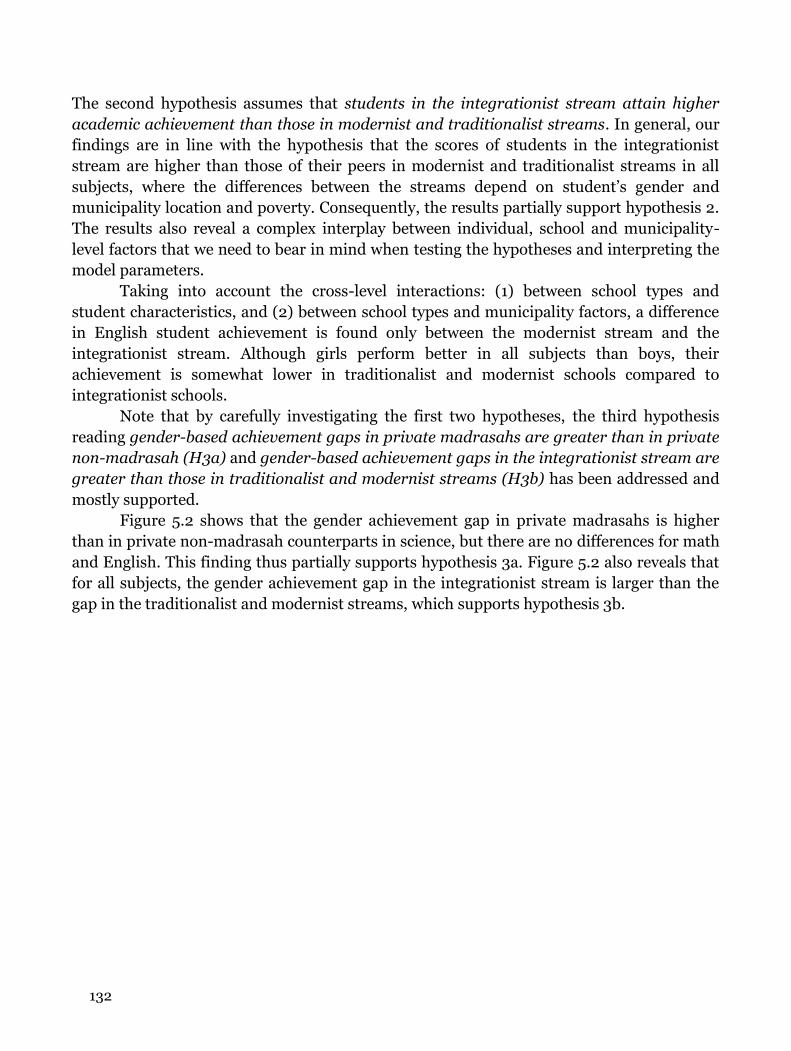
The second hypothesis assumes that students in the integrationist stream attain higher
academic achievement than those in modernist and traditionalist streams. In general, our
findings are in line with the hypothesis that the scores of students in the integrationist
stream are higher than those of their peers in modernist and traditionalist streams in all
subjects, where the differences between the streams depend on student’s gender and
municipality location and poverty. Consequently, the results partially support hypothesis 2.
The results also reveal a complex interplay between individual, school and municipality-
level factors that we need to bear in mind when testing the hypotheses and interpreting the
model parameters.
Taking into account the cross-level interactions: (1) between school types and
student characteristics, and (2) between school types and municipality factors, a difference
in English student achievement is found only between the modernist stream and the
integrationist stream. Although girls perform better in all subjects than boys, their
achievement is somewhat lower in traditionalist and modernist schools compared to
integrationist schools.
Note that by carefully investigating the first two hypotheses, the third hypothesis
reading gender-based achievement gaps in private madrasahs are greater than in private
non-madrasah (H3a) and gender-based achievement gaps in the integrationist stream are
greater than those in traditionalist and modernist streams (H3b) has been addressed and
mostly supported.
Figure 5.2 shows that the gender achievement gap in private madrasahs is higher
than in private non-madrasah counterparts in science, but there are no differences for math
and English. This finding thus partially supports hypothesis 3a. Figure 5.2 also reveals that
for all subjects, the gender achievement gap in the integrationist stream is larger than the
gap in the traditionalist and modernist streams, which supports hypothesis 3b.

133
Figure 5.2 Gender achievement gaps across tracks and streams
Notes:
*IM=Integrationist madrasah; IS= Integrationist school/non-madrasah; TM= Traditionalist
madrasah; TS= Traditionalist school; MM= Modernist madrasah; MS=Modernist school.
**Figures are based on Model 4 in Table 5.4.
The difference in student performance between the traditionalist and modernist streams
and the integrationist stream is greater on Java (in favor of integrationist schools)
compared to schools in other regions.
0.00
0.05
0.10
0.15
0.20
0.25
0.30
0.35
0.40
0.45
0.50
Gen
der
sco
re g
ap
s
Math English Math English Math English
Integrationist Traditionalist Modernist
-0.05
0.00
0.05
0.10
0.15
0.20
0.25
0.30
0.35
0.40
Gen
der
sco
re g
ap
s in
Sci
ence
IM IS TM TS MM MS

134
The final hypothesis postulates that the SES achievement gap in private madrasahs
is greater than in private non-madrasahs (H4a) and the SES achievement gap in
integrationist schools is greater than those gaps in both traditionalist and modernist
schools (H4b). The results fully refute this set of hypotheses as represented in Model 4 in
Table 5.4 and Figure 5.3.
Model 4 in Table 5.4 illustrates that the effects of SES as represented by parental
education and occupation are significantly positive for all subjects. Enrolling in private
madrasahs significantly reduces the advantage of students from well-educated parents over
those from low-educated parents. Thus, the SES achievement gaps in private madrasahs are
smaller than in private non-madrasahs as shown in Figure 5.3, which is contradictory to our
hypothesis (H4a).
Figure 5.3 Parental education (SES) achievement gaps across tracks
Note:
*Figures is based on Model 4 in Table 4.
Figure 5.4 and 5.5 reveal that there ares no cross-level interaction between parental SES
and school streams, implying that there are no differences in SES achievement gaps
between students in integrationist streams and their other counterparts for all subjects,
which contradicts our hypothesis (H4b).
0.00
0.05
0.10
0.15
0.20
0.25
Sco
re g
ap
s in
En
gli
sh
Madrasah Non-madrasah

135
Figure 5.4 Poverty achievement gap of 20% for Math and Science across track
Note:
*Figures are based on Model 4 in Table 4.
Figure 5.5 Poverty achievement gap of 20% in English across track and stream
Notes:
*IM=Integrationist madrasah; IS= Integrationist school/non-madrasah; TM= Traditionalist
madrasah; TS= Traditionalist school; MM= Modernist madrasah; MS=Modernist school.
**Figures are based on Model 4 in Table 4.
-0.6
-0.4
-0.2
0.0
0.2
0.4
0.6
0.8
1.0
1.2
0 1 2 3 4 5
Sco
re g
ap
s in
Ma
th a
nd
Sci
ence
Tracks: Madrasah vs Non-madrasah
Math in Non
Sci in Non
Math in Mad
Sci in Mad
-1.5
-1.0
-0.5
0.0
0.5
1.0
Sco
re g
ap
s in
En
gli
sh
Across tracks and streams
IM
IS
TM
TS
MM
MS

136
A summary of the results of the six hypotheses is provided below, in Table 5.5.
Table 5.5 Overview of hypotheses and findings of our analyses
No. Hypotheses Results
1 Students who attended the private madrasahs
have a lower level of achievement than students
who attended private non-madrasahs (H1).
Refuted (X): students in
madrasah attain a higher level
than their peers in non-
madrasah.
2 Students in Integrationist stream have higher
academic achievement compared to those in
Modernist and Traditionalist streams (H2).
Partially supported (√): girls in
Integrationist stream attain
higher.
3 Gender-based achievement gaps in private
madrasahs are greater than in private non-
madrasahs (H3a) and gender gaps in
Integrationist stream are greater than in
Traditionalist and Modernist streams (H3b).
Mostly supported (√): Gender
gap in madrasah is greater in
science, and gender gap in
Integrationist stream is
greater in all subjects.
4 SES achievement gaps in private madrasahs are
greater than those in private Islamic schools
(H4a) and SES achievement gaps in
Integrationist stream are greater than those in
Traditionalist and Modernist streams (H4b)
Refuted (X): SES gaps in
madrasah are smaller and
there are no differences in SES
gaps across streams.
Finally, although no hypotheses were formulated at the district level, the findings regarding
municipality characteristics deserve further attention and interpretation, which will be
offered in the discussion section.

137
5.6 Discussion and conclusion
In this study, we assessed the effects of various organizational (tracks) and ideological
(streams) in Indonesian private Islamic schools on students’ academic achievement and
achievement gaps across gender and parental SES. Adopting an education production
function approach, it was expected that student achievement is a function of a school's
investment in teaching-related activities and resources (Hanushek, 2007; Coates, 2003;
Bowles, 1970). We discussed four dimensions of investments including: investments in the
primary process, teachers, students, and in organization and coordination. We argued that
the more time, money and attention that are devoted to students, the more they will learn,
and the higher their performance and the smaller their achievement gaps are likely to be.
The results of the multilevel analyses, confirming that investments in teaching time,
more qualified teachers and financial incentives are related to higher student performance,
echo results from educational studies outside Indonesia (Grave, 2010; Stinebrickner &
Stinebrickner, 2008; Darling-Hammond, 2000; Hanushek, 2006). In addition, findings
prove that gender achievement gaps in the integrationist stream are higher than in other
streams for all subjects. The gender achievement gap in private madrasahs is higher than in
private non-madrasahs in science, but this does not hold for math and English. It could be
concluded that investment decisions indeed matter, but that their effects are largely
contingent upon the context in which the investments were made.
This study also resulted in some contradictive findings, for which we will offer some
tentative explanations. In terms of organizational perspective (track), we predicted in
agreement with general perceptions on madrasahs and resource investments, that student
achievement in madrasahs is lower than in non-madrasahs, but we found contradictive
evidence for this. This contradictive finding is not easy to interpret. Perhaps it can be
explained by the selection of the proxy variables at the student level that could not fully
assess prior student achievement. It may be that students in madrassah schools are overall
better students than students in non-madrassah schools. In the present study, however, we
were unable to control for prior student achievement.
A second contradictive finding is that the SES achievement gap for English in private
madrasahs is smaller than in private non-madrasahs. This unexpected finding is difficult to
interpret. We previously assumed that decentralization only benefited non-madrasahs and
not madrasahs. This could be true for public non-madrasahs, which are directly managed
by the local government, but not for private non-madrasahs, which are owned by non-
government organizations. A previous study by Ghozali, Mudjahid and Hayati (2013)
showed that local governments 1) do not treat private non-madrasahs equally as
independent institutions and 2) provide scholarships and school grants for both non-
madrasahs and madrasahs to reduce political risk in direct elections. The smaller gap found
only for English in private madrasahs could be related to effects of parental SES and region.
Student achievement in traditionalist and modernist streams in all subjects is lower on the
island of Java than in other regions of the Indonesian archipelago. In addition, compared to
138
learning math and science, learning English can also be influenced by learning outside
school, such as attending extra language courses or having media access to English
materials. High-SES parents have more possible access to English courses and to resources
like multimedia, especially on Java.
The expected better performance of students in integrationist streams compared to
their traditionalist and modernist counterparts was found to be highly dependent on gender
and municipality. Female students have a pronounced advantage in integrationist schools,
which are characterized by single sex education. This may be in line with findings from
other studies showing single sex education to minimize distractions, reduce discipline
problems, and boost the self-esteem and confidence of girls, thus leading to high
performance (Piper, 2008; Bracey, 2006; Gurian & Henley, 2001; March, Byrne & Yeung,
1999).
In addition to some contradictive findings, the study also revealed an unexpected
finding. No differences were found between the Integrationist stream and the two other
streams with regard to SES achievement gaps. This implies that ideological views, which are
operationalized by financial or other support for low SES pupils in traditionalist and
modernist streams, do not appear to help to narrow the SES achievement gap. Perhaps the
financial and other support for students from families with low SES increase their daily
attendance. The resultant improvement is too small to adequately reduce the SES
achievement gap.
As noted before, in terms of organization (track), the role of municipalities became
very important after the implementation of a decentralized education system. Even though
the effects of municipality poverty rate differ across subjects, these effects are significant,
with similar patterns for math and science, which differ from English. To facilitate
interpretation, we calculated the effects of a municipality poverty rate gap of 20 percent.
For math and science, Figure 5.4 reveals that the student achievement gap is lower in
madrasahs than in non-madrasahs. For English, Figure 5.5 shows that the gap is smaller in
the integrationist stream than in the traditionalist and modernist streams.
To summarize, the findings in this study confirm the value of the education
production function approach and reveal the importance of municipality factors. Before
discussing the implications of our findings, however, we acknowledge some limitations of
this study.
First, the modest degree of explained variance at all levels might be partly due to our
use of aggregate variables at the school-level. The results revealed important significant
effects at the student-level, such as age and gender. In view of the substantial variability at
the municipality-level, it would be worthwhile to include more variables related to
municipality, like sub-district and village characteristics. The development of more fine-
grained variables and measurements may help to unravel the mechanisms underlying the
relation between private Islamic school types and student achievement and achievement
gaps.

139
Second, in spite of the consistency with our theoretical reasoning, in the study we
used cross-sectional data that impede causal inferences. Further studies, therefore, would
profit from a longitudinal design to disentangle causality relations between resource
investment and student achievement. Moreover, such a design could account for the effect
of prior student achievement.
Apart from these limitations, our study discloses several general implications for
research and policy. It refines current research on student achievement and achievement
gaps in three ways. First, our study provides insights into strengths and weaknesses across
school tracks and streams. Such insights can enable local governments to develop better
and more equal interventions to improve education in Islamic private madrasahs and non-
madrasahs, both in the domains of school funding and teacher development. The patterns
seem to indicate that the government’s interventions to improve Islamic private schools
need to be focused on the traditionalist and modernist streams. Both streams
predominantly serve children from low SES parents, and are thus associated with limited
parental resources, leading in turn to inadequate school incomes. In addition, the presence
of modernist schools in all provinces and almost all municipalities indicates that they reach
diverse students across the country, including remote areas where public schools do not
exist. Therefore, improving the quality of modernist and traditionalist schools would lead to
improved quality of learning for underprivileged and underserved students.
Second, our study suggests that although school tracks and streams matter, student
and family characteristics are still strong determinants of student achievement and
achievement gaps. Examination of the cross-level interaction between gender and school
streams shows that the effects of school streams are only significant for girls in the
integrationist stream, implying that differences across streams affect girls and boys
differently. This result provides new insight into the conditions under which students
perform better in the Islamic private school. For instance, girls seem to profit from the
implementation of single sex education in private Islamic schools but boys do not have
those benefits.
Third, to our knowledge, this study is the first empirical attempt to test the relation
between characteristics of private Islamic school tracks and streams and student
achievement and achievement gaps in Indonesia, one of the largest Muslim countries in the
world. Most research in student achievement and achievement gaps has been conducted in
schools in general (Suharti, 2013; Suryadarma, 2010) or comparing public and private
schools (Newhouse & Beegle, 2006). This study, therefore, fills a gap to enrich the literature
on the education production function approach by adding information about organizational
and resource investments in a specific context of private Islamic school tracks and streams.