University of Groningen The Cross-Cultural Dementia Screening … · The Cross-Cultural Dementia...
12
University of Groningen The Cross-Cultural Dementia Screening (CCD) Goudsmit, Miriam; Uysal-Bozkir, Ozgul; Parlevliet, Juliette L.; van Campen, Jos P. C. M.; de Rooij, Sophia E.; Schmand, Ben Published in: Journal of Clinical and Experimental Neuropsychology DOI: 10.1080/13803395.2016.1209464 IMPORTANT NOTE: You are advised to consult the publisher's version (publisher's PDF) if you wish to cite from it. Please check the document version below. Document Version Publisher's PDF, also known as Version of record Publication date: 2017 Link to publication in University of Groningen/UMCG research database Citation for published version (APA): Goudsmit, M., Uysal-Bozkir, O., Parlevliet, J. L., van Campen, J. P. C. M., de Rooij, S. E., & Schmand, B. (2017). The Cross-Cultural Dementia Screening (CCD): A new neuropsychological screening instrument for dementia in elderly immigrants. Journal of Clinical and Experimental Neuropsychology, 39(2), 163-172. https://doi.org/10.1080/13803395.2016.1209464 Copyright Other than for strictly personal use, it is not permitted to download or to forward/distribute the text or part of it without the consent of the author(s) and/or copyright holder(s), unless the work is under an open content license (like Creative Commons). Take-down policy If you believe that this document breaches copyright please contact us providing details, and we will remove access to the work immediately and investigate your claim. Downloaded from the University of Groningen/UMCG research database (Pure): http://www.rug.nl/research/portal. For technical reasons the number of authors shown on this cover page is limited to 10 maximum. Download date: 28-03-2019
Transcript of University of Groningen The Cross-Cultural Dementia Screening … · The Cross-Cultural Dementia...

University of Groningen
The Cross-Cultural Dementia Screening (CCD)Goudsmit, Miriam; Uysal-Bozkir, Ozgul; Parlevliet, Juliette L.; van Campen, Jos P. C. M.; deRooij, Sophia E.; Schmand, BenPublished in:Journal of Clinical and Experimental Neuropsychology
DOI:10.1080/13803395.2016.1209464
IMPORTANT NOTE: You are advised to consult the publisher's version (publisher's PDF) if you wish to cite fromit. Please check the document version below.
Document VersionPublisher's PDF, also known as Version of record
Publication date:2017
Link to publication in University of Groningen/UMCG research database
Citation for published version (APA):Goudsmit, M., Uysal-Bozkir, O., Parlevliet, J. L., van Campen, J. P. C. M., de Rooij, S. E., & Schmand, B.(2017). The Cross-Cultural Dementia Screening (CCD): A new neuropsychological screening instrument fordementia in elderly immigrants. Journal of Clinical and Experimental Neuropsychology, 39(2), 163-172.https://doi.org/10.1080/13803395.2016.1209464
CopyrightOther than for strictly personal use, it is not permitted to download or to forward/distribute the text or part of it without the consent of theauthor(s) and/or copyright holder(s), unless the work is under an open content license (like Creative Commons).
Take-down policyIf you believe that this document breaches copyright please contact us providing details, and we will remove access to the work immediatelyand investigate your claim.
Downloaded from the University of Groningen/UMCG research database (Pure): http://www.rug.nl/research/portal. For technical reasons thenumber of authors shown on this cover page is limited to 10 maximum.
Download date: 28-03-2019
Full Terms & Conditions of access and use can be found athttp://www.tandfonline.com/action/journalInformation?journalCode=ncen20
Download by: [University of Groningen] Date: 22 June 2017, At: 00:41
Journal of Clinical and Experimental Neuropsychology
ISSN: 1380-3395 (Print) 1744-411X (Online) Journal homepage: http://www.tandfonline.com/loi/ncen20
The Cross-Cultural Dementia Screening (CCD): Anew neuropsychological screening instrument fordementia in elderly immigrants
Miriam Goudsmit, Özgül Uysal-Bozkir, Juliette L. Parlevliet, Jos P.C.M. vanCampen, Sophia E. de Rooij & Ben Schmand
To cite this article: Miriam Goudsmit, Özgül Uysal-Bozkir, Juliette L. Parlevliet, Jos P.C.M.van Campen, Sophia E. de Rooij & Ben Schmand (2017) The Cross-Cultural DementiaScreening (CCD): A new neuropsychological screening instrument for dementia in elderlyimmigrants, Journal of Clinical and Experimental Neuropsychology, 39:2, 163-172, DOI:10.1080/13803395.2016.1209464
To link to this article: http://dx.doi.org/10.1080/13803395.2016.1209464
© 2016 The Author(s). Published by InformaUK Limited, trading as Taylor & FrancisGroup
View supplementary material
Published online: 08 Aug 2016. Submit your article to this journal
Article views: 667 View related articles
View Crossmark data

The Cross-Cultural Dementia Screening (CCD): A new neuropsychologicalscreening instrument for dementia in elderly immigrantsMiriam Goudsmita, Özgül Uysal-Bozkirb, Juliette L. Parlevlietb, Jos P.C.M. van Campenc,Sophia E. de Rooijb,d and Ben Schmande,f
aDepartment of Medical Psychology/Hospital Psychiatry, Medical Centre Slotervaart, Amsterdam, The Netherlands; bDepartmentof Internal Medicine, Section of Geriatric Medicine, Academic Medical Centre, University of Amsterdam, Amsterdam, TheNetherlands; cDepartment of Geriatrics, Medical Centre Slotervaart, Amsterdam, The Netherlands; dUniversity of Groningen,University Medical Center Groningen, University Center for Geriatric Medicine, Groningen, The Netherlands; eDepartment ofMedical Psychology, Academic Medical Centre, University of Amsterdam, Amsterdam, The Netherlands; fFaculty of Social andBehavioural Science, program group Brain and Cognition, University of Amsterdam, Amsterdam, The Netherlands
ABSTRACTObjective: Currently, approximately 3.9% of the European population are non-EU citi-zens, and a large part of these people are from “non-Western” societies, such as Turkeyand Morocco. For various reasons, the incidence of dementia in this group is expectedto increase. However, cognitive testing is challenging due to language barriers and loweducation and/or illiteracy. The newly developed Cross-Cultural Dementia Screening(CCD) can be administered without an interpreter. It contains three subtests that assessmemory, mental speed, and executive function. We hypothesized the CCD to be aculture-fair test that could discriminate between demented patients and cognitivelyhealthy controls. Method: To test this hypothesis, 54 patients who had probabledementia were recruited via memory clinics. Controls (N = 1625) were recruited viatheir general practitioners. All patients and controls were aged 55 years and older andof six different self-defined ethnicities (Dutch, Turkish, Moroccan-Arabic, Moroccan-Berber, Surinamese-Creole, and Surinamese-Hindustani). Exclusion criteria includedcurrent or previous conditions that affect cognitive functioning. Results: There wereperformance differences between the ethnic groups, but these disappeared aftercorrecting for age and education differences between the groups, which supports ourcentral hypothesis that the CCD is a culture-fair test. Receiver-operating characteristic(ROC) and logistic regression analyses showed that the CCD has high predictive validityfor dementia (sensitivity: 85%; specificity: 89%). Discussion: The CCD is a sensitive andculture-fair neuropsychological instrument for dementia screening in low-educatedimmigrant populations.
ARTICLE HISTORYReceived 15 September2015Accepted 1 July 2016
KEYWORDSCognition; Cross-cultural;Dementia;Neuropsychological tests;Sensitivity and specificity
Currently, approximately 3.9% of the Europeanpopulation are non-EU citizens, and a large part ofthese people are from “non-Western” societies, suchas Turkey and Morocco (19.6 million people;Eurostat, 2015). In the coming decades, this immi-grant population will grow older, and the incidenceof bothmild cognitive impairment and dementia willincrease accordingly. Accurate information aboutthe prevalence of dementia is not available for mostof the minority groups in European countries.
The diagnosis of dementia in elderly immi-grants can be challenging for a number of reasons.Most of the elderly immigrants from ethnic mino-rities have a limited knowledge of the host coun-try’s language, and many are low educated or evenilliterate. Due to these barriers, either cognitivetesting is not possible, or the degree of cognitiveimpairment is overestimated due to the minorities’poor results on conventional cognitive screeninginstruments (Ardila, 2005; Manly & Espino, 2004;
CONTACT Miriam Goudsmit [email protected] Department of Medical Psychology/Hospital Psychiatry, Medical CentreSlotervaart, Louwesweg 6, 1066 EC, Amsterdam, The Netherlands, or Özgül Uysal-Bozkir [email protected] Department ofInternal Medicine, Section of Geriatric Medicine, Academic Medical Centre, University of Amsterdam, F4-108, Meibergdreef 9, 1105 AZ,Amsterdam, The Netherlands
Supplemental table for this article can be accessed here.
JOURNAL OF CLINICAL AND EXPERIMENTAL NEUROPSYCHOLOGY, 2017VOL. 39, NO. 2, 163–172http://dx.doi.org/10.1080/13803395.2016.1209464
© 2016 The Author(s). Published by Informa UK Limited, trading as Taylor & Francis GroupThis is an Open Access article distributed under the terms of the Creative Commons Attribution License (http://creativecommons.org/licenses/by/4.0/), which permitsunrestricted use, distribution, and reproduction in any medium, provided the original work is properly cited.

O’Bryant & O’Jile, 2004). For instance, on the MiniMental State Examination (MMSE), scores that areas low as 14 points (that is, 10 points under thenormal cutoff score of 24 points) may still benormal for illiterates (Ardila et al., 2010).Cultural factors may further influence these mino-rities’ perception of cognitive symptoms thataccompany dementia, their likelihood of visiting amemory clinic, and the communication betweenthese patients and their general practitioners (GPs)and/or specialists (Mukadam, Cooper, &Livingston, 2011). Memory clinics across Europeare currently not well prepared for the elderlyimmigrant population, mainly because there arehardly any culturally appropriate cognitive screen-ing tests available (Nielsen et al., 2011).
We developed a new neuropsychologicaldementia screening test, the Cross-CulturalDementia screening (CCD; Goudsmit, Parlevliet,van Campen, & Schmand, 2014). In this paper,we present data on the standardization and valida-tion of the CCD (i.e., the diagnostic accuracy) inboth cognitively healthy participants and demen-ted patients.
Method
Features of the CCDThe CCD was developed in 2005 in a general hos-pital (Medical Centre Slotervaart) in Amsterdam.The CCD consists of three subtests that measurememory, mental speed, and executive function.
Memory is assessed by the Objects test, which isa memory test that uses colored pictures of every-day objects, such as household items, tools, food,and clothing. The participant has to recognize 30target items that are among an increasing numberof distractors (92, in total). This test has two parts:a learning trial with immediate recognition (PartA) and a delayed recognition trial (Part B). Thescore of the Objects test represents the number of
correctly recognized targets (maximum: 30) plusthe number of correctly rejected distractors (max-imum: 92). The maximum total score for immedi-ate and delayed recognition is 122 each.
Mental speed and inhibition are assessed by theSun–Moon test, which is a series of suns andmoons that the participant has to name as fast aspossible in his or her mother tongue (Part A). Foran example, see Figure 1. In the second part of thetest (Part B), the participant is asked to say “sun”when a moon is shown and “moon” when a sun isshown, which evokes a Stroop effect (Stroop,1935). The scores of Parts A and B include thetime to completion in seconds plus the addedpenalty seconds for mistakes; accordingly, bothspeed and accuracy are taken into account.
Mental speed and divided attention are assessedby the Dots test, which is based on the TrailMaking Test (Reitan & Wolfson, 1985). Insteadof letters and numbers, this task uses stimuli thatresemble domino pieces. In the first part of the test(Part A), dominoes that have one to nine dots haveto be connected in the right order as fast as possi-ble by drawing a line in pencil. In the second part(Part B), the participant must connect black andwhite dominoes to one another, in both an alter-nating and an ascending order from one to nine, asfast as possible (i.e., 1 white–1 black–2 white–2black, etc.; see Figure 2). The scores include thetime in seconds on both Part A and Part B.Mistakes are also scored, but they are only usedfor the qualitative analysis.
The CCD does not require general factualknowledge or reading and writing skills. The testprovides multiple examples in order to ensure thatthe participant understands the instructions. Thetest can be administered without the experimenterneeding to speak in the participants’ language. Testinstructions are given by the computer by thedigitally recorded standard instructions in the par-ticipants’ language. Currently, the CCD is available
Figure 1. Example of a stimulus material from the Sun–Moon test.
164 M. GOUDSMIT ET AL.

in six languages: Dutch; Turkish; Moroccan-Arabicand Tarifit (two languages that are commonly spo-ken by Moroccans in the Netherlands); andSranantongo and Sarnámi-Hindustani (the mostspoken of the Surinamese languages by theCreoles and the Hindustani, respectively). Thetest instructions were translated by professionaltranslators and were judged for suitability by bilin-gual and bicultural administrators. Furthermore,the test requires no or minimal verbal responsefrom the participant; only behavioral responses,such as pointing to the correct alternative, arerequired. Note: The Sun–Moon test is the onlyexception to the nonverbal procedure because theadministrator needs to know the words for sunand moon in the participants’ language in orderto score the task. The administration time isapproximately 20 minutes.
Experiment 1: Standardization
Method
ParticipantsParticipants were recruited to the SYMBOL-studyof the Academic Medical Centre in Amsterdam(AMC), the Netherlands. SYMBOL stands forSystematic Memory Testing Beholding OtherLanguages (Parlevliet et al., 2014). Inclusionoccurred from May 2010 to May 2013.Participants were approached through their GPs,who were located in seven cities in theNetherlands, which all have a large immigrant
population. Informed consent was obtained fromall of the participants. The study was approved bythe AMC institutional review board.
All of the patients of the participating GPs whomet the inclusion criteria (being of Dutch, Turkish,Moroccan, or Surinamese descent and being aged55 years or older) were invited to participate in thestudy via a letter that was sent by their GP and theresearch team. Afterwards, they received a tele-phone call from a bilingual and bicultural inter-viewer who provided them with furtherexplanation about the study. If the participantwas interested, an appointment was made at theGP’s practice or at a local (senior) center, or theywere visited at home.
All of the eligible participants were screened forexclusion criteria, which were reported by the par-ticipant, a family member, and/or the GP. Theseincluded current or a history of neurological dis-eases, such as brain tumors, epilepsy, severestrokes with permanent disabilities, brain injurywith a loss of consciousness for more than anhour and hospitalization, memory complaintsthat are worse than normal for one’s age, obviouscognitive impairment (as judged by the examiner),psychosis at the time of assessment, or a history ofpsychosis or bipolar disorder. In addition, a fewparticipants (n = 14) were excluded due to pro-blems with the test administration (i.e., severevisual problems or a lack of cooperation).
All of the participants completed the CCD and astructured questionnaire. The questionnaire (if
Figure 2. Example of a stimulus material from the Dots test (Part B).
JOURNAL OF CLINICAL AND EXPERIMENTAL NEUROPSYCHOLOGY 165

necessary, taken orally for illiterate participants)contained questions on demographic characteris-tics, medical history, self-perceived cognitive func-tioning (Question 6 of the EuroQoL 5D+C;Brooks, 1996; Krabbe, Stouthard, Essink-Bot, &Bonsel, 1999), and depressive symptoms (usingthe Geriatric Depression Scale–2 or –15; Arroll,Khin, & Kerse, 2003; Sheikh & Yesavage, 1986).
Bilingual and bicultural interviewers adminis-tered the CCD and the questionnaire. All of themwere students in psychology or in a related disci-pline, and they received 9–12 hours of training onthe administration and scoring of the CCD.
ProcedureParticipants were divided into six groups, based ontheir self-defined ethnicity: Dutch, Turkish,Moroccan-Arabic, Moroccan-Berber, Surinamese-Creole, and Surinamese-Hindustani. Their demo-graphic characteristics are shown in Table 1. Theirmean age was 65.1 years (SD = 7.4 years), and 45%were males. Education was scored according to theInternational Standard Classification of Educationof UNESCO (ISCED, 2012).
The ethnic groups differed in regard to age, F(5,1619) = 16.38, p < .001, sex, χ2(5) = 59.2, p < .001,and education, Kruskal–Wallis, χ2(5) = 688.5, p <.001. Turkish and Moroccan participants wererelatively younger and had less education thanthe native Dutch and Surinamese participants.Missing data on sex and education were replacedby the same proportion of the sex distribution (n =27) or the median of the education level (n = 54) ofthe same ethnic group. Participants with scores onthe CCD that could be defined as outliers wereremoved (n = 32–73, depending on the subtest).These outliers had a score that was less than 112
on immediate recognition of the Objects test,greater than 200 (s) on Part A of the Sun–Moontest, greater than 250 (s) on Part B of the Sun–Moon test, greater than 350 (s) on Part A of theDots test, and/or greater than 600 (s) on Part B ofthe Dots test. Statistical analyses were conductedusing the IBM SPSS Statistics Version 20.0 forWindows.
Results
The means and standard deviations for the CCDsubtest scores for each of the ethnic groups areshown in Table 2.
To examine the effect of ethnicity on the CCDresults, we performed an analysis of covariance(ANCOVA, or multivariate analysis of covariance,MANCOVA) with the CCD subtest scores as thedependent variables, the ethnic group as the inde-pendent variable, and age and education as thecovariates. If the data were not normally distribu-ted, they were either transformed or subjected to anonparametric analysis.
The average immediate recognition score on theObjects test (Part A) was 121 out of the 122objects. The average score for delayed recognition(Part B) was 116 out of the 122 objects. Thus,almost all of the participants performed very wellon both of the subtests, which made the scoredistribution highly skewed. Therefore, differencesbetween the ethnic groups were tested based on theKruskal–Wallis test [Part A: χ2(5) = 143.4, p < .001;Part B: χ2(5) = 51.5, p < .001], which showedsignificant differences between the groups.Despite the skewed distribution, the MANCOVAwas used to estimate the effect sizes. The effects of
Table 1. Demographic background of the participants from six ethnic groups.Participantcharacteristics
Turkish(n = 323)
Moroccan-Arabic(n = 173)
Moroccan-Berber(n = 59)
Surinamese-Creole(n = 346)
Surinamese-Hindustani(n = 249)
Native Dutch(n = 475)
Total(N = 1625)
Sexa
% Male 46 69 45 36 36 48 45Age (years)Mean 63.6 63.5 65.6 64.5 64.2 67.5 65.1SD 6.0 6.2 6.5 7.8 7.4 8.0 7.4Range 55–83 55–79 55–77 55–91 55–87 55–95 55–95
Educationb,c
Median 1 1 0 5 3 5 4Range 0–7 0–6 0–5 0–7 0–7 1–7 0–7
Note. N = 1625.aFor 27 participants, sex was not registered. bFor 54 participants, education was not registered. cOrdinal scale: range was from 0 (illiterate/noeducation) to 7 (university). Eight categories: 0: no education; 1: less than 6 classes of elementary school; 2: elementary school; 3: more thanelementary school, without specialized further education; 4: secondary education, skills level; 5: secondary education; 6: tertiary education(bachelor); 7: tertiary education (master and higher).
166 M. GOUDSMIT ET AL.

ethnicity, age, and education were small. Theirexplained variance (η2) was approximately 3%.
The mean corrected time score (i.e., includingpenalty seconds in the case of errors) for the Sun–Moon test was 30 (s) for Part A (Naming) and 41(s) for Part B (Interference). There weredifferences between the ethnic groups for theSun–Moon test, for both Part A and Part B, F(10,3168) = 18.3, p < .001, η2 = .06. The native Dutchgroup was faster than the rest; when excluding thissubgroup, differences still remained betweenthe other groups for Part B, F(8, 2244) = 3.9,p < .001, but the explained variance was verysmall (η2 = .01). The differences between the eth-nic groups could partly be explained by differencesin word length of the words “sun” and “moon” inthe different languages. There were also effects foreducation, F(2, 1583) = 64.1, p < .001; and age, F(2,1583) = 32.3, p < .001. Higher educated andyounger participants performed better, but again,the explained variances were very small (η2 = .08and η2 = .04, respectively). Thus, the Sun–Moontest had a small to moderate association with eth-nicity, education, and age.
The average time on the Dots test for Part A was37 s, and on Part B it was 104 s. We log-transformedthe scores before performing an ANCOVA for PartsA and B because the values were not normally
distributed. There were differences between the eth-nic groups for Part A, F(5, 1583) = 48.7, p < .001, η2 =.13, and for Part B, F(5, 1546) = 68.7, p < .001, η2 =.18. The native Dutch group was faster than the rest;when excluding this subgroup, there were no differ-ences between the other groups [Part A: F(4, 1122) =0.64, p = .64; Part B: F(4, 1122) = 1.51, p = .20].Education also had an impact on the performancesof Parts A and B: Higher educated subjects per-formed better, F(1, 1583) = 260.9, p < .001, η2 = .14;F(1, 1546) = 211.9, p < .001, η2 = .12, respectively.Finally, age also affected the performances of Parts Aand B: Younger participants performed better, F(1,1583) = 98.9, p < .001, η2 = .06; F(1, 1546) = 115.8, p <.001, η2 = .07, respectively.
Level of education correlated with test results(higher educated people attaining better scores),with explained variances between 3% (Objects test)and 14% (Dots test Part B). Moreover, the standarddeviations of scores tended to be larger in the lowesteducation group (see Supplementary table).
Further analysis of cultural differences
We hypothesized that the differences in CCDscores for the different ethnic groups would becaused by the fact that our six ethnic groups werenot fully comparable with regard to education and
Table 2. Performance on the CCD subtests by the six ethnic groups.
Performance on the CCD TurkishMoroccan-Arabic
Moroccan-Berber
Surinamese-Creole
Surinamese-Hindustani
NativeDutch Total
Objects testn 311 165 55 344 239 473 1587Part A: Immediate Recognitionscore
120 (2) 120 (2) 120 (2) 121 (2) 121 (2) 121 (1) 121 (2)
Part B: Delayed Recognitionscore
115 (6) 116 (5) 116 (6) 115 (5) 115 (5) 117 (4) 116 (5)
Sun–Moon testn 318 171 55 343 242 463 1592Part A:Time (s) 33 (11) 30 (11) 38 (16) 30 (14) 32 (11) 23 (7) 29 (12)No of errors 0.3 (1.0) 0.2 (0.6) 0.2 (0.7) 0.3 (1.4) 0.6 (2.3) 0.0 (0.4) 0.3 (1.2)Penalty seconds per mistake 3.6 5.8 8.4 2.3 4.0 1.4 4.5Corrected time score (s) 33 (12) 31 (12) 40 (9) 31 (14) 34 (15) 23 (7) 30 (14)Part B:Time (s) 41 (14) 43 (18) 49 (21) 38 (14) 38 (15) 27 (7) 36 (15)No of errors 1.3 (3.4) 1.0 (2.0) 1.5 (2.6) 0.8 (2.9) 1.3 (3.7) 0.2 (1.1) 0.8 (2.7)Penalty seconds per mistake 3.5 4.3 8.3 4.6 3.6 3.4 5.5Corrected time score (s) 46 (21) 48 (22) 64 (40) 42 (21) 44 (24) 28 (9) 41 (25)
Dots testn 314 170 55 343 242 469 1593Part A:Time (s)
50 (38) 56 (48) 73 (60) 34 (27) 41 (34) 19 (12) 37 (35)
n 298 165 52 342 228 467 1552Part B:Time (s)
134 (73) 150 (96) 166(102) 104 (80) 119 (80) 54 (34) 104 (79)
Note. CCD = Cross-Cultural Dementia Screening. Means; standard deviations in parentheses. Participants with scores that were defined as outlierswere removed so number of subjects differs per subtest; see Method section.
JOURNAL OF CLINICAL AND EXPERIMENTAL NEUROPSYCHOLOGY 167

age. Therefore, the analyses were repeated for threeage-matched and education-matched subgroups ofparticipants (59 were Moroccan-Berber, 59 wereMoroccan-Arabic, and 59 were Turkish).Matching on age and education with the lowesteducated group (the Moroccan-Berber group)proved possible for these three ethnic groups onlybecause both the Surinamese and the native Dutchgroup were higher educated and older, comparableto the age and education distribution in theirpopulations. For the age-matched and education-matched ethnic groups, there was no longer a sig-nificant effect for ethnicity detectable. This out-come, together with the earlier analyses on effectof ethnicity, supported our assumption that mostcultural differences on the CCD were in factcaused by differences in population characteristicssuch as age and education.
Experiment 2: Validity
Method
PatientsPatients with a diagnosis of probable dementiawere recruited from memory clinics. Inclusionoccurred between January 2009 and March 2013.The diagnosis of dementia was made according tothe Dutch consensus guidelines by a geriatricianor neurologist (Knopman et al., 2001; Waldemaret al., 2007). The CCD was not used as a diag-nostic tool in order to avoid circularity in thediagnosis (incorporation bias). Informed consentwas obtained for all of the patients from theirprimary caregivers. They received oral and writ-ten information about the research project, whichwas approved by the ethical committee of thehospital.
We included 54 patients (28 were Turkish, 8were Moroccan-Berber, 6 were Surinamese-Creole, 5 were Moroccan-Arabic, 5 were nativeDutch, and 2 were Surinamese- Hindustani). Thediagnoses included Alzheimer’s disease (43%), thecombination of Alzheimer’s disease and vasculardementia (19%), vascular dementia (17%), demen-tia not otherwise specified (16%), fronto-temporaldementia (3%), and Lewy body dementia (2%).Information on the severity of dementia was notsystematically scored.
After the routine diagnostic procedures, theCCD was administered by an experienced neurop-sychologist or by a trained examiner who had a
master’s degree in psychology and prior experiencewith testing demented patients.
ProcedureThe patients (n = 54) were matched for age, educa-tion, gender, and ethnicity to control for these char-acteristics in the participants (n = 54) who weredrawn from the standardization sample. The discri-minative capacity of the CCD was evaluated withreceiver operating characteristics (ROC) curves,which visually reveal sensitivity and specificity inthe area under the curve (AUC). Finally, to examinethe predictive power of the CCD, a logistic regressionanalysis was performed with the group (control par-ticipant and demented patient) as the dependentvariable and with CCD performance, age, education,and the ethnic group as the independent variables.
The patients had little education (ISCED scalemedian = 1.0; range = 0–5); most of the patientshad completed less than elementary school. Themean age was 77 years (SD = 9), and 56% werefemale. The missing values or outliers of thedemented patients were replaced by the lowestnormal values of the patient group, 250 s for theSun–Moon test, Part A and/or B (n = 14); 554 s forthe Dots test, Part A (n = 21), and 574 s for theDots test, Part B (n = 32). The missing values oroutliers for the control participants were replacedby the lowest normal value in the control group,518 s for the Dots test, Part B (n = 3).
Results
In Table 3, the CCD performance of the controlparticipants and demented patients is shown.Controls performed better than demented patientson all of the subtests (Mann–Whitey U test for thedifferences in distributions between the groupswere all significant at the p < .001 level).
The sensitivity and specificity of the CCD subtestsare shown in a ROC curve (see Figure 3). Part B ofthe Objects test shows the best combination of sensi-tivity and specificity. AUCs varied from .85 (Sun–Moon test, Part A) to .95 (Objects test, Part B).
The optimal results for discriminating the con-trols from the demented patients were reached withthe cutoff points that are reported in Table 4. Thesecutoff points were determined by combining themaximum scores for both sensitivity and specificity(i.e., Youden index; Youden, 1950).
To determine which subtest had the best pre-dictive value for dementia, we performed a
168 M. GOUDSMIT ET AL.

forward stepwise conditional logistic regressionanalysis (N = 108; 54 demented patients and 54matched controls). Predictors included all of theCCD subtest results, age, and education. InTable 5, the results of the best predictors areshown. Age and education were not significantpredictors (p = .17 and p = .57, respectively). The
best predictors were the Objects test, Part B(Delayed Recognition) and the Sun–Moon test,Part B (Interference). The other subtests did notadd predictive value. A similar solution wasreached by combining Objects test Part B with
Table 3. Performance on the CCD subtests by the controlparticipants and the demented patients.
Performance on the CCD
Group
Control(n = 54)
Demented(n = 54)
Objects testPart A: Immediate Recognition scorea 120 (4) 107 (11)Part B: Delayed Recognition scorea 115 (6) 97 (7)
Sun–Moon testPart A: Corrected time score (s)b 34 (15) 100 (81)Part B: Corrected time score (s)c 46 (24) 170 (78)
Dots testPart A: Time (s) 45 (37) 285 (225)Part B: Time (s) 157 (126) 438 (179)
Note. CCD = Cross-Cultural Dementia Screening. Means; standarddeviations in parentheses.
aThe number of good-positives plus the number of good-negatives(max.: 122). bCorrected time score Part A = time in Part A +(penalty seconds × errors). cCorrected time score Part B = time inPart B + (penalty seconds × errors).
1,0
0,8
0,6
0,4
0,2
0,00,2 0,4 0,6
1 - Specificity
Sen
siti
vity
0,80,0 1,0
Objects test part AImmediate RecognitionObjects test part BDelayed RecognitionSun-Moontest part Acorrected time scoreSun-Moontest part Bcorrected time scoreDots test part A time scoreDots test part B time scoreReference Line
Figure 3. Receiver-operating characteristic (ROC) curves that show the discrimination between the demented patients andcontrols by the three subtests of the Cross-Cultural Dementia Screening (CCD).
Table 4. Optimal cutoff points, sensitivity, and specificityfor all of the subtests, based on 54 controls and 54demented patients.
Performance on the CCDCutoffscores Sensitivity Specificity
Objects testPart A: Immediate Recognitionscorea
<118 .85 .89
Part B: Delayed Recognitionscorea
<109 .92 .91
Sun–Moon testPart A: Corrected timescore (s)b
>39 .81 .85
Part B: Corrected timescore (s)c
>71 .85 .89
Dots testPart A: Time (s) >115 .67 .98Part B: Time (s) >216 .85 .83
aThe number of good-positives plus the number of good-negatives(max.: 122). bCorrected time score A = time in Part A + (penaltyseconds × errors). cCorrected time score B = time in Part B +(penalty seconds × errors).
Table 5. Logistic regression analysis results.
Predictor B SE Wald df Exp (B)
95% CI for Exp (B)
p Lower Upper
Objects test, Part B: Delayed Recognition score –0.190 0.050 14.244 1 .000 0.827 0.749 0.913Sun–Moon test, Part B: Corrected time score (s) 0.022 0.008 7.277 1 .007 1.022 1.006 1.039Constant 18.321 5.567 10.831 1 .001
Note. CI = confidence interval.
JOURNAL OF CLINICAL AND EXPERIMENTAL NEUROPSYCHOLOGY 169
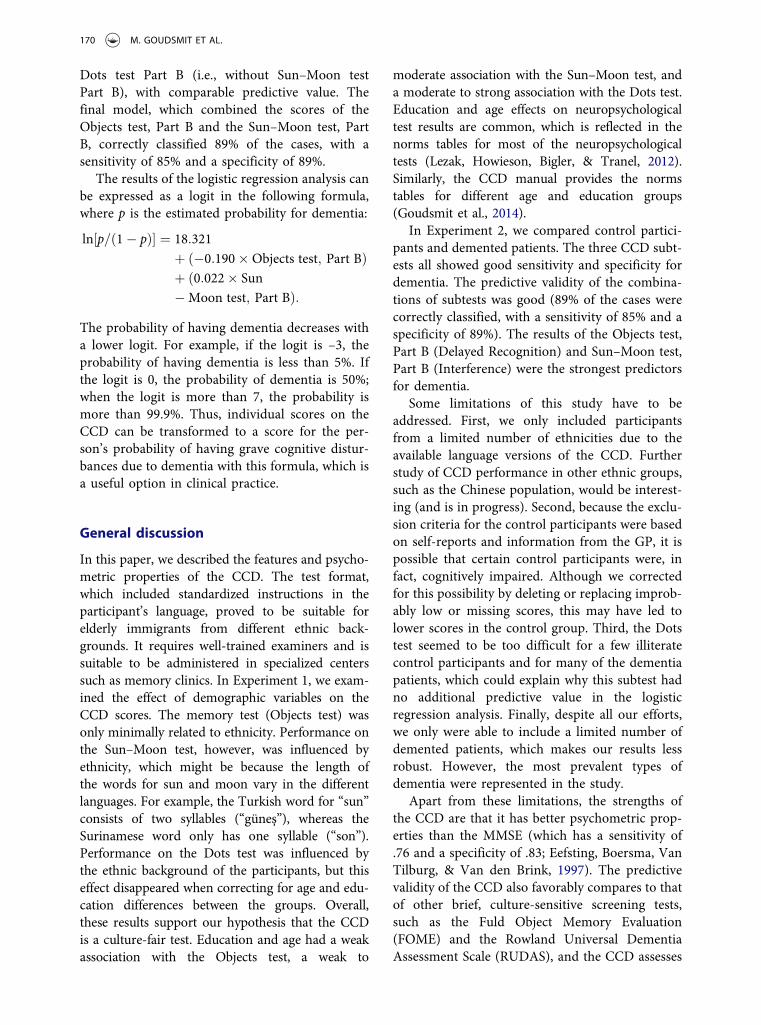
Dots test Part B (i.e., without Sun–Moon testPart B), with comparable predictive value. Thefinal model, which combined the scores of theObjects test, Part B and the Sun–Moon test, PartB, correctly classified 89% of the cases, with asensitivity of 85% and a specificity of 89%.
The results of the logistic regression analysis canbe expressed as a logit in the following formula,where p is the estimated probability for dementia:
ln½p=ð1� pÞ� ¼ 18:321
þ ð�0:190�Objects test; Part BÞþ ð0:022� Sun
�Moon test; Part BÞ:The probability of having dementia decreases witha lower logit. For example, if the logit is –3, theprobability of having dementia is less than 5%. Ifthe logit is 0, the probability of dementia is 50%;when the logit is more than 7, the probability ismore than 99.9%. Thus, individual scores on theCCD can be transformed to a score for the per-son’s probability of having grave cognitive distur-bances due to dementia with this formula, which isa useful option in clinical practice.
General discussion
In this paper, we described the features and psycho-metric properties of the CCD. The test format,which included standardized instructions in theparticipant’s language, proved to be suitable forelderly immigrants from different ethnic back-grounds. It requires well-trained examiners and issuitable to be administered in specialized centerssuch as memory clinics. In Experiment 1, we exam-ined the effect of demographic variables on theCCD scores. The memory test (Objects test) wasonly minimally related to ethnicity. Performance onthe Sun–Moon test, however, was influenced byethnicity, which might be because the length ofthe words for sun and moon vary in the differentlanguages. For example, the Turkish word for “sun”consists of two syllables (“güneş”), whereas theSurinamese word only has one syllable (“son”).Performance on the Dots test was influenced bythe ethnic background of the participants, but thiseffect disappeared when correcting for age and edu-cation differences between the groups. Overall,these results support our hypothesis that the CCDis a culture-fair test. Education and age had a weakassociation with the Objects test, a weak to
moderate association with the Sun–Moon test, anda moderate to strong association with the Dots test.Education and age effects on neuropsychologicaltest results are common, which is reflected in thenorms tables for most of the neuropsychologicaltests (Lezak, Howieson, Bigler, & Tranel, 2012).Similarly, the CCD manual provides the normstables for different age and education groups(Goudsmit et al., 2014).
In Experiment 2, we compared control partici-pants and demented patients. The three CCD subt-ests all showed good sensitivity and specificity fordementia. The predictive validity of the combina-tions of subtests was good (89% of the cases werecorrectly classified, with a sensitivity of 85% and aspecificity of 89%). The results of the Objects test,Part B (Delayed Recognition) and Sun–Moon test,Part B (Interference) were the strongest predictorsfor dementia.
Some limitations of this study have to beaddressed. First, we only included participantsfrom a limited number of ethnicities due to theavailable language versions of the CCD. Furtherstudy of CCD performance in other ethnic groups,such as the Chinese population, would be interest-ing (and is in progress). Second, because the exclu-sion criteria for the control participants were basedon self-reports and information from the GP, it ispossible that certain control participants were, infact, cognitively impaired. Although we correctedfor this possibility by deleting or replacing improb-ably low or missing scores, this may have led tolower scores in the control group. Third, the Dotstest seemed to be too difficult for a few illiteratecontrol participants and for many of the dementiapatients, which could explain why this subtest hadno additional predictive value in the logisticregression analysis. Finally, despite all our efforts,we only were able to include a limited number ofdemented patients, which makes our results lessrobust. However, the most prevalent types ofdementia were represented in the study.
Apart from these limitations, the strengths ofthe CCD are that it has better psychometric prop-erties than the MMSE (which has a sensitivity of.76 and a specificity of .83; Eefsting, Boersma, VanTilburg, & Van den Brink, 1997). The predictivevalidity of the CCD also favorably compares to thatof other brief, culture-sensitive screening tests,such as the Fuld Object Memory Evaluation(FOME) and the Rowland Universal DementiaAssessment Scale (RUDAS), and the CCD assesses
170 M. GOUDSMIT ET AL.

more domains than the Common Objects MemoryTest (COMT; Kempler, Teng, Taussig, & Dick,2010; Nielsen et al., 2013; Rideaux, Beaudreau,Fernandez, & O’Hara, 2012). Furthermore, theCCD has the advantage that it may be adminis-tered without an interpreter.
In conclusion, the CCD is a promising tool forthe screening of cognitive impairment in elderlyimmigrants, and it has been proven to overcomelow education or illiteracy barriers, language bar-riers, and cultural differences. The CCD is a usefulcomplement to the usual multidisciplinary diag-nostic workup in memory clinics.
Author note
Miriam Goudsmit and Özgül Uysal-Bozkir contributedequally to this paper. M.G., J.P., J.C., and B.S. designedthe Cross-Cultural Dementia Screening (CCD). M.G.and J.C. recruited most of the patients. O.U. and J.P.recruited the other participants. S.R. and J.P. drafted theSYMBOL (Systematic Memory Test Beholding OtherLanguages) research protocol for the control partici-pants and wrote the SYMBOL funding protocol. M.G.and O.U. drafted the first version of the manuscript. M.G., O.U., and B.S. performed the data analysis. All of theauthors were involved in the conceptual design, themanuscript revisions, and the final approval of themanuscript.
Acknowledgements
The authors wish to acknowledge the research assistants inthe study (Wing-Sam Cheung and Isabella Makkinje) andthe bilingual and bicultural interviewers. Additionally,they acknowledge the preparatory work that was com-pleted in the pilot studies by Marije de Hen, MarloesVleeschouwer, Mirjam Capetti, and Ikram Mizab.
Disclosure statement
M.G., J.P., J.C., and B.S. are the authors of the CCD(Goudsmit et al., 2014), which was published by BohnStafleu van Loghum.
Funding
This study was supported by the InnovatiefondsZorgverzekeraars (Innovation Fund InsuranceCompanies) [grant number 1433]. The portion of thisstudy that took place in The Hague was partially sup-ported by the innovation fund of Stichting Transmuraal(Transition Foundation).
References
Ardila, A. (2005). Cultural values underlying psycho-metric cognitive testing. Neuropsychology Review, 15(4), 185–195. doi:10.1007/s11065-005-9180-y
Ardila, A., Bertolucci, P. H., Braga, L. W., Castro-Caldas, A., Judd, T., Kosmidis, M. H.,. . . Rosselli, M.(2010). Illiteracy: The neuropsychology of cognitionwithout reading. Archives of Clinical Neuropsychology,25(8), 689–712. doi:10.1093/arclin/acq079
Arroll, B., Khin, N., & Kerse, N. (2003). Screening fordepression in primary care with two verbally askedquestions: Cross sectional study. British MedicalJournal, 327(7424), 1144–1146. doi:10.1136/bmj.327.7424.1144
Brooks, R. (1996). EuroQol: The current state of play.Health Policy, 37(1), 53–72. doi:10.1016/0168-8510(96)00822-6
Eefsting, J. A., Boersma, F., Van Tilburg, W., & van denBrink, W. (1997). Bruikbaarheid van de “Mini-mentalstate examination” voor het vaststellen van dementie;onderzoek naar de criteriumvaliditeit in eenNederlandse plattelandspopulatie [Usefulness of the“Mini-Mental State Test” for the diagnosis of demen-tia; study of criterion validity in a Dutch rural popu-lation]. Nederlands Tijdschrift voor Geneeskunde, 141(43), 2066–2070.
Eurostat. (2015). Eurostat, the statistical office of theEuropean Union. Retrieved from http://ec.europa.eu/eurostat/statistics-explained/index.php?title=Migration_and_migrant_population_statistics&oldid=264684
Goudsmit, M., Parlevliet, J., van Campen, J., &Schmand, B. (2014). Cross-culturele dementiescreening[Cross-cultural dementia screening]. Houten: BohnStafleu van Loghem.
International Standard Classification of Education ofUNESCO (ISCED). (2012). UNESCO Institutefor Statistics. Montreal, QC: Author. Retrieved fromhttp://www.uis.unesco.org/Education/Documents/isced-2011-en.pdf
Kempler, D., Teng, E. L., Taussig, M., &Dick,M. B. (2010).The CommonObjectsMemory Test (COMT): A simpletest with cross-cultural applicability. Journal of theInternational Neuropsychological Society, 16(3), 537–545. doi:10.1017/S1355617710000160
Knopman, D. S., DeKosky, S. T., Cummings, J. L., Chui,H., Corey-Bloom, J., Relkin, N.,. . . Stevens, J. C.(2001). Practice parameter: Diagnosis of dementia(an evidence-based review). Report of the QualityStandards Subcommittee of the American Academyof Neurology. Neurology, 56(9), 1143–1153.doi:10.1212/WNL.56.9.1143
Krabbe, P. F., Stouthard, M. E., Essink-Bot, M. L., &Bonsel, G. J. (1999). The effect of adding a cognitivedimension to the EuroQol multiattribute health-sta-tus classification system. Journal of ClinicalEpidemiology, 52(4), 293–301. doi:10.1016/S0895-4356(98)00163-2
JOURNAL OF CLINICAL AND EXPERIMENTAL NEUROPSYCHOLOGY 171

Lezak, M. D., Howieson, D. B., Bigler, E. D., & Tranel,D. (2012). Neuropsychological assessment. New York,NY: Oxford University Press.
Manly, J. J., & Espino, D. V. (2004). Cultural influenceson dementia recognition and management. Clinics inGeriatric Medicine, 20(1), 93–119. doi:10.1016/j.cger.2003.10.004
Mukadam, N., Cooper, C., & Livingston, G. (2011). Asystematic review of ethnicity and pathways to care indementia. International Journal of GeriatricPsychiatry, 26(1), 12–20. doi:10.1002/gps.2484
Nielsen, T. R., Andersen, B. B., Gottrup, H., Lutzhoft, J.H., Hogh, P., & Waldemar, G. (2013). Validation ofthe Rowland Universal Dementia Assessment Scalefor multicultural screening in Danish memory clinics.Dementia and Geriatric Cognitive Disorders, 36(5–6),354–362. doi:10.1159/000354375
Nielsen, T. R., Vogel, A., Riepe, M. W., de Mendonca,A., Rodriguez, G., Nobili, F.,. . . Waldemar, G. (2011).Assessment of dementia in ethnic minority patientsin Europe: A European Alzheimer’s DiseaseConsortium survey. International Psychogeriatrics,23(1), 86–95. doi:10.1017/S1041610210000955
O’Bryant, S. E., & O’Jile, J. R. (2004). Attenuating demo-graphic influences on verbal fluency and animal nam-ing in a psychiatric sample. Applied Neuropsychology,11(4), 210–214. doi:10.1207/s15324826an1104_6
Parlevliet, J. L., Uysal-Bozkir, Ö., Goudsmit, M., vanCampen, J. P. C. M., Schmand, B., & de Rooij, S. E.
(2014). The SYMBOL Study: A population-based studyon health and cognition in immigrant older adults inthe Netherlands. Journal of Gerontology & GeriatricResearch, 3(4), 177. doi:10.4172/2167-7182.1000177
Reitan, R. M., & Wolfson, D. (1985). The Halstead–Reitan Neuropsychological Test Battery. Tucson, AZ:Neuropsychological Press.
Rideaux, T., Beaudreau, S. A., Fernandez, S., &O’Hara, R. (2012). Utility of the abbreviated FuldObject Memory Evaluation and MMSE for detec-tion of dementia and cognitive impairment notdementia in diverse ethnic groups. Journal ofAlzheimer’s Disease, 31(2), 371–386. doi:10.3233/JAD-2012-112180
Sheikh, J. I., & Yesavage, J. A. (1986). Geriatric DepressionScale (GDS): Recent evidence and development of ashorter version. In T. L. Brink (Ed.), Clinical gerontol-ogy: A guide to assessment and intervention (pp. 165–173). New York, NY: The Haworth Press.
Stroop, J. R. (1935). Studies of interference in serialverbal reactions. Journal of Experimental Psychology,18(6), 643–662. doi:10.1037/h0054651
Waldemar, G., Phung, K. T., Burns, A., Georges, J.,Hansen, F. R., Iliffe, S., . . . Sartorius, N. (2007). Accessto diagnostic evaluation and treatment for dementia inEurope. International Journal of Geriatric Psychiatry, 22(1), 47–54. doi:10.1002/gps.1652
Youden, W. J. (1950). Index for rating diagnostic tests.Cancer, 3(1), 32–35. doi:10.1002/1097-0142
172 M. GOUDSMIT ET AL.