University of Ghana THE ECONOMIC ...
96
THE ECONOMIC POTENTIAL OF BLACK PEPPER PRODUCTION IN THE WESTERN REGION OF GHANA BY DAVID DARKOH THIS THESIS IS SUBMITTED TO THE UNIVERSITY OF GHANA, LEGON, IN PARTIAL FULFILMENT OF THE REQUIREMENTS FOR THE AWARD OF M. PHIL DEGREE IN AGRICULTURAL ADMINISTRATION DEPARTMENT OF AGRICULTURAL ECONOMICS & AGRIBUSINESS UNIVERSITY OF GHANA LEGON JULY 2002. University of Ghana http://ugspace.ug.edu.gh
Transcript of University of Ghana THE ECONOMIC ...

THE ECONOMIC POTENTIAL OF BLACK PEPPER PRODUCTION IN THE
WESTERN REGION OF GHANA
BY
DAVID DARKOH
THIS THESIS IS SUBMITTED TO THE UNIVERSITY OF GHANA, LEGON, IN
PARTIAL FULFILMENT OF THE REQUIREMENTS FOR THE AWARD OF
M. PHIL DEGREE IN AGRICULTURAL ADMINISTRATION
DEPARTMENT OF AGRICULTURAL ECONOMICS & AGRIBUSINESS
UNIVERSITY OF GHANA
LEGON
JULY 2002.
University of Ghana http://ugspace.ug.edu.gh

37048 iiif
U ^ c c ' (
University of Ghana http://ugspace.ug.edu.gh

DECLARATION
I David Darkoh, author of this report, do hereby declare that the work presented in this
thesis
“ The economic potential of black pepper production in the Western Region of Ghana”
was done entirely by me under the guidance of my supervisors in the Department of
Agricultural Economics & Agribusiness, University of Ghana, Legon.
This work has never been presented in whole or in part for any degree of this University
or elsewhere.
David Darkoh
This work has been submitted for examination with our approval as supervisors.
zSt.
Rev. Dr. S. Asuming-Brempong Mr. Ditchfield P. K. Amegashie
(Principal supervisor) (Co-supervisor)
(i)
University of Ghana http://ugspace.ug.edu.gh

ACKNOWLEDGEMENT
Thanks be to Jehovah God for seeing me through this work to the end. My greatest
gratitude goes to Rev. Dr. S. Asuming-Brempong and Mr. D.P.K. Amegashie, my
supervisors for their constructive criticisms, guidance, and kind supervision of this work.
My indebtedness is also to CARE INTERNATIONAL for their assistance.
Mention must also be made of Dr. Kweku Andah and the entire teaching staff whose
invaluable suggestions and constructive criticisms during seminar presentations helped to
improve the quality of this work.
(ii)
University of Ghana http://ugspace.ug.edu.gh

DEDICATION
I dedicate this work to the Darkoh family whose efforts in diverse ways have brought me
this far.
(iii)
University of Ghana http://ugspace.ug.edu.gh
ABSTRACT
The study looked at the economic potential of black pepper production in the Western
Region of Ghana. The objectives of the study were: to determine whether there is
comparative advantage or disadvantage of producing black pepper; to determine the
competitiveness of black pepper production; to determine whether the prices paid by
local and international markets give any incentives for black pepper production; and to
identify constraints that militate against the production of black pepper, all in the Western
Region of Ghana. The findings of the study are: there is comparative advantage of black
pepper production in the Western Region of Ghana as shown by the Social Profits (SP) of
2,556,000 and the Domestic Resource Cost (DRC) of 0.34. To further improve on the
comparative advantage, there is the need to take a critical look at the land tenure system
in the country and to introduce micro finance activities to help farmers, as the black
pepper crop is a perennial one.
The production of black pepper in the Western Region of Ghana is competitive as shown
by the Private Profits (PP) of 1,887,250 and Private Cost Ratio (PCR) of 0.39. However,
there is the need for a critical look at the post harvest handling of the crop.
The price paid to the black pepper farmers are a little below the international prices as
shown by the Nominal Protection Coefficient (NPC) of 0.81 and Effective Protection
Coefficient (EPC) of 0.26. It should be however noted that the prices received by the
farmers are realistic as the fruits are ungraded and of lower quality than the fruits sold on
the international markets.
(iv)
University of Ghana http://ugspace.ug.edu.gh

TABLE OF CONTENTS
DECLARATION i
ACKNOWLEDGEMENT ii
DEDICATION iii
ABSTRACT iv
TABLE OF CONTENTS v
LIST OF TABLES ix
LIST OF ACRONYMS x
Chapter 1: INTRODUCTION 1
1.1 Background 1
1.2 Problem statement 6
1.3 Objectives of the study 8
1.4 Relevance of the study 8
1.5 Organization of the study 10
Chapter 2: LITERATURE REVIEW 11
2.1 The Potential for Black Pepper Production in Ghana 11
(v)
University of Ghana http://ugspace.ug.edu.gh

2.2 Policy Analysis Matrix (PAM): An Analytical Framework for
Assessment of Comparative Advantage
2.3 Policy Analysis Matrix (PAM): An Analytical Framework for
Assessment of Competitiveness
2.4 The strengths of Policy Analysis Matrix (PAM)
2.5 Choice of Policy Analysis Matrix as an Analytical Tool
for the Study
2.6 World Trade in Black Pepper
2.7 Constraints in the Production of Black Pepper ■;, cK
Chapter 3: METHODOLOGY
3.1 Theoretical concept
3.2 Assessment of Comparative Advantage or Disadvantage of
Black Pepper Production in the Western Region of Ghana
3.3 Assessment of Competitiveness of Black Pepper production
in the Western Region of Ghana
3.4 Prices of black pepper paid to farmers in the Western Region of Ghana
3.5 Social Valuation of Tradables and Non-Tradables
3.6 Construction of PAMS for Black Pepper
3.7 Classification of Inputs and Outputs
University of Ghana http://ugspace.ug.edu.gh

3.8 Procedure for estimating PAM for Black Pepper Production 40
3.9 Procedure for budget preparation for black pepper production 41
3.10 Sensitivity analysis 43
3.11 Data collection for the study 44
Chapter 4: ANALYSIS AND DISCUSSION OF RESULTS 45
4.1 Introduction 45
4.2 Assessment of Comparative Advantage or Disadvantage of Black Pepper
Production in the Western Region of Ghana 45
4.3 Assessment of Competitiveness of Black Pepper Production in the
Western Region of Ghana 50
4.4 Black Pepper Producer Prices in the Western Region of Ghana 54
4.5 Constraints in the production of black pepper 56
(vii)
University of Ghana http://ugspace.ug.edu.gh

Chapter 5: CONCLUSION AND RECOMMENDATIONS 60
APPENDICES 68
Appendix 1 World imports, by type of spice (1995) 68
Appendix 2 World exports of spices, by country and value (1995) 69
Appendix 3 Foreign exchange earnings by Agriculture and Non-AgricultureSectors, 1990 to 2002 in Ghana 70
Appendix 4 Activity budget of the production of one acre black pepper 71
Appendix 5 Costs of domestic factors of the production of one acre ofblack pepper 72
Appendix 6 Costs of tradable inputs of the production of one acre ofblack pepper 73
References 74
Questionnaire of black pepper 80
(viii)
University of Ghana http://ugspace.ug.edu.gh

LIST OF TABLES
Table 1: Average world imports of black pepper 2
Table 2: The Policy Analysis Matrix 29
Table 3: Activity budget of black pepper 36
Table 4: The Policy Analysis Matrix for one acre of black pepper production
in the Western Region of Ghana 47
Table 5: Non-ratio economic indicators 48
Table 6: Average non-ratio economic indicators 51
(ix)
University of Ghana http://ugspace.ug.edu.gh

Acronyms
ADB Agricultural Development BankDRC Domestic Resource CostEPC Effective Protection CoefficientERP Economic Recovery ProgrammeFAO Food and Agriculture OrganizationFASDEP Food and Agriculture Sector Development ProgrammeFT Factor TransfersGDP Gross Domestic ProductGEPC Ghana Export Promotion CouncilGSS Ghana Statistical ServiceHACCP Hazard Analysis of Critical Control PointsIT Input TransfersIPC International Pepper CommunityISSER Institute of Statistical, Social and Economic ResearchITC International Trade CentreHTAP Joint Integrated Technical Assistance ProgrammeMOFA Ministry of Food and AgricultureMTADP Medium Term Agricultural Development ProgrammeNGO Non Governmental OrganizationNPC Nominal Protection CoefficientNPCI Nominal Protection Coefficient on InputsNPCO Nominal Protection Coefficient on OutputsNT Net TransfersOT Output TransfersPAM Policy Analysis MatrixPC Profitability CoefficientPCR Private Cost RatioPP Private ProfitsPGRC Plant Genetic and Resource CentreQDS Quarterly Digest of StatisticsRC Reccerca e CooperazioneSAP Structural Adjustment ProgrammeSP Social ProfitsSRP Subsidy Ratio to ProducersTIRP Trade and Investment Reform ProgrammeUNDP United Nations Development ProgrammeUK United KingdomUSA United States of America
(x)
University of Ghana http://ugspace.ug.edu.gh

CHAPTER 1
INTRODUCTION
1.1 Background
Spices have been defined in many ways, out of which two are widely used. First is the
International Organization for Standardization's definition that spices and condiments are
“vegetable products or mixtures thereof free from extraneous matters, used for flavouring,
seasoning and imparting aroma in foods”. The International Spices Group on the other hand, has
adopted the following definition: “Spices are any of the flavoured or aromatic substances of
vegetable origin obtained from tropical or other plants, commonly used as condiments or
employed for other purposes on account of their fragrance, preservative or medicinal qualities.”
They include pepper, pimento, vanilla, cinnamon and cassia, cloves, turmeric, spice seeds (aniseed,
caraway, coriander, cumin, dill, fennel, fenugreek and juniper etc), saffron, laurel leaves, spice
herbs (sage, thyme, oregano etc) and mixtures of the foregoing products (such as spice mixtures,
curry powder, etc). The term applies equally to the product in the whole form or in the ground
form.1
The difference in the definition of spices is very important, especially when analysing international
trade figures on spices. For instance, while many markets, such as those in the United States of
America, Europe and Japan, regard mustard seeds and sesame seeds as spices, many developing
countries treat them as oil seeds. In addition, international statistics do not often reflect imports of
spice oils and oleoresins.
1 Nandakumar T. (1996) the Global Spice Trade and the Uruguay round agreements p.9 Geneva1
University of Ghana http://ugspace.ug.edu.gh

Black pepper is one of the oldest and most important of all spices. Pepper by virtue of its versatile
in the modem world has earned the reputation as King of Spices.2 Pepper rules the spice trade both
in terms of volume and value. International Trade Centre-UNCTAD has estimated that pepper
contributes 34% of the total spice trade by volume followed by chillies at 22%, seed spices 17%,
tree spices 14%, turmeric 5%, ginger 4%, cardamom 3% and vanilla 1%. In terms of value and
volume, the global spice trade is estimated at US$ 1.5 to 2 billion and 400 to 450 thousands metric
tonnes in quantity.3
The World trade in spices has been buoyant in recent years. For example, the average world
imports for spices increased from 220,000 tonnes in 1970-75 to 500,000 tonnes in 1993-95, which
is 227% increase in 25 years (Appendix Table 1).
Table 1: Average world imports of black pepper
Period Quantity (tonnes) Value ($ millions)
1970-1975 220,000 300.0
1978-1980 311,500 737.5
1981-1985 350,000 1,000.0
1991-1993 450,000 1,600.0
1993-1995 500,000 1,750.0
Source: International Trade Centre, International Pepper Community and the Commonwealth
Secretariat (1996).
The International Trade Centre (ITC) has estimated the volume of world imports of spices at
450,000 tonnes as at 1996. The growth rate in volume terms in the spice industry is thought to
2 Purseglove, J.W., Brown E.G., Green C.L., Robbins S.R., (1987) Spices - Tropical Agricultural Services, Longman Scientific and Technical Group Limited, Volume 1.
3 International Pepper Community News Bulletin, April 2002, Indonesia, Jarkarta , http://www.ipcnet.org/industrymain.htm
2
University of Ghana http://ugspace.ug.edu.gh

between 3% and 4% a year. B lack pepper accounts for a market share of about 35 percent terms
and 155,000 tonnes in terms of volume of world imports of spices.4
The demand for spices in general is increasing, for example between 1995 and 1999 almost all the
countries in the European Union increased their imports of spices. Between 1995 and 1997, for
example, the value of imports in spices increased by 18 percent in volume and 44 percent in
value.5 The World’s major exporting countries of black pepper are Indonesia, India, Brazil,
Malaysia and Vietnam. Together these five countries exported about 90% of the world’s trade in
black pepper. Black pepper is mainly exported to Europe, North America, South Korea, Taiwan
and China (Appendix Tables 1 and 2).
In Ghana there has been dwindling amounts of foreign exchange earned by the Country’s few
traditional export commodities like cocoa. For example the export of cocoa alone accounted for
about 60 percent of the foreign exchange earned in the 1980s. This percentage reduced to about 45
percent in 19906 and there has been further reduction as cocoa accounted for 20.5% of foreign
exchange earned in 2001.7 The decline in the foreign exchange earned by cocoa has been attributed
to two major factors, a decline in the world market price for cocoa and a low level of cocoa
production. The world market price of cocoa was $2367 per tone in 1983 / 84 season and declined
in a fluctuating fashion to about $1,295 in 1998 / 90 season. This means a decline of about 45
percent in sixteen years. The production of cocoa also declined by 40 percent. The dwindling
amount of foreign exchange earned by the countries few traditional export commodities has
brought into sharp focus the need to expand the export base (Appendix Table 4).
4 Nandakumar T. (1996) the Global Spice Trade and the Uruguay round agreements p.6 Geneva5 JTTAP Report No. ITC / DTCC/ JTTAP / GHA /11 / 05
6 The state of the Ghanaian Economy in 1991 published by the Institute of Statistical, Social and Economic Research (ISSER) in 1992 p77.
7 The state of the Ghanaian Economy in 2001 published by the Institute of Statistical, Social and Economic Research (ISSER) in 2002 p77.
3
University of Ghana http://ugspace.ug.edu.gh

The agricultural sector is promoting several other crops that have export potential like black
pepper. There are also some institutions and organizations that have helped to create the awareness
and the potential of black pepper as an export crop. The Ghana Export Promotion Council (GEPC)
explored the existence of crops with distinct comparative advantage for development and linking
them with exporters. Black pepper was one of such crops selected by the GEPC for development.
In 1989, 61 agricultural commodities were identified by GEPC to be exportable. The number of
exportable commodities was reduced to 50 in 1990. Black pepper was one of the exportable
commodity identified by GEPC. In view of the prospects of black pepper, the GEPC and Plant
Genetic Resource Centre (PGRC) and Ministry of Food and Agriculture (MOFA) began a pilot
production of black pepper at Sefwi-Wiawso in the Western Region in 1991.
Also Reccerca e cooperazione (RC), an Italian NGO, in the 1990s undertook a black pepper
support programme in five villages in the Western Region (Suhensu, Adoti, Appiahkrom,
Kwekuboakrom and Ewiase). RC supplied seedlings and provided technical assistance and
advisory services to black pepper fanners in these selected villages.
Other institutions that contributed to black pepper development are CEDECOM in the Central
Region and the PGRC in Bunso in the Eastern Region, who are mandated to research into black
pepper. The University of Ghana Research Station at Kade is also conducting research into black
pepper production. It is clear that some level of effort has been invested in the development of
black pepper as a potential export crop.
As a result of the promotion of black pepper and non-traditional crops in general export earnings
by the non-traditional crops has increased. For example over the period from 1991 - 1998 the
export of non-traditional crops increased from US $998 million to US $1,830 million with an
average annual growth of about 9 percent per annum8
8 Joint Integrated Technical Assistance Programme (JITAP)Report No. ITC / DTCC / JITAP / GHA / 11 /04/ March 2000, p. 196.
4
University of Ghana http://ugspace.ug.edu.gh

Developments efforts in Ghana have so far created the awareness and potential as an export crop,
which is forecast to enjoy a supply deficit on the world market in the next few years. Efforts made
by various institutions include:
■ Capacity building in seedling production;
■ Improving research capacity by Plant Genetic Resource Centre at Bunso in the Eastern
region; and
■ Introduction of farmers to the propagation and cultivation of the crop.
These developments together with other factors indicate that Ghana can exploit the potential of
black pepper. These positive factors include:
• Availability of arable land (especially in the Western region) that is ecologically suitable
for the cultivation of the crop;
• Availability of labour for the cultivation of black pepper production;
• The possibility to intercrop with food crops especially plantain for the first few years until
black pepper begins to yield;
• Institutional support and technical assistance through the Trade and Investment Reform
Programme;
• The involvement of micro-entrepreneurs or small holder fanners in the Programme; and
• The possibility to replace devastated cocoa farms in Western region with black pepper.
In spite of the development efforts and positive factors enumerated above, the crop has not yet
been fully exploited to tap its potential. For example, the Export Production Village established by
the GEPC in the Western region. The project was designed to involve 250 farmers in 10 villages in
two districts to cultivate an aggregate of 125 acres of black pepper. This was to be intercropped
with chillies to provide some income to be used to offset loans given to fanners for the
establishment of black pepper farms. The farmers were supported financially with a total of 16.8
5
University of Ghana http://ugspace.ug.edu.gh

million disbursed through the Agricultural Development Bank. Providing seedling through PGRC
supported the fanners.
In order to tap the full potential of the black pepper crop, there should be a lot of research work
into black pepper production and quality improvement of the berries to meet international
standards. There should also be competitive prices paid to producers both internally and externally
to encourage farmers to go into black pepper production. There should also be good packaging and
transportation systems so as to meet the international standards for the marketing of black pepper.
All these and others that will come out clearly at the end of the study will help to tap the potential
in black pepper production. Although there are well over hundred spices whose vegetative parts
are used as spices in Ghana, it appears that the spice that has great potential for flavouring food, is
black pepper.
1.2 Problem Statement
Ghana has had to depend on a few traditional export commodities such as cocoa, timber and
minerals even when all indicators are pointing to the fact that the over-dependence on few
exportable crops is detrimental. Since April 1983 Ghana has undertaken a series of comprehensive
macroeconomic and structural adjustment reforms aimed at reversing the economic decline, which
had characterized the economy in the 1970s.
Under what was termed Economic Recovery Program (ERP) and Structural Adjustment Program
(SAP), specific measures that will restore incentive for the production of food, industrial raw
materials and export commodities and thereby increase output were also put in place. A diversified
export industry was planned and the role that non-traditional agricultural export (NTAE)
commodities shall play in the whole export diversification strategy was duly recognized.
6
University of Ghana http://ugspace.ug.edu.gh

One of the non-traditional crops identified is black pepper. The Market News Service of the World
Trade Organization stated that industry experts’ had forecast of good prospects for black pepper
and that by the year 2006 demand will outstrip supply. Expectations are that by 2010 black pepper
2.15 million tonnes.9
A marketing survey by the International Trade Centre (ITC) showed that there exist some
possibilities for exporters of black pepper from developing countries such as Ghana to increase
their sales to Europe and the Americas. For example in 1993 developing countries exported 74%
of the world's export in spices, and the developing and least developed countries were among the
leading 28 exporters.10
In Ghana and most African countries, commercial cultivation and black pepper export is of little
significance, though it has a long history in its medicinal uses. The dangers inherent in the
dominance of the economy by few exportable primary commodities notably cocoa, timber and
mineral coupled with declining world prices have been realized. It is against this background that
the Ghana government as part of its economic recovery programme instituted a policy to diversify
agricultural production to broaden the export base, for more foreign exchange earnings. Black
pepper is one of the selected crops for export development for poverty alleviation and sustained
stable economy. The crop can be cultivated in the Western, Ashanti, Eastern, Brong-Ahafo,
Central and Volta regions where agro-climatic conditions are favourable for the cultivation of the
crop. There appears to be a potential for entry into the black industry, however, for successful
entry there are questions that needs to be addressed.
exports by the major producers may reach 2.05 million tones with consumption reaches its peak at
9 The Public Ledger, Global Commodities Daily, April, 14, 1995.10 UNCTAD Commodity Yearbook 1995 (United Nations publications, Sales No. E/F.95.//.D.25).
7
University of Ghana http://ugspace.ug.edu.gh

The questions that need to be addressed are the following:
Does Western Region of Ghana have a comparative advantage or disadvantage of black pepper
production?
Is the production of black pepper in Western Region of Ghana competitive domestically?
Do the prices paid locally provide incentives to domestically produced black pepper in the Western
Region of Ghana?
What are the constraints militating against the production of black pepper in the Western region of
Ghana?
1.3 Objectives of the study
The general objective of this study is to examine the economic potential and constraints of
black pepper production in the Western Region of Ghana.
The specific objectives of the study are:
1. To determine whether there is comparative advantage or disadvantage of producing
black pepper in the Western Region of Ghana;
2. To determine the competitiveness of black pepper production in the Western Region of
Ghana;
3. To determine whether the prices paid to local black pepper farmers give an incentive to
domestically produce black pepper production in the Western Region of Ghana; and
4. To identify the constraints that militate against the production of black pepper in the
Western Region of Ghana.
1.4 Relevance of the study
Until 1992, agriculture accounted for the highest proportion of the total foreign exchange earned
by Ghana. In 1992, however, agriculture’s contribution to the Gross Domestic Product (GDP) of
8
University of Ghana http://ugspace.ug.edu.gh

Ghana was 35 percent whereas gold contributed 40 percent of GDP.11 There is therefore the urgent
need to increase the export base to include non-traditional crops like black pepper to increase the
foreign exchange earnings of Ghana.
There are other positive aspects of promoting black pepper production as it is going to generate
employment to the economically active population mainly as farmers and farm labourers, and to
reduce rural-urban migration. The promotion of black pepper is going to increase rural
development and as well as increase in income levels of the rural people and hence reducing
poverty levels to some extent. It will also be a source of foreign exchange earner to the country.
Preventive health care and alternative systems of medicine are gaining recognition. Spices like
black pepper are likely to become an integral part of food in well-planned preventive health care
systems. Consumers of black pepper are showing willingness to pay premium prices for higher
quality produce in terms of both flavour and food safety. There is the need therefore for countries
like Ghana with the potential to produce black pepper to be re-oriented to cater for the production
of the non-traditional crops like black pepper.
In developed countries, the usage of pepper in the food industry has increased substantially
because of taste, flavour and seasoning characteristics. More than 60% of pepper is consumed in
industrial food and food service sectors due to shift in the eating habits all over the world and the
balance quantity is consumed in household, medicine, perfume, health and beauty segments.
Ethnic foods particularly Indian, Chinese and Thai are having a growing impact in many countries
and expanding to cover a wide range of tastes in food. In developing countries 90% of the pepper
is consumed in the household segment.
In Ghana the Trade and Investment Reform Programme (TIRP) is being implemented to expand
the commodity base of non-traditional export crops and black pepper is one of the non-traditional
11 Nyanteng V. K., Dapaah S. K. (1996) Agricultural Development policies and Options p. 69.
University of Ghana http://ugspace.ug.edu.gh

crops identified with a very tremendous potential as an export crop. Findings from this study will
help to indicate whether there is comparative advantage and competitiveness of black production
to enable the full potential of the crop to be tapped, create employment for the farmers, help the
farmers to get income and the nation as a whole to earn foreign exchange if the crop is exported.
1.5 Organization of the study
This study consists of five chapters. The premier chapter is the introduction of the study followed
by the literature review in Chapter two. Chapter three contains the methodology whilst Chapter
four presents the analysis and discussion. The last Chapter (Chapter five) presents the conclusions
and recommendations of the study.
10
University of Ghana http://ugspace.ug.edu.gh

CHAPTER 2
LITERATURE REVIEW
2.1 The Potential for Black Pepper Production in Ghana
Black pepper was first identified in the Western Ghats of India and Guinea Coast of West Africa.
The plant is a perennial woody climber that grows to 10 metres in height. The plant matures three
years after cultivation and has an economic production life span 12-15 years.12
Production of black pepper depends very much on agro climatic factors, pest and disease
occurrence, as well as price mechanisms. High price coupled with good cultural practices,
favourable weather situation and less incidence of pests and diseases often lead to higher
production levels. Reversing the situation of the above factors will normally lead to lower
production levels.
Black pepper does well in forest areas with moderate to heavy rainfall (1800-3000 mm of rain per
year). It requires a hot, wet tropical climate and is grown at low altitudes. It cannot stand water
logging and usually planted on mounds. The ideal soil is a well-drained soil, rich in humus and a
pH above 5.5.13 Black pepper and cocoa have similar cultivation practices in terms of layout,
lining and pegging of establishment. It means that the spice can be grown alongside cocoa and as
plantation crop.14 The crop grows well in cocoa growing areas in Ghana.
12 Lane D.A., (1962) The forest vegetation.13 Akromah R., (1991) Resource paper presented at the black pepper workshop by GEPC at Sefwi.14 Blacklock J.G. (1954) A study of black pepper culture. Pp 31, 40-56, 1954.
11
University of Ghana http://ugspace.ug.edu.gh

2.2 Policy Analysis Matrix (PAM): An Analytical Framework for Assessment of
Comparative Advantage
The methodological breakthrough underpinning the eventual development of PAM was the
invention of the DRC approach for measuring social profitability. And Anne Krueger in the United
States of America developed the DRC. Earlier publications demonstrating the use of DRC
approach are Bruno’s paper on the optimal selection of export-promoting and import-substituting
projects (Bruno, 1965) and Krueger’s paper on some economic costs of exchange control
(Krueger, 1966).
Bruno (1965) recommended and applied DRC to measure comparative advantage of economic
activities of producing tradable goods and services within a single country. He did some
modifications of the concept and used it in the optimal selection of export promoting and import
substituting projects.
Pearson and Merger (1974) used the DRC in a study on four African countries and found out that
Uganda, Tanzania, Ivory Coast, Ethiopia had DRCs of 0.33,0.42,0.75and 0.4respectively.They
concluded that the relative degrees of comparative advantage among countries producing an
identical export commodity can be measured by ranking the ratios of DRC per foreign exchange
rate for each country. The country with the smallest ratio has the strongest relative comparative
advantage in coffee. They inferred that Ivory Coast has a weaker competitive position in coffee
largely due to higher opportunity cost of domestic factors of production.
Akrasanee (1974) used DRC technique and established that Thailand has a large comparative
advantage in rice production, and that if the government objective was to earn foreign exchange
through exports, it was very advantageous and economical for Thailand government to continue to
expand production and boost up export of rice. Pearson et al (1981) in the study of policy and
economics of rice production in Ivory Coast, Sierra Leone, Liberia, Senegal and Mali used12
University of Ghana http://ugspace.ug.edu.gh

Resource Cost Ratio (RCR) technique, which is analogous to DRC to determine the comparative
advantage of these five countries. Abad (1982) used DRC approach and concluded that the
Philippines had a comparative advantage in the production of both , flue-cured tobacco and native
tobacco. Also in the Philippines, Baliscan (1982) conducted a study of the cotton industry using
the DRC technique as a measure of comparative advantage. He estimated that the country had a
comparative advantage in cotton production, especially the production of seed cotton.
Osafo (1983) also used the Net Social Profitability (NSP) analysis as an indicator of comparative
advantage and found that all rice production technique in Ghana were privately profitable but
socially unprofitable. In fact, he concluded that Ghana had the lowest rates of NSP in West Africa
and that domestic rice production will replace imported rice at a very high cost to the Ghanaian
economy. Saini (1982) used the NSP to find the choice of inputs-based strategy for agricultural
development in Pakistan. He came out with guidelines for an appropriate input-based strategy for
agricultural development.
Unnevehr et al (1984) conducted a study of changing comparative advantage in Philippine rice
production for the period 1966 to 1982 using the DRC coefficient as an indicator of comparative
advantage. They concluded that technological change in rice production has increased Philippine
rice production.
Assuming-Brempong (1987) used DRC as a measure of comparative advantage of rice production
in Ghana. In that study, he worked on different methods of rice production and found out that all
had comparative disadvantage and concluded that the traditional system performed relatively better
economically. Asuming-Brempong (1988) used DRC to study the economics of cassava
production under the Structural Adjustment Program (SAP) in Ghana. In his analysis, he compared
cassava production in Ghana before and after SAP using DRC, NPC and EPC as economic
indicators to measure comparative advantage. His results gave DRC coefficients of 0.11 and 0.16
at the rural market level and -0.37 and 0.39 at the wholesale level for 1980 and 1988 respectively.13
University of Ghana http://ugspace.ug.edu.gh

He realised that SAP had little effect or no effect on cassava production at rural market level. For
the DRC coefficient he had for the wholesale level, he stated that under SAP, Ghana produced
cassava efficiently and had a comparative, advantage at the international level. For the negative
DRC for 1980, he explained that production resulted in absolute loss of foreign exchange as a
result of the over-valuation of the cedi during the early part of the 1980s that made imported items
cheaper. He then concluded that cassava production in Ghana became more profitable to farmers
during SAP than it was previously.
El-Habbab and Jabarin (1992) used PAM to look at impact of wheat policy on traditional and
modem rainfed wheat production in Jordan. PAM was used to calculate the different protection
coefficients. The NPC on output for wheat produced by both traditional and modem technologies
was 1.01 and 1.06 respectively. The EPC for both technologies was close to 1,whereas the DRC
was 0.23 for traditional technology and 0.11 for the modem technology.
Jabarin and El-Habbab (1997) used PAM in the study of impact of trade liberalization on the
comparative advantage and bilateral trade of cereals between Jordan and Syria. It was determined
that freeing trade between Jordan and Syria will positively affect the comparative advantage of
producing wheat and barley under rainfed conditions in both countries. It was also determined that
there is a good opportunity to develop bilateral trade of cereals between Jordan and Syria
Odermatt and Santiago (1997) used PAM in the study of comparative profitability of dairy
production in Mexico. The economics of milk production in three regions of Mexico was studied,
including an intensive dairy farm in the Comarca Lagunra, a farming enterprise in Atlos de Jalisco
and a tropical dairy farm, producing both milk and meat.
Ayele and Heidhues (1998) used PAM in the study of the economic returns of vertisols
innovations: an empirical analysis of smallholder mixed farming in Ethiopia. This study showed
that both on-farm and household level analysis indicated that the vertisol technology is cost-14
University of Ghana http://ugspace.ug.edu.gh

effective and economically sound. The DRC results confirmed that much more comparative
advantage can be gained from the package of improved vertisol technology than traditional
practices of the farmer. The closest forerunner to the complete PAM approach is the method used
by Ingram and Pearson (1981) to look at the impact of investment concessions on the profitability
of some selected firms in Ghana.
2.3 Policy Analysis Matrix (PAM): An Analytical Framework for Assessment of
Competitiveness
PAM has been used in a number of studies to determine the competitiveness of agricultural
systems, for example, Adesina and Coulibaly (1998) conducted a study on policy and
competitiveness of agroforestry-based technologies for maize production in Cameroon: an
application of PAM. PAM was applied to analyse social profitability of agrobased technologies for
maize production under different technologies. The study examined policy shifts such as the
removal of subsidies on farm inputs (e.g. fertilizers) and the devaluation of the currency that has
affected the structure of input and crop commodity prices. Maize production under agrofostery-
based cropping systems was found to have high comparative advantage.
Braunschweig and Gotsch (1998) used PAM in the study of cocoa biotechnology research and
issues in competitiveness. One of the conclusions is that innovations in biotechnology may have a
bias against smallholder cocoa plantation systems. Adjovi (1996) used PAM in a study to look at
the potential, constraints and perspective of rice production in southern Benin. He found out that
rice production in southern Benin is competitive and has potential for development.
15
University of Ghana http://ugspace.ug.edu.gh

2.4 The strengths of Policy Analysis Matrix (PAM)
The strengths of PAM are as follows:
• Provides a consistent accounting framework for organizing information at the
microeconomic level;
• Builds on farming systems data;
• Measures competitiveness and comparative advantage;
• Treats government policies explicitly;
• Links macroeconomic policies to microeconomic phenomena; and
• Easy to explain results to policy makers.15
The major weakness of PAM is that it is static, hence partial budgeting and sensitivity analysis is
done to reduce this effect.
Methodologies that are used to analyse competitiveness, comparative advantage and international
trade have strands diverse in nature. It has been very difficult to categorize the methodologies, but
these are some broad based methodologies used in international trade studies. For example, cross
country regressions test for correlations among trade, growth, income, poverty, and inequality
variables observed at the national level. A typical example of this is a research done by (Dollar and
Kraay, 2001)16, in which they used time-series Gini coefficients and income growth rates foe
average households versus the poorest quintile, they found out that no general trend in inequality
among countries classified as globalizers. The cross-country regression approach nevertheless has
a number of advantages such as understanding the links between trade and poverty. It enables the
use of traditional statistical tools for testing results, hypotheses, and inequality measures as the
Gini Coefficient, as opposed to only making predictions. Additionally, cross-country regression
results are typically much more general than the country-specific results of many applied
15 Seminar on Agricultural Policy Analysis at Akosombo, Ghana on September 18-29, 1995 on the subject “ The Policy Analysis Matrix (PAM): An Introduction” by Daniel Sellen.
16
University of Ghana http://ugspace.ug.edu.gh

simulation models and also able to account for some of the dynamic aspects of trade reform that
are missed by static simulation models. The limitation of this model is the difficulty of
distinguishing between correlation and causation in cross-country regression analysis.
In relation to partial equilibrium or cost of living analysis, they are used by researchers who are
interested in how trade will affect only a limited number of an economy’s markets and needs to
incorporate a great amount of sectoral detail. They have the advantage of being easier to
understand. In general, however, all of the studies in this category are “partial” in nature, since
they focus on one or a limited number of markets in an economy. The partial equilibrium are
typically based on household expenditure data, and generally emphasize commodity markets and
their role in determining poverty impacts, or at least as a measure of poverty across time.
Additionally, most can be considered “cost-of-living” studies since they tend to focus on
household expenditure as a measure of poverty. A typical example of this category is the work
done by Levinsohn, Berry, and Friedman (1999)17, who examined how the Indonesian economic
crisis affected poor households in that country. The drawback of this methodology is that it focuses
only on the consumption side of the crisis-precluded calculation of its real effects. However,
studies focusing on international trade generally find factor market effects to be at least as
important as commodity market effects.
With regard to micro-macro synthesis, it is best characterized by its sequential, two-step nature. In
general, a general equilibrium model is first shocked to get commodity and factor price changes
along with detailed household survey information. A typical example of this category is the work
by Robilliard, Bourguignon, and Robinson (2001), to simulate Indonesian financial crisis. They
used the general equilibrium model to get aggregate price changes, and then solve an estimated
micro simulation model of household income such that it generates aggregate changes consistent
16 Dollar D., A. Kraay (2001) Trade, Growth, and Poverty. World Bank Policy Research Working Paper 2615.17 Levinsohn J., S. Berry, J. Friedman (1999) Impacts of the Indonesian Economic Crisis: Price Changes and the Poor.
Paper prepared for the Conference on Poverty and the International Economy, organized by World Bank and Swedish Parliamentary Commission on Global Development, Stockholm, October 20-21, 2000.
17
University of Ghana http://ugspace.ug.edu.gh

with general equilibrium models. The limitation is that the reactions of the post-simulation analysis
are not transmitted back to the general equilibrium model.
In relation to gravity models, they were introduced to economic theory in the 1960s. In the
standard gravity approach, bilateral trade between countries, either at the aggregate level or at the
industry level, is regressed on the GNP levels of the countries, their populations, and geographical
distance between them. As a result of its empirical robustness it has been used for investigations of
geographical patterns of trade. A typical example is Blavy (2001), who looked at trade in the
Mashreq. The limitation is that the standard estimation method tends to underestimate trade
between high-volume traders, and overestimate it between low-volume traders as a result of
heterogeneity bias.
Another methodology is the general equilibrium models, which are used to assess the impact of
economic shocks that reverberate across sectors and, in some cases, regions of a country or even
the world. They are capable of producing disaggregated results at the microeconomic level, while
providing a consistency check on macroeconomic accounts. General equilibrium analysis in
developing countries has its origins in the work by Adelman and Robinson for Korea (1978), along
with Lysy and Taylor for Brazil (1980). A general equilibrium model is generally calibrated to a
Social Accounting Matrix, which is a complete, consistent, and disaggregated data system. The
limitation is that most of them are comparatively static in nature.
There are some researchers who use Linear Programming Approach, which is a mathematical
method of determining the optimal combination of inputs to maximize their income (minimize
their cost) when there are many combinations of input variables that are available subject to
constraints. In agricultural projects, most of the time they are used to optimise cropping patterns
that will maximize income.
University of Ghana http://ugspace.ug.edu.gh

In spite of the methodological diversity, there appears to be increasing recognition that any
analysis of competitiveness, comparative advantage and international trade needs to come to grips
with the issue of factor market effects, and researchers such as Jones (1995) has indicated that the
inclusion of factor market in trade analysis is as a result of the magnifying effect in theoretical
trade models. This was one of the key conclusions of the October 2000 Conference on Poverty and
International Economy, organized by the Swedish Parliamentary Commission on Global
Development and the World Bank. A methodology that takes into accounts the trade policy, policy
transfers, comparative advantage, competitiveness, and factor market effects of systems are the
Policy Analysis Matrix (PAM).
In summary, the PAM is a simple conceptual framework for organizing information at the micro-
economic level to show the effects of policy on financial profitability and comparative advantage
of agricultural systems. It treats government policies explicitly, and can be used to link
macroeconomic policies with microeconomic phenomena. PAM links all the stages in the
production chain (from input procurement to consumer marketing), and it obliges the analyst to
consider all direct and indirect effects on the production system being analysed. From the point of
view of policy making, PAM is useful as it helps in quantifying the priorities, the sectors to focus
on, and the degree of importance of various sizes within the same sector.
Sensitivity analysis
Sensitivity analysis provides a way of assessing the impact of changed assumptions and errors in
estimating profitability. It can be applied to both private and social estimations. In private
estimations, it usually involves partial budgeting. In principle, all social parameters can be
subjected to sensitivity analysis. However, the social estimates of long run world prices for output,
the cost of labour, and cost of capital are usually the most uncertain and hence receive the most
attention in sensitivity analysis.
19
University of Ghana http://ugspace.ug.edu.gh

Further analysis with the PAM involves what economists call "comparative statics" or "partial-
budgeting". This involves asking "what if' questions and simulating certain changes in policies
that impact upon the parameters used, and therefore on profitability and comparative advantage.
Simulations can be applied by adjusting the parameters.
Considering the above advantages and superiority of PAM, it can be seen that PAM is an excellent
analytical framework that has been tried and tested by other researchers and hence can be used as a
methodology for the study.
2.5 Choice of Policy Analysis Matrix as an Analytical Tool for the Study
Policy Analysis Matrix is a convenient analytical framework that enables you to obtain twelve
economic indicators for analysis. The twelve economic indicators are Private Profits (PP), Social
Profits (SP), Private Cost Ratio (PCR), Domestic Resource Cost (DRC), Nominal Protection
Coefficients (NPC), Effective Protection Coefficient (EPC), Profitability Coefficient (PC), Output
Transfers (OT), Input Transfers (IT), Factor Transfers (FT), Net Transfers (NT), and Subsidy Ratio
to Producers (SRP). It has been used by a number of researchers such as Pearson and Merger
(1974), Adesina and Coulibaly (1998), El-Habbab and Jabarin (1992) and many others.
The SP has been used an indicator of comparative advantage, for example Osafo (1983) used the
NSP as a measure of comparative advantage. The SP as an indicator of comparative advantage has
a major limitation of carrying the units of measurement. That is to say, SP must be estimated per
tonne, per hectare and so on. For this reason, it cannot rank systems that are measured in different
units. Also there is a problem when you want to compare systems producing different outputs, this
because the cost structure of the systems will be different and hence the NSP fails to give a good
measure of comparative advantage.
An alternative indicator of comparative advantage that is independent of a unit of measurement is
the DRC. The DRC has advantages over SP because the DRC is a ratio and is unitless. In20
University of Ghana http://ugspace.ug.edu.gh

measuring the competitiveness of a system some researchers have used PP as an indicator of
competitiveness. PP has also got unit of measurement so to overcome this problem a ratio PCR is
used to measure competitiveness.
Some researchers have used EPC as an indicator to measure the extent of incentives or
disincentives that a system receives from product policies. The main limitation of the EPC as an
indicator of incentives is that it does not incorporate any effects of policies that influence factor
prices and costs. To overcome this problem PC which measures the incentive effects of all policies
is used.
Considering the above advantages and superiority of PAM, it can be seen that PAM is an excellent
analytical framework that has been tried and tested by other researchers and hence can be used to
analyse the comparative advantage and competitiveness of black pepper production in Ghana.
2.6 World Trade in Black Pepper
During the last ten years, world pepper production and export shifted within the range of 171,000
metric tonnes to 233,000 metric tonnes. The International Pepper Community (IPC) member
countries are major producers and exporters of pepper. They produce, on the average, 166,000
metric tonnes of pepper of (84%) and export 124,000 metric tonnes or (87%) of world pepper
export, while non IPC countries such as Vietnam, China and Madagascar produce, on average,
about 31,000 metric tonnes or (16%) of world production and supply about 19,000 metric tonnes
or (13%) of world export.
World trade in spices has been buoyant in recent years especially for black pepper. The crop
accounts for a market share of about 35% of the world total spice trade volume or 155,000 tonnes
in a year. The major exporting countries of black pepper are Indonesia, India, Brazil, Malaysia and
21
University of Ghana http://ugspace.ug.edu.gh

Vietnam. Together these countries export about 90% of the worlds trade in black pepper.18 Most of
the black pepper berries are exported to Europe, North America, South Korea, Taiwan and China
where the demand of spices is on the increase.
According to industry experts’, there are good prospects for demand for the crop, and that by the
year 2006 demand will outstrip supply. The demand and supply trends reveal a generally surging
price on the world market. The unstable nature of agricultural commodity prices is more
pronounced for black pepper especially on a monthly basis. This is probably due to the fact that
harvests are not uniform over the year, the high degree of speculation by institutional traders and
brokers and also stock holdbacks by wealthy farmers in anticipation of future higher prices
together contributed to the price fluctuations of the crop. In this connection, a research work by
(Asante, 1991) on trends and variability of international price of pepper showed that world price of
pepper registered the highest variability with an instability index of (47.62), followed by cocoa
(30.87) and coffee (21.87).19 Another development that is likely to add up to trade speculations are
that India is preparing to launch its International Pepper Exchange. There is the likelihood that the
price of pepper will continue to grow on the world market in the long run due to the growth in
demand that outstrips supply.
2.7 Constraints in the Production of Black Pepper
The major producing countries are in the developing and least developed countries, and their
(developing and least developed countries) constraints are attributable to low levels of growth and
development. The additional problems of the spice sector are due to the fact that it does not get the
priority it deserves in national planning and research. The main problems faced by producing
countries are discussed below:
18 UNCTAD Commodity Yearbook 1995 (United Nations sales No. E/F 11 .D25)19 Owusu Asante V. (1991) Trends and Variability of International Prices of Pepper.
22
University of Ghana http://ugspace.ug.edu.gh

Spices are considered as minor crops in most countries. Spices are considered insignificant in the
total agricultural economy of most producing countries. As they are regarded as minor crops, they
do not get the priority it deserves in national planning. As a result, spices are given low priority in
national research programmes. In general, for various reasons spices such as very low priority in
the research focus of developing countries. International agencies have also failed to attach
importance to research into spices. Research in post-harvest technology and quality upgrading has
almost been non-existent.
A study in India has shown that black pepper showed that black pepper is exported at different
moisture levels, with pepper at lower moisture levels attracting the higher prices. In monetary
terms, a drop of moisture content of 1% means price equivalent gain of 10 kg for every tonne of
black pepper. The absence of clear and uniform international standards for moisture levels creates
difficulties for shippers.20
Many exporters in the spice producing countries are not fully aware of the quality requirements of
consuming countries. Rejection of spice consignments and further negotiations on price
adjustments are quite common in the trade. Communication on the user companies’ problems with
the quality of the spices they obtain is likewise almost non-existent. In the present trading context,
this has become a major issue in the spice industry.
Developing country exporters do not have the capacity to meet the requirements for quality
management systems that being imposed in international markets. International Organization for
Standardization (ISO) 9000 certification and Hazard Analysis at Critical Control Points (HACCP)
^are becoming essential tools in the management of food processing companies. HACCP strategies
have major implications for producing countries. The correct use and application of permissible
pesticides, proper harvesting, drying and storage technique, the right screening procedures, the
hygiene of processing units and factory workers are issues that need to be addressed. These are not
23
University of Ghana http://ugspace.ug.edu.gh

simply technology issues, they have'implication for management, labour relations and farm
practices.
Many spice-producing countries do not have internationally acceptable quality assurance systems,
quality upgrade facilities, grading and processing facilities and scientific warehousing. The
deterioration in quality as a result of unscientific handling, inadequate processing and storage has
contributed significantly to low unit-value realization. Though this is the combined effect of poor
technology and lack of capital, certain improvements are possible even with limited resources.
Packaging and transportation continue to be a constraint for producing countries. Some buyers do
not favour traditional hessian bags and sacks are discouraged on environmental grounds. Most
spices are hygroscopic in nature and need specialized packaging. In addition, most shipping lines
operate only with containers, which creates special problems for spices. It appears that the
commonly used ventilated containers are not suitable for this product group. Thus exporters often
receive complains about substandard and poor quality deliveries even though they have shipped
good quality products. Enough work has not been done on designing containers for spices
requiring special handling.
Marketing has been one of the producing countries’ weakest areas. Producer countries often have
very limited role in processing, marketing and distribution operations. This has been essentially
due to lack of adequate technology, research and development support and proper packaging as
well as a reputation for lower quality. Inadequate market support and the lack of clear market
strategy have also contributed to the situation. Market-driven production plans and product
consistency continue to be considered unimportant, with many producers happy to be fair-weather
exporters, thereby falling into the trap of low prices in surplus-production situations and
speculations in low-production years.
20 Nandakumar T. (19961 The Global Spice Trade and the Jlpjguay agreements, Geneva p.25
University of Ghana http://ugspace.ug.edu.gh

Widely fluctuating prices and low prices have affected the ability of spice producing countries to
improve their performance. This is partly due to the indifference of the spice producing community
to carry out joint efforts to press for acceptable minimum levels of quality and to establish
effective marketing operations. In much spice producing countries, effective coordination between
research, extension, marketing and quality improvement is lacking.
Lack of financing and investment in both spice growing and spice processing has also been a
major problem. With the limited ability of governments to find resources for investing in this
sector, a case exists for increased private sector investment. It is admitted that private sector
investments will flow into sectors that have a potential for generating higher profits.21
21 Nandakumar T. (1996) The Global Spice Trade and the Uruguay Round Agreement pp. 15-17.25
University of Ghana http://ugspace.ug.edu.gh

CHAPTER 3
METHODOLOGY
3.1 Theoretical concept
The law of comparative advantage states that countries specialize in producing and exporting the
goods they produce at a lower relative cost than other countries.22 David Ricardo formulated by the
economist David Ricardo. Ricardo pointed out that even if one country were able to produce all
goods more cheaply than another, there would be differences in the extent of this absolute
advantage from product to product. The efficient country thus has a comparative advantage in
those products where its absolute advantage is greatest while the inefficient country has a
comparative advantage in those products where its absolute disadvantage is least. This forms the
basis on which countries trade. So each country should specialize in the production, and export of
those goods in which it has a comparative advantage and buy from others the goods in which it has
comparative disadvantage.23
The Policy Analysis Matrix (PAM) uses the general equilibrium model of international trade as its
theoretical framework.24 International trade enables a country to specialize in the production of
those goods and services in which it is economically efficient, and to trade these goods and
services in which it cannot produce or cannot produce efficiently. International trade is beneficial
as a result of the differences in the opportunity cost of factors of production. Opportunity cost tells
us about the relative cost of producing different goods.
22 D. Begg, S. Fisher, R. Dornbusch Economics Published by McGraw-Hill, Book Company Europe.23 Donnelly Graham ( 1991) A foundation in Economics. Pp. 285,28624 Monke and Pearson (1989) The Policy Analysis Matrix for Agricultural Development, Pp. 97-102.
26
University of Ghana http://ugspace.ug.edu.gh

PAM has economic indicators that tells about the comparative advantage and competitiveness of
crops (such as black pepper) which enables informed decisions to be made whether it makes
economic sense to use scarce resources to produce the crop for the international market or
otherwise. The analytical framework is a product of two accounting identities, one defining
profitability as the difference between revenues and costs and the other measuring the effects of
divergences as the difference between observed parameters such as revenues, prices and
parameters that would exists if the divergences were removed.
Economic profits are the fundamental component of the Policy Analysis Matrix (PAM) approach.
They act as signals for the optimal allocation of resources. There are two types of profits—private
profits evaluated at market prices and social profits evaluated at social or efficiency prices. If there
are no market distortions, the two are often the same. If, however, there were market failures or
distortions then the two would diverge from one another. Their divergence would act as a signal
for policy intervention. Profits are defined as the difference between the value of outputs
(revenues) and the costs of all inputs (costs).25
The PAM model is portrayed in Table 2. The elements in the first row of the matrix are private
revenues, costs and profits. The values in the first row of the matrix are based on direct observation
of the actual revenues and costs in the existing commodity systems. The letter A is used to define
the private revenues (the revenues at the prevailing market prices). Costs are divided into two
components—Costs of tradable inputs (inputs which are traded on world markets) such as
fertilizers, pesticides and seeds and costs of non-tradable inputs. The value of these tradable inputs
at the prevailing market prices (private prices) are recorded in the first row and second column and
are denoted by the letter B. Tradable inputs can be imported from or exported to other countries.
The third column of the matrix includes domestic factors. Domestic factors include land, water,
25 Evaluation of Agricultural policies in the Hashemite kingdom of Jordan: Policy Analysis Matrix approach (New York, United Nations, 1991).
27
University of Ghana http://ugspace.ug.edu.gh

labour, and capital. Domestic factors are also called non-tradable inputs because there is generally
no international market for these inputs.
Private profits are defined in the first row as D = A (Revenues)- B-C (Costs). The second row
covers social revenues, costs and profits. Estimation of social values is more complex, involving
the evaluation of the effects on production system’s policies and market failures. These are values
obtained by adjusting the market prices for inefficiencies in the market. The letter E portrays the
revenues valued at efficiency prices (social prices) and F and G indicate the efficiency values of
tradable inputs and domestic factors, respectively. The third row covers the divergences. The
letters I, J, K, and L define the divergences as a result of output transfers, input transfers, factor
transfers and net transfers respectively.
28
University of Ghana http://ugspace.ug.edu.gh

Table 2: The Policy Analysis Matrix
Item Revenues
Costs of
Profits
Tradable
Inputs
Domestic
Factors
Private Prices A B C D
Social Prices E F G H
Effects of Policy and other
Divergences
I J K L
The symbols (capital letters) are defined as follows:
A = Revenues in private prices (market prevailing prices, also called accounting prices).
B = Costs of tradable inputs (such as fertilizers, seeds, plastic mulch, etc.) in private prices.
C = Costs of domestic factors (such as labour, capital, etc.) in private prices.
D = Private profits.
E = Revenues in social prices (economic, efficiency prices or shadow prices).
F = Costs of tradable inputs (such as fertilisers, seeds, plastic mulch, etc.) in social prices.
G = Costs of domestic factors such as (labour, capital, etc.) in social prices.29
University of Ghana http://ugspace.ug.edu.gh

H = Social profits.
I = Output transfers
J = Input transfers
K = Factor transfers
L = Net transfers
D =A-B-C = Private Profits
H = E-F-G = Social Profits
I = A-E = Output Transfers Input
J=B-F = Transfers
K=C-G = Factor Transfers
L=D-H or L=I-J-K = Net Transfers
3.2 Assessment of Comparative Advantage or Disadvantage of Black Pepper Production in
the Western Region of Ghana
In assessing the comparative advantage of black pepper production in the Western Region, the
main economic indicators that will be used are Social Profits (SP) and Domestic Resource Cost
(DRC). Other economic indicators that have indirect bearing on the comparative advantage are the
Factor Transfers (FT) and Subsidy Ratio to Producers (SRP).
Social profits are those profits calculated at efficiency (shadow) prices. Positive social profits (H)
indicate that there is a positive social valuation of output, and an incentive for the expansion of the
activities under consideration. Social profitability is a measure of comparative advantage or
efficiency in the agricultural commodity system. Positive social profit means that there is
comparative advantage of black pepper production in the Western Region. Black pepper farmers
will be encouraged to increase their production of black pepper. Negative social profits means
there is a comparative disadvantage of black pepper production.
30
University of Ghana http://ugspace.ug.edu.gh

Comparative advantage could be measured by the Domestic Resource Cost (DRC) ratio.26 DRC
determines whether the production of black pepper makes efficient use of the domestic resources.
The DRC, as a measure of efficiency or comparative advantage, is calculated by dividing the factor
cost in social prices (G) by the value added in social prices (E-F). A DRC greater than one
indicates that the cost of domestic resources used to produce the commodity is greater than the
contribution of its value added at social prices meaning a comparative disadvantage of black
pepper production. A DRC less than one indicate that the country has a comparative advantage in
producing black pepper, or that black pepper is making efficient use of the domestic resources.
The letter K portrays the divergences in domestic factors. The Government can affect the prices of
domestic factors such as capital or land. When any factor of production such as the purchase price
of agricultural land is subsidized, the private cost of a domestic factor will be less than the social
costs and K will have a negative value. But, if the Government taxes domestic factors, which
rarely is the case in developing countries, K will have a positive value.
SRP is an indicator used to measure net transfers across dissimilar systems. SRP shows how large
net transfers diverge in relation to social revenue of the system. The SRP converted to a
percentage, also shows the output tariff equivalent required to maintain existing PP if all
distortions and market failures are eliminated. The SRP shows the net policy transfers as a
proportion of total social revenues.
3.3 Assessment of Competitiveness of Black Pepper production in the Western Region of
Ghana
The main economic indicators that will be used to assess the competitiveness of black pepper
production are Private Profits (PP) and Private Cost Ratio (PCR). Other economic indicators that
have indirect bearing on the competitiveness are Input Transfers (IT), Output Transfers (OT), and
Net Transfers (NT).
26 Gittinger P.J. (1982) Economic analysis of Agricultural gipjects pp. 398-400
University of Ghana http://ugspace.ug.edu.gh
A positive value for profits at prevailing market prices (D) confirms the profitability of the
business. Positive profits also provide stimulus for existing firms to increase output and for other
forms to enter the business. In the case of black pepper, positive profits of are an indication of
competitiveness of black pepper production in the Western Region of Ghana. This will lead
expansion of black pepper farms as well as entry of new black pepper farmers unless fanning area
cannot be expanded or substitute crops like cocoa and plantain are more profitable than black
pepper production Negative private profitability means there is a net loss indicating there is no
incentive to continue the production of black pepper. When the market prices of inputs and outputs
are distorted by either market failure or by taxes or subsidies, then private profits alone could lead
to misleading signals.
The Private Cost Ratio (PCR) explains the ratio of domestic factor costs (C) to value added in
private prices (A-B). This ratio demonstrates the ability of the production of black pepper to cover
the cost of the domestic factors and continue to be competitive.27 It is also a proxy for the degree
of processing of black pepper within the domestic economy. This ratio is important for investors
because they can optimise their profits by minimizing the cost of tradable inputs and factors.
The letter J represents the differences between the private costs and social costs of tradable inputs.
If J is negative, the private costs of tradable inputs like black pepper seedlings and fertilizer is
lower than the social costs. This means that the Government is actually or implicitly subsidizing
the costs of black pepper seedlings and fertilizer as these inputs are sold at prices lower than those
prevailing in the international markets. On the other hand, if J is positive then the private costs of
inputs are greater than the social costs. This indicates that the Government is imposing tax on the
price of black pepper seedlings and fertilizer used by farmers. The net effect is that prices paid by
farmers are greater than the world market prices.
32
University of Ghana http://ugspace.ug.edu.gh

If the value of I, defined as output transfer, is positive then private revenues exceed social
revenues. This indicates that the Government is subsidizing output prices. If the government is
subsidizing the prices of black pepper, then the Government and/or consumers are purchasing
black pepper at prices greater than international prices or those that would equate social and
private valuations. The value of the difference is theoretically a transfer from the treasury to the
black pepper farmers. If the value of I is negative, then social revenues are greater than the private
revenues. This means that the Government is taxing instead of subsidizing the black pepper
farmers. In other words, the government and/or consumers are purchasing black pepper at prices
lower than those prevailing in international markets or those that equate private and social
valuations. The actual or implicit tax, in this case, is a transfer from black pepper farmers to the
treasury. A comparison between output transfers of two or more outputs requires the construction
of a ratio to compare unlike products. This ratio is the Nominal Protection Coefficient on Tradable
Outputs (NPCO), defined as the revenue in private prices divided by the revenue in social prices.
When more than one output is produced, the average NPCO for all products are found by adding
all output in private prices and then in social prices by the formation of a ratio of these two sums.
The letter L denotes the net effect of all policies on the commodity system. If the overall effect of
all policies and/or market failures on input and output prices is in favour of the producers (in the
short run), L will have a positive value. Alternatively, L will have a negative value, if the policies
and/or market failures are working to the detriment of the producers.
3.4 Prices of black pepper paid to farmers in the Western Region of Ghana
The main economic indicators that will be used are Nominal Protection Coefficient (NPC),
Effective Protection Coefficient (EPC), and Profitability Coefficient (PC).
27 Economic analysis of Agricultural markets, market manual series pp. 133, 13433
University of Ghana http://ugspace.ug.edu.gh

The NPC- is calculated by dividing the revenue in private price (A) by the revenue in social price
(E). The objective of calculating NPC is to measure the actual divergences or distortions between
domestic prices and international or border prices of output. If NPC is less than one it confirms the
presence of taxes (tariffs) on outputs. An NPC greater than one shows the presence of subsidies.
An NPC equal to one (in the absence of market failures) reveals the absence of intervention.28
The EPC is defined as the ratio of value added in private prices (A-B) to value added in social
prices (E-F) of a system. It is another measure of incentives to black pepper farmers.29 This
coefficient indicates the combined effects of policies on tradable commodities (inputs and outputs).
The EPC is a useful indicator that measures the whole structure of incentives/dis-incentives, which
may exist with respect to a black pepper production.30 An EPC less than one indicate negative
effects of policy (a tax), whereas an EPC greater than one indicates positive effects of policy (a
subsidy). The main limitation of the EPC as an indicator of incentives is that it does not
incorporate any effects of policies that influence factor prices. This omission means that EPC
results should be interpreted as measures of the incentive effects of black pepper price policies but
not as indicators of the total impact of policies that influence prices and costs of black pepper
production.
The PC is defined as the ratio of private profits (D) to social profits (H). The Profitability
Coefficient (PC) measures the incentive effects of all policies affecting the production of black
pepper. However, its use is limited when either private or social profits are negative. The PC can
be used as a proxy for the net policy transfer (L).
28 Food and Agriculture Organization of the United Nations, Comparative advantage of agriculture production systems and its policy implications in Pakistan. FAO Economic and Social development paper (68), (Rome, 1987) p.2
29 Naylor R., and Gotsch C., (1989) Agricultural policy analysis course-oomputer exercise, Food Research Institute, Stanford University, Palo Alto, CAUSA (July 1989)
30 Corden W.M. (1985) Protection, Growth and Trade: Essays in International Economics, Pp. 141-15334
University of Ghana http://ugspace.ug.edu.gh

3.5 Social Valuation of Tradables and Non-Tradables
Social valuation of outputs and inputs is a major segment in the building process of the Policy
Analysis Matrix (PAM). Social prices in the PAM are also referred to as efficiency prices (shadow
prices) and demonstrate opportunity costs of use of these factors of production.
3.6 Construction of PAMS for Black Pepper
As PAM uses both private and social prices for inputs and outputs, costs and returns information
are disaggregated in two ways. First, private costs are classified into four categories- labor, capital,
land, and tradable inputs. Second, quantity and unit price data are usually necessary for estimation
of social costs and returns.
To estimate PAM, representative black pepper farms are first identified. Secondly, for each
system, observed data for prices, output levels, and input use are collected, and the first line of
PAM is estimated. Thirdly, the price and quantity observations are modified to reflect the social
values appropriate to use in the second line of PAM. The necessary social prices, may be observed
directly (world prices for tradable outputs and inputs) or they may be derived indirectly, for
example, using information about divergences to estimate social factor prices from private factor
prices.
The selection of black pepper farms is perhaps the most arbitrary, yet crucial, element of PAM
research, and in this study 132 black pepper farmers were used. In this study a population of 132
black pepper farmers in the Western Region who were part of the micro enterprise development
assistance black pepper sub sector development programme were used (see Table 11).
Characteristics that are similar across the firms are chosen as the basis for the representative firm.
For example the commodity produced, region of production, and production technology are the
most common identification criteria. Activity selection is also dictated by the requirement of social
valuation. The domestically produced product must be comparable to a commodity available in the
35
University of Ghana http://ugspace.ug.edu.gh
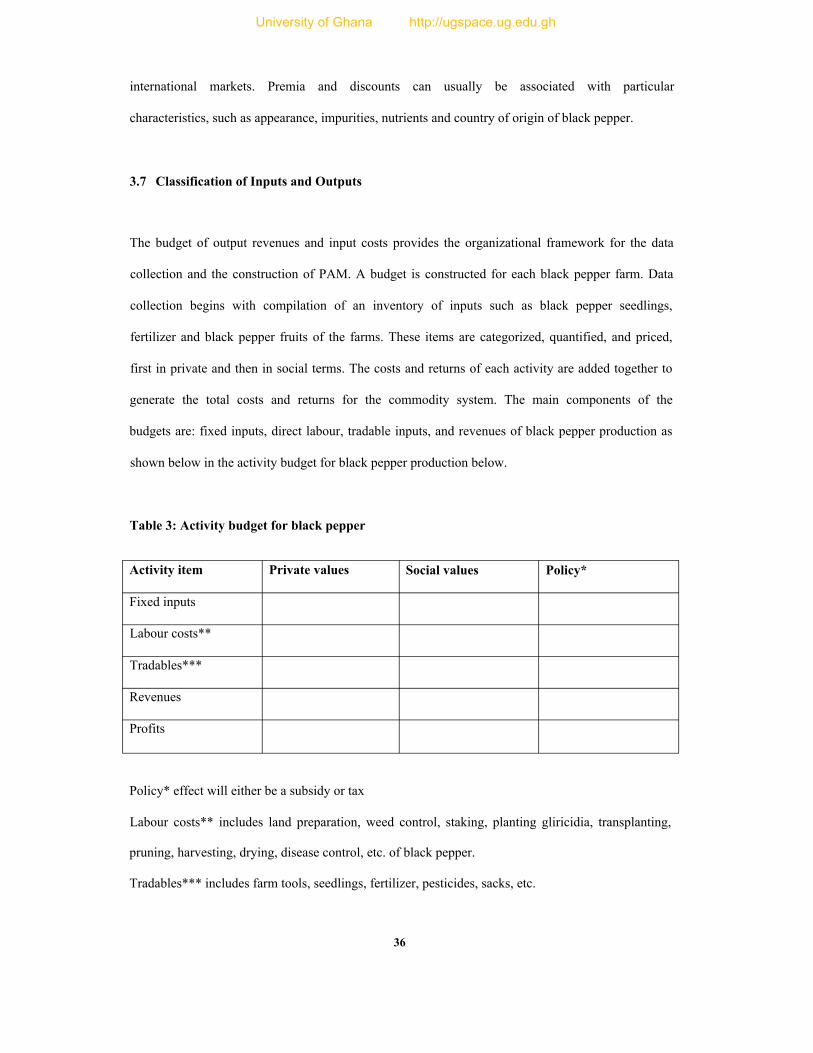
international markets. Premia and discounts can usually be associated with particular
characteristics, such as appearance, impurities, nutrients and country of origin of black pepper.
3.7 Classification of Inputs and Outputs
The budget of output revenues and input costs provides the organizational framework for the data
collection and the construction of PAM. A budget is constructed for each black pepper farm. Data
collection begins with compilation of an inventory of inputs such as black pepper seedlings,
fertilizer and black pepper fruits of the farms. These items are categorized, quantified, and priced,
first in private and then in social terms. The costs and returns of each activity are added together to
generate the total costs and returns for the commodity system. The main components of the
budgets are: fixed inputs, direct labour, tradable inputs, and revenues of black pepper production as
shown below in the activity budget for black pepper production below.
Table 3: Activity budget for black pepper
Activity item Private values Social values Policy*
Fixed inputs
Labour costs**
Tradables***
Revenues
Profits
Policy* effect will either be a subsidy or tax
Labour costs** includes land preparation, weed control, staking, planting gliricidia, transplanting,
pruning, harvesting, drying, disease control, etc. of black pepper.
Tradables*** includes farm tools, seedlings, fertilizer, pesticides, sacks, etc.
36
University of Ghana http://ugspace.ug.edu.gh

Fixed inputs have a useful life of many years and so the analyst uses only a portion of fixed input
cost should be attributed to a particular year’s production. A simple approach is to divide the cost
of fixed inputs by its useful life. But that calculation ignores the need for capital expenditures to
earn a rate of return on the investment. The annual equivalent value for a fixed input is known as
the capital recovery cost (A). It is expressed as:
A = Z [(1+ i ) n 1 / ( 1+i )]. Where A, Z, n, and i represent capital recovery costs or the annual
payment sufficient to repay cost, initial cost, the useful life of fixed input and the rate of return
respectively. By applying this factor to the purchase price of the fixed input, the analyst can
calculate the annual equivalent value for any fixed input.
Farms utilize many different vintages of capital equipment; as a result, fixed costs may vary
substantially among firms. But capital stock must be replaced eventually, and current costs of fixed
inputs become important to the continued operation of the firm. Useful lives of the fixed inputs
vary among firms as well, depending on intensity of use as well as owner maintenance practices.
The following rules of thumb can be used when no better information is available: buildings - (30
to 40) years, machinery- (10 to 15) years and small machines and tools- (5 years).
Land is unique because it is the only truly fixed factor of production in agriculture. In the suburban
locations, agriculture might not be the only use for land, and prices and rental values will be
influenced by off farm opportunities. But in most areas, the only alternative to agricultural use is
no use at all (if forestry is included as an agricultural activity). In these cases, land acts as a
residual claimant on the profits from farming.
Divergences that affect the prices of agricultural outputs and non-land inputs have a direct impact
on the rental value of land. If the prices of the principal outputs of a region increase, profits will
increase. Ultimately, land values will increase because individual producers are willing and able to
pay an increased amount for the right of access to farmland. Only if arable land supplies are in
surplus will the price of land remain unaffected and presumably near zero.37
University of Ghana http://ugspace.ug.edu.gh

To draw conclusions about the effects of policy distortions and market failures on the choice of
agricultural activities, the social land rental value is usually measured as the value of the land in its
most profitable alternative use. Another distortion in the land market is when government
sometimes tries to alter the distribution of profits between tenant and landowner by imposing
controls that limit the land rents paid by tenants. If such controls are binding, private market rental
rates will be less than full amount of private profits. In this study agricultural land was valued at
the leasing price for farming in the Western Region and included in the input costs so as to obtain
the true estimate of the cost of production of black pepper.
The greatest complication for labour market evaluation involves recognition of many types of
labour and choice of private market prices to represent differences in sex, age, and skill levels. The
identification of labour market failures usually begins with comparisons of regional wage rates
specified by sex and type of worker. If wage levels for similar types of labour vary substantially
among regions or if wages change in a very different manner over time, market fragmentation and
monopsony power may be present. But wage rate comparisons are not by themselves sufficient to
justify adjustment of private prices. First, the cost of living can differ across regions, and real
wages differences can be less than nominal wage differences. Second, wages may adjust only
slowly across regions, because labour does not respond instantaneously to changes in relative
earning opportunities. Third, migration from region to region is costly. If relative wage rise in a
particular region, labour from another region may choose not to migrate to the new higher wage
area because the costs of migration are larger than the net gains. Therefore, even if labour markets
are well integrated, regional wages can be expected to demonstrate some independence.
The second category of inputs, direct labour, and covers all labour directly employed in the
activity. Both hired and family labour resources are included. If the analyst wants to make a
distinction between family and hired labour, these inputs can be entered as separate lines within
the labour category. Similar distinctions may be made between male and female labourers and
labourers of different ages and skills levels. In this study the agricultural wage rate in the Western38
University of Ghana http://ugspace.ug.edu.gh

Region was applied to both family and hired labour so that the cost of production of black pepper
reflects the true value on the ground.
If any of these circumstances can account for wage differences, no adjustment of private wages is
necessary to approximate social prices of labour. But if market imperfections are present in a
particular region, social wages will be somewhere between those in the monopsony power region
and those in the other regions of the country.
Policy distortion usually entails legislated wage rates or taxes and subsidies on the use of particular
categories of labour. Evaluation of distortions must determine whether the regulations are binding.
When the labour market completely ignores a legislated minimum wage rate for example, the
private wage equals the social wage; both prices may be below or above the minimum wage. If
only some sectors observe the regulations, the wages in the unregulated sector provide a measure
of social price. In this study, the economic wage rate was the prevailing wage rate during peak
seasons of harvest time and during planting was used, as these seasons’ most rural people can find
employment or work to do. At these seasons the wage rate will be a good estimate of opportunity
cost of labour and its marginal value product.31
Treatment of employer paid taxes on labour follows a similar procedure. The issue is whether the
regulation has actually raised the reward to labour, or employers have simply lowered the money
wage so that workers’ total compensation remains unchanged. The presence of a globally binding
regulation should be associated with some unemployment. If legislated wages are associated with
full employment and all employers pay tax, the analyst can assume that the legislation is non
binding. The private cost of labour then equals its social cost.
Revenues, the final category of the activity budget covers all outputs of the activity. The
commodity of interest is designated the primary output and it is listed first in the category list. All
39
University of Ghana http://ugspace.ug.edu.gh

other outputs are called secondary outputs and are entered on subsequent lines on the list. These
designations are entirely arbitrary, secondary products can be as important as or more important
the primaiy product as sources of revenue for the activity. The distinction for a valuable output is
that it has some productive value to that activity. This value can be gained through sale or use
elsewhere in the production of black pepper.
3.8 Procedure for estimating PAM for Black Pepper Production
Choosing the Time Frame of Analysis
After inputs and outputs for each activity have been identified, they need to be evaluated. The
chosen time frame in which to evaluate the costs and benefits of the activities is termed as the base
year in PAM analysis. The base year may be the current year or any past year. Research objectives
and practical consideration determine the choice of base year. Because policy makers may be wary
of dated results, most choose a base year as close as possible to the present year. In this study the
base year was the year 2000.
Explicit recognition of the time frame of analysis provides another justification for the collection
of separate price and quantity estimates for the major inputs and outputs of the system. From the
policy makers perspective, the long run profitability of the system is often most germane to the
policy process. Because many policies are not changed with great frequency, the policy system
interaction over a long time period must be understood. In the portrayal of a longer-run
interactions of policy and profitability, expected prices replace prices observed at a particular time
as the correct measure for calculation of input costs and output revenues.
Disaggregation of input costs into domestic factor and tradable input components
After all private and social input costs have been standardized to annual basis, they are allocated to
their domestic factor and tradable input components. This disaggregation is necessary to permit
31 d nas-rv The j3/.on<vni<\ *-''>’-'sis of Agricultural Projects, pp. 258,261.--- ——----------------------------------------------------- 40
University of Ghana http://ugspace.ug.edu.gh

identification of tradable input and domestic factor divergences. Both total private and total social
costs are decomposed into their domestic factors and tradable input components. In principle,
many classes of domestic factors could be recognized, but for most purposes, four categories of
domestic factors - unskilled labour, skilled labour, land and capital are sufficient.
With other intermediate inputs, including electricity, transportation, and most services, no
particular cost category appears to dominate total costs. Such inputs are denoted as non-tradable
inputs, because they are not available on international markets. Non-tradable goods such as
electricity and water have high international transport costs. Non-tradable services such as
marketing activities and legal services are impossible to supply from foreign sources for logistical
reasons. In this study, the operational rule for distributive shares are applied and the assumption is
that non-tradable inputs contain one-third labour, one-third capital, and one-third tradable.
3.9 Procedure for budget preparation for black pepper production
The first step involves the preparation of the crop calendar (a time line that identifies the various
tasks in crop production such as land clearing, planting, fertilization, pest control and harvesting)
to reduce the likelihood of data omissions. The next step in budget preparation involves the
specification of inputs and outputs associated with each task of the cropping calendar.
Because each input will be evaluated in social as well as private prices, input have to be identified
with a high degree of specificity.
For inputs and outputs that are identified in quantity terms, unit prices represent the final
ingredient necessary for the formulation of the budget. All prices need to be standardized to a
common time and in this study the year 2000 is chosen.
Prices must also be standardized for the location and in this study the farm gate price of black
pepper is used. To calculate the farm level profitability of the activity farm gate prices or price41
University of Ghana http://ugspace.ug.edu.gh
equivalents are the relevant values. For intermediate inputs, price therefore includes marketing
costs incurred in delivering the input to the farm. For example, the cost of fertilizer is not the ex
factory price but the ex-factory price plus the cost of marketing and delivering the fertilizer to the
farm gate. Black pepper fruits are valued similarly, not with the price in some consumer centre but
with a price or price equivalent that represents the ex-farm gate value of black pepper fruits.
In this study, the costs of manure were estimated on the basis of the labour, capital, and the
intermediate inputs required producing the output. The total cost of these inputs is assumed to
reflect an implicit market price for the product.
Perhaps the most common non-marketed input is family labour. Instead of receiving a wage
payment, a family labour shares in the net income of the farm. Each family member receives an
implicit wage to the value of individual consumption and savings divided by the time devoted to
the farm activity. In this study the agricultural wage rate of the Western Region was applied to
both family and hired labour. Makers of budgets usually avoid such calculations by applying
market wages at all labour inputs. If family labour does not earn the market wage, at least some
family members could do better financially by leaving their own farms and seeking employment as
hired labourers. The analyst then needs to develop a rationale for acceptance of a relatively low
rate of remuneration, such as limited alternative employment opportunities or a desire for food
security and a consequent unwillingness to rely on markets for basic foodstuffs.
At some point, the analyst needs to convert world prices into domestic currency, this conversion
require an exchange rate. Entries in the calculation of private profitability, the top row of the
matrix, present no difficulties (Appendix Table 5). Interest then centres on what exchange rate to
use to convert world prices into domestic currency for social valuation. Adjusting the exchange
rate for the impacts of output price distortion and macroeconomic policy effects is a complex task.
Fortunately, such corrections are not essential for the construction of the PAM. Exchange rate
changes causes changes in output prices that will be transmitted eventually to domestic factor42
University of Ghana http://ugspace.ug.edu.gh

prices. Social factor prices reflect marginal value products- the social prices of output times the
marginal physical products- and these prices will change in equal proportion because changes in
exchange rates alter tradable output prices in equal proportion.
A11 tradable commodity systems are similarly affected by the exchange rate, once factor prices
have time to adjust. The non-uniformity of exchange rate occurs in systems for non-tradable
goods, because the non-traded output prices are not directly affected, whereas all input costs are
changed. In this study the exchange rate that was used is the exchange rate quoted by the Bank of
Ghana.
3.10 Sensitivity analysis
Sensitivity analysis provides a way of assessing the impact of changed assumptions and errors in
estimating profitability. It can be applied to both private and social estimations. In private
estimations, it usually involves partial budgeting. In principle, all social parameters can be
subjected to sensitivity analysis. However, the social estimates of long run world prices for output,
the cost of labour, and cost of capital are usually the most uncertain and hence receive the most
attention in sensitivity analysis. The sensitivity analysis was done by assuming that there will be
fluctuations in the prices paid to black pepper farmers and increases in the prices of tradable inputs
such as fertilizer and the way it affects the profitability of the production of black pepper.
The choice of social prices for outputs and inputs is subject to analytical imprecision in several
areas. First, estimates of price equivalents impact of factor market divergences might not be much
better than educated guesses, especially for rates of return to capital and short run effects of
distorted foreign exchange rates. Second, divergences additional to factor market divergences may
influence domestic factor prices, and their impacts may not be well understood. For example,
widespread protection of outputs that are intensive to a particular factor will probably elevate that
factor price. Third, price response within the commodity system could cause the quantities of
University of Ghana http://ugspace.ug.edu.gh

inputs employed under social prices to be different from those used in the estimation of private
profits. Sensitivity analysis was done so that critical inputs of black pepper production such as
fertilizer, black pepper seeds and pesticides are identified.
3.11 Data collection for the study
Secondary data from the Micro enterprise Development Assistance Black Pepper Sub sector
Development Programme undertaken by CARE International was used for the analysis of the
work. In addition, random sampling technique was used to select farmers (from the 119 farmers
who were from eight cooperative groups [Appendix Table 13]), and a questionnaire administered
to them. In relation to the constraints, statistical methods such as frequency and percentages were
used to analyse the responses from the farmers.
44
University of Ghana http://ugspace.ug.edu.gh

CHAPTER 4
ANALYSIS AND DISCUSSION OF RESULTS
4.1 Introduction
This chapter discusses the results obtained using the PAM analytical framework. There are twelve
economic indicators, made up of six non-ratio indicators and six ratio indicators. The six non-ratio
indicators are Private Profits (PP), Social Profits (SP), Output Transfers (OT), Input Transfers (IT),
Factor Transfers (FT) and Net Transfers (NT) and the six ratio indicators measuring economic
efficiencies are the Private Cost Ratio (PCR), Domestic Resource Cost (DRC), Nominal
Protection Coefficient (NPC), Effective Protection Coefficient (EPC), Profitability Coefficient
(PC) and Subsidy Ratio to Producers (SRP).
In addressing objective one that is to determine whether there is comparative advantage in
producing black pepper in the Western Region of Ghana, the main economic indicators that will be
used are the Social Profits and Domestic Resource Cost. Determining the competitiveness of black
pepper production in the Western Region of Ghana, the main economic indicators that will be used
are the Private Profits and Private Cost Ratio. With regard to the third objective, that is to
determine whether the prices paid locally provide incentives to domestically produce black pepper
in the Western Region of Ghana, the main economic indicators that will be used are the Nominal
Protection Coefficient, Effective Protection Coefficient, Profitability Coefficient and Subsidy
Ratio to Producers were used as the main economic indicators
45
University of Ghana http://ugspace.ug.edu.gh

The first economic indicator to determine whether there is comparative advantage or disadvantage
of black pepper production is the Social Profits (SP). The average SP of black pepper was
02,556,000. The positive value of the SP meant that there is comparative advantage of black
pepper production in the Western Region of Ghana. The positive value of the SP also indicates that
there is positive valuation of black pepper and this is an incentive to black pepper farmers to
expand their production. This is important as the crop is a perennial one and will have to be on the
land for at least fifteen years. The value of SP of 02,556,000 implies black pepper production
contributes to raising national income and if Government is able to promote black pepper
production it will earn both internal income and foreign exchange from importing countries.
Countries such as The Comoros, Grenada, Guatemala, Madagascar and Tanzania depend heavily
on spice exports for their foreign exchange earnings. The black pepper crop starts fruiting in the
third year and so it appears that the revenue accrued causes the SP to increase from the third year
onwards (Appendix Table 5).
4.2 Assessment of Comparative Advantage or Disadvantage of Black Pepper Production in
the Western Region
46
University of Ghana http://ugspace.ug.edu.gh

Table 4: The Policy Analysis Matrix for one acre of black pepper production in the Western
Region of Ghana
(Figures in thousands of cedis)
Item Revenues
Costs of
Profits
Tradable
Inputs
Domestic
Factors
Private Prices 3,257.69 177.76 1,192.68 1,887.25
Social Prices 4,021.84 150.90 1,314.94 2,556.00
Effects of Policy and other
Divergences
(764.15) 26.86 (122.63) (668.75)
Source: Author’s computation
47
University of Ghana http://ugspace.ug.edu.gh

~ ^ Table 5: Non-ratio economic indicators (‘000’)
J *!'&« -1996 1997 1998 19 99 2000 2001 2002 2003-
2011
PP (555.9) (211.1) 1259.9 1430.4 2042.4 2564 2564 2135
SP (760.4) 53.2 2196.8 1619.8 2748.8 3420.4 3420.4 2849
OT (255) (680) (980) (250) (750) (900) (900) (749.7)
IT 14.00 32.00 30.00 12.00 30.00 30.00 30.00 24.99
FT (473.5) (447.7) (73.1) (72.6) (73.6) (73.6) (73.6) (61.30)
NT 204.5 (264.3) (936.9) (189.4) (706.4) (856.4) (856.4) (713.3)
Ratios of economic indicators
PCR 4.00 1.40 0.23 0.24 0.21 0.19 0.19 0.19
DRC 2.65 0.96 0.17 0.24 0.18 0.18 0.17 0.17
EPC 0.41 0.43 0.62 0.88 0.77 0.77 0.77 0.77
NPCO 0.5 0.5 0.66 0.90 0.80 0.80 0.80 0.80
NPCI 1.25 1.29 1.14 1.03 1.08 1.08 1.08 1.08
PC 0.73 (3.97) 0.57 0.88 0.74 0.75 0.75 0.74
SRP 0.0014 (0.0029) 0.0002 0.0004 0.0002 0.0002 0.0002 0.0004
The second economic indicator to address the objective of comparative advantage is the
Domestic Resource Cost (DRC). The average DRC of 0.34 indicates that there is economic
comparative advantage of black pepper production in the Western Region. It also means that
domestic factors of production like labour are used efficiently in the production of black
pepper. The average DRC of 0.34 means the opportunity cost of domestic factors of production
like labour is significantly less than the net foreign exchange saved by avoiding importing a
marginal unit of black pepper. The average DRC of 0.34 suggests that for every 0100 obtained
48
University of Ghana http://ugspace.ug.edu.gh

from value added to black pepper only 034 is attributed to domestic factors of production and
hence there is an economic comparative advantage of black pepper production in the Western
Region. It appears that as you move from the first year onwards the rate of revenue increases
(all things been equal value added will also increase) exceeds the rate at which the domestic
cost of production increases and hence the DRCs ratio becomes smaller as you move from the
first year onwards (Appendix table 5). It can therefore be seen that the economic indicators of
SP and DCR showed that there is comparative advantage of black pepper production in the
Western Region of Ghana.
Other economic indicators that also have indirect effects on comparative advantage are the
Factor Transfers (FT) and Subsidy Ratio to Producers (SRP). As FT is negative (that is -
0122,630, Appendix Table 4), it means that the private cost of domestic factors of production
such as labour in the cultivation of black pepper is less than the international prices of factors
of production. This is very good for black pepper farmers as the production of the crop is very
labour intensive. This puts black pepper farmers at a competitive edge to tap the full potential
of the crop. Studies in India has shown that black pepper cultivation and harvesting is labour
intensive and constitutes about 60% of production cost.32 Fortunately for the fanners in the
Western Region there is cheap labour readily available that put them at a competitive edge.
SRP is an indicator used to measure net transfers of divergences (between private and social
values) across dissimilar systems. SRP shows how large net transfers diverge in relation to
social revenue of the system. The SRP converted to a percentage, also shows the output tariff
equivalent required to maintain existing PP if all distortions and market failures are eliminated.
The SRP shows the net policy transfers as a proportion of total social revenues. The SRP of
0.017 (Appendix Table 4) means divergences caused by the existing policies have increased
gross revenues of black pepper by 17%.
32 Brandao A.L, Tafani R.K, Lima L.P. Economic viability of black pepper cultivation in the Cacao region of Bachia. Estimation of investment costs for one hectare of pepper.
49
University of Ghana http://ugspace.ug.edu.gh

4.3 Assessment of Competitiveness of Black Pepper Production in the Western Region
The first economic indicator that will be used to address objective one above is the Private Profits
(PP). The average PP (Appendix Table 4) for black pepper in the Western Region of Ghana was
01,887,250. The positive value of average PP shows that black pepper production in the Western
Region is profitable and competitive under the existing policies of allowing the private sector and
market conditions to set the prices of agricultural products and tradable inputs. Other fanners
cultivating less profitable crops will also start the cultivation of black pepper, as it is more
profitable. The expansion of the black pepper farms will continue unless the farming area in the
Western Region becomes exhausted or substitute crops like plantain and cocoa produced in the
Western Region are more privately profitable than black pepper.
50
University of Ghana http://ugspace.ug.edu.gh

Table 6: Average non-ratio economic indicators (‘000’)
(Figures in thousands of cedis)
ECONOMIC INDICATORS AVERAGE
Private Profits 1,887.25
Social Profits 2,556.00
Output Transfers -764.15
Input Transfers 26.86
Factor Transfers -122.26
Net Transfers -668.75
Ratios of economic indicators
Private Cost Ratio 0.39
Domestic Resource Cost 0.34
Effective Protection Coefficient 0.26
Nominal Protection Coefficient on Outputs 0.81
Nominal Protection Coefficient on Inputs 1.18
Profitability Coefficient 0.74
Subsidy Ratio to Producers 0.17
The PP is a standard of measure of financial competitiveness. The average PP of 01,887,250
shows that black pepper production in the Western Region of Ghana is competitive. The black
pepper crops takes three years before it starts fruiting and supervised credit will be a welcome
relief to the farmers. This is going to encourage other farmers who cannot cultivate black pepper
because of the financial constraints to be able to cultivate the crop. This means that well organized
black pepper farmers can be able to form cooperatives so that they get supervised credit from
51
University of Ghana http://ugspace.ug.edu.gh

financial institutions to expand their farms. The PP generally increases from the third year onwards
as a result of the accrued revenue from the black pepper berries (Appendix Table 5).
The second ratio that will be used to determine whether it was competitive to produce black pepper
was the Private Cost Ratio (PCR). It is a ratio of the private costs of domestic factors and value
added in private prices. The average PCR of 0.39 (Appendix Table 4) means that for every 0100
obtained as a result of value added to black pepper, only 039 goes into the costs of private
domestic factors such as labour used in the production of black pepper. The rate of reduction in the
PCR ratio from the first to the third years are more pronounced than from the third year onwards
and becoming stable from the sixth year onwards (Appendix Table 5). To further improve on the
financial competitiveness of black pepper production, Government should encourage investors into
black pepper processing33 and diversified products of black pepper such as pepper oil and pepper
oleoresin, which are more profitable than the production and exporting of the raw black pepper
fruits.34
In this area Government can encourage agricultural engineers of the Centre for Scientific and
Industrial Research (CSIR) to develop small-scale equipments for black pepper production using
local materials for their construction. In Indonesia small-scale equipment for processing black and
white pepper was developed at the farm level to help farmers to add value to the crop. It was found
out that the mechanical processing of black pepper was more economical than the traditional one.35
Thus it can be seen that the PP of 01,887,250 and PCR of 0.39 showed that black pepper
production in the Western Region is competitive.
Other economic indicators that have indirect effects on the competitiveness of the crop are the
Input Transfers (IT), Nominal Protection Coefficient on Inputs (NPCI), Output Transfers (OT) and
Net Transfers (NT). The IT is 026,860. As IT is positive it means the private cost of inputs of
33 Rusli S., Nurdjannah. N. (1993) Handling and processing of pepper, Pp. 38-43.34 Pruthi J. S. (1990) Diversification in pepper utilization. Green pepper products.
52
University of Ghana http://ugspace.ug.edu.gh

production of black pepper such as black pepper seedlings, fertilizers are greater than their
international prices. This means that the black pepper producers in the Western Region are being
taxed as a result of the higher prices of the inputs of production. To help to reduce cost on black
pepper production researchers should come out with high yielding and disease resistant varieties
that will require fewer amounts of these agrochemicals. Black pepper farmers can be encouraged
to shift to the use of manure and animal droppings so as to cut down the use of the agrochemicals.
Studies in India have shown that black pepper productivity can be increased without chemical
fertilizers and pesticides. It has been shown that by adding organic manure and integration of
animal components, the soil becomes disease suppressive.36
The private sector is handling the marketing of these tradable inputs such as fertilizers and
agrochemicals, government can help to reduce the cost of these inputs by giving special tax
exemptions for them. The IT of 026,860 is telling us that the domestic cost of tradable inputs are
higher and if steps are taken to reduce the cost, it is going to reduce the overall cost of production
of black pepper. This will increase profitability and be an incentive for the farmers to exploit the
full potential of the crop. It appears that IT of 026,860 is one of the reasons why the PP of
01,887,250 is lower than the SP of2,556,000.
The average NPCI of 1.18 (Appendix Table 4) shows that the costs of tradable inputs like fertilizer
were 18% more than the international prices. This means that if tradable inputs such as fertilizer
are suppose to be 0100, the existing policies have increased the prices to 0118. This is in a form of
tax to producers of black pepper. To help reduce the higher cost of these tradable inputs farmers
can form groups so as to buy these fertilizers in bulk so as to get discounts.
Output Transfers (OT) is the difference between market revenues of black pepper and social
revenues of the crop. The OT is - 0764,150 (Appendix Table 4). As the OT is negative it means
35 Nuijannah N, Hidayat T. (1996) Small scale equipment for pepper processing at farm level in Indonesia.36 Zulkifly E. (1996) Prospects of implementing organic fanning on pepper.
53
University of Ghana http://ugspace.ug.edu.gh

that social revenues exceeds private revenues, this indicates that domestic consumers of black
pepper are purchasing it at prices lower than the international price of black pepper. However, it
should be realized that the quality of black pepper fruits are ungraded and hence the lower PP are
realistic.
The average value of NT was - 0668,750, and as the NT is the sum of all the divergences that
causes private profits to differ from social profits, it also gives an indication of the inefficiencies in
the system. To be able to improve on the NT, there is the need to improve on the quality of black
pepper produced to enable them to higher prices for the produce. There is the need to encourage
the farmers to cultivate high yielding variety such as Balancotta.
4.4 Black Pepper Producer Prices in the Western Region
The economic indicators that will be used to address the objective of determining whether the
prices paid by local and international markets give any incentive for black pepper production in the
Western Region of Ghana were the NPC (Nominal Protection Coefficient), EPC (Effective
Protection Coefficient) and PC (Profitability Coefficient).
On the average farmers are receiving 0.8lor 81% (Appendix Table 4) of world prices of black
pepper, which is realistic. The NPC on outputs of 0.81 means that producers of black pepper are
slightly taxed. The NPC on outputs of 0.81 shows that black pepper farmers are receiving 81% of
the world price of black pepper even though what is sold in the domestic market is ungraded and
of much lower quality (Appendix Table 4). The NPC on outputs of 0.81 indicates that policies
caused output prices to be 19% lower than they would have been if international prices had been
allowed to set domestic prices. The average NPCI of 1.18 shows that the cost of tradable inputs
likes fertilizer were 18% higher than international prices.
The second economic indicator that will be discussed is the Effective Protection Coefficient
(EPC). The ratio thus shows how many policies in the product markets caused observed value54
University of Ghana http://ugspace.ug.edu.gh

added to differ from what it would be in the absence of commodity price policies. EPC is an
indicator of the net incentives or disincentive effect of all commodity policies affecting prices of
tradable outputs and inputs. The EPC indicates the combined effects of policies on black pepjper.
The average EPC is a single indicator that combines the two results of the NPCO of 0.81 and NPCI
of 1.18. It can thus be seen that the EPC is a useful measure of combined effects of commodity
price policies. The EPC of 0.26 means that the factors of production such as land have their returns
enhanced by 26% and hence there is incentive for factors of production to be pulled into the
production of black pepper. For the farmers to be able to get better prices for their produce, the
farmers have to be trained in post harvest technology that will enable the benies to be of high
quality and also to develop a structured system for handling and marketing of black pepper.37
In India for example, blanching of black pepper berries prior to sun drying38 is done to improve the
quality of black pepper. Blanching in water of 80 degrees Celsius for 1.5 to 5 minutes prior to sun
drying accelerated both the browning and the rate of drying. The black pepper required only 3 days
(21 hours of sunshine) with the common method using 4 to 5 days (28 to 31 hours of sunshine)
required. The quality of black pepper was improved. The black pepper had an attractive colour
with an excellent and strong aroma.39 So it can be said that on the whole price paid to black pepper
farmers are realistic and attractive. However farmers will be able to get better prices if they are
able to use simple post harvest technologies to improve the quality of the black pepper fruits.
The third economic indicator that will be discussed is the Profitability Coefficient (PC). The
average PC was 0.74 (Appendix Table 4). The PC is a measure of the degree to which NT (Net
Transfers) has caused a differential between PP and SP. PC is a more complete measure than the
EPC because it provides an indication of total incentive effects of policies including those
influencing factor markets. The PC measures the incentive effects of all policies affecting the
production of black pepper in the Western Region. It appears that as a result of the ungraded and
37 Ahlert et al (1997) Improvement of black pepper quality.38 James P.S., Regina F.M., Effects of treatments prior to sun drying characteristics of pepper. Pp 44-46
55
University of Ghana http://ugspace.ug.edu.gh

lower quality of black pepper as shown the colour and texture of the berries, the prices received by
the black pepper farmers are reasonable. It appears the prices paid by the local markets are realistic
if you take into consideration the quality of the black pepper fruits. To improve on the prices
received post harvest technology should be looked at critically. Processing of black pepper fruits
should be encouraged and diversified products of black pepper like pepper oleoresin40 and pepper
oil should be looked at so as to be able to tap the full potential of the crop.41
4.5 Constraints in the production of black pepper
Black pepper is considered as a minor crop in Ghana, and hence it is considered insignificant in the
total agricultural economy of Ghana. As it is regarded as a minor crop, it does not the get the
priority it deserves in national planning. For example, in the Medium Term Agricuktural
Development Plan (MTADP, 1990) and the Food and Agriculture Sector Development Programme
(FASDEP, 2001), there are no specific plans for the promotion and development of black pepper.
Spices in general are given low priority in research programmes in Ghana as they are regarded as
minor crops. International agencies have also failed to attach importance to research into spices.
Research in post-harvest technology and quality upgrading has almost been non-existent.
The production of black pepper in the Western Region is characterized by very small farms (on the
average 0.5 acre) and old farmers (an average age of 47 years). Because of the small quantities
produced and their independent quality, some countries have been forced to sell spices at low
prices. These sales have had the effect of bringing down international prices to significant lower
levels.
39 Risfaheri, Tatang-Hidayat (1994) Effects of treatments prior to sun drying on black pepper quality.40 Mathew A.G., (1993) Pepper oleoresin, Pp. 4-1141 Verghese, J. (1987) Black pepper oleoresin manufacture and utilization: The isolation of oleoresin black pepper by
solvent extraction, Pp 1-20.56
University of Ghana http://ugspace.ug.edu.gh

A study on black pepper in India showed that black pepper is exported at different moisture levels,
with pepper at lower moisture levels attracting the higher prices. In monetary terms, a drop of
moisture content of 1% means price equivalent gain of 10 kg for every tonne of black pepper. The
absence of clear and uniform international standards for moisture levels creates difficulties for
shippers.
Another identified constraint was the cost of tradable inputs that constituted 4% of identified
constraints. In the black pepper industry exporters have often neglected to take note of quality
concerns, importers have also not been effective in conveying their quality norms to the exporting
countries. Rejection of spice consignments and further negotiations on price adjustments are quite
common in the trade. Communication on the user companies’ problems with the quality of the
spices they obtain is likewise almost non-exist. In the present trading context, this has become a
major issue in the spice industry.
In most developing countries exporters of the crop do not have the capacity to meet the
requirements for quality management systems that are being imposed on the international markets.
ISO 9000 certification and Hazard Analysis at Critical Control Points (HACCP) is now an
essential tool in the management of food processing companies. HACCP strategies have major
implications for producing countries. The correct use and application of permissible pesticides,
proper harvesting, drying and storage technique, the right screening procedures, the hygiene of
processing units and factory workers are issues that need to be addressed. These are not simply
technology issues, they have implication for management, labour relations and farm practices. The
fanners do not have internationally acceptable quality assurance systems, quality upgrade
facilities, grading and processing facilities and scientific warehousing. The deterioration in quality
as a result of unscientific handling and storage has contributed significantly to low unit-value
realization. Though this is the combined effect of poor technology and lack of capital, certain
improvements are possible even with limited resources. In the Western Region the constraint of
technical advice was identified and it 4% of the total identified constraints.57
University of Ghana http://ugspace.ug.edu.gh

Post harvest handling, packaging and transportation are some of the major constraints the farmers
have to overcome in order to tap the full potential of the crop. In relation to the Western Region
post harvest activities constituted 4% of the identified constraints. In the black pepper industry
some buyers do not favour traditional hessian bags and sacks and they are discouraged on
environmental grounds. Black pepper is hygroscopic in nature and needs specialized packaging. In
addition, most shipping lines operate only with containers, which creates special problems for
spices. It appears that the commonly used ventilated containers are not suitable for these products.
Thus the exporters often receive complains about substandard and poor quality deliveries even
though they have shipped good quality products. Enough work has not been done on designing
containers for black pepper, as they require special handling.
Marketing has been one of the major constraints of the black pepper producers in the Western
Region. The farmers have been very limited role in processing, marketing and distribution
operations, as these activities are done by a company in Accra. This has been essentially due to
lack of adequate technology, research and development support and proper packaging. Inadequate
market support and the lack of clear market strategy have also contributed to the situation. Widely
fluctuating prices and low prices have affected the ability of black pepper farmers to improve upon
their performance. This is partly due to the indifference of the black pepper producing community
to carry out joint efforts to press for acceptable minimum levels of quality and to establish
effective marketing operations. In the Western Region the production of black pepper is unplanned
and the farmers are price takers from itinerant buyers, and the analysis showed that marketing
problem was of a high priority occupying the first position on the identified constraints with a
percentage of 45%.
Another constraint is that there is no coordination between research, extension, marketing and
quality improvement in the production of black pepper. The lack of financing and investment in
both black pepper production and processing has also been a major problem, and this regard
58
University of Ghana http://ugspace.ug.edu.gh

financing in general was the second on the identified priorities constituting 35% of identified
constraints.
Summary of findings
From the foregoing analysis the findings can be summed up as follows: There is comparative
advantage of black pepper production as shown by the SP of 2,556,000 and DRC of 0.34. To
further improve on the comparative advantage there is the need to take a critical look at the land
tenure system in the country and to introduce micro finance activities to help the farmers, as the
black pepper crop is perennial one. The land tenure system is important, as the crop can be
harvested for thirty years and even more if good crop maintenance practices are adhered to. The
production of black pepper is competitive as shown by the PP of 1,887,250 and the PCR of 0.39.
The price paid to black pepper farmers is a little below the international prices as shown by the
NPC of 0.81 and EPC of 0.26. It should however be noted that the prices received by the farmers
are realistic as the produce is ungraded and of lower quality than the fruits sold on the international
markets.
There are a lot of constraints facing the fanners such as low priority of the crop in national
programmes and plans, lack of research and development, lack of post harvest technology and post
harvest handling of the crop, lack of information flow from the little research to the farmers,
marketing and low prices paid to farmers, finance and others. In relation to post harvest losses,
farmers can be helped to practice sun drying of the berries and keeping them in suitable containers.
59
University of Ghana http://ugspace.ug.edu.gh

Chapter 5
Conclusions and Recommendations
Generally the major conclusions of this study can therefore be summed up as follows: There is
comparative advantage of black pepper production as shown by the SP of 02,556,000 and DRC of
0.34. To further improve on the comparative advantage there is the need to take a critical look at
the land tenure system in the country and to introduce micro finance activities to help the fanners,
as the black pepper is a perennial crop.
The production of black pepper is competitive as shown by the PP of 01,887,250 and the PCR of
0.39. There is the need to take a critical look at the post harvest handling of the crop. The price
paid to the black fanners are a little below the international prices as shown by the NPC of 0.81
and EPC of 0.26. It should be however be noted that the prices received by the farmers are realistic
as the fruits are ungraded and of lower quality than the fruits sold on the international markets.
The recommendations from the study are: The study was used to assess at the economic potential
and constraints of black pepper production in the Western Region of Ghana. To enable the black
pepper fanners to tap the full potential of the crop, there is the urgent need to develop clear
strategies covering the following areas: research and development, post harvest technology, prices
of black pepper, policies for black pepper, training, diversification, marketing, and access to
information.
Research in black pepper production has been given low priority in Ghana. It is the Plant Genetic
Resource Centre (PGRC) at Bunso and the University of Ghana research station at Kade that have
done some research on the production of black pepper. It should be noted that in countries such as
Thailand, India and Indonesia a lot of research has been conducted into black pepper production
and hence it is not surprising that black pepper yields per acre in Thailand is between 2000kg/acre
to 2600kg/acre, whereas in the Western Region the yield of the crop per acre is on the average60
University of Ghana http://ugspace.ug.edu.gh

650kg/acre. The yield per acre in the Western Region is approximately 25% of that of Thailand
due to lack of research into black pepper production. If the farmers are introduced to high yielding
varieties like Balancotta. which some of the farmers have started planting, it will help to increase
the revenue accrued from the cultivation of the crop and help tap the full potential of the crop.
Research and development in the cultivation of spices will be an area of prime importance for
export growth. Research should necessarily focus on productivity, control of pest and diseases, and
the evolution of varieties, which are disease resistant and amendable to integrated pest
management practices. An integrated pest management strategy for black pepper should address
the following:
• The use of pesticides least toxic to natural predators, minimum use of pesticides and
application only when pest damage has reached critical injury level.
• Phasing and timing of the use of pesticides to ensure that the product has the least pesticide
residues.
• Use of selected rather than broad spectrum pesticides and
• Avoidance of highly toxic chemicals such as BHC, DDT, aldrin and chlordane.
• This is very crucial as ISO 9000 certification and Hazard Analysis at Critical Control Points
(HACCP) 42are becoming essential tools in the management of food processing companies.
It should be noted that for now Government have to take the lead to continue funding research
work as it is been done at Bunso and Kade. Non Government Organisation (NGO) like CARE
International and other international organisations should be encouraged to go on promoting
research into black pepper. Economic theory suggests private research will focus on areas where
returns to the research are appropriable and reasonable profits are generated. It means that private
research will only take place when black pepper production is earning very reasonable profits for
42 Developed by the Pillsburg Company to ensure food safety, HACCP principles and procedures have been integrated into the regulatory mechanisms of many countries with a clear focus on the safety and wholesomeness of food
61
University of Ghana http://ugspace.ug.edu.gh

private investors. In the long term Government will encourage private investment into research in
black pepper by easing constraints to private investors. 43
It is very important for Ghana to tap the potential of black pepper so that in the long term we will
be able to earn both internal revenue and foreign exchange. This is because countries like The
Comoros, Grenada, Guatemala, Madagascar, and Tanzania depend solely on spice exports for their
foreign exchange earnings. Brazil, China, India, Indonesia, Malaysia, Sri Lanka, Thailand, Turkey
and Vietnam also earn substantial amounts of foreign exchange from their trade in spices.44
It is necessary to train the farmers in the post harvest technology and develop structures for
handling and marketing of black pepper 45 Blanching of black pepper prior to sun drying gives the
fruits a uniform black colour. Blanching in warm water for between 1.5 to 5 minutes prior to sun
drying accelerated both the browning and the rate of drying. The black pepper has an attractive
colour with an excellent and strong aroma when the blanching technology was used.46 In the long
term, however, black pepper farmers should be helped to improve the quality of their fruits so that
they are comparable to internationally acceptable quality assurance systems, quality upgrade
facilities, grading and processing facilities and scientific warehousing.47
Some of the macro cleanliness issues can be taken care by adopting modem drying, processing and
packaging technologies. Technical assistance should be sought by Government to help in
developing simple drying equipments. Government can take the initiative to seek assistance from
international organizations to help in this direction, as the long-term objective is to export black
pepper. It is necessary to make processors and exporters aware of the advantages of shifting to new
technology as quality products earn more revenue. It is important to create a strong scientific team
for use, upkeep, and maintenance of the technology acquired, as well as for adapting the
43 Pray C. E, Umali-Deminger D. The private sector in agricultural research systems: will it fill the gap?44 Nandakumar T. (1996) The Global Spice Trade and the Uruguay round agreements, Geneva.45 Ahlert et al (1997) Improvement of black pepper quality46 Risfaheri, Tatang-Hidayat (1994) Effects of treatments prior to sun drying on black pepper quality.47 Mathew A.G. Black pepper: grading for end users. Pp 8-14
62
University of Ghana http://ugspace.ug.edu.gh

technology to local use and for upgrading when it becomes necessary. Technology does not
necessarily mean sophisticated imports of equipments from developed countries. Very often,
simple interventions at the farm level can make a difference to the quality and sanitation levels of
the product. The development of such technology has to come out of local research and
development efforts based on observations and market demand driven. There could be zero-cost
interventions during post harvest handling and processing which will not only add to the value of
the product but will also make them acceptable in sophisticated markets.48
It is necessary to train the farmers in post harvest technology and to develop a new structure of
organization for handling and selling pepper. Problems of quality maintenance have been
encountered with the introduction of box containers for the transport of spices from tropical
producer countries to temperate importer countries. The findings of a study of the Natural
Resources Institute (NRI) England, with black pepper reported that the wetting problem is
interpreted as arising from the body of the pepper cargo to the container headspace when a
temperature differential develops between the cargo and external environment. Open sided
containers with suitable modifications to handling practices are considered the most suitable for
avoiding the problem.49 So these should give the technical experts the nature of container vessel
that may be suitable for black pepper handling to maintain the quality of the crop from the
producers to the buyers.
In the Western Region black pepper farmers are receiving 80% of the world price of black pepper
on the average. This is realistic if you take into consideration that the black pepper fruits by the
farmers in the Western Region are ungraded and of lower quality. This is an improvement as
CARE International has linked these farmers to a lead farmer who processes the black pepper
before selling them to the supermarkets and restaurants. To further improve on the prices received
by the farmers there is the need for the farmers to form an association that will be their mouthpiece
48 Sandhu H.K. (1993) India’s export share of black pepper in the world trade: an econometric analysis, Pp. 113-11849 Gough M. C. (1993) Quality maintenance during container vessel shipment of black pepper.
63
University of Ghana http://ugspace.ug.edu.gh

to negotiate with the buyers for better prices for the crop. This will help as farmers who produce
quality berries are rewarded in the form of higher prices. As a result of quality products of black
pepper, black pepper is sold under geographic names such as Lampong black, Muntok white,
Malabar pepper and Sarawak pepper.50 If the black pepper farmers are able to have a reputation for
the production of quality crops, they can propose as a group for suitable regulations and
legislations to convert these into brand names for better price realisation. There should be effective
coordination between research, extension, marketing and quality improvement. In the long term
there should be a suitable mechanism or agency to look at the twin objectives of higher export
earnings and higher returns to farmers.
As the long-term objective is to export black pepper, there is the need to be aware of the widely
fluctuating prices of black pepper. After experimenting with price cartels, state trading and support
prices, some countries are beginning to realize the importance of setting up commodity futures
market in their own countries with support of other producing countries. An example is the
initiative taken by the International Pepper Community (IPC), which had advocated for an
international commodity futures exchange for black pepper in India and Malaysia. Such
commodity exchanges would stabilize prices to some extent, giving farmers the possibility of
predicting price trends and making investment decisions accordingly. 51 In relation to the
Ghanaian black pepper farmers producing high quality berries, branding quality berries, forming
groups to have a common mouth piece, and improvement of post harvest handling of the berries
will help them to cope with the price instability.
The International Pepper Community has already mooted a proposal to set up an international
pepper futures exchange. UNCTAD has prepared a report52 recommending with certain
reservations, the setting up of such an exchange. FAO (1995) has noted that the considerable
50 Rachim-Kartabrata (1994) The role of the Indonesian pepper in the world market, Pp. 13-19.51 Bade J., Smith H.P. (1998) Cooperation among the IPC member countries in the development and use of computer
simulation model for forecasting supply and demand of pepper and pepper products.52 Feasibility study on a worldwide pepper futures contract. (UNCTAD/ COM/64, October 1995).
64
University of Ghana http://ugspace.ug.edu.gh

redistribution of price risks internationally and nationally following liberalization raises questions
on the economic and social consequences of exposing agricultural producers to the world price
volatility, in addition to the often more substantial risks that run from natural factors which affect
the year to year quantity produced. In general, exposing the fanners and small traders to the full
brunt of the world market price volatility lies in the use of market based risk management
instruments. The International Finance Corporation has also observed53that futures and options
markets, hitherto favoured only by developed countries, have shown significant growth in
developing economies in the recent past.
In Ghana, spices in general are considered as minor crops and hence there are no specific policies
for individual crops like black pepper. To be able to tap the full potential of black pepper, there
should be specific policies for the crop. Policies should be specific, pragmatic and geared toward
efficiency in production, generalized policies, which lack proper direction will only compound
problems and create complexities in tapping the full potential of the crop. It is sad to note that in
the Medium Term Agricultural Development Plan (MTADP) and Food and Agriculture Sector
Development Programme (FASDEP) there are no specific policies for black pepper.
As in the long term the aim is to export black pepper, information technology is one of the major
areas that are crucial to tap the potential of black pepper production. While countries are rapidly
changing their regulations on food safety standards, related information is not easily available to
all interested parties. It will in practice take a long time before all concerned in producing countries
understands the details of any regulation. This is an area where international organizations like
ITC, UNDP and FAO can play an active role.
It is not enough for Governments and research agencies to receive information. It is necessary to
have a system that will interpret the concerns of the international markets to producing regions and
53 In a paper entitled Emerging futures and options markets- an overview of issues and prospects in developing countries.
65
University of Ghana http://ugspace.ug.edu.gh

farmers. Effective extension machinery supported by a multi media campaign, with training
programmes, interaction seminars and the active involvement of NGOs is essential to achieving
results. Cooperation amoung DPC member countries in the development and use of computer
simulation model of forecasting supply and demand of pepper and pepper products have been very
useful.
The training of farmers and processors is also essential part of this strategy. This training needs to
be simple and should be directed to acceptable and understandable levels of technology. The
message should be such that fanners can add more value to the product by improving its quality
and sanitation levels.54 Traders and exporters must also learn to specify quality and sanitation
levels in their purchasing specifications. In this way, they can play an integral part in the overall
strategy for improvement. It is also necessary to have qualified scientists capable of using and
maintaining such equipments. These scientists must have been trained in reputable laboratories
before they assume their duties.
Considerable advances have been made in recent years in the diversification of value added
processed products from pepper which are in great demand. There are three major groups:
• Black pepper based products, such as pepper oil and pepper oleoresin;
• Pepper by-products for medicinal, culinary and industrial purposes;558 and
• Green pepper products, including frozen green pepper and white pepper products.
Marketing has been one of the black pepper producer’s weakest areas. However, the marketing
system is imperfect, characterized by oligopsony. Farmers are generally price takers rather than
price makers and sell to local itinerant dealers, who in turn sell to chop bars, restaurants and hotels.
There are very little or virtually no institutional buyers now. There is the need for the black pepper
fanners to form an association so as to have a common mouthpiece to negotiate with the buyers so
as to obtain prices, which are reasonable for the black pepper fanners.
54 Battock M. (1991) Processing of black pepper. Pp 8,9.55 Pruthi J.S. (1990) Diversification in pepper utilization 1 Green pepper products.
66
University of Ghana http://ugspace.ug.edu.gh

These recommendations are specific to the black pepper farmers in the Western Region. But
adapting it to other black pepper farmers in other regions could use the same principles in the
recommendations.
Finally, it is recommended that future studies focus on relative profitability of black pepper vis-a-
vis other spices, crops, and other farm production models such as linear programming.
67
University of Ghana http://ugspace.ug.edu.gh

Appendix 1
World imports, by type of spice (1995)
Spice Quantity (tonnes) % share
Pepper 155,000 34.45
Capsicum 100,000 22.22
Spice seeds 75,000 16.67
Cinnamon and cassia 33,000 7.33
Turmeric 30,000 6.67
Ginger (dry) 18,000 4.00
Nutmeg and mace 14,000 3.11
Cardamon 14,000 3.11
Cloves 10,000 2.22
Curry powder 6,000 1.33
Vanilla 2,000 0.44
Pimento 2,000 0.44
Saffron 30-50 0.1
Source: International Trade Centre, International Pepper Community and the
Commonwealth Secretariat
68
University of Ghana http://ugspace.ug.edu.gh

Appendix 2
World exports of spices, by country and value (1995)Exporter Value ($ million) % share in the world total
Indonesia 139.8 10.21
Singapore 128.4 9.38
India 119.2 8.71
China 107.8 7.88
Germany 58.7 4.29
Spain 56.1 4.10
United States 50.7 3.70
Hong Kong 50.3 3.67
Madagascar 44.4 3.24
Turkey 44.2 3.23
Netherlands 40.7 2.97
Guatemala 39.8 2.91
Brazil 35.3 2.58
France 35.0 2.56
United Arab Emirates 32.3 2.36
Sri Lanka 30.8 2.25
Malaysia 27.8 2.03
United Kingdom 20.2 1.48
Iran 20.1 1.47
Vietnam 20.1 1.47
Comoros 17.8 1.30
Thailand 14.5 1.06
Hungary 13.3 0.97
Myanmar 13.2 0.96
Pakistan 12.3 0.90
Syrian Arab Republic 12.1 0.88
South Africa 11.6 0.85
Others 172.3 12.60
Total 1,368.8 100.00
69
University of Ghana http://ugspace.ug.edu.gh

Appendix 3
Foreign Exchange Earnings by Agriculture and Non-Agriculture sectors, 1990 to 2002 in
Ghana (US$ millions)
Cocoa Timber Non-
Traditional
Non-
Agriculture
Total
Year Amount % Amount % Amount % Amount % Amount %
1990 361 40.3 118 13.2 29 3.2 387 43.2 895 100.0
1991 347 34.8 124 12.4 34 3.4 493 49.4 998 100.0
1992 277 28.1 114 11.0 22 2.2 526 53.3 986 100.0
1993 251 23.6 147 13.8 26 2.4 606 57.0 1,064 100.0
1994 295 23.8 165 13.3 39 3.2 714 57.7 1,238 100.0
1995 361 25.2 191 13.3 28 2.0 823 57.5 1,431 100.0
1996 480 30.6 147 9.4 50 3.2 823 52.4 1,570 100.0
1997 385 25.8 172 11.5 57 3.8 817 54.1 1,490 100.0
1998 554 30.2 170 9.3 78 4.3 1,028 56.2 1,830 100.0
1999 550 26.2 174 8.3 85 4.1 1,290 61.5 2,099 100.0
2000 437 22.5 175 9.0 75 3.9 1,254 64.6 1,941 100.0
2001 381 20.4 169 9.1 82 4.4 1,235 66.1 1,867 100.0
2002 463 22.4 183 8.9 86 4.2 1,332 64.5 2,064 100.0
Source: Bank of Ghana, Accra.
70
University of Ghana http://ugspace.ug.edu.gh

Appendix 4
Activity budget of black pepper production of one acre of black pepper
(Figures in thousand of cedis)
Summary of Budget Information for One Acre Black Pepper Production in the
Western Region of Ghana
Private Values Social Values Policy
Domestic Factors 1,192,680 1,314,940 9%
Tradables 177,760 150,960 18%
Revenue 3,257,690 4,021,840
Profit 1,887,250 2,556,000
71
University of Ghana http://ugspace.ug.edu.gh

Appendix 5
Costs of domestic factors of the production of one acre of black pepper
Figures are in “000” of cedis
Domestic Factors
Domestic Factors Unit cost in
private prices
Unit cost in
social prices*
Quantity Cost in private
prices
Costs in social
prices
Land preparation. 8.00 8.72 15.00 120.00 130.80
Cost of land
attributable to a
year
100.00 1.00 100.00 100.00
Weed control 8.00 8.72 10.00 80.00 87.20
Gliricidia
planting
8.00 8.72 3.00 24.00 26.16
Transplanting of
black pepper
8.00 8.72 4.00 32.00 34.88
Prunning 8.00 8.72 3.00 24.00 26.16
Harvesting 8.00 8.72 4.00 32.00 34.88
Drying 8.00 8.72 3.00 24.00 26.16
Staking 8.00 8.72 2.00 16.00 17.44
Disease control 8.00 8.72 2.00 16.00 17.44
Ladder 1.00 80.00 1.00 80.00 80.00
Polythene sheets 10.00 10.00 10.00 100.00 100.00
Black pepper
seedlings
1.00 1.00 340.00 340.00 340.00
Extension
services
200.00 218.00
Miscellaneous 46.68 75.82
TOTAL 1,192.68 1,314.94
*Tax on domestic factors was 9%
72
University of Ghana http://ugspace.ug.edu.gh

Appendix 6
Costs of tradable inputs of the production of one acre of black pepper
Tradables
Figures are in “000” of cedis
Item Private prices Conversion factor
from private to social
prices*
Social prices
Farm tools/cutlass 32,000 0.82 26,240
Agrochemicals/Fertiliz
er and pesticides
135,000 0.82 110,700
Miscellaneous 10,760 13,960
TOTAL 177,760 150,900
* The tax on tradables was 18%.
73
University of Ghana http://ugspace.ug.edu.gh

References
Abad A.G. “The Tobacco Industry: Comparative advantage and impact of economic policies”
MSc. Thesis UPLB, 1982.
Ajovi N.R.A. “The economies of rice production systems in Southern Benin: potential, constraints
and perspectives” Pp. 215-219, 1996
Akrasanee N., Wattananukit A. “Comparative advantage in rice production in Thailand” Food
Research Institute Studies, Volume XV, No. 2,Pp 177-212, 1976.
Akromah R. Resource paper presented at the black pepper workshop for Agricultural personnel in
the Sefwi districts organized by Ghana Export Promotion Council in collaboration
with Ministry Of Food and Agriculture, 25-27* November 1991.
Asuming-Brempong “Comparative advantage and Rice policy in Ghana”. A Thesis submitted to
the Faculty of the Graduate School, University of Philippines at Los Banos, 1987.
Ayele G., Heidures F. “Economic returns of vertisol innovation: an empirical analysis of
smallholder mixed farming in the highlands of Ethiopia.” University of
Hohenheim,1999.
Bade J., Smith P. “Cooperation among IPC countries in the development and use of computer
simulation model for forecasting supply and demand of pepper and pepper
products.” Economic and Social Institute, Free University, Amsterdam,
Netherlands. A report of the first phase of the project for the development of a
computer simulation model for forecasting the supply and demand of black pepper
and black pepper products, November 1988.
Battock M. “Processing of black pepper.” Research station, Department of Minor Export Crops,
Matale, Sri Lanka, Pp 97-102, 1991.
Blacklock, J.G. “A short history of black pepper culture with special references to Sarawak,
Tropical Agriculture.” Pp 97-102, 1954.
Brandao A.L., Tafani R.K, Lima P. “Economic viability of black pepper cultivation in the Cacao74
University of Ghana http://ugspace.ug.edu.gh

region of Bachia. Estimation of investment costs for one hectare of pepper.” 1978.
Braunschweig T., Gotsch N. “Cocoa biotechnology research and issues in competitiveness:
guidelines for assessing potential economic impact.” A study prepared for the
International Services for National Agricultural Research (ISNAR), The Hague,
The Netherlands, 1998.
Bruno M. “The optimal selection of Export-promoting and Import-substituting projects.” Planning
the external sector: Techniques, Problems and Policies, Report on the First
International Seminar on Development Planning, 6-17 September 1965, New York,
United Nations.
Corden W.M. “The theory of protection” Oxford University press, 1971.
Corden W.M. “Protection, Growth and Trade: Essays in international economics.” Oxford, Basil
Blackwell, Pp. 7-29, 1992.
Donnelly Graham “ A foundation in Economics.” Stanley Thoms (Publishers) Limited, England,
Pp. 31,40-56, 1991.
“ Economic analysis of Agricultural Markets.” Market Manual Series, Pp 133,134.
El-Habbab M.S., Jabarin A.S. “ The impact of wheat policy on traditional and modem rainfed
wheat production in Jordan.” Department of Agricultural Economics and Extension,
University of Jordan, Amman, Jordan Pp. 7-29, 1992
Food and Agriculture Organization of the United Nations. “Comparative advantage of agriculture
production systems and its policy implications in Pakistan.” FAO Economic and
Social development paper (68), p.2 Rome.
Gittinger P.J., “Economic analysis of Agricultural projects” Economic Development Institute of
the World Bank, The John Hopkins University Press, Baltimore and London, Edi
Series in Economic Development, Pp. 133,134,1982.
Gotsch and G. Brown, “Prices, Taxes and Subsidies in Pakistan Agriculture.” World Bank Staff
Working Paper NO. 387, Washington D.C., Pp 70,71, April 1980.
Gough M.C., Green C. L.,’’Quality maintenance during container vessel shipment of black
75
University of Ghana http://ugspace.ug.edu.gh

pepper.” Natural Resource Institute, Tropical Science, United Kingdom Pp. 390-
400, 1993.
Ingram D.W., Pearson S.R., “ The impact of investment concessions on the profitability of selected
firms in Ghana.” Economic development and cultural change 29 Pp 831-839
(July 1981).
James P.S., Regina F.M., “Sundrying characteristics of pepper.” Regional Research Station, Kerala
Agricultural University, Pattambi, India, Pp 44-46, October 1992.
Joint Integrated Technical Assistance Programme (JITAP) Report ITC/DTCC/GHA/ 11/04
International Trade Centre, UNCTAD/World Trade Organization, March 2000
p. 196.4
Krueger O.A., “Some economic costs of exchange control: The Turkish case”, Journal of Political
Economy 74, Pp. 466-480, October 1966.
Lane D.A., “The Forest Vegetation. ’’Oxford University Press, 1962.
Mathew A.G., “Pepper oleoresin.” International Pepper News Pp 9-13,1993
Monke and Pearson “The Policy Analysis Matrix for Agricultural Development.” Cornell
University Press, Ithaca, Pp 97-102,1989.
Mustika L, Rachmat S.A., Sudradjat D. “The influence of organic matter on the growth of black
pepper and antagonistic microorganisms.” Journal of Spice and Medicinal Crops
Research, International Pepper News Bulletin, April 1994, Pp 19-24, 1994.
Nandakumar T. “The Global Spice Trade and the Uruguay round agreements.” Geneva, p.6, 1990.
Nuijannah R. and Gotsch C. “Agricultural policy analysis course-computer exercises.” Food
Research Institute, Standard University Palo Alto, CA, USA (July 1989)
Naijannah N., Hidayat T. “Small scale equipment for pepper processing at farm level in
Indonesia.” International Pepper News Bulletin, Indonesia, Pp. 20-26, October
Nyamekye-Boamah K. “Post harvests handling of black pepper and its products.”
UNDPPGHA/87/004.
Nyanteng V.K., Dapaah S.K., “Agricultural Development Policies and Options.” Pp.69
Odermatt and Santiago “Comparative profitability of dairy production in Mexico.” 1997.76
University of Ghana http://ugspace.ug.edu.gh

Osafo K. “Rice policy in Ghana.” Stanford University Michigan, USA, 1983.
Omankutty M., Matthew A.G., “Oils and oleoresins from major spices.” Pp 1-20,1982.
Pearson S.R., Merger P.K., “ Comparative advantage among African coffee producers.” American
journal of Agricultural Economics vol. 56,1974.
Pearson S.R., “Rice in West Africa: Policy and Economics.” Stanford University press, 1981.
Pichai-Saranrom “Production and trade of pepper in Thailand.” Malaysia Agricultural Journal, Pp
25-30,1993.
Popsil F., Karikari S.K., Boamah-Mensah E., “Black pepper and its potential as a spice in Ghana.”
University of Ghana Agricultural Research Station, Kade, Ghana, 1972.
Pray C.E. Umali-Deininger D. “The private sector in the agricultural research systems: will it fill
the gap?” Rutgers University, New Brunswick, New Jersey, USA, Ppl 127-1148.
Pruthi J.S., “Diversification in pepper utilization.” Carishma Food Consultancy Service, Chanakya
Puri, New Delhi, India, Pepper News Pp 2-9 April 1990.
Purseglove J.W., Brown E.G., Green C.L., Robbins S.R. “Spices - Tropical Agricultural Series.”
Longman Scientific and Technical Group Limited, vol. 1, 1987.
Rachim-kartabrata “The role of Indonesia pepper in the world market.” Association of Indonesia
Pepper Exporters, Jakarta, Java, Indonesia, International Pepper News Bulletin,
Indonesia, January Pp 13-19,1994.
Rosegrant M.W., Gonzales L.A., Bonis H.E., Sison J.F. “Price and investment policies for food
crop sector growth in Philippines.’ International food policy research institute,
Washington D.C., 1987.
Risfaheri, Tatang-Hidayat “Effects of treatments prior to sun drying on black pepper quality”
Research Institute for Spice and Medicinal Crops, Bogov, Java, Indonesia,
International Pepper News Bulletin, Indonesia, Pp. 9-12, July 1994.
Rusli S., Nurdjannah N., “Handling and processing of black pepper” Indonesian-Agricultural
Research Institute for Spice and Medicinal Crops, Bogov, Java, Indonesia,
Pp. 38-43,1993
Sandhu H.K., “India’s export share of black pepper in the world trade: an econometric analysis.”77
University of Ghana http://ugspace.ug.edu.gh

Indian Economic Journal, Department of Economics and Sociology, Agricultural
University, Ludhiana, Punjab, India, Pp. 113-118, 1993.
Saini G.R., “Choice of inputs in agriculture: a sturdy of social profitability of irrigation and
fertilizers.” Directorate of Economics and Statistics, Ministry of Agriculture, New
Delhi, India, Pp 289-298, 1982.
Shankarikutty B., Narayanan C. S., Rajaran K., Sumathikutty M.A., Omankutty M., Mathew A.G.,
“Oils and oleoresins from major spices” Regional Research Laboratory, Council of
Scientific and Industrial Research (CSIR), Trivandrum, Kerala, India, Journal of
Plantation Crops, Pp. 1-20, June 1982.
The Ghana Farmer, Volume XVI December 1972.
The Public Ledger, Global Commodities Daily, April 14,1995.
The Public Ledger, Global Commodities Daily, July 15,1996. * a ' t
“The State of the Ghanaian Economy” Published by the Institute of Statistical Social and
Economic Research (ISSER), p.77, 1991.
UNCTAD Commodity Yearbook 1995 (United Nations publications sales No. E/F11.D.25)
United Nations “Evaluation of Agricultural Policies in The Hashemite Kingdom of Jordan: Policy
Analysis Matrix Approach.” New York.
Unnevehr L.J., “The changing comparative advantage in Philippine rice production. IRRI
Agricultural Economics paper”, 1984.
Verghese J., ‘Black pepper oleoresin manufacture and utilization: the isolation of oleoresin black
pepper by solvent extraction.” Synthite Industrial Chemicals, Kolenchery, Kerala,
India, Pepper News, Indonesia, Pp 4-11, May 1987.
Yau P.Y., Tham K.C., Kadmin B. “Preliminary findings on active rot distribution of pepper on
different supports using 32P tracer.” Horticulture Research Division, Malaysia
Agrcultural Research and Development Institute (MARDI), Serdang, Selangor,
Malaysia, MARDI - Research Journal, Malaysia, Pp 195-200 December 1993.
ZulkiflyE. “Prospects of implementing organic farming on pepper.” Research Institute for
Spice
I
78
University of Ghana http://ugspace.ug.edu.gh

and Medicinal Crops, Bogor, Java, Indonesia, Pp. 24-30, April 1996.
79
University of Ghana http://ugspace.ug.edu.gh

questionnaire for black pepper
SECTION A: GENERAL INFORMATION1. Name of farm ......................................................................2. Name of farmer....................................................................3. Town / Village.................................. Region......................
SECTION.B: DEMOGRAPHIC CHARACTERISTICS4. Age of respondent:
< 20 years = 121 - 30 years = 231 - 40 years = 341 - 50 years = 4
> 50 years = 55. Gender:
Male = 1 Female =2
6. Level of Education:Primary / JSS = 1 Secondary/SSS =2 Post- secondary = 3 Tertiary = 4No education = 5Other (Specify) = 6
7. Marital statusSingle = 1 Married = 2 Divorced =3 Separated = 4 Widowed =5
8. Are you the head of your household?Yes =1 No =2
9. How many years have you been cultivating black pepper?< 1 year = 1
1-3 years = 2 4-6 years =3 7-9 years =4
10-12 years = 510. Household composition and education
Age Group Male Female Number in school
Number not in school
Numbercompletedschool
Under 10 years11-30 years18-30 years> 30 years
SECTION C: LAND TENURE11. Are you a native of where your farmland is?
Yes =1 No =2
80
University of Ghana http://ugspace.ug.edu.gh

12. Do you own the land on which you farm?Yes =1 No =2
IF YES, HOW DID YOU ACQUIRE THE LAND?Purchase = 1Inherited = 2Other (Specify) =3
13. IF NO, WHAT TITLE DO YOU HOLD TO THE LAND?Leasehold = 1Sharecropping =2 Rental = 3Family = 4Other (Specify)= 5
IF LEASEHOLD: LENGTH OF LEASE; PAYMENTS PER YEAR.IF SHARECROPPING: TYPE (ABUNU; ABUSA; DURATION OF TENURE).................IF RENT: ANNUAL RENT; CONDITIONS FOR CONTINUED USE OF LAND..............IF FAMILY LAND: OBLIGATIONS TO OTHER FAMILY MEMBERS:..........................
SECTIOND: COMMUNITY ORGANIZATION14. Do you belong to any association or group? (Not political groups)
Yes =1 No =2
15. If Yes, what type of association / group do you belong?Social = 1Economic = 2Religion = 3N/A =4
16. Do you hold any leadership position within the group / association?Yes =1 No =2
17. What benefit do you get or derive from the group or association? (From membership)Learn trade / vocation = 1 Financial assistance = 2 Moral / Social support = 3 Other (Specify) = 4
WHAT ARE YOUR OBLIGATIONS TO THE GROUP OR ASSOCIATION?SECTION E: AGRICULTURAL PRODUCTION18. CROPS CULTIVATED
Main Crops Acreage/ acre Production Unit CroppingSystem
Major/ Minor Major/ Minor Major/ Minor Major/ Minor1.2.3.
19. Main source of water for farming.Rained = 1 Irrigation =2 Both = 3
PROCESSING20. Do you process any of your produce?
Yes =1 No =2
81
University of Ghana http://ugspace.ug.edu.gh

21. If yes, what type of produce do you process?Black pepper berries =1 Other (Specify) = 2
22. Methods of processing employed.Traditional = 1Mechanized = 2Both = 3
MARKETING23. Where do you sell your farm produce? (Both black pepper and other crops)
Local market = 1Farm gate = 2Outside market =3 N/A =4
24. If you sell in a market, how far is it from your town?< 1km =1 1-3 km =2 4-5 km =3 > 5 km = 4
N/A =525 .How frequent is the market day?
Daily = 1Weekly =2Twice a week = 3N/A =4Other (Specify) = 5
26.How do you transport your produce to the market?Head loading = 1Bicycle = 2Draught animal = 3Motor vehicle/ track = 4 Boat / Canoe = 5N/A =6
27. What is the nature of the road to the market?Good =1 Fair =2 Poor = 3 N/A =4
28. Do you have access to Extension services?Yes =1 No =2
29. If Yes, how often?Weekly = 1Fortnightly = 2Once a month = 3 Irregular = 4
30. Are the messages / advice useful?Yes =1 No =2 N/A =3
31. If yes, do you adopt them?Yes =1 No =2 N/A =3
82
University of Ghana http://ugspace.ug.edu.gh

32. If No, why?Expensive inputs = 1 Inputs not available = 2 Message is complex = 3 Others (Specify) = 4 N/A =5
33. Do you purchase agricultural inputs?
Type of input Source of input Cost of input/ unit1.2.3.
Yes =1 No =2
34. If yes, what type of inputs do you purchase?Seeds / Planting materials Agric. implements Fertilizers =Agrochemicals N/A
35. Is the input readily available?Yes =1 No =2 N/A =3
SECTION F: AGRICULTURAL FINANCE36. What is your main source of funding for the farm activities?
Own funds = 1 Formal credit = 2 Informal credit = 3 Other (Specify) =4
37. What do you mainly use the credit for?Payment for hired labour = 1 Purchase of inputs = 2Other (Specify) = 3N/A =4
38. If you use credit, is it easy to obtain?Yes =1 No =2 N/A =3
SECTION G: LABOUR39. What is your main source of labour?
Family labour = 1 Hired labour = 2Neighbours = 3Other (Specify) = 4
40. If hired labour, is it readily available?Yes =1 No =2 N/A = 3
41. If No, state why?.....................................................................
= 1 = 2 = 3 = 4 = 5
83
University of Ghana http://ugspace.ug.edu.gh

SECTION H: INCOME AND EXPENDITURE42. What are your main sources of income?
Agricultural activities = 1Non-agricultural activities = 2 Remittances = 3Other (Specify) = 4
43. If agricultural, state type of produce, quantity sold and price per unit
Type of produce
Quantity sold Unit of sale Price per unit Total revenue
1.2.3.4.5.6.7.
44. If non- agricultural activities, state type of activity and revenue derived from sales.
Type of non-farming activity Total revenue/ month1.2.3.4.5.6.7.
45. State total remittances received last year?
84
University of Ghana http://ugspace.ug.edu.gh