University of Dundee Periprostatic Fat Adipokines ...
32
University of Dundee Periprostatic Fat Adipokines Expression Correlated with Prostate Cancer Aggressiveness in Men Undergoing Radical Prostatectomy for Clinically Localised Disease Dahran, Naief; Szewczyk-Bieda, Magdalena; Vinnicombe, Sarah; Fleming, Stewart; Nabi, Ghulam Published in: BJU International DOI: 10.1111/bju.14469 Publication date: 2019 Document Version Peer reviewed version Link to publication in Discovery Research Portal Citation for published version (APA): Dahran, N., Szewczyk-Bieda, M., Vinnicombe, S., Fleming, S., & Nabi, G. (2019). Periprostatic Fat Adipokines Expression Correlated with Prostate Cancer Aggressiveness in Men Undergoing Radical Prostatectomy for Clinically Localised Disease. BJU International, 123(6), 985-994. https://doi.org/10.1111/bju.14469 General rights Copyright and moral rights for the publications made accessible in Discovery Research Portal are retained by the authors and/or other copyright owners and it is a condition of accessing publications that users recognise and abide by the legal requirements associated with these rights. • Users may download and print one copy of any publication from Discovery Research Portal for the purpose of private study or research. • You may not further distribute the material or use it for any profit-making activity or commercial gain. • You may freely distribute the URL identifying the publication in the public portal. Take down policy If you believe that this document breaches copyright please contact us providing details, and we will remove access to the work immediately and investigate your claim. Download date: 10. Dec. 2021
Transcript of University of Dundee Periprostatic Fat Adipokines ...
University of Dundee
Periprostatic Fat Adipokines Expression Correlated with Prostate CancerAggressiveness in Men Undergoing Radical Prostatectomy for Clinically LocalisedDiseaseDahran, Naief; Szewczyk-Bieda, Magdalena; Vinnicombe, Sarah; Fleming, Stewart; Nabi,GhulamPublished in:BJU International
DOI:10.1111/bju.14469
Publication date:2019
Document VersionPeer reviewed version
Link to publication in Discovery Research Portal
Citation for published version (APA):Dahran, N., Szewczyk-Bieda, M., Vinnicombe, S., Fleming, S., & Nabi, G. (2019). Periprostatic Fat AdipokinesExpression Correlated with Prostate Cancer Aggressiveness in Men Undergoing Radical Prostatectomy forClinically Localised Disease. BJU International, 123(6), 985-994. https://doi.org/10.1111/bju.14469
General rightsCopyright and moral rights for the publications made accessible in Discovery Research Portal are retained by the authors and/or othercopyright owners and it is a condition of accessing publications that users recognise and abide by the legal requirements associated withthese rights.
• Users may download and print one copy of any publication from Discovery Research Portal for the purpose of private study or research. • You may not further distribute the material or use it for any profit-making activity or commercial gain. • You may freely distribute the URL identifying the publication in the public portal.
Take down policyIf you believe that this document breaches copyright please contact us providing details, and we will remove access to the work immediatelyand investigate your claim.
Download date: 10. Dec. 2021

Periprostatic Fat Adipokines Expression Correlated with
Prostate Cancer Aggressiveness in Men Undergoing Radical
Prostatectomy for Clinically Localised Disease
Naief Dahrana,b
, Magdalena Szewczyk-Biedaa, Sarah Vinnicombe
a, Stewart Fleming
a,
*Ghulam Nabia
a Division of Cancer Research, School of Medicine, University of Dundee, Dundee, DD1 9SY,
UK.
b Department of Anatomy, Faculty of Medicine, University of Jeddah, Jeddah, Saudi Arabia.
*Correspondence to:
Professor Ghulam Nabi Professor of Surgical Uro-Oncology & Consultant Urological Surgeon,
Head of Division for Cancer Research,
Division of Cancer Research, School of Medicine,
University of Dundee
Email: [email protected]
Funding: ND was funded by Kingdom of Saudi Arabia Government for his Ph D.
Conflicts of Interest: None

- 1 -
Abstract
Objectives: To investigate relationship between periprostatic adipose tissue (PPAT)
adipokines expression and PCa aggressiveness using both pathological features of radical
prostatectomy (RP) and multiparametric MRI parameters.
Patients and methods: Sixty-nine men were recruited to assess immunohistochemical
expression of TNFα- and VEGF of periprostatic fat of radical prostate specimens. Percent
immunopositivity was quantified on scanned slides using Aperio Positive Pixel Count
algorithm for PPAT TNFα, VEGF and androgen receptors. Periprostatic fat volume
(PFV) was segmented on contiguous T1-weighted axial MRI slices from the level of the
prostate base to apex. PFV was normalised to prostate volume (PV) to account for
variations in PV (NPFV=PFV/PV). MRI quantitative values (Kep, Ktrans, and ADC) were
measured from PCa primary lesion using OleaSphere software. Patients were stratified
into three groups according to RP GS: ≤6, 7(3+4) and 7(4+3) or more.
Results: The mean rank of VEGF and TNFα were significantly different between the
groups [H(2)= 11.038, p=0.004] and [H(2)=13.086, p=0.001], respectively. Patients with
stage pT3 had higher TNFα (18.2±8.95) positivity than patients with stage pT2
(13.27±10.66), t (67) =-2.03, p=0.047. TNFα expression significantly correlated with
Ktrans (ρ=0.327, p=0.023). TNFα (p=0.043) and VEGF (p= 0.02) correlates with high-
grade PCa (GS≥7) in radical prostatectomy specimens and correlated significantly with
upgradation of Gleason score from biopsy to radical prostatectomy histology.
Conclusions: Expression level of TNFα and VEGF on immunostaining significantly
correlated with aggressivity of PCa. As biomarkers, these suggest the risk of having high-
grade PCa in men undergoing RP.
Keywords: prostate cancer; periprostatic adipose tissue; TNFα; VEGF; MRI; radical
prostatectomy

- 2 -
1 Introduction
Several studies have found an association between periprostatic fat adiposity and the
aggressivity of prostate cancer (PCa) using several different imaging modalities and
measurement techniques [1-3]. In a recent MRI study, we found normalised periprostatic
fat volume (NPFV) to be a significant predictor for high-grade localised prostate cancer
in men opting for radical prostatectomy [4]. However, imaging alone cannot discriminate
between metabolically more active and less active periprostatic adipose tissue (PPAT).
Adipocytes have an important role in synthesizing and storing triglycerides from free
fatty acids (FFA) and in producing adipokines [5-8]) have reported that there are two
kinds of adipocytes: “fat” and “thin”. Besides being storage cells for free-fatty acids (the
major source of energy for the cancer cell), the more active “fat” cells, which are common
in obese populations, may differentiate into “cancer-associated adipocytes” and crosstalk
with cancer cells via a paracrine effect, resulting in the secretion of more inflammatory
adipokines and chemokines (e.g. CCL7), stimulating macrophage infiltration, which in
turn encourages insulin resistance that leads to disease progression and local
dissemination [5, 8-13].
Periprostatic adipose tissue inflammation has been found to be associated with high-grade
PCa [14]. When adipose tissue expands, hypoxia occurs, and certain adipokines become
up-regulated. In response, hypoxia inducible factor 1 alpha (HIF-1α), may interact with
endothelial cells and lead to a reduction in nitric oxide that regulates vasodilation,
stimulates angiogenesis and increases vascular permeability to overcome the hypoxia
[15-17]. Tumour necrosis factor alpha (TNFα) and vascular endothelial growth factor
(VEGF) are adipokines which have been widely implicated for their roles in

- 3 -
tumourigenesis by inducing inflammatory and angiogenic responses, respectively, and
increasing the risk of metastasis [18-24].
Angiogenesis in periprostatic fat may facilitate the seeding of a PCa microenvironment
with adipocyte precursors (lipoblasts), that secrete numerous factors (e.g. IL-6 and TNFα)
involved in the inflammatory response, particularly in pathological conditions such as
obesity [25]. Zhang et al [26] have described that the tumour microenvironment may
contain lipoblasts seeded by visceral fat (VF) through blood vessels. It was suggested that
periprostatic fat has more lipoblasts than VF [27]. Thus, periprostatic fat could be a major
source for seeding the microenvironment of PCa with lipoblasts, facilitating tumour
progression. Understanding the metabolic pathways between PPAT, as an inflammatory
promotor, and PCa could reveal new diagnostic and therapeutic possibilities. Anti-
angiogenic treatments, in combination with radiotherapy, could be successful ways to
treat PCa [28].
This study aimed to:
1. Investigate the correlation between PPAT metabolic activity and prostate cancer
aggressiveness by comparing inflammatory and angiogenic adipokine (TNFα and
VEGF) expression levels in the periprostatic fat with Gleason scores (GS) and
pathological tumour staging (pT).
2. Correlate expression level of adipokines (TNFα and VEGF) with quantifiable
MRI parameters of PCa aggressivity.

4
2 Patients, materials and methods
2.1 Cohort selection and power calculation
This was a prospective study with institutional approval (Caldicott/CSAppGN021211) for
follow-up. A sample size of 69 was calculated based on information from a pilot phase of the
study (n = 15) and a power calculation (Table S1). The pilot phase also evaluated the quality
of immunostaining. Between January 2010 and December 2015, we recruited 69 men with
localised prostate cancer opting for RP. Demographic details were recorded in a database.
Periprostatic-fat tissue sections were selected from the excised prostate surface at three or more
different periprostatic regions. Tissue block sectioning and immunohistochemistry (IHC) were
performed at the Tayside Tissue Biorepository (TBR), Study inclusion criteria were:
• Men with localised prostate cancer (PCa) who underwent Radical Prostatectomy (RP).
• Gleason score and histopathological stage of RP specimens reported and discussed at
multidisciplinary meetings by an experienced uropathologist.
Exclusion criteria were: men with metastatic PCa or those with localised disease who had
external beam radiotherapy/brachytherapy or focal treatment prior to radical surgery. Men
were also excluded if they had hormones in neoadjuvant settings.
The primary aim of the study was evaluation of the magnitude of correlation between the
immunohistochemical expression of PPAT and histopathological parameters of PCa. The
correlation between quantitative MRI parameters and adipokine expression levels was the
secondary aim (Figure S1).

5
2.2 Antibody selection and immunohistochemistry preparation
Table S2 summarises the characteristics of the selected antibodies. Antigen retrieval and
deparaffinisation were performed using a DAKO EnVision™ FLEX Target Retrieval solution
(high pH) buffer (50x conc.) (K8004) in a DAKO PT Link (serial number PT2794Y1205) for
10 minutes at 97°C. Immunostaining using the DAKO EnVision™ FLEX system on a DAKO
Autostainer Link 48 (serial number AS2383D1203) was conducted according to the
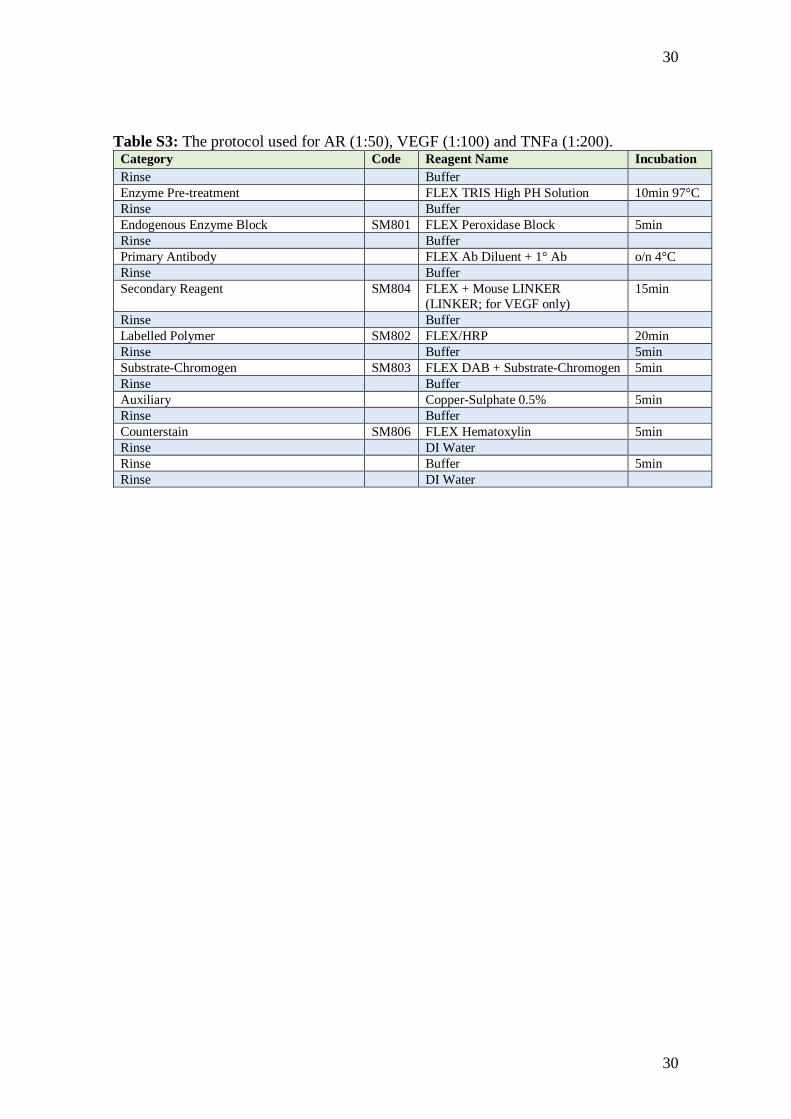
manufacturer’s protocol. Sections were initially washed in a Flex Wash Buffer (K8006). Table
S3 summarises the protocols used for TNFα, VEGF, and AR.
2.3 Immunohistochemistry Analysis
After IHC application, the stained sections were scanned at 40x magnification using a Leica
Aperio® slide scanner and the results assessed employing the local ImageScope (version
12.3.2.1813) for staining quality assessment and the linked online eSlide Manager (version
12.1.0.5029) for digital analysis.
The region of periprostatic adipose tissue (PPAT) was manually selected from different
periprostatic regions. An experienced pathologist (SF) reviewed histopathology reviewed
histopathology and guided selection of regions specifically but not exclusively around tumour
within the prostate gland. We did not include damaged adipose tissue at section edges, blood
vessels, and artefacts. The selected total area on each slide was not less than 30,000m2.
Following standardised parameters, we used the Leica Aperio Positive Pixel Count algorithm
to quantify the positive and negative staining of 3,3’-diaminobenzidine (DAB) and
Hematoxylin (counterstain), respectively (Figure 1). The algorithm automatically analysed the
positive DAB staining of the selected regions into three different coloured pixels: strong
positive (Sp) (red), positive (p) (orange), and weak positive (Wp) (yellow). The Hematoxylin
6
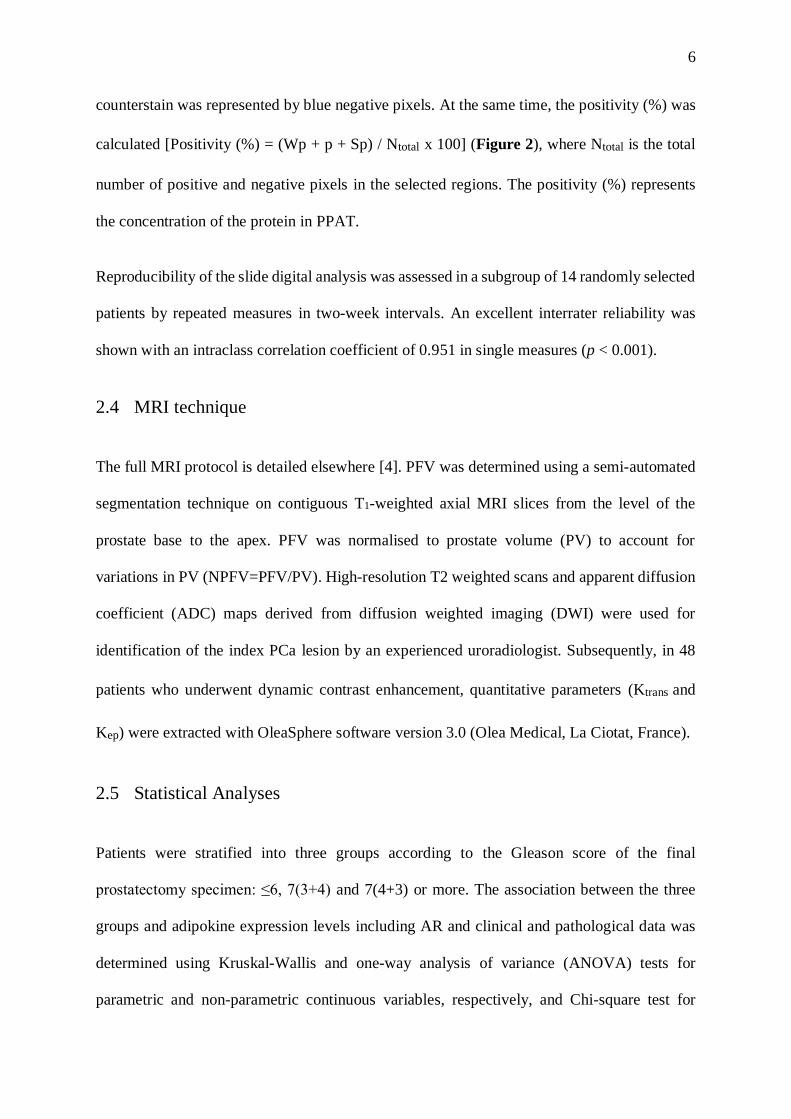
counterstain was represented by blue negative pixels. At the same time, the positivity (%) was
calculated [Positivity (%) = (Wp + p + Sp) / Ntotal x 100] (Figure 2), where Ntotal is the total
number of positive and negative pixels in the selected regions. The positivity (%) represents
the concentration of the protein in PPAT.
Reproducibility of the slide digital analysis was assessed in a subgroup of 14 randomly selected
patients by repeated measures in two-week intervals. An excellent interrater reliability was
shown with an intraclass correlation coefficient of 0.951 in single measures (p < 0.001).
2.4 MRI technique
The full MRI protocol is detailed elsewhere [4]. PFV was determined using a semi-automated
segmentation technique on contiguous T1-weighted axial MRI slices from the level of the
prostate base to the apex. PFV was normalised to prostate volume (PV) to account for
variations in PV (NPFV=PFV/PV). High-resolution T2 weighted scans and apparent diffusion
coefficient (ADC) maps derived from diffusion weighted imaging (DWI) were used for
identification of the index PCa lesion by an experienced uroradiologist. Subsequently, in 48
patients who underwent dynamic contrast enhancement, quantitative parameters (Ktrans and
Kep) were extracted with OleaSphere software version 3.0 (Olea Medical, La Ciotat, France).
2.5 Statistical Analyses
Patients were stratified into three groups according to the Gleason score of the final
prostatectomy specimen: ≤6, 7(3+4) and 7(4+3) or more. The association between the three
groups and adipokine expression levels including AR and clinical and pathological data was
determined using Kruskal-Wallis and one-way analysis of variance (ANOVA) tests for
parametric and non-parametric continuous variables, respectively, and Chi-square test for

7
categorical variables (WHO weight classification, pT stage and D’Amico risk classification).
Receiver Operating Characteristic (ROC) curve analysis was used to test the ability of TNFα
and VEGF to differentiate between high-grade (GS ≥ 7) and low-grade (GS ≤ 6) prostate
cancers. Binary logistic regression analysis was used to establish an independent effect of
TNFα and VEGF on high-grade (GS ≥ 7) vs low-grade (GS ≤ 6) prostate cancers. Independent
sample t-test was used to compare the adipokine levels, AR, functional MRI quantitative values
(Ktrans, Kep, and ADC value) and age with pT and GS upgrading from biopsy specimen to RP.
Spearman correlation coefficients (ρ) were used to evaluate the relationship between the
adipokine levels (TNFα and VEGF), AR, MRI parameters (Ktrans, Kep, and ADC value), NPFV
and pre- and post-operative GS. p value of < 0.05 was considered statistically significant. IBM
Statistical Package for the Social Sciences (SPSS) (version 23) for OS X was used for data
analyses.

8
3 Results
The mean age of the cohort (N=69) was 66.13 ± 5.47 years (range, 53-78), and the mean BMI
was 28.12 ± 4.37 kg/m2 (range, 20.5 - 40.6). According to WHO classification, 17 patients
were classified as normal weight (27.86 %), 27 as overweight (44.26%), 13 as obese class I
(21.31 %), three as obese class II (4.93 %), and 1 as obese class III (1.64%). Table 1
summarises the patients’ characteristics categorised into three groups according to the post-
operative GS based on histopathology.
The mean ranks of the positivity of vascular endothelial growth factor (VEGF) and tumour
necrosis alpha (TNFα) were statistically different between the three groups (GS ≤ 6, GS =
7(3+4) and GS ≥ 7(4+3), with [H (2) = 11.038, p = 0.004] and [H (2) = 13.086, p = 0.001],
respectively (Figure 3). There were no differences in the mean ranks of immunopositivity for
AR between the three groups [H (2) = 1.388, p = 0.5], nor in mean age [H (2) = 1.880, p =
0.391] (Table 1).
After dichotomisation of PCa histopathology into low (GS ≤ 6) and high (GS ≥ 7) grade groups,
ROC curve analysis yielded areas under the curves for TNFα and VEGF of 0.897 (p = 0.001)
and 0.910 (p = 0.001), with Youden’s indices of 9.03 and 4.22, respectively. Use of these cut-
offs provided a sensitivity and specificity for differentiating between low and high-grade
cancers of 74.6% and 100%, respectively for TNFα and 85.7% and 100%, respectively for
VEGF (Figure 4).
Binary logistic regression analysis showed that both TNFα and VEGF could predict the risk of
having high-grade PCa (GS ≥ 7), with odds ratios (OR) of 1.343 (95% CI, 1.01-1.79; p = .043)
and 1.921 (95% CI, 1.11-3.33; p = .02), respectively. A Hosmer-Lemeshow test revealed that
the data fit the model well [𝝌2(8) = 1.81, p = 0.986].

9
Patients with stage pT3 had statistically significantly higher positivity of TNFα (18.2 ± 8.95)
than patients with stage pT2 (13.27 ± 10.66), t (67) = -2.03, p = 0.047. There was no relationship
between AR and VEGF and pT stage of PCa, [t (67) = .458, p = 0.649] and [t (67) = -.547, p =
0.586], respectively).
Mean expression levels of TNFα and VEGF for Gleason score ≤ 6 disease were 4.1 (± 3.7) and
2.8 (±1.1) respectively. In contrast mean levels of expression for TNFα and VEGF for Gleason
score 7 and more disease were 15.4 (±9.7) and 15.1 (±11.3) respectively. There were 22
(31.8%) patients with upgraded GS from biopsy specimen to final RP (14 had Gleason score 6
disease on biopsies and were upgraded to GS 7 or more). Analysis of 20 radical prostatectomy
cases (20/69; 28.9%) diagnosed with Gleason 6 on biopsies showed that 70% (14/20; 70%)
were upgrade to Gleason 7 or more on final histopathology. Performance of expression level
analysis for TNF α and VEGF in those with upgraded disease vs. non-upgraded disease showed
statistically significant differences (Table 2). VEGF expression between the non-upgraded
(2.83 ± 1.18; n = 6) and upgraded (6.85 ± 3.45; n = 14) groups was statistically significant [t
(18) = -2.75, p = 0.013]. Similarly, there was a difference in the mean of TNF α expression
between the non-upgraded (4.11 ± 3.77; n = 6) and upgraded (10.55 ± 8; n = 14) groups with
statistically significance [t (18) = -1.86, p = 0.039]. This suggests a high expression of TNFα
and VEGF in presence of low grade disease on biopsy may indicate presence of high grade
disease in the prostate.
Immunohistochemical expression of TNFα was significantly positively correlated with Ktrans
(ρ = 0.327, p = 0.023), but not with Kep (ρ = 0.162, p = 0.270) or ADC value (ρ = -0.096, p =
0.516). There was no significant correlation between VEGF expressions with any of
quantitative MRI parameters. Table 3 summarises the correlations results.

10
4 Discussion
To our knowledge, this is the first study to investigate the relationship between the
inflammatory and angiogenic adipokine (TNFα and VEGF) expression levels in PPAT and the
aggressivity of PCa by comparing their immunohistochemical expression with Gleason scores
(GS), pathological tumour staging (pT), and quantifiable MR imaging biomarkers. The results
indicate a strong correlation between PPAT TNFα positivity and histopathological GS, as well
as pT stage. We observed that both TNFα and VEGF were significant correlating with the risk
of having high-grade PCa (GS ≥ 7) following RP. However, PPAT androgen receptor
expression had no relationship with either post-operative GS or pT stage. It is, however
interesting to observe that men who were upgraded from low GS on biopsy had statistically
significant different level of expression for both TNFα and VEGF to those who continued to
have low grade disease with similar GS on biopsy and radical prostatectomy histology.
Recent studies [1, 3, 29-31], including our previous study [4], have confirmed the relationship
between the adiposity of periprostatic fat and the aggressivity of PCa. The cross-talk between
PPAT and PCa cells could modify the phenotype and characteristics of closely related
adipocytes, which can become more metabolically active adipocytes called “cancer-associated
adipocytes” [11, 12]. These cells can stimulate and support PCa progression by releasing FFA,
the major source of PCa energy, through lipolysis and secreting adipokines that stimulate
tumour progression through a paracrine effect [12, 32]. This may suggest that both adiposity
and adipokine activity of periprostatic fat have an impact on the aggressivity of PCa. However,
at present, imaging is unable to assess adipokine activity of periprostatic fat. Interestingly,
BMI, the marker of generalised obesity, has no relationship with NPFV nor PCa aggressiveness
indicating that periprostatic fat adiposity is more important than BMI [4].

11
TNFα is a pro-inflammatory and lipolytic adipokine that induces apoptosis and inhibits
carbohydrate metabolism and adipogenesis [33-37]. Serum TNFα has been reported as a
biomarker for PCa diagnosis [20]. As a pro-inflammatory cytokine, it can influence PCa
progression and increase the risk of metastasis [19, 23, 24]. Focusing on PPAT, a study showed
that inflammation was associated with high-grade PCa [14]. PPAT TNFα is higher in obese
men, which contributes to insulin resistance [9, 35, 38-40], but it is not associated with lipolysis
in cachectic patients with gastrointestinal cancers [36]. Ribeiro et al [41] have reported that
TNFα was expressed by approximately 1.7-fold higher in PPAT explants stimulated with a
PC3 human PCa cell line conditioned medium, but not by stromal vascular fractions that did
not contain mature adipocytes, suggesting that mature PPAT adipocytes, the cancer-associated
adipocytes, can significantly crosstalk with PCa cells and secrete larger amount of TNFα [11].
Therefore, we investigated its relation to PCa grading along with staging and found that it was
significantly correlated with the both.
Ktrans, representing the rate of accumulation of gadolinium-based contrast agent in the
extravascular extracellular space, is a measure of capillary permeability. Our study showed that
Ktrans in the primary lesion was significantly correlated with PPAT TNFα but not to PPAT
VEGF. This may reflect the consequence of the inflammatory response of PPAT and increased
vascular permeability leading to transfer of the contrast agent from blood vessels to the
extracellular matrix. It has been reported that PPAT angiogenesis may facilitate seeding of a
PCa microenvironment with adipocyte precursors (lipoblasts) [42]. These lipoblasts secrete
numerous factors (e.g. IL-6 and TNFα) involved in the inflammatory response, particularly in
obesity [25]. Taking all of this into consideration, there is a clear implication that TNFα has a
significant role as a pro-inflammatory adipokine, secreted by activated mature PPAT
adipocytes, together with the angiogenic PPAT VEGF, creating a favourable stromal

12
microenvironment that promotes PCa progression by inducing vascularity and increasing
vascular permeability [43-50], which facilitates seeding PPAT lipoblasts to the PCa tumour
stromal microenvironment [42]. Moreover, as a lipolytic factor, PPAT TNFα may increase the
release of FFA, which has been found to be the major source of PCa energy[32]. The
quantitative Ktrans of primary prostate lesion could provide an estimate of angiogenic activity
of periprostatic fat, however this needs further research.
Our results showed that both TNFα and VEGF positivity at IHC can distinguish between low
(GS ≤ 6) and high (GS ≥ 7) grade PCa. TNFα and VEGF expression levels above 9.03% and
4.22% had a 74.6% and 85.7% chance of having high-grade PCa, respectively. These findings
have strong clinical implications, if externally validated to predict upgrading from GS biopsy
to RP, the practical utility of measuring the expression of TNFα and VEGF in the periprostatic
fat sample during prostate biopsy could be realised, and the level of expression for both could
become a marketable test, similar to Oncotype DX, Prolaris, and Decipher tests, that predict
upgrading and help in decision-making such as in active surveillance versus radical treatment
[51].
Androgens upregulate the adrenoreceptors of catecholamines in adipose tissue, and their
receptors are more prominent in visceral fat than subcutaneous fat [52, 53]. This may indicate
the uptake of the lipolytic catecholamines in visceral fat is higher, leading to the release of
greater amounts of FFA, the major source of PCa energy [32, 52, 53]. Therefore, we included
PPAT AR in our analysis, but did not find any correlation with GS or pT stage.
There are some limitations to our study. The present investigation was a single centre cohort
and the results require further validation through a multicentre design. Quantitative MRI data
was available for only 48 cases in the cohort (we had no imaging data for the remaining 21
cases as they were scanned on 1.5T MRI). Though we demonstrated no correlation between

13
PPAT VEGF and Ktrans of the primary lesion at MRI, a larger sample size might have altered
this result. Although we had only 6 patients in Gleason score 6 diseases, trends do suggest that
periprostatic fat biopsies at the time of prostatic biopsy for immunostaining for inflammatory
biomarkers could represent a time-saving way of obtaining useful information and predicting
aggressive PCa.
In conclusion, PPAT TNFα and VEGF immunostaining was significantly positively correlated
with the aggressivity of PCa (grade and stage) in men undergoing radical prostatectomy for
clinically localised disease. As PCa biomarkers, PPAT metabolic activity measured by
immunohistochemical expression of TNFα and VEGF significantly correlates with the risk of
having high-grade prostate cancer disease including upgradation from prostate biopsy results.

14
5 Acknowledgements
We would like to thank the Tayside Biorepository team (TBR) especially Dr Susan Bray and
Dr Sharon King for their close support in immunohistochemistry slide preparation and digital
scanning to ensure the quality of the study. We also want to thank Dr Petra Rauchhaus from
Dundee Epidemiology and Biostatistics Unit (DEBU) for her supervision in statistical
analyses.

15
Conflicts of interest:
None.
16
References
1. Bhindi B, Trottier G, Elharram M, Fernandes K, Lockwood G, Toi A, Hersey K, Finelli
A, Evans A, van Der Kwast T et al: Measurement of peri-prostatic fat thickness
using transrectal ultrasonography (TRUS): a new risk factor for prostate cancer.
BJU Int 2012, 110(7):980-986.
2. Van Roermund JGH, Hinnen KA, Tolman CJ, Bol GH, Witjes JA, Bosch JLHR,
Kiemeney LA, van Vulpen M: Periprostatic fat correlates with tumour
aggressiveness in prostate cancer patients. Bju International 2010, 107:1775-1779.
3. Woo S, Cho JY, Kim SY, Kim SH: Periprostatic Fat Thickness on MRI: Correlation
With Gleason Score in Prostate Cancer. American Journal of Roentgenology 2015,
204:W43-W47.
4. Dahran N, Szewczyk-Bieda M, Wei C, Vinnicombe S, Nabi G: Normalized
periprostatic fat MRI measurements can predict prostate cancer aggressiveness
in men undergoing radical prostatectomy for clinically localised disease. Scientific
Reports 2017, 7(1):4630.
5. Waki H, Tontonoz P: Endocrine functions of adipose tissue. Annu Rev Pathol 2007,
2:31-56.
6. Bastard JP, Feve B: The secretory face of the adipose cell: a tribute to two queens,
leptin and adiponectin. Biochimie 2012, 94(10):2063-2064.
7. Paz-Filho G, Lim EL, Wong ML, Licinio J: Associations between adipokines and
obesity-related cancer. Front Biosci (Landmark Ed) 2011, 16:1634-1650.
8. Powell K: Obesity: the two faces of fat. Nature 2007, 447(7144):525.
9. Weisberg SP, McCann D, Desai M, Rosenbaum M, Leibel RL, Ferrante AW, Jr.:
Obesity is associated with macrophage accumulation in adipose tissue. J Clin Invest
2003, 112(12):1796-1808.
10. Bastard JP, Maachi M, Lagathu C, Kim MJ, Caron M, Vidal H, Capeau J, Feve B:
Recent advances in the relationship between obesity, inflammation, and insulin
resistance. Eur Cytokine Netw 2006, 17(1):4-12.
11. Muller C: Tumour-surrounding adipocytes are active players in breast cancer
progression. Ann Endocrinol (Paris) 2013, 74:108-110.
12. Nieman KM, Romero IL, Lengyel E, Van Houten B: Adipose tissue and adipocytes
support tumorigenesis and metastasis. Biochimica et Biophysica Acta - Molecular
and Cell Biology of Lipids 2013.
13. Laurent V, Guérard A, Mazerolles C, Le Gonidec S, Toulet A, Nieto L, Zaidi F, Majed
B, Garandeau D, Socrier Y et al: Periprostatic adipocytes act as a driving force for
prostate cancer progression in obesity. 2016, 7:10230.
14. Gucalp A, Iyengar NM, Zhou XK, Giri DD, Falcone DJ, Wang H, Williams S, Krasne
MD, Yaghnam I, Kunzel B et al: Periprostatic adipose inflammation is associated
with high-grade prostate cancer. Prostate Cancer Prostatic Dis 2017.
15. Hube F, Hauner H: The role of TNF-alpha in human adipose tissue: prevention of
weight gain at the expense of insulin resistance? Horm Metab Res 1999, 31(12):626-
631.
16. Roskoski R, Jr.: Vascular endothelial growth factor (VEGF) and VEGF receptor
inhibitors in the treatment of renal cell carcinomas. Pharmacol Res 2017, 120:116-
132.
17. Rutkowski JM, Davis KE, Scherer PE: Mechanisms of obesity and related
pathologies: The macro? and microcirculation of adipose tissue. In., vol. 276.
Oxford, UK; 2009: 5738-5746.

17
18. Di Alberti L, Rossetto A, Albanese M, D'Agostino A, De Santis D, Bertossi D, Nocini
PF: Expression of Vascular Endothelial Growth Factor (VEGF) mRNA in healthy
bone tissue around implants and in peri-implantitis. Minerva Stomatol 2013.
19. Grivennikov SI, Greten FR, Karin M: Immunity, inflammation, and cancer. Cell
2010, 140(6):883-899.
20. Chadha KC, Miller A, Nair BB, Schwartz SA, Trump DL, Underwood W: New serum
biomarkers for prostate cancer diagnosis. Clin Cancer Investig J 2014, 3(1):72-79.
21. Khandekar MJ, Cohen P, Spiegelman BM: Molecular mechanisms of cancer
development in obesity. Nat Rev Cancer 2011, 11(12):886-895.
22. Roskoski R, Jr.: Vascular endothelial growth factor (VEGF) signaling in tumor
progression. Crit Rev Oncol Hematol 2007, 62(3):179-213.
23. Sethi G, Sung B, Aggarwal BB: TNF: a master switch for inflammation to cancer.
Front Biosci 2008, 13:5094-5107.
24. Szlosarek P, Charles KA, Balkwill FR: Tumour necrosis factor-α as a tumour
promoter. European Journal of Cancer 2006, 42(6):745-750.
25. Cousin B, Munoz O, Andre M, Fontanilles A, Dani C, Cousin J, Laharrague P, Casteilla
L, Penicaud L: A role for preadipocytes as macrophage-like cells. Faseb J 1999,
13(2):305-312.
26. Zhang J, Li H, Wang X, Qi H, Miao X, Zhang T, Chen G, Wang M: Phage-derived
fully human antibody scFv fragment directed against human vascular endothelial
growth factor receptor 2 blocked its interaction with VEGF. Biotechnol Prog 2012,
28(4):981-989.
27. Ribeiro R, Monteiro C, Silvestre R, Castela A, Coutinho H, Fraga A, Príncipe P, Lobato
C, Costa C, Cordeiro-da-Silva A et al: Human periprostatic white adipose tissue is
rich in stromal progenitor cells and a potential source of prostate tumor stroma.
Experimental Biology and Medicine 2012, 237(10):1155-1162.
28. Cao Y: Angiogenesis in Adipose Tissue. New York, NY: New York, NY : Springer
New York : Imprint: Springer; 2013.
29. Van Roermund JG, Bol GH, Witjes JA, Ruud Bosch JL, Kiemeney LA, van Vulpen M:
Periprostatic fat measured on computed tomography as a marker for prostate
cancer aggressiveness. World J Urol 2009, 28:699-704.
30. Zhang Q, Sun LJ, Qi J, Yang ZG, Huang T, Huo RC: Periprostatic adiposity
measured on magnetic resonance imaging correlates with prostate cancer
aggressiveness. Urol J 2014, 11(4):1793-1799.
31. Tan WP, Lin C, Chen M, Deane LA: Periprostatic Fat: A Risk Factor for Prostate
Cancer? Urology 2016, 98:107-112.
32. Liu Y: Fatty acid oxidation is a dominant bioenergetic pathway in prostate cancer.
Prostate Cancer and Prostatic Diseases 2006, 9(3):230-234.
33. Prins JB, Niesler CU, Winterford CM, Bright NA, Siddle K, O'Rahilly S, Walker NI,
Cameron DP: Tumor necrosis factor-alpha induces apoptosis of human adipose
cells. Diabetes 1997, 46(12):1939-1944.
34. Wellen KE, Hotamisligil GS: Inflammation, stress, and diabetes. J Clin Invest 2005,
115(5):1111-1119.
35. Cawthorn WP, Sethi JK: TNF-α and adipocyte biology. FEBS letters 2008,
582(1):117-131.
36. Rydén M, Agustsson T, Laurencikiene J, Britton T, Sjölin E, Isaksson B, Permert J,
Arner P: Lipolysis—Not inflammation, cell death, or lipogenesis—Is involved in
adipose tissue loss in cancer cachexia. Cancer 2008, 113(7):1695-1704.
37. Ouchi N, Parker JL, Lugus JJ, Walsh K: Adipokines in inflammation and metabolic
disease. Nat Rev Immunol 2011, 11(2):85-97.

18
38. Xu H, Barnes GT, Yang Q, Tan G, Yang D, Chou CJ, Sole J, Nichols A, Ross JS,
Tartaglia LA et al: Chronic inflammation in fat plays a crucial role in the
development of obesity-related insulin resistance. J Clin Invest 2003, 112(12):1821-
1830.
39. Heilbronn LK, Campbell LV: Adipose tissue macrophages, low grade inflammation
and insulin resistance in human obesity. Curr Pharm Des 2008, 14(12):1225-1230.
40. Olefsky JM, Glass CK: Macrophages, inflammation, and insulin resistance. Annu
Rev Physiol 2010, 72:219-246.
41. Ribeiro, Ricardo J T, Monteiro, Cátia P D, Cunha, Virginia F P M, Azevedo, Andreia
S M, Oliveira, Maria J, Monteiro, Rosário, Fraga, Avelino M, Príncipe, Paulo, Lobato,
Carlos, Lobo, Francisco, Morais, António, Silva, Vitor, Sanches-Magalhães, José,
Oliveira, Jorge, Guimarães, João T, Lopes, Carlos M S, and Medeiros, Rui M. Tumor
Cell-educated Periprostatic Adipose Tissue Acquires an Aggressive Cancer-
promoting Secretory Profile. Cellular Physiology and Biochemistry : International
Journal of Experimental Cellular Physiology, Biochemistry, and Pharmacology 2012,
29:233-40.
42. Zhang Y, Daquinag AC, Amaya-Manzanares F, Sirin O, Tseng C, Kolonin MG:
Stromal progenitor cells from endogenous adipose tissue contribute to pericytes
and adipocytes that populate the tumor microenvironment. Cancer research 2012,
72(20):5198.
43. Ito A, Hirota S, Mizuno H, Kawasaki Y, Takemura T, Nishiura T, Kanakura Y,
Katayama Y, Nomura S, Kitamura Y: Expression of vascular permeability factor
(VPF/VEGF) messenger RNA by plasma cells: possible involvement in the
development of edema in chronic inflammation. Pathol Int 1995, 45(10):715-720.
44. Claffey KP, Brown LF, del Aguila LF, Tognazzi K, Yeo KT, Manseau EJ, Dvorak HF:
Expression of vascular permeability factor/vascular endothelial growth factor by
melanoma cells increases tumor growth, angiogenesis, and experimental
metastasis. Cancer Res 1996, 56(1):172-181.
45. Kalkanis SN, Carroll RS, Zhang J, Zamani AA, Black PM: Correlation of vascular
endothelial growth factor messenger RNA expression with peritumoral vasogenic
cerebral edema in meningiomas. J Neurosurg 1996, 85(6):1095-1101.
46. Sasaki R: [Microvessel count and vascular endothelial growth factor in renal cell
carcinoma]. Nihon Hinyokika Gakkai Zasshi 1996, 87(8):1032-1040.
47. Viglietto G, Romano A, Maglione D, Rambaldi M, Paoletti I, Lago CT, Califano D,
Monaco C, Mineo A, Santelli G et al: Neovascularization in human germ cell tumors
correlates with a marked increase in the expression of the vascular endothelial
growth factor but not the placenta-derived growth factor. Oncogene 1996,
13(3):577-587.
48. Takano S, Yoshii Y, Kondo S, Suzuki H, Maruno T, Shirai S, Nose T: Concentration
of vascular endothelial growth factor in the serum and tumor tissue of brain tumor
patients. Cancer Res 1996, 56(9):2185-2190.
49. Saito W, Kase S, Fujiya A, Dong Z, Noda K, Ishida S: Expression of vascular
endothelial growth factor and intravitreal anti-VEGF therapy with bevacizumab
in vasoproliferative retinal tumors. Retina 2013, 33(9):1959-1967.
50. Wang W, Merrill MJ, Borchardt RT: Vascular endothelial growth factor affects
permeability of brain microvessel endothelial cells in vitro. Am J Physiol 1996,
271(6 Pt 1):C1973-1980.
51. Wei, Wang, Lampert, Schlanger, Depriest, Hu, Gomez, Murakam, Glenn, Conroy,
Morrison, Azabdaftari, Mohler, Liu, and Heemers. Intratumoral and Intertumoral
Genomic Heterogeneity of Multifocal Localized Prostate Cancer Impacts

19
Molecular Classifications and Genomic Prognosticators. Eur Urol 2017, 71(2): 183-
92.
52. Lee J: Adipose tissue macrophages in the development of obesity-induced
inflammation, insulin resistance and type 2 diabetes. Arch Pharm Res 2013,
36(2):208-222.
53. Ibrahim MM: Subcutaneous and visceral adipose tissue: structural and functional
differences. In., vol. 11. Oxford, UK; 2010: 11-18.

20
Figure 1: (I) Periprostatic adipose tissues were manually selected from multiple areas proximal and
distal to the prostate tissue (red marks). The Positive Pixel Count algorithm was used to quantify the
positive and negative staining within the selected regions. (II) A closer view of the net-shaped adipose
tissue analysed by the Positive Pixel Count algorithm. Lipid droplets were not included in the analysis.
Artefacts, blood vessels, and other types of tissues within the selected regions were manually excluded
(green marks).
21
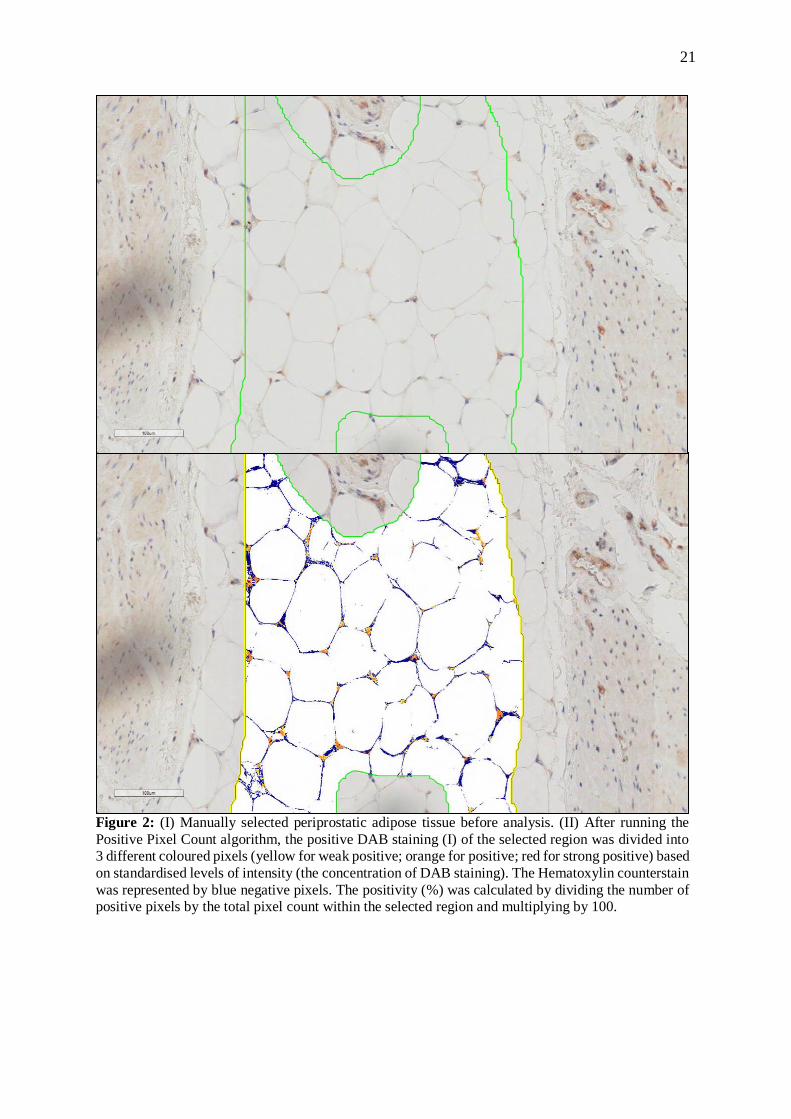
Figure 2: (I) Manually selected periprostatic adipose tissue before analysis. (II) After running the
Positive Pixel Count algorithm, the positive DAB staining (I) of the selected region was divided into
3 different coloured pixels (yellow for weak positive; orange for positive; red for strong positive) based
on standardised levels of intensity (the concentration of DAB staining). The Hematoxylin counterstain
was represented by blue negative pixels. The positivity (%) was calculated by dividing the number of
positive pixels by the total pixel count within the selected region and multiplying by 100.

22
Figure 3: Box plot showing the differences in the distribution and the median of the positivity of
vascular endothelial growth factor (VEGF) and tumour necrosis factor alpha (TNFa) in the three groups
stratified according to post-operative Gleason score.

23
Figure 4: ROC curve showing the areas under the curves of tumour necrosis factor alpha (TNFa;
green line) and vascular endothelial growth factor (VEGF; blue line).

24
Table 1: Patient characteristics.
Group 1
Post-operative
Gleason score
6
Group 2
Post-operative
Gleason score 7
(3+4)
Group 3
Post-operative
Gleason score 7
(4+3) and over
p value
Mean Standard Deviation
No. n = 6 n = 35 n = 28
Age 64 8.17 65.83 5.67 66.96 4.54 .391a
VEGF (%) 2.83 1.18 10.03 7.74 9.45 6.65 .004b
AR (%) 7.44 5.07 5.64 3.71 7.15 5.96 .500b
TNFa (%) 4.1 3.77 14.89 10.76 18.32 8.75 .001b
Initial PSA
(ng/ml) 7.9 2.13 10.69 7.53 11.53 6.39 .317b
PV (cm3) 64.64 8.74 48.99 26.035 55.44 23.01 .165b
WHO classification N (%)*
No. n = 4 n = 33 n = 24
.568c
Normal weight 1 (25) 10 (30.3) 6 (25)
Overweight 3 (75) 16 (48.5) 8 (33.3)
Obesity class I 0 5 (15.2) 8 (33.3)
Obesity class II 0 2 (6.1) 1 (4.2)
Obesity class III 0 0 1 (4.2)
Pathological stage N (%)*
No. n = 6 n = 35 n = 28
.027c T2 5 (83.3) 24 (68.6) 11 (39.3)
T3 1(16.7) 11 (31.4) 17 (60.7)
D’Amico risk classification N (%)*
No. n = 6 n = 35 n = 28
<.001c Low 5 (83.3) 9 (25.7) 1 (3.6)
Intermediate 1 (16.7) 17 (48.6) 10 (35.7)
High 0 9 (25.7) 17 (60.7)
VEGF = Vascular endothelial growth factor; AR = Androgen receptors; TNFa = Tumour
necrosis factor alpha; PSA = Prostate specific antigen; PV = Prostate volume.
Patients were stratified according to post-operative Gleason score aANOVA, bKruskal-Wallis test, c𝝌2 test
*(%) within each group
p value is significant <0.05

25
Table 2. Independent-sample t test was used to compare the differences in the mean adipokine
Immunopositivity (%) for upgraded and not upgraded from low-grade (GS = 3+3) PCa at
biopsy (n = 20). N Mean
(%)
Std. Deviation
(%)
Std. Error
Mean (%)
t *p value
VEGF not upgraded 6 2.83 1.18 .48 -2.75 .013
upgraded 14 6.85 3.45 .92
TNFa not upgraded 6 4.11 3.77 1.53 -1.86 .079
upgraded 14 10.55 8 2.14
(%) immunopositivity within each group

26
26
Table 3: The relationship between periprostatic adipose tissue adipokines (VEGF and TNFa), androgen receptors, age, prostate volume,
Quantitative values of functional MRIs (DCE-MRI and DWI), fat measures, body mass index (BMI), prostate specific antigen (PSA) and pre- and
post-operative Gleason scores using Spearman correlation coefficient.
AR VEGF TNFa Age PV AFA SFT PSA BMI Ktrans Kep ADC NPFV
Post-op
GS
Biopsy
GS
Spearman's
rho
AR Correlation Coefficient 1.000 .269* .226 .190 .057 .112 .062 .101 .107 .194 .084 .302* .018 .045 .103
Sig. (2-tailed) . .025 .062 .119 .653 .383 .629 .408 .411 .185 .572 .037 .886 .714 .399
N 69 69 69 69 64 63 63 69 61 48 48 48 64 69 69
VEGF Correlation Coefficient .269* 1.000 .475** .009 -.143 .040 .127 .175 .110 .158 .118 .012 .068 .190 .265*
Sig. (2-tailed) .025 . .000 .943 .259 .757 .320 .151 .397 .284 .426 .933 .595 .117 .028
N 69 69 69 69 64 63 63 69 61 48 48 48 64 69 69
TNFa Correlation Coefficient .226 .475** 1.000 -.012 -.038 .156 .278* .177 .233 .327* .162 -.096 .082 .345** .419**
Sig. (2-tailed) .062 .000 . .921 .767 .223 .027 .146 .070 .023 .270 .516 .517 .004 .000
N 69 69 69 69 64 63 63 69 61 48 48 48 64 69 69
Ktrans Correlation Coefficient .194 .158 .327* .126 .159 .070 .089 .060 .115 1.000 .682** .081 .157 .005 .110
Sig. (2-tailed) .185 .284 .023 .395 .281 .640 .551 .687 .443 . .000 .588 .286 .974 .458
N 48 48 48 48 48 47 47 48 47 48 48 47 48 48 48
Kep Correlation Coefficient .084 .118 .162 .032 .211 -.106 .061 .011 .051 .682** 1.000 .122 .057 -.123 .054
Sig. (2-tailed) .572 .426 .270 .828 .150 .480 .683 .941 .735 .000 . .413 .701 .405 .716
N 48 48 48 48 48 47 47 48 47 48 48 47 48 48 48
ADC Correlation Coefficient .302* .012 -.096 .067 -.068 -.221 -.334* -.230 -.365* .081 .122 1.000 -.163 -.473** -.361*
Sig. (2-tailed) .037 .933 .516 .651 .644 .136 .022 .116 .012 .588 .413 . .268 .001 .012
N 48 48 48 48 48 47 47 48 47 47 47 48 48 48 48
AR = Androgen receptors; VEGF = Vascular endothelial growth factor; TNFa = Tumour necrosis factor alpha; PV = Prostate volume; AFA = Abdominal fat area; SFT =
Subcutaneous fat thickness; PSA = Prostate specific antigen; BMI = Body mass index; Ktrans = Transfer constant; Kep = Reverse reflux rate constant; ADC = Apparent diffusion
coefficient; NPFV = Normalised periprostatic fat volume; GS = Gleason score.
*. Correlation is significant at the 0.05 level (2-tailed).
**. Correlation is significant at the 0.01 level (2-tailed).
27
27
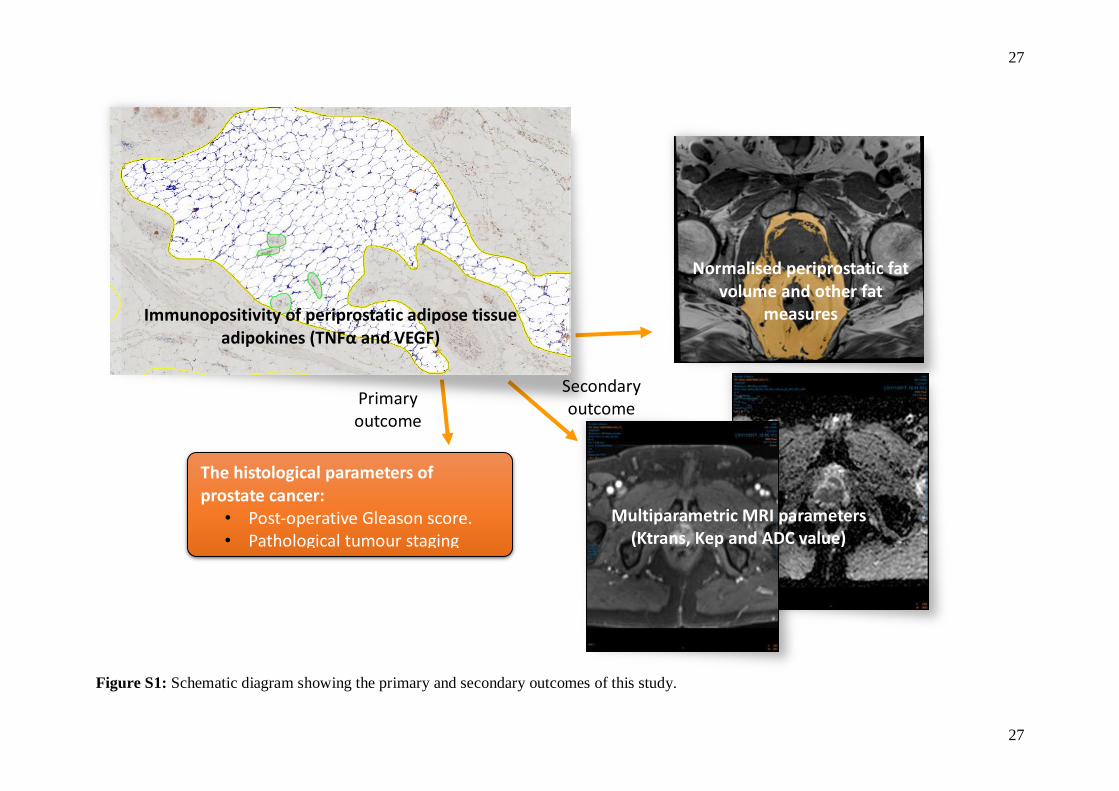
Figure S1: Schematic diagram showing the primary and secondary outcomes of this study.
The histological parameters of prostate cancer:
• Post-operative Gleason score. • Pathological tumour staging
Primary outcome
Secondary outcome
Immunopositivity of periprostatic adipose tissue adipokines (TNFα and VEGF)
Multiparametric MRI parameters (Ktrans, Kep and ADC value)
Normalised periprostatic fat volume and other fat
measures

28
28
Table S1: Power analysis. Fat measures Effect
Size (f) error
probability
Power (1-
error
probability)
Sample size
calculated
p valuea
AR .46 .05 .8 51 .249
VEGF .64 .05 .8 27 .082
TNFα .39 .05 .8 69 .358
AR = Androgen Receptor; VEGF = Vascular endothelial growth factor; TNFa = Tumour necrosis factor
alpha. a One-way ANOVA test.

29
29
Table S2: The characteristics of the selected antibodies. Antibody clonality Isotype Host Reactivity Tissue
specificity
Catalog
number
company
Anti-
Androgen
Receptor
clone
AR441
Monoclonal IgG Mouse Human Nucleus M3562 DAKO
Anti-
VEGF
clone
VG1
Monoclonal IgG Mouse Human Secreted M7273 DAKO
Anti-
TNFa
Polyclonal IgG Rabbit Mouse, Rat, Guinea
pig, Human, Pig,
Fish, Cynomolgus
monkey
Nucleus
and
cytoplasm
Ab6671 Abcam
30
30
Table S3: The protocol used for AR (1:50), VEGF (1:100) and TNFa (1:200). Category Code Reagent Name Incubation
1. Rinse Buffer
2. Enzyme Pre-treatment FLEX TRIS High PH Solution 10min 97°C
3. Rinse Buffer
4. Endogenous Enzyme Block SM801 FLEX Peroxidase Block 5min
5. Rinse Buffer
6. Primary Antibody FLEX Ab Diluent + 1° Ab o/n 4°C
7. Rinse Buffer
8. Secondary Reagent SM804 FLEX + Mouse LINKER
(LINKER; for VEGF only)
15min
9. Rinse Buffer
10. Labelled Polymer SM802 FLEX/HRP 20min
11. Rinse Buffer 5min
12. Substrate-Chromogen SM803 FLEX DAB + Substrate-Chromogen 5min
13. Rinse Buffer
14. Auxiliary Copper-Sulphate 0.5% 5min
15. Rinse Buffer
16. Counterstain SM806 FLEX Hematoxylin 5min
17. Rinse DI Water
18. Rinse Buffer 5min
19. Rinse DI Water
![Adipokines and the role of visceral adipose tissue in infl ......adipokines show correlations with the activity of a variety of autoimmune as well as infectious diseases [13,47]. Given](https://static.fdocuments.in/doc/165x107/5f704ebef0a62560e40f3170/adipokines-and-the-role-of-visceral-adipose-tissue-in-infl-adipokines-show.jpg)