UNIVERSITY OF CAMBRIDGE INTERNATIONAL EXAMINATIONS ... · Answer three questions. ... GEOGRAPHY...
16
This document consists of 15 printed pages and 1 blank page and 1 Insert. SP (KN) T49883/7(R) © UCLES 2007 [Turn over UNIVERSITY OF CAMBRIDGE INTERNATIONAL EXAMINATIONS International General Certificate of Secondary Education READ THESE INSTRUCTIONS FIRST If you have been given an Answer Booklet, follow the instructions on the front cover of the Booklet. Write your Centre number, candidate number and name on all the work you hand in. Write in dark blue or black pen. You may use a soft pencil for any diagrams, graphs or rough working. Do not use staples, paper clips, highlighters, glue or correction fluid. Answer three questions. Sketch maps and diagrams should be drawn whenever they serve to illustrate an answer. The Insert contains Photographs A and B for Question 1, Figs 3A, 3B and 3C for Question 2 and Fig. 8 for Question 5. At the end of the examination, fasten all your work securely together. The number of marks is given in brackets [ ] at the end of each question or part question. *7060475148* GEOGRAPHY 0460/01 Paper 1 October/November 2007 1 hour 45 minutes Additional Materials: Answer Booklet/Paper
Transcript of UNIVERSITY OF CAMBRIDGE INTERNATIONAL EXAMINATIONS ... · Answer three questions. ... GEOGRAPHY...

This document consists of 15 printed pages and 1 blank page and 1 Insert.
SP (KN) T49883/7(R)© UCLES 2007 [Turn over
UNIVERSITY OF CAMBRIDGE INTERNATIONAL EXAMINATIONSInternational General Certificate of Secondary Education
READ THESE INSTRUCTIONS FIRST
If you have been given an Answer Booklet, follow the instructions on the front cover of the Booklet.Write your Centre number, candidate number and name on all the work you hand in.Write in dark blue or black pen.You may use a soft pencil for any diagrams, graphs or rough working.Do not use staples, paper clips, highlighters, glue or correction fluid.
Answer three questions.Sketch maps and diagrams should be drawn whenever they serve to illustrate an answer.The Insert contains Photographs A and B for Question 1, Figs 3A, 3B and 3C for Question 2 and Fig. 8 for Question 5.
At the end of the examination, fasten all your work securely together.The number of marks is given in brackets [ ] at the end of each question or part question.
*7060475148*
GEOGRAPHY 0460/01
Paper 1 October/November 2007
1 hour 45 minutes
Additional Materials: Answer Booklet/Paper

2
0460/01/O/N/07© UCLES 2007
1 (a) Study Fig. 1, information about the number of immigrants to Australia, an MEDC.
Darwin
Perth
Brisbane
Hobart
CANBERRACANBERRACANBERRAAdelaideAdelaide
MelbourneMelbourne
Adelaide
Melbourne
NORTHERNTERRITORY
NEWSOUTHWALES
SOUTHAUSTRALIA
WESTERNAUSTRALIA
VICTORIATASMANIA
QUEENSLAND
AUSTRALIA
Sydney
UK & Ireland
North Africa &Middle East
Rest ofAfrica
SouthAfrica
The Americas
Rest of Europe &former USSR
Northeast Asia
Southeast Asia
Rest of Oceania
New Zealand
South Asia
Year ofmigration
Number of immigrants
1989-1990
1999-2000
20 000
10 000
5 000
1 000
Sydney large cities
Fig. 1
(i) What is meant by an immigrant? [1]
(ii) Compare the number of immigrants in 1989-1990 with those in 1999-2000 and identify a place of origin:
A which shows an increase in migration,
B which shows the largest decrease in migration. [2]
(iii) Choose any area shown on Fig. 1. Write down the name of the area which you have chosen and suggest three reasons why people migrate from there to an MEDC such as Australia. [3]
(iv) Many migrants from other countries move to cities in Australia, such as Sydney and Melbourne. Describe the effects of international migration on cities such as these. [4]

3
0460/01/O/N/07© UCLES 2007 [Turn over
(b) Study Photographs A and B (Insert), which show parts of an area of sparse population density in an LEDC.
(i) Use evidence from the photographs to explain why the area shown is sparsely populated. [3]
(ii) Explain why towns may grow up in areas which are otherwise sparsely populated. [5]
(c) The size of the population in an area may change as a result of natural increase.
For an area which you have studied, explain why the rate of natural population growth is high. [7]

4
0460/01/O/N/07© UCLES 2007
2 (a) Study Fig. 2, which shows census statistics about three areas of housing in the city of Worcester, UK.
Housing characteristics Barbourne St. Peter’s Brickfields
% owner occupied 70 91 45
% rented from council or other social rented housing
10 3 47
% privately rented 20 6 8
% of households which are overcrowded (average greater than 1 person per room)
1.1 0.21 2.31
Fig. 2
(i) What is meant by owner occupied housing? [1]
(ii) Use Fig. 2 to identify the areas which have:
A the largest percentage of rented housing,
B the houses with the most space per person. [2]

5
0460/01/O/N/07© UCLES 2007 [Turn over
(b) Study Figs 3A, 3B and 3C (Insert), which show street maps and photographs of these three housing areas in Worcester.
(i) Identify two ways in which St. Peter’s is typical of a suburban area in an MEDC. [2]
(ii) Brickfields is an outer city estate of low cost housing. Suggest two advantages and two disadvantages of living in an area such as this. [4]
(iii) Barbourne is an inner city area. Use evidence from Fig. 3A only to describe the street layout and housing characteristics of this area. [4]
(iv) There are plans for the redevelopment of the Barbourne area. Suggest reasons why some people are likely to want the existing houses to be improved,
rather than the area to be redeveloped. [5]
(c) The area surrounding towns and cities is known as the rural-urban fringe. What problems are likely to occur in the rural-urban fringe as a result of the growth of towns
and cities? You should refer to an example which you have studied. [7]

6
0460/01/O/N/07© UCLES 2007
3 (a) Study Fig. 4, which shows an area of coastline.
Sand dunes
Headland
BayBay
BayBay
X
Y
DIRECTIONDIRECTIONOF LONGSHOREOF LONGSHORE
DRIFTDRIFT
DIRECTIONOF LONGSHORE
DRIFT
N
Bay
Bay
Fig. 4
(i) In which direction is longshore drift taking place? [1]
(ii) Identify the landforms labelled X and Y. [2]
(iii) Suggest reasons why there are bays and headlands along this stretch of coast. [3]
(iv) Explain how wind action forms and shapes coastal sand dunes. [4]
7
0460/01/O/N/07© UCLES 2007 [Turn over
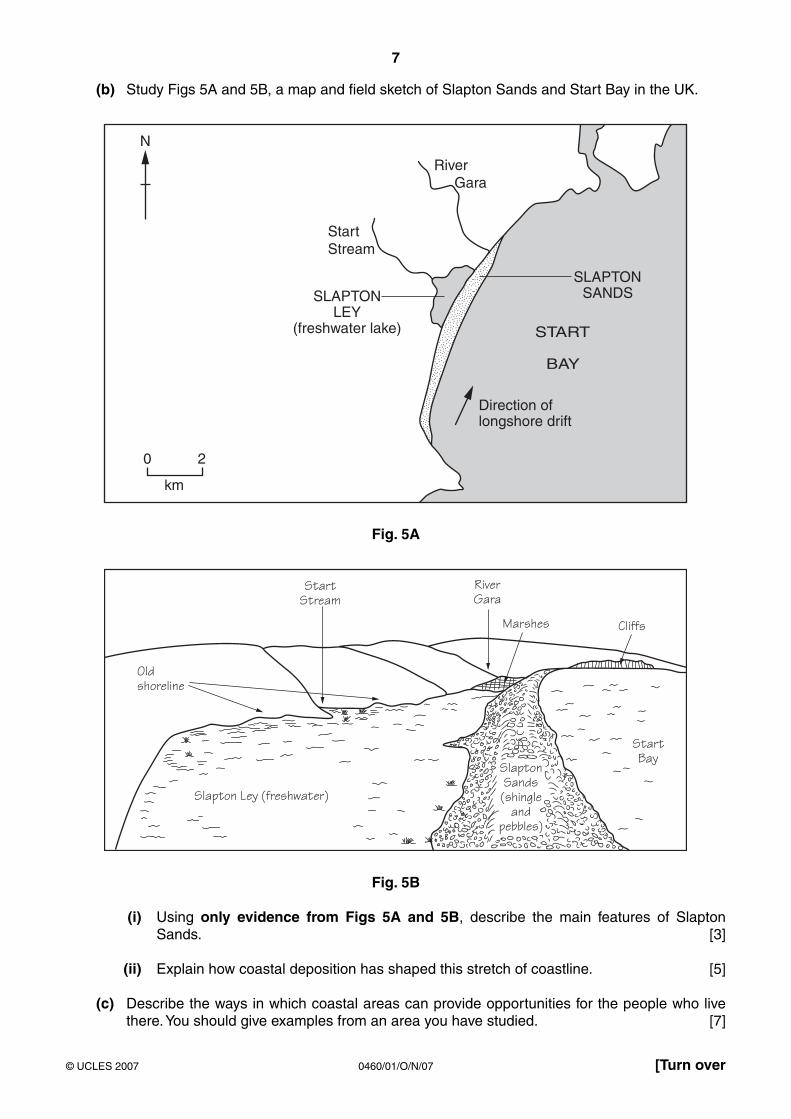
(b) Study Figs 5A and 5B, a map and field sketch of Slapton Sands and Start Bay in the UK.
River Gara
Start Stream
N
SLAPTONLEY
(freshwater lake)
SLAPTON SANDS
Direction of longshore drift
START
BAY
0 2
km
Fig. 5A
StartStream
Old shoreline
RiverGara
Marshes Cliffs
StartBay
Slapton Ley (freshwater)
SlaptonSands(shingle
andpebbles)
Fig. 5B
(i) Using only evidence from Figs 5A and 5B, describe the main features of Slapton Sands. [3]
(ii) Explain how coastal deposition has shaped this stretch of coastline. [5]
(c) Describe the ways in which coastal areas can provide opportunities for the people who live there. You should give examples from an area you have studied. [7]

8
0460/01/O/N/07
BLANK PAGE
9
0460/01/O/N/07© UCLES 2007 [Turn over
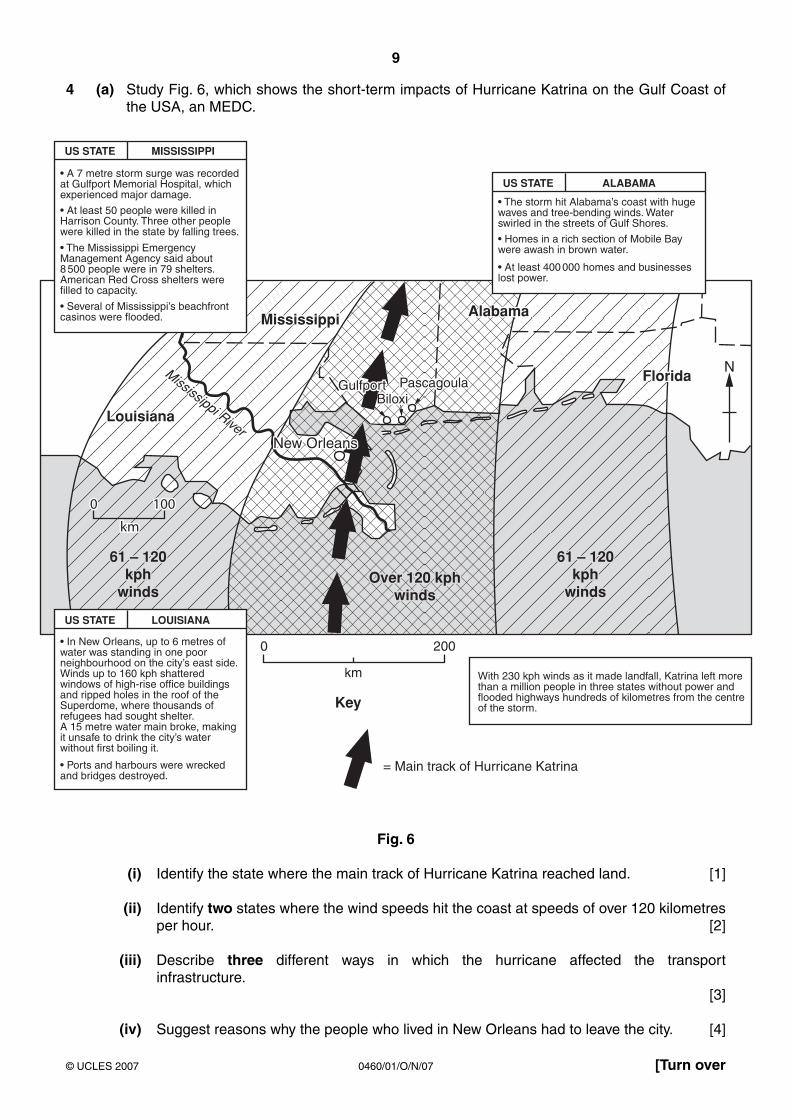
4 (a) Study Fig. 6, which shows the short-term impacts of Hurricane Katrina on the Gulf Coast of the USA, an MEDC.
Louisiana Louisiana
Mississippi Mississippi
0 0 100 100
km km
Mississippi River
Mississippi RiverLouisiana
61 – 120 61 – 120 kph kph
winds winds
Mississippi
0 100
km
Mississippi River
FloridaFloridaFlorida
AlabamaAlabamaAlabama
New Orleans New Orleans
Gulfport Gulfport Biloxi Biloxi
Pascagoula Pascagoula Pascagoula Gulfport Biloxi
New Orleans
US STATE MISSISSIPPI
• A 7 metre storm surge was recorded at Gulfport Memorial Hospital, which experienced major damage.
• At least 50 people were killed in Harrison County. Three other people were killed in the state by falling trees.
ALABAMA
• The storm hit Alabama’s coast with huge waves and tree-bending winds. Water swirled in the streets of Gulf Shores.
• Homes in a rich section of Mobile Bay were awash in brown water. • At least 400 000 homes and businesses lost power.
• The Mississippi Emergency Management Agency said about 8 500 people were in 79 shelters. American Red Cross shelters were filled to capacity. • Several of Mississippi’s beachfront casinos were flooded.
• In New Orleans, up to 6 metres of water was standing in one poor neighbourhood on the city’s east side. Winds up to 160 kph shattered windows of high-rise office buildings and ripped holes in the roof of the Superdome, where thousands of refugees had sought shelter. A 15 metre water main broke, making it unsafe to drink the city’s water without first boiling it.
With 230 kph winds as it made landfall, Katrina left more than a million people in three states without power and flooded highways hundreds of kilometres from the centre of the storm.
• Ports and harbours were wrecked and bridges destroyed.
= Main track of Hurricane Katrina
0 200
km
61 – 120 kph
winds
61 – 120 61 – 120 kph kph
winds winds
61 – 120 kph
winds Over 120 kph Over 120 kph
winds winds Over 120 kph
winds
US STATE LOUISIANA
US STATE
Key
N
Fig. 6
(i) Identify the state where the main track of Hurricane Katrina reached land. [1]
(ii) Identify two states where the wind speeds hit the coast at speeds of over 120 kilometres per hour. [2]
(iii) Describe three different ways in which the hurricane affected the transport infrastructure.
[3]
(iv) Suggest reasons why the people who lived in New Orleans had to leave the city. [4]
10
0460/01/O/N/07© UCLES 2007
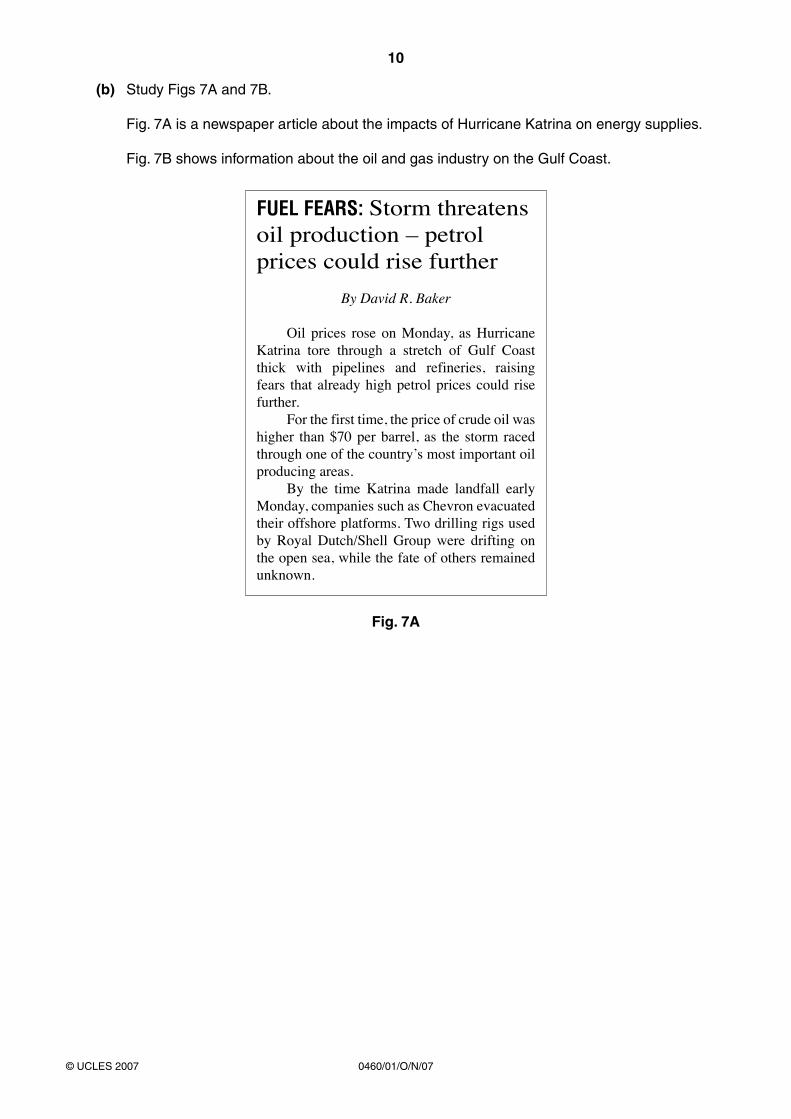
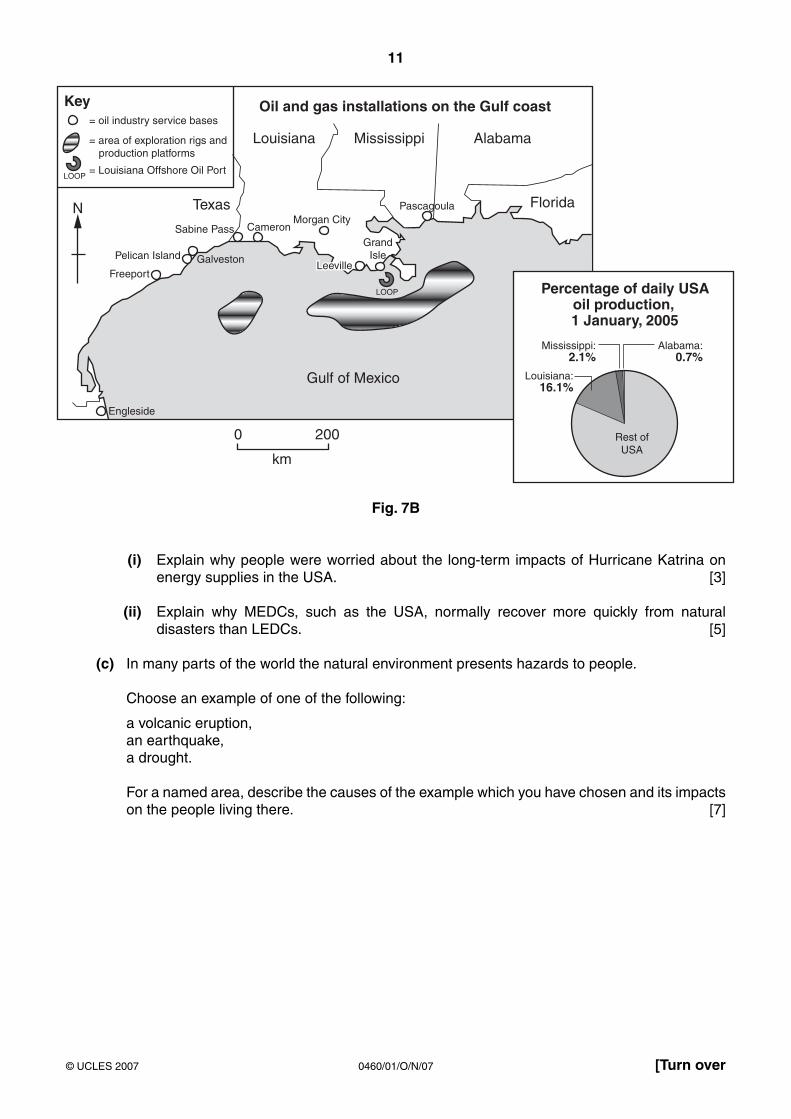
(b) Study Figs 7A and 7B.
Fig. 7A is a newspaper article about the impacts of Hurricane Katrina on energy supplies.
Fig. 7B shows information about the oil and gas industry on the Gulf Coast.
FUEL FEARS: Storm threatensoil production – petrolprices could rise further
By David R. Baker
Oil prices rose on Monday, as Hurricane Katrina tore through a stretch of Gulf Coast thick with pipelines and refineries, raising fears that already high petrol prices could rise further. For the first time, the price of crude oil was higher than $70 per barrel, as the storm raced through one of the countryʼs most important oil producing areas. By the time Katrina made landfall early Monday, companies such as Chevron evacuated their offshore platforms. Two drilling rigs used by Royal Dutch/Shell Group were drifting on the open sea, while the fate of others remained unknown.
Fig. 7A
11
0460/01/O/N/07© UCLES 2007 [Turn over
Engleside
Freeport
Pelican Island Galveston
Sabine Pass CameronGrand
Isle
PascagoulaMorgan City
LeevilleLeeville
Texas
Louisiana Mississippi
Gulf of Mexico
0 200
km
Alabama
Key= oil industry service bases
= area of exploration rigs and production platforms
= Louisiana Offshore Oil PortLOOP
LOOP
Oil and gas installations on the Gulf coast
Florida
Leeville
Percentage of daily USAoil production, 1 January, 2005
Alabama:0.7%
Rest ofUSA
Mississippi:2.1%
Louisiana:16.1%
N
Fig. 7B
(i) Explain why people were worried about the long-term impacts of Hurricane Katrina on energy supplies in the USA. [3]
(ii) Explain why MEDCs, such as the USA, normally recover more quickly from natural disasters than LEDCs. [5]
(c) In many parts of the world the natural environment presents hazards to people.
Choose an example of one of the following:
a volcanic eruption, an earthquake, a drought.
For a named area, describe the causes of the example which you have chosen and its impacts on the people living there. [7]

12
0460/01/O/N/07© UCLES 2007
5 (a) Study Fig. 8 (Insert), a map showing information about food consumption in different parts of the world.
(i) Name a continent where most countries have an average daily consumption of more than 3000 calories per person. [1]
(ii) Countries with a low average calorie intake may suffer food shortages. Describe the distribution of countries which have an average daily consumption of less
than 2500 calories per person. [2]
(iii) Explain how food shortages can be caused by:
A the natural environment, [3]
B economic and political factors. [4]

13
0460/01/O/N/07© UCLES 2007 [Turn over
(b) Study Fig. 9, which shows information about a recent aid programme in Burundi, an LEDC in Central Africa.
START HERE
Give a widowedmother a goat.
The widow growsmore crops.
The w
idow g
ives
som
e go
ats b
ack t
o
the
aid p
rogr
amm
e.
The g
oat
prod
uces
man
ure.
The goat
produces milk.
The goat produces
more goats.
The w
idow’s children
don’t go hungry.T
he w
idow
kee
pson
e of
the
goat
s.
How to recycle a goat
Fig. 9
(i) State three outputs from the system. [3]
(ii) Explain how the aid programme is likely to improve the quality of life of the people who live in Burundi. [5]
(c) All farming systems have inputs, processes and outputs.
Name an example which you have studied of either small-scale subsistence farming or large-scale commercial farming.
Give the name of an area where your chosen farming type takes place. Describe the inputs, processes and outputs of this farming system. [7]

14
0460/01/O/N/07© UCLES 2007
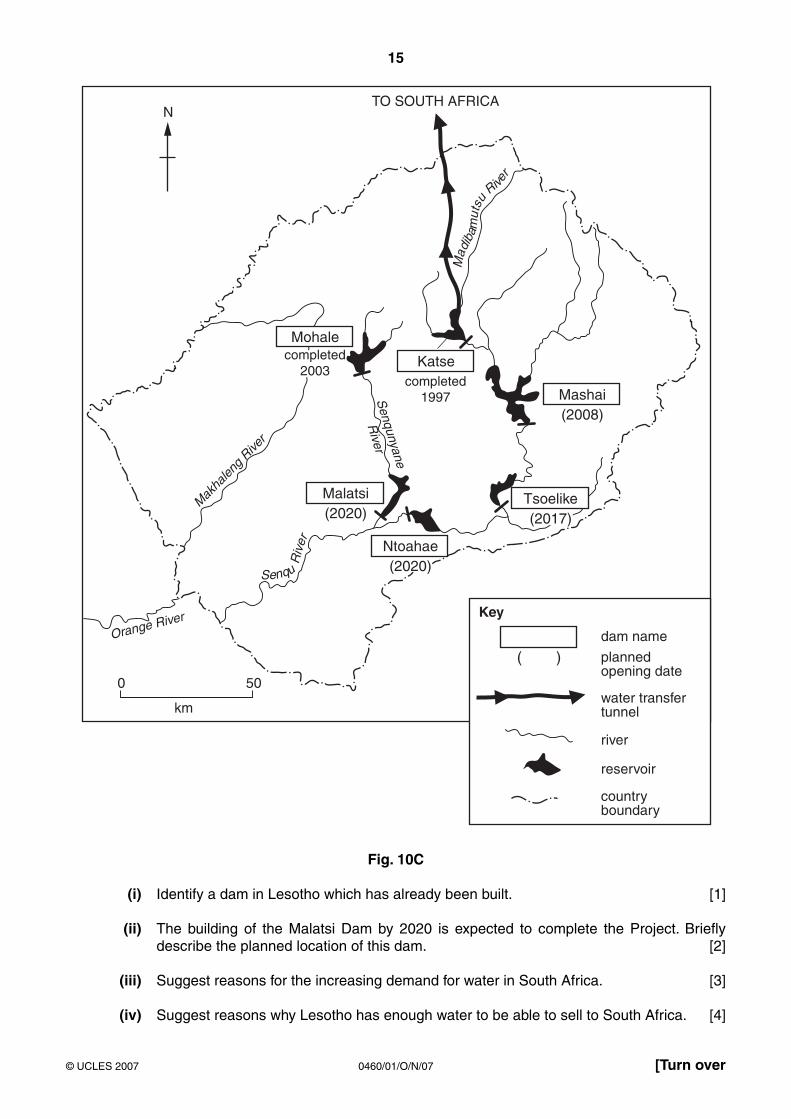
6 (a) Study Figs 10A, 10B and 10C, which show information about the Lesotho Highlands Water Project.
Lesotho is an LEDC in the mountains of southern Africa. It aims to build a series of dams. These will collect and store water to sell to South Africa, its richer neighbour. Water will also be used at the dams to generate hydro-electric power (HEP).
Fig. 10A
N
NAMIBIA
BOTSWANA
SWAZILAND
MOZAMBIQUE
SOUTH AFRICA
ZIMBABWE
Tropic ofCapricorn
At lant icOcean
IndianOcean
Cape Town
Johannesburg
Port Elizabeth
East London
Durban
Maputo
Soweto
BloemfonteinBloemfontein
Kimberley
Pretoria
LESOTHO
O
range River
Bloemfontein
0 150
km
300Keyrivers
international borders
large cities
Fig. 10B
15
0460/01/O/N/07© UCLES 2007 [Turn over
0
km
50
Orange River
Mak
halen
g Rive
r
completed2003
Katsecompleted
1997 Mashai(2008)
Malatsi(2020)
( )
Ntoahae(2020)
Senqunyane
River
NTO SOUTH AFRICA
Key
dam name
plannedopening date
water transfertunnel
river
reservoir
country boundary
Mohale
Senqu Riv
er
Mad
ibam
utsu
Rive
rTsoelike(2017)
Fig. 10C
(i) Identify a dam in Lesotho which has already been built. [1]
(ii) The building of the Malatsi Dam by 2020 is expected to complete the Project. Briefly describe the planned location of this dam. [2]
(iii) Suggest reasons for the increasing demand for water in South Africa. [3]
(iv) Suggest reasons why Lesotho has enough water to be able to sell to South Africa. [4]

16
0460/01/O/N/07© UCLES 2007
(b) Study Fig. 11, which shows the opinions of selected people about the Lesotho Highlands Water Project.
Opposition politician in Lesotho Parliament “Lesotho will be more dependent on South Africa.”
A worker on the dam site
“Lesotho will get hydro- electricity from the dam and tourists will come.”
Lesotho farmer
“The best land for my cattle will be gone.”
Minister of Energy
“Hydro-electric power is far cleaner than other forms of energy.”
Lesotho government spokesman“We will have many new roads and jobs,and money to spend on educationand health.”
Environmentalist “It will do permanent environmental damage.”
Fig. 11
(i) Describe the advantages of using hydro-electric power (HEP), rather than other sources of energy. [3]
(ii) Explain the positive and negative effects which the Highlands Water Project will have on Lesotho. [5]
(c) Water and air may be polluted by human activities.
Name an example of a place which you have studied where either the air or the water is polluted. Describe the causes of this pollution and its effects on people and the environment. [7]
Copyright Acknowledgements:
Question 1(b) Photograph A S. Sibley © UCLES.Question 1(b) Photograph B S. Sibley © UCLES.Question 2(b) Figs 3A, 3B & 3C; S. Sibley © UCLES.Question 4 Fig. 7A © David R. Barker; ‘Fuel Fears: Storm threatens oil production - petrol prices could rise further’; San Francisco
Chronicle, 30 August 2005.Question 5 Fig. 9 © Christian Aid.
Permission to reproduce items where third-party owned material protected by copyright is included has been sought and cleared where possible. Every reasonable effort has been made by the publisher (UCLES) to trace copyright holders, but if any items requiring clearance have unwittingly been included, the publisher will be pleased to make amends at the earliest possible opportunity.
University of Cambridge International Examinations is part of the Cambridge Assessment Group. Cambridge Assessment is the brand name of University of Cambridge Local Examinations Syndicate (UCLES), which is itself a department of the University of Cambridge.