University of Antwerp World LNG Shipping: dynamics in markets ...
25
129 CHAPTER 7 World LNG shipping: dynamics in markets, ships and terminal projects Siyuan WANG and Theo NOTTEBOOM Abstract The aim of this paper is to explore how world Liquefied Natural Gas (LNG) shipping has developed over the last decade given the growing usage of natural gas and increasing seaborne trade volume of LNG over the world. The paper presents current dynamics in the LNG shipping market focused on three aspects: the evolution of LNG short-term shipping and market structure, the growth of the LNG fleet and the development of terminal projects. It is found that with the liberalization of LNG trade, short-term shipping is rapidly growing, and that the size of LNG tankers and the scale of terminals are also extending accordingly in order to benefit from economies of scale. 1 | Introduction Given its ease of use and environmentally-friendliness, Natural Gas is fast becoming one of the most attractive energy sources in the world. According to the latest report from EIA (The International Energy Outlook 2010), the total natural gas consumption worldwide is expected to increase by 44%, from 108 TCF 1 in 2007 to 156 TCF in 2035. Although the global economic recession slowed down demand in 2009, once world economies begin to recover from the downturn, the demand will rebound. The consumption of natural gas, projected by EIA, is expected to grow at an average rate of 1.8% from 2007 to 2020. Figure 1 shows the outlook for world energy consumption by source. Nowadays, the transportation of Natural Gas is mainly done by pipeline and by shipment in the form of liquefied natural gas (LNG). LNG is natural gas that is stored and transported in liquid form at atmospheric pressure at a temperature of -161 o C (-256 o F). Liquefied gas occupies a volume corresponding of 1/600 of the gas in the gaseous form which eases the transportation process and allows to ship LNG in specialized LNG carriers. Most experts indicate that LNG shipping is more competitive in cases where pipeline transportation is not feasible due to geographic constraints or not economic, particularly for medium and long distances. 1 TCF: Trillion cubic feet, CM: Cubic meter, BCM: Billion cubic meter, BTU: British thermal unit, MMtpa: Million Metric ton per annum.
-
Upload
truongkiet -
Category
Documents
-
view
229 -
download
10
Transcript of University of Antwerp World LNG Shipping: dynamics in markets ...
129
CHAPTER 7
World LNG shipping: dynamics in markets, ships and terminal projects
Siyuan WANG and Theo NOTTEBOOM
Abstract
The aim of this paper is to explore how world Liquefied Natural Gas (LNG) shipping has
developed over the last decade given the growing usage of natural gas and increasing
seaborne trade volume of LNG over the world. The paper presents current dynamics in
the LNG shipping market focused on three aspects: the evolution of LNG short-term
shipping and market structure, the growth of the LNG fleet and the development of
terminal projects. It is found that with the liberalization of LNG trade, short-term
shipping is rapidly growing, and that the size of LNG tankers and the scale of terminals
are also extending accordingly in order to benefit from economies of scale.
1 | Introduction
Given its ease of use and environmentally-friendliness, Natural Gas is fast becoming
one of the most attractive energy sources in the world. According to the latest report
from EIA (The International Energy Outlook 2010), the total natural gas consumption
worldwide is expected to increase by 44%, from 108 TCF1 in 2007 to 156 TCF in 2035.
Although the global economic recession slowed down demand in 2009, once world
economies begin to recover from the downturn, the demand will rebound. The
consumption of natural gas, projected by EIA, is expected to grow at an average rate of
1.8% from 2007 to 2020. Figure 1 shows the outlook for world energy consumption by
source. Nowadays, the transportation of Natural Gas is mainly done by pipeline and by
shipment in the form of liquefied natural gas (LNG). LNG is natural gas that is stored
and transported in liquid form at atmospheric pressure at a temperature of -161oC
(-256oF). Liquefied gas occupies a volume corresponding of 1/600 of the gas in the
gaseous form which eases the transportation process and allows to ship LNG in
specialized LNG carriers. Most experts indicate that LNG shipping is more competitive
in cases where pipeline transportation is not feasible due to geographic constraints or
not economic, particularly for medium and long distances.
1 TCF: Trillion cubic feet, CM: Cubic meter, BCM: Billion cubic meter, BTU: British thermal unit, MMtpa: Million
Metric ton per annum.

Current issues in shipping, ports and logistics
130
Figure 1. World marketed energy use by fuel type, 1990-2035 (quadrillion BTU)
Source: EIA, International Energy Outlook 2010
Figure 2. Growth rates of marketed production, total natural gas trade and LNG trade
Source: GIIGNL, The LNG Industry 2009
Figure 3. Global gas consumption by LNG, regional pipelines and domestic production
Source: Shell

Wang and Notteboom – World LNG shipping
131
Figure 2 shows the growth rate of LNG trade up to 2009, versus the natural gas trade
and marketed production. Figure 3 presents the gas consumption by types. The
demand for LNG is expected to grow by an average of 10% per annum up to 2015.
With the increase of LNG international seaborne trade, world LNG shipping is booming,
but so far it has received little attention compared to other stages of the gas chain.
There are four key academic publications on LNG market dynamics.
Jensen (2004) made a study on the development of the LNG market with the aim to
examine whether the global market would be shaped by the dynamics of the LNG trade
of the past ten years. Although long-term contracts in LNG have been the vehicle for
sharing the large up-front investment risks that characterize LNG projects, the paper
demonstrates that short-term trading is growing fast in recent years. The study also
shows that declining costs of delivering LNG, the growing diversity of supply sources
and a loosening of the traditional rigid industry structure have created a system which
can transmit price signals freely between isolated regional gas systems, therefore
arbitrage trade is developed. However, as the author noted, the increase of physical
flows between regions does not imply a global market. Since the long term contract
still remains a mainstay of international trade, the growth of short-term trade volume
and price arbitration are limited accordingly. Thus, a LNG global market may well not
live up to expectations.
Through an analysis of recent developments in LNG shipping, Dorigoni et al. (2008)
conclude that LNG shipping is intrinsically related to LNG sector dynamics, especially
since the owners of tankers are companies controlled by gas producers and to a lesser
extent by gas importers. This implies that long-term contracts are often used.
Gkonis and Psaraftis (2009) used a game theoretic approach to study competition in
LNG shipping. The conclusions contain three key points for strategic decision-making by
shipping lines. First, shipping companies must take into account the capacity each
company supplies to the market. Second, the greater versatility and adaptability
achieved by having smaller vessels in the fleet should be compared to the economies
of scale advantages that a portfolio consisting of large scale vessels enjoys. Finally,
non-cooperative collusion may exist in the LNG shipping business.
Engelen and Dullaert (2010) examined transformations in gas shipping aimed at
understanding the features of the gas shipping market, distinct with other main
merchant markets (dry, tanker and container markets). They demonstrate that the LNG
shipping market is transforming and evolving to a more competitive setting. The
operational efficiency in the LNG market can be increased significantly when sellers
take a more thorough stance towards contracting tonnage on the back of product
supply. More flexible contracts will be used in a market with more dispersed sellers and
buyers.

Current issues in shipping, ports and logistics
132
It is particularly interesting to analyze the LNG shipping market in view of
understanding how it is linked to other stages of the chain, how it has developed and
what the drivers behind this development are. This paper aims to find answers to these
questions by presenting current dynamics in the LNG shipping market focused on three
aspects: the evolution of LNG short-term shipping and market structure, the growth of
the LNG fleet and the development of terminal projects. In this way, the paper tries to
add value to existing literature in the field.
This paper is organized as follows: Section 2 discusses the LNG supply chain and
provides a brief overview of world LNG trade. In Section 3, the development of the LNG
shipping market, especially the growing short-term shipping market, and evolutions in
the market structure are analysed in detail. Section 4 looks at the growth of the LNG
fleet and ship distribution by type, age and size. Finally Section 5 provides more insight
in global LNG export and import terminal projects.
2 | LNG trade and the LNG supply chain
2.1 World LNG trade
The dominant LNG consuming area is found in the Asia Pacific region where Japan,
South Korea and Taiwan are the big importers. However, in recent years China and
India are developing infrastructure to accommodate LNG imports. The European
import volume is increasing slowly linked to the growth of pipeline transport capacity
in this region. North America is witnessing a decrease in imports since 2007 as the US
has significantly increased its own production in recent years through the exploration
of unconventional gas (i.e. shale gas).
The main LNG producers and exporters are also situated in the Asia-pacific region,
including Indonesia, Malaysia, Australia and Brunei. However, over the last ten years
the total export volume from this region has remained rather stable. Indonesia and
Malaysia are gradually losing their position to new rivals due to the maturity of gas
fields in these countries. Meanwhile Middle East countries such as Qatar, Oman and
UAE are becoming more important. Africa (Nigeria, Algeria, and Egypt) and America
(Trinidad and Tobago) have also expanded their export capacities in recent years.
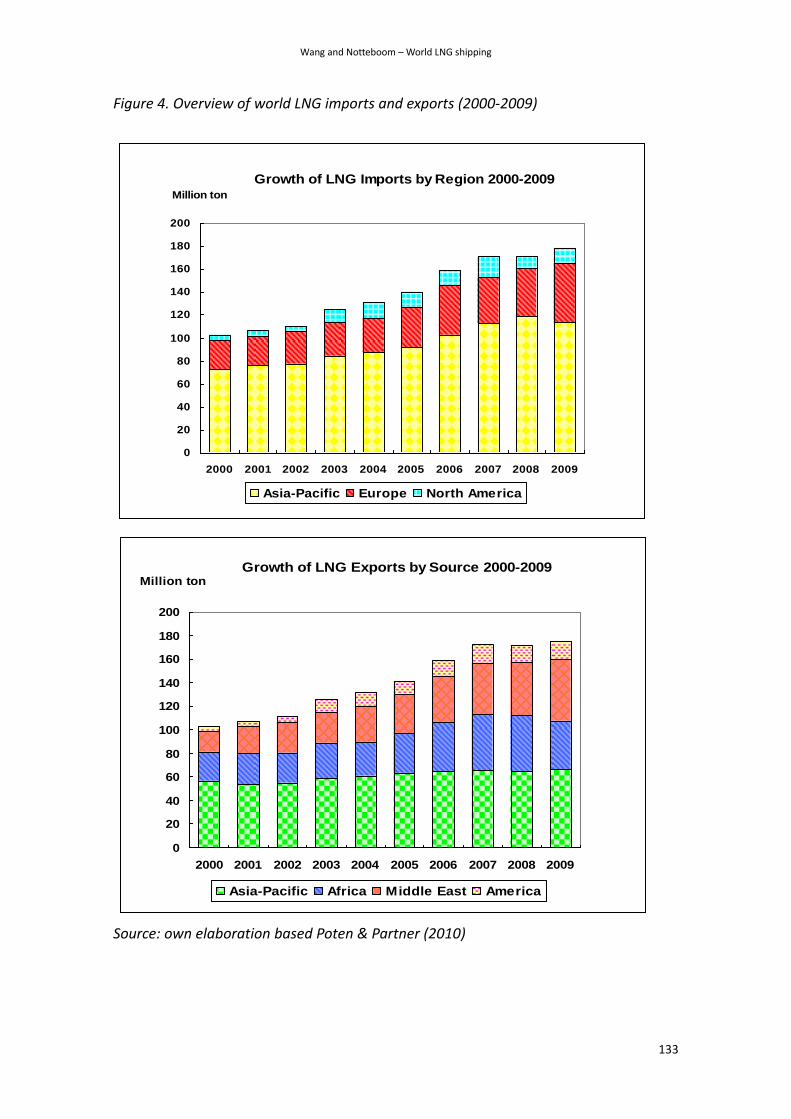
Figures 5 and 6 show the market shares of import and export countries in 2009. Note
that Japan, South Korea and Spain are still the three biggest import countries. At the
export side, Qatar extends its share to more than 20% (49.44 BCM) and delivers its
cargo to 15 countries across three continents. Furthermore, the volume from Trinidad
and Tobago accounts for 8.1% of total exports in 2009.
Wang and Notteboom – World LNG shipping
133
Figure 4. Overview of world LNG imports and exports (2000-2009)
Source: own elaboration based Poten & Partner (2010)
Growth of LNG Imports by Region 2000-2009
0
20
40
60
80
100
120
140
160
180
200
2000 2001 2002 2003 2004 2005 2006 2007 2008 2009
Million ton
Asia-Pacific Europe North America
Growth of LNG Exports by Source 2000-2009
0
20
40
60
80
100
120
140
160
180
200
2000 2001 2002 2003 2004 2005 2006 2007 2008 2009
Million ton
Asia-Pacific Africa Middle East America
Current issues in shipping, ports and logistics
134
Figure 5. LNG imports in 2009 (242.77 BCM)
Figure 6. LNG exports in 2009 (242.77 BCM)
Source: own elaboration based on BP Statistical review (2009)
2.2 Overview of the LNG supply chain
Four distinct activities can be identified in the LNG supply chain (Figure 7): gas
exploration, liquefaction, shipping and regasification. For each of these stages,
advances in technology and design have led to significant cost savings and efficiency
improvements, which have enhanced the competitiveness of LNG.
Figure 7. The LNG supply chain
Source: own elaboration based on Nikhalat and Zavitsas (2010)
Wang and Notteboom – World LNG shipping
135
Gas production is a capital intensive activity requiring large investments. However, the
amount of investment varies depending on the characteristics of the gas reservoir.
Normally gas production including gas processing and associated pipelines constitutes
15 to 20% of the cost of an entire LNG project. The largest cost component in the LNG
value chain is the liquefaction plant (30 to 45% of total costs), which consists of one or
more “trains” (production unit) to purify LNG by removing contaminants and liquefying
gas by the use of refrigerants. LNG transport (10 to 30% of total cost) requires special
tankers which are double hulled and insulated as to ship the cargo at a temperature of
minus 161°C. Since an increasing number of shipyards is equipped to build LNG tankers,
the price of purchasing an LNG tanker declined in the last decade. In addition, with the
growth of ship size (from 138,000 CM to 260,000 CM) and technological advances in
propulsion systems, the unit transport cost has been considerably decreased.
The final part of the LNG supply chain concerns storage and regasification at the
receiving terminal (15 to 25% of total costs). Through the regasification process
onshore, the liquid is transformed to natural gas and then pumped to grids for delivery
to the end users. These users can be power plants (30% of global use in 2009),
industries for plastics and fertilizers (27%) and residents for commercial use (21%) (EIA,
2010b).
2.3 Effects of technology on cost reduction
LNG projects are highly capital intensive, most projects costing several billion dollars.
However, economies of scale are significant. The reduction of unit costs of liquefaction
plants is not only achieved by increasing the size of each processing train (from 3.5
MMtpa in 2005 to 7.8 MMtpa (Qatar Projects) in 2010), but by setting up new trains as
well. Adding a second train once a plant is built can reduce the unit cost of a
liquefaction train by 20 to 30% (Cornot-Gandolphe 2005). In addition, technological
progress over the past four decades has led to a sharp decrease in investment and
operating costs of liquefaction plants. The average unit cost for a liquefaction plant
dropped from $350 per ton per year of capacity in the mid 1990s to approximately
$200 in 2010 (Figure 8).
Transport costs are largely a function of the distance between the liquefaction and
regasification terminals. Using a larger number of smaller carriers offers more flexibility
and reduces storage requirements but raises unit shipping costs. The largest LNG
carriers today have a maximum capacity of 220,000-266,000 CM. Substantial cost
reductions have been achieved in recent decades thanks to economies of scale.
Regasification plant construction costs depend on throughput capacity, land
development and labor costs (which vary considerably according to location), and
storage capacity. Economies of scale are most significant for storage. Tanks with a
storage capacity of about 480,000 CM (the largest feasible at present) are currently the
optimal size.
Current issues in shipping, ports and logistics
136
Figure 8. Reduction in unit costs of new LNG projects
Source: IEA
2.4 Advantages of LNG compared to transport by pipeline
Gas producers have to consider which transport method they will use for delivery to
the markets: LNG shipping or pipelines. But where such a choice exists there is a
marked difference in cost build-up versus distance to market. Research by ENI shows
that an LNG project, along the chain from production to the market, has a high cost
threshold, but distance to the market is not as crucial as for pipeline delivery. The costs
of a gas pipeline are highly sensitive to scale and the distance to the market. Figure 9
demonstrates that LNG shipping is more competitive than pipeline on long distances.
The LNG project break-even distance versus a 42-inch onshore pipeline is 2,500 miles
(4,000 km) and 1,240 miles (2,000 km) for an offshore pipeline (Ndao 2004).
Figure 9. Illustrative costs of pipeline vs. LNG
Source: ENI
$per tonne of annual capacity
0
100
200
300
400
500
600
700
800
mid 1990s 2002 2010 2030
Regasification
Shipping
Liquefaction
Wang and Notteboom – World LNG shipping
137
However, costs are not the only determinant for the choice between LNG and pipeline
supply. Pipelines may have to cross many counties, whereas LNG trade normally only
involves an end-to-end route from port of loading to port of discharge. The absence of
transit negotiations and treaties (and possibly high transit costs) simplifies the project
development process in the case of LNG and makes for shorter development times
(and may offer an additional cost advantage). ‘Security’ aspects are also a major
concern. An extended pipeline system transiting many countries poses supply security
issues. For LNG these are more contained as transit through other countries is limited.
Moreover, with regards to safety performance, LNG has a very good track record. The
effect of a shipping accident at sea would not be catastrophic and would only have a
limited environmental impact (Clingendeal 2003).
Diversity of supply is yet another aspect of ‘security’. For a number of markets LNG
offers a realistic alternative to a single dominant supply source. As the LNG market
grows, so does its ability to offer flexibility of supply between markets: if a market
cannot take delivery of a cargo, the ship can be redirected to another market. If a
supply source experiences a problem, the cargo can be shipped to the market from
another source. In addition, such flexibility also encourages gas sellers to do arbitrage
trade taking advantage of a price difference between the markets to maximize their
profit (Clingendeal 2003). Hence, it can be concluded that the flexibility of LNG supplies
and arbitrage opportunities between different consuming areas are among the biggest
advantages of LNG over pipelines.
3 | Dynamics in the LNG shipping market
3.1 Evolution of the short-term shipping market
The LNG industry originally developed as a niche business where a relatively small
number of sellers supplied specific regional markets, using a traditional approach with
tankers dedicated to bilateral trades for long-term contracts (normally more than 20
years), and there is little in the way of spot/ short-term trade (less than 3 years) or
cargo diversions from the originally intended destination. In the early of 1990s, the
LNG world was firmly divided between the Atlantic Basin and Asia Pacific markets
(Figure 10). There was minimal trade between these two regions, and consequently
little or no market or price interaction (Thompson et al, 2009). The capital-intensive
LNG projects obliged the investors to conclude long-term commitments with customers
in order to minimize risks and secure their return on investment.
However, with debottlenecking and the expansion of liquefaction plants, more surplus
volume was offered which either effectively rolled into long-term contracts and sold to
the same buyers or flowed into the alternative markets. As a result of the latter a
short-term market started to emerge and regionalization of the industry began to
Current issues in shipping, ports and logistics
138
break down. Other drivers favouring the short-term market include:
Flexibility of supply: once the long-term buyers couldn’t absorb the contracted
volume, with more flexible contract terms (i.e. no destination restriction clause),
the sellers can divert the cargo to alternative buyers in order to arbitrage prices
between the markets
Quick response to gas demand: once natural events occurred upon buyers (i.e.
pipeline supply is curtailed or a sudden increase of seasonal demand), the buyers
can search for gas from other supplies.
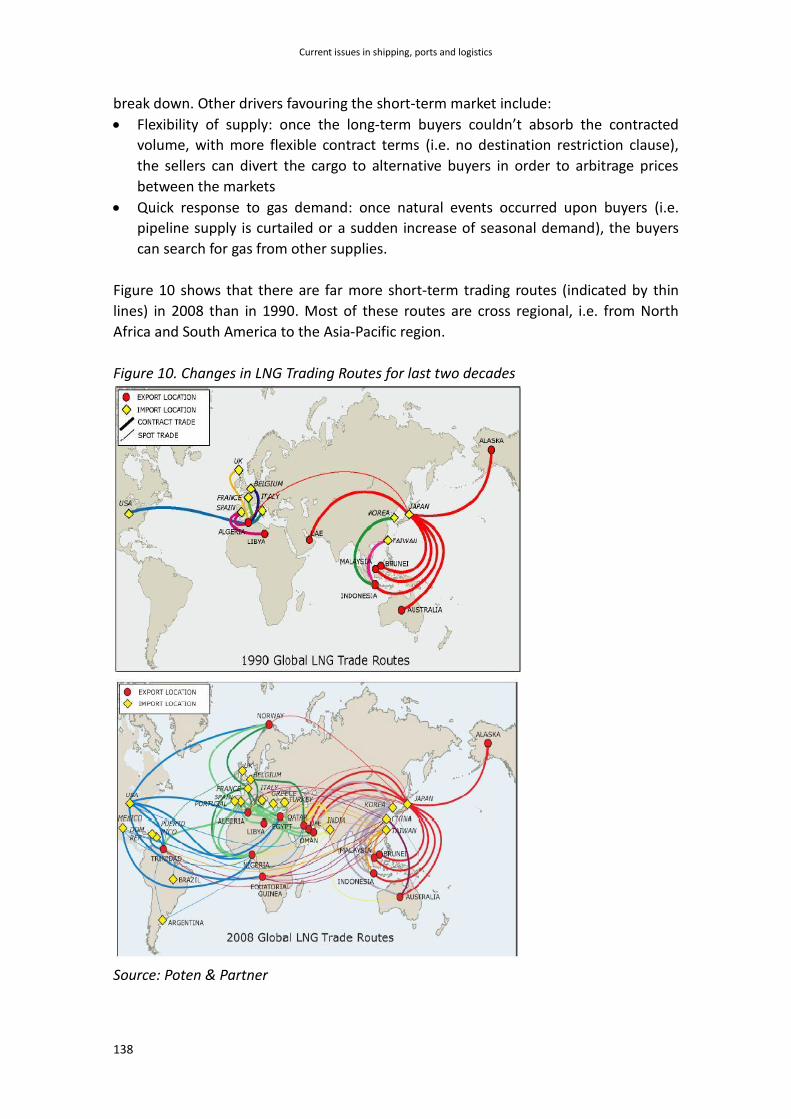
Figure 10 shows that there are far more short-term trading routes (indicated by thin
lines) in 2008 than in 1990. Most of these routes are cross regional, i.e. from North
Africa and South America to the Asia-Pacific region.
Figure 10. Changes in LNG Trading Routes for last two decades
Source: Poten & Partner
Wang and Notteboom – World LNG shipping
139
While a very small short-term LNG market has been in existence for nearly a decade, it
has grown rapidly in the past several years. In 1997, short-term LNG transactions
accounted for only 1.5% of international LNG trade. In the following four years the
volume of short term transactions increased six fold and in 2001 accounted for 7.8% of
international trade. In late 2008 the share amounted to 17.8%. As estimated by
Thompson et al (2009), short-term trade volumes will increase at an average rate of
about 11% per annum between 2008 and 2015, with most of the growth occurring
between 2011 and 2014. This short-term growth rate is faster than total growth in the
LNG market, causing the share of the short-term trade in total trade to increase from
20 to 25% during this period.
Although it is envisioned that the short-term market is continuously growing, “the
long-term contracts would be still alive and well” (Jensen, 2004) since no supplier has
yet undertaken to build a new facility on a speculative basis without a contracted
outlet. But for short-term markets, suppliers in different regions have their own
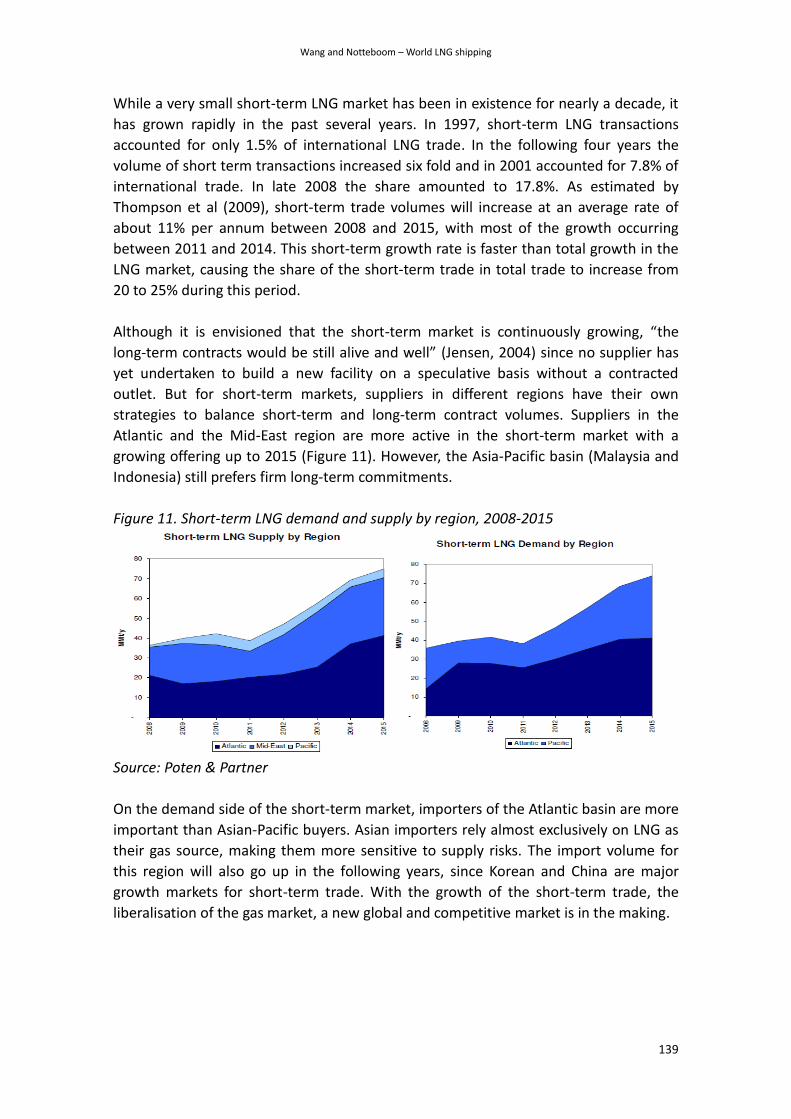
strategies to balance short-term and long-term contract volumes. Suppliers in the
Atlantic and the Mid-East region are more active in the short-term market with a
growing offering up to 2015 (Figure 11). However, the Asia-Pacific basin (Malaysia and
Indonesia) still prefers firm long-term commitments.
Figure 11. Short-term LNG demand and supply by region, 2008-2015
Source: Poten & Partner
On the demand side of the short-term market, importers of the Atlantic basin are more
important than Asian-Pacific buyers. Asian importers rely almost exclusively on LNG as
their gas source, making them more sensitive to supply risks. The import volume for
this region will also go up in the following years, since Korean and China are major
growth markets for short-term trade. With the growth of the short-term trade, the
liberalisation of the gas market, a new global and competitive market is in the making.
Current issues in shipping, ports and logistics
140
3.2 The structure of the LNG Shipping Market
The LNG market developed for a long time as an oligopoly market which was
dominated by a few big state-controlled or regulated oil and gas companies and a few
independent shipowners. As part of the global trend towards privatization of the
energy markets, the transformations taking place in the LNG market are heavily
influenced by deregulation and liberalization in both the upstream and downstream
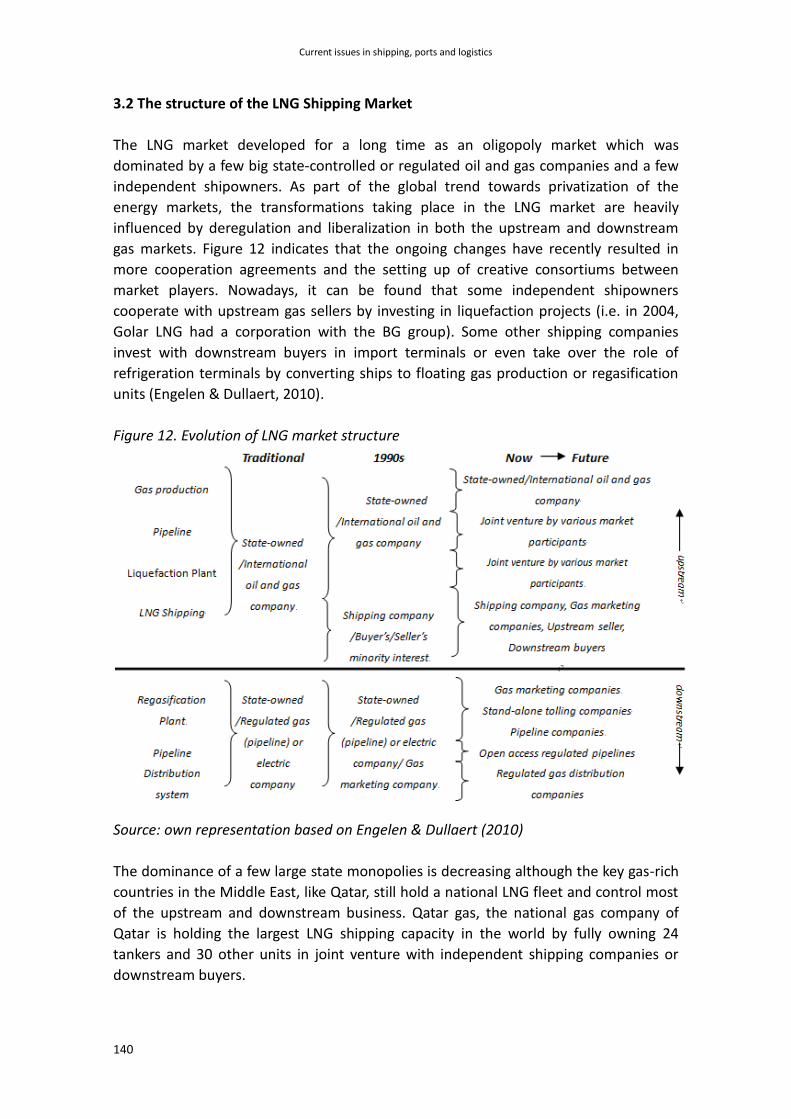
gas markets. Figure 12 indicates that the ongoing changes have recently resulted in
more cooperation agreements and the setting up of creative consortiums between
market players. Nowadays, it can be found that some independent shipowners
cooperate with upstream gas sellers by investing in liquefaction projects (i.e. in 2004,
Golar LNG had a corporation with the BG group). Some other shipping companies
invest with downstream buyers in import terminals or even take over the role of
refrigeration terminals by converting ships to floating gas production or regasification
units (Engelen & Dullaert, 2010).
Figure 12. Evolution of LNG market structure
Source: own representation based on Engelen & Dullaert (2010)
The dominance of a few large state monopolies is decreasing although the key gas-rich
countries in the Middle East, like Qatar, still hold a national LNG fleet and control most
of the upstream and downstream business. Qatar gas, the national gas company of
Qatar is holding the largest LNG shipping capacity in the world by fully owning 24
tankers and 30 other units in joint venture with independent shipping companies or
downstream buyers.

Wang and Notteboom – World LNG shipping
141
Among the top nine shipowners there are four independent shipowners (NYK, MOL,
Teekay and K-line). Of the 57 owners around thirty are shipping companies. More
individual shipping companies are entering the market, but a portion of the ship
capacity of these independent shipping companies is jointly owned by upstream sellers
or downstream buyers. Roughly 74% of the current fleet is under joint venture and
only 26% is wholly owned by single owners.
Figure 13. Distribution of the LNG tanker capacity by shipowners
Source: own elaboration based on Clarkson data 2010
4 | Dynamics in the LNG Fleet
4.1 The development of the LNG fleet
The first LNG cargo was shipped in 1959 by Methane Pioneer. The construction of the
first large-scale liquefaction plant took place in 1964 in Algeria. The LNG trade started
from North Africa to Europe and the USA, and from South East Asia to Japan. The 1973
oil crisis intervened and the uncertainty this created, especially over future gas export
prices, resulted in projects being deferred or abandoned altogether. Investor
confidence only revived in the early 1990s. Trade quadrupled from 48 BCM in 1984 to
242 BCM in 2009.
The development of the LNG fleet followed the LNG trade climate. Shipowners are
sensitive to the volatility in the market. They order more ships when the market goes
well and try to reduce capacity when the market is weak. The time-lag between new
orders and deliveries creates cycles in the LNG shipping market of roughly 3-4 years
(Figure 14).
Current issues in shipping, ports and logistics
142
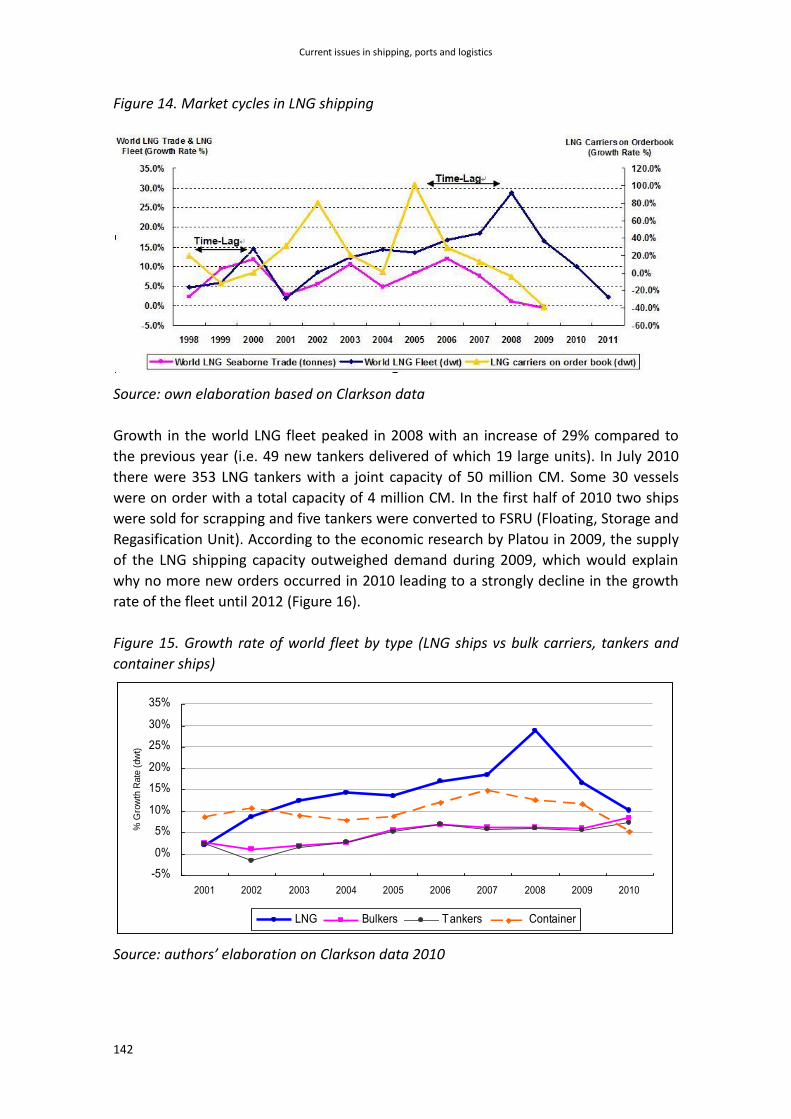
Figure 14. Market cycles in LNG shipping
Source: own elaboration based on Clarkson data
Growth in the world LNG fleet peaked in 2008 with an increase of 29% compared to
the previous year (i.e. 49 new tankers delivered of which 19 large units). In July 2010
there were 353 LNG tankers with a joint capacity of 50 million CM. Some 30 vessels
were on order with a total capacity of 4 million CM. In the first half of 2010 two ships
were sold for scrapping and five tankers were converted to FSRU (Floating, Storage and
Regasification Unit). According to the economic research by Platou in 2009, the supply
of the LNG shipping capacity outweighed demand during 2009, which would explain
why no more new orders occurred in 2010 leading to a strongly decline in the growth
rate of the fleet until 2012 (Figure 16).
Figure 15. Growth rate of world fleet by type (LNG ships vs bulk carriers, tankers and
container ships)
Source: authors’ elaboration on Clarkson data 2010
-5%
0%
5%
10%
15%
20%
25%
30%
35%
2001 2002 2003 2004 2005 2006 2007 2008 2009 2010
% G
row
th R
ate
(dw
t)
LNG Bulkers Tankers Container
Wang and Notteboom – World LNG shipping
143
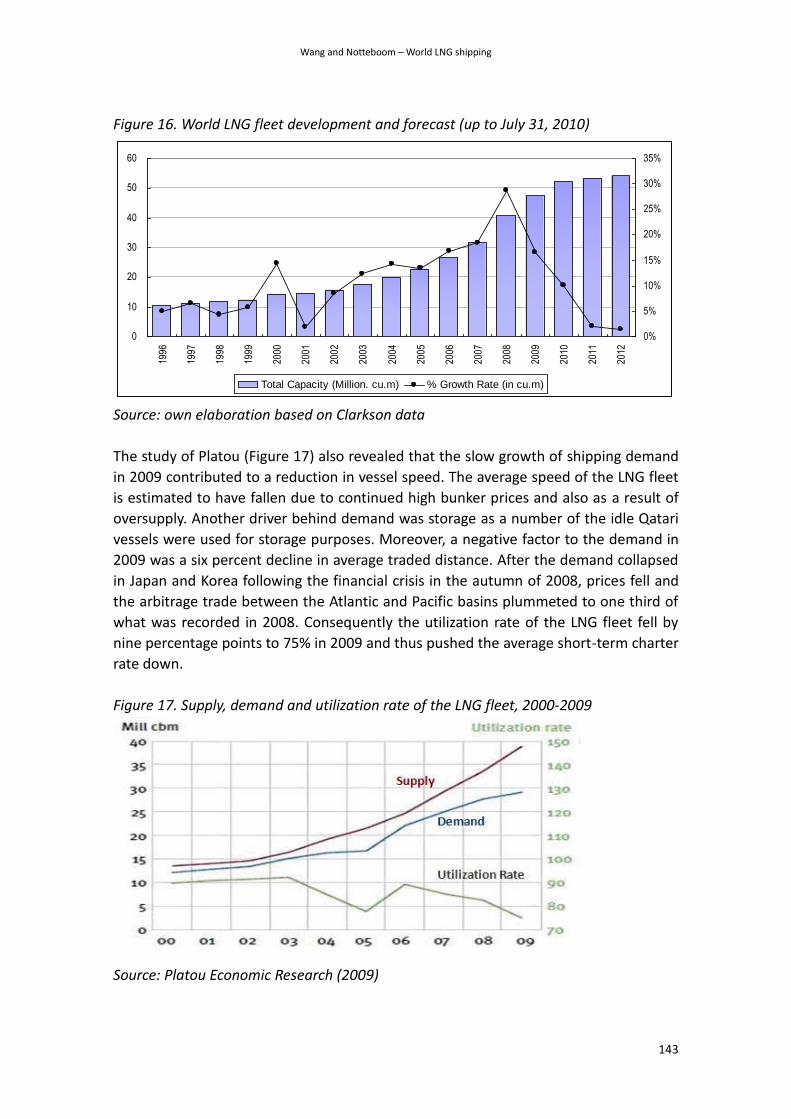
Figure 16. World LNG fleet development and forecast (up to July 31, 2010)
Source: own elaboration based on Clarkson data
The study of Platou (Figure 17) also revealed that the slow growth of shipping demand
in 2009 contributed to a reduction in vessel speed. The average speed of the LNG fleet
is estimated to have fallen due to continued high bunker prices and also as a result of
oversupply. Another driver behind demand was storage as a number of the idle Qatari
vessels were used for storage purposes. Moreover, a negative factor to the demand in
2009 was a six percent decline in average traded distance. After the demand collapsed
in Japan and Korea following the financial crisis in the autumn of 2008, prices fell and
the arbitrage trade between the Atlantic and Pacific basins plummeted to one third of
what was recorded in 2008. Consequently the utilization rate of the LNG fleet fell by
nine percentage points to 75% in 2009 and thus pushed the average short-term charter
rate down.
Figure 17. Supply, demand and utilization rate of the LNG fleet, 2000-2009
Source: Platou Economic Research (2009)
0
10
20
30
40
50
6019
96
1997
1998
1999
2000
2001
2002
2003
2004
2005
2006
2007
2008
2009
2010
2011
2012
0%
5%
10%
15%
20%
25%
30%
35%
Total Capacity (Million. cu.m) % Growth Rate (in cu.m)
Current issues in shipping, ports and logistics
144
In 2010, the situation improved. On the demand side, volumes from the new LNG
projects and an increase in average distances contributed to a marginally higher growth
in demand compared to supply. This led to a small improvement in the utilization rate
and thus spot rates. An increase in arbitrage trade or storage may improve the
utilization rate.
4.2 Ship distribution by type, size and age
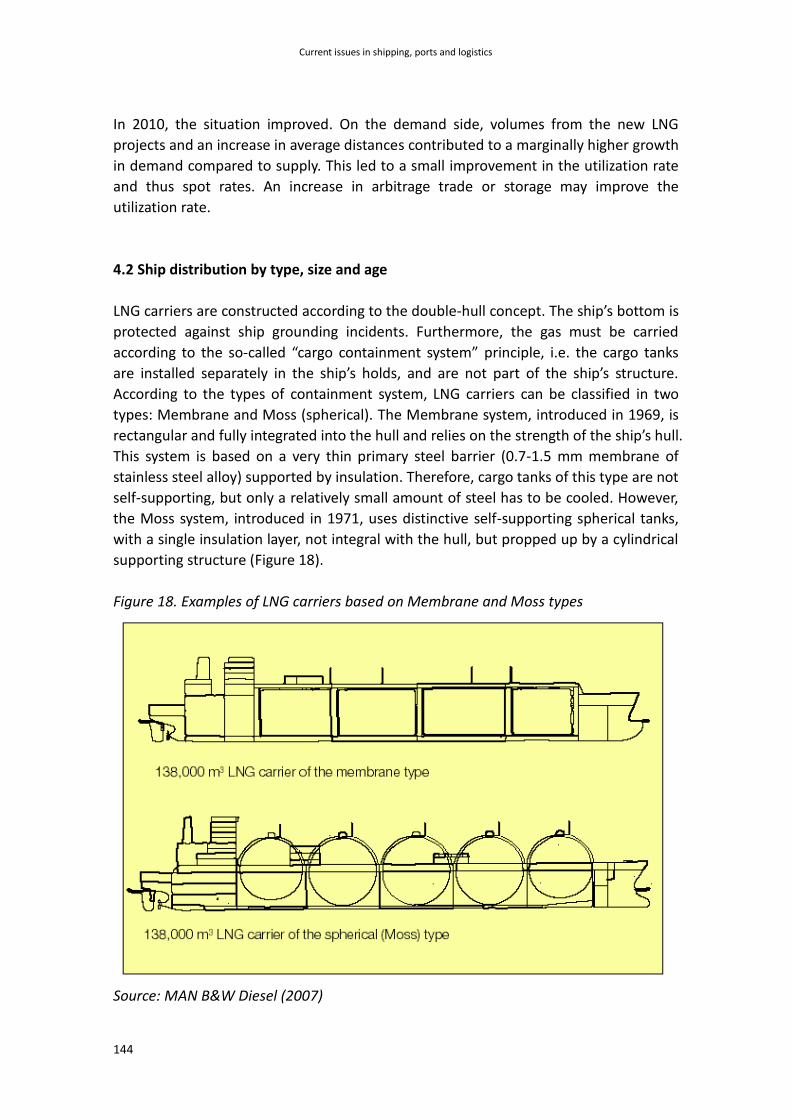
LNG carriers are constructed according to the double-hull concept. The ship’s bottom is
protected against ship grounding incidents. Furthermore, the gas must be carried
according to the so-called “cargo containment system” principle, i.e. the cargo tanks
are installed separately in the ship’s holds, and are not part of the ship’s structure.
According to the types of containment system, LNG carriers can be classified in two
types: Membrane and Moss (spherical). The Membrane system, introduced in 1969, is
rectangular and fully integrated into the hull and relies on the strength of the ship’s hull.
This system is based on a very thin primary steel barrier (0.7-1.5 mm membrane of
stainless steel alloy) supported by insulation. Therefore, cargo tanks of this type are not
self-supporting, but only a relatively small amount of steel has to be cooled. However,
the Moss system, introduced in 1971, uses distinctive self-supporting spherical tanks,
with a single insulation layer, not integral with the hull, but propped up by a cylindrical
supporting structure (Figure 18).
Figure 18. Examples of LNG carriers based on Membrane and Moss types
Source: MAN B&W Diesel (2007)

Wang and Notteboom – World LNG shipping
145
Nowadays, membrane tanks are most common because of their higher utilization of
the hull volume for cargo capacity (i.e. for the same cargo capacity, the ship dimensions
are smaller than for a similar spherical (Moss) type LNG carrier). However, the boil-off
gas amount is higher for the membrane tank type compared to that of the spherical
tank type. Prismatic membrane tanks have been introduced which largely reduce the
amount of boil-off gas. In addition, spherical tanks are more expensive (20 to 30%
more than ships with membrane tanks) and require a longer construction period.
Figure 19. Distribution of containment systems
Source: own elaboration based on Clarkson data
Another notable characteristic of an LNG carrier is its propulsion system based on
steam turbines, a technique no longer applied to other ship types. An LNG carrier can
burn its boil-off gas in the ship’s boilers. Some 273 ships (77%) of the current fleet use
steam turbines. However, diesel engines and dual-fuel diesel-electric engines are more
and more applied to newer tankers in view of improving fuel efficiency.
LNG carriers can be classified according to ship dimensions, as shown in Table 1. The
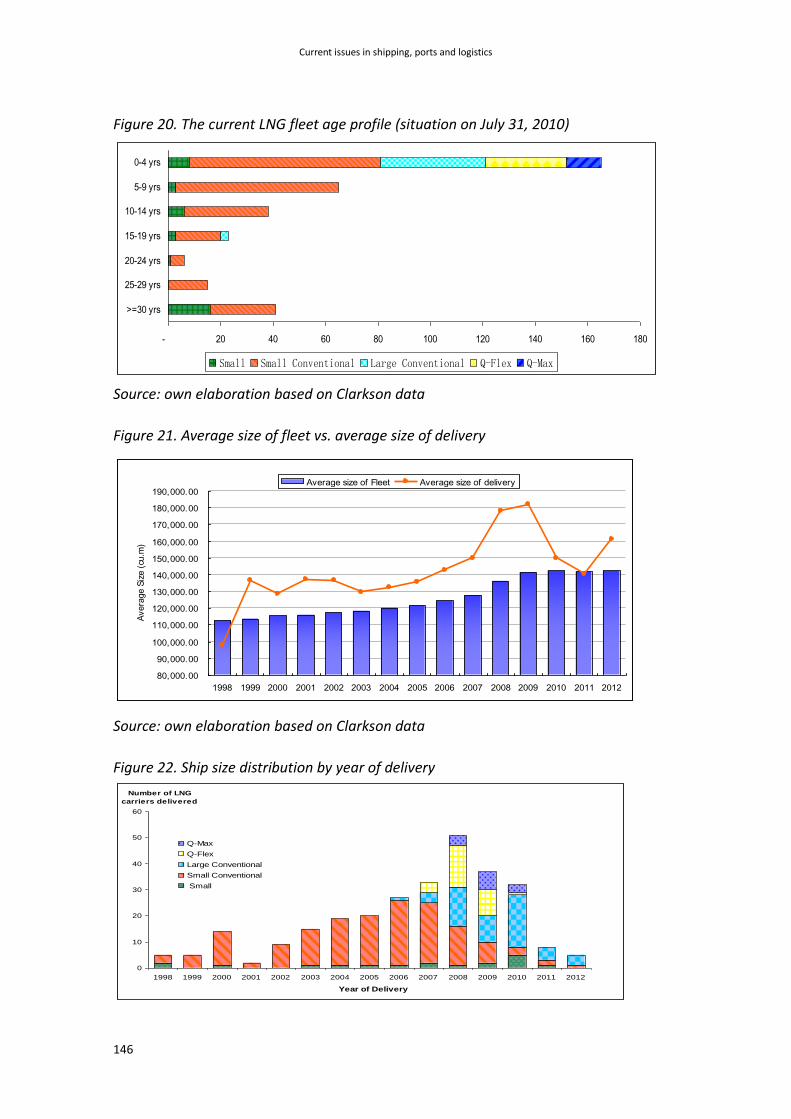
LNG fleet may be the youngest fleet in the shipping industry. Figure 20 illustrates that
more than 50% of the fleet is under the age of four years. All large ships (Q-Flex and
Q-Max) are within this class.
Table 1. LNG carrier classes by size
LNG carrier classes Ship size - LNG capacity
Small up to 90,000 CM
Small Conventional 120,000 - 149,999 CM
Large Conventional 150,000 - 180,000 CM
Q-flex 200,000 - 220,000 CM
Q-max More than 260,000 CM
Current issues in shipping, ports and logistics
146
Figure 20. The current LNG fleet age profile (situation on July 31, 2010)
Source: own elaboration based on Clarkson data
Figure 21. Average size of fleet vs. average size of delivery
Source: own elaboration based on Clarkson data
Figure 22. Ship size distribution by year of delivery
- 20 40 60 80 100 120 140 160 180
>=30 yrs
25-29 yrs
20-24 yrs
15-19 yrs
10-14 yrs
5-9 yrs
0-4 yrs
Small Small Conventional Large Conventional Q-Flex Q-Max
80,000.00
90,000.00
100,000.00
110,000.00
120,000.00
130,000.00
140,000.00
150,000.00
160,000.00
170,000.00
180,000.00
190,000.00
1998 1999 2000 2001 2002 2003 2004 2005 2006 2007 2008 2009 2010 2011 2012
Avera
ge S
ize (
cu.m
)
Average size of Fleet Average size of delivery
0
10
20
30
40
50
60
1998 1999 2000 2001 2002 2003 2004 2005 2006 2007 2008 2009 2010 2011 2012
Year of Delivery
Number of LNG
carriers delivered
Q-Max
Q-Flex
Large Conventional
Small Conventional
Small
Wang and Notteboom – World LNG shipping
147
Source: own elaboration based on Clarkson data
The average size of the LNG fleet has been continuously growing for the last decade,
from 112,649 CM in 1998 to 136,367 CM in 2008. The average size of the current fleet
(353 ships in total) is 142,092 CM and it is expected to remain the same for next two
years (Figure 21). Figure 22 illustrates the distribution of ship size by year of delivery.
Several large ships owned by Qatar gas were delivered in the last couple of years (16
Q-flex and 4 Q-Max).
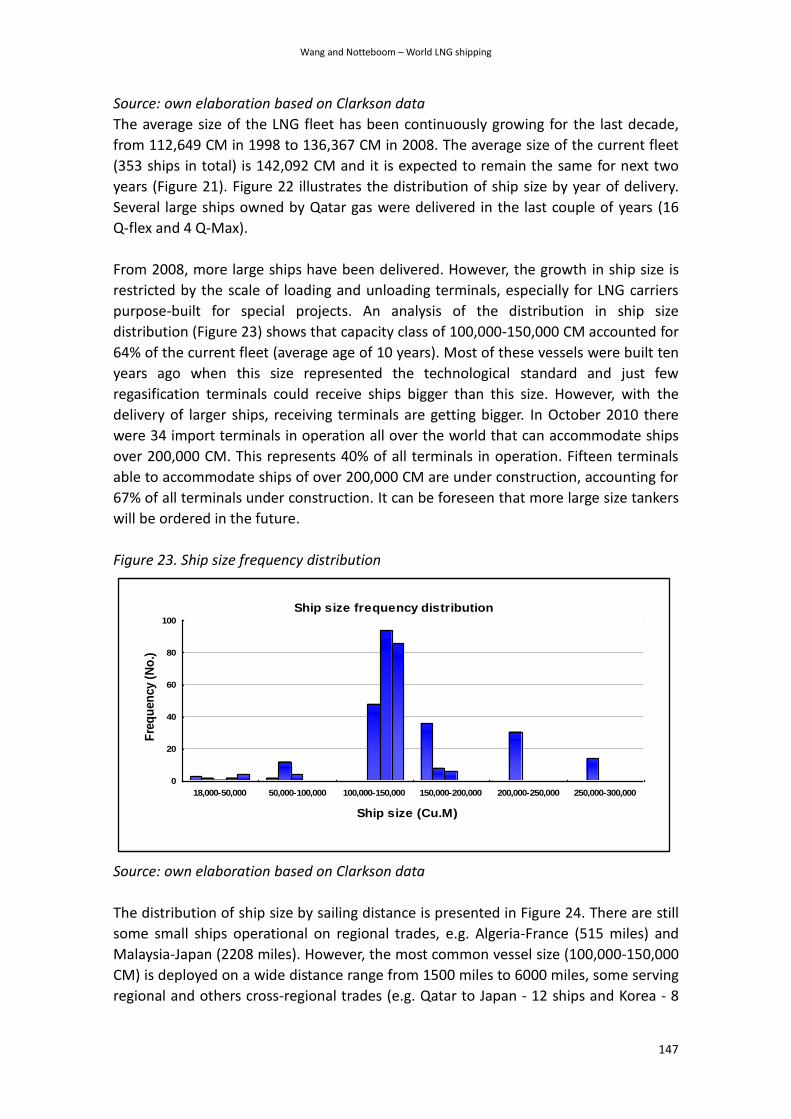
From 2008, more large ships have been delivered. However, the growth in ship size is
restricted by the scale of loading and unloading terminals, especially for LNG carriers
purpose-built for special projects. An analysis of the distribution in ship size
distribution (Figure 23) shows that capacity class of 100,000-150,000 CM accounted for
64% of the current fleet (average age of 10 years). Most of these vessels were built ten
years ago when this size represented the technological standard and just few
regasification terminals could receive ships bigger than this size. However, with the
delivery of larger ships, receiving terminals are getting bigger. In October 2010 there
were 34 import terminals in operation all over the world that can accommodate ships
over 200,000 CM. This represents 40% of all terminals in operation. Fifteen terminals
able to accommodate ships of over 200,000 CM are under construction, accounting for
67% of all terminals under construction. It can be foreseen that more large size tankers
will be ordered in the future.
Figure 23. Ship size frequency distribution
Source: own elaboration based on Clarkson data
The distribution of ship size by sailing distance is presented in Figure 24. There are still
some small ships operational on regional trades, e.g. Algeria-France (515 miles) and
Malaysia-Japan (2208 miles). However, the most common vessel size (100,000-150,000
CM) is deployed on a wide distance range from 1500 miles to 6000 miles, some serving
regional and others cross-regional trades (e.g. Qatar to Japan - 12 ships and Korea - 8
Ship size frequency distribution
0
20
40
60
80
100
18,000-50,000 50,000-100,000 100,000-150,000 150,000-200,000 200,000-250,000 250,000-300,000
Ship size (Cu.M)
Fre
qu
en
cy (
No
.)

Current issues in shipping, ports and logistics
148
ships). The newest classes of large ships, Q-Flex and Q-Max, are deployed on the routes
between Qatar and Europe/US. Qatar has become the biggest LNG exporter in the
world despite its location far away from the markets: the average distance to Europe
amounts to 5,737 miles, Japan is 6,508 miles away and the US 9,680 miles. Qatar Gas
uses large ships to reduce unit transport costs and to keep its competitive position.
Figure 24. LNG tanker size and distance covered
Source: own elaboration based on data of World LNG Journal (Aug, 2010)
5 | Overview of terminal projects
LNG terminals both in export countries and import countries play an important role for
LNG seaborne trade. Once an LNG project is launched, the project developers have to
finance and construct liquefaction or regasification facilities along the quay side. Export
terminals typically consist of pipelines, liquefaction plants, storage tankers and loading
facilities. Pipelines convey the natural gas from the gas fields to the liquefaction plant.
After the liquefying process the liquids are transferred to storage tanks, and then finally
loaded in an LNG carrier.
In October 2010 there were 56 export terminal projects in operation in 18 countries.
The aggregate capacity of all liquefaction plants amounted to 274.2 Million ton per
year (Table 2). There are a number of projects under construction and others are
planned. The Pacific region has a lot of projects under construction or planned.
Australia is also important in this respect. Currently, there are three terminal projects
under construction in Australia. By 2014, the maximum loading volume will reach 47.85
million ton per year, overtaking Indonesia to become the biggest LNG exporter in the
Pacific region. Moreover, nine projects are planned in Australia which could make
Australia the biggest LNG exporter in the world. Iran and Papua New Guinea will join
the list of LNG exporters in 2012. Canada and Brazil might be potential exporters since

Wang and Notteboom – World LNG shipping
149
they already plan to develop liquefaction facilities.
Table 2. Overview of export terminal projects in operation in 2010
Region Export Country No. of
projects No. of trains
Total Liquefaction
Capacity (MMt/year)
Atlantic
Algeria 6 21 28.4
Nigeria 4 6 21.9
Trinidad Tobago 4 4 15.1
Egypt 3 3 12.2
Norway 1 1 4.3
Equatorial Guinea 1 1 3,72
Libya 1 4 0.4
Middle
East
Qatar 9 12 61.8
Oman 2 3 9.9
Abu Dhabi 2 3 5.8
Yemen 1 2 6.7
Pacific
Indonesia 10 16 38.8
Australia 5 6 19.6
Malaysia 3 8 22.7
Brunei 1 5 7.2
Peru 1 1 4.5
Russia 1 2 9.6
USA 1 1 1.3
Total 18 56 99 270.23
Source: Poten & Partner
Figure 25. Annual liquefaction capacity of export terminals projects by status (situation
in October 2010)
Source: authors’ elaboration on Poten & Partner
0
40
80
120
160
200
240
280
320
Operating Capacity Under construction
Capacity
Plan Capacity
MM
t/y
Atlantic Middle East Pacific
Current issues in shipping, ports and logistics
150
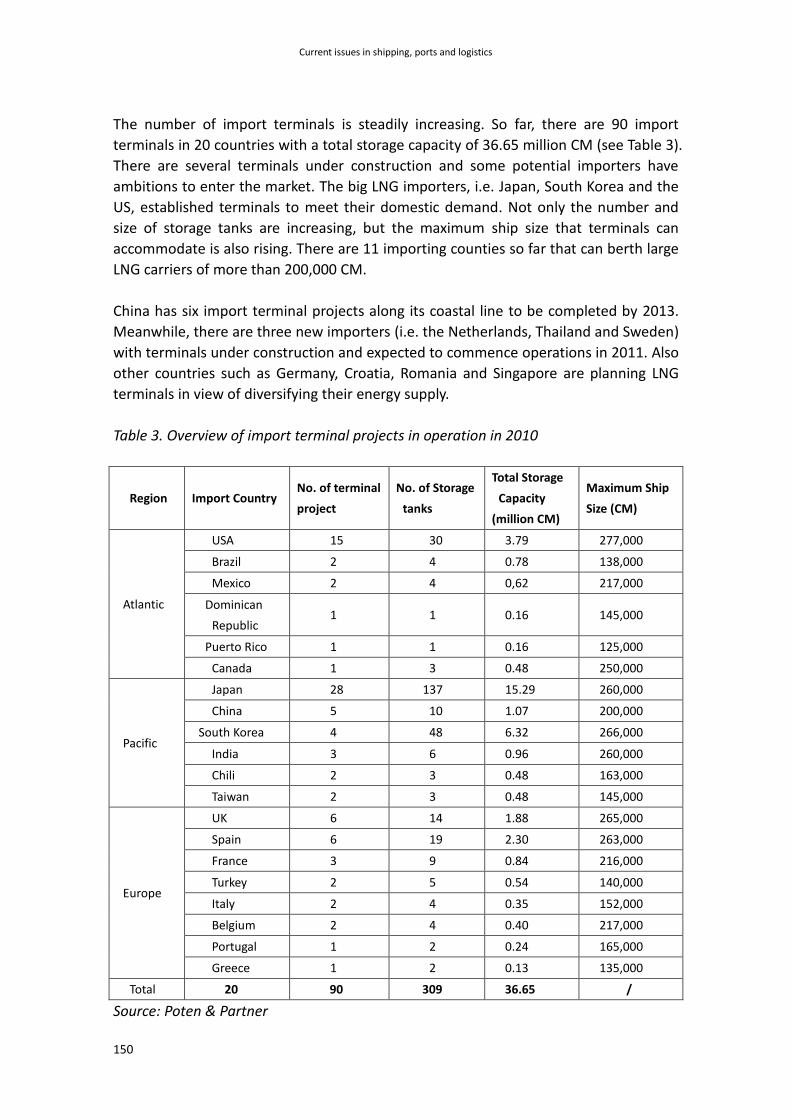
The number of import terminals is steadily increasing. So far, there are 90 import
terminals in 20 countries with a total storage capacity of 36.65 million CM (see Table 3).
There are several terminals under construction and some potential importers have
ambitions to enter the market. The big LNG importers, i.e. Japan, South Korea and the
US, established terminals to meet their domestic demand. Not only the number and
size of storage tanks are increasing, but the maximum ship size that terminals can
accommodate is also rising. There are 11 importing counties so far that can berth large
LNG carriers of more than 200,000 CM.
China has six import terminal projects along its coastal line to be completed by 2013.
Meanwhile, there are three new importers (i.e. the Netherlands, Thailand and Sweden)
with terminals under construction and expected to commence operations in 2011. Also
other countries such as Germany, Croatia, Romania and Singapore are planning LNG
terminals in view of diversifying their energy supply.
Table 3. Overview of import terminal projects in operation in 2010
Region Import Country No. of terminal
project
No. of Storage
tanks
Total Storage
Capacity
(million CM)
Maximum Ship
Size (CM)
Atlantic
USA 15 30 3.79 277,000
Brazil 2 4 0.78 138,000
Mexico 2 4 0,62 217,000
Dominican
Republic 1 1 0.16 145,000
Puerto Rico 1 1 0.16 125,000
Canada 1 3 0.48 250,000
Pacific
Japan 28 137 15.29 260,000
China 5 10 1.07 200,000
South Korea 4 48 6.32 266,000
India 3 6 0.96 260,000
Chili 2 3 0.48 163,000
Taiwan 2 3 0.48 145,000
Europe
UK 6 14 1.88 265,000
Spain 6 19 2.30 263,000
France 3 9 0.84 216,000
Turkey 2 5 0.54 140,000
Italy 2 4 0.35 152,000
Belgium 2 4 0.40 217,000
Portugal 1 2 0.24 165,000
Greece 1 2 0.13 135,000
Total 20 90 309 36.65 /
Source: Poten & Partner
Wang and Notteboom – World LNG shipping
151
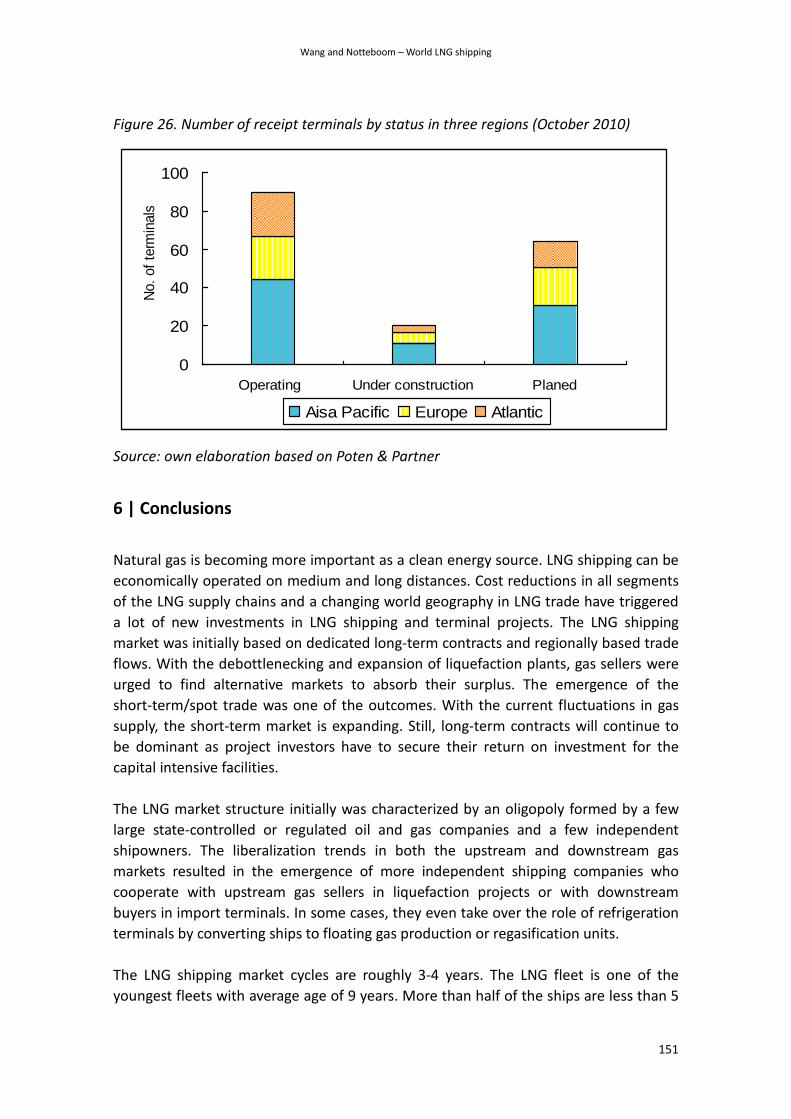
Figure 26. Number of receipt terminals by status in three regions (October 2010)
Source: own elaboration based on Poten & Partner
6 | Conclusions
Natural gas is becoming more important as a clean energy source. LNG shipping can be
economically operated on medium and long distances. Cost reductions in all segments
of the LNG supply chains and a changing world geography in LNG trade have triggered
a lot of new investments in LNG shipping and terminal projects. The LNG shipping
market was initially based on dedicated long-term contracts and regionally based trade
flows. With the debottlenecking and expansion of liquefaction plants, gas sellers were
urged to find alternative markets to absorb their surplus. The emergence of the
short-term/spot trade was one of the outcomes. With the current fluctuations in gas
supply, the short-term market is expanding. Still, long-term contracts will continue to
be dominant as project investors have to secure their return on investment for the
capital intensive facilities.
The LNG market structure initially was characterized by an oligopoly formed by a few
large state-controlled or regulated oil and gas companies and a few independent
shipowners. The liberalization trends in both the upstream and downstream gas
markets resulted in the emergence of more independent shipping companies who
cooperate with upstream gas sellers in liquefaction projects or with downstream
buyers in import terminals. In some cases, they even take over the role of refrigeration
terminals by converting ships to floating gas production or regasification units.
The LNG shipping market cycles are roughly 3-4 years. The LNG fleet is one of the
youngest fleets with average age of 9 years. More than half of the ships are less than 5
0
20
40
60
80
100
Operating Under construction Planed
No.
of
term
inals
Aisa Pacific Europe Atlantic
Current issues in shipping, ports and logistics
152
years old. The ship size distribution of the current fleet clearly shows that the average
size is growing with the delivery of large tankers from Qatar gas (Q-flex, Q-Max).
However, the most common ship size is still in the range between 100,000 and 150,000
CM. The large Q-Flex and Q-Max units are deployed on LNG routes between Qatar and
Europe/US. LNG terminal size is rising in line with the increase in average ship sizes.
The number of terminals is growing, not only in existing export or import countries, but
also in countries who have the ambition to enter the market.
References
Chabrelie, M. (2003) A new trading model for the fast-changing LNG industry, first Asia
Gas Buyers’ Summit
Cook, L. (2005) The role of LNG in a global gas market, Oil and Money Conference,
London, 21 September
Dorigoni, S., Graziano, C., Pontoni, F. (2009) Can LNG increase competitiveness in the
natural gas market? Universita Commerciale Luigi Bocconi, IEFE Working Paper Series
Dorigoni, S., Mazzei, L., Pontoni, F., Sileo, A. (2008) LNG shipping: a descriptive analysis,
Report for IEFE Universita Bocconi, Milan
Clingendeal International Energy Program (2003) The role of Liquefied Natural Gas in
the European Gas market
Cornot-Gandolphe, S. (2005) LNG cost reductions and flexibility in LNG trade add to
security of gas supply, Energy Prices & Taxes, 29-36
Energy Information Administration (2003) The global liquefied natural gas market:
status and outlook
Energy Information Administration (2010) The international energy outlook 2010
Engelen, S., Dullaert, W. (2010) Transformations in gas shipping: market structure and
efficiency, Maritime Economics and Logistics, 12, 295–325
GIIGNL (2009) The LNG Industry 2009
Gkonis, K. G., Psaraftis, H. N. (2009) The LNG market: a game theoretic approach to
competition in LNG shipping. Maritime Economics and Logistics, 11(2), 227-246
Institute of Shipping Analysis and EO&W (2001) The LNG shipping Market Study,
Goteborg
Wang and Notteboom – World LNG shipping
153
Jensen, J.T. (2004) The development of a global LNG market, Oxford Institute for Energy
Studies
Jensen, J.T. (2003) The LNG revolution, The Energy Journal of the International
Association for Energy Economics, 24(2)
Ndao, M. (2004) The Dynamics of the LNG shipping Market and the Development of
LNG Supply for Western Europe. MSc thesis, University of Oklahoma, Oklahoma.
Neumann (2008) Linking Natural Gas markets- Is LNG Doing Its Job? Discussion Papers
of DIW Berlin
Nikhalat, H., Zavitsas, K., Bell, M.G.H., Elhajj, M.(2010) Predicting the future of LNG
Market: A Review and Comparison of Oil and LNG Industries Performance Indicators
and Risk Factors, Annual Conference of the International Association of Maritime
Economists, Lisbon, 7-9 July 2010
Rogers H.V. (2010) LNG Trade-flows in the Atlantic Basin: Trends and Discontinuities,
Oxford Institute for Energy Studies, Oxford
Rowe, D. (2004) LNG Market Overview, The Oxford Princeton Program, March 2004
Siliverstovs, B., Neumann, A., L’Hegaret, G., von Hirschhusen, C. (2004) International
market integration for natural gas? A cointegration analysis of gas prices in Europe,
North America and Japan, Globalization of Natural Gas Markets Working Papers,
WP-GG-06
Thompson, Poten & Partners (2009) The new LNG trading model short-term market
development and prospects
Tolgos S (2007) Two-stroke propulsion trends in LNG carriers, MAN B&W Diesel AG.
Valais, M., Chabrelie, M.F., Lefeuvre, T. (2001) World LNG prospects: favourable
parameters for a new growth era, 18th World Energy Congress, Buenos Aires, 21-25
October
www.clarksons.com
www.LNGoneworld.com
www.LNGjournal.com
www.poten&partner.com