UNIVERSITY OF GONDAR€¦ · and which crop is more correlate what crop by what factor they...
67
UNIVERSITY OF GONDAR FACULITY OF INFORMATICS DEPARTMENT OF INFORMATION TECHNOLOGY POSTGRADUATE PROGRAM Thesis Title: Discovering the Pattern and Key Determinant Factor of Cereal Crop Production: By Using Association Rule Mining By Gizealew Alazie A Thesis Submitted to the Department of Information Technology, Uni- versity of Gondar in Partial Fulfillment of the Requirements for the De- gree of Master of Science in Information Technology (MSCIT) Advisor: Dejen Alemu Gondar, Ethiopia Fbe, 2018 GSJ: Volume 7, Issue 7, July 2019 ISSN 2320-9186 235 GSJ© 2019 www.globalscientificjournal.com
Transcript of UNIVERSITY OF GONDAR€¦ · and which crop is more correlate what crop by what factor they...

UNIVERSITY OF GONDAR
FACULITY OF INFORMATICS
DEPARTMENT OF INFORMATION TECHNOLOGY
POSTGRADUATE PROGRAM
Thesis Title:
Discovering the Pattern and Key Determinant Factor of Cereal
Crop Production: By Using Association Rule Mining
By
Gizealew Alazie
A Thesis Submitted to the Department of Information Technology, Uni-
versity of Gondar in Partial Fulfillment of the Requirements for the De-
gree of Master of Science in Information Technology (MSCIT)
Advisor:
Dejen Alemu
Gondar, Ethiopia
Fbe, 2018
GSJ: Volume 7, Issue 7, July 2019 ISSN 2320-9186
235
GSJ© 2019 www.globalscientificjournal.com
ashish
Typewritten Text
ashish
Typewritten Text
ashish
Typewritten Text
ashish
Typewritten Text
GSJ: Volume 7, Issue 7, July 2019, Online: ISSN 2320-9186 www.globalscientificjournal.com
ashish
Typewritten Text
ashish
Typewritten Text
ashish
Typewritten Text
ashish
Typewritten Text
ashish
Typewritten Text

ii
DECLARATION I declare that this thesis is my original work and has not been presented to any other university
for achieving any academic degree or diploma awards and all sources of materials used for this
work have been duly acknowledged.
Declared by:
Student Name: Gizealew Alazie
Signature: _______________________
Submitted to: Department Information technology, University of Gondar
Date: ____/_____/____
Advisor Name: Dejen Alemu
Signature:
_______________________________________________________________________
Date ____/_____/____
Examiner
_______________________________________________________________________
Date ____/_____/____
GSJ: Volume 7, Issue 7, July 2019 ISSN 2320-9186
236
GSJ© 2019 www.globalscientificjournal.com

iii
ACKNOWLEDGMENTS I would like to thank my God and his mother St. Marry for helping me in my life and getting the
chance to pursue my graduate education at the University of Gondar.
My special gratitude goes to my advisor, Mr. Dejen Alemu department of information system,
University of Gondar for his precious comments, suggestion and ideas that facilitate the success-
ful realization of this study. I would like to appreciate his interest and fast response when I asked
him to have extra guidance and help. My gratitude also goes to all my course instructors and the
department of information technology, University of Gondar for their unreserved knowledge and
experience sharing and my colleagues who contributed to this work in one or the other way. My
thanks also go to the director of the Central Statistical Agency, Addis Ababa for giving me a data
of 2013-2016 and the data management staff for technical assistance and my entire friend they
involve in my thesis. Last but not the least, my deepest and warmest gratitude goes to my fami-
ly, especially my father, mother and my wife who have been sources of pride and encouragement
throughout my life.
GSJ: Volume 7, Issue 7, July 2019 ISSN 2320-9186
237
GSJ© 2019 www.globalscientificjournal.com

iv
Table of Contents
LIST OF ABBREVIATIONS ........................................................................................................ vi
List of figures ................................................................................................................................ vii
List of tables ................................................................................................................................. viii
Abstract .......................................................................................................................................... ix
1. CHAPTER ONE ...................................................................................................................... 1
Introduction ..................................................................................................................................... 1
1.1 Background of the study ............................................................................................................... 1
1.2 Statement of the problem ............................................................................................................ 2
1.3 Objective ....................................................................................................................................... 3
1.3.1 General objective .................................................................................................................. 3
1.4 Scope the study ............................................................................................................................. 3
1.5 Significance of the Study ............................................................................................................... 4
1.6 Structure of the Paper .................................................................................................................. 4
CHAPTER TWO ............................................................................................................................ 6
2. LITERATURE REVIEW AND CONCEPTUAL FRAMEWORK ........................................... 6
2.1. Overview of Data Mining .................................................................................................................. 6
Data Mining Methods ............................................................................................................................... 6
Data mining process .............................................................................................................................. 7
2.1.3. Data Mining Knowledge Discovery Process Models ................................................................. 7
Hybrid-DM process ...................................................................................................................... 11
Comparison of association rule mining algorithms without candidate generation ................................. 16
Evaluating the Performance of Association Rule Mining ....................................................................... 16
Algorithms .............................................................................................................................................. 16
Using Apriori with WEKA for Frequent Pattern Mining ............................................................. 16
Foundation for Frequent Pattern Mining Algorithms‟ Implementation ....................................... 17
Data Mining and Statistics ............................................................................................................ 17
Data Mining in Agriculture ........................................................................................................... 17
Related Works on Agricultural Problem Domain ......................................................................... 18
Comparison of the Study with Other Related Works.............................................................................. 26
CHAPTER THREE ...................................................................................................................... 27
GSJ: Volume 7, Issue 7, July 2019 ISSN 2320-9186
238
GSJ© 2019 www.globalscientificjournal.com

v
3. METHDOLOGY ...................................................................................................................... 27
3.1. Research design ............................................................................................................................... 27
3.1.1. Understanding Agricultural domain approach ......................................................................... 28
3.1.2. Understanding agricultural data ............................................................................................... 29
3.1.3. Data Preparation ....................................................................................................................... 29
3.1.3.3. Data Integration...................................................................................................................... 33
3.1.4. Mining (modeling) techniques ...................................................................................................... 39
3.1.4.1. Association rule Modeling ......................................................................................................... 39
3.1.4.1.1. Apriori algorithm ..................................................................................................................... 39
3.1.4.1.2. Comparing Different Algorithms ............................................................................................. 40
CHAPTER FOUR ......................................................................................................................... 41
4. Result and Discussion ............................................................................................................ 41
4.1. Attributes during the analysis .......................................................................................................... 41
4.2. Discovering the rules ....................................................................................................................... 42
4.2.1. Experimental setup to discover the rules ................................................................................. 42
4.3. Evaluation of the discovered knowledge ......................................................................................... 43
4.4. Discussion of the Finding ............................................................................................................ 46
CHAPTER FIVE .......................................................................................................................... 49
CONCLUSION, CONTRIBUTION, AND RECOMMENDATION ........................................... 49
Contribution of the Study ........................................................................................................................ 49
Recommendation .................................................................................................................................... 50
Reference ...................................................................................................................................... 52
ANNEXES .................................................................................................................................... 56
ANNEX I: Sample rules discovered using Minimum support: 0.1 (29221 instances) Minimum metric
<confidence>: 0.9 .................................................................................................................................... 56
ANNEX II: Sample rules discovered using Minimum support: 0.15 (5844 instances) Minimum metric
<confidence>: 0.7 .................................................................................................................................... 57
ANNEX III: Sample rules discovered using Minimum support: Minimum support: 0.25 (9740
instances) Minimum metric <confidence>: 0.25 .......................................................................... 59
Discussion Questions with Domain Experts Regarding to the Research Problem and Initial Data
Understanding. ........................................................................................................................................ 62
GSJ: Volume 7, Issue 7, July 2019 ISSN 2320-9186
239
GSJ© 2019 www.globalscientificjournal.com

vi
LIST OF ABBREVIATIONS
AI- Artificial Intelligence
ARM- Association Rule Mining
AARM-Apriori Association Rule Mining
CRISP-CRoss-Industry Standard Process
DM- Data Mining
ADM- Agricultural Data Mining
KDD- Knowledge Discovery in Database
RMS-Rapid Miner Studio
ECSA-Ethiopian central statistics agency
WEKA-Waikato Environmental Knowledge Analysis
CSV-comma separated version
ARFF-Attribute relation file format
MoA- Ministry of Agriculture
GSJ: Volume 7, Issue 7, July 2019 ISSN 2320-9186
240
GSJ© 2019 www.globalscientificjournal.com

vii
List of figures
Figure 1 :the data mining process[14]........................................................................................................... 7
Figure 2 knowledge discovery in database[15] ............................................................................................. 8
Databasehematic of SEMMA (original for [m SAS Institute) [16] .............................................................. 9
Figure 4:The CRISP-DM life cycle[19] ...................................................................................................... 11
Figure 5: The six-step KDP model [20] ...................................................................................................... 13
Figure 7: Research design ........................................................................................................................... 28
GSJ: Volume 7, Issue 7, July 2019 ISSN 2320-9186
241
GSJ© 2019 www.globalscientificjournal.com

viii
List of tables
Table 1 Data Mining Tasks .......................................................................................................... 13
Table 2: related work discussion................................................................................................... 25
Table 3: Data summery ................................................................................................................. 29
Table 4: List of the Selected Attributes and their Description ...................................................... 36
Table 5: Descriptions of the Selected Attributes with Their Possible List of Values................... 38
Table 6: Attribute Evaluator: Correlation Ranking Filter ............................................................. 41
Table 7: Configuring minimum support 0.10, and minimum confidence of 0.9 .......................... 42
Table 8: Configuring minimum support of 0.15 and minimum confidence of 0.7 ....................... 43
Table 9: Configuring Minimum support 0.25 and minimum confidence 0.25 ............................. 43
Table 10: based on correlation or lift and evaluation using domain experts selected rule ........... 45
GSJ: Volume 7, Issue 7, July 2019 ISSN 2320-9186
242
GSJ© 2019 www.globalscientificjournal.com

ix
Abstract
Agriculture is the major source of Ethiopian economy due to this the amount of agriculture da-
tabase are increasing on a daily basis. The wide availability of huge amounts of agriculture data
has generated an urgent need for the research of data mining. Although different approaches of
statistic, technology, metrology and geology were applied to identify factors contributing to im-
provement of cereal crop productivity, there remains a lot of work to bring overall change in the
productivity of cereal crop. This research focused on identifying relationships between attributes
of agriculture productivity survey data of cereal crop with input mechanisms and techniques to
clearly understand the nature of production of cereal crop in Ethiopia. The study uses a hybrid
data mining model since it is a research oriented model and WEKA 3.8.0, Microsoft Excel 2013
and SPSS tools are used for data mining, for data integration and for data exploration respec-
tively. Finally, 38961 instances and 14 attributes are selected for analysis. Additionally, the val-
ues of the yield of the attribute are discretized using domain expert ideas which are categorized
as Excellent, Very good, Good, satisfactory, and Bad. Association rule mining methods such as
Apriori and FP Growth algorithm compared and Apriori algorithm is applied in order to get the
results. By configuring different thresholds, different rules are achieved. The discovered rules
are then evaluated using the interestingness measure lift or correlation and domain experts. Fi-
nally, generating strong rule by satisfying both a minimum support threshold and a minimum
confidence threshold and identify the most detrimental factor behind for occurring frequently
and which crop is more correlate what crop by what factor they correlate. Finally, identify the
relationship between factors for improving cereal crop production in Ethiopia. Then non- im-
proved seed is affected by non –chemical damage, as well as occur in private owners and non-
irrigated land the region those occur frequently in Oromia. Use of non-improved seed and not
properly using fertilizer, not using the extension and irrigation as well as the region and male
household are showing a strong positive relationship with wheat, crop production (Yield) and
this observation lead to conclude that fertilizer, improved seed and irrigation are important var-
iables for cereal crop production. In this study maize and wheat is highly associated based on
their determinate factors.
Keywords:-Apriori Algorithm, Association rule, Data mining, Knowledge discovery database
GSJ: Volume 7, Issue 7, July 2019 ISSN 2320-9186
243
GSJ© 2019 www.globalscientificjournal.com

1
1. CHAPTER ONE
Introduction
1.1 Background of the study
Agriculture is the main source of income and employment for the majority of people in this
world, especially in rural areas[1].Ethiopian government has focused its agricultural develop-
ment policy on ensuring food security by allocating more resources to increase agricultural pro-
duction so as to ensure continuous and adequate supply of food . To monitor and evaluate the
performance of the policy and the trends in the changing patterns of agricultural production, val-
uable information on agriculture is required as an input[3].
Agriculture is a unique business crop production, which is dependent on many climate and econ-
omy factors. Some of the factors on which agriculture is dependent are soil, climate, cultivation,
irrigation, fertilizers, temperature, rainfall, harvesting, pesticide weeds and other factors. Histori-
cal crop yield information is also important for supply chain operation of companies engaged in
industries. These industries use agricultural products as raw material, livestock, food, animal
feed, chemical, poultry, fertilizer, pesticides, seed and pepper. An accurate estimate of crop pro-
duction and risk helps these companies in planning, supply chain decision like production sched-
uling. Business such as seed, fertilizer, agrochemical and agricultural machinery industries plan
production and marketing activities based on crop production estimates[4].
Data mining in agriculture could be a terribly recent analytical topic. It consists within the appli-
cation of information mining techniques to agriculture. Recent technologies square measure to-
day able to offer plenty of data on agricultural related activities, which may then be analyzed so
as to search out vital data. Carrying out effective and property, agriculture has become a crucial
issue in recent years[5].
Agricultural production needs to continue to associate ever-increasing population. A key to the
current is that the usage of recent technologies likes GPS (for exactitude agriculture) and data
processing techniques to require advantage of the soil's non uniformity. The big amounts of in-
formation that square measure today, nearly harvested at the side of the crops got to be analyzed
and will be warned to their full extent this is often clearly an information mining task[5].
GSJ: Volume 7, Issue 7, July 2019 ISSN 2320-9186
244
GSJ© 2019 www.globalscientificjournal.com

2
Thus, the results of this study may help the decision makers to make quick adjustments in agri-
cultural policy as well as development programs to ensure food security of the country. In addi-
tion, this[6], research would aim to highlight the important role of data mining in analyzing the
agricultural statistical data items on crop production and to explore useful knowledge based on
data mining methods. The study will have benefits to the agriculture professionals specifically
experts on crop production and farmers.
1.2 Statement of the problem The agricultural sector is the country‟s major source of economic growth under Ethiopia‟s
Growth Transformation Plan (GTP), with attention given to productivity and production in-
crease, which is crucial for the country's effort to attain food security and increase export earn-
ings[7]
Ethiopia‟s agriculture sector policy and investment framework 2010-2020 provides a strategic
framework for the prioritization and planning of investments that will drive Ethiopia‟s agricul-
tural growth and development. The framework is anchored to, and aligned with, the national vi-
sion of becoming a middle income country [8].
In Ethiopia most of the farmers are suffering from time to time because of crop failures or yield
losses that may affect the lives of more than 85% of the country‟s population[9].So, the food
supply shortage is the most serious problem which poses a challenge to both the federal and re-
gional governments. Causes of reducing cereal crop production and the determinant factors are
not well explored in Ethiopia improving crop productivity is the front focus of communities and
governments. However, currently ECSA conducts the survey on annual bases using field data
collection method and traditional statistical tools for analysis, which requires thousands of field
data collectors, huge financial resources and quiet a lot of time every year[10]. Moreover, this
traditional method of data analysis[6] has limited capacity to discover new and unanticipated pat-
terns and relationships that are hidden in the conventional databases, consequently, this situation
has initiated the researcher to undertake study on crop production determinant factor correlation
using association data mining technique and generate rule between each attribute of cereal crop.
An essential issue for agricultural planning intention is the accurate yield estimation for the nu-
merous crops involved in the planning. Data mining techniques are necessary approach for ac-
complishing practical and effective solutions for this problem. Agriculture has been an obvious
target for big data. Environmental conditions, variability in soil, input levels, combinations and
GSJ: Volume 7, Issue 7, July 2019 ISSN 2320-9186
245
GSJ© 2019 www.globalscientificjournal.com

3
commodity prices have made it all the more relevant for farmers to use information and get help
to make critical farming decisions. This paper focuses on the analysis of the agriculture data and
finding optimal parameters to maximize the crop production using data mining tech-
niques[4].The wide availability of huge amounts of agriculture data has generated an urgent need
for the research of data mining. Generating rules with higher accuracy of agriculture databases
can be done using different techniques of data mining[11].Due to these the study drives the fol-
lowing research questions:
What are the possible determinant factors limits crop production in Ethiopia?
What are the most interesting patterns or rules generate degrading the determinant
factors correlation?
Which association rule algorithm is more appropriate in discovering an interesting
pattern?
1.3 Objective
1.3.1 General objective
The general objective of this research work is to explore determinant factors for crop productivi-
ty from the existing statistical survey datasets for cereal crop production and to discover im-
portant and interesting rules from the generated knowledge by applying data mining techniques
and tools. And specifically to:
Explore determinant factors or variables that have significant impact on crop produc-
tivity from the existing statistical survey datasets;
Use data mining methodologies to identify the factor of crop production;
Discover the hidden knowledge (patterns);
Evaluate the performance of the discovered association rule;
Determine important rules of the generated knowledge;
Insight into future research direction.
1.4 Scope the study The purpose of this study would intend to investigate the determinant factor of crop production
correlation which is mainly focused on cereal crops such as teff, wheat, maize, sorghum, and
barley. In order to achieve the proposed objectives the study will be going to understand the
GSJ: Volume 7, Issue 7, July 2019 ISSN 2320-9186
246
GSJ© 2019 www.globalscientificjournal.com

4
problem, understand the dataset and preprocessing, data mining, evaluating discovered
knowledge and use discovered knowledge for discovering an interesting pattern. The study is
also limited in Amhara and Oromia region.
1.5 Significance of the Study
It is expected that the outcome of this study will have contributions in reducing government ex-
penses and the time required for conducting agricultural production forecasting survey in the tra-
ditional way. Thus, the results of this study may help the decision makers to make quick adjust-
ments in agricultural policy as well as development programs to ensure food security of the
country. In addition, this research would aim to highlight the important role of data mining in
analyzing the agricultural statistical data items on crop production and to explore useful
knowledge based on data mining methods. The study would have benefited to the agriculture
professionals specifically experts on crop production and mainly for farmers. Hence, the signifi-
cance of this study will contribute to the following benefits:
Increase the productivity and quality of crops produced.
Helps to simplify a decision making process in order to support crop production strate-
gies as domain knowledge or expertise.
Disseminate appropriate information for farmers at the right time from the government.
1.6 Structure of the Paper This thesis report is structured into five chapters. The first chapter is an introduction part, which
contains background to the study (i.e. Crop production correlation in Ethiopia and tries to give
insights into the data mining technology that were applied in this study, explains the statement of
the problem that lead to this research work, objectives to be attained, scope and limitation of the
study, the significance of the study. Chapter two deals with literature review and conceptual
framework about data mining techniques and different types of algorithms implemented in the
data mining tasks and conceptual framework. It includes a detailed discussion on the related
works of the application of data mining in the area of crop production correlation and determinant
factors. Chapter three deals with methodology that explains the data preparation process for the
data mining analysis. It starts with understanding the existing data and explains the business that
deals with the statistical analysis of crop production correlation which is undertaken by the Cen-
tral Statistical Agency. Then, it explains how each data preprocessing steps were done in order to
GSJ: Volume 7, Issue 7, July 2019 ISSN 2320-9186
247
GSJ© 2019 www.globalscientificjournal.com

5
generate an appropriate dataset for the experiment. Chapter four presents the experimentation
phase of the study. In this chapter, the results of the selected algorithms for the experiment are
discussed briefly. The results of the experiments were compared based on their efficiency using
different evaluation techniques and interesting rules that were generated by the selected model
are interpreted into understandable form that can be used by the domain experts and other users.
Finally, Chapter five provides conclusion, contribution and offers recommendations for future
work to be conducted on similar areas to improve the results of the current research work.
GSJ: Volume 7, Issue 7, July 2019 ISSN 2320-9186
248
GSJ© 2019 www.globalscientificjournal.com

6
CHAPTER TWO
2. LITERATURE REVIEW AND CONCEPTUAL FRAMEWORK
Introduction
This chapter discusses background concepts of data mining and their relationship, including; ex-
plain the meaning of data mining, data mining tasks and what Agricultural Data Mining (from
now onwards ADM) means, major tasks and algorithms used in ADM. In addition, review of re-
lated literature is discussed in the application of data mining tools and techniques of agriculture.
2.1. Overview of Data Mining
Thanks to advances in computers and data capture technology, huge data sets containing giga-
bytes or even terabytes of data have been and are being collected. These mountains of data con-
tain potentially valuable information. The trick is to extract that valuable information from the
surrounding mass of uninteresting numbers, so that the data owners can capitalize on it[12]. Data
mining is a new discipline that seeks to do just that: by sifting through these databases, summa-
rizing them, and finding patterns. Data mining should not be seen as a simple one-time exercise.
Huge data collections may be analyzed and examined in an unlimited number of ways. As time
progresses, so new kinds of structures and patterns may attract interest, and may be worth seek-
ing in the data. Data mining has, for good reason, recently attracted a lot of attention. It is a new
technology, tackling new problems, with great potential for valuable commercial and scientific
discoveries. However, we should not expect it to provide answers to all questions. Like all dis-
covery processes, successful data mining has an element of serendipity. While data mining pro-
vides useful tools that does not mean that it will inevitably lead, to important, interesting, or val-
uable results. We must beware of over exaggerating the likely outcomes[13].
Data Mining Methods
The objective of data mining is both prediction and description. That is, to predict unknown or
future values of the attributes of interest using other attributes in the databases, while describing
the data in a manner understandable and interpretable to humans. Predicting the sale amounts of
a new product based on advertising expenditure, or predicting wind velocities as a function of
temperature, humidity, air pressure, etc., are examples of tasks with a predictive goal in data
mining. Describing the different terrain groupings that emerge in a sampling of satellite imagery
is an example of a descriptive goal of a data mining task. The relative importance of description
and prediction can vary between different applications. These two goals can be fulfilled by any
GSJ: Volume 7, Issue 7, July 2019 ISSN 2320-9186
249
GSJ© 2019 www.globalscientificjournal.com

7
of a number data mining tasks including: classification, regression, clustering, summarization,
dependency modeling, and change and deviation detection[13]
Data mining process
For databases containing a huge amount of data, appropriate sampling techniques can first be
applied to facilitate interactive data exploration. Interactive mining allows users to focus the
search for patterns, providing and refining data mining requests based on returned results. Spe-
cifically, knowledge should be mined by drilling down, rolling up, and pivoting through the data
space and knowledge space interactively[14].
Figure :the data mining process[14].
2.1.3. Data Mining Knowledge Discovery Process Models
Knowledge discovery in database (KDD) Process
Data mining is the core part of the knowledge discovery process. In this, process may consist of
the following steps: data selection, data cleaning, data transformation, pattern searching (data
mining), and finding presentation, finding interpretation and finding evaluation. The data mining
and KDD often used interchangeably because data mining is the key part of the KDD process.
The term Knowledge Discovery in Databases or KDD for short, refers to the broad process of
finding knowledge in data, and emphasizes the "high-level" application of particular data mining
methods. It is of interest to researchers in machine learning, pattern recognition, databases, statis-
tics, artificial intelligence, knowledge acquisition for expert systems, and data visualization. The
GSJ: Volume 7, Issue 7, July 2019 ISSN 2320-9186
250
GSJ© 2019 www.globalscientificjournal.com

8
unifying goal of the KDD process is to extract knowledge from data in the context of large data-
bases. It does this by using data mining methods (algorithms) to extract (identify) what is
deemed knowledge, according to the specifications of measures and thresholds, using a database
along with any required preprocessing, sub sampling, and transformations of that database[15].
Figure 1 knowledge discovery in database[15]
The SEMMA-DM Process
The acronym SEMMA stands for Sample, Explore, Modify, Model, Assess, and refers to the
process of conducting a DM project. The SAS Institute considers a cycle with 5 stages of the
process: [16].
Sample- this stage consists of sampling the data by extracting a portion of a large data set big
enough to contain the significant information, yet small enough to manipulate quickly.
Explore- this stage consists of the exploration of the data by searching for unanticipated trends
and anomalies in order to gain understanding and ideas.
Modify- this stage consists of the modification of the data by creating, selecting, and transform-
ing the variables to focus the model selection process.
Model- this stage consists of modeling the data by allowing the software to search automatically
for a combination of data that reliably predicts a desired outcome.
GSJ: Volume 7, Issue 7, July 2019 ISSN 2320-9186
251
GSJ© 2019 www.globalscientificjournal.com

9
Assess- this stage consists of assessing the data by evaluating the usefulness and reliability of the
findings from the DM process and estimate how well it performs.
Figure 2:Schematic of SEMMA original from SAS Institute)[16]
The SEMMA process offers an easy to understand process, allowing an organized and adequate
development and maintenance of DM projects. It thus confers a structure for his conception, cre-
ation and evolution, helping to present solutions to business problems as well as to find the DM
business goals.
The CRISP-DM Process
CRISP-DM stands for CRoss-Industry Standard Process for Data Mining. It consists of a cycle
that comprises six stages[17],[18].
GSJ: Volume 7, Issue 7, July 2019 ISSN 2320-9186
252
GSJ© 2019 www.globalscientificjournal.com

10
Business understanding: This initial phase focuses on understanding the project objectives and
requirements from a business perspective, then converting this knowledge into a DM problem
definition and a preliminary plan designed to achieve the objectives;
Data understanding: The data understanding phase starts with an initial data collection and pro-
ceeds with activities in order to get familiar with the data, to identify data quality problems, to
discover first insights into the data or to detect interesting subsets to form hypotheses for hidden
information.
Data preparation: The data preparation phase covers all activities to construct the final dataset
from the initial raw data.
Modeling: In this phase, various modeling techniques are selected and applied and their parame-
ters are calibrated to optimal values.
Evaluation: At this stage the model (or models) obtained are more thoroughly evaluated and the
steps executed to construct the model are reviewed to be certain it properly achieves the business
objectives.
Deployment: Creation of the model is generally not the end of the project. Even if the purpose of
the model is to increase knowledge of the data, the knowledge gained will need to be organized
and presented in a way that the customer can use it.
CRISP-DM is extremely complete and documented. All his stages are duly organized, structured
and defined, allowing that a project could be easily understood or revised.
GSJ: Volume 7, Issue 7, July 2019 ISSN 2320-9186
253
GSJ© 2019 www.globalscientificjournal.com

11
Figure 3:The CRISP-DM life cycle[19]
Hybrid-DM process
The development of academic and industrial models has led to the development of hybridmodels
i.e., Models that combine aspects of both. One such model is a six-step KDP model. It was de-
veloped based on the CRISP-DM model by adopting it to academic research. A description of
the six steps follows :
1. Understanding of the problem domain.
This initial step involves working closely with domain experts to define the problem and deter-
mine the project goals, identifying key people, and learning about current solutions to the prob-
lem. It also involves learning domain-specific terminology. A description of the problem, includ-
GSJ: Volume 7, Issue 7, July 2019 ISSN 2320-9186
254
GSJ© 2019 www.globalscientificjournal.com

12
ing its restrictions, is prepared. Finally, project goals translate into DM goals, and the initial se-
lection of DM tools to be used later in the process is performed.
2. Understanding of the Data
This step includes collecting sample data and deciding which data, including format and size,
will be needed. Background knowledge can be used to guide these efforts. Data are checked for
completeness, redundancy, missing values, the plausibility of attribute values, among others. Fi-
nally, the step includes verification of the usefulness of the data with respect to the DM goals.
3. Preparation of the data
This step concerns deciding which data will be used as input for DM methods in the subsequent
step. It involves sampling, running correlation and significance tests, and data cleaning, which
includes checking the completeness of data records, removing or correcting for noise and miss-
ing values, etc. The cleaned data may be further processed by feature selection and extraction
algorithms (to reduce dimensionality), by derivation of new attributes (say, by discretization),
and by summarization of data (data granularization). The end results are data that meet the spe-
cific input requirements for the DM tools selected in Step 1.
4. Data mining
Here the data miner uses various DM methods to derive knowledge from preprocessed data.
5. Evaluation of the discovered knowledge
Evaluation includes understanding the results, checking whether the discovered knowledge is
novel and interesting, interpretation of the results by domain experts, and checking the impact of
the discovered knowledge. Only approved models are retained, and the entire process is revisited
to identify which alternative actions could have been taken to improve the results. A list of errors
made in the process is prepared.
6. Use of the discovered knowledge
This final step consists of planning where and how to use the discovered knowledge. The appli-
cation area in the current domain may be extended to other domains. A plan to monitor the im-
plementation of the discovered knowledge is created and the entire project documented. Finally,
the discovered knowledge is deployed to the specified domain.
GSJ: Volume 7, Issue 7, July 2019 ISSN 2320-9186
255
GSJ© 2019 www.globalscientificjournal.com

13
Figure 4: The six-step KDP model [20]
Data Mining Tasks
According to Fayyad[21] data mining can be divided into two tasks: predictive tasks and descrip-
tive tasks. Table 1 provides examples of descriptive and predictive modeling paradigm pairs. The
descriptive models reveal the suitability of the corresponding predictive model and guide the
search.
Table 1:Data Mining Tasks
Descriptive paradigm Predictive paradigm
Correlation analysis Linear regression
Associative rules
Probabilistic rules
Clustering Classification
Episodes Markov models
GSJ: Volume 7, Issue 7, July 2019 ISSN 2320-9186
256
GSJ© 2019 www.globalscientificjournal.com

14
Descriptive Modeling
A model is a high-level description, summarizing a large collection of data and describing its
important features. Often a model is global in the sense that it applies to all points in the meas-
urement space. The goal of a descriptive model is describing all of the data (or the process gen-
erating the data). Examples of such descriptions include models for the overall probability distri-
bution of the data (density estimation), partitioning of the p-dimensional space into groups (clus-
ter analysis and segmentation), and models describing the relationship between variables (de-
pendency modeling)[6]. Clustering is similar to the classification except that the groups are not
predefined, but are defined by the data alone[12]. The association rule finds the association be-
tween the different attributes
Association Rules Discovery
Association rule mining, one of the most important and well researched techniques of data min-
ing, was first introduced in [22]. It aims to extract interesting correlations, frequent patterns, as-
sociations or casual structures among sets of items in the transaction databases or other data re-
positories. Association rules are widely used in various areas such as telecommunication net-
works, market and risk management, inventory control etc. Hegland [23], reviews the most well-
known algorithm for producing association rules. Apriori and discuss variants for distributed da-
ta, inclusion of constraints and data taxonomies. The review ends with an outlook on tools which
have the potential to deal with long item sets and considerably reduce the amount of (uninterest-
ing) item sets returned [24].
Clustering
One of the best known problems in the data mining is the clustering. Clustering is the task of cat-
egorizing objects having several attributes into different classes such that the objects belonging
to the same class are similar, and those that are broken down into different classes are not. Clus-
tering is the subject of active research in several fields such as statistics, pattern recognition, ma-
chine learning and data mining. A wide variety of clustering algorithms have been proposed for
different applications [25].
Clustering tools assign groups of records to the same cluster if they have something in common,
making it easier to discover meaningful patterns from the dataset. Clustering often serves as a
starting point for some supervised DM techniques or modeling.
Sequence Discovery
GSJ: Volume 7, Issue 7, July 2019 ISSN 2320-9186
257
GSJ© 2019 www.globalscientificjournal.com

15
Sequential pattern mining methods have been found to be applicable in a large number of do-
mains. Sequential data are omnipresent. Sequential pattern mining methods have been used to
analyze this data and identify patterns. Such patterns have been used to implement efficient sys-
tems that can recommend based on previously observed patterns, help in making predictions,
improve usability of systems, detect events, and in general help in making strategic product deci-
sions. They discussed also the applications of sequential data mining in a variety of domains like
healthcare, education, Web usage mining, text mining, Bioinformatics, telecommunications, in-
trusion detection, et cetera[26]. Sequential pattern mining is an important data mining problem
with broad applications. However, it is also a difficult problem since the mining may have to
generate or examine a combinatorial explosive number of intermediate subsequences [27].
Predictive Modeling
Predictive modeling the main point is that prediction requires the data to include a special re-
sponse variable. The response may be categorical or numb, thus further classifying predictive
data mining as, respectively, classification and regression and are called supervised learning al-
gorithm intend to obtain a classifier by learning from training examples [24].
Classification
Classification is to build (automatically) a model that can classify a class of objects so as to pre-
dict the classification or missing attribute value of future objects (whose class may not be
known). It is a two-step process. In the first process, based on the collection of training data sets,
a model is constructed to describe the characteristics of a set of data classes or concepts. Since
data classes or concepts are predefined, this step is also known as supervised learning (i.e., which
class the training sample belongs to is provided). In the second step, the model is used to predict
the classes of future objects or data. There are handful techniques for classification [3].
Discovering Patterns and Rules
The previous three types of data mining tasks discussed above are connected with model build-
ing that describes functional relationships between known and unknown variables. However,
there are situations where such a functional relationship is either not appropriate or too hard to
achieve certain data mining goals. Nevertheless, there might be a pattern of certain items, more
frequent items, values or measurements that occur together and then, such type of data mining
GSJ: Volume 7, Issue 7, July 2019 ISSN 2320-9186
258
GSJ© 2019 www.globalscientificjournal.com

16
task is connected with pattern discovery. Association rule is a typical method which is appropri-
ate for such type of knowledge discovery task[12].
Comparison of association rule mining algorithms without candidate generation
Association rule mining techniques play an important role in data mining research where the aim
is to find interesting correlations between sets of items in databases. Although the apriori algo-
rithm of association rule mining is the one that boosted data mining research, it has a bottleneck
in its candidate generation phase that requires multiple passes over the source data. FP-growth
and matrix apriori are two algorithms that overcome that bottleneck by keeping the frequent item
sets in compact data structures, eliminating the need of candidate generation. To our knowledge,
there is no work to compare those two similar algorithms focusing on their performances in dif-
ferent phases of execution. This study compares matrix apriori and FP-growth algorithms. Two
case studies analyzing the algorithms carry out phase by phase using two synthetic datasets gen-
erated in order i) to see their performance with datasets having different characteristics, ii) to un-
derstand the causes of performance differences in different phases. Our findings are i) perfor-
mances of algorithms are related to the characteristics of the given dataset and threshold value,
ii) Matrix Apriori outperforms FP-growth in total performance for threshold values below 10%,
iii) although building matrix data structure has higher cost, finding item sets is faster[28].
Evaluating the Performance of Association Rule Mining
Algorithms
Association rule mining is one of the most popular data mining methods. However, mining asso-
ciation rules often results in a very large number of found rules, leaving the analyst with the task
to go through all the rules and discover interesting ones. In this paper, we present the perfor-
mance comparison of apriori and FP-growth algorithms. The performance is analyzed based on
the execution time for different number of instances and confidence in super market data set.
These algorithms are presented together with some experimental data. Our performance study
shows that the FP-growth method is efficient and scalable and is about an order of magnitude
faster than the apriori algorithm[29].
Using Apriori with WEKA for Frequent Pattern Mining
Knowledge exploration from the large set of data, generated as a result of the various data pro-
cessing activities due to data mining only. Frequent pattern mining is a very important undertak-
ing in data mining. Apriori approach applied to generate frequent item set generally espouse
GSJ: Volume 7, Issue 7, July 2019 ISSN 2320-9186
259
GSJ© 2019 www.globalscientificjournal.com

17
candidate generation and pruning techniques for the satisfaction of the desired objective. This
paper shows how the different approaches achieve the objective of frequent mining along with
the complexities required to perform the job. This paper demonstrates the use of WEKA tool for
association rule mining using apriori algorithm[30].
Foundation for Frequent Pattern Mining Algorithms’ Implementation As with the development of the IT technologies, the amount of accumulated data is also increas-
ing. Thus the role of data mining comes into picture. Association rule mining becomes one of the
significant responsibilities of descriptive technique which can be defined as discovering mean-
ingful patterns from large collection of data. The frequent pattern mining algorithms determine
the frequent patterns from a database. Mining frequent item set is very fundamental part of asso-
ciation rule mining. Many algorithms have been proposed from last many decades including ma-
jors are apriori, direct hashing and pruning, FP-growth, ECLAT etc. The aim of this study is to
analyze the existing techniques for mining frequent patterns and evaluate the performance of
them by comparing apriori and DHP algorithms in terms of candidate generation, database and
transaction pruning. This creates a foundation to develop newer algorithm for frequent pattern
mining[31].
Data Mining and Statistics
The disciplines of statistics and data mining both aim to discover structure in data. So much do
their aims overlap, that some people regard data mining as a subset of statistics. But that is not a
realistic assessment as data mining also makes use of ideas, tools, and methods from other areas
particularly database technology and machine learning, and is not heavily concerned with some
areas in which statisticians are interested [32]. Statistical procedures do, however, play a major
role in data mining, particularly in the processes of developing and measuring models. Most of
the learning algorithms use statistical tests when constructing rules or trees and also for correct-
ing models that are over fitted. Statistical tests are also used to validate machine learning models
and to evaluate machine learning algorithms. Some of the commonly used statistical analysis
techniques are discussed below. For an extensive review of classical statistical algorithms see
Johnson [32].
Data Mining in Agriculture
Data mining in agriculture is a very recent research topic. It consists in the application of data
mining techniques to agriculture. This data mining technique used in agriculture for prediction of
GSJ: Volume 7, Issue 7, July 2019 ISSN 2320-9186
260
GSJ© 2019 www.globalscientificjournal.com
18
problem, disease detection, optimizing the pesticide and so on. Recent technologies are nowa-
days able to provide a lot of information on agricultural-related activities, which can then be ana-
lyzed in order to find important information and to collect relevant information[1]. Agricultural
organizations store huge amounts of data in the form of crop databases. Trends in these databases
can be identified using data mining practices, which sort and model the data in order to arrive at
a conclusion. The data mining applications present the data in the form of data marts. In the agri-
cultural industry, however, the lack of standard vocabulary has hindered the process of data min-
ing to a certain extent. This could lead to unnecessary problems, during the process of data min-
ing. The increase in the use of standardized terms will reduce the percentage of errors in the data
mining process[33].
Related Works on Agricultural Problem Domain
Currently, there are some researches that were applied to investigate the application of data min-
ing tools and techniques on productivity of agricultural crops production, and other agricultural
related issues. The literatures reviewed and cited below have tried to cover the application of da-
ta mining tools and techniques on the agricultural production issues from the perspective of the
types of input data, the number of instances and attributes, the methods or approaches used, tools
and algorithms applied, and the final outcomes or results found. Some of the most important
works which have been done globally and locally are summarized as follows Legesse [6], con-
ducted his study titled “Knowledge Discovery from Agricultural Survey Data: The Case of
Teff Production in Ethiopia”. The main objective of the researcher was to explore the determi-
nant factors that increase the productivity of eff. The input data items used for his research work
were taken from the Meher season annual agricultural production survey conducted by CSA
from the years 2007/2008up to 2011/12. For his experiment24 attributes were selected. The re-
searcher focused his study on the application of data mining techniques by applying classifica-
tion and association rule mining techniques. For association, he applied algorithms such as Apr
ori, Tertius, and FilteredAssociator. Besides, for classification he selected the decision tree algo-
rithms such as J48, Random Forest, and REPTreeThe results of association rule experiments
conducted in his research indicated that from the total dataset used 95.45% of Teff was cultivated
on pure field type which is dedicated only for Teff production with damage prevention mecha-
nisms; and it has also an association with the use of fertilizer which is about 94.71% of the total
data set.Moreover, the results of classification experiments alsoindicated that from the total da-
GSJ: Volume 7, Issue 7, July 2019 ISSN 2320-9186
261
GSJ© 2019 www.globalscientificjournal.com

19
taset used in his research high productivity of Teff were associated with area in hectare, type of
measures taken to prevent damage, use of extension service, use of fertilizer, type of seed, sam-
ple weight of seed, and sex of household head. Finally,Legesse recommended that at most care
should be taken while deciding the attribute to be labeled as a class. He also suggested that Clus-
ter Analysis is more appropriate for the selection of attributes that contains natural clusters to be
labeled as a class.
GSJ: Volume 7, Issue 7, July 2019 ISSN 2320-9186
262
GSJ© 2019 www.globalscientificjournal.com

25
Sr.
No. Author(s) Objective
Type of Input
Data
Methods or
Approaches
Algorithms Ap-
plied
Results
Found
Validation
Methods Limitation Implication
1. Sally Jo
Cunning-
ham and
Geoffrey
Holmes(201
1)
to mine infor-
mation from
existing
agricultural da-
tasets; and
developing new
machine learning
algorithms
agricultural
datasets contain
282 mushrooms
predictive
models exper-
iments with
machine learn-
ing schemes
J48 classifier and
wrapper search
method
J48 models Comparison on
average accura-
cy of the mod-
els and the level
of agreement
with the domain
experts
The attributes
for mushroom
grading may not
be useful in
practice
Needs more
objective
standards for
quality classi-
fication
2. ZekariasDiri-
ba, (2013) –
Unpublished
to assess the ap-
plicability of data
mining applica-
tions on Ethiopian
crop productivity
Crop produc-
tion data (Only
one year) (EEA
Database)
Classification
data mining
techniques
using Decision
Tree method
J48, Random-
Forest, REPTree
J48 Deci-
sion Tree
Classifier
K-fold cross
validation, F-
Measure, ROC
and Confusion
Matrix
data size (used
only one year
data)
Needs an inte-
gration of
more than one
year datasets
3. BirukLegesse
, (2013) –
Unpublished
to explore the
determinant fac-
tors that increase
the productivity of
Teff
Crop produc-
tion data of Teff
(CSA Data-
base)
Classification
and Associa-
tion Rule data
mining tech-
niques
J48, Random-
Forest, REPTree,
Apriori, Tertius,
and FilteredAsso-
ciator
J48 Deci-
sion Tree
Classifier
K-fold cross
validation, F-
Measure, ROC
and Confusion
Matrix
Biasness on
selection of
attributes to be
labeled as a
class
Cluster Analy-
sis is more
appropriate for
the selection of
attributes
4. NukellaSrini-
vasaRao and
Susanta Kumar
Das (2011)
to classify the herb-
al gardens data
based on the dis-
covered patterns and
rules
Supervised herbal
gardens data,
contains
9,060,426 cut-
tings
Classification
data mining
approach, Clus-
tering analysis
and associations
A hierarchical clus-
ter analysis, Ag-
glomeration, Icicle
Plot and Dendro-
gram Using Aver-
age Linkage
A Hierar-
chical Clus-
ter Analysis
Comparison by
Accuracy
Access of the
required in-
formation
DM technology is
on rise in the fields
of agriculture and
related research
Table 2: related work discussion
GSJ: Volume 7, Issue 7, July 2019 ISSN 2320-9186
263
GSJ© 2019 www.globalscientificjournal.com

26
Comparison of the Study with Other Related Works
As discussed on literature review part of the study report one of related research works is a study
conducted by Legesse [6] whose main objectives were discovering the determinant factors that
increase Teff productivity. His study focused on the application of data mining techniques by
applying classification and association rule mining techniques by using CRISP-DM model. For
association, he applied algorithms such as Apriori, Tertius, and Filtered Associator. Besides, for
classification he selected the decision tree algorithms such as J48, RandomForest, and REPTree.
His experiments results showed that J48 Algorithm performed with highest accuracy which is
80.3267%. The results of his experiments indicated that high productivity of Teff was associated
with area in hectare, type of measures taken to prevent damage, use of the extension service, use
of fertilizer, type of seed, sample weight of seed, and Male household head.
The other research work was done by Diriba[23],whose main objective was to assess the ap-
plicability of data mining techniques on agricultural crop productivity prediction using decision
trees classification data mining techniques. His experiments were done by using decision tree
method applying three algorithms: namely J48, Random Forest and REPTree. His experiments
results showed that REPTree Algorithm performed with higher accuracy than others, which is
83.39%, and „Fertilizer used‟ is the major determinant factor which has the highest predictable
power than other factors. Diriba used one year input data taken from the Ethiopian Economic
Association (EEA) for his study, where as the current researcher and Legesse used the same in-
put data source taken from ECSA. Both, Legesse and Diriba, applied decision trees method for
the implementation of classification techniques. Generally, the research works done by (Le-
gesseet al., 2013). did not address the problem raised by the present researcher that identifies the
correlation between the determinate factor of cereal crop production and fully implemented de-
scriptive data mining task and. In this regard, this research has been conducted to fill the gaps of
the previous research works with main objective to identify the correlation of cereal crop produc-
tion determinate factors rather than developing a predictive model. Thus, the experiments done
by the current researcher have been conducted using association rule mining after compare and
contrast different metrics of apriori algorithm.
GSJ: Volume 7, Issue 7, July 2019 ISSN 2320-9186
264
GSJ© 2019 www.globalscientificjournal.com

27
CHAPTER THREE
3. METHDOLOGY
The goal of this work is to explore a number of standard data mining techniques to agricultural
data set for discovering cereal crop patterns and detecting strong association between attributes.
So before applying the data mining techniques on the data set, there should be a methodology
that governs a given work. Methodology is more than method of data collection; rather it is fur-
ther of the concepts and theories which underlie the methods. So it is important to understand the
fundamental concepts of the methodology to highlight a specific feature of a sociological theory
test an algorithm for information retrieval or test the validity of a particular system.
3.1. Research design
Based on the figure the first step of the study understands the problem domain. This step in-
cludes an overview of the agriculture, factors of cereal crop determinates. In understanding the
data step domain specific terminologies, data description and attribute selection is included. In
data preparation step, data cleaning, data integration and data reduction steps are applied. The
next step is building the model based on the selected algorithm which is apriori algorithm. Using
apriori algorithm the rules are discovered then the rules are evaluated using the lift.
In DM there are four process models. These are KDD, SEMMA, CRISP and the newly emerging
hybrid DM process model. For the purpose of conducting this research the six-step process hy-
brid DM process model is selected in order to discover interesting patterns of yield production
and correlation analysis. The main reason hybrid DM process model selected was it combines
the main aspects of both models of academic and research
GSJ: Volume 7, Issue 7, July 2019 ISSN 2320-9186
265
GSJ© 2019 www.globalscientificjournal.com

28
Figure 5: Research design
3.1.1. Understanding Agricultural domain approach
In order to understand the problem, domain experts, i.e. instructors from the University of Gon-
dar, Gondar agricultural institute center professional, north Gondar zone agriculture office and
farmers were interviewed as they are close to the area. In an interview five persons were selected
those are plant science department head, natural resource management department head (both are
teachers), one from Gondar agriculture institute center, one from north Gondar zone agriculture
office and one model farmer. Those persons selected because they are much related to the work.
Gondar agriculture institute center professional and north Gondar zone agriculture office are ap-
propriate in closely watching crop productivity determinate factors. Instructors also interviewed
in order to define the scientific knowledge and practices properly.
GSJ: Volume 7, Issue 7, July 2019 ISSN 2320-9186
266
GSJ© 2019 www.globalscientificjournal.com

29
3.1.2. Understanding agricultural data
Initial data set for this research work, which is the last three years‟ survey data of cereal crop
production ranging from 2013 up to 2016 G.C, was collected from the CSA‟s database. The sur-
veys were conducted to provide data on farmland area and production of crops on the private
peasant holdings for BELG season. The empirical data from the CSA‟s statistical reports, which
provide basic quantitative information on total cultivated land area and cereal crop production,
contain major attributes that have relation to crop production for all major crops in Ethiopia.
3.1.2.1. Data collection method
Crop production and land use data sets are taken from the central statistics agency as well each
branch of the agency collects the data at different areas of the country and this data is stored cen-
trally at the agency level with their data processing software or (SPSS). Therefore, to conduct
this study, the researcher will take the data set from the central statistics agency.
3.1.2.2. Description of the Data
As described above, the initial cereal crop production dataset that was taken from the ECSA‟s
database contains many attributes together with their instances. The summary of the data sources
and general description of the collected data are illustrated in the table below
According to[34]data quality can be verified in terms of its accuracy, completeness, consistency,
timeliness, believability and interpretability which are helpful to examine the quality of the data
before conducting the experimentation.
In this regard, the initial dataset has been statistically described and visualized using SPSS pack-
age and Microsoft excel to examine the properties of the whole dataset records and to obtain high
level information regarding the data mining questions. Simple statistical analysis has been per-
Source of Data Years Number of
Attributes
Number of
Records Data Size
ECSA 2013_2014 G.C. 70 144,590 11.3 MB
2014_2015G.C. 88 160,625 13.1 MB
2015_2016G.C. 54 160,625 18.1 MB
Total Three Years Data 53 465,809 42.5 MB
Table 3: Data summery
GSJ: Volume 7, Issue 7, July 2019 ISSN 2320-9186
267
GSJ© 2019 www.globalscientificjournal.com

29
formed to verify the quality of the dataset, addressing questions such as: do the data cover all
cases required? Is the data correct or does it contains errors? Are there missing values in the da-
ta?
3.1.2.3. Exploration of the data
Exploration of the data includes surveying the data that is taking a high-level overview to dis-
cover what is contained in the dataset and to gain over all insight into the nature of the data. Sur-
veying the data, therefore, looks at the general structure of the data and reports to identify wheth-
er there is a useful information contained in the dataset about various areas of the business or not.
The particular purpose of the data survey is to find out if the answer to the problem to be mod-
eled actually exists in the dataset prior to investing much time, money, and resource in building
the model. Consequently, data surveying and analysis address directs the data mining goals[35].
According to[36],exploring the nature and the relationships of the information contained in a da-
taset is the task of the data survey. In addition, finding the places, defining the limits, and under-
standing the structures of the dataset is the purpose of data surveying. Thus, the whole purpose of
the data survey is to help the miner to draw a high-level map of the business territory. With the
help of this map, a data miner discovers the general nature or characteristics of the data, as well
as area of gaps, limitation, and usefulness of the data.
As a result, the researcher has performed basic statistical data analysis on the initial dataset to
clarify the data mining goals or to make them more precise. In this task, basic statisticalexercise
has been conductedto identify the characteristics of interesting sub-populations using SPSS and
MS Excel software. Then, we have analyzed the properties of major attributes that indicate the
data characteristics or lead to interesting data subsets for further examination. Accordingly, in
the following section we describe the first findings of the primary data analysis andevaluate this
information regarding their impact on the remainder of the study.
3.1.3. Data Preparation
The main objective of data preparation is to get a prepared dataset (or datasets) that is of maxi-
mum use for modeling, in which the natural order of the data is least disturbedand best enhanced
for the particular purposes of the miner. The best way to actually make the changes in the data
depends on two key decisions: what the solution requires and what the mining tool requires,
GSJ: Volume 7, Issue 7, July 2019 ISSN 2320-9186
268
GSJ© 2019 www.globalscientificjournal.com

30
since these decisions affect how the data is prepared, while the inputs to and outputs from the
process are not affected[36].
In this study, the major activities done during data preparation phase included data selection, da-
ta cleaning, attribute or feature selection, data transformation and aggregation, data integration
and formatting of the dataset. The purpose of these activities was to produce best model that can
correlate cereal crops production in efficient and cost-effective ways. The following sub sections
elaborate on these tasks in detail.
3.1.3.1. Data Selection
According to[37], one of the major activities that would be carried out during data preparation
phase is data selection, which deals with decision on the target data set, by focusing on a subset
of variables and data samples, on which the knowledge discovery task is to be performed. The
criteria used for data selection include: relevance of the data items to the data mining goals, data
quality and technical constraints such as limitations on data size or data types. Besides, the crite-
ria for excluding data may include resource constraints, cost, restrictions on data use, or other
data quality problems.
Sometimes, the whole collected dataset may not be taken for the experiments. Thus, the relevan-
cy of each data to the overall research goals and objectives need to be checked. When plenty of
data is available the miner has to select sufficient amount of sample to meet some degree of con-
fidence in building association models[35].Hence, before selecting the target data set on which
discovery is to be performed, basic issues that have relevance to the data mining goals have been
dealt with as follows:
According to CSA and FAO/WFP (2016) reports[23], all crops in the cereal category are planted
in all regions of the country. However, Oromia region contributes about 46% and 51% of the
country‟s total cultivated land area and production of cereal crops, respectively, while, the con-
tribution of Amhara region, in terms of area and production of cereals is about 35% and 31%,
respectively, of the country‟s total. This shows that, Amhara and Oromia Regions contribute
larger ratio of the country‟s total cereal crop production, which is 82%, and total land covered by
cereal crops, which is 81%.
GSJ: Volume 7, Issue 7, July 2019 ISSN 2320-9186
269
GSJ© 2019 www.globalscientificjournal.com

31
Therefore, for the purpose of this research, Amhara and Oromia regions, which have more rele-
vance to the overall goal and objectives of the research work, were selected. However, the total
data size is still very large i.e. 465,809 records that require 42.5MB for storage. This fact forced
us to select a sample for the experimentation to reduce the data to manageable size. The major
reason that obliged us to reduce the sample size for the experimentation was that the limitation of
WEKA heap size (virtual memory size) when running the whole datasets, since virtual memory
size is dependent on the capability of the hardware and type of the operating system loaded on it.
As a result, 9% of the total records are taken using proportional sampling technique, which are
available in SPSS software that enabled us to generate the sample based on the specified per-
centage of cases. Sampling was performed without replacement; so the same case cannot be se-
lected more than once. Hence, the huge data size was reducedto38961records which require only
1.78MB storage space.
3.1.3.2. Data Cleaning
Usually, real world databases contain incomplete, noisy and inconsistent data and such unclean-
ness data may cause confusion in the data mining process. Thus, data cleaning has become a very
important activity during data preparation phase in order to assure the quality of data so as to im-
prove the accuracy and efficiency of the data mining techniques.
Data cleaning task deals with all the data quality issues until the targeted dataset reaches the level
required by the selected analysis techniques. This may involve selection of clean subsets of the
data, insertion of suitable defaults or more ambitious techniques such as the estimation of miss-
ing data by modeling. Generally, data cleaning is a process which fills missing values, removes
noise (invalid data), and corrects data inconsistency[36].
Accordingly, the researcher took actions such as missing value handling, and outlier detection
and removal on the selected dataset to improve the quality of the targeted data set. The data
cleaning report describes the decisions and actions that were taken to address the data quality
problems of the initial data that were reported during data quality verification tasks. The report
also addresses outstanding data quality issues and possible effects it may have on the final re-
sults.
GSJ: Volume 7, Issue 7, July 2019 ISSN 2320-9186
270
GSJ© 2019 www.globalscientificjournal.com

32
3.1.3.2.1. Missing Value Handling
Missing value refers to the values of one or more attributes in a data that do not exist. Sometimes
missing value may be significant by itself and has to be properly handled. Theoretically, there
are several methods suggested in the data mining literature to handle missing values, such as:
calculating the average of continuous attribute values and filling this mean value for missing at-
tribute values, removing the tuple, using the global constant value i.e. question mark (?), and fill-
ing in the missing value manually[36].
The statistical summary of the initial dataset shows that some attributes in the original dataset
contain missing values, ranging from 0.1% to as high as 100%, which are difficult to predict, re-
place or fill. Thus, the researcher has decided to ignore those attributes that have large amount of
missing values from the dataset to assure the quality of the data. This is because, the research
believes that trying to fill these missing values using any accepted method will result in changing
the original input data with artificial data.
As stated in the data description and data quality verification tasks, that are shown above in ta-
bles out of the total 53 attributes of the original dataset, 19attributes were ignored because of
their large amount of missing values, and 20 attributes that have no relation with the research
goals have been removed. Out of these 20 attributes, 8 attributes hold area identification infor-
mation i.e., Code of Zone, Wereda, District, Farmers Association, Enumeration Area, Household
Id, Land Holder Id and Field ID, and 4 attributes hold information about the enumerator identifi-
cation like name, id, title, etc., which have no relevance for the research since the scope of the
study is limited to regional level,
Therefore, for this study 14 attributes that have less missing values, from 0% to 0.3%, were se-
lected and the remaining 39 attributes were omitted because of the above mentioned reasons. The
missing values found in the selected attributes are insignificant when compared with the initial
data set. Then, these missing values were handled by removing all the records since they are few
in numbers. The basic reason is that these missing values are few in number and contain values
that cannot be predicted, replaced or filled with mean value, and if we do so, it will create bias-
ness on the output of the experiment or lead to false/wrong interpretation.
GSJ: Volume 7, Issue 7, July 2019 ISSN 2320-9186
271
GSJ© 2019 www.globalscientificjournal.com

33
3.1.3.2.2. Outlier Detection and Removal
The data stored in a database may reflect outlier noise, exceptional case, incomplete data object
and random error in a measure of attribute values. These incorrect attribute values may occur due
to data entry problems, faulty data collection, inconsistency in naming convention or technology
limitation. According to[34], there are four basic noise handling methods for a given dataset such
as: binning, clustering, regression and combined computer and human inspection methods.
There are also other outliers handling methods that have been developed to handle noise for a
given dataset. Some of these methods are sensitive to extreme values, like the standard deviation
(SD) method, and others are resistant to extreme values. The SD method is a simple classical ap-
proach, which uses less robust measures such as the mean values, to identify outliers in a dataset.
Mean value is the most common labeling method that detects how much distance the data has
from the average, since mean value describes the average value of the global data[38].
Consequently, the researcher has identified and detected some noise or outlier value from the
target dataset, as discussed in the data quality verification task, through analysis of statistical
measure of variables available in SPSS. SD method was applied for handling outliers from the
dataset for those attributes containing continuous numeric values such as: Production in Quintal
(PRODQ) and Area in Hectare (AREAH). Then, high and low extreme values were replaced
with mean value for those data instances which have values greater than(Mean + 2*SD) or less
than (Mean - 2*SD) value, since values that do not lie within this range are extreme values and
considered as outliers[38]. The following operations were applied in handling outliers:
1. Take the Mean and Standard Deviation value for each attribute.
2. Identify the outliers (extreme values) for each attribute using the SD method.
3. Replace the outliers with mean values.
3.1.3.3. Data Integration
Data integration refers to an operation by which information is combined from multiple tables or
other information sources to create new records or values known as merged data, through joining
two or more tables together that have different information about the same objects. At the data
integration stage it may be advisable to generate new records and aggregate values, where new
values are computed by summarizing information from multiple records and/or tables[35].
GSJ: Volume 7, Issue 7, July 2019 ISSN 2320-9186
272
GSJ© 2019 www.globalscientificjournal.com

34
Accordingly, to integrate the three years crop production data it was required to create new vari-
able known as „YEAR‟ to hold values of different years. This attribute was included to make ag-
gregation of the three years data simple and suitable for SPSS software but not used as a decisive
factor for model building. In addition, another new attribute known as „YIELD‟ was derived
from crop production and cultivated land area where new values are computed and generated.
This new attribute helps to aggregate values from the records of attribute „PRODQ‟ (Production
in Quintal) and attribute AREAH (Area in Hectare) by summarizing information contained in the
data set. Then, after completing basic data pre-processing tasks separately on each file, the three
years data files (i.e. from 2013up to 2016 ),that have different information about the selected
variable were integrated or merged into one file for further analysis.
Since, it is a time series association the class variable should be the yield in the harvest season of
the year while the association are those variable values that affect crop productivity (YIELD) and
happen prior to the harvest season.
3.1.3.3.1. Data Construction
Data construction tasks include data preparation operations such as the computation of derived
attributes that are derived from one or more existing attributes in the same record, or constructing
completely new records or transformed values for existing attributes. According to[36],the basic
reasons for constructing derived attributes during the course of data because:
Background knowledge convinces us that some facts are important and should be repre-
sented, even though there is no attribute which currently represent it.
The modeling algorithm currently in use handles only certain types of data. In this study,
we are using association rule mining algorithm apriori for discovering frequent pattern
and discover the relationship between attribute of cereal crops by using data mining tech-
niquewhich requires only categorical data values.
When doing the experiments, the outcome of the rule phase may suggest that certain facts
are not being covered.
According to[36], the basic activities that have to be accomplished in performing transformation
we should specify the necessary transformation steps in terms of available transformation facili-
ties (for example, change a binning of a numeric attribute). Transformations may be necessary to
GSJ: Volume 7, Issue 7, July 2019 ISSN 2320-9186
273
GSJ© 2019 www.globalscientificjournal.com

35
transform ranges to symbolic fields or symbolic fields to numeric values as the algorithms often
require them. Therefore, in this study, some new attributes such as: „YIELD‟ and „YEAR‟ were
generated since they are very important for the data analysis task. Besides, while preparing the
data, attributes that have numeric or continuous values have been changed into nominal attribute
values.Furthermore, attribute or feature selection and data transformation were also done based
on the above guidelines and discussed in the following sub sections.
3.1.3.4. Attribute or Feature Selection
The ideal practice for variable selection is to take all the variables in the database, feed them to
the data mining tool and let it find those which are the best descriptor. But, in practice this
doesn‟t work very well. One reason is that the time it takes to build association model increases
with the number of variables. The second reason is that blindly including unnecessary columns
can lead to incorrect result. Although, in principle some data mining algorithms will automatical-
ly ignore irrelevant variables and properly account for related (covariant) columns, in practice it
is wise to avoid depending solely on the tool. Often, knowledge of the problem domain helps us
to make attributes selection correctly[37].
Consequently, after consultation with the domain experts at CSA about the meaning of the at-
tributes, the researcher decided to eliminate some attributes from the target dataset, since their
instances are irrelevant for the analysis of this data mining problem domain. Thus, 11attributes
that are irrelevant or redundant or already represented by other attributes in the database were
excluded from the target dataset. Besides, those attributes with no variation in their value
throughout the dataset and attributes which serve to assign sequence number for the records were
also eliminated. The selected attributes are indicated below.
According to[38], rates of less than 1% missing data are generally considered trivial, and that of
1-5% are manageable. However, 5-15% missing data requires sophisticated methods to handle it,
and more than 15% may severely impact any kind of interpretation. Due to these reasons we
were forced to remove 19 attributes which have higher missing values, more than the recom-
mended range.
GSJ: Volume 7, Issue 7, July 2019 ISSN 2320-9186
274
GSJ© 2019 www.globalscientificjournal.com

36
At this point, the number of attributes has diminished considerably, and out of the 53 attributes
of the original dataset the researcher selected 14attributesthat are found to be more relevant and
necessary to meet the research goals
List of the Selected Attributes and their Description
SR.
No.
Attribute
Name
Data
Type
Description
1. REG Numeric Region
2. HHSEX Numeric Head sex
3. FLDTYPE Numeric Field Type
4. CROP Numeric Types of Crop
5. OWNTYPE Numeric Ownership Type
6. EXT Numeric Is field under Extension Program?
7. IRRG Numeric Is Field Irrigated?
8. SEEDTYPE Numeric Type of Seed (Improved or Non- Improved)
9. DAMAGE Numeric Was crop damaged?
10. DMTYPE Numeric Type of measure to prevent damage
11. FERT Numeric Is Fertilizer Used?
12. FERTTYPE Numeric Type of fertilizer used if any?
13. D22A Numeric If chemical fertilizer used, type?
14. YIELD Numeric Production per Hectare Table 4: List of the Selected Attributes and their Description
3.1.3.5. Transformation and Aggregation
In data transformation and aggregation, the collected data are transformed or consolidated into
forms that are appropriate for data mining. This task includes constructive data preparation oper-
ations such as the creation of derived attributes, generating new or transformed values for exist-
ing attributes, combining records and summarizing fields[36].
Data analysis using association technique can only be performed on definite data (discrete or
nominal values). Thus, data reduction on numeric or continuous values of attributes is required in
order to make the analysis process manageable. According to[39],[21], data reduction techniques
include data discretization, which is one of transformation methods used to reduce the number
of continuous values of a given attribute by dividing the range of the attribute into intervals.
Then, interval labels can be used to replace the actual data values using different methods such
as: data cube aggregation, dimensional reduction (irrelevant or redundant attributes are re-
moved), data compression (data is encoded to reduce the size), and numerous reduction (models
GSJ: Volume 7, Issue 7, July 2019 ISSN 2320-9186
275
GSJ© 2019 www.globalscientificjournal.com

37
or samples are used instead of the actual data)[34]. Generally, discretization reduces significantly
the number of possible values of continuous feature since large numbers of possible values con-
tribute to slow and ineffective process of inductive machine learning.
Some of the attributes in the targeted dataset like „PRODQ’ (Production in quintal), ‘AREAH’
(Area in Hectare) and ‘YIELD’ (Crop production per Hectare) have numeric data type and con-
sist of more than 10,000 unique or continuous values. Hence, these continuous values have been
grouped into ranges to have a combined smaller number of group values or intervals, and their
data type converted from numeric to nominal. These helped us to reduce the large number of
possible values to make the dataset suitable for data mining tools. These tasks were performed
using simple ranking methods and sum of case weights approach which are available in SPSS
software that allow us to create new or separate ranking variables for such continuous values of
numeric attributes. The new attribute values contain values equal to the sum of case weights,
which are constant for all cases in the same group. So, the numeric attribute values are grouped
into 10constant intervals to secretiveand then, transformed into new distinct values in order to
improve performance of the models.
The following tables illustrate the transformed attribute values that were created by grouping
their continuous values into a smaller number of categorical data to reduce complexity of the re-
sults.
SR.
No.
Attribute
Name
Data
Type
Description Possible Values
1. REG Numeric Region Amhara Region = 3 and
Oromia Region = 4
2. HHSEX Numeric Head sex Male = 1
Female = 2
3. FLDTYPE Numeric Field Type Single or one crop type = 1
Mixed crops= 2
Other land use = 3
4. CROP Numeric Types of Crop Barley = 1
Maize = 2
Sorghum = 6
Teff = 7
Wheat = 8
5. OWNTYPE Numeric Ownership Type Private = 1
Rent = 2
Others = 3
6. EXT Numeric Is field under Ex- Yes = 1
GSJ: Volume 7, Issue 7, July 2019 ISSN 2320-9186
276
GSJ© 2019 www.globalscientificjournal.com

38
tension Program? No = 2
7. IRRG Numeric Is Field Irrigated? Yes = 1
No = 2
8. SEEDTYPE Numeric Type of Seed (Im-
proved or Non-
Improved)
Yes = 1
No = 2
9. DAMAGE Numeric Was crop dam-
aged?
Yes = 1
No = 2
10. DMTYPE Numeric Type of measure to
prevent damage
Chemical = 1
Non-Chemical = 2
Both = 3
11. FERT Numeric Is Fertilizer Used? Yes = 1
No = 2
12. FERTTYPE Numeric Type of fertilizer
used if any?
Natural = 1
Chemical = 2
Both = 3
13.
D22A Numeric If chemical ferti-
lizer used, type?
UREA = 1
DAP = 2
Both = 3
Not stated
14. YIELD Numeric Production per
Hectare
Excellent=yield in Kg /hectare>3000
Very good= yield in Kg /hectare>2500
Good= yield in Kg /hectare>2000
Poor= yield in Kg /hectare>1500
Bad = yield in Kg /hectare<1500
Table 5: Descriptions of the Selected Attributes with Their Possible List of Values
3.1.3.6. Data Formatting
Data formatting task primarily refers to syntactic modification or changes made to the data with-
out changing its meaning, but might be required to satisfy the requirements of the specific mod-
eling tool[35][40] .Most data mining tools in use can handle only certain types of file format and
data types. For instance, WEKA software requires the target dataset to be prepared in the Com-
ma Separated Value (CSV) file format to run experiments. This software either process the CSV
file format itself or a file in the form of Attribute Relation File Format (ARFF). WEKA software
allows the conversion of CSV file format into an ARFF file format which is acceptable for run-
ning experiments on WEKA software.
Hence, after all data pre-processing tasks have been completed, the target dataset was imported
and saved into CSV file format using SPSS package, and then, the targeted data was converted
successfully into Attribute Relation File Format (ARFF).
GSJ: Volume 7, Issue 7, July 2019 ISSN 2320-9186
277
GSJ© 2019 www.globalscientificjournal.com

39
3.1.4. Mining (modeling) techniques As it is stated above the mining tasks is association rule mining analysis. The total experimenta-
tion for this research is three experiments. WEKA 3.8 DM using apriori algorithms with differ-
ent metrics confidence, support and lift. This experiment conducted on the following machine
resource Toshiba Satellite P845t-S4310, 4GB internal memory (RAM), 400 GB Hard disk and
window 8 64-bit operating system and Intel(R) Core(TM) i3 3317U CPU @ 1.70GHz processor.
3.1.4.1. Association rule Modeling
The next step of this research is discovering strong crop production patterns using association
rule mining techniques. In this association rule modeling different experiments were conducted
using WEKA DM tools. As stated primarily three experiments of association rule mining analy-
sis were conducted using different metrics support and confidence value. To generate more rules
and better understand with different perspectives on the whole data set (38961). Those experi-
ments‟ were using WEKA DM tool using apriori algorithm.
3.1.4.1.1. Apriori algorithm Apriori is a classic algorithm for frequent item set mining and association rule learning over
transactional databases. It proceeds by identifying the frequent individual items in the database
and extending them to larger and larger item sets as long as those item sets appear sufficiently
often in the database. The frequent item sets determined by Apriori can be used to determine as-
sociation rules which highlight general trends in the database: this has applications in domains
such as market basket analysis. The rules generated by apriori algorithm makes it easier for the
user to understand and further apply the result. Employed the association rule method specifical-
ly apriori algorithm to identifying novel, unpredicted and exciting samples in hospital infection
control. Another study by employed apriori algorithm to generate the frequent item sets and de-
signed the model for economic forecasting, presented their methods on modeling and inferring
user‟s intention via data. Association rules are usually required to satisfy a user-specified mini-
mum support and a user specified minimum confidence at the same time [41].In the research
which is conducted by apriori algorithm mentioned as one of the most important findings in the
history of mining association rules since its introduction [34][37] and basic concepts defined be-
fore the introduction of algorithms for mining association rules. In the research Item sets includ-
ed in a database is shown by Item set=, X1, X2 …Xn. Then, for each rule, two values of support
and confidence is determined. Support is the probability that the transactions contain both X and
GSJ: Volume 7, Issue 7, July 2019 ISSN 2320-9186
278
GSJ© 2019 www.globalscientificjournal.com

40
While Confidence is the conditional probability that the transaction containing X and Y also con-
tains Y.
According to[37], apriori algorithm is a widely used algorithm for the association rule and it is
based on the rule of all sub item sets of a frequent item sets must also be frequent .By using this
rule, apriori is able to prune huge amount of item sets. Besides it uses a bottom up approach.
The other research which mentioned about apriori algorithm is [41].In this research apriori algo-
rithm mentioned as the first and best known for association rule mining .It is one of the most in-
fluential Boolean association rule mining for frequent item sets . It is an iterative algorithm to
calculate the specific length of item collection of given database to produce frequent item sets. It
cut down candidate item sets using the principle that all non-empty subsets of frequent item sets
are frequent too. apriori algorithm basically works in two steps. In first step candidate item set is
generated using linking process and in next step frequent item set from those candidate item set
is found based on minimum support count by scanning the database.
3.1.4.1.2. Comparing Different Algorithms
GSJ: Volume 7, Issue 7, July 2019 ISSN 2320-9186
279
GSJ© 2019 www.globalscientificjournal.com
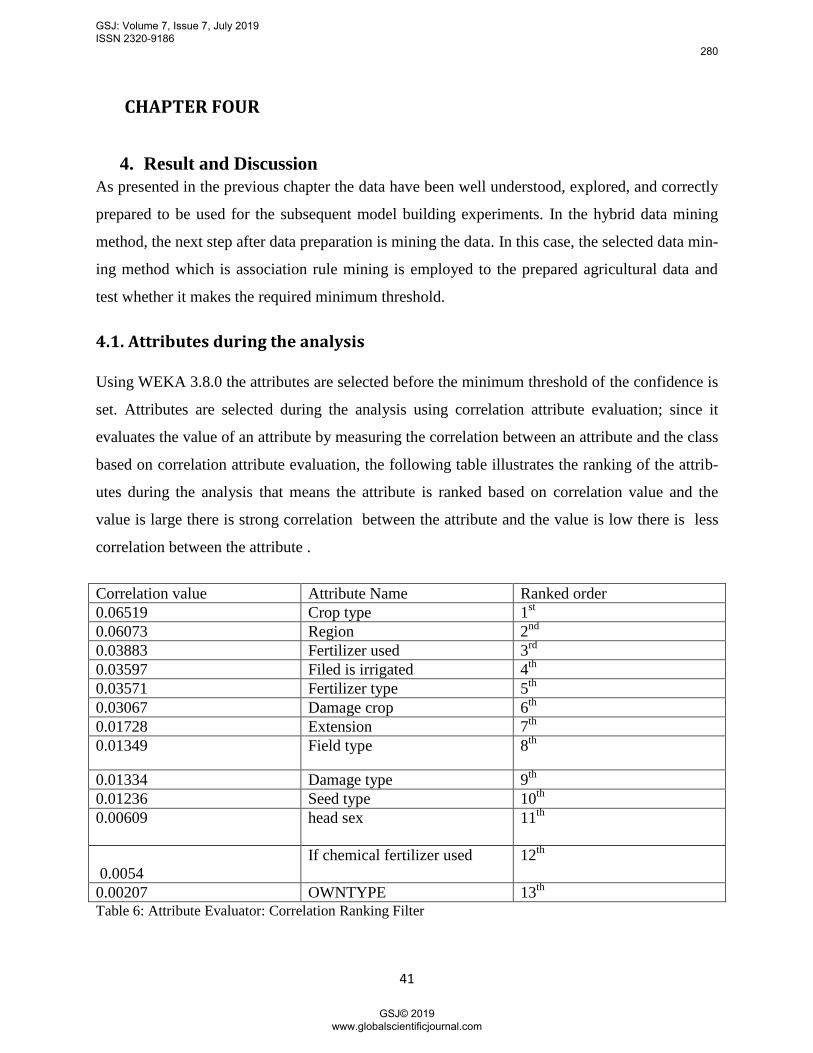
41
CHAPTER FOUR
4. Result and Discussion
As presented in the previous chapter the data have been well understood, explored, and correctly
prepared to be used for the subsequent model building experiments. In the hybrid data mining
method, the next step after data preparation is mining the data. In this case, the selected data min-
ing method which is association rule mining is employed to the prepared agricultural data and
test whether it makes the required minimum threshold.
4.1. Attributes during the analysis
Using WEKA 3.8.0 the attributes are selected before the minimum threshold of the confidence is
set. Attributes are selected during the analysis using correlation attribute evaluation; since it
evaluates the value of an attribute by measuring the correlation between an attribute and the class
based on correlation attribute evaluation, the following table illustrates the ranking of the attrib-
utes during the analysis that means the attribute is ranked based on correlation value and the
value is large there is strong correlation between the attribute and the value is low there is less
correlation between the attribute .
Correlation value Attribute Name Ranked order
0.06519 Crop type 1st
0.06073 Region 2nd
0.03883 Fertilizer used 3rd
0.03597 Filed is irrigated 4th
0.03571 Fertilizer type 5th
0.03067 Damage crop 6th
0.01728 Extension 7th
0.01349 Field type 8th
0.01334 Damage type 9th
0.01236 Seed type 10th
0.00609
head sex 11th
0.0054
If chemical fertilizer used 12th
0.00207 OWNTYPE 13th
Table 6: Attribute Evaluator: Correlation Ranking Filter
GSJ: Volume 7, Issue 7, July 2019 ISSN 2320-9186
280
GSJ© 2019 www.globalscientificjournal.com

42
4.2. Discovering the rules
Depending on the choice of the thresholds, the algorithm can become very slow and generate an
extremely large amount of results or generate none or too few results, omitting valuable infor-
mation [29][23].
4.2.1. Experimental setup to discover the rules Configuring minimum support 0.10, and minimum confidence of 0.9; some of the rules are
Rule Support Confi
fi-
dence
Lift
Damage type=non-chemical 31456 ==> Seed type=Non-Improved
30757
0.1 0.98 1.12
filed is irrigated=No If chemical fertilizer used=Not Stated 31351
==>Extension=No 29725
0.1 0.95 1.07
region=Oromia 32071 ==> filed is irrigated=No 30126
0.1 0.94 1.03
filed is irrigated=No 35550 ==> OWNTYPE=Private 33331
0.1 0.94 1.01
Table 7: Configuring minimum support 0.10, and minimum confidence of 0.9
Configuring minimum support of 0.15and minimum confidence of 0.7; some of the following
rules are discovered:
Rule support confi-
dence
Lift
region=Oromia head sex=Male crop type=Wheat filed is irrigat-
ed=No Seed type=Non-Improved If chemical fertilizer
used=NotStated yield production per hectare=Bad 7012 ==>
Damage crop=No 5844
0.15 0.84 1.27
region=Oromia head sex=Male crop type=Wheat filed is irrigat-
ed=No Damage crop=No If chemical fertilizer used=Not Stated
yield production per hectare=Bad 5898 ==> Seed type=Non-
Improved 5844
0.15 0.99 1.13
head sex=Male crop type=Maize Damage type=non-chemical
6909 ==> region=Oromia If chemical fertilizer
used=NotStated5844
0.15 0.85 1.18
region=Oromia head sex=Male crop type=Wheat Damage
crop=No If chemical fertilizer used=Not Stated yield production
per hectare=Bad 6115 ==> filed is irrigated=No Seed type=Non-
Improved 5844
0.15 0.96 1.2
GSJ: Volume 7, Issue 7, July 2019 ISSN 2320-9186
281
GSJ© 2019 www.globalscientificjournal.com

43
Table 8: Configuring minimum support of 0.15 and minimum confidence of 0.7
Configuring Minimum support 0.25 and minimum confidence 0.25; some of the following rules are
discovered.
Rule support confi-
dence
Lift
head sex=Male OWNTYPE=Private Extension=No Seed
type=Non-Improved Damage crop=No Fertilizer used=No 9740
==> fertilizer type=Both 9740
0.25 1 1.78
head sex=Male OWNTYPE=Private Extension=No Damage
crop=No Fertilizer used=No 9822 ==> Seed type=Non-Improved
fertilizer type=Both 9740 <conf:(0.99)> lift:(1.95)
0.25 0.99 1.95
head sex=Male OWNTYPE=Private Seed type=Non-Improved
Damage crop=No Fertilizer used=No 10201 ==>Extension=No
fertilizer type=Both 9740
0.25 0.95 1.83
head sex=Male OWNTYPE=Private Extension=No Damage
crop=No Fertilizer used=No If chemical fertilizer used=Not Stat-
ed9822 ==> Seed type=Non-Improved fertilizer type=Both 9740
<conf:(0.99)> lift:(1.95)
0.25 0.99 1.95
Table 9: Configuring Minimum support 0.25 and minimum confidence 0.25
4.3. Evaluation of the discovered knowledge Based on the hybrid data model, the next step after mining of the data is an evaluation of the dis-
covered knowledge or rules. To evaluate the interestingness of the discovered rules, the study
uses interestingness measure based on correlation or lift and evaluation using domain experts.
Interestingness measures of an association rule
Generally, there are two evaluation standards to evaluate whether an association rule is interest-
ing or not: the objective measure and the subjective measure. The method of the objective meas-
ure can obtain a quantitative value by the algorithm, and it is relatively visual and easy to oper-
ate. However, the rule after the evaluation of the objective measure may be not the mode users
interested in, therefore, the subjective measure is required. In order to ensure that the final min-
ing rule can arouse the interests of the users or the experts in the field, they should be involved in
the process and make use of their knowledge to pruning the rule[42],[43].
Objective Measure interestingness
An objective measure is a data-driven approach for evaluating the quality of association patterns.
It is domain-independent and requires minimal input from the users, other than to specify a
threshold for filtering low-quality patterns.
GSJ: Volume 7, Issue 7, July 2019 ISSN 2320-9186
282
GSJ© 2019 www.globalscientificjournal.com

44
Support and Confidence: Support and Confidence are two common indicators of the objective
measure to evaluate the association rule; the former measures the usefulness of the rules while
the latter reflects the effectiveness of the rules[44],[45].Support refers to the frequency that the
concurrence of data domain A and B involved by the association rule occupies in all of item sets,
during the researching data item sets. The accuracy will be higher only when the researching as-
sociation rule frequently appears in item sets. Only when the support of the concurrence of A and
B is greater than or equal to the designated minimum support threshold, A and B will be con-
firmed to be the frequent item sets.
These steps includes interpretation of the results, cross checking the results and observing the
interestingness and the relationship of the discovered knowledge, review the process and other
means of discovering knowledge can be assessed. Based on the review another step can be de-
termined. Besides based on the discovered results there is a discussion with domain experts; in
this case the domain experts are the data analysts from central statistics agency The discovered
knowledge can be divided in to three parts namely expected and previously known which are
rules that confirms user beliefs and can be used to validate the initial approach; the other is un-
expected that contradicts user beliefs and which needs further investigation for its interestingness
and the need for taking an action. The third one is unknown that doesn‟t clearly belong to any
category and which needs domain specific experts to categorize [46].To evaluate the interesting-
ness of association rules, the researcher uses measure based on correlation or lift.
Correlation (A, B) or lift = P (AUB)/P(A)P(B), where A and B are item sets.
If the correlation or lift value is less than 1, then the occurrence of A is negatively correlated
with the occurrence of B.
If the correlation or lift value is greater than 1, A and B are positively correlated. This implies the
occurrence of one implies (promotes) the occurrence of the other.
Similarly, if the correlation or lift value is 1, A and B are independent. This implies there is no
correlation between the items.
GSJ: Volume 7, Issue 7, July 2019 ISSN 2320-9186
283
GSJ© 2019 www.globalscientificjournal.com

45
Rule confidence Lift
1. head sex=Male OWNTYPE=Private Extension=No Damage
crop=No fertilizer type=Both 10160 ==> Seed type=Non-Improved
Fertilizer used=No If chemical fertilizer used=NotStated 9740
<conf:(0.96)> lift:(1.99
0.96 1.99
2. head sex=Male OWNTYPE=Private Seed type=Non-Improved
Damage crop=No fertilizer type=Both If chemical fertilizer
used=Not Stated 10201 ==>Extension=No Fertilizer used=No 9740
0.95 1.89
3. region=Oromia head sex=Male crop type=Wheat filed is irrigat-
ed=No Seed type=Non-Improved If chemical fertilizer used=Not
Stated yield production per hectare=Bad 7012 ==> Damage
crop=No 5844
0.84 1.27
4. head sex=Male crop type=Maize Damage type=non-chemical 6909
==> region=Oromia If chemical fertilizer used=Not Stated 5844
0.85 1.18
5. region=Oromia head sex=Male crop type=Wheat filed is irrigated=No
Damage crop=No If chemical fertilizer used=Not Stated yield production
per hectare=Bad 5898 ==> Seed type=Non-Improved 5844
0.83 1.3
6. head sex=Male OWNTYPE=Private Extension=No Damage crop=No
Fertilizer used=No If chemical fertilizer used=Not Stated 9822 ==> Seed
type=Non-Improved 9740
0.99 1.95
7. head sex=Male OWNTYPE=Private Seed type=Non-Improved Damage
crop=No Fertilizer used=No 10201 ==>Extension=No If chemical fertilizer
used=Not Stated 9740
0.95 1.17
8.head sex=Male OWNTYPE=Private Seed type=Non-Improved Damage
crop=No Fertilizer used=No 10201 ==>Extension=No fertilizer type=Both
9740 <conf:(0.95)> lift:(1.83)
0.95 1.83
9.crop type=Maize Damage type=non-chemical If chemical fertilizer
used=Not Stated 7083 ==> region=Oromia head sex=Male 5844
0.83 1.16
10. crop type=Wheat filed is irrigated=No Damage crop=No If chemical
fertilizer used=Not Stated yield production per hectare=Bad 7569 ==> re-
gion=Oromia head sex=Male Seed type=Non-Improved 5844
0.77 1.26
11. head sex=Male OWNTYPE=Private Extension=No Damage crop=No
fertilizer type=Both 10160 ==> Seed type=Non-Improved Fertilizer
used=No If chemical fertilizer used=Not Stated 9740
0.96 1.99
12. head sex=Male OWNTYPE=Private Seed type=Non-Improved Damage
crop=No fertilizer type=Both If chemical fertilizer used=Not Stated 10201
==>Extension=No 9740
0.95 1.89
Table 10: based on correlation or lift and evaluation using domain experts selected rule
GSJ: Volume 7, Issue 7, July 2019 ISSN 2320-9186
284
GSJ© 2019 www.globalscientificjournal.com

46
4.4. Discussion of the Finding
Data mining results cover models which are necessarily related to its original objectives and all
other findings which are not necessarily related to these objectives but might also reveal addi-
tional challenges, information or hints for future directions[47].According to [48],findings can be
defined as anything apart from the association rule that is important in meeting objectives of the
business or important in leading to new questions, or side effects e.g. data quality problems un-
covered by the data mining exercise. Although the result is directly connected to the business
objectives, the findings need not be related to any questions or objectives, but are important to
the initiator of the study.
From the analysis the discovered knowledge are categorized based on the seed type, extension,
damage type, head sex, filed irrigated, filed type, crop type, fertilizer type, owner type, region,
chemical fertilizer used attributes. Due to the completeness nature of algorithm such as apriori
the number of pattern that are extracted are very large. Therefore there is needed prune or rank
the discovered pattern according to their degree of interestingness. Due to this twelve best rules
are selected those satisfying minimum support and lift greater than threshold is listed above.
Rules satisfying minimum requirement of support and confidence threshold are strong rules and
lift measure evaluate the interestingness of the rules generated[48]. Additionally, the researcher
let experts‟ judgments interestingness measure and importance. So the generated rules are ex-
tremely large, all rules have not been exhaustively assessed. Some of the rules that have been
discussed here are those considered more important. However, there are still other relevant find-
ings in the remaining rules which require much time and effort to exhaustively explore. The fol-
lowing are rules selected for discussion from association rule experiment
Rule 3:-region=Oromia head sex=Male crop type=Wheat filed is irrigated=No Seed type=Non-
Improved If chemical fertilizer used=Not Stated yield production per hectare=Bad 7012 ==>
Damage crop=No 5844 <conf :( 0.84)>lift:(1.27)
This rule indicates that wheat crop is highly associated with the type of seed used, irri-
gation use, and sex of the household head, region, Extension service and fertilizer then
damage occurrence have effect in the production of wheat because they have positive
correlation and frequently occurrence show on the given confidence and lift those indi-
GSJ: Volume 7, Issue 7, July 2019 ISSN 2320-9186
285
GSJ© 2019 www.globalscientificjournal.com

47
cate that one attribute promote the occurrence of another attribute then in wheat crop pro-
duction those the above feature are determine the amount of yield.
. Rule 6:-head sex=Male OWNTYPE=Private Extension=No Damage crop=No Fertilizer
used=No If chemical fertilizer used=Not Stated 9822 ==> Seed type=Non-Improved 9740
conf :( 0.99), lift :( 1.95)
The meaning of this rule is if a household is male, owner is private, not using extension, no ferti-
lizer used then seed type is not improved and not properly using fertilizer type. The support for
this rule can be computed by dividing the figure on the right-hand-side of the rule 9740 by the
total number of instances considered in generating association rules, 9882. This rule has a sup-
port of 99%. The number 9740 on the right-hand-side of the rule indicates the number of items
covered by its antecedent. The confidence is also computed by dividing the figure on the left-
hand-side of the rule by the figure on the right-hand-side of the rule. Following the rule is the
number of those an item for which the rule‟s consequent holds as well, then there is highly posi-
tive correlation ship between those attributes because of the value of lift and confidence [49].it
indicate that the frequently occurrence of one attribute with another attribute is high.
Rule 4:-head sex=Male crop type=Maize Damage type=non-chemical 6909 ==> re-
gion=Oromia If chemical fertilizer used=Not Stated 5844 conf :( 0.85), lift :( 1.18)
This pattern suggested that male head sex, crop type is maize the damage is non-chemical then in
Oromia region and chemical fertilizer is not stated so yield production of maize is highly associ-
ate with on the above features that means this attribute is positively correlated and frequent oc-
currence is assured by a given confidence and lift then the above mentioned factors are highly
determine yield production of maize in Ethiopia. Here researcher used high minimum support
because its feet with the dataset in discovering the desired knowledge. Some of our results are
broadly consistent with[11] which they discovered hidden patterns from survey data using asso-
ciation rule mining approach.
Rule 10:-crop type=Wheat filed is irrigated=No Damage crop=No If chemical fertilizer
used=Not Stated yield production per hectare=Bad 7569 ==> region=Oromia head sex=Male
Seed type=Non-Improved 5844 <conf:(0.77)> lift:(1.26)
This rule shows that wheat crop, non- irrigated field, damage is not occurring, chemical fertilizer
is not stated, yield, production is bad, then region is Oromia,head sex is male seed is non-
improved, meaning that those mentioned features are determinate factor for wheat, crop produc-
GSJ: Volume 7, Issue 7, July 2019 ISSN 2320-9186
286
GSJ© 2019 www.globalscientificjournal.com

48
tion because they occur frequently in a positive direction that means as the literature indicates
that lift value is greater than one there is positive relation and one promote the occurrence of an-
other [48].
Rule 12: -head sex=Male OWNTYPE=Private Seed type=Non-Improved Damage crop=No fer-
tilizer type=both If chemical fertilizer used=Not Stated 10201 ==>Extension 9740 <conf :(
0.95) >lift :( 1.89) These rules show that male head sex, private owners, non- improved seed damage does not oc-
cur, fertilizer type both natural and chemical then not using extension, meaning that those factors
which are determine the yield production of the whole cereal crop these are assured by measur-
ing the interestingness of the rule based on the given confidence and lift[50].So the relationship
between those the given attributes are positive because when the lift value is greater than one that
means one is promoting the occurrence of another[51].
Generally:-the findings observed in the interpreted rules indicate that the algorithms used for
building the association rule models assumed that all attributes of the targeted dataset were used
for the construction of decision rule sets. However, some attributes like use of chemical fertilizer
identification and owner type have less effect on major cereal crop productivity. Use of Im-
proved Seed, amount of Fertilizer used, using extension service, region and percentage of crop
damage showed a strong relationship with productivity (yield) of all major cereal crops. There-
fore, it can be concluded that improved seed, optimum fertilizer used, extension service, using
irrigation and percentage of crop damage are determinant factors for annual major cereal crop
production.
In this study maize and wheat is highly associated based on their determinate factors because of
the attribute of maize is almost similar to wheat and those attributes also occur frequently and
positively correlated, then those two cereal crops are specially more correlative and associative
and have almost similar determinate factors.
The major challenges we observed in the course of the association rule model building tasks are
the side effects encountered on the final output of this study due to the data quality problems
which were uncovered during the data mining exercise, since there is no other means that helps
to know the validity of the original data set.
GSJ: Volume 7, Issue 7, July 2019 ISSN 2320-9186
287
GSJ© 2019 www.globalscientificjournal.com

49
CHAPTER FIVE
CONCLUSION, CONTRIBUTION, AND RECOMMENDATION
The obtained results of this study works, which deal with identifying the determinant factors for
Crop Production and the relationship between those discovering important knowledge and inter-
esting patterns from the existing data, lead to the following conclusions:
Use of non-improved seed and not properly using fertilizer, not using the extension and irriga-
tion as well as the region and male household are showing a strong positive relationship with
wheat, crop production (Yield) and this observation led us to conclude that fertilizer, improved
Seed extension and Irrigation are important variables for cereal crop production.
More attention has to be given to each statistical survey processing steps in conducting crop
production correlations(starting from questionnaire design which goes through data collection,
data editing & coding, data capturing, data cleaning & analysis, reporting and dissemination of
final results and evaluations), in order to obtain high quality data.
In cereal crop production Oromia region, filed irrigation in private owners highly relate each
other as well as non-chemical damage type and non-improved seed in private owners highly
asociate,not properly using extension service in Oromia region are occur frequently specially
determine maize production. Similarly, strong rules are achieved using apriori algorithm which
can be easily understood by domain experts and other stakeholders. Finally, we see from the
study maize and wheat is more correlated because of those most frequent patterns are the same.
But in using Apriori algorithm, there is no standard way of setting different thresholds. This
leads to missing the strong rules.
Furthermore, the findings of the study and the discovered knowledge could initiate further re-
searches to be continued (embarked on) in this problem domain
Contribution of the Study
This research sought to consider the application of association rule mining technique to find rela-
tionship and interesting patterns between attributes of survey data. These subjects would be fully
fill the gap of previous research by keying out the relationship between attributes in food grain
GSJ: Volume 7, Issue 7, July 2019 ISSN 2320-9186
288
GSJ© 2019 www.globalscientificjournal.com

50
crop yield. Thus the field helps the agriculture professionals, policy shapers and other responsi-
ble body for decides scientifically.
Another donation is for researchers help as initial concept when they require applying associa-
tion rule mining techniques using different algorithm for further investigation. Finally, the study
is contributed for farmers to improve their crop production for sustainable growth of their pro-
duction.
The outcome of the study could be important milestones for the concerned organization (ECSA)
that enables it to re-engineer the traditional statistical survey analysis system to fully automated
data processing scheme to improve the data quality in collaboration with other organizations to
minimize the scare resources of the country.
Finally, since no field data are required for the newly developed correlation model, it gives the
précised solution for the problems faced by the government in conducting crop production corre-
lation survey through field data collection method every year. This is because the association
model works with the most determinant factors for crop production correlations that can be col-
lected from the concerned regional offices and other agricultural centers as a secondary data.
Therefore, this association rule has a better advantage in minimizing these huge amounts of fi-
nancial resources and quiet a lot of time that the survey requires every year.
Recommendation This research work has been conducted mainly for academic achievement. However, the re-
searcher strongly believes that the findings of the study can be used by the concerned organiza-
tions to further investigate their data quality problems and to choose appropriate data analysis
methods, techniques and tools that are currently in use for processing the country‟s crop produc-
tion determinate factors.
Hence, based on the findings of this study, the following recommendations are forward-
ed the study uses association rule mining methods and apriori algorithm to identify the
determinant factor for the cereal crop production it will be essential if other researchers
use another algorithm since there is no standard way of setting the threshold and this
leads to missing of important rules.
The researcher feels that the number of experiments undertaken in this study is not
enough to have a comprehensive conclusion about the application of the data mining
GSJ: Volume 7, Issue 7, July 2019 ISSN 2320-9186
289
GSJ© 2019 www.globalscientificjournal.com

51
techniques on survey data such as the cereal crop production survey dataset. Therefore,
future research work in this area should consider different alternatives to identify rela-
tionships between the attributes in the dataset that could help in building more accurate
result in major cereal crop production.
Another future work is to test the applicability of other association rule mining algo-
rithms and software for mining rules from survey data and compare the results. One
weakness of the apriori association rule algorithm is inability to handle numeric data.
The researcher transformed numeric attributes into nominal by listing their possible val-
ues. So, other algorithms which can perform more efficiently and effectively than apriori
algorithm and WEKA software should be investigated and applied.
There are a number of techniques used to enhance the apriori algorithm or association
rule algorithms in general. In this research the apriori algorithm was applied directly as it
is implemented in WEKA, without any adjustment to improve its performance. Thus, it
is important to investigate techniques of improving apriori efficiency in future research
work.
Finally, the researcher suggests further studies are required to establish the result of this
descriptive DM could be used as input to other ADM related study and help as key in in-
tegrating the DM result to knowledge base system and recommender system to farmers.
GSJ: Volume 7, Issue 7, July 2019 ISSN 2320-9186
290
GSJ© 2019 www.globalscientificjournal.com

52
Reference
[1] N. Neelaveni, “Data Mining In Agriculture- A Survey,” Verlag, Springer.vol. 4, no. 4, pp.
104–107, 2016.
[2] A. S. Taffesse, P. Dorosh, and S. Asrat, “Crop Production in Ethiopia : Regional Patterns
and Trends,”Department of social science,UoG,2011.
[3] S. Chouhan, “A Survey and Analysis of Various Agricultural Crops Classification
Techniques,” vol. 136, no. 11, pp. 25–30, 2016.
[4] J. Majumdar, S. Naraseeyappa, and S. Ankalaki, “Analysis of agriculture data using data
mining techniques: application of big data,” J. Big Data, vol. 4, no. 1, 2017.
[5] A. Azevedo, “A Survey on Data Mining Techniques in Agriculture,” vol. 3, no. 8, pp. 426–
431, 2014.
[6] B. Legesse, "Knowledge Discovery from Agricultural Survey Data: The Case of Teff
Production in Ethiopia," Computer Science and Technology, HiLCoE, Addis Ababa, 2013.
[7] UN, “Report on United Nations Development Programme Agricultural Growth and
Transformation Strengthening National Capacity through Economic Growth & Poverty
Reduction,” San Francisco, USA, 2016.
[8] E. K. T. Lower, “Revised Document Summary,” no. September, pp. 1–2, 2014.
[9] Alemayehu Seyoum, "Crop Production in Ethiopia: Regional Patterns and Trends",
Master’s thesis, Department of Computer Science,AAU, 2012.
[10] B. Pinnar, “Cereal Crops reports: Rice, Maize, Millet, Sorghum, Wheat,” vol. 2, no.
3,2015.
[11] R. G. Thakkar, M. Kayasth, and H. Desai, “Rule Based and Association Rule Mining On
Agriculture Dataset,” pp. 6381–6384, 2014.
[12] D. Hand, "Principles of Data Mining,"Cambridge, MIT Press, London England vol.2.
2001.
[13] G. N. Fathima, “Agriculture Crop Pattern Using Data Mining Techniques,” vol. 4, no. 5,
pp. 781–786, 2014.
[14] M. J. Zaki and L. Wong, “Data mining techniques,” Publisher Springer Science+Business
Media 2012.
[15] C. Shearer, “The Knowledge Discovery Process,” AAAI Press ,2013.
[16] C. I. Ipp, A. Azevedo, and M. F. Santos, “Kdd, semma and crisp-dm: a parallel
overview,” pp. 182–185, 2008.
GSJ: Volume 7, Issue 7, July 2019 ISSN 2320-9186
291
GSJ© 2019 www.globalscientificjournal.com

53
[17] O. Niakšu, “CRISP Data Mining Methodology Extension for Medical Domain,” Balt. J.
Mod. Comput., vol. 3, no. 2, pp. 92–109, 2015.
[18] S. H. Sastry and P. M. S. P. Babu, “Implementation of CRISP Methodology for ERP
Systems,” Int. J. Comput. Sci. Eng., vol. 2, no. 5, pp. 203–217, 2013.
[19] C. Shearer, "the CRISP-DM Model: The New Blueprint for Data Mining,". San
Francisco: Morgan Kaufmann Publishers, 2000.
[20] N. B. Classifier, P. C. Analysis, and K. Discovery, “Hybrid D Ata M ining Technique For
K Nowledge D Iscovery From E Ngineering,” pp. 1–12, 2014.
[21] U. Fayyad, G. Piatetsky-shapiro, and P. Smyth, “From Data Mining to Knowledge
Discovery in,” vol. 17, no. 3, pp. 37–54, 1996.
[22] V. Kaleeswaran and R. Rathipriya, “A Study on Data Mining Approaches for Agricultural
Intelligence,” vol. 5, no. 4, pp. 453–456, 2016.
[23] Z. Diriba, “Application of Data Mining Techniques for Crop Productivity Prediction,”
department of information technology ,AAU2000.
[24] M. Kamber, “A survey on Data Mining Techniques for Crop Yield Prediction,” pp. 59–64,
2014.
[25] M. Tiwari, “Application of Cluster Analysis in Agriculture – A Review Article,” vol. 36,
no. 4, pp. 43–47, 2011.
[26] S. A. R. Kumar, “A Study On Paddy Crops Disease Prediction Using Data Mining
Techniques Department of Information Technology,” vol. 7, no. 1, pp. 336–347, 2015.
[27] J. Joseph, “Rainfall Prediction using Data Mining Techniques,” vol. 83, no. 8, pp. 11–15,
2013.
[28] C. Gy, R. Gy, and S. Holban, “A Comparative Study of Association Rules Mining
Algorithms,” vol. 40, no. 2015.
[29] R. Z. Osman “Evaluating The Performance Of Association Rule Mining,” vol. 2, no. 6, pp.
101–103, 2011.
[30] P. Tanna and Y. Ghodasara, “Using Apriori with WEKA for Frequent,” vol. 12, no. 3, pp.
127–131, 2014.
[31] P. P. Tanna and Y. Ghodasara, “Foundation for Frequent Pattern Mining Algorithms ’
Implementation,” vol. 4, no. 7, pp. 2159–2163, 2013.
[32] H. Fetanat, L. Mortazavifar, and N. Zarshenas, “The Application of Data Mining
Techniques in Agricultural Science,” pp. 108–116, 2015.
GSJ: Volume 7, Issue 7, July 2019 ISSN 2320-9186
292
GSJ© 2019 www.globalscientificjournal.com

54
[33] J. Solanki and P. Y. Mulge, “Different Techniques Used in Data Mining in Agriculture,”
vol. 5, no. 5, pp. 1223–1227, 2015.
[34] M. Kamber, M. Kaufmann, and P. All, “Note : This manuscript is based on a forthcoming
book by Jiawei Han Jiawei Han and Micheline Kamber,” 2000.
[35] B. Sanjeewa and R. Kalupahana, “An investigation into automated processes for
generating focus maps,” no. April, 2015.
[36] J. Swierzowicz, “Analysis of Current Data Mining Standards,” Kaufmann Publishers, San
Francisco pp. 764–766, 2003
.
[37] A. Palmer, R. Jiménez, and E. Gervilla, “Data Mining : Machine Learning and Statistical
Techniques,” 2006.
[38] C. Priyadharsini, “An Improved Novel Index Measured Segmentation Based Imputation
Algorithm for Missing Data Imputation,” no. 6, pp. 283–286, 2017.
[39] A. A. Chaudhari and H. K. Khanuja, “Database transformation to build data-set for data
mining analysis - A review,” Proc. - 1st Int. Conf. Comput. Commun. Control Autom.
ICCUBEA 2015, no. July 2015, pp. 386–389, 2015.
[40] S. B. Jagtap, “Census Data Mining and Data Analysis using WEKA,” (ICETSTM – 2013)
Int. Conf. “Emerging Trends Sci. Technol. Manag. Singapore, pp. 35–40, 2013.
[41] Y. Q. Wei, R. H. Yang, and P. Y. Liu, “An improved apriori algorithm for association
rules of mining,” ITME2009 - Proc. 2009 IEEE Int. Symp. IT Med. Educ., vol. 3, no. 1,
pp. 942–946, 2009.
[42] A. Merceron and K. Yacef, “Revisiting interestingness of strong symmetric association
rules in educational data,” CEUR Workshop Proc., vol. 305, pp. 3–12, 2007.
[43] J. O. F. Computing, “Interestingness Measure for Mining Spatial Gene Expression Data
using Association,” Computing, vol. 2, no. 1, pp. 110–114, 2010.
[44] S. Kannan and R. Bhaskaran, “Association Rule Pruning based on Interestingness
Measures with Clustering,” J. Comput. Sci., vol. 6, no. 1, pp. 35–43, 2009.
[45] B. Vo and B. Le, “Interestingness measures for association rules: Combination between
lattice and hash tables,” Expert Syst. Appl., vol. 38, no. 9, pp. 11630–11640, 2011.
[46] K. Lai, “Support vs Confidence in Association Rule Algorithms,”Master’s thesis,
Department of Computer Science, University of India , pp. 1–14,2012.
[47] A. J. Knobbe, B. Marseille, O. Moerbeek, and D. M. G. van Der Wallen, “Results in data
GSJ: Volume 7, Issue 7, July 2019 ISSN 2320-9186
293
GSJ© 2019 www.globalscientificjournal.com

55
mining for adaptive system management,” Proc. Benelearn 1998, pp. 31–38, 1998.
[48] P. Tan and V. Kumar, “Interestingness measures for association patterns: a perspective,”
Proc. Work. Postprocessing Mach. Learn. Data Min., 2000.
[49] N. E., M. Mostafa, S. R., S. S., and V. Snasel, “A Novel Mapreduce Lift Association Rule
Mining Algorithm (Mrlar) for Big Data,” Int. J. Adv. Comput. Sci. Appl., vol. 7, no. 3, pp.
151–157, 2016.
[50] P. D. McNicholas, T. B. Murphy, and M. O’Regan, “Standardising the lift of an
association rule,” Comput. Stat. Data Anal., vol. 52, no. 10, pp. 4712–4721, 2008.
[51] M. Hahsler, B. Grün, and K. Hornik, “Introduction to arules – A computational
environment for mining association rules and frequent item sets,” J. Stat. Softw., vol. 14,
no. 15, pp. 1–25, 2005.
GSJ: Volume 7, Issue 7, July 2019 ISSN 2320-9186
294
GSJ© 2019 www.globalscientificjournal.com

56
ANNEXES
ANNEX I: Sample rules discovered using Minimum support: 0.1 (29221
instances) Minimum metric <confidence>: 0.9
Best rules found:
1. Damage type=non-chemical 31456 ==> Seed type=Non_Improved 30757 <conf:(0.98)> lift:(1.12)
lev:(0.08) [3236] conv:(5.62)
2. filed is irrigated=No If chemical fertilizer used=Not Stated 31351 ==>Extension=No 29725
<conf:(0.95)> lift:(1.07) lev:(0.05) [2029] conv:(2.25)
3. OWNTYPE=Private If chemical fertilizer used=NotStated 31378 ==>Extension=No 29679
<conf:(0.95)> lift:(1.07) lev:(0.05) [1959] conv:(2.15)
4. If chemical fertilizer used=NotStated 33750 ==>Extension=No 31878 <conf:(0.94)> lift:(1.07)
lev:(0.05) [2063] conv:(2.1)
5. filed is irrigated=No If chemical fertilizer used=NotStated 31351 ==> OWNTYPE=Private 29472
<conf:(0.94)> lift:(1.02) lev:(0.01) [493] conv:(1.26)
6. Extension=No filed is irrigated=No 31891 ==> OWNTYPE=Private 29966 <conf:(0.94)>
lift:(1.02) lev:(0.01) [488] conv:(1.25)
7. region=Oromia 32071 ==> filed is irrigated=No 30126 <conf:(0.94)> lift:(1.03) lev:(0.02) [862]
conv:(1.44)
8. OWNTYPE=Private If chemical fertilizer used=NotStated 31378 ==> filed is irrigated=No 29472
<conf:(0.94)> lift:(1.03) lev:(0.02) [841] conv:(1.44)
9. region=Oromia 32071 ==> OWNTYPE=Private 30090 <conf:(0.94)> lift:(1.02) lev:(0.01) [445]
conv:(1.22)
10. filed is irrigated=No 35550 ==> OWNTYPE=Private 33331 <conf:(0.94)> lift:(1.01) lev:(0.01)
[470] conv:(1.21)
11. OWNTYPE=Private Extension=No 31973 ==> filed is irrigated=No 29966 <conf:(0.94)>
lift:(1.03) lev:(0.02) [792] conv:(1.39)
12. Extension=No If chemical fertilizer used=NotStated 31878 ==> filed is irrigated=No 29725
<conf:(0.93)> lift:(1.02) lev:(0.02) [637] conv:(1.3)
13. Extension=No filed is irrigated=No 31891 ==> If chemical fertilizer used=NotStated 29725
<conf:(0.93)> lift:(1.08) lev:(0.05) [2099] conv:(1.97)
14. Extension=No If chemical fertilizer used=NotStated 31878 ==> OWNTYPE=Private 29679
<conf:(0.93)> lift:(1.01) lev:(0.01) [213] conv:(1.1)
15. If chemical fertilizer used=NotStated 33750 ==> OWNTYPE=Private 31378 <conf:(0.93)>
lift:(1.01) lev:(0) [181] conv:(1.08)
16. Extension=No 34418 ==> OWNTYPE=Private 31973 <conf:(0.93)> lift:(1.01) lev:(0) [159]
conv:(1.06)
17. If chemical fertilizer used=NotStated 33750 ==> filed is irrigated=No 31351 <conf:(0.93)>
lift:(1.02) lev:(0.01) [555] conv:(1.23)
GSJ: Volume 7, Issue 7, July 2019 ISSN 2320-9186
295
GSJ© 2019 www.globalscientificjournal.com

57
ANNEX II: Sample rules discovered using Minimum support: 0.15 (5844 in-
stances) Minimum metric <confidence>: 0.7 Best rules found:
1. region=Oromia head sex=Male crop type=Wheat filed is irrigated=No Damage crop=No If chemical
fertilizer used=NotStatedyield production per hectare=Bad 5898 ==> Seed type=Non_Improved
5844 <conf:(0.99)> lift:(1.13) lev:(0.02) [683] conv:(13.42)
2. region=Oromia head sex=Male crop type=Wheat Seed type=Non_Improved Damage crop=No If
chemical fertilizer used=NotStatedyeild production per hectar=Bad 6059 ==> filed is irrgat-
ed=No 5844 <conf:(0.96)> lift:(1.06) lev:(0.01) [315] conv:(2.46)
3. region=Oromia head sex=Male crop type=Wheat Damage crop=No If chemical fertilizer
used=NotStatedyeild production per hectare=Bad 6115 ==> filed is irrgated=No Seed
type=Non_Improved 5844 <conf:(0.96)> lift:(1.2) lev:(0.03) [980] conv:(4.6)
4. head sex=Male crop type=Maize Damage type=non-chemical If chemical fertilizer used=NotStated
6123 ==> region=Oromia 5844 <conf:(0.95)> lift:(1.16) lev:(0.02) [803] conv:(3.87)
5. head sex=Male crop type=Wheat filed is irrigated=No Seed type=Non_Improved Damage crop=No
If chemical fertilizer used=NotStatedyeild production per hectare=Bad 6445 ==> region=Oromia
5844 <conf:(0.91)> lift:(1.1) lev:(0.01) [538] conv:(1.89)
6. head sex=Male crop type=Wheat filed is irrigated=No Damage crop=No If chemical fertilizer
used=NotStatedyeild production per hectare=Bad 6509 ==> region=Oromia Seed
type=Non_Improved 5844 <conf:(0.9)> lift:(1.27) lev:(0.03) [1241] conv:(2.86)
7. region=Oromia head sex=Male crop type=Maize Damage type=non-chemical 6530 ==> If chemical
fertilizer used=NotStated 5844 <conf:(0.89)> lift:(1.03) lev:(0) [187] conv:(1.27)
8. region=Oromia head sex=Male crop type=Wheat filed is irrigated=No Seed type=Non_Improved
Damage crop=No yeild production per hectare=Bad 6609 ==> If chemical fertilizer
used=NotStated 5844 <conf:(0.88)> lift:(1.02) lev:(0) [118] conv:(1.15)
9. region=Oromia head sex=Male crop type=Wheat filed is irrigated=No Damage crop=No
yeildproduction per hectare=Bad 6673 ==> Seed type=Non_Improved If chemical fertilizer
used=NotStated 5844 <conf:(0.88)> lift:(1.15) lev:(0.02) [760] conv:(1.92)
10. region=Oromia crop type=Maize Damage type=non-chemical If chemical fertilizer used=NotStated
6753 ==> head sex=Male 5844 <conf:(0.87)> lift:(1) lev:(-0) [-10] conv:(0.99)
11. region=Oromia crop type=Wheat filed is irrigated=No Seed type=Non_Improved Damage crop=No
If chemical fertilizer used=NotStatedyeild production per hectare=Bad 6778 ==> head sex=Male
5844 <conf:(0.86)> lift:(0.99) lev:(-0) [-32] conv:(0.96)
12. head sex=Male crop type=Wheat Seed type=Non_Improved Damage crop=No If chemical fertilizer
used=NotStatedyield production per hectare=Bad 6809 ==> region=Oromia filed is irrgated=No
5844 <conf:(0.86)> lift:(1.11) lev:(0.01) [579] conv:(1.6)
13. region=Oromia crop type=Wheat filed is irrigated=No Damage crop=No If chemical fertilizer
used=NotStatedyield production per hectare=Bad 6875 ==> head sex=Male Seed
type=Non_Improved 5844 <conf:(0.85)> lift:(1.12) lev:(0.02) [612] conv:(1.59)
14. head sex=Male crop type=Wheat Damage crop=No If chemical fertilizer used=NotStatedyield
production per hectar=Bad 6887 ==> region=Oromia filed is irrigated=No Seed
type=Non_Improved 5844 <conf:(0.85)> lift:(1.28) lev:(0.03) [1283] conv:(2.23)
15. head sex=Male crop type=Maize Damage type=non-chemical 6909 ==> region=Oromia If chemical
fertilizer used=NotStated 5844 <conf:(0.85)> lift:(1.18) lev:(0.02) [905] conv:(1.85)
GSJ: Volume 7, Issue 7, July 2019 ISSN 2320-9186
296
GSJ© 2019 www.globalscientificjournal.com

58
16. region=Oromia head sex=Male crop type=Wheat Seed type=Non_Improved Damage crop=No
yield production per hectare=Bad 6930 ==> filed is irrigated=No If chemical fertilizer
used=NotStated 5844 <conf:(0.84)> lift:(1.05) lev:(0.01) [267] conv:(1.25)
17. region=Oromia head sex=Male crop type=Wheat Damage crop=No yeild production per hec-
tare=Bad 7000 ==> filed is irrigated=No Seed type=Non_Improved If chemical fertilizer
used=NotStated 5844 <conf:(0.83)> lift:(1.19) lev:(0.02) [925] conv:(1.8)
18. region=Oromia head sex=Male crop type=Wheat filed is irrigated=No Seed type=Non_Improved If
chemical fertilizer used=NotStatedyeild production per hectare=Bad 7012 ==> Damage crop=No
5844 <conf:(0.83)> lift:(1.27) lev:(0.03) [1224] conv:(2.05)
19. region=Oromia crop type=Wheat Seed type=Non_Improved Damage crop=No If chemical fertilizer
used=NotStatedyield production per hectare=Bad 7021 ==> head sex=Male filed is irrgated=No
5844 <conf:(0.83)> lift:(1.06) lev:(0.01) [314] conv:(1.27)
20. crop type=Maize Damage type=non-chemical If chemical fertilizer used=NotStated 7083 ==>
region=Oromia head sex=Male 5844 <conf:(0.83)> lift:(1.16) lev:(0.02) [810] conv:(1.65)
21. region=Oromia crop type=Wheat Damage crop=No If chemical fertilizer used=NotStatedyield
production per hectare=Bad 7121 ==> head sex=Male filed is irrgated=No Seed
type=Non_Improved 5844 <conf:(0.82)> lift:(1.19) lev:(0.02
) [940] conv:(1.73)
22. region=Oromia head sex=Male crop type=Wheat filed is irrgated=No If chemical fertilizer
used=NotStatedyield production per hectare=Bad 7158 ==> Seed type=Non_Improved Damage
crop=No 5844 <conf:(0.82)> lift:(1.27) lev:(0.03) [1237] conv:(1.94)
23. head sex=Male crop type=Wheat filed is irrigated=No Seed type=Non_Improved Damage crop=No
yield production per hectare=Bad 7261 ==> region=Oromia If chemical fertilizer
used=NotStated 5844 <conf:(0.8)> lift:(1.13) lev:(0.02) [654] conv:(1.46)
24. region=Oromia head sex=Male crop type=Wheat Seed type=Non_Improved If chemical fertilizer
used=NotStatedyield production per hectar=Bad 7305 ==> filed is irrigated=No Damage
crop=No 5844 <conf:(0.8)> lift:(1.34) lev:(0.04) [1473] conv:(2.01)
25. head sex=Male crop type=Wheat filed is irrigated=No Damage crop=No yield production per
hectare=Bad 7337 ==> region=Oromia Seed type=Non_Improved If chemical fertilizer
used=NotStated 5844 <conf:(0.8)> lift:(1.29) lev:(0.03) [1319] conv:(1.88)
26. region=Oromia head sex=Male crop type=Wheat If chemical fertilizer used=NotStatedyield
production per hectare=Bad 7460 ==> filed is irrigated=No Seed type=Non_Improved Damage
crop=No 5844 <conf:(0.78)> lift:(1.33) lev:(0.04) [1456] conv:(1.9)
27. crop type=Wheat filed is irrigated=No Seed type=Non_Improved Damage crop=No If chemical
fertilizer used=NotStatedyield production per hectare=Bad 7461 ==> region=Oromia head
sex=Male 5844 <conf:(0.78)> lift:(1.1) lev:(0.01) [542] conv:(1.33)
28. region=Oromia crop type=Maize Damage type=non-chemical 7510 ==> head sex=Male If chemical
fertilizer used=NotStated 5844 <conf:(0.78)> lift:(1.04) lev:(0.01) [223] conv:(1.13)
29. crop type=Wheat filed is irrigated=No Damage crop=No If chemical fertilizer used=NotStatedyeild
production per hectare=Bad 7569 ==> region=Oromia head sex=Male Seed type=Non_Improved
5844 <conf:(0.77)> lift:(1.26) lev:(0.03) [1210] conv:(1.7)
30. region=Oromia crop type=Wheat filed is irrigated=No Seed type=Non_Improved Damage crop=No
yeild production per hectare=Bad 7647 ==> head sex=Male If chemical fertilizer
used=NotStated 5844 <conf:(0.76)> lift:(1.02) lev:(0) [120] conv:(1.07)
31. region=Oromia crop type=Wheat filed is irrigated=No Damage crop=No yield production per
hectar=Bad 7758 ==> head sex=Male Seed type=Non_Improved If chemical fertilizer
GSJ: Volume 7, Issue 7, July 2019 ISSN 2320-9186
297
GSJ© 2019 www.globalscientificjournal.com

59
used=NotStated 5844 <conf:(0.75)> lift:(1.14) lev:(0.02) [717] conv:(1.37)
32. head sex=Male crop type=Wheat Seed type=Non_Improved Damage crop=No yield produc-
tion per hectare=Bad 7795 ==> region=Oromia filed is irrigated=No If chemical fertilizer
used=NotStated 5844 <conf:(0.75)> lift:(1.1) lev:(0.01) [548] conv:(1.28)
ANNEX III: Sample rules discovered using Minimum support: Minimum support:
0.25 (9740 instances) Minimum metric <confidence>: 0.25
Best rules found:
1. head sex=Male OWNTYPE=Private Extension=No Seed type=Non_Improved Damage crop=No
Fertilizer used=No 9740 ==> fertilizer type=Both 9740 <conf:(1)> lift:(1.78) lev:(0.11) [4252]
conv:(4252.89)
2. head sex=Male OWNTYPE=Private Extension=No Seed type=Non_Improved Damage crop=No
Fertilizer used=No 9740 ==> If chemical fertilizer used=NotStated 9740 <conf:(1)> lift:(1.15)
lev:(0.03) [1302] conv:(1302.72)
3. head sex=Male OWNTYPE=Private Extension=No Seed type=Non_Improved Damage crop=No
fertilizer type=Both If chemical fertilizer used=NotStated 9740 ==> Fertilizer used=No 9740
<conf:(1)> lift:(1.89) lev:(0.12) [4593] conv:(4593.88)
4. head sex=Male OWNTYPE=Private Extension=No Seed type=Non_Improved Damage crop=No
Fertilizer used=No If chemical fertilizer used=NotStated 9740 ==> fertilizer type=Both 9740
<conf:(1)> lift:(1.78) lev:(0.11) [4252] conv:(4252.89)
5. head sex=Male OWNTYPE=Private Extension=No Seed type=Non_Improved Damage crop=No
Fertilizer used=No fertilizer type=Both 9740 ==> If chemical fertilizer used=NotStated 9740
<conf:(1)> lift:(1.15) lev:(0.03) [1302] conv:(1302.72)
6. head sex=Male OWNTYPE=Private Extension=No Seed type=Non_Improved Damage crop=No
Fertilizer used=No 9740 ==> fertilizer type=Both If chemical fertilizer used=NotStated 9740
<conf:(1)> lift:(1.89) lev:(0.12) [4593] conv:(4593.63)
7. head sex=Male OWNTYPE=Private Extension=No Damage crop=No Fertilizer used=No 9822 ==>
Seed type=Non_Improved 9740 <conf:(0.99)> lift:(1.13) lev:(0.03) [1146] conv:(14.81)
8. head sex=Male OWNTYPE=Private Extension=No Damage crop=No Fertilizer used=No fertilizer
type=Both 9822 ==> Seed type=Non_Improved 9740 <conf:(0.99)> lift:(1.13) lev:(0.03)
[1146] conv:(14.81)
9. head sex=Male OWNTYPE=Private Extension=No Damage crop=No Fertilizer used=No 9822 ==>
Seed type=Non_Improved fertilizer type=Both 9740 <conf:(0.99)> lift:(1.95) lev:(0.12) [4738]
conv:(58.08)
10. head sex=Male OWNTYPE=Private Exstenstion=No Damage crop=No Fertilizer used=No If
chemical fertilizer used=NotStated9822 ==> Seed type=Non_Improved 9740 <conf:(0.99)>
GSJ: Volume 7, Issue 7, July 2019 ISSN 2320-9186
298
GSJ© 2019 www.globalscientificjournal.com

60
lift:(1.13) lev:(0.03) [1146] conv:(14.81)
11. head sex=Male OWNTYPE=Private Extension=No Damage crop=No Fertilizer used=No 9822
==>Seed type=Non_Improved If chemical fertilizer used=NotStated 9740 <conf:(0.99)>
lift:(1.3) lev:(0.06) [2257] conv:(28.19)
12. head sex=Male OWNTYPE=Private Extension=No Damage crop=No fertilizer type=Both If
chemical fertilizer used=NotStated 9822 ==> Seed type=Non_Improved 9740
<conf:(0.99)>lift:(1.13) lev:(0.03) [1146] conv:(14.81)
13. head sex=Male OWNTYPE=Private Extension=No Damage crop=No Fertilizer used=No fertilizer
type=Both If chemical fertilizer used=NotStated 9822 ==> Seed type=Non_Improved 9740
<conf:(0.99)> lift:(1.13) lev:(0.03) [1146] conv:(14.81)
14. head sex=Male OWNTYPE=Private Extension=No Damage crop=No fertilizer type=Both If
chemical fertilizer used=NotStated 9822 ==> Seed type=Non_Improved Fertilizer used=No
9740 <conf:(0.99)> lift:(2.06) lev:(0.13) [5019] conv:(61.46)
15. head sex=Male OWNTYPE=Private Extension=No Damage crop=No Fertilizer used=No If
chemical fertilizer used=NotStated 9822 ==> Seed type=Non_Improved fertilizer type=Both
9740 <conf:(0.99)> lift:(1.95) lev:(0.12) [4738] conv:(58.08)
16. head sex=Male OWNTYPE=Private Extension=No Damage crop=No Fertilizer used=No fertilizer
type=Both 9822 ==> Seed type=Non_Improved If chemical fertilizer used=NotStated 9740
<conf:(0.99)> lift:(1.3) lev:(0.06) [2257] conv:(28.19)
17. head sex=Male OWNTYPE=Private Extension=No Damage crop=No Fertilizer used=No 9822 ==>
Seed type=Non_Improved fertilizer type=Both If chemical fertilizer used=NotStated 9740
<conf:(0.99)> lift:(2.06) lev:(0.13) [5018] conv:(61.46)
18. region=Oromia head sex=Male Fild type=Pure filed is irrgated=No Damage type=non-chemical If
chemical fertilizer used=NotStated 9836 ==> Seed type=Non_Improved 9740 <conf:(0.99)>
lift:(1.13) lev:(0.03) [1134] conv:(12.69)
19. head sex=Male OWNTYPE=Private Extension=No Seed type=Non_Improved Damage crop=No
fertilizer type=Both 10065 ==> Fertilizer used=No 9740 <conf:(0.97)> lift:(1.83) lev:(0.11)
[4422] conv:(14.56)
20. head sex=Male OWNTYPE=Private Extension=No Seed type=Non_Improved Damage crop=No
fertilizer type=Both 10065 ==> If chemical fertilizer used=NotStated 9740 <conf:(0.97)>
lift:(1.12) lev:(0.03) [1021] conv:(4.13)
21. head sex=Male OWNTYPE=Private Extension=No Seed type=Non_Improved Damage crop=No
fertilizer type=Both 10065 ==> Fertilizer used=No If chemical fertilizer used=NotStated 9740
<conf:(0.97)> lift:(1.83) lev:(0.11) [4422] conv:(14.56)
22. head sex=Male OWNTYPE=Private Extension=No Damage crop=No fertilizer type=Both 10160
==> Seed type=Non_Improved Fertilizer used=No 9740 <conf:(0.96)> lift:(1.99) lev:(0.12)
[4856] conv:(12.53)
23. head sex=Male OWNTYPE=Private Extension=No Damage crop=No fertilizer type=Both 10160
==> Seed type=Non_Improved If chemical fertilizer used=NotStated 9740 <conf:(0.96)>
lift:(1.26) lev:(0.05) [2000] conv:(5.75)
GSJ: Volume 7, Issue 7, July 2019 ISSN 2320-9186
299
GSJ© 2019 www.globalscientificjournal.com

61
24. head sex=Male OWNTYPE=Private Extension=No Damage crop=No fertilizer type=Both 10160
==> Seed type=Non_Improved Fertilizer used=No If chemical fertilizer used=NotStated 9740
<conf:(0.96)> lift:(1.99) lev:(0.12) [4856] conv:(12.53)
25. head sex=Male OWNTYPE=Private Seed type=Non_Improved Damage crop=No Fertilizer
used=No 10201 ==>Exstenstion=No 9740 <conf:(0.95)> lift:(1.08) lev:(0.02) [728]
conv:(2.57)
26. head sex=Male OWNTYPE=Private Seed type=Non_Improvedd Damage crop=No Fertilizer
used=No fertilizer type=Both 10201 ==>Exstenstion=No 9740 <conf:(0.95)> lift:(1.08)
lev:(0.02) [728] conv:(2.57)
27. head sex=Male OWNTYPE=Private Seed type=Non_Improved Damage crop=No Fertilizer
used=No 10201 ==>Extension=No fertilizer type=Both 9740 <conf:(0.95)> lift:(1.83)
lev:(0.11) [4424] conv:(10.57)
28. head sex=Male OWNTYPE=Private Seed type=Non_Improved Damage crop=No Fertilizer
used=No If chemical fertilizer used=NotStated 10201 ==>Extension=No 9740 <conf:(0.95)>
lift:(1.08) lev:(0.02) [728] conv:(2.57)
29. head sex=Male OWNTYPE=Private Seed type=Non_Improved Damage crop=No Fertilizer
used=No 10201 ==>Extension=No If chemical fertilizer used=NotStated 9740 <conf:(0.95)>
lift:(1.17) lev:(0.04) [1393] conv:(4.01)
30. head sex=Male OWNTYPE=Private Seed type=Non_Improved Damage crop=No fertilizer
type=Both If chemical fertilizer used=NotStated 10201 ==>Extension=No 9740 <conf:(0.95)>
lift:(1.08) lev:(0.02) [728] conv:(2.57)
31. head sex=Male OWNTYPE=Private Seed type=Non_Improved Damage crop=No Fertilizer
used=No fertilizer type=Both If chemical fertilizer used=NotStated 10201 ==>Extension=No
9740 <conf:(0.95)> lift:(1.08) lev:(0.02) [728] conv:(2.57)
32. head sex=Male OWNTYPE=Private Seed type=Non_Improved Damage crop=No fertilizer
type=Both If chemical fertilizer used=NotStated 10201 ==>Extension=No Fertilizer used=No
9740 <conf:(0.95)> lift:(1.89) lev:(0.12) [4588] conv:(10.93)
GSJ: Volume 7, Issue 7, July 2019 ISSN 2320-9186
300
GSJ© 2019 www.globalscientificjournal.com
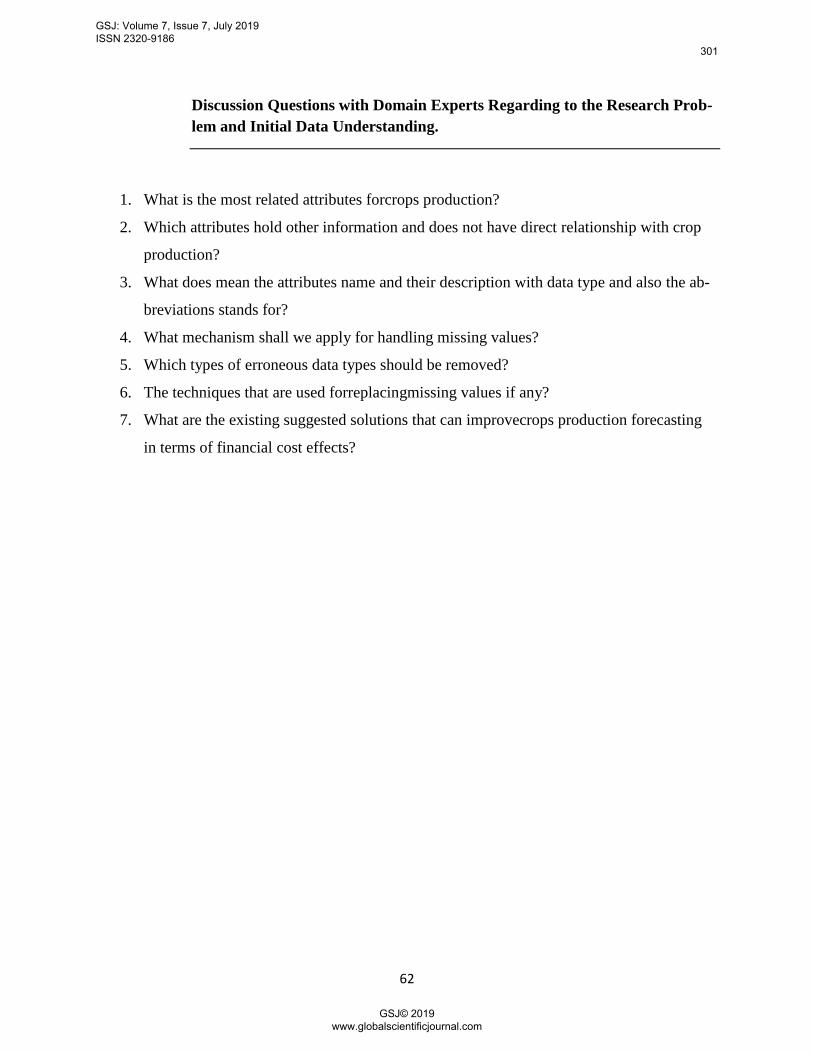
62
Discussion Questions with Domain Experts Regarding to the Research Prob-
lem and Initial Data Understanding.
1. What is the most related attributes forcrops production?
2. Which attributes hold other information and does not have direct relationship with crop
production?
3. What does mean the attributes name and their description with data type and also the ab-
breviations stands for?
4. What mechanism shall we apply for handling missing values?
5. Which types of erroneous data types should be removed?
6. The techniques that are used forreplacingmissing values if any?
7. What are the existing suggested solutions that can improvecrops production forecasting
in terms of financial cost effects?
GSJ: Volume 7, Issue 7, July 2019 ISSN 2320-9186
301
GSJ© 2019 www.globalscientificjournal.com