University of Alberta · 2.4.2 AISC Manual, ... Effective eccentricities of the tests used for AISC...
162
University of Alberta Design and Behaviour of Extended Shear Tabs under Combined Loads by Kristin Thomas A thesis submitted to the Faculty of Graduate Studies and Research in partial fulfillment of the requirements for the degree of Master of Science in Structural Engineering Department of Civil and Environmental Engineering ©Kristin Thomas Spring 2014 Edmonton, Alberta Permission is hereby granted to the University of Alberta Libraries to reproduce single copies of this thesis and to lend or sell such copies for private, scholarly or scientific research purposes only. Where the thesis is converted to, or otherwise made available in digital form, the University of Alberta will advise potential users of the thesis of these terms. The author reserves all other publication and other rights in association with the copyright in the thesis and, except as herein before provided, neither the thesis nor any substantial portion thereof may be printed or otherwise reproduced in any material form whatsoever without the author's prior written permission.
Transcript of University of Alberta · 2.4.2 AISC Manual, ... Effective eccentricities of the tests used for AISC...

University of Alberta
Design and Behaviour of Extended Shear Tabs under Combined Loads
by
Kristin Thomas
A thesis submitted to the Faculty of Graduate Studies and Research in partial fulfillment of the requirements for the degree of
Master of Science in
Structural Engineering
Department of Civil and Environmental Engineering
©Kristin Thomas Spring 2014
Edmonton, Alberta
Permission is hereby granted to the University of Alberta Libraries to reproduce single copies of this thesis and to lend or sell such copies for private, scholarly or scientific research purposes only. Where the thesis is
converted to, or otherwise made available in digital form, the University of Alberta will advise potential users of the thesis of these terms.
The author reserves all other publication and other rights in association with the copyright in the thesis and,
except as herein before provided, neither the thesis nor any substantial portion thereof may be printed or otherwise reproduced in any material form whatsoever without the author's prior written permission.

To Britney, for making it through 2007

ABSTRACT
Current design procedures for extended shear tab connections tend to be
conservative and often do not include considerations for axial load. To address
these problems, an investigation into the behaviour of extended shear tabs was
completed by testing 23 full-scale specimens. Both unstiffened and stiffened
extended shear tab specimens were tested that varied in plate thickness, plate
depth, and the number of horizontal bolt lines. The specimens were tested by
rotating the beam to 0.03 radians, applying a horizontal load, and then applying
vertical load until failure. The horizontal loads varied from 500 kN in
compression to 200 kN in tension. Based on the test results, design
recommendations were made for both unstiffened and stiffened extended shear
tabs. The recommendations include strength equations for bolt group design and
plate design, while connection ductility is addressed by ensuring the plate will fail
prior to bolt or weld rupture.

ACKNOWLEDGMENTS
The author would like to thank Waiward Steel Fabricators Ltd. for donating the
test specimens for this project. On an individual level, thank you Logan Callele
for proposing this project and for offering advice throughout.
A number of other individuals need to be thanked for the overall success of this
project. First, the author wishes to thank Dr. Robert Driver, her supervisor, for his
technical guidance and for his dedication to the project. A special thank you must
also be given to Dr. Steven Oosterhof who was instrumental prior to, during, and
after testing and who was a co-supervisor in spirit, if not in name. Discussions
with, encouragement from, and advice given by Nolan Rettie and Graeme
Johnston are also sincerely appreciated.
The author appreciates the patience of Cameron West and Greg Miller and thanks
them for their instruction on the use of screwdrivers, grinders, drills, clamps, etc.
For volunteering their time and donating their muscle when required in the lab,
thank you Sydney Van Der Voort, Pouya Salem, Michael Ross, Alex Melnik, and
Shane DeLory. Finally, the author thanks her family, Sherri, Stewart, Stacey, and
Kait, for their constant support.
Financial support for the research was provided by the Natural Sciences and
Engineering Research Council, the University of Alberta, the Steel Structures
Education Foundation, and the Government of Alberta.

TABLE OF CONTENTS
Chapter 1: Introduction ....................................................................................... 11.1 Statement of the Problem .......................................................................... 1
1.2 Objectives and Scope ................................................................................ 4
1.3 Organization of Thesis .............................................................................. 5
Chapter 2: Background and Literature Review ................................................ 62.1 Introduction ............................................................................................... 6
2.2 Previous Research ..................................................................................... 6
2.2.1 Shear connections .............................................................................. 6
2.2.2 Shear Tabs .......................................................................................... 9
2.2.3 Extended Shear Tabs ........................................................................ 11
2.2.4 Combined Loading ........................................................................... 14
2.3 Capacity Equations ................................................................................. 16
2.3.1 Gross Section Yielding .................................................................... 16
2.3.2 Net Section Fracture ........................................................................ 17
2.3.3 Column Web Yielding ..................................................................... 17
2.3.4 Out-of-plane Deformation................................................................ 19
2.3.5 Weld Rupture ................................................................................... 21
2.3.6 Bolt Group Capacity ........................................................................ 21
2.3.7 Bolt Bearing ..................................................................................... 24
2.3.8 Block Shear ...................................................................................... 25
2.4 Design Standards and Industry Handbooks ............................................ 25
2.4.1 CISC Handbook ............................................................................... 25
2.4.2 AISC Manual, 13th Edition ............................................................. 26
2.4.3 AISC Manual, 14th Edition .............................................................. 29
2.4.4 Eurocode .......................................................................................... 32
2.5 Summary ................................................................................................. 34
Chapter 3: Experimental Program ................................................................... 353.1 Introduction ............................................................................................. 35
3.2 Test Specimens ....................................................................................... 35
3.3 Material Properties .................................................................................. 40

3.3.1 Plate Coupon Tests .......................................................................... 40
3.3.2 Bolt Shear Tests ............................................................................... 42
3.4 Test Set-up .............................................................................................. 43
3.5 Instrumentation ....................................................................................... 45
3.6 Test Procedure ........................................................................................ 47
3.7 Safety ...................................................................................................... 47
3.8 Test Results ............................................................................................. 48
3.9 Summary ................................................................................................. 51
Chapter 4: Unstiffened Extended Shear Tabs .................................................. 534.1 Introduction ............................................................................................. 53
4.2 Observed Behaviour ................................................................................ 53
4.2.1 Failure Modes .................................................................................. 53
4.2.1.1 Weld Rupture ............................................................................ 54
4.2.1.2 Bolt Fracture ............................................................................. 55
4.2.1.3 Column Web Yielding .............................................................. 55
4.2.1.4 Gross Section Yielding/Net Section Fracture of Plate .............. 57
4.2.1.5 Bolt Bearing .............................................................................. 58
4.2.1.6 Out-of-Plane Deformation ........................................................ 59
4.2.2 Vertical Load�–Deformation Curves ................................................. 59
4.2.3 Effects of Key Variables .................................................................. 60
4.2.3.1 Number of horizontal bolt lines ................................................ 61
4.2.3.2 Plate Thickness ......................................................................... 61
4.2.3.3 Horizontal Load ........................................................................ 62
4.3 Current Design Procedures ..................................................................... 63
4.4 Design Recommendations ...................................................................... 67
4.4.1 Bolt Group Capacity ........................................................................ 68
4.4.1.1 Instantaneous Centre of Rotation Method ................................ 68
4.4.1.2 Effective Eccentricity ................................................................ 68
4.4.2 Plate Thickness ................................................................................ 69
4.4.2.1 Maximum Plate Thickness ........................................................ 70
4.4.2.2 Minimum Plate Thickness ........................................................ 72

4.4.3 Column Web Capacity ..................................................................... 75
4.4.4 Weld Design ..................................................................................... 78
4.4.5 Plate Design ..................................................................................... 80
4.4.6 Comparison of Test Results to Design Recommendations .............. 81
4.5 Summary ................................................................................................. 87
Chapter 5: Stiffened Extended Shear Tabs ...................................................... 88
5.1 Introduction ............................................................................................. 88
5.2 Observed Behaviour ................................................................................ 88
5.2.1 Failure Modes .................................................................................. 88
5.2.1.1 Weld Rupture ............................................................................ 89
5.2.1.2 Bolt Fracture ............................................................................. 90
5.2.1.3 Column Web Yielding .............................................................. 90
5.2.1.4 Gross Section Yielding ............................................................. 90
5.2.1.5 Out-of-plane Deformation ........................................................ 91
5.2.1.6 Plate Rupture ............................................................................. 91
5.2.1.7 Bolt Bearing .............................................................................. 92
5.2.2 Vertical Load–Deformation Curves ................................................. 92
5.2.3 Effect of Key Variables.................................................................... 94
5.2.3.1 Presence of Stiffeners................................................................ 94
5.2.3.2 Number of horizontal bolt lines ................................................ 95
5.2.3.3 Plate Thickness ......................................................................... 96
5.2.3.4 Horizontal Load ........................................................................ 97
5.3 Current Design Procedures ..................................................................... 97
5.4 Design Recommendations ...................................................................... 98
5.4.1 Bolt Group Capacity ........................................................................ 98
5.4.2 Plate Thickness ................................................................................ 99
5.4.3 Weld Design ................................................................................... 100
5.4.4 Plate Design ................................................................................... 101
5.4.5 Comparison of Test Results to Design Recommendations ............ 101
5.5 Summary ............................................................................................... 106
Chapter 6: Conclusions and Recommendations ............................................ 107

6.1 Summary ............................................................................................... 107
6.2 Conclusions and Design Recommendations ......................................... 108
6.3 Recommendations for Further Research ............................................... 110
References ....................................................................................................... 115
Appendix A ..................................................................................................... 115
Appendix B ..................................................................................................... 115
Appendix C ..................................................................................................... 115

LIST OF TABLES
Table 2-1: AISC 14th edition conventional configuration guidelines ................... 29
Table 3-1: Unfactored capacities (kN) using Fabricator’s design procedure ....... 38
Table 3-2: Material properties............................................................................... 42
Table 3-3: Bolt shear strength ............................................................................... 43
Table 3-4: Test results ........................................................................................... 50
Table 4-1: Critical and other observed failure modes ........................................... 54
Table 4-2: Vertical load causing yielding through the plate depth (kN) .............. 58
Table 4-3: Comparison of design procedures and experimental capacities .......... 64
Table 4-4: Test-to-predicted strength ratios .......................................................... 65
Table 4-5: Comparison of observed and predicted critical failure modes ............ 66
Table 4-6: Effective eccentricities of test specimens failing in bolt fracture ........ 69
Table 4-7: Comparison of proposed ductility requirements with test specimens . 84
Table 4-8: Comparison of proposed shear capacity equations with test specimen
capacities ..................................................................................................... 86
Table 5-1: Critical and other observed failure modes ........................................... 89
Table 5-2: Effect of stiffeners on connection capacity ......................................... 95
Table 5-3: Comparison of proposed plate thickness requirements with specimens
................................................................................................................... 104
Table 5-4: Comparison of proposed shear capacity equations with test specimen
capacities ................................................................................................... 105

LIST OF FIGURES
Figure 1-1: (a) conventional shear tab and (b) extended shear tab geometry ......... 1
Figure 1-2: Combined loading on (a) unstiffened and (b) stiffened extended shear
tabs .......................................................................................................................... 2
Figure 1-3: (a) extended shear tab connection to girder (elevation); (b) extended
shear tab connection to column (plan); (c) double-coped beam and end plate
connection to girder (elevation); (d) double-coped beam and single angle
connection to column (plan) ................................................................................... 3
Figure 2-1: Classification of connections based on beam line theory .................... 7
Figure 2-2: Typical shear–rotation behaviour of simple connections ..................... 8
Figure 2-3: Assumed yield pattern in column web subjected to transverse tension
or compression from shear tab plate ..................................................................... 18
Figure 2-4: Assumed yield pattern in column web subjected to moment from
shear tab plate ....................................................................................................... 19
Figure 2-5: Instantaneous centre of rotation variables .......................................... 22
Figure 2-6: Effective eccentricities of the tests used for AISC Table 10-9 .......... 30
Figure 3-1: Specimen geometries ......................................................................... 36
Figure 3-2: Shear tab tension coupons cut from 500 mm 500 mm plate ........... 41
Figure 3-3: Test set-up .......................................................................................... 43
Figure 3-4: Actuator 3 lateral bracing system ....................................................... 44
Figure 3-5: Instrumentation plan .......................................................................... 45
Figure 3-6: Bolt numbering system ...................................................................... 51
Figure 3-7: Weld fracture (a) tip fracture, (b) and (c) rupture .............................. 51
Figure 4-1: Bolt fracture of Specimen 3B-10-U-0 ................................................ 55
Figure 4-2: Column web tearing in specimen 5B-10-U-0 .................................... 56
Figure 4-3: Lüders’ lines at the compression edge of plate .................................. 56
Figure 4-4: Plate deformation in specimen 2B-10-U-0 ........................................ 57
Figure 4-5: Load–deformation behaviour of specimen 3B-10-U-0 ...................... 59
Figure 4-6: Effect of number of horizontal bolt lines on connection behaviour ... 61
Figure 4-7: Effect of horizontal load on connection capacity ............................... 62

Figure 4-8: Column web yield line geometry under axial load ............................ 75
Figure 4-9: Column web yield line geometry under eccentric shear .................... 76
Figure 4-10: Effect of column web thickness on flexural yield mechanism
capacity ................................................................................................................. 77
Figure 4-4-11: Test-to-predicted ratios for unstiffened connections .................... 84
Figure 5-1: Lüders’ lines on the column web opposite stiffened specimens ........ 90
Figure 5-2: Out-of-plane deformation of specimen 3B-10-S-200C ...................... 91
Figure 5-3: Tear in the radius of specimen 3B-10-S-0 ......................................... 92
Figure 5-4: Load-Deformation behaviour of specimen 2B-10-S-0 ...................... 93
Figure 5-5: Effect of number of horizontal bolt lines on connection ductility ..... 96
Figure 5-6: Effect of plate thickness on connection behaviour ............................ 96
Figure 5-7: Effect of horizontal compression on connection capacity ................. 97
Figure 5-8: Test-to-predicted ratios for stiffened connections ............................ 103
Figure B-1: Specimen 2B-10-U-0 ....................................................................... 134
Figure B-2: Specimen 2B-10-U-00 ..................................................................... 134
Figure B-3: Specimen 2B-10-U-200C ................................................................ 135
Figure B-4: Specimen 2B-13-U-200C ................................................................ 135
Figure B-5: Specimen 3B-10-U-0 ....................................................................... 136
Figure B-6: Specimen 3B-10-U-200C ................................................................ 136
Figure B-7: Specimen 3B-10-U-300C ................................................................ 137
Figure B-8: Specimen 3B-10-U-200T ................................................................ 137
Figure B-9: Specimen 3B-13-U-200C ................................................................ 138
Figure B-10: 5B-10-U-0 ..................................................................................... 138
Figure B-11: 5B-10-U-300C ............................................................................... 139
Figure B-12: 5B-10-U-200T ............................................................................... 139
Figure B-13:Specimen 5B-13-U-300C ............................................................... 140
Figure C-1: Specimen 2B-10-S-0 ....................................................................... 142
Figure C-2: Specimen 2B-10-S-200C ................................................................. 142
Figure C-3: Specimen 2B-13-S-200C ................................................................. 143
Figure C-4: Specimen 3B-10-S-0 ....................................................................... 143

Figure C-5: Specimen 3B-10-S-200C ................................................................. 144
Figure C-6: Specimen 3B-10-S-300C ................................................................. 144
Figure C-7: Specimen 3B-13-S-200C ................................................................. 145
Figure C-8: Specimen 5B-10-S-300C ................................................................. 145
Figure C-9: Specimen 5B-10-S-400C ................................................................. 146
Figure C-10: Specimen 5B-13-S-500C ............................................................... 146

LIST OF SYMBOLS
Ab = bolt cross-sectional area
Ag = gross area
Agv = gross area in shear
An = net area
Ant = net area in tension
Aw = weld throat area
BBB = bolt bearing capacity
C = tabulated coefficient for calculating eccentrically loaded bolt group capacity
C�’ = tabulated coefficient for calculating the moment only bolt group capacity
D = filler weld leg size
d = bolt diameter
db = beam depth
dbh = bolt hole diameter
dc = depth of the plate in compression
dp = plate depth
di = distance from bolt i to the instantaneous centre of rotation
dmax = maximum di
E = modulus of elasticity
eBG = eccentricity of P
eg = geometric eccentricity
en = end distance
eeff = effective eccentricity
eeff-cs = clear span effective eccentricity
Fcr = critical design buckling stress
Fe = Euler�’s buckling stress; elastic buckling stress
Fu = ultimate strength of the plate
Fub = ultimate strength of a bolt
Fy = yield strength of the plate

Fyc = yield strength of the column
G = shear modulus
IBG = bolt group moment of inertia
Iy = weak-axis moment of inertia
J = St. Venant torsional constant
K = modification factor for critical lateral torsional buckling capacity (Salvadori 1955)
k = plate buckling coefficient, effective length factor
L = unbraced length/clear span
Lo = location of instantaneous centre of rotation perpendicular to P
Lw = weld length
M = moment
MBG = moment about the centroid of the bolt group
MCW = moment capacity of column web
Mcr = elastic lateral torsional buckling moment capacity
MF = factored applied moment
MOBG = Moment-only bolt group capacity
Mp = plastic moment
Mr = factored moment resistance
Mta = Applied nominal torsional moment
Mtn = nominal torsional moment resistance
My = yield moment
m = number of shear planes
mo = location of instantaneous centre of rotation parallel to P
mw = moment capacity of the column web per unit length
N = nominal applied axial load
NCW = axial column web capacity
NGS = axial gross section yielding capacity
NF = factored applied axial load
NNS = axial net section fracture capacity
n = number of bolts

nh = number of horizontal bolt lines
P = resultant force on a eccentrically loaded bolt group
Q = non-dimensional yield stress reduction factor for plate buckling
Ri = force on bolt i
Rn = shear capacity of an individual bolt
Ry = factor to approximate probable yield stress
r = radius of gyration
s = bolt spacing
T = clear distance between column web-to-flange fillets for W-shapes
TBS = block shear capacity
tb = beam web thickness
tmax = maximum plate thickness
tmin = minimum plate thickness
tp = plate thickness
Ut = efficiency factor for block shear
V = shear
VCW = shear column web yielding capacity
VBG = shear capacity of a bolt group
VF = factored applied shear force
VGS = shear gross section yielding capacity
VLTB = nominal shear force that can be applied without stiffeners
VNS = shear net section yielding capacity
VMN = flexural shear capacity of the plate
VPB = shear causing plate buckling
Vr = Factored shear resistance
VW = fillet weld capacity
Vy = shear causing flexural yielding
v = Poisson�’s ratio
w = column web thickness
XIC = x-coordinate of the instantaneous centre of rotation

Xi = x-coordinate of bolt i
Xu = ultimate tensile strength of weld filler metal
YIC = y-coordinate of the instantaneous centre of rotation
Yi = y-coordinate of bolt i
= angle of resultant load
i = deformation of bolt i
max = theoretical maximum bolt deformation
= End Rotation
i = angle of force for bolt i
w = orientation of applied force with respect to the weld axis
= ratio of smaller end moment to larger, positive for double curvature
= non-dimensional slenderness parameter for plate buckling
n = normal stress
= shear stress
= plate resistance factor
b = bolt resistance factor
w = weld resistance factor
2 = coefficient to account for moment gradient in lateral-torsional buckling capacity

1
CHAPTER 1: INTRODUCTION
1.1 Statement of the Problem
A shear tab is a type of shear connection commonly used in steel building
construction, wherein a plate is welded in the vertical orientation to a column or
girder, and bolted to the supported beam. As demonstrated in Figure 1-1,
�“extended�” shear tabs have the same configuration as conventional shear tabs, but
normally frame into the supporting member�’s web and extend beyond its flanges.
This creates a larger geometric eccentricity, the distance between the bolt group
centroid and weld (denoted as �“a�” in Figure 1-1), that must be accounted for
explicitly in design. The recommended limit on eccentricity for conventional
shear tabs is typically between 75 mm (3 in), according to the Canadian Institute
of Steel Construction�’s Handbook of Steel Construction (CISC 2010), and 89 mm
(3.5 in), according to the American Institute of Steel Construction�’s Steel
Construction Manual (AISC 2011). The extended configuration is also known as
an extended single plate connection or a long fin plate.
Figure 1-1: (a) conventional shear tab and (b) extended shear tab geometry
a
Plate
Welded to Column Flange
Bolts
a
Welded to Column Web
Plate
Bolts

2
Extended shear tabs are either unstiffened, like conventional shear tabs, or
stiffened by welding the plate either directly to the flanges of a girder or to
perpendicular stiffeners, or stabilizer plates, located between the flanges of a
column. The stiffener plates may be required for the extended shear tab only or
also as part of the connection to the column strong axis and can be located directly
above and below the plate or offset from the plate. Examples of unstiffened and
stiffened extended shear tabs framing into a column are shown schematically in
Figure 1-2. The stiffeners in this figure are offset from the top and bottom of the
by increasing the plate depth near the column web.
Figure 1-2: Combined loading on (a) unstiffened and (b) stiffened extended shear
tabs
Extended shear tabs are advantageous when framing a beam into the web of either
a column or girder as they eliminate the need for coping the beam, normally
making for a more economical connection. Typical coped beams, connected to the
support using an end-plate or angle (a conventional shear tab could also be used),
are compared to an equivalent unstiffened extended shear tab connection in Figure
1-3. By using the extended shear tab, the beam can more easily be positioned
during construction, improving both speed and safety during assembly of the
structural components. Despite their relatively common use, extended shear tab
behaviour is not well understood. As such, conservative procedures and
assumptions are commonly adopted for expediency, leading to excessively
conservative connection designs.
VF
NFNR
MR
VR
VF
NFNR
MR
VR
(a) (b)

3
Figure 1-3: (a) extended shear tab connection to girder (elevation); (b) extended
shear tab connection to column (plan); (c) double-coped beam and end plate
connection to girder (elevation); (d) double-coped beam and single angle
connection to column (plan)
Because the extended shear tab plates are slender, one main consideration for
design is the stability of the connection. Plate buckling becomes an even larger
concern when the connection is loaded under both shear and compression.
However, the manner in which shear, axial load, and moment interact on the plate
is complex, particularly after significant inelastic action has taken place.
The requirement for connections to transfer axial load, either compressive or
tensile, in addition to shear is becoming more common. These loads may originate
from the building shape, as is the case for gable-framed buildings, from industrial
equipment supported by the structure, or as part of the lateral load resisting
system for wind or earthquake loading. Connections may also be required to have
a certain degree of axial load capacity to ensure robustness of the structure or, in
other words, to prevent collapse due to abnormal loading such as blast or impact.
(a) (b)
(c) (d)

4
1.2 Objectives and Scope
The objective of this work is to examine the behaviour of extended shear tab
connections, both with and without the presence of axial load. By varying a
number of geometric parameters, as well as the magnitude and direction of the
horizontal load, current design procedures were evaluated to determine their
validity. This was completed by conducting full-scale laboratory tests and
comparing the measured capacities with those predicted by the design procedures.
Ultimately, a recommendation of an appropriate design model was made for the
failure modes observed in the laboratory.
A limited number of research programs have studied the behaviour of extended
shear tabs, especially those connected to a flexible support such as a column or
girder web. A total of 23 full-scale unstiffened extended shear tab tests were
found in literature, with 17 framing into the weak axis of a column. Results of 29
stiffened extended shear tabs were found, including 20 framing into the column
web. None of these tests examined the effect of horizontal loading, nor have any
of the tested connections had more than one vertical bolt line.
To expand the available test results, this research program includes 23 specimens,
13 without stiffeners and 10 stiffened configurations. All had two vertical lines of
bolts and the beam was braced laterally to isolate the local connection behaviour.
The specimens differed in four geometric characteristics in addition to varying the
magnitude and direction of the applied horizontal load: the number of horizontal
bolt lines, plate depth, plate thickness, and use of stiffeners. The effect of beam
end rotation was also examined to determine the sensitivity of the connection
behaviour to a moderate beam rotation. In addition to determining the capacity of
each connection, its behaviour was also characterised in terms of the sequence of
development of the various limit states. The test specimen capacities and critical
failure modes were compared to those predicted by current design procedures.
Due to the difference in behaviour, the unstiffened and stiffened configurations

5
were analyzed separately and design recommendations were developed for both
configurations.
1.3 Organization of Thesis
This thesis consists of six chapters. Chapter 2 contains a literature review of areas
pertaining to this research including shear connections, shear tabs, extended shear
tabs, and axially loaded shear connections. Capacity equations related to extended
shear tab design, as well as an overview of design standards from North America
and Europe, are also presented in the second chapter. The experimental program
is discussed in Chapter 3. Details of the specimen geometry and design are given,
followed by an overview of the material properties, test set-up, instrumentation,
and test procedures. Following the experimental design, a summary of the test
results is presented by giving the maximum recorded vertical load and observed
failure modes for each specimen. Chapters 4 and 5 discuss the behaviour and
design of unstiffened and stiffened extended shear tabs, respectively. Each
proposes design recommendations based on observations made from the results of
the testing program. Finally, a summary of the research is presented in Chapter 6
and conclusions about the behaviour and design of extended shear tabs are made,
as well as recommendations for future work. Appendix A includes sample
calculations. Appendix B contains shear-deformation graphs for the unstiffened
specimens, while those for the stiffened test specimens are given in Appendix C.

6
CHAPTER 2: BACKGROUND AND LITERATURE REVIEW
2.1 Introduction
Extensive research on the behaviour of shear connections has been conducted in
North America and Europe over the past fifty years. Much of this research
concentrated on the behaviour and design of shear tabs due to their economy in
terms of fabrication. However, despite their relatively common use, a limited
number of research programs have investigated the behaviour of extended shear
tabs and, therefore, no comprehensive limit states design procedure has been
widely accepted. As such, elastic procedures are commonly adopted for
expediency, leading to excessively conservative connections.
In the following sections, an overview of existing knowledge related to the
behaviour and design of extended shear tabs is given. First, a review of significant
general research on shear connections and research specific to conventional and
extended shear tabs is presented. Next, capacity equations for the limit states
identified during the experimental program that forms part of this research project
are explained. Finally, current design guidelines in Canada, the United States, and
Europe, are discussed.
2.2 Previous Research
2.2.1 Shear connections
Steel framing connections can be broken into three categories depending on their
stiffness and bending moment capacity: moment, shear, and semi-rigid. A
connection is typically classified into one of these groups using beam line theory.
The beam line is drawn on a graph of moment versus rotation as a straight line
connecting the beam�’s fixed end moment on the vertical axis and its simple span
end rotation on the horizontal axis. The moment�–rotation curve of a given
connection can then be plotted on the same graph. The intersection point of the
beam line and moment�–rotation curve gives the demand on the connection for a
beam under conventional gravity loading (Richard et al. 1980).

7
Astaneh (1989) proposed that moment connections be classified as those that
develop at least 90% of the fixed end moment, while not rotating by more than
10% of the simple span end rotation. The proposed limit for shear connections
was given as a moment less than or equal to 20% of that for a fixed end and a
rotation greater than or equal to 80% of that for a simple span. Connections that
are subjected to a combination of moment and rotation that falls between these
moment and shear limits were defined as semi-rigid. This theory can be used in
conjunction with beam line theory, as shown in Figure 2-1. Depending on the
zone in which the moment�–rotation curve and beam line intersect, the connection
can be placed into the appropriate category. In the figure, two moment�–rotation
curves are given: curve �“a�” and �“b�”. Curve �“a�” intersects the beam line in the
moment zone and is therefore a moment connection. The moment�–rotation curve
�“b�” represents a simple connection. However, because elastic beam lines are
non-conservative when the beam behaves inelastically, Astaneh (1989) expanded
the theory to include inelastic behaviour.
Figure 2-1: Classification of connections based on beam line theory
Using inelastic beam line theory, Astaneh (1989) completed a numerical study to
determine the rotational demand on connections at critical loads, such as when the
00
End
Mom
ent (
M)
End Rotation ( )
Mfix
ed-e
nd
simple
a
b
Semi-Rigid Zone
MomentZone
Shear Zone

8
beam begins to yield in flexure or when its plastic moment is reached. Hundreds
of beams were analyzed, varying in section geometry and span length. A �“typical�”
shear�–rotation relationship for simple beams, shown in Figure 2-2, resulted from
the study. In this figure, the end shear, V, is normalized based on the shear that
causes flexural yielding, denoted as Vy. This relationship has been widely
accepted and is commonly used to study shear connection behaviour.
Figure 2-2: Typical shear�–rotation behaviour of simple connections
As indicated in Figure 2-2, the rotational demand on a shear connection when the
plastic moment is reached in a beam is typically approximately 0.03 radians.
Because beams are not designed to resist a load that will cause its plastic moment
to be exceeded, this rotation can be considered a reasonable upper limit for shear
connections. Among others, Creech (2005), Metzger (2006), and Guravich and
Dawe (2006) targeted this value as the maximum rotation during their test
programs. To allow any combination of moment, rotation and shear to be applied
to the connection, Astaneh (1989) proposed a test set-up consisting of two vertical
actuators connected to a beam that is cantilevered from the connection. One force-
controlled actuator is positioned next to the connection to apply primarily shear
and another is placed near the end of the beam to maintain a specified rotation.
Although the theory and testing procedures that have been developed for shear
connections ignore the influence of axial load, Astaneh et al. (1989) recognized
00.20.40.60.8
11.21.41.6
0 0.02 0.04 0.06 0.08 0.1
End
Shea
r (V
/Vy)
End Rotation (rad)

9
that “major forces present in a simple connection can be shear force, bending
moment, and axial load”. However, until recently, most research concentrated on
the moment–rotation behaviour as well as shear capacity of connections. After the
collapse of the World Trade Center in 2001, research into progressive collapse
prevention has increased the number of tests done on connections subjected to
axial tension, although axial connection forces are also commonplace under
normal service conditions, particularly in industrial structures. On the other hand,
demands on connections in a progressive collapse scenario involve rotations far
greater than those discussed above for conventional loading.
2.2.2 Shear Tabs
Research into the behaviour of shear tab connections has a long history, and
design procedures began to be developed in the mid-1900s. Although a previous
design procedure had been proposed by Lipson (1968) and another by Richard et
al. (1980; 1982) that were verified and refined by other researchers, the
experimental program and design procedure proposed by Astaneh et al. (1993)
laid the foundation for the design methods used today.
Astaneh et al. (1989) began an extensive research program into the behaviour of
shear tabs that was continued by Porter and Astaneh (1990) and Shaw and
Astaneh (1992). The first phase of the research included six tests and resulted in a
design procedure that focused on six limit states: shear yielding of the gross area,
fracture of the net section, fracture of the end distance of the plate, bolt bearing,
bolt fracture, and weld fracture. Shear tabs with three, five, seven, and nine bolts
were tested. The rotational stiffness of the connections was reduced as shear
yielding began, releasing moment to the centre of the beam and allowing the shear
tabs to be sufficiently ductile to accommodate end rotation. The ductility
increased with the depth of the connection. Porter and Astaneh (1990) also tested
shear tabs with short slotted holes and found that the limit states were unaffected.
Beam-to-girder connection tests were completed by Shaw and Astaneh (1992),
who observed that shear tab behaviour was most sensitive to the number of bolts

10
and the support condition, either rigid or flexible. The flexible support allowed
larger rotations to occur due to deformation of the girder web. A change in failure
mode was also evident when results from tests with rigid and flexible support
conditions were compared. Bolt fracture was more common for rigidly supported
shear tabs, whereas weld fracture was often observed when the plate was
connected to a girder web. In one case, the failure mode was girder web yielding,
which was not included as a limit state in the design procedure
(Astaneh et al. 2002).
Additional shear tab research was completed by Creech (2005). A total of ten full-
scale specimens were tested. The specimens varied in a number of parameters,
including support type and number of bolts. Creech found that consideration of
the eccentricity of the shear force was only required when calculating the bolt
group capacity for two or three bolt connections and, therefore, connections with
more than three bolts could be designed by calculating the direct shear capacity of
the bolt group. However, the support type was found to reduce the bolt group
capacity due to the additional rotation from the girder web.
Metzger (2006) conducted four additional shear tab tests. However, only two were
loaded to failure. Through these tests, Metzger studied the effective eccentricity
acting on the bolt groups and found that using nominal bolt strengths, without the
bolt group action factor, and the distance from the weld to the vertical bolt line
gave the best approximation. The bolt group action factor is used to account for
non-uniform load distributions in a connection by reducing the bolt strength by
20%.
A series of eight specimens with more than one vertical bolt line was tested by
Marosi et al. (2011a). Although a larger number of bolts was used, the
connections were able to reach rotations comparable with those of single-line
connections. The connection strength was conservatively predicted by a design
procedure proposed by Marosi et al. (2011b), which was a modified version of the
American Institute of Steel Construction (AISC) procedure for extended single

11
plate connections (AISC 2005), in which the bolt shear capacity was calculated
using 0.62 of the ultimate tensile stress rather than 0.5.
2.2.3 Extended Shear Tabs
The critical limit states for extended shear tabs are similar to those observed for
conventional shear tabs. However, due to the complex behaviour introduced by
the increased load eccentricity and extended plate, research programs to determine
additional design parameters have been completed. These include investigations
of both stiffened and unstiffened geometries, as well as physical and numerical
testing.
Moore and Owens (1992) conducted a series of tests that mimicked realistic shear
tab connections in order to verify a design model proposed by the Steel
Construction Institute and the British Constructional Steelwork Association in
their design guide (BCSA and SCI 2002). The tests were completed by connecting
a shear tab to both ends of a test beam. The compression flange of the beam was
laterally restrained along its length at regular intervals and, using two hydraulic
jacks, the test beams were loaded in two phases. First, the nominal live and dead
loads were applied to determine the elastic characteristics of the connections. The
load was then removed and reapplied until failure occurred. Although these beam-
to-column connection tests included both regular and extended shear tabs, only
the results from the specimens with the extended configuration are included in
this discussion.
From the first phase completed at working loads, Moore and Owens (1992) found
that the deflection of the beams at mid-span was much larger than that permitted
for serviceability, 1/360 of the beam length. The large deformation was caused by
a combination of vertical plate deformation and rotation. The rotation was
significantly larger when the connection was made to the column web. From these
results, Moore and Owens (1992) suggested that serviceability may be the
governing limit state for extended shear tab connections.

12
Assuming a constant shear along the length of the shear tabs, Moore and Owens
(1992) found that the moment varied significantly. At the ultimate load, they
found that two locations were particularly important for describing the moment at
failure: the weld line and the bolt line. The location of failure depended on the
length of the plate. Extended shear tabs were more likely to fail at the weld line,
whereas shorter plates tended to fail at the bolt line. The extended shear tabs also
had a tendency to twist.
The behaviour of extended shear tabs connected to both interior and exterior
columns were included in the test program. The interior column connection test
was conducted by loading a cantilevered section on the opposite side of the
column web, maintaining an equal moment on both sides of the web. As a result,
the interior and exterior connections developed similar moments, but the interior
connection had a much lower rotational ductility (Moore and Owens 1992).
Sherman and Ghorbanpoor (2002) conducted an extensive testing program on
extended shear tabs for AISC. A total of 31 tests were completed, including six
unstiffened beam-to-column, two unstiffened beam-to-girder, 14 stiffened beam-
to-column, and nine stiffened beam-to-girder connections. Variations in the
number of horizontal bolt lines, plate dimensions, support members, beam sizes,
lateral braces, and bolt hole types were accompanied by changes in how the plates
were welded to the support, the size of stiffener plates used, and the method of
bolt installation. A number of observations, geometric restrictions, and design
suggestions were given for extended shear tabs:
1. Pretensioned bolts do not influence connection behaviour.
2. Short slotted holes and standard holes can both be used and do not
influence the strength of the connection.
3. Bracing the beam laterally does not affect connection capacity.
4. Both sides of the plate must be welded to the supporting member.
5. Stiffener plates need not be thicker than the shear tab.
6. Stiffeners need not be welded to the column web.

13
Based on their results, Sherman and Ghorbanpoor (2002) recommended the
consideration of plate twisting and web yielding as possible failure modes. Plate
twisting was observed during many of the unstiffened extended shear tab tests, as
was column web yielding for the supports with thinner webs. Buckling of the
plate was also observed for two connections in beam-to-girder tests when the
connection was made to both the top and bottom girder flanges. However, checks
for these three observed failure modes were not included in their proposed design
method.
Sherman and Ghorbanpoor (2002) also observed that unstiffened extended shear
tabs have �“excessive�” vertical deflections. Therefore, to reduce the mid-span
beam deflections, connection capacities were given as the load that caused a
reasonable level of deflection, considered by the researchers to be a quarter-inch
of total vertical connection deformation.
A research program on the design of stiffened beam-to-column extended shear
tabs was completed by Goodrich (2005). In both physical tests and finite element
simulations, the shear tab plates were stiffened at the top and bottom to determine
how stiffeners influence the connection behaviour and if a reduced eccentricity
can be used in design instead of the actual. The capacities of the three geometries
tested were more than twice those predicted by the design procedure proposed by
Goodrich, and exceeded the AISC allowable stress design safety factor of 1.67.
All of the extended shear tab tests described above used specimens with only one
vertical bolt line. The use of multiple vertical bolt lines was investigated by
Metzger (2006). Four beam-to-column connection tests were completed to assess
the validity of the AISC extended configuration design procedure, three of which
had two bolt lines and the other, one. However, unlike the majority of the tests
discussed above and extended shear tabs typically used in construction, the plates
were welded to the column flange in lieu of the column web.
The specimens tested by Metzger (2006) were designed according to AISC�’s
extended configuration guidelines (AISC 2005). Although the measured

14
connection capacities exceeded the design capacities, the predicted failure
mode�—bolt shear fracture for all four tests�—was incorrect. The connections
either failed due to weld fracture or the beam failed prior to connection failure.
The welds that failed were smaller than those recommended by AISC for shear
tab design, but the capacities calculated using the AISC equation for weld design
over-predicted the strength when the eccentricity was ignored. Although the AISC
design procedure ignores the load eccentricity on the weld, Metzger (2006)
recalculated the weld strength using the geometric eccentricity, the distance from
the weld to the centroid of the bolt group, and found these values were lower than
the tested capacity. This suggests that, although the eccentricity of the load must
be considered when designing the weld, the effective eccentricity is likely less
than the total eccentricity.
2.2.4 Combined Loading
When simple connections are required to resist a tensile or compressive force in
addition to shear, they tend to be rotationally stiffer (Thornton 1997). This
increased stiffness may cause fracture of the weld or bolt(s) and lead to a
progressive failure. Using an approximation of the maximum possible moment
that the connection will attract, Thornton (1997) proposed equations for tee,
angle, and end-plate connections to ensure progressive failure of the connection
will not occur. These equations are used to ensure the less ductile connection
elements, like the bolts or welds, have sufficient ductility to preclude premature
failure. Thornton (1997) also proposed an equation for tensile capacity that was
based on prying action and accounted for shear�–tension interaction.
Guravich and Dawe (2006) examined the behaviour of common shear
connections, including shear tabs, when subjected to combined shear and tension.
This research was partly in response to evolving requirements to design
connections for tensile �“tie-forces�”, which are intended to improve overall
structural integrity. They found that, similar to shear tabs without axial load,

15
ductility was provided by yielding of the plate and bolt bearing. They also found
that the nominal bolt bearing resistance, BBB, given by:
2-1 B = tpnenFu
where tp is the plate thickness, n is the number of bolts, en is the end distance
(perpendicular to the vertical edge of the plate), and Fu is the ultimate strength of
the plate, gave a consistent approximation of the resultant force on the connection
at failure, with an average experimental-to-predicted capacity ratio of 0.94.
Therefore, the end distance becomes critical to connection behaviour.
Guravich and Dawe (2006) also studied the effect of shear force on the
connection�’s ability to resist tension. The tensile capacities of shear tab
connections were found after zero, fifty, and one hundred percent of the factored
bolt shear capacity was applied in shear. These tests showed that as long as the
shear stress in the plate is less than approximately 50% of the yield stress, the
tensile capacity of the connection does not decrease.
Research into the prevention of progressive collapse of structures has focused on
the ability of connections to allow floor and roof structures to bridge over a failed
column. In this column-removal analysis, the connections are subjected to high
tensile forces as well as moment and shear. However, much higher rotations than
expected under normal loading conditions are applied to the connections and,
therefore, this aspect is outside of the scope of this project.
A design procedure for extended shear tabs subjected to axial load is given by
Tamboli (2010). The procedure is similar to that in the AISC Steel Construction
Manual (2011), described in Sections 2.4.2 and 2.4.3, but includes a buckling
check of the plate, treating it as a column subjected to a compressive load. The
interaction of the shear, moment and axial load is also taken into consideration.
The detailed procedure is shown in Appendix A.
16
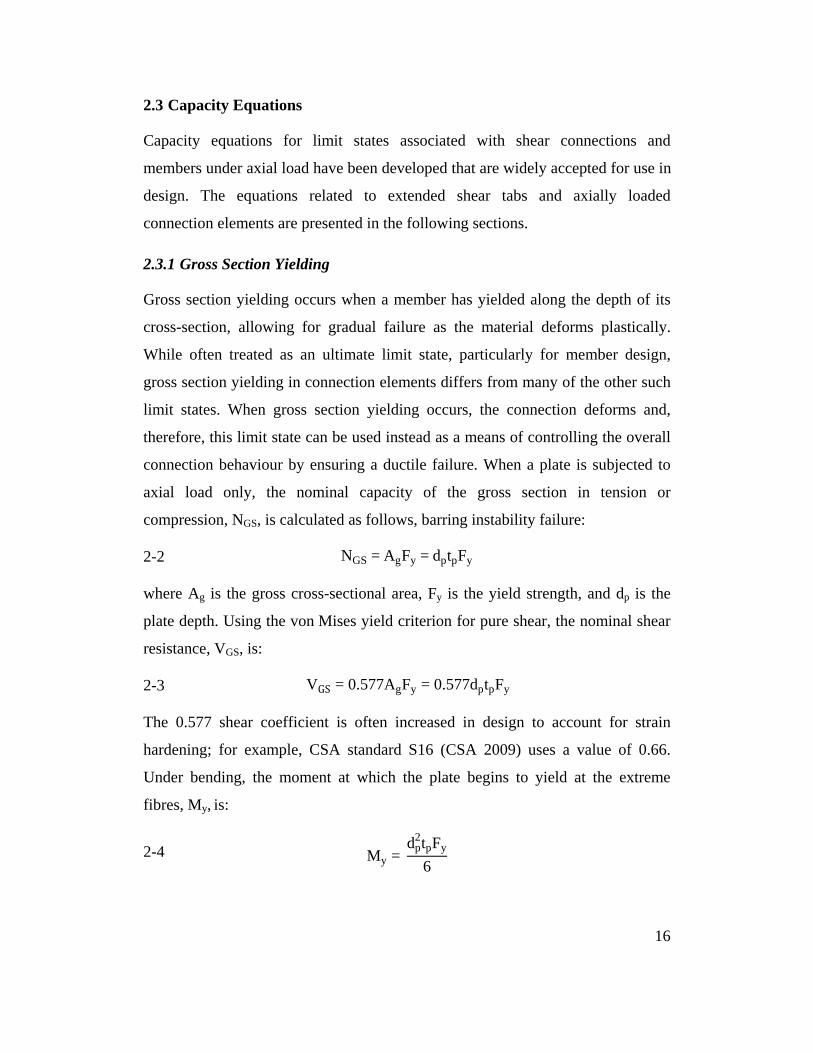
2.3 Capacity Equations
Capacity equations for limit states associated with shear connections and
members under axial load have been developed that are widely accepted for use in
design. The equations related to extended shear tabs and axially loaded
connection elements are presented in the following sections.
2.3.1 Gross Section Yielding
Gross section yielding occurs when a member has yielded along the depth of its
cross-section, allowing for gradual failure as the material deforms plastically.
While often treated as an ultimate limit state, particularly for member design,
gross section yielding in connection elements differs from many of the other such
limit states. When gross section yielding occurs, the connection deforms and,
therefore, this limit state can be used instead as a means of controlling the overall
connection behaviour by ensuring a ductile failure. When a plate is subjected to
axial load only, the nominal capacity of the gross section in tension or
compression, NGS, is calculated as follows, barring instability failure:
2-2 NGS = AgFy = dptpFy
where Ag is the gross cross-sectional area, Fy is the yield strength, and dp is the
plate depth. Using the von Mises yield criterion for pure shear, the nominal shear
resistance, VGS, is:
2-3 VGS = 0.577AgFy = 0.577dptpFy
The 0.577 shear coefficient is often increased in design to account for strain
hardening; for example, CSA standard S16 (CSA 2009) uses a value of 0.66.
Under bending, the moment at which the plate begins to yield at the extreme
fibres, My, is:
2-4 My = dp
2tpFy
6

17
The plate reaches its plastic moment capacity, Mp, when it has yielded through its
full depth:
2-5 Mp = dp
2tpFy
4
2.3.2 Net Section Fracture
Net section fracture occurs when the connection plate begins to tear along the bolt
line. For plates under tension, without significant shear lag, the capacity is given
by:
2-6 NNS = AnFu
where An is the minimum net area of all possible failure paths and Fu is the
ultimate tensile strength of the plate material. For a plate with a regular bolt
pattern, the net area is:
2-7 An = dp-nhdbh tp
where dbh is the bolt hole diameter and nh is the number of horizontal bolt lines.
The shear capacity is similar to Equation 2-6, but with the 0.577 shear coefficient
added, which assumes that the von Mises yield criterion for pure shear applies
also at the ultimate stress. Flexural rupture of connection plates was investigated
by Mohr (2005). Based on test results, he suggested that this moment capacity
was closely approximated by the plastic moment on the gross cross-section:
2-8 Mp=Fytpdp
2
4
2.3.3 Column Web Yielding
Because extended shear tabs are usually connected to a flexible web, if
unstiffened the strength of the supporting member�’s web must be evaluated. Yield
line theory can be used to find the web�’s capacity. This theory is applied by
assuming a failure geometry and equating the internal work required to cause this

18
failure mode and the applied or external work done on the system. However, the
results from yield line analysis are dependent on the assumed failure mechanism
and, if incorrect, they provide an upper bound solution.
For cases where shear tab connections transfer tensile or compressive forces to the
column web, Kapp (1974) proposed the failure geometry shown in Figure 2-3.The
yield line capacity, NCW, is given by:
2-9 NCW =Fycw2dp
b+4Fycw2 1+
c2b
where Fyc is the yield strength of the column web and the values for a=2b+c and c
(see Figure 2-3) should be determined by the engineer based on design
assumptions. However, Kapp mentions that the clear distance between column
web-to-flange fillets, T, could be used for a, and c could be taken as zero or as the
plate thickness plus an eighth of an inch to account for the welds.
b
dp
Column Web Thickness,w
c b
Figure 2-3: Assumed yield pattern in column web subjected to transverse tension
or compression from shear tab plate
Two failure geometries were proposed by Abolitz and Warner (1965) to describe
the yielding of column webs when subjected to out-of-plane moment. Sherman
and Ghorbanpoor (2002) recommended the failure geometry shown in Figure 2-4
for extended shear tabs.

19
The corresponding capacity equation is:
2-10 MCW=mwdp2adp
+4dp
a+4 3
where mw is the moment capacity of the column web per unit of length and,
similar to Equation 2-9, the a dimension should be determined based on design
assumptions.
a
dp
Column Web
Figure 2-4: Assumed yield pattern in column web subjected to moment from
shear tab plate
2.3.4 Out-of-plane Deformation
Out-of-plane deformation of an extended shear tab could occur due to instability
related either to lateral�–torsional buckling or plate-type buckling. The elastic
lateral�–torsional buckling capacity of any flexural member with a rectangular
cross-section can be represented by its critical moment capacity, Mcr, as follows:
2-11 Mcr= LEIyGJ
where E is the modulus of elasticity, Iy is the weak-axis moment of inertia, G is
the shear modulus, J is the St. Venant torsional constant, and the warping
torsional constant is considered negligible for a thin rectangular section. The

20
unbraced length, L, for an extended shear tab supporting a laterally-braced beam
would be from the weld line to the first vertical line of bolts.
While Equation 2-11 assumes that the member is loaded by a constant moment
along its length, Salvadori (1955) proposed interaction curves that accounts for
the effect of axial load and a linear moment gradient for wide-flange members of
a wide variety of geometries, with plates constituting the limiting case of zero
flange width. The member capacity is quantified in terms of a non-dimensional
factor, K, that modifies the critical moment. Using Equation 2-12, simplified to
apply only to rectangular sections (plates) under a moment gradient, the K values
can be converted into 2 values, used in S16 (CSA 2009) to account for the
moment gradient in unbraced flexural members:
2-12 2=K
A simple, conservative approximation to Equation 2-12 is provided in S16 (CSA
2009). Applying the modifier 2 to Equation 2-12 gives the elastic lateral�–
torsional buckling equation for an extended shear tab with a linear moment
gradient:
2-13 Mcr=2
LEIyGJ
Because the slender extended shear tab plate is typically subjected to compressive
stress resulting from the applied axial load and/or bending from eccentric shear,
plate buckling also becomes a concern. The classical plate buckling equation is
based on calculating the critical stress, Fe, at which buckling will occur:
2-14 F =k 2E
12 1-v2tpdc
2
where v is Poisson�’s ratio and dc is the depth of the plate in compression. The k
factor varies depending on the loading and boundary conditions.

21
2.3.5 Weld Rupture
Shear tabs are connected to the supporting member with a double-sided fillet
weld. The capacity of a fillet weld, VW, depends on the area of the weld throat,
Aw, the ultimate tensile strength of the filler metal, Xu, and the orientation of the
load with respect to the weld axis, w (CSA 2009):
2-15 VW = 0.67AwXu 1.00+0.5 sin1.5w
where the coefficient 0.67 relates the filler metal tensile strength to its shear
strength. The area of the weld throat is the product of 0.707 times the weld leg
dimension, D, and the weld length, Lw:
2-16 Aw = 0.707DLw
2.3.6 Bolt Group Capacity
The capacity of a bolt group loaded in shear, VBG, is found by multiplying the
number of bolts by the strength of an individual bolt, as follows for a concentric
load:
where m is the number of shear planes, Ab is the cross-sectional area of the bolt
shank, Fub is the tensile capacity of the bolt, and the 0.6 reduction is used to
approximate shear capacity. Because of the reduction in cross-sectional area, if
the bolt�’s threads are within the shear plane a factor of 0.7 is applied to the
capacity given by Equation 2-17 (CSA 2009).
However, when the connection is eccentrically loaded, the bolt group is subjected
to a moment and the bolts do not share equally in resisting the load. The capacity
of the bolt group is found using the instantaneous centre of rotation method
(Crawford and Kulak 1971). This is an iterative procedure that assumes the bolts
rotate about an instantaneous centre of rotation, and bolt deformation is
proportional to the distance between this point of rotation and the bolt. Figure 2-5
2-17 V = 0.6nmAbFub

22
shows the variables and coordinate system for a general case using this method,
where the origin is taken as the bolt group centroid.
Bolt Group Centroid& Origin
Bolt Location: Xi, Yi
VBGP
NF
eBG
Lom
o
y
Instantaneous Centre of Rotation(XIC, YIC)
di
Ri
xeeff
Figure 2-5: Instantaneous centre of rotation variables
The first step is to determine the loads acting on the bolt group and the
eccentricity of these loads. Because it is initially unknown, the vertical load
capacity of the bolt group, VBG, must be assumed. The resultant load, P, can be
calculated as follows:
2-18 = NF2 + VBG
2
where NF is the factored applied horizontal load. The angle with respect to the
horizontal axis at which this resultant load acts, , must also be calculated and is
positive in the counter-clockwise direction. For a load case in which the
horizontal load passes through the centroid of the bolt group, which is a
reasonable assumption for an axially loaded shear tab, the moment about the
centroid of the bolt group, MBG, is:
2-19 M = VBGeeff
i

23
where eeff is the effective horizontal eccentricity of the vertical load. The
eccentricity of the resultant force that would cause this moment, eBG, is then
determined as follows:
2-20 e = MBG
P
Next, the forces acting on each bolt, Ri, are determined. These forces depend on
the location of the instantaneous centre of rotation, which is initially unknown.
Therefore, a location is assumed for the first iteration that is defined from the
origin by the dimensions Lo, perpendicular to the resultant applied load, and mo,
parallel to the resultant load. The coordinates of the instantaneous centre of
rotation, XIC and YIC, are then found:
2-21 XIC = - Lo sin - mo cos
2-22 YIC = Lo cos - mo sin
The distance, di, from each bolt to the instantaneous centre of rotation and the
angle of the bolt�’s force, i, from the horizontal axis are calculated using the
coordinates of the bolts, Xi and Yi, measured from the origin using Equations 2-23
and 2-24, respectively.
2-23 di = Yi-YIC2 + Xi-XIC
2
2-24 i = tan-1 Yi-YIC
Xi-XIC-
2
The bolt with the maximum distance from the instantaneous centre of rotation,
dmax, will be the first to fail and will therefore undergo the maximum theoretical
bolt deformation, max, assumed to be 8.64 mm (Crawford and Kulak 1971). The
remaining bolt deformations, i, are:
2-25 i = maxdi
dmax
The force in each bolt, Ri, is then calculated using Equation 2-26, where Rn is the
nominal shear capacity of an individual bolt:

24
2-26 Ri = Rn 1 - e-0.4 i 0.55
The final step in this procedure is to ensure equilibrium of the forces is achieved.
The sum of the bolt force components in the vertical and horizontal directions are
equated to the applied shear and axial loads, respectively, as shown in Equations
2-27 and 2-28. Equation 2-29 equates the moment created by the bolt forces about
the instantaneous centre of rotation to the moment due to the applied loads. If
Equations 2-28 to 2-30 are not all satisfied, the shear capacity, VBG, and the
location of the instantaneous centre of rotation, defined by Lo and mo, are adjusted
until equilibrium is achieved.
2-27 Ri sin i + P sin = 0
2-28 Ri cos i + P cos = 0
2-29 Ridi+ eBG+Lo = 0
2.3.7 Bolt Bearing
The connected material, the shear tab and the beam web, may fail due to excessive
deformation from bolt bearing or by bolt tear out. The bearing capacity is directly
related to the strength of the material that surrounds the bolts. Equation 2-1 gives
the bearing equation applicable to tearing out of bolts loaded toward a plate edge,
a failure mode that can be avoided by checking block shear failure (see Section
2.3.8). Equation 2-30 is used to avoid large deformations around the bolt group
and is checked for the connected plates:
where d is the bolt diameter. The bolts must also satisfy minimum end and edge
distances to reduce the probability of bolt tear out.
2-30 BBB=3tpdnFu

25
2.3.8 Block Shear
Block shear failure occurs due to a combination of shear and tension on a block of
material. Although both shear and tension contribute to the failure, rupture begins
on the tension face, at which time the gross shear area normally carries a stress
greater than the yield strength. Equation 2-31 is used in S16 (CSA 2009) for block
shear failure, where Ant and Agv are the net area in tension and gross area in shear,
respectively. However, the equation varies between codes.
2-31 T = UtAntFu + 0.6AgvFy + Fu
2
The efficiency factor, Ut, is used to account for any non-uniform stress
distribution on the tension face. If both tension and shear are present, Tamboli
(2010) suggests either treating the resultant force on the connection as a shear
force or using Equation 2-32:
2-32 VF
TBS-shear
2
+NF
T -tension
2
1
which is an interaction equation that involves calculating the block shear
capacities in both shear, TBS-shear, and tension, TBS-tension, separately. Using the
interaction equation will produce less-conservative results than treating the
resultant force as a shear load (Tamboli 2010).
2.4 Design Standards and Industry Handbooks
2.4.1 CISC Handbook
A design table for shear tabs is given in the Canadian Institute of Steel
Construction (CISC) handbook (CISC 2010). This table is based on the work done
by Astaneh et al. (1989) and includes resistances for connections with one vertical
bolt line located 75 mm from the weld line. Depending on the number of
horizontal bolt lines, ranging from two to seven, the connection resistance, plate
length, plate thickness, and weld size are given for 19 mm (3/4 in) and M20 bolts
as well as 22 mm (7/8 in) and M22 bolts. Although tables are given for both

26
flexible and rigid supports to account for variation in the effective eccentricity for
different support conditions, the geometric eccentricity is restricted to 75 mm and,
therefore, does not include provisions for extended shear tab design.
2.4.2 AISC Manual, 13th Edition
The AISC introduced a new prescriptive design procedure for single-plate
connections in the 13th edition of the Steel Construction Manual (AISC 2005).
The new procedure separated the design of shear tabs into two categories based on
geometry: the conventional configuration and the extended configuration. The
conventional configuration design procedure was an updated version of the
method given in the previous editions for shear tabs. The new, extended
configuration method expanded the design recommendations to include
connections with larger eccentricities and an unlimited number of vertical and
horizontal bolt lines.
There are some requirements that both configurations have in common. The
connections must be made with ASTM A325, F1852, or A490 bolts that are snug-
tight, pretensioned or slip critical. Either 248 MPa (36 ksi) or 345 MPa (50 ksi)
steel is accepted for both methods. A standard fillet weld size of five-eighths of
the plate thickness is required on both sides of the plate to assure the plate yields
before the weld fractures. It was reduced from three-quarters of the plate thickness
in the previous edition of the manual to reflect a change in the assumed critical
limit state from weld yielding to weld fracture (Hewitt 2006). A derivation of the
limit is given by Muir and Hewitt (2009). Experimental work done by Metzger
(2006) verified that the reduction in weld size produces conservative designs.
The conventional configuration design method provides a simplified design
procedure for shear tabs with 2 to 12 bolts in one vertical line that is a maximum
of 88.9 mm (3.5 in) from the weld line. When these limitations are met and the
remaining variables, such as plate thickness and edge distance, are chosen, the
connection is checked for bolt shear, block shear, bolt bearing, shear yielding, and

27
shear rupture. The eccentricity is only required to be considered during the design
of 10 to 12 bolt connections with standard holes. (AISC 2005)
The extended configuration design method was developed for situations in which
the conventional configuration�’s limitations are not met. In other words, the
number of bolts, number of vertical bolt lines, and plate length are not restricted.
However, the design procedure is much more involved and is based on designing
the plate to yield prior to other, more brittle failure modes.
First, the bolt group is designed for bolt shear and bolt bearing. The bolts must be
able to resist the shear force, and the moment developed due to the eccentricity of
this force. The eccentricity is taken as the distance from the support to the first
vertical line of bolts. The maximum plate thickness, tmax, is then calculated such
that gross section yielding will occur before bolt fracture, as follows:
2-33 tmax = 6M BG
Fydp2
The maximum plate thickness is found using the moment-only capacity of the bolt
group, M0BG, plate depth and nominal plate yield stress. This equation is derived
using the elastic section modulus of the plate and assumes the plate will begin to
redistribute stress as soon as it begins yielding. Equation 2-33 need not be
satisfied for a single vertical line of bolts if either the beam web or plate thickness
is less than half the bolt diameter plus one-sixteenth of an inch and the horizontal
edge distances are greater than twice the bolt diameter. If two vertical bolt lines
are used, both the beam web and plate must meet this thickness requirement in
order for Equation 2-33 to be ignored.
The AISC Steel Construction Manual (2005) requires checks for shear yielding,
shear rupture, and block shear of the plate, as well as a flexure check using the
von Mises yield criterion to account for shear-moment interaction. Due to the
larger eccentricity of extended shear tabs, the stability check for double-coped
beams without any specific geometric limitations is also required, which is based
on the classical buckling equation for a plate with one free and three simply-

28
supported edges under a uniform compressive stress. Muir and Thornton (2004)
proposed a simplified equation to determine the plate buckling coefficient, k (see
Equation 2-14), needed to determine the critical stress, Fcr, based on plate
buckling curves presented by Gerard and Becker (1957). The procedure is
outlined in Equations 2-34 to 2-36:
2-34 Fcr = QFy
2-35 Q =1 for 0.7
=1.34-0.486 for 0.7< 1.41
=1.30
2 for >1.41
2-36 =
dp Fy
tp 47500+112000dp2L
2
where the yield stress is in kips per square inch, L is the unbraced length of the
plate parallel to the compressive force, and is:
2-37 = Fy
F
where Fe is the classic plate buckling stress.
Finally, the designer must ensure that the beam is braced laterally at the support.
Using the foregoing procedures, the column can be designed for the transferred
shear only, ignoring eccentricity. The AISC Steel Construction Manual (2005)
also recommends a minimum depth of the plate equal to half the T-dimension of
the beam to provide lateral stability for the beam and for stability during
construction. A design example using the requirements given in the manual was
completed by Muir and Hewitt (2009).

29
2.4.3 AISC Manual, 14th Edition
In the 14th edition of the AISC Steel Construction Manual (2011), the design
guidelines for both conventional and extended single-plate connection
configurations were updated. The conventional configuration procedure was
updated to incorporate increased bolt shear capacity values given by AISC�’s 2010
Specification for Structural Steel Buildings (Muir and Thornton 2011). In
previous editions, the load eccentricity was ignored because the bolt shear values
included a 20% reduction to account for end-loaded connections and, because
shear tabs are not end loaded, ignoring the eccentricity was still conservative. To
account for the bolt strength increase, guidelines for determining the effective
eccentricity and limits on plate thickness were developed and are given in
Table 10-9 of the Steel Construction Manual (AISC 2011). Table 2-1 is a
reproduction of these guidelines, where eg is the geometric eccentricity and d is
the bolt diameter.
Table 2-1: AISC 14th edition conventional configuration guidelines
Number of Bolts Hole Type Eccentricity Max. Plate or Web Thickness
2 to 5 Short Slotted eg/2 None Standard eg/2 d/2 + 1/16
6 to 12 Short Slotted eg/2 d/2 + 1/16 Standard eg d/2 �– 1/16
Table 2-1 was developed using results from 22 shear tab tests conducted by
several researchers that failed due to bolt fracture. To determine the effective
eccentricity for each test, the shear capacity of the bolt group was calculated,
ignoring load eccentricity. The ratio of the tested capacity to the shear capacity of
the bolt group was then calculated and, using the instantaneous centre of rotation
method, the effective eccentricity causing this strength reduction was then
calculated and expressed as a proportion of the geometric eccentricity. Figure 2-6
shows the effective eccentricities of the 22 tests with the Table 2-1 values (eg/2
and eg) shown as horizontal lines. The black data points correspond to the black
line and the grey data points the grey line. Although the effective eccentricities for

30
many of the tests exceed the design values, Muir and Thornton (2011) have given
a detailed rationalization for using the values in Table 2-1, including limiting the
shear tab or beam web thickness to ensure ductility.
Figure 2-6: Effective eccentricities of the tests used for AISC Table 10-9
The conventional configuration design guidelines also address plate buckling in
the 14th edition (AISC 2011). However, because the geometric eccentricity is
limited to 89 mm (3.5 in), Equations 2-34 to 2-36 can be used to show that
buckling of the plate will not occur (Muir and Thornton 2011).
Few changes were made to the extended configuration design method and most of
them were minor. The calculation of the bolt group moment capacity was updated
to reflect the changes to specified bolt strengths and the use of short slotted holes
was addressed and became explicitly permitted. An interaction equation for shear
and moment acting simultaneously on the plate was implemented that requires
shear yielding and shear buckling be checked as per Equation 2-38, in lieu of the
flexural check in the 13th edition that just accounts for the reduction in yield stress
according to the von Mises yield criterion (AISC 2011):
2-38 VF
Vr
2
+ MF
Mr
2
1.0
0
0.2
0.4
0.6
0.8
1
1.2
2 3 4 5 6 7
Effe
ctiv
e Ec
cent
ricity
(e
eff/e
g)
Number of Bolts, n
n = 2 to 5, STDn= 2 to 5, SSLn=6 to 12, STDn= 6 to 12, SSL

31
where VF is the factored applied shear force, Vr is the factored shear resistance,
MF is the factored applied moment, and Mr is the factored moment capacity.
Guidelines for the use of the optional stiffeners shown in the previous edition of
the manual were included in the 14th edition (AISC 2011). The new criteria for
determining whether or not stabilizer plates (stiffeners) are required is based on
the work by Cheng et al. (1984) on coped beams. Thornton and Fortney (2011)
adapted the design method for unbraced double-coped beams to extended shear
tabs by assuming that the beam itself acts as a rigid body between the shear tabs.
Because the rigid beam was considered unbraced, two times the geometric
eccentricity of the shear tab was used as the member length. Although the plates
are not subjected to a constant moment over their length, applying the double-
coped beam equation, which makes this assumption, was considered a
conservative approach. While inconsistent with the constant moment, a constant
shear was assumed over the length of the plate and, solving for the reaction force
that would cause the plate to fail by lateral�–torsional buckling:
2-39 VLTB=1500dptp3
L2
If this resisting force is less than the applied shear, stiffeners are required.
Finally, the torsional capacity of the connection is calculated according to
equations developed by Thornton and Fortney (2011) to account for the effect of
the lap splice between the plate and the beam web. They proposed a resistance
equal to the torsional capacity of the plate in addition to the resistance provided
by the beam bearing against the concrete, if a slab if present. This resistance must
be greater than the torsional moment caused by the lap splice. However, in the
examples presented by Thornton and Fortney (2011), the capacities of the
connection were much higher than required and, therefore, they suggest that the
effect of the lap splice can be neglected in most cases.

32
2.4.4 Eurocode
The design requirements for the components of shear connections are covered by
Eurocode 3: Design of Steel Structures �– Part 1-8: Design of Joints (2005).
However, design guidelines for specific types of connections are not given in this
code. The British Constructional Steelwork Association (BCSA) and the Steel
Construction Institute (SCI) jointly published detailed design procedures for
connections, including shear tabs, that meet the requirements of Eurocode 3.
When shear tabs are designed using this procedure, they can be classified as
pinned, without additional analysis or experimental evidence to demonstrate their
simple connection behaviour. (BCSA and SCI 2002)
The BCSA/SCI design guidelines (2002) define fin plates, or shear tabs, as either
short (conventional) or long (extended) based on the plate�’s thickness and the
distance from the weld line to the first vertical bolt line. The limit for
conventional shear tabs is shown in Equation 2-40 and Equation 2-41 describes
extended configurations.
The 15 design checks include provisions for both types; however, extended shear
tabs are only allowed if the beam is laterally restrained because when unrestrained
the behaviour is complex and the connections are more likely to twist, as observed
by Moore and Owens (1992).
The BCSA/SCI design philosophy is to design the bolt group to resist the
eccentric shear force, while the weld is designed to be stronger than the plate. The
first design step is to detail the connection according to the recommended
geometry. These recommendations were made to ensure the connection will have
the required rotational capacity and, for conventional shear tabs, to provide
2-40 tp
L 0.15
2-41 tpL < 0.15

33
sufficient lateral strength when the beam is not laterally supported. In addition to
the recommended geometry, standard dimensions are also given for the plate
thickness (10 mm), plate width, gap distance, bolt size (20 mm), end distance,
edge distance, minimum plate depth (60% of beam depth), and weld size (8 mm).
After the connection has been detailed accordingly, the bolt group is designed to
resist the eccentric load. Bolt bearing on both the plate and beam web is then
checked. The gross and net shear capacities, as well as block shear capacity of the
plate, are verified. Although shear�–moment interaction is not directly taken into
account, the gross shear capacity is reduced by dividing it by 1.27 to account for
moment in the plate. However, moment is not accounted for when calculating net
or block shear failure. The lateral stability of the plate and its bending capacity are
verified by dividing the plastic moment capacity of the plate by the geometric
eccentricity to get the critical shear load. This critical shear value is then reduced
to account for lateral�–torsional buckling. Finally, the weld capacity is calculated.
Although a weld size of 8 mm is recommended, the required size changes based
on plate thickness and the material strength (BCSA and SCI 2002).
Additional design guidelines are outlined for the beam strength and stability,
especially if it is coped. If an extended shear tab is used, the ability of the beam
web to resist moment at the connection is verified. The shear strength of the
supporting member, either a girder or column, is checked, as well as its resistance
to web tearing if the connection is made on one side of the web of a W-section or
to an HSS section (BCSA and SCI 2002).
The British Standard BS EN 1991-1-7 requires a tying force to be resisted by the
connection to help mitigate possible progressive or disproportionate collapse. In
this design procedure, the plate, bolts, beam web, supporting member, and weld
must resist this tensile force. The tying force is considered independently of the
design shear (BCSA and SCI 2002).
This design procedure was verified by tests completed by Moore and Owens
(1992), as discussed in Section 2.2.3. These tests verified the procedure for beams

34
with a depth up to and including 610 mm. Larger beams are not recommended
because the margin of safety between the design and tested capacities of the
specimens decreased with increasing beam depth (BCSA and SCI 2002).
2.5 Summary
Conventional and extended shear tabs are common types of shear connections
used for beam-to-girder and beam-to-column connections. Although there has
been extensive research into the design of conventional shear tabs, few testing
programs have concentrated on the behaviour of extended shear tabs. Research
programs by Sherman and Ghorbanpor (2002), Goodrich (2005), and Metzger
(2006) have been used to develop the AISC design procedures (2005; 2011),
whereas the BCSA and SCI have verified design guidelines with research by
Moore and Owens (1992). However, these design procedures do not address the
presence of horizontal load or the increase in strength of the connection when
stiffeners are present.
Failure modes for extended shear tabs are similar to those identified for
conventional shear tabs: gross area yielding, net section fracture, bolt tear out, bolt
bearing, bolt fracture, and weld rupture. However, additional failure modes have
been observed and should be included in design procedures for extended shear
tabs. These additional limit states are column web yielding and out-of-plane
deformation. Several of the failure modes cited above are influenced by the
presence of axial force and, if present, this force needs to be accounted for
explicitly in design.

35
CHAPTER 3: EXPERIMENTAL PROGRAM
3.1 Introduction
In order to gain a better understanding of the behaviour of extended shear tabs, 23
full-scale tests were completed. A key aspect of this test program is the presence
of axial load because, although the stability of this type of connection has always
been a design concern, no prior tests had been done considering the effect of
compression or tension. In addition to varying the magnitude of tension or
compression, the program also investigates the influence of plate thickness, the
number of horizontal bolt lines, and the presence of stiffeners (stabilizer plates).
In the following sections, a summary of specimen geometry and design is given,
followed by an overview of the material properties, test set-up, instrumentation,
and test procedures. A summary of the test results is presented by giving the peak
vertical load and observed failure modes for each specimen.
3.2 Test Specimens
As no widely-accepted method currently exists for designing extended shear tab
connections subjected to axial load, 12 specimen geometries were designed for
the experimental program based on the design procedures used at Waiward Steel
Fabricators Ltd. of Edmonton, Alberta, referred to as �“the Fabricator�” in the
remainder of this document. The specimens, shown in Figure 3-1, differ in the
number of horizontal bolt lines, the plate thickness, and the use of stiffeners.
These three variables are used to identify specimen groups with the same
geometry using an alphanumeric I.D. that begins with 2B, 3B, or 5B, depending
on the number of horizontal bolt lines. The plate thickness to the nearest
millimeter, either 10 or 13, follows. Finally, if the specimen is unstiffened, a �“U�”
follows the plate thickness or, if stiffeners are present, an �“S�” is used to complete
the group I.D. For example, the stiffened specimens with two horizontal bolt lines
and a 10 mm plate are identified as specimen group 2B-10-S.

36
348
3580
8035
450
PL THICKNESS VARIES:10 OR 13 mm
348
3580
80
PL THICKNESS VARIES:10 OR 13 mm
348
3580
80
PL THICKNESS VARIES:10 OR 13 mm
80
348
3580
80
PL THICKNESS VARIES:10 or 13 mm
348
3580
80
PL THICKNESS VARIES:10 OR 13 mm
348
3580
80
PL THICKNESS VARIES:10 OR 13 mm
80
66
66
66
66
66
66
19 mm BOLTS (4 TYP.)
19 mm BOLTS (6 TYP.)
19 mm BOLTS (10 TYP.)
19 mm BOLTS (4 TYP.)
19 mm BOLTS (6 TYP.)
19 mm BOLTS (10 TYP.)
150
150
190
190
270
270
W310X107 W310X107
W310X107
W310X107
3535
35
3535450
450
450
450
450
450
450
450
450
450
W310X107
450
W310X107
13 mm STIFFENER
13 mm STIFFENER
13 mm STIFFENER
(a) 2B-10, 2B-13 (b) 2B-10-S, 2B-13-S
(c) 3B-10, 3B-13 (d) 3B-10-S, 3B-13-S
(f) 5B-10-S, 5B-13-S(e) 5B-10, 5B-13
Figure 3-1: Specimen geometries
2B-10-U, 2B-13-U
3B-10-U, 3B-13-U
5B-10-U, 5B-13-U
2B-10-S, 2B-13-S
3B-10-S, 3B-13-S
5B-10-S, 5B-13-S

37
The magnitude of the horizontal load applied to the specimen, in kilonewtons, is
added to the end of the specimen group I.D. to differentiate among test results of
specimens with the same geometry. This force is followed by a �“C�” if it was
tested under compression, a �“T�” if tension was applied, or nothing if the
horizontal load was 0 kN. While a small beam rotation was generally applied at
the beginning of the test (see Section 3.6), one test was carried out with the beam
at zero radians to investigate the influence of beam rotation on the connection
capacity. This test is identified by adding an additional zero (there was no
horizontal force) to the end of the I.D. (2B-10-U-00).
To determine how the variables described above influence the behaviour of
extended shear tabs, typical sizes and dimensions were chosen for the remaining
parameters. These constants include a W310x107 column stub, a 348 mm long
connection plate, 19 mm (3/4 in) diameter ASTM A325 bolts, two vertical bolt
lines, a 6 mm fillet weld, and a constant stiffener configuration, as shown in
Figure 3-1. These parameters were used with the Fabricator�’s design procedure to
determine the governing unfactored shear capacities shown in Table 3-1. This
design procedure examines the bolt group capacity, bolt tear out, gross section
yielding, net section fracture, plate stability, block shear capacity under axial
loads, and weld capacity. Additional calculations for stiffener strength and
stiffener weld capacity are included if required. Calculations are also completed to
determine the maximum and minimum plate thicknesses that ensure a ductile
mode of failure. The predicted failure mode for all specimens was shear yielding
of the gross cross-section of the shear tab plate. Appendix A provides detailed
calculations for a sample specimen.
Because it is commonly used in the design of extended shear tabs, the specimens
in this program have two vertical bolt lines. The number of horizontal bolt lines
was varied to determine not only the influence of this variable on the capacity, but
also to test different plate depth-to-length ratios. Two, three, and five horizontal
bolt lines were selected to cover a reasonable range commonly used in buildings.

38
The shear capacity of the bolt group was determined using the instantaneous
centre of rotation method, with the eccentricity taken equal to the geometric
eccentricity, i.e., the distance from the weld line to the centroid of the bolt group.
Standard bolt holes were used in all specimens, 2 mm (1/16 in) greater than the
nominal bolt diameter.
Table 3-1: Unfactored capacities (kN) using Fabricator’s design procedure
Horizontal Load (kN)
Specimen Group 200T 0 200C 300C 400C 500C 2B-10-U - 66 55 - - - 2B-13-U - 81 - - - 2B-10-S - 66 55 - - - 2B-13-S - 81 - - - 3B-10-U 142 151 142 125 - - 3B-13-U - - 194 - - 3B-10-S - 151 142 125 - - 3B-13-S - - 194 - - 5B-10-U 385 395 - 374 - - 5B-13-U - - - 467 - - 5B-10-S - - - 374 334 - 5B-13-S - - - - - 420
The extended shear tab plates, fabricated from CAN/CSA-G40.20/G40.21-04
grade 350W steel, vary in both depth and thickness. As the number of bolts
increases, the plate depth also increases in order to keep a consistent 80 mm
spacing between both the vertical and horizontal bolt lines and 35 mm end and
edge distances. The two plate thicknesses chosen, 9.5 mm (3/8 in) and 12.7 mm
(1/2 in), are commonly used for extended shear tabs.
The plate length is constant for all specimens. In reality, there is no typical value
for this dimension because it depends on the column size, the required gap
between the beam and column flanges (with or without clearance for fire-proofing
material), the number of vertical bolt lines, the vertical bolt line spacing, and the
edge distance. Therefore, typical sizes and dimensions were specified for these
parameters and, with the exception of the gap distance, are shown in Figure 3-1. A

39
gap distance of 50 mm was selected to represent a �“worst case�” scenario: when
fireproofing must be accommodated between the column and beam. As a result, a
348 mm plate was used with a geometric eccentricity of 273 mm.
Due to the large load eccentricity, which was used without any reduction to
design the connection, the interaction of shear, moment, and axial load had to be
taken into consideration to calculate the gross and net section capacities of the
plate. These capacities were estimated using a von Mises stress equation,
modified to include the presence of some strain hardening.
Because the specimens were subjected to axial load, the possibility of block shear
failure was checked according to standard S16 (CSA 2009), given in Chapter 2.
The torsional moment caused by the lap of the plate and beam web was ignored
because the beam was laterally and torsionally braced next to the connection.
For the unstiffened extended shear tab connections, the plate-to-column-web weld
was designed by neglecting the eccentricity of the load and using the equation for
a concentrically loaded weld (see Chapter 2). The weld was sized for the shear
capacity of the connection, taken as the minimum of the bolt group and plate
capacities. As a result, a 6 mm fillet weld was used on both sides of the plate, for
both plate thicknesses.
For stiffened extended shear tab connections, the stiffeners were designed for the
shear capacity of the plate and the horizontal load. Because the distance between
stiffeners, their thickness, and the weld sizes depend not only on the loads
transferred from the weak-axis connection(s) to the column, but also on the forces
acting on the column�’s strong-axis connection(s), the stiffener configuration was
chosen to represent typical dimensions used in practice. The stiffeners had a
thickness of 12.7 mm (1/2 in) and were offset from the top and bottom of the
shear tabs by a clear distance of 75 mm. The radius of the interior corner where
the plate depth changes was 25 mm and the stiffener plate extended 115 mm from
the column web before changing depth. Double-sided, 6 mm fillet welds were

40
specified to connect the stiffener plate to the extended shear tab, the column web,
and the column flanges.
Each extended shear tab plate was supported by a 900 mm long, W310107
column stub. A 12.7 mm (1/2 in) column cap plate was welded onto the top and
bottom of the column stub for installation of the specimen into the set-up, as
described and shown in Section 3.4. The shear tabs were centred vertically on the
column web and offset horizontally by one-half of the total beam web plus shear
tab thickness to keep the beam and column axes aligned.
The beam was reused for all the specimens tested with the same number of
horizontal bolt lines, with the exception of the 5B-10-S-300C and 5B-13-S-500C
tests. A new beam was installed for these specimens due to excessive deformation
of the web that occurred during the 5B-10-S-400C test. For the two and three bolt
line specimens, a W310x129 beam was used, whereas for the deeper, five bolt
line specimens, a W530x165 beam was used. These were chosen for three
reasons: compatibility with the test set-up, similar web thicknesses, and to
preclude beam web failure. The beams had the same edge distance as the extended
shear tabs: 35 mm.
As-built dimensions were measured for all of the specimens to ensure they were
fabricated as specified. However, because the actual dimensions only varied
slightly from those given in Figure 3-1, the specified specimen geometries are
used for the remainder of the document.
3.3 Material Properties
3.3.1 Plate Coupon Tests
Tension coupons were fabricated from 500 mm 500 mm plates that were cut
from the same source plate as was used for the extended shear tab specimens. For
each plate thickness, four material samples were taken. The coupons were
oriented as shown in Figure 3-2, with two samples taken from one direction and
the remaining pair taken at 90 degrees from the first. The pairs were cut at

41
90 degrees to assess the material properties from two orthogonal directions, but
the observed differences are not considered to be significant.
20
20300
300
60 20 20
5
5
5
10
5
Figure 3-2: Shear tab tension coupons cut from 500 mm 500 mm plate
The dog-bone shaped material samples were tested according to ASTM standard
A370-12a (ASTM 2012). The stress was calculated by dividing the force,
recorded by the testing apparatus, by the initial area of the �“reduced�” section. The
strain was measured by an extensometer with a gauge length of 50 mm. Three
static points were taken on the yield plateau and averaged in order to calculate the
static yield strength, and one static point was taken at the ultimate tensile load.
The yield and tensile strengths of each coupon are shown in Table 3-2. These
values were averaged to find the material properties of both plate thicknesses.
The elastic modulus, final elongation, and area reduction are also reported in
Table 3-2. The elastic modulus was found by performing a linear regression on
the elastic portion of the stress�–strain curve. The final percent elongation was
calculated by dividing the final change in length between two punch marks by the

42
undeformed distance measured before testing. Finally, the initial and minimum
final cross-sectional areas were used to calculate the area reduction.
Table 3-2: Material properties
Plate Size (mm)
Coupon Number
Yield Strength (MPa)
Tensile Strength (MPa)
Elastic Modulus (MPa)
Final Elongation
(%)
Area Reduction
(%)
10
i 458 500 202000 23.2 68.3 ii 464 505 206520 23.0 73.0 iii 451 529 177510 24.8 71.9 iv 448 495 171500 26.1 73.7
Average 455 507 189383 24.3 71.8
13
i 424 473 196250 21.4 59.9 ii 431 467 200590 25.8 62.7 iii 404 442 172650 26.0 65.2 iv 413 496 186540 24.1 65.3
Average 418 470 189008 24.3 63.3
For both plate thicknesses, the minimum strength and ductility given by
CSA G40.21-04 for this grade were met. The standard deviations of the yield and
tensile stresses are within 5% of the mean values for both thicknesses.
3.3.2 Bolt Shear Tests
To determine the shear capacity of the bolts used to connect the shear tab to the
beam web, six bolt shear tests were completed on bolts from the same lot. These
bolt tests were conducted in single shear to mimic the test conditions. To ensure
the shear plane was in the same location as it was during the tests, three tests were
completed for each plate thickness. In both cases the shear plane was in the thread
run-out region of the bolt, but for the thicker plate it was near the minimum
diameter and for the thinner plate it was on the boundary between the thread run-
out and the unthreaded shank. The results of the bolt tests are summarized in
Table 3-3.

43
Table 3-3: Bolt shear strength
Test Number Plate Thickness
13 mm 10 mm 1 159 kN 180 kN 2 159 kN 176 kN 3 158 176 kN
Average 159 kN 177 kN
3.4 Test Set-up
The test set-up was designed to allow any combination of vertical load, horizontal
load, and rotation to be applied to the connection. As shown in Figure 3-3, the
set-up consisted of an interchangeable column stub specimen (including the shear
tab), a beam, and three actuators. This set-up is a modified version of that used by
Oosterhof and Driver (2012) for progressive collapse research.
SUPPORTING BEAM BEYOND
ACTUATOR 3
ACTUATOR 2ACTUATOR 1
REACTION BEAMS
STEEL BASEPLATEAND STRONG FLOOR
ACTUATOR 3 CONNECTION
SHEAR WALL
LATERAL BRACING CONTACT POINT
50
BEAM
INTERCHANGEABLE COLUMN STUB (SPECIMEN)
SEAT FOR COLUMN STUB
Figure 3-3: Test set-up
Actuator 1 was used to apply vertical load near the connection, while Actuator 2
primarily controlled the rotation of the beam. The specified horizontal load for
each test was applied using Actuator 3. The beams were bolted to Actuators 1
and 2 using four 22 mm (7/8 in) diameter pretensioned bolts. Actuator 3 was

44
connected to the beam using 12.7 mm (1/2 in) lap plates on both sides of the beam
web. The plates were connected to the beam web by nine 22 mm (7/8 in)
pretensioned bolts in double shear. The other end of the plates were welded to a
thick load transfer plate that was in turn bolted to the actuator using eight
25.4 mm (1 in) pretensioned bolts. Actuators 1 and 2 were anchored to the lab�’s
strong floor, while Actuator 3 was connected to a stiff shear wall.
Before testing, the specimen was bolted to seats at the top and bottom of the
column stub using the column cap plates. On both ends, the connection was made
using four 25.4 mm (1 in) pretensioned bolts to prevent the column stub from
slipping. The seats were designed to minimize the possibility of vertical or
horizontal deformation during the tests, and were each mounted on a strong
column using two vertical lines of nine 25.4 mm (1 in) pretensioned bolts. The
column was anchored to the strong floor and braced diagonally to the floor and
also back to the shear wall.
Two types of lateral bracing were used in the set-up. First, facing pairs of steel-
backed Teflon slide plates were provided on each side of the beam to serve as
bracing near the connection, and their location is shown in Figure 3-3. These slide
plates braced both the top and bottom flanges and were shimmed snug between a
support column and the beam flanges before each test. In order to apply
compressive horizontal loads greater than 300 kN safely, a second set of lateral
braces that utilised end rollers against a stiff steel running surface was provided
for Actuator 3. The bracing was the same on both sides of the actuator and is
shown in Figure 3-4.
Figure 3-4: Actuator 3 lateral bracing system

45
3.5 Instrumentation
Loads cells, clinometers, cable transducers, pressure transducers and linear
variable differential transformers (LVDTs) were used to monitor the behaviour of
the extended shear tab connections throughout the tests and were located on the
set-up as shown in Figure 3-5. The instruments were connected to an HBM
MGCplus data acquisition system, and a data point from each instrument was
recorded every two seconds using HBM�’s catman®Easy data acquisition software.
In addition to the instruments listed above, a digital image correlation camera
system, by Correlated Solutions, was used to map the three-dimensional
displacements and strains of the connection specimens.
SUPPORTING BEAM BEYOND
ACTUATOR 3
ACTUATOR 2ACTUATOR 1
REACTION BEAMS
STEEL BASEPLATEAND STRONG FLOOR
SHEAR WALL
SLIDE PLATE CONTACT POINT
CL1 CT1
CL1 CL2
CL3CL4
CL5
CL6
LC1 LC2
LC3
PT1
PT1 PT2
PT3,4
LEGEND
CLINOMETER CABLE TRANSDUCER PRESSURE TRANSDUCER
LC1 LOAD CELL
CT2CT1
CT3CT4
CT5
LVDT1 LINEAR VARIABLE DIFFERENTIAL TRANSFORMER
LVDT2LVDT1
Figure 3-5: Instrumentation plan
A load cell and clinometer were mounted on each actuator. The clinometers were
installed using a plumb line so that when vertical, they read zero radians. This
allowed the forces from the load cells to be separated into vertical and horizontal

46
components. By adding the three vertical and three horizontal load components,
the total load on the connection in each principal directions was calculated.
Redundant load measurements were taken by pressure transducers connected to
the hoses of the hydraulic actuators. The ratio of the force in each load cell to that
measured by the corresponding pressure transducer was monitored during the
tests to ensure the instruments were functioning properly. For several of the tests,
the values read by Actuator 3�’s pressure transducer were used for the force
calculations because the load cell was unable to read the load, likely due to
bending causing slightly eccentric forces in the load cell.
In addition to the total load, the moment acting on the connection was calculated
using the horizontal and vertical forces from each actuator and their respective
moment arms. The moment arms were calculated using cable transducers,
clinometers, and the dimensions of the set-up components measured prior to
testing.
Beam rotation was measured both directly, using a clinometer, and indirectly
using cable transducers and the clinometers on Actuators 1 and 2. The ratio of the
direct and indirect measurements was monitored during the tests to confirm that
the instruments were functioning properly.
Clinometers were also mounted on the flange of the column stub and on the
extended shear tab plate. The former was used to monitor global column stub
rotation; however, it did not record a rotation higher than 0.00325 radians
(0.19 degrees) during the first 12 tests, so the use of this clinometer was
discontinued. The clinometer on the connection plate was located as close to the
weld line as possible to get an indication of the column web rotation.
Two additional cable transducers were used to measure the extended shear tab
deformations. One measured the vertical deformation of the connection at the
centroid of the bolt group, while the other measured axial deformation along the
centreline of the beam, between the beam and the column web. Any elastic axial
beam deformation captured was assumed negligible compared to the connection

47
deformation. The horizontal displacement of the column stub web and the overall
horizontal movement of the column stub in relation to the strong-column support
were measured by LVDTs.
In order to use the strain cameras, the areas of interestthe extended shear tab
plate and beam webwere painted white with black speckles. The cameras were
positioned to capture as much information on the plate as possible, without
sacrificing the accuracy of the measurements. However, a large portion of the
extended shear tab plate was not visible because it was obstructed by the column
flanges.
3.6 Test Procedure
Once the specimen was bolted to the beam using the required number of 19 mm
(3/4 in) diameter snug-tight bolts, the beam was rotated by 0.03 radians. This
angle was chosen to reflect the expected end rotations of a typical-length simply
supported beam when the middle of the beam reaches its plastic moment, as
discussed in Section 2.2.1. While rotating the beam, the total horizontal and
vertical loads were kept at or near zero. When 0.03 radians was reached, the
horizontal load for that test was applied while the rotation was held constant and
the vertical load was kept at or near zero. Once the desired horizontal load had
been applied, both it and the beam rotation were held constant for the remainder
of the test. Finally, upward vertical load was applied to the connection until
failure occurred and the vertical load had decreased substantially from its peak
value. After the load was removed, the specimen was examined and any visible
failure modes were recorded.
3.7 Safety
In accordance with the university’s health and safety act, precautions had to be
implemented to prevent injury and loss of equipment during testing. The risks
associated with the tests were evaluated and the necessary safeguards were put
into place. One of the major safety concerns was bolt failure in a projectile-like

48
manner, and, therefore, a barrier was required between the specimen and
researchers at all times while the tests were in progress. This safeguard, though
necessary, caused the specimens to be inaccessible during testing. Although
inaccessible directly, equipment was put into place to allow visual monitoring of
the specimens. On one side of the set-up, a Plexiglas shield was installed as a
viewport and, although access to the other side was not permitted, the strain
cameras were set-up on this side, allowing deformations to be monitored. A live
video stream of the area in which failure was expected to begin was also used for
viewing the specimens during the tests.
3.8 Test Results
Results from the 23 tests are shown in Table 3-4. The peak vertical load and
observed failure modes are given according to each specimen�’s I.D. Of the
possible failure modes discussed in Chapter 2, only those that were observed are
listed. The manner in which these modes contributed to failure and the order in
which they occurred are discussed in Chapters 4 and 5 for unstiffened and
stiffened specimens, respectively.
Bolt fracture, in the threaded region, was commonly observed during these tests.
A number was assigned to each bolt to describe bolt failure, as shown in Figure
3-6. The numbers corresponding to the failed bolts from each test are listed in
Table 3-4, although the specific sequence of failure could not be determined
reliably. Nearly all of the unstiffened specimens experienced some degree of weld
fracture, but the severity varied considerably; however, they were grouped into
two categories to facilitate discussion. The less severe, dubbed a �“tip fracture�”,
describes weld fracture at the tension tip of the weld only, as shown in Figure
3-7(a). This occurred due to the high stress concentration at this location, but the
crack was then quickly arrested and the weld is considered to have performed
acceptably. If fracture extended beyond the weld tip, it is categorized as �“rupture�”,
indicating that the weld capacity diminished significantly due to tearing and the
weld is considered to have failed. As shown in Figure 3-7(b) and Figure 3-7(c),

49
the extent of weld rupture in this category varies. If out-of-plane deformation was
visible after testing, Table 3-4 contains a “Y”, indicating it was present.
Otherwise, an “N” is used to indicate that out-of-plane deformation was not
evident. In general, it was present for stiffened specimens and not for unstiffened
ones. The presence of column web yielding is given by a yes (Y) or no (N)
indicator based on whether or not the column web underwent plastic deformation.
In general, it was present for unstiffened specimens and not for stiffened ones.
1 2
3 4
5 6
7 8
9 10
Figure 3-6: Bolt numbering system
Figure 3-7: Weld fracture (a) tip fracture, (b) and (c) rupture
(c) (b) (a)

50
Table 3-4: Test results
Specimen ID
Peak Load (kN)
Bolt Failure(s) Weld Failure
Out-of-plane
Deformation (Y/N)
Column Web
Yielding (Y/N)
2B-10-U-0 188 3,4 Rupture N Y 2B-10-U-00 197 3 Rupture N Y
2B-10-U-200C 159 3,4 Tip Fracture N Y 2B-13-U-200C 138 3,4 Tip Fracture N Y
2B-10-S-0 317 1,3 - Y N 2B-10-S-200C 258 1,3 - Y N 2B-13-S-200C 323 1,3 - Y N
3B-10-U-0 330 5,6 Rupture N Y 3B-10-U-200C 339 5,6 Rupture N Y 3B-10-U-300C 278 5,6 Tip Fracture N Y 3B-10-U-200T 270 - Rupture N N 3B-13-U-200C 263 5,6 Tip Fracture N Y
3B-10-S-0 511 1,2,3,5 - Y N 3B-10-S-200C 382 - - Y N 3B-10-S-300C 279 - - Y N 3B-13-S-200C 562 1,2,3,4,5,6 - Y N 5B-10-U-0* 762 1,2,7,9,10 - N Y**
5B-10-U-300C 732 5,7,8,9,10 Tip Fracture Y Y 5B-10-U-200T 612 9,10 Rupture N Y 5B-13-U-300C 613 5,7,8,9,10 Tip Fracture N Y 5B-10-S-300C* 798 - - Y N 5B-10-S-400C 586 - - Y N 5B-13-S-500C* 861 7,9,10 - Y N
*Actuator 1 capacity reached **Column web tear
As discussed previously, the only difference between tests 2B-10-U-0 and
2B-10-U-00 is the angle of the beam during the test. Although 0.03 radians was
chosen as a constant beam rotation for all tests, to determine the sensitivity of the
connection capacity to the beam rotation at the beginning of the program, a
second test with the same specimen geometry as 2B-10-U-0 was conducted,
keeping the rotation at zero radians. Because these tests resulted in capacities
51
within 10 kN (5%) of one another, and the rotated beam capacity was the lower of
the two, the 0.03 radian rotation was used for the remaining tests.
The vertical load reported in Table 3-4 is the maximum value recorded during
testing. When comparing these values with the design capacities in Table 3-1, it is
evident that the specimens were much stronger. In fact, the actual capacities of the
larger, five-bolt-line extended shear tabs approached or exceeded the capacity of
the set-up, which was governed by the maximum force that could be applied by
Actuator 1. Although the capacity of Actuator 1 was reached during three of the
tests (denoted in Table 3-4 by *), the maximum vertical load recorded is still
considered representative of the connection capacity in each case. First, although
no horizontal load was to be applied to specimen 5B-10-U-0, 146 kN of tension
had to be applied to reach failure, and this is not considered to have influenced the
vertical load capacity greatly. For the two stiffened specimen tests in which the
actuator capacity was reached, 5B-10-S-300C and 5B-13-S-500C, the vertical
load versus deformation curve had reached an extended plateau, suggesting that
the capacity of the connection had been closely approached.
3.9 Summary
A total of 23 extended shear tab connections were tested. The connections varied
in the number of horizontal bolt lines, plate thickness and presence of stiffeners.
As such, the following extended shear tab test groups are identified:
7 two-bolt-line, 9 three-bolt-line, and 7 five-bolt-line
17 with a 10 mm plate and 6 with a 13 mm plate
13 unstiffened and 10 stiffened.
An existing set-up was modified to meet the requirements for these tests and a
variety of instruments were used to monitor and record the behaviour of the
specimens. The tests were conducted by rotating the beam to 0.03 radians,
applying a predetermined horizontal load, and then failing the connection in shear.
The peak vertical load and observed failure modes for each test were recorded.

52
The tests have revealed that the Fabricator�’s procedure used for specimen design
appears to underestimate the capacities of extended shear tab connections
considerably.

53
CHAPTER 4: UNSTIFFENED EXTENDED SHEAR TABS
4.1 Introduction
A discussion of the 13 unstiffened extended shear tabs that were tested is
presented in this chapter. The key variables, peak shear load, and observed failure
modes are discussed in detail and used to describe typical connection behaviour.
Following this, existing design procedures are examined and compared to the test
results. The ability of each design procedure to predict ultimate shear capacities,
as well as critical failure modes, is discussed. Finally, design recommendations
for unstiffened extended shear tab connections are proposed and compared to the
test data.
4.2 Observed Behaviour
4.2.1 Failure Modes
The commonly observed failure modes for the unstiffened extended shear tabs
tested were bolt fracture, weld rupture, and column web yielding. In some cases,
the extended shear tab plates underwent permanent plastic deformations due to
gross section yielding and/or deformations of the bolt holes due to bolt bearing.
However, the critical failure mode—considered to be that which caused the initial
post-peak decrease in vertical load—tended to be bolt fracture or weld rupture. In
one case, specimen 5B-10-U-0, the weld did not rupture but column web tearing
began on the tension side of the weld. Significant out-of-plane deformation of the
shear tab plate was only observed on specimen 5B-10-U-300C.
A summary of the observed failure modes was given in Chapter 3; however, a
more detailed list including all of the failure modes described in Chapter 2 is
given in Table 4-1. These failure modes include weld rupture (WR), bolt fracture
(BF), column web yielding (CWY), gross section yielding (GSY), net section
fracture (NSF), bolt bearing (BB), and out-of-plane deformation (OPD). In this
table, the critical failure mode is marked as CFM. Each of these modes is
discussed in the following sections. Whether or not gross section yielding

54
occurred during test 3B-13-U-200C is unknown due to a problem with data
collection from the camera system.
Table 4-1: Critical and other observed failure modes
Failure ModesSpecimen I.D. WR BF CWY GSY NSF BB OPD
2B-10-U-0 CFM - - 2B-10-U-00 CFM - - 2B-10-U-200C - CFM - - 2B-13-U-200C - CFM - - 3B-10-U-0 CFM - - 3B-10-U-200C CFM - - 3B-10-U-300C - CFM - - 3B-10-U-200T CFM3B-13-U-200C - CFM N/A - -5B-10-U-0* - CFM** - -5B-10-U-300C - CFM - -5B-10-U-200T CFM - -5B-13-U-300C - CFM - -* Actuator 1 Capacity Reached** Column Web Tearing (CWT)
4.2.1.1 Weld Rupture
Even if it did not cause the drop in vertical load, some extent of weld rupture was
observed in every test specimen, except for the specimen that experienced column
web tearing instead: 5B-10-U-0. The rupture would begin at the tension tip of the
weld and in some cases propagate towards the compression side, while in others it
was arrested quickly (see Table 3-3). If the tip fracture did not propagate, it was
considered a local effect and the weld performance was deemed acceptable. Weld
rupture tended to occur when the specimens were tested without axial load or with
axial tension. In both cases where tension was applied, weld rupture was the
critical failure mode. It is unclear why the critical failure mode of specimen
3B-10-U-200C, with a large compressive force, was also weld rupture, but this
mode may have been triggered by a weld flaw that went undetected.

55
4.2.1.2 Bolt Fracture
In many cases, the decrease in vertical load was attributed to the fracture of one or
more bolts. With the exception of test 3B-10-U-200T, during which no bolts
fractured, this failure mode occurred during every test. In some cases, bolt
fracture was a secondary failure mode. In these tests, after the primary decrease in
vertical load, the forces were redistributed in order for the connection to reach a
new equilibrium state. This redistribution of forces eventually led to an increased
bolt shear that caused failure, either very quickly after the initial load dropped or
after a plateau at a lower vertical force.
Figure 4-1: Bolt fracture of Specimen 3B-10-U-0
4.2.1.3 Column Web Yielding
Column web yielding was observed during all 13 unstiffened extended shear tab
tests and in one case, specimen 5B-10-U-0, the column web tore, as shown in
Figure 4-2. The column webs were whitewashed prior to testing to determine the
column web yield pattern. The whitewash revealed Lüders�’ lines extending
radially on the column web from top and bottom of the plate, as shown in Figure
4-3 for a typical case at the conclusion of the test. Specimen 3B-10-U-200T,

56
which did not exhibit signs of column web yielding prior to the weld rupturing,
was the only exception.
Figure 4-2: Column web tearing in specimen 5B-10-U-0
Figure 4-3: Lüders�’ lines at the compression edge of plate
With the exception of specimen 3B-10-U-200T, the column webs underwent
significant permanent deformation consistent with the failure geometry presented
by Sherman and Ghorbanpoor (2002) based on a yield line analysis and discussed
in Chapter 2.

57
4.2.1.4 Gross Section Yielding/Net Section Fracture of Plate
Although evidence of localized plate yielding was observed on all specimens, it
was not responsible for a decrease in vertical load. Plate yielding occurred along
the vertical bolt line closest to the weld, such that the plate was bending around
bolt number 1 (see Chapter 3 for bolt numbering system) and causing a discrete
kink in the plate at this location. This plate deformation was most visible on the
connections tested without axial load and those with a 10 mm plate thickness. An
example of the deformation due to plate yielding in specimen 2B-10-U-0 is shown
in Figure 4-4. Transverse necking of the plate was evident where it bent around
the bolt hole in this specimen and four others: 2B-10-U-00, 3B-10-U-0,
5B-10-U-0, and 5B-10-U-200T, indicating that net section fracture would have
occurred along this line had it not been pre-empted by another mode. Because the
necking deformation occurred in the region of the plate that was primarily
subjected to tension, these deformations were not observed when the connection
was subjected to horizontal compressive loads. Necking was not observed on
specimen 3B-10-U-200T due to the high tensile force on the weld during this test;
the only failure mode observed was weld rupture.
Figure 4-4: Plate deformation in specimen 2B-10-U-0

58
Gross section yielding is one mechanism that can be used in design to ensure that
the connection has sufficient ductility. The vertical load at which the plate yielded
through its full depth is given in Table 4-2 for each specimen, other than
3B-10-U-200T, which experienced only localized yielding. This point was
determined by analyzing the strain field on the surface of the plate, found using
the strain cameras. The yield line was always in the same location: along the
vertical bolt line closest to the weld. Data could not be extracted for test
3B-13-U-200C as the image files were not recorded properly and could not be
analyzed.
Table 4-2: Vertical load (kN) causing yielding through the plate depth
Axial Load (kN)
Specimen Group 200T 0 200C 300C2B-10-U - 160 127 - 2B-13-U - - 124 - 3B-10-U N/A 311 302 273 3B-13-U - - N/A - 5B-10-U 569 670* - 615 5B-13-U - - - 595*
*Occurred after peak load
4.2.1.5 Bolt Bearing
Varying degrees of bolt bearing deformation were observed on all unstiffened
specimens. This was not a critical failure mode for any specimen, but rather
contributed to the overall ductility of the connections. In Figure 4-4, permanent
bearing deformations around the bolt holes can be seen, especially around bolt
number 1 which had the maximum deformation of all specimens, 8.6 mm. The
other specimens tested without axial load also exhibited higher than average
maximum bolt hole deformations. In contrast, the specimens with a 13 mm plate
experienced less than one millimeter of deformation.

59
4.2.1.6 Out-of-Plane Deformation
Out-of-plane deformation was not a common failure mode for the unstiffened
extended shear tabs tested. In previous testing programs, Moore and Owens
(1992) and Sherman and Ghorbanpoor (2002) observed plate twisting. However,
because the beams were braced next to the connection, plate twisting did not
occur in this testing program. Specimen 5B-10-U-300C exhibited plastic
out-of-plane deformation, indicative of the onset of plate buckling failure, not
twisting.
4.2.2 Vertical Load–Deformation Curves
The behaviour of the 13 unstiffened extended shear tabs can be explained by
breaking the vertical load�–vertical deformation graphs into three zones, A, B, and
C, delineated by the critical and secondary failure modes. A typical vertical load�–
deformation curve for specimen 3B-10-U-0 is given in Figure 4-5. The
displacement is that of the bolt group centroid on the beam.
Figure 4-5: Load�–deformation behaviour of specimen 3B-10-U-0
0
50
100
150
200
250
300
350
0 10 20 30 40 50
Verti
cal L
oad
(kN
)
Vertical Deformation (mm)
Zone A Zone B Zone C
Crit
ical
Fai
lure
Mod
e
Seco
ndar
y Fa
ilure
Mod
e
Con
tinue
dFa
ilure
GSY WR
BF
BF

60
In zone A, the 0.03 radian beam rotation is imposed, horizontal load is then
applied (if required), and the vertical load is applied subsequently. During the
beam rotation and application of horizontal load, a small amount of deformation
was recorded, approximately 2 mm in Figure 4-5. In this zone, stiffness changes
occurred as the connection elements began to yield, primarily the column web.
The deformation continued while the vertical load increased until, in most cases,
the plate yielded through its depth causing the linear portion of the graph to end.
Zone A finishes at the critical failure mode, where the vertical load begins to
decrease after the peak value. When weld rupture was the critical failure mode,
the load decreased gradually, as shown in Figure 4-5. The vertical load tended to
drop more suddenly when bolts fractured.
After initial failure occurred, load redistribution began in Zone B. The vertical
load either continued to decrease gradually as the weld rupture propagated, as
shown in Figure 4-5, or remained relatively constant until secondary failure
occurred. The deformation between the critical and secondary failure modes
varied considerably.
In zone C, the vertical load continued to drop while the bolts progressively failed
and/or weld rupture propagated. Again, the number and extent of the load drops in
this zone varied. During the 3B-10-U-0 test, two bolts failed, shown as the
secondary failure mode and continued failure points in Figure 4-5. The vertical
load�–deformation graph for each unstiffened extended shear tab is given in
Appendix B.
4.2.3 Effects of Key Variables
Of the 13 unstiffened shear tab specimens, four had two horizontal bolt lines, five
specimens had three, and four specimens had five. In each of these groups, one of
the specimens had a 13 mm plate, while the rest were 10 mm thick. The
specimens were also tested under a variety of horizontal loads, as discussed in
Chapter 3. General observations about the effects of these three key variables are
discussed below. It must be kept in mind that these results are influenced by the

61
hierarchy of failure modes experienced by the specimens, so any design changes
that alter the failure sequence, such as a thicker column web or a larger weld or
bolts, may affect these observations.
4.2.3.1 Number of horizontal bolt lines
As the number of horizontal bolt lines and, therefore, the plate depth increased,
the strength of the connection also increased, as expected. However, as Figure 4-6
shows, the load plateau occurs at similar deformations. This is consistent for all
specimens that varied only by connection depth. The critical failure mode also
correlates with plate depth. All the two bolt line tests failed due to bolt fracture,
whereas weld tearing was critical in some of the deeper connections.
Figure 4-6: Effect of number of horizontal bolt lines on connection behaviour
4.2.3.2 Plate Thickness
The test matrix permits a comparison of three pairs of specimens wherein only the
plate thickness is varied. Increasing the thickness of the plate caused a decrease in
the peak vertical load observed during testing in all cases. The peak vertical loads
0
100
200
300
400
500
600
700
800
0 10 20 30 40 50 60 70
Verti
cal L
oad
(kN
)
Vertical Deformation (mm)
5B-10-U-0
3B-10-U-0
2B-10-U-0

62
were lower for the thicker plate by 13%, 22%, and 16% for the two, three, and
five horizontal bolt line connections, respectively. Although these results may
seem counter-intuitive, the connection�’s stiffness was increased by increasing the
plate thickness, in turn reducing plate deformation and increasing the demands on
the weld and the bolt group. In addition to the increased demand on the bolt
group, the shear plane through the bolts of specimens with the thicker plate was
closer to the minimum diameter in the threads, resulting in a 10% lower bolt
strength (see Chapter 3). Because bolt fracture was the critical failure mode for
these three pairs of connections, failure occurred at lower loads when the 13 mm
plate was used in lieu of the 10 mm plate. While the increased demand from the
13 mm plates did not result in weld failure in any of these cases, the specimens
were all subjected to significant compressive load. Weld failure instead of bolt
failure may be critical for cases with a smaller compressive or a tensile load.
4.2.3.3 Horizontal Load
Figure 4-7 shows the results of the 5B-10-U, 3B-10-U, and 2B-10-U tests. A
negative horizontal load indicates the specimen was subjected to compression. As
this figure shows, adding horizontal load tended to reduce the shear capacity of
the connections; the reduction was more pronounced for deeper connections and
for tensile loads.
Figure 4-7: Effect of horizontal load on connection capacity
0
200
400
600
800
-300 -200 -100 0 100 200
Verti
cal L
oad
(kN
)
Horizontal Load (kN)
5B-10-U3B-10-U2B-10-U

63
The capacities of the unstiffened connections, shown in Figure 4-7, were reduced
due to the addition of horizontal load by a maximum of 29 kN (15%), 60 kN
(18%), and 150 kN (20%) for the two, three and five horizontal bolt line
connections, respectively. In the case of the 3B-10-U specimens, the addition of
200 kN of compression actually increased the shear capacity of the connection by
9 kN, but when 300 kN was applied the capacity was reduced. This result
indicates that there may be a limiting value of compression below which the shear
capacity of the connection is not affected. In contrast, the addition of tension
caused the largest decreases in peak vertical load because more demand was
placed on the tension side of the weld.
4.3 Current Design Procedures
Four design procedures have been used to calculate the shear strengths of the
unstiffened extended shear tab specimens. In all cases, the resistance factor was
omitted and measured material strengths were used. The design procedures given
by SCI/BCSA (2002) and AISC (2011), as discussed in Chapter 2, were used to
calculate strengths of the unstiffened specimens tested without horizontal load,
since these two procedures do not include provisions for axial load. The strengths
of the specimens, including those tested under horizontal tension or compression,
were also calculated using the guidelines presented by Tamboli (2010). Finally,
the measured material properties and bolt strengths were used to recalculate
specimen capacities using the Fabricator�’s procedure. The resulting strengths
from these four design procedures are compared to the peak vertical loads
observed during testing in Table 4-3.
The specimens did not meet all of the requirements given by SCI/BCSA (2002).
First, the 6 mm weld does not meet the basic requirement of 80% of the plate
thickness. This would require the welds to be 8 mm and 10 mm for the 10 mm
and 13 mm plates respectively. SCI/BCSA also limits the plate thickness to 42%
of the bolt diameter, and both plate sizes exceed the 8 mm maximum thickness for

64
19 mm bolts. Finally, the end distance must be at least double the bolt diameter,
or 38 mm, rather than the 35 mm specified for the test specimens.
Table 4-3: Comparison of design procedures and experimental capacities
Specimen ID
Test
Capacity
(kN)
SCI/BCSA
Capacity*
(kN)
AISC
Capacity
(kN)
Tamboli
Capacity
(kN)
Fabricator
Capacity
(kN)
2B-10-U-0 188 70 60 105 87
2B-10-U-00 197 70 60 105 87
2B-10-U-200C 159 - - 66 72
2B-13-U-200C 138 - - 94 95
3B-10-U-0 330 149 119 239 197
3B-10-U-200C 339 - - 180 182
3B-10-U-300C 278 - - 149 163
3B-10-U-200T 270 - - 186 182
3B-13-U-200C 263 - - 211 222
5B-10-U-0 762 394 202 493 513
5B-10-U-300C 732 - - 431 496
5B-10-U-200T 612 - - 475 505
5B-13-U-300C 613 - - 505 534 *Minimum weld size not met and plate thickness limit exceeded
Although all of the peak shears are under-predicted substantially by all four
design procedures, the trends observed during testing are mimicked. That is, the
strength increases with the number of horizontal bolt lines and, for those that
include horizontal load, the strength decreases as the horizontal load increases.
However, the reduction in load capacity due to an increase in plate thickness
observed in the tests is not reflected, even though the difference in the bolt shear
capacities is accounted for, as the design procedures are predicated on preventing
weld and bolt failure from occurring, and it is the increased demand on these
elements from the thicker plates that caused this phenomenon.
In Table 4-4, the calculated strengths given in Table 4-3 are presented as a
fraction of the peak vertical load obtained from the test to evaluate the ability of
the design procedures to predict the connection capacity. As the table shows, the
Fabricator’s procedure and that proposed by Tamboli (2010) are the most accurate
overall. However, even these methods significantly underestimated the capacities.

65
Though less accurate, the ability of the method proposed by the SCI/BSCA (2002)
to predict the strength also increases slightly with connection depth. The extended
configuration design procedure given by AISC (2011) predicts a capacity of less
than 40% of the peak shear observed during testing in all cases.
Table 4-4: Test-to-predicted strength ratios
Specimen I.D. SCI/BCSA Capacity
AISC Capacity
Tamboli Capacity
Fabricator Capacity
2B-10-U-0 0.37 0.32 0.56 0.46 2B-10-U-00 0.36 0.30 0.53 0.44 2B-10-U-200C - - 0.42 0.45 2B-13-U-200C - - 0.68 0.69 3B-10-U-0 0.45 0.36 0.72 0.60 3B-10-U-200C - - 0.53 0.54 3B-10-U-300C - - 0.54 0.59 3B-10-U-200T - - 0.69 0.67 3B-13-U-200C - - 0.80 0.84 5B-10-U-0 0.52 0.26 0.65 0.67 5B-10-U-300C - - 0.59 0.68 5B-10-U-200T - - 0.78 0.83 5B-13-U-300C - - 0.82 0.87
Average 0.43 0.31 0.64 0.64
The design procedures not only under-predict connection capacity, but also
incorrectly identify the failure mode in most cases. Table 4-5 gives the governing
failure modes predicted for each specimen by each design method, as well as the
critical failure mode observed from testing. If the failure mode is properly
identified, it is shown in bold text. While gross section yielding is not considered
to be the critical failure mode in the tests because it did not cause the vertical load
to decrease, it did occur prior to the critical mode in most cases. Therefore, if this
is correctly reflected by the design procedure, the failure mode is indicated in the
table as being properly identified. However, when gross section yielding is the
predicted failure mode, the capacities are always significantly underestimated
suggesting that, though widely accepted, this failure mode may not be an
appropriate ultimate limit state for extended shear tab design. From Tables 4-4

66
and 4-5, it is apparent that the calculated capacities have often been restricted by
failure modes that did not ultimately cause the specimens to fail.
Table 4-5: Comparison of observed and predicted critical failure modes
Specimen I.D. Critical Failure Mode
SCI/BCSA Failure Mode
AISC Failure Mode
Tamboli Failure Mode
Fabricator�’s Failure Mode
2B-10-U-0 BF GSY OPD GSY GSY 2B-10-U-00 BF GSY OPD GSY GSY 2B-10-U-200C BF - - NSF NSF 2B-13-U-200C BF - - NSF NSF 3B-10-U-0 WR GSY OPD NSF GSY 3B-10-U-200C WR - - NSF NSF 3B-10-U-300C BF - - NSF NSF 3B-10-U-200T WR - - NSF NSF 3B-13-U-200C BF - - BF BF 5B-10-U-0 CWT OPD OPD NSF GSY 5B-10-U-300C BF - - NSF NSF 5B-10-U-200T WR - - NSF GSY 5B-13-U-300C BF - - BF BF The SCI/BCSA method and the AISC extended configuration method can only be
applied to connections without horizontal load. For these four cases, gross section
yielding was identified by the SCI/BCSA method as the failure mode for three,
and out-of-plane deformation due to lateral-torsional buckling was predicted for
the five horizontal bolt line specimen. The AISC method predicts out-of-plane
deformation as the critical failure mode for all four specimens. For the two
horizontal bolt line specimen, plate buckling limited the predicted capacity,
whereas lateral-torsional buckling was critical (based on the check of the need for
stiffeners) for the specimens with three and five horizontal bolt lines. Neither
mode was observed in these tests.
The Tamboli (2010) method identified the failure mode correctly in four cases,
two of which were bolt fracture and matched the critical mode observed at the
peak load. To design the bolts, this procedure uses the eccentrically loaded bolt

67
group tables given in Part 7 of the AISC Manual (2011). The horizontal and
vertical loads are combined into an inclined resultant force with an eccentricity
equal to the geometric eccentricity. This method does not take advantage of the
full bolt group capacity and is highly dependent on the angle of the inclined load.
The strengths of other specimens determined by this design procedure were
limited by the plate net section fracture check, which was not observed in the
tests.
The Fabricator’s procedure correctly identified the failure mode for six
specimens, including two that failed due to bolt fracture. To determine the
capacity of the bolt group, the full geometric eccentricity is used with the
instantaneous centre of rotation method described in Chapter 2. However, the
calculated strength is considerably lower than the tested capacity, implying that
only a portion of the eccentricity need be considered. In several other cases the
calculated strengths were limited by net section fracture.
4.4 Design Recommendations
New design recommendations for unstiffened extended shear tabs under loading
conditions that can include axial force are proposed in this section. These
recommendations are based on both the current AISC guidelines for single plate
connections with an extended configuration (AISC 2011) and the design
procedure used by the Fabricator. The procedure addresses both strength and
ductility considerations. The strengths of the bolt group, column web, and plate
are considered, whereas ductility is ensured by specifying a minimum weld size
and both minimum and maximum plate thicknesses. Axial compression or
tension, if present, is addressed explicitly in each section. Methods for
determining block shear and bolt bearing capacities are not included in the
discussions that follow as failures of these types were not observed during testing.
However, these limit states must be checked during design.

68
4.4.1 Bolt Group Capacity
4.4.1.1 Instantaneous Centre of Rotation Method
The first step in the design of unstiffened extended shear tabs is to size the bolt
group to resist the applied shear and axial loads. Because the load is eccentrically
applied, the instantaneous centre of rotation method is used to calculate the bolt
group shear capacity, VBG. A detailed description of this method is given in
Chapter 2.
In the AISC Manual�’s design procedure for extended single plate connections, the
use of Tables 7-6 to 7-13 (AISC 2011), which give coefficients, C, for specific
joint configurations, is recommended; these tables also have the instantaneous
centre of rotation method as their basis. For configurations not covered by these
tables, an iterative procedure is needed that can be facilitated by the use of a
spreadsheet. Therefore, the proposed method is consistent with the AISC design
procedures and is also used by the Fabricator.
4.4.1.2 Effective Eccentricity
The effective eccentricity, eeff, used to determine the bolt group capacity has a
substantial impact on the resulting strength. Both the AISC and Fabricator�’s
procedures use the geometric eccentricity, but when this value is used the
predicted shear capacity of the bolt group is lower than the capacities of the
specimens tested. However, ignoring the eccentricity over-predicts the capacity
significantly. Therefore, only a fraction of the total eccentricity need be
considered for this calculation, implying the existence of an inflection point in the
plate somewhere between the weld line and the centroid of the bolt group.
Using the tested capacities, the effective eccentricity was determined by
calculating the eccentricity that would cause bolt group failure at the peak shear
recorded during testing for each specimen that failed due to bolt fracture. To
provide accurate input for the instantaneous centre of rotation calculations, the
experimentally-determined shear strengths of bolts from the same lot as those

69
used in the connection tests, described in Chapter 3, are used rather than nominal
values. However, the maximum bolt deformation, 8.64 mm, given by Crawford
and Kulak (1971) was used to define the individual bolt response. Table 4-6 gives
the effective eccentricities as a proportion of the geometric eccentricity. The
average effective eccentricity is 75.9% of the geometric eccentricity, with a
standard deviation of 6.2%.
Unless a more accurate value can be determined, an effective eccentricity equal to
75% of the geometric eccentricity is recommended for design, and this value is
used in Section 4.4.6 to determine the capacities of the bolt groups in all
specimens. Because the column web was thin, this effective eccentricity is
considered conservative for bolt group design since the observed column web
rotations where higher than what should typically be permitted in practice.
Table 4-6: Effective eccentricities of test specimens failing in bolt fracture
Axial Load (kN) Specimen Group 0 00 200C 300C
2B-10-U 0.695 0.658 0.734 - 2B-13-U - - 0.745 - 3B-10-U - - - 0.8233B-13-U - - 0.812 - 5B-10-U - - - 0.7725B-13-U - - - 0.832
4.4.2 Plate Thickness
For an extended shear tab connection, the desired failure mode is plate yielding.
In other words, the plate must be strong enough to resist the applied loads, but
also have proportions that ensure a ductile failure mode. This involves creating a
fuse that precludes any potential for failure of the bolt group or the weld, or lateral
buckling of the plate itself. Assuming an efficient connection design, it is
recommended that the ductility checks be satisfied even if all components of the
connection have sufficient strength to resist the applied loads. This allows for
variations of the load-carrying mechanism from that assumed in the design

70
procedure, while still ensuring ductile behaviour and the ability of the joint to
rotate in a way consistent with the assumption of a simple beam support. For that
reason, design provisions for both a maximum and a minimum plate thickness are
proposed. The maximum plate thickness defined in the next section is to prevent
premature failure of the bolt group; design of the weld for both strength and
connection ductility is discussed in Section 4.4.4. The minimum plate thickness is
to ensure that lateral�–torsional buckling of the plate is not the governing failure
mode.
4.4.2.1 Maximum Plate Thickness
To ensure the connection has sufficient ductility, plate yielding must occur prior
to bolt failure. Using this requirement, the maximum plate thickness, tmax, is
determined by equating the yield moment of the plate, reduced to account for the
effects of any coexisting axial force, with the moment capacity of the bolt group
and solving for plate thickness:
4-1 tmax = 6 bM
BG
RyFydp2 +
NRyFydp
where b is the bolt resistance factor, Fy is the nominal yield stress, dp is the depth
of the plate, N is the nominal axial load, taken as positive for both tension and
compression, and Ry is discussed below. The moment capacity of the bolt group,
MBG, is found by multiplying the shear capacity of the bolt group by the effective
eccentricity of the load, taken equal to 75% of the geometric eccentricity, as
follows:
4-2 MBG = BGeeff
The first term in Equation 4-1 is similar to the maximum plate thickness equation
given by AISC (2011) and used by the Fabricator. However, in those design
procedures, the moment-only capacity of the bolt group is used. In other words,
eccentricity of the shear load is not taken into account and the bolt group moment
capacity is therefore over-estimated, resulting in a non-conservative maximum

71
plate thickness. These methods also use the nominal bolt group moment capacity
in calculating tmax. However, because bolt fracture is an undesirable failure mode
leading to non-ductile connection behaviour, it should be calculated based on the
reliable bolt capacity and, therefore, the factored moment capacity of the bolt
group is utilized in Equation 4-1.
The second term in Equation 4-1 has been added to allow for an increase in
maximum plate thickness if axial load is present because the plate will yield when
subjected to a lower shear force. However, this increase should only be taken into
account if the axial load is a constant load, such as that due to permanent
equipment, or is a load fundamentally linked to the applied shear load, as would
be the case for an inclined design load that imposes both axial and shear forces on
the connection concurrently. In other words, a transient or cyclical axial load
should be neglected when applying Equation 4-1 to ensure a ductile failure mode.
In general, the inclusion or exclusion of axial load should be consistent in the
determination of MBG and the use or omission of the second term in Equation 4-1.
The yield stress used in Equation 4-1 significantly impacts the maximum plate
thickness obtained. If the nominal value is used, the actual maximum plate
thickness required to ensure ductile failure may be less than that calculated, since
actual yield strengths are nearly always greater than the nominal. This is
especially important for connection plates designed with a nominal yield strength
of 300 MPa or lower because in many cases plate material will be used that is
dual-certified and has an actual yield strength exceeding 350 MPa. To account for
this in seismic design, the nominal yield stress is increased by the factor Ry to
obtain a probable yield stress whenever design loads are defined in accordance
with capacity design principles (CSA 2009). For structural plate, Ry is typically
taken as 1.1, but with a minimum value of 385 MPa for RyFy. This design
philosophy has been adopted for calculating the maximum thickness to ensure
ductile connection behaviour, as shown in Equation 4-1.

72
It is worth noting that while shear is present in the plate in addition to moment
and, potentially, axial force, its influence on the onset of yielding is neglected in
Equation 4-1. This is a reasonable and conservative approximation to the true
behaviour, although yielding is expected to be somewhat more extensive on the
critical section of the plate than at the extreme fibre only, as is implied by
Equation 4-1.
As discussed in Chapter 2, the AISC Manual (AISC 2011) allows the connection
plate to exceed the maximum thickness requirement if certain geometric
conditions are met by the plate and/or beam web, depending on the number of
vertical bolt lines. Because the test specimens did not meet these conditions, they
are not included as an exception for Equation 4-1.
4.4.2.2 Minimum Plate Thickness
Because extended shear tab plates are slender, out-of-plane deformation, or
buckling, could occur. To preclude this type of failure and ensure a ductile failure
mode, a minimum plate thickness is established. A minimum plate thickness
required to ensure a ductile failure mode is not given by AISC (2011); rather, a
check for plate lateral�–torsional buckling under the design loads is carried out to
determine the need for stabilizer plates. However, by meeting the proposed
ductility limit, stability of the plate need not be considered under the design loads
and stabilizer plates are not required. Implementing a minimum plate thickness
requirement could increase the required plate thickness compared to that required
by AISC in some cases. However, the improved connection behaviour in the
event of an overload�—or a variation in the load-carrying mechanism�—achieved
by forcing a ductile failure mode outweighs the nominal increase in cost of using
a thicker plate. The Fabricator uses a method similar to that proposed below.
As discussed in Chapter 2, the critical moment causing lateral�–torsional buckling
of an extended shear tab, Mcr, can be approximated as:

73
4-3 Mcr = 2 EIyGJ
in which 2 is a coefficient to account for the moment gradient along the length of
the plate, L is the clear span of the plate, from the weld to the first vertical bolt
line, and E is the modulus of elasticity. The moment of inertia of the plate for
out-of-plane bending, Iy, is:
4-4 Iy =dptp3
12
where tp is the plate thickness. The elastic shear modulus, G, is:
4-5 G =E
2.6
and J is the St. Venant torsional constant of the plate:
4-6 J =dptp3
3= 4Iy
By substituting Equations 4-4 through 4-6 into Equation 4-3, the equation for the
critical moment becomes:
Equating Equation 4-7 with the plastic moment capacity of the plate, Mp, given in
Equation 4-8, a relationship for the minimum plate thickness, tmin, is found:
Although the yield moment was used to derive the maximum plate thickness
ductility requirement, the plastic moment capacity has been used to derive
Equation 4-9 for two reasons: consistency and simplicity. First, an actual yield
4-7 Mcr =0.325 2Edptp3
4-8 Mp =Fytpdp
2
4
4-9 tmin = 0.877Fydp
2E

74
stress higher than the nominal value would cause the plate to yield at a higher
load, and variability in the buckling capacity of the plate could cause the critical
moment to be lower than calculated. The use of the plastic moment instead of the
yield moment conservatively takes the net effect of these probabilistic issues into
account without the need to introduce the probable yield stress or a resistance
factor. Second, although the presence of shear was ignored in the derivation of
Equation 4-9 for simplicity, the shear force would accelerate not only plate
yielding, but also lateral�–torsional buckling. However, accounting for the shear�–
moment interaction on both sides of the equation would result in a much more
complex equation for minimum thickness. Therefore, any potential increase in
minimum thickness due to the presence of shear is accounted for indirectly by
using the plastic moment capacity. A similar argument can be made for the
presence of axial load, if any. However, if a large axial load is applied compared
to the shear force, engineering judgement should be exercised in determining the
minimum plate thickness and a column-type strength check may be appropriate.
To apply Equation 4-9, the moment distribution along the plate must be estimated.
For linear moment distributions, the coefficient, 2, is:
according to S16 (CSA 2009), in which is the ratio of the smaller end moment
to the larger, taken positive for double curvature and negative for single curvature.
Thornton and Fortney (2011) conservatively assumed a constant moment along
the length of the plate to derive the stabilizer plate requirement in the AISC
Manual (2011), resulting in a value of 2 equal to 1.0. However, due to the
deformed shape of the test specimens, it is apparent that the plates are in double
curvature. Although a moment gradient consistent with the actual location of the
inflection point, given approximately in Table 4-6, might seem appropriate for
consistency, because the actual gradient is uncertain, the moment at the column
web is conservatively assumed to be zero for this check, resulting in an 2 value
of 1.75. Equation 4-9 then becomes:
4-10 2 = 1.75 + 1.05 + 0.3 2 2.5

75
4.4.3 Column Web Capacity
The column web capacity is checked against the applied axial and shear loads
separately using classical yield line theory. For the axial capacity, the web
capacity equation is based on the failure geometry proposed by Kapp (1974), as
discussed in Chapter 2. However, the thickness of the plate is conservatively
neglected to simplify the equation:
4-12 NCW= 2Fy w2 dp
T+2
where the yield stress, Fyc, is that of the column web, w is the thickness of the
column web, and T is the clear distance between column web-to-flange fillets, as
tabulated for W-shapes in the CISC Handbook (CISC 2010). The assumed failure
geometry defined by this equation is shown in Figure 4-8. Note that the direction
of the web deformation depends on whether axial tension or compression is
applied.
T
T/2
dpT/
2
Plate
Column Web
Yield Line
Deformed Web
Plate
Web Yield Line Geometry1
2
Deformation of Column Web2 Deformation of Column WebSection
Figure 4-8: Column web yield line geometry under axial load
4-11 tmin = 0.663Fydp
E

76
The proposed capacity equation for yielding of the column web under an eccentric
shear load originates from a yield line analysis by Abolitz and Warner (1965), as
suggested by Sherman and Ghorbanpoor (2002) and discussed in Chapter 2.
Assuming the column web capacity is limited by the formation of a flexural yield
mechanism, the shear capacity of the column web, VCW, is:
4-13 VCW=Fy w2dp
0.5eg
T2dp
+dp
T+ 3
where the eccentricity is half of the geometric eccentricity. This eccentricity has
been chosen rather than that corresponding to the effective eccentricity discussed
in Section 4.4.1.2 to represent the likely location of inflection prior to any
deformation of the column web. Once the column web begins to deform and,
therefore, its stiffness decreases, the inflection point begins to migrate toward the
column web, which resulted in an eccentricity from the column web of 25% of the
geometric eccentricity at the ultimate load during the tests. Because this
deformation should be minimized, the approximate initial condition is used. The
assumed failure geometry is shown in Figure 4-9, where u is:
4-14 u = T6
3
T/2 T/2
uu
dp/2
dp/2
uu
Plate
Column Web
Yield Line
Initial Weld Fracture
Deformed Web
Plate
Web Yield Line Geometry1
2
Deformation of Column Web2 Deformation of Column WebSection
Figure 4-9: Column web yield line geometry under eccentric shear

77
Although Equation 4-13 results in a strength that is lower than the ultimate
strength of the column web, as the potential for the development of membrane
action is neglected, it is included as a limit state to avoid excessive rotation of the
flexible support. During the tests, deformation of the column web likely
contributed to some degree of weld rupture, even if only at the weld tip, in 12 of
the 13 specimens. However, the tested unstiffened extended shear tabs were
supported by a 10.9 mm web and as the column web thickness increases this limit
state becomes less of a concern. Figure 4-10 shows the effect of increasing the
column web thickness on the column web shear capacity for the shear tab depths
tested. Especially for the deeper shear tabs, increasing the column web thickness
results in a rapid increase in capacity. While the same result could be
accomplished by adding stiffeners, selecting an appropriate column section to
avoid excessive web distortion would in most cases be a more economical
solution unless stiffeners are already required for another purpose.
Figure 4-10: Effect of column web thickness on flexural yield mechanism
capacity
Although column web rotation has been identified as a failure mode in previous
research programs (Sherman and Ghorbanpoor 2002; Moore and Owens 1992)
0200400600800
10001200140016001800
10 15 20
Col
umn
Web
Cap
acity
(kN
)
Column Web Thickness (mm)
5B3B2B
78
and excessive yielding and deformation of the column web was noted when the
column web was flexible (Moore and Owens 1992), column web yielding has not
been incorporated as a limit state in any current design guidelines. However,
basing the axial and eccentric shear capacities of the column web on Equations
4-12 and 4-13, respectively, is recommended not only to limit the deformation,
but also to avoid initiating rupture at the tip of the weld. Nevertheless, the
nominal material strength is used in these equations for design to reflect the fact
that small column web deformations do not represent an ultimate limit state for
the connection.
4.4.4 Weld Design
To ensure ductile failure, the column-to-plate weld should be sized such that the
plate will yield prior to rupture of the weld. To determine the weld size, D, that is
required to develop the capacity of the plate, the weld capacity equation, given in
Chapter 2, is equated to the plate capacity. Because extended shear tabs can be
subjected to shear, moment, and/or axial load, three load cases were investigated.
For shear, the plate capacity was taken as:
4-15 VGS = 0.66RyFytpdp
resulting in a minimum weld size of:
4-16 D 0.697RyFytp
wXu
where Xu is the ultimate strength of the weld, w is the weld�’s resistance factor
and Ry is included for the same reasons as those described in Section 4.4.2.1 for
the maximum plate thickness. Solving for the weld size based on the gross tensile
and plastic moment capacity of the plate both result in the limit:
4-17 D 0.704RyFytp
wXu
Because Equations 4-16 and 4-17 differ by only 1%, that derived for
axial/moment is conservatively adopted for all cases. Substituting 0.67 into

79
Equation 4-17 for the weld�’s resistance factor (CSA 2009) and 1.1 for Ry, the
minimum weld size becomes:
4-18 D 1.155Fy
Xutp
The AISC Manual (2011) follows a similar approach as that outlined above,
resulting in a minimum weld size of five-eighths of the plate thickness. However,
rather than consider the forces individually, the interaction of moment and shear is
taken into consideration. Muir and Hewitt (2009) derived this limit assuming the
weld�’s rupture strength to be 2 3 Xu and its shear strength to be 2Xu 3. The
resulting equation for weld size is simplified by assuming a yield stress of 50 ksi
and an ultimate weld strength of 70 ksi. Because the resistance factor has been
included to account for the large variability in weld strength and the probable
yield stress has been included in lieu of the nominal, Equation 4-18 results in a
larger weld size than the AISC method. Nevertheless, these factors are needed to
ensure that the intended connection ductility is achieved. It should be noted that
the resistance factor used to obtain Equation 4-18 has been shown in previous
research to provide reliability indices for fillet welds in lap joints that are well in
excess of 4.0 (Ng et al. 2002; Deng et al. 2006). If reliability studies justify the
use of a larger resistance factor for this application, it should be incorporated into
the equation.
The approach of sizing the weld so that it will not rupture before the plate yields
is different from that used by the Fabricator and, therefore, the method used to
design the test specimens. The welds were designed to resist the shear force only,
neglecting the eccentricity, since the full geometric eccentricity was used to
design the bolt group. However, some degree of weld rupture was evident on all
unstiffened extended shear tab specimens. For this reason, the design philosophy
that forms the basis of Equation 4-18 is adopted.

80
4.4.5 Plate Design
The extended shear tab plate must meet not only the maximum and minimum
thickness requirements, but also the strength requirements for the applied factored
axial force, shear force and moment. As long as the plate thickness is greater than
the minimum value, the lateral stability of the plate need not be considered.
The shear resistance is taken as the lesser of the gross section shear capacity:
4-19 VGS = 0.66Fytpdp
and the net section shear capacity:
4-20 VNS = 0.6uFutp dp - nhdbh
in which n is the number of bolts per vertical line and dbh is the bolt hole diameter.
If the shear stress, τ, exceeds 50% of the factored yield strength, Fy, the
interaction of shear and normal stress needs to be taken into consideration, and the
maximum permissible factored normal stress, σn, can conservatively be
approximated as (CSA 2014):
4-21 σn = min Fy, 6.25 0.66Fy - τ
where the shear stress, τ, is the factored applied shear force divided by the gross
cross-sectional area of the plate.
The flexural capacity of the plate is expressed as the shear force that would cause
the plate to reach its plastic moment capacity in the presence of the axial force, if
any. Using the factored normal stress capacity from Equation 4-21, the factored
shear capacity, VMN, is calculated based on the clear span effective eccentricity,
eeff-cs. This eccentricity is found by subtracting the distance from the bolt group
centroid to the first vertical line of bolts from the effective eccentricity given in
Section 4.4.1.2:

81
4-22 V = ntpdp2
4eeff-cs-
NF2
4 ntpeeff-cs
Although the AISC Manual (2011) requires that the plate be checked for
torsion�—due to the small out-of-plane eccentricity arising from the lapped
connection with the beam web�—and block shear, these failure modes were not
observed in the tests and, therefore, are not included in these design
recommendations. However, there may be situations in which these failure modes
govern.
4.4.6 Comparison of Test Results to Design Recommendations
The design recommendations made in the previous sections have been applied to
the unstiffened test specimens. A summary of the ductility requirements is given
in Table 4-7 and the shear strength calculations are located in Table 4-8. The axial
capacities of the column web for the two, three, and five horizontal bolt line
specimens were 242 kN, 273 kN, and 336 kN, respectively. Although the 273 kN
value was exceeded in the 3B-10-U-300C test and the column web did not fail,
this limit is still required to preclude excessive column web deformation.
The maximum plate thickness recommendation was met for all 13 specimens, and
the minimum thickness requirement was met with the exception of the 5B-10-U
specimen group, where the limit was violated by only 0.3 mm. As out-of-plane
deformation was not the critical failure mode for any of the unstiffened
specimens, the actual plate thicknesses of the six unstiffened specimen geometries
should meet or exceed the minimum thickness. Because a small amount of
out-of-plane deformation was observed after testing the 5B-10-U-300C specimen
and the limit is only exceeded by 0.3 mm, the test results appear consistent with
the proposed limit.
Because the procedure used to design the test specimens ignores the shear force
eccentricity and tensile forces when calculating the weld capacity, the weld size
required by the proposed equation exceeds the actual weld size in all cases.

82
According to the proposed criteria, the welds are undersized by 3.3 mm and
5.4 mm for the 9.5 mm and 12.7 mm plates, respectively, although the ten
specimens with a 9.5 mm thick plate had welds equal to the AISC (2011)
minimum permissible size. Because the welds were undersized, it is not surprising
that some degree of weld rupture was evident on all but one specimen.
The connection shear capacities, calculated using measured strengths for the bolts
and shear tab plates given in Chapter 3, for the various limit states are given in
Table 4-8. As this table shows, the capacities of the three and five horizontal bolt
line specimens would have been limited by the column web capacity. However,
this requirement is included to prevent excessive support deformation and does
not reflect the actual connection strength. Also, if a larger column had been used,
the column web capacity would not limit the overall connection capacity.
Therefore, this limit state has been ignored when evaluating the test-to-predicted
capacity ratios in Table 4-8. Based on the recommended design equations, the
predicted critical failure mode was bolt fracture for all of the specimens excluding
the 2B-10-U specimen group. This correlates well with the test results, since bolt
fracture occurred during all but one test in which the weld ruptured entirely and, if
the welds hadn�’t been undersized, would have likely been the critical failure mode
for each specimen. The 2B-10-U group of specimens underwent the most plate
deformation; therefore, predicting plate failure due to the combination of flexure
and axial force for this specimen group mimics the observed behaviour.
The average test-to-predicted capacity ratio is 1.02, with a coefficient of variation
equal to 0.154. The ratio for the 2B-10-U specimen group is high because the
calculated capacities are limited by the plate strength, not the bolt group as was
observed during testing. Because the average effective eccentricity was used to
determine the bolt group capacities, some of the calculated specimen capacities
differ from the corresponding test values even though bolt failure was predicted to
be the governing limit state. However, the test-to-predicted ratios for these
specimens are within 8% of unity, other than those tested with a tensile force.

83
Specimens 3B-10-U-200T and 5B-10-U-200T have the smallest test-to-predicted
ratios at 0.85 and 0.80, respectively. These specimens failed due to weld rupture
resulting from an undersized weld, as well as a stress concentration at the tension
tip of the weld. Given that the welds were undersized, if they had been
proportioned as proposed in Section 4.4.4, bolt fracture would have likely been
the critical failure mode, as was the case for most of the specimens, and the test-
to-predicted ratios would be increased. These specimens were also more sensitive
to column web deformation, because the applied tension increased the tensile
stress concentration at the tip of the weld resulting from bending of the column
web. As a result of the small weld size and increased tensile stress, specimen
3B-10-U-200T did not experience gross section yielding at all.
All connections with 13 mm plates exhibited lower test-to-predicted ratios than
their thinner counterparts with the same depth and axial force, as well as less
ductile behaviour, and specimens 3B-13-U-200C and 5B-13-U-300C both had
ratios lower than unity. The ductility was not only limited by negligible bolt
bearing deformation, but also by gross section yielding, which occurred after the
peak load for specimen 5B-13-U-300C (for 3B-13-U-200C this point could not be
determined). Although the maximum plate thickness requirement is based on the
plate reaching its yield moment, rather than its full plastic moment, these
observations imply that more a more stringent limit may be warranted. However,
since significant rotations at the column web occurred, which increases the
effective eccentricity of the shear force on the bolt group and would have been
prevented had the associated proposed design requirement been met, changes to
the maximum thickness equation could not be justified without more information.
The only other specimen with a low test-to-predicted strength ratio was
3B-10-U-300C. The calculated effective eccentricity of this connection given in
Table 4-6 was high, likely because both the recommended axial and shear column
web capacities were exceeded. It is believed that had the recommended weld size

84
and column web thickness requirements been met, the test-to-predicted ratios
would have been acceptable for all of the specimens.
The test-to-predicted ratios are shown graphically in Figure 4-11. If the data point
is above the diagonal line, the design recommendations are conservative. The
connections subjected to tension are identified by the grey data points and are the
farthest from the diagonal line.
Figure 4-11: Test-to-predicted ratios for unstiffened connections
0
200
400
600
800
0 200 400 600 800
Test
ed C
apac
ity
(kN
)
Predicted Capacity (kN)
2B
3B
5B

85
Table 4-7: Comparison of proposed ductility requirements with test specimens
Specimen ID Plate thickness (mm) Min. Weld
Size (mm) Weld Size
(mm) tmax tp tmin 2B-10-U-0 21.1 9.5 6.1 9.3 6.0 2B-10-U-00 21.1 9.5 6.1 9.3 6.0
2B-10-U-200C 21.7 9.5 6.1 9.3 6.0 2B-13-U-200C 21.1 12.7 5.8 11.4 6.0
3B-10-U-0 16.6 9.5 7.5 9.3 6.0 3B-10-U-200C 18.0 9.5 7.5 9.3 6.0 3B-10-U-300C 18.3 9.5 7.5 9.3 6.0 3B-10-U-200T 18.0 9.5 7.5 9.3 6.0 3B-13-U-200C 17.7 12.7 7.2 11.4 6.0
5B-10-U-0 13.9 9.5 9.8 9.3 6.0 5B-10-U-300C 15.0 9.5 9.8 9.3 6.0 5B-10-U-200T 14.7 9.5 9.8 9.3 6.0 5B-13-U-300C 14.7 12.7 9.4 11.4 6.0

Table 4-8: Comparison of proposed shear capacity equations with test specimen capacities
Specimen ID
Column Web Capacity
(kN)
Bolt Group Capacity
(kN)
Gross Shear
Capacity (kN)
Net Shear
Capacity (kN)
Flexural/ Axial
Capacity (kN)
Minimum Shear
Capacity (kN)
Shear Capacity
w/o CWY (kN)
Measured Peak Shear (kN)
Test-to-Predicted
Ratio1 (kN)
2B-10-U-0 158 176 429 315 148 148 148 188 1.27 2B-10-U-00 158 176 429 315 148 148 148 197 1.33
2B-10-U-200C 158 156 429 315 134 134 134 159 1.19 2B-13-U-200C 158 137 526 389 170 137 137 138 1.01
3B-10-U-0 249 326 658 487 348 249 326 330 1.01 3B-10-U-200C 249 316 658 487 334 249 316 339 1.07 3B-10-U-300C 249 302 658 487 316 249 302 278 0.92 3B-10-U-200T 249 316 658 487 334 249 316 270 0.85 3B-13-U-200C 249 281 806 602 415 249 281 263 0.94
5B-10-U-0 484 782 1116 831 1000 484 782 762 0.97 5B-10-U-300C 484 749 1116 831 969 484 749 732 0.98 5B-10-U-200T 484 765 1116 831 986 484 765 612 0.80 5B-13-U-300C 484 667 1366 1027 1200 484 667 613 0.92
Mean: 1.02 Coefficient of Variation: 0.154
1Shear capacity w/o column web yielding used in comparison
86

87
4.5 Summary
The unstiffened extended shear tab specimens failed due to either bolt shear or
weld rupture, with the exception of one specimen that failed due to column web
tearing. In most cases, the plate yielded through its depth prior to failure. The
behaviour of the specimens can be described using a graph of the vertical
load-vertical deformation, located in Appendix B for all unstiffened extended
shear tab specimens. As expected, the strength of the connection increased with
plate depth. However, the capacity decreased when a thicker plate was used, due
in part to a lower bolt strength, but also to the increased demand on the bolt group
resulting from the stiffer plate behaviour. When horizontal tension was applied to
the connections, the failure mode was weld rupture, whereas the addition of
compression tended to cause bolt fracture. Because current design procedures
under-predict the connection capacity significantly, new design recommendations
are proposed. These recommendations are based on the test results, AISC’s
extended configuration design method, and the design procedure used by the
Fabricator. Maximum and minimum plate thickness requirements are included to
ensure the plate yields prior to bolt fracture and to prevent lateral–torsional
buckling. The weld and adjacent column web are also sized to ensure ductile
behaviour, and strength requirements are outlined for both the bolt group and
plate. The proposed recommendations result in a mean test-to-predicted capacity
ratio of 1.02 when compared to the peak vertical load observed during testing.

88
CHAPTER 5: STIFFENED EXTENDED SHEAR TABS
5.1 Introduction
A discussion of the ten stiffened extended shear tab connections that were tested
is presented in this chapter. The key variables, peak shear load, and observed
failure modes are discussed and used to describe typical connection behaviour.
Finally, the design recommendations made in Chapter 4 for unstiffened shear tabs
are adapted for stiffened extended shear tabs. An additional design
recommendation to address out-of-plane deformation is presented to reflect the
observed behaviour.
5.2 Observed Behaviour
5.2.1 Failure Modes
Using stiffeners increased the connection strength compared to the unstiffened
extended shear tabs with geometry that was otherwise identical. With the addition
of stiffeners, the plate-to-column web connection becomes much more stable and
the possibility of column web yielding or weld fracture occurring—two
commonly observed failure modes for unstiffened extended shear tab tests—is
greatly reduced. Out-of-plane deformation was the critical failure mode for each
of the ten stiffened specimens. Six of the specimens also had bolt shear as a
secondary failure mode. A summary of the failure modes is given in Chapter 3;
however, a detailed list of all of the observed failure modes is presented in Table
5-1 for each stiffened extended shear tab specimen. These failure modes include
weld rupture (WR), bolt fracture (BF), column web yielding (CWY), gross
section yielding (GSY), bolt bearing (BB), and out-of-plane deformation (OPD).
No indication of net section fracture was observed on any specimen, but plate
rupture (PR) was observed in the radius of two specimens. In this table the critical
failure mode is marked as CFM.

89
Table 5-1: Critical and other observed failure modes
Failure Mode
Specimen I.D. WR BF CWY PR GSY BB OPD
2B-10-S-0 - - - CFM 2B-10-S-200C - - - - CFM
2B-13-S-200C - - - - CFM
3B-10-S-0 - - - CFM
3B-10-S-200C - - - - - CFM 3B-10-S-300C - - - - - CFM 3B-13-S-200C - - - - CFM 5B-10-S-300C* - - - - - CFM 5B-10-S-400C** - - - - - CFM 5B-13-S-500C* - - - - CFM *Actuator 1 Capacity Reached **Beam Web Deformation
During the 5B-10-S-300C and 5B-13-S-500C tests, the capacity of Actuator 1 was
reached. However, in both cases the load had reached the plateau and additional
actuator capacity was only required to maintain the beam rotation during plate
deformation. Once the actuator capacity was reached, the 5B-10-S-300C test was
stopped, whereas an additional 50 kN of horizontal compression was applied to
the 5B-13-S-500C specimen to accelerate plate deformation. Due to the high
loads and plate depth, out-of-plane deformation of the beam web was visible after
testing specimen 5B-10-S-400C. Therefore, the beam was replaced for the
remaining tests.
5.2.1.1 Weld Rupture
Weld rupture was not an issue during the stiffened extended shear tab tests, as the
stress concentration seen in the unstiffened specimens was prevented by the
stiffeners. This suggests that the column-end of the connection behaves similarly
to a moment-resisting beam-to-column connection, in that the shear force is
transferred to the column primarily through the vertical weld and the moment is
transferred through the horizontal stiffeners.

90
5.2.1.2 Bolt Fracture
In six of the ten tests, bolt fracture was a secondary failure mode. As the plates
deformed out-of-plane, the bolts were subjected to an increasing tensile force in
addition to the horizontal and vertical loads. Therefore, with the exception of the
three and five bolt line specimens with 10 mm plates and high axial load, the bolts
failed. The bolts in the vertical line closest to the support typically failed as they
were subjected to a higher proportion of the tensile load. However, the severity of
bolt fracture varied. For example, the 3B-13-S-200C test ended abruptly, with the
entire bolt group rupturing at once, whereas during the 5B-13-S-500C test the
bolts failed progressively.
5.2.1.3 Column Web Yielding
Significant column web yielding was not observed during any of the unstiffened
extended shear tab tests. However, when high compressive loads were applied to
the connections, some Lüders’ lines were observed on the face of the column web
opposite the plate, as seen in Figure 5-1 for specimen 5B-13-S-500C. Similar to
weld rupture, the large column web deformation seen during unstiffened extended
shear tab tests was prevented by the stiffeners.
Figure 5-1: Lüders’ lines on the column web opposite stiffened specimens
5.2.1.4 Gross Section Yielding
Although not the critical failure mode, gross section yielding was observed in all
cases. The specimens with two horizontal bolt lines yielded through their depth
Lüders’ Lines
Column Web

91
prior to the plate deforming out-of-plane, but the vertical load continued to
increase until the plate began to bend out-of-plane. At this point, the load
plateaued while the plate continued to fold and, ultimately, the load began to
decrease.
5.2.1.5 Out-of-plane Deformation
Out-of-plane deformation was the critical failure mode in all of the specimens.
The plates began to move out-of-plane prior to reaching the peak shear and
continued until either the plate could not sustain half the peak vertical load or bolt
fracture caused a decrease in the vertical load. The amount of deformation varied,
but was more severe for specimens with 10 mm plates. Figure 5-2 shows the final
deformation of specimen 3B-10-S-200C.
Figure 5-2: Out-of-plane deformation of specimen 3B-10-S-200C
5.2.1.6 Plate Rupture
The specimens tested without horizontal compression, specimens 2B-10-S-0 and
3B-10-S-0, both tore at the radius of the plate on the flexural tension side, as
shown in Figure 5-3. Cheng (1993) identified radius cuts as potential fatigue crack
initiation sites in coped beams. The tears result from a combination of the stress

92
concentration induced under loading due to the cross-sectional discontinuity and
tensile residual stresses if flame-cutting is used. A similar stress concentration
exists in these stiffened extended shear tabs and produces a location of potential
tearing, even under non-cyclic loading. However, the tears in both specimens
began after peak load and significant deformation had already occurred.
Compression in the connection mitigates the potential for tearing.
Figure 5-3: Tear in the radius of specimen 3B-10-S-0
5.2.1.7 Bolt Bearing
Varying degrees of bolt bearing were observed on the stiffened extended shear tab
plates. Many of the maximum deformations were less than or equal to
approximately one millimeter; the largest deformation, 5.7 mm, occurred around
bolt number 1 on specimen 3B-10-S-0. Because the deformations were small, they
are contributing to the overall ductility of the connection, rather than causing
failure.
5.2.2 Vertical Load–Deformation Curves
The behaviour of the ten stiffened extended shear tabs can be explained by
breaking the vertical load-vertical deformation graph into three zones: A, B, and
C, delineated by the beginning and end of the load carrying capacity plateau. A
typical vertical load-deformation curve, for specimen 2B-10-S-0, is given in
Figure 5-4. The deformation is that of the bolt group centroid on the beam.

93
Zone A contains the beginning of the test, when the beam was rotated to
0.03 radians and horizontal load was applied, if required. Vertical load was then
gradually applied and the plate began to yield, typically in the area around the
radius in compression. As the plate continued to yield, it began to deform
out-of-plane until the vertical load no longer increased. For some tests, the plate
yielded along its full depth prior to deforming out-of-plane. The point of
maximum vertical load, marks the end of Zone A.
Figure 5-4: Load-Deformation behaviour of specimen 2B-10-S-0
After the peak vertical load was reached, the plate continued to deform
out-of-plane while remaining at or near the peak load. The length of this load
plateau varied but the vertical load eventually began to decrease, marking the end
of Zone B. For the 5B-10-S-300C and 5B-13-S-500C tests, the beginning of
Zone B was reached prior to reaching the actuator capacity. However, because the
force in Actuator 1 needed to be increased to maintain the 0.03 radians while the
specimen deformed (even though the net shear force on the connection was not
0
50
100
150
200
250
300
350
0 10 20 30 40 50
Ver
tica
l Loa
d (k
N)
Vertical Deformation (mm)
Zone A Zone B Zone C
Pea
k L
oad
Fai
lure BF
BF
GSY
PROPD

94
increasing), specimen 5B-10-S-300C had not reached the end of this zone when
the actuator reached its capacity and the test was terminated. A similar situation
arose with specimen 5B-13-S-500C, but additional horizontal load was applied to
complete the test.
Zone C begins when the vertical load starts to decline steadily. The decrease in
vertical load either continued to be gradual until half of the peak vertical load was
reached, or began to gradually decrease until bolt fracture occurred, which caused
a more abrupt load decline. Zone C in Figure 5-4 is an example of the latter; the
load begins to decrease gradually until two bolts progressively fail. Vertical load–
deformation graphs for each stiffened extended shear tab are given in
Appendix C.
5.2.3 Effect of Key Variables
Of the ten specimens, three had two horizontal bolt lines, four specimens had
three, and three specimens had five. In each of these groups, one of the specimens
had a 13 mm plate, while the rest were 10 mm thick. The specimens were also
tested under a variety of horizontal loads, as discussed in Chapter 3. General
observations about the effects of these three key variables are discussed below. It
must be kept in mind that these results are influenced by the hierarchy of failure
modes experienced by the specimens, so any design changes that alter the failure
sequence, such as a thicker plate or smaller bolts, may affect these observations.
5.2.3.1 Presence of Stiffeners
The influence of stiffeners on connection strength is examined by comparing
specimens that differed only by the presence of stiffeners. Table 5-2 shows both
the unstiffened and stiffened peak vertical load, as well as the increase in capacity
due to the addition of stiffeners. The “U” or “S” has been removed from the
specimen I.D. in the table for ease of comparison.

95
Table 5-2: Effect of stiffeners on connection capacity
Specimen I.D. Peak Shear (kN) Percent
Increase Unstiffened Stiffened 2B-10-0 188 317 68.6% 2B-10-200C 159 258 62.3% 2B-13-200C 138 323 134.1% 3B-10-0 330 511 54.8% 3B-10-200C 339 382 12.7% 3B-10-300C 278 279 0.4% 3B-13-200C 263 562 113.7% 5B-10-300C 732 798 9.0%
This comparison shows that stiffeners increased the capacities of the connections,
especially for specimens with two horizontal bolt lines and/or the 13 mm plate.
However, the increase in capacity decreases with the addition of horizontal
compression. For example, when the 3B-10-S geometry was tested with a
horizontal compression of 300 kN, the extra strength expected due to the addition
of stiffeners was no longer present.
5.2.3.2 Number of horizontal bolt lines
While deforming, the stiffened extended shear tab plate moved away from the
beam web, causing the bolts to be loaded in combined shear and tension. Because
more bolts were used, deeper plates sustained larger deformations after
out-of-plane deformation began. Therefore, the shear carried by the smaller
connections dropped more quickly than for the deeper specimens, leading to a
more ductile failure, as shown in Figure 5-5.
The sequence of failure modes was also dependent on plate depth. The two
horizontal bolt line connections met or exceeded their plastic moment capacity
prior to deforming out-of-plane. In the deeper connections, the plate began to
deform out-of-plane prior to reaching its full moment capacity.

96
Figure 5-5: Effect of number of horizontal bolt lines on connection ductility
5.2.3.3 Plate Thickness
In contrast to the unstiffened specimens, stiffened extended shear tabs obtained
higher peak loads when the thicker plate was used. This higher capacity was
achieved because the thicker connection plate was less susceptible to out-of-plane
deformation. The connections with thicker plates exhibited more brittle failures
because more force was required to deform the plates, and the out-of-plane
movement exposed the bolts to higher tensile forces and caused a more sudden
bolt fracture, as shown in Figure 5-6.
Figure 5-6: Effect of plate thickness on connection behaviour
050
100150200250300350400450
0 10 20 30 40 50
Ver
tica
l Loa
d (k
N)
Vertical Deformation (mm)
0
100
200
300
400
500
600
0 10 20 30 40 50
Ver
tica
l Loa
d (k
N)
Vertical Deformation (mm)
3B-13-S-200C
3B-10-S-200C
2B-10-U-200C
3B-10-U-200C

97
5.2.3.4 Horizontal Load
The peak vertical load reached by the stiffened extended shear tab specimens
decreased significantly with the addition of compression, as shown in Figure 5-7.
With the application of 200 kN of compression, the capacity of the 2B-10-S
specimen group decreased by 59 kN (19%), and the 3B-10-S group by 129 kN
(25%). Increasing the horizontal load from 300 kN to 400 kN in compression
resulted in a decrease of 212 kN (27%) for the 5B-10-S specimen group. Because
the stiffened specimens typically deformed out-of-plane, applying axial
compression accelerated the movement and decreased the shear capacity of the
connections.
Figure 5-7: Effect of horizontal compression on connection capacity
5.3 Current Design Procedures
Not all of the design procedures discussed in Chapter 4 address the presence of
stiffeners. AISC (2011) and the Fabricator include provisions for stiffeners to
improve the connection’s behaviour, but do not allow for an increase in capacity
with the addition of stiffeners. The test data shows that using stiffeners increases
the strength of the extended shear tabs with geometry that is otherwise identical to
an unstiffened specimen, unless high compressive forces are applied. Because the
0
200
400
600
800
-500 -400 -300 -200 -100 0
Ver
tica
l Loa
d (k
N)
Horizontal Load (kN)
5B-10-S
3B-10-S
2B-10-S

98
design procedures examined in Chapter 4 significantly underestimated the
capacity of unstiffened extended shear tabs, comparing the stiffened specimens’
test results to these procedures would not provide any insight into their ability to
describe specimen behaviour.
5.4 Design Recommendations
The design recommendations in Chapter 4 have been modified as required for the
design of stiffened extended shear tabs. The recommendations made for bolt
group capacity and maximum plate thickness differ only by the definition of
eccentricity, whereas the weld design philosophy has changed. The latter is now
based on transferring the shear force to the support, rather than sizing the weld to
ensure ductile failure. Design recommendations for column web yielding are not
included because it was not an observed failure mode, but an additional maximum
depth-to-thickness ratio, instead of the minimum thickness ratio used in
Chapter 4, has been included to prevent the out-of-plane failure of the stiffened
extended shear tabs seen during testing. Again, not all failure modes that must be
addressed during design are included in these recommendations.
5.4.1 Bolt Group Capacity
The bolt group capacity of stiffened extended shear tabs is calculated using the
instantaneous centre of rotation method, similar to the unstiffened configuration.
However, because the stiffeners act as a support on the column side of the plate,
the shear force eccentricity is not based on the geometric eccentricity from the
weld line; rather, it is the clear distance from the stiffeners to the centroid of the
bolt group. In other words, the eccentricity becomes the geometric eccentricity
minus the stiffener depth. For the test specimens, this eccentricity is 158 mm.
Because bolt fracture was not a critical failure mode for any of the stiffened
specimens, the method used in Chapter 4 to quantify the eccentricity causing bolt
fracture could not be used. Therefore, the effective eccentricity is assumed to be
50% of the design eccentricity (i.e., 50% of 158 mm for the stiffened test

99
specimens). Because the stiffeners reduce the rotation at the column-end of the
plate seen during the unstiffened extended shear tabs, using 75% underestimates
the bolt group capacities when comparing with the test results. An effective
eccentricity of 50% of the design eccentricity is a reasonable approximation of the
true inflection location. However, judgement is required to evaluate whether a
larger eccentricity should be used to account for the possibility of a rotationally
flexible supporting member.
5.4.2 Plate Thickness
The maximum plate thickness equation in Chapter 4 is also valid for extended
shear tabs with stiffeners. The calculation differs only in the definition of the
effective eccentricity, as discussed in the previous section.
The minimum plate thickness requirement has been redefined from that used for
unstiffened extended shear tabs. Because the stiffeners decreased the length of the
shear tab plate significantly, their capacities increased and out-of-plane
deformation became the critical failure mode for all test specimens. Moreover, the
short length makes the formulation based on flexural lateral–torsional buckling
inaccurate. Out-of-plane deformation occurred prior to gross section yielding for
specimens with larger depth-to-thickness ratios. Therefore, to mitigate
buckling-like failure, stiffened extended shear tabs should meet a maximum
depth-to-thickness ratio. The limit given in S16 (CSA 2009) for elements in
uniform compression supported along one edge that must reach the yield strain
without buckling is 200/√Fy and for the same element at the extreme fibre of a
flexural member that is capable of achieving a fully plastic cross-section (i.e., the
strain is uniform and greatly exceeds the yield value), the limit is 170/√Fy .
Considering the point at which the stress changes from compression to tension
along the depth of the plate as the supported edge, the actual strain state on the
part of the plate in compression is between these two cases. That is, the strain
increases from zero at the neutral axis to a value much greater than the yield strain

100
at the free edge when the plate becomes fully plastic. Therefore, an average value
is proposed for the maximum depth-to-thickness ratio:
5-1 dc
tp≤
185
√Fy
where Fy is the nominal yield stress. The depth of the plate in compression, dc, is
given by:
5-2 dc =dp
2-
NF
2Fytp
where the factored axial load, NF, is taken as positive for tension. Rearranging
Equations 5-1 and 5-2 results in an equation for the minimum plate thickness:
5-3 tmin=√Fy
370(dp-
NF
Fytp)
5.4.3 Weld Design
For stiffened extended shear tabs, the weld is designed to transfer shear force to
the column, with no eccentricity. As discussed in Chapter 2, the factored weld
capacity, wVW, can be calculated as follows when the force is parallel to the weld
axis:
5-4 w
VW
= 0.67w
Aw
Xu
where Xu is the ultimate tensile strength of the filler metal and w is the resistance
factor for welds. The area of the weld throat, Aw, is:
5-5 Aw = 0.707DLw
where D is the leg size of the fillet weld and Lw is the length of the weld. The
weld that connects the stiffener to the connection plate can also be designed using
Equations 5-4 and 5-5. These welds should be designed to transfer the horizontal
load and moment.

101
5.4.4 Plate Design
Similar to the unstiffened case, the plate must be designed to resist the applied
shear on both the net and gross sections. In addition, the flexural capacity of the
plate can be calculated using the same relationship as for unstiffened extended
shear tabs, but with a modified eccentricity. During the unstiffened specimen
tests, the high stress region in the plate was at the first vertical bolt line; therefore,
the distance from the inflection point to the first vertical bolt line was used to
calculate its flexural capacity. Conversely, in the stiffened extended shear tab tests
high stress regions were present at both ends of the plate span. Therefore, the
clear span, L, from the edge of the stiffeners to the first vertical bolt line, is
conservatively used to calculate the eccentric shear force that would result in
flexural failure.
5.4.5 Comparison of Test Results to Design Recommendations
The design recommendations made in previous sections have been applied to the
stiffened test specimens. A summary of the plate thickness requirements is given
in Table 5-3 and the shear strength calculations are located in Table 5-4.
The maximum plate thickness recommendation was met for all specimens with
the exception of specimen 5B-13-S-500C. This result was expected because all of
the specimens exhibited ductile failure and this maximum thickness requirement
is used to ensure plate yielding occurs prior to bolt fracture. Specimen
5B-13-S-500C exceeded the limit by 1.3 mm and was the least ductile of the
stiffened extended shear tab specimens because bolt fracture occurred quickly
after peak load, as would be expected when the maximum thickness is exceeded.
The minimum thickness requirement was only met by two specimens: 2B-10-S-0,
and 2B-13-S-200C. This requirement is in place to ensure the plate will reach its
plastic moment prior to deforming out-of-plane and was calculated for
comparison to the test specimens using the measured yield stress to determine the
depth of the plate in compression, but the nominal yield stress (350 MPa) was

102
used to calculate the limiting ratio. The tested capacities of the specimens that met
the limit exceeded the capacities calculated using the equation for plate flexure.
Moreover, two (2B-10-S-200C and 3B-13-S-200C) that violated the limit by no
more than 0.8 mm either closely approximated or exceeded the calculated
capacities. In all but one of the remaining cases the test capacity was significantly
lower. Therefore, the depth-to-thickness ratio appears to be a good indicator of
when the fully plastic plate capacity can be achieved. However, restricting the
plate size to prevent out-of-plane deformation in this way has resulted in
minimum plate thicknesses that are larger than the maximum for all of the
specimens with five horizontal bolt lines and one with three. This indicates that
for these connection geometries, the combinations of bolt diameter and axial load
used for these tests would not be permitted because adequate ductility cannot be
assured.
The shear requirements are given in Table 5-4 and, as this table shows, these
design recommendations are conservative when predicting plate flexure as the
failure mode, but otherwise non-conservative. Although the mean
test-to-predicted ratio is equal to 1.04, the coefficient of variation is high (0.30).
The specimens with the highest test-to-predicted ratio are those with two
horizontal bolt lines. The capacity of these connections is limited by the flexural
capacity of the plate which, as shown in Figure 5-4, underestimates the peak load.
Plate flexure is also the predicted failure mode for specimen 3B-10-S-0; however,
because the plate actually failed due to out-of-plane deformation, the ratio is
closer to unity. All of the specimens with very low test-to-predicted ratios,
3B-10-S-200C, 3B-10-S-300C, 5B-10-S-400C, and 5B-13-S-500C, had plate
thicknesses well below the minimum requirement.
The test-to-predicted ratios are shown graphically in Figure 5-8. If the data point
is above the diagonal line, the design recommendations are conservative. The
points shown in grey meet the minimum thickness requirement.
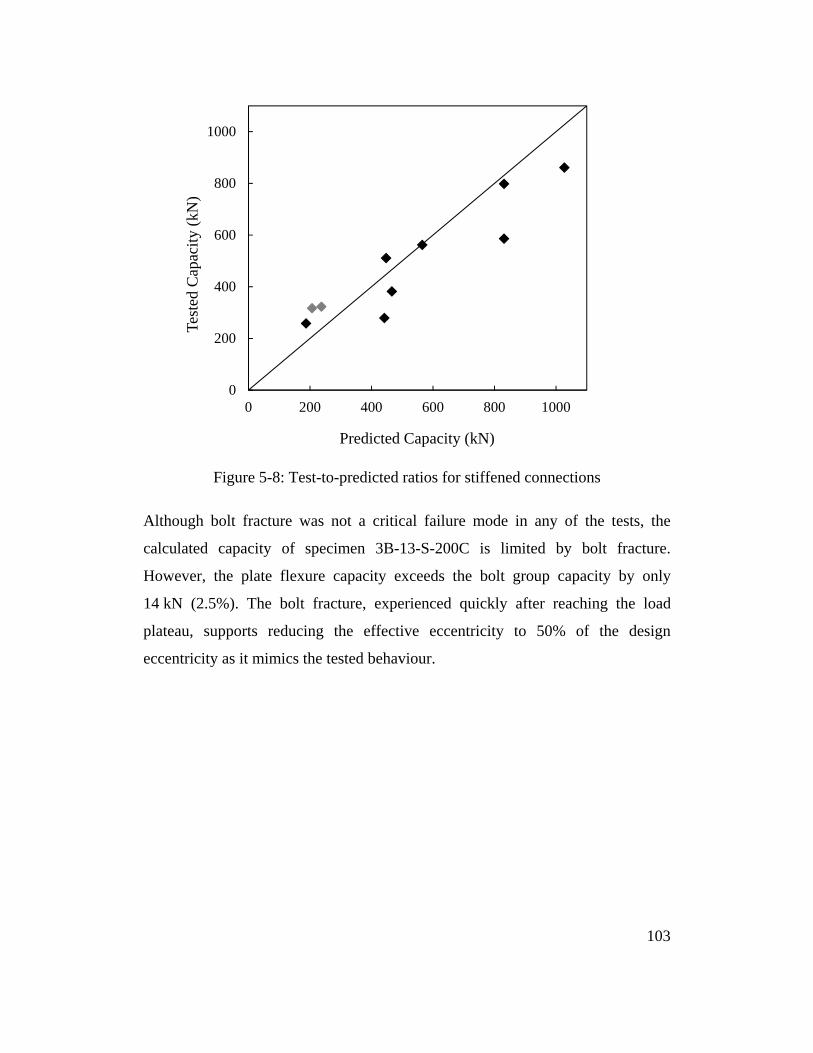
103
Figure 5-8: Test-to-predicted ratios for stiffened connections
Although bolt fracture was not a critical failure mode in any of the tests, the
calculated capacity of specimen 3B-13-S-200C is limited by bolt fracture.
However, the plate flexure capacity exceeds the bolt group capacity by only
14 kN (2.5%). The bolt fracture, experienced quickly after reaching the load
plateau, supports reducing the effective eccentricity to 50% of the design
eccentricity as it mimics the tested behaviour.
0
200
400
600
800
1000
0 200 400 600 800 1000
Test
ed C
apac
ity
(kN
)
Predicted Capacity (kN)

104
Table 5-3: Comparison of proposed plate thickness requirements with specimens
Specimen ID Plate thickness (mm)
tmax tp tmin*
2B-10-S-0 16.8 9.5 7.6 2B-10-S-200C 17.9 9.5 9.9 2B-13-S-200C 17.5 12.7 9.5 3B-10-S-0 12.9 9.5 11.6 3B-10-S-200C 14.4 9.5 14.0 3B-10-S-300C 14.8 9.5 15.1 3B-13-S-200C 14.2 12.7 13.5 5B-10-S-300C 10.9 9.5 23.2 5B-10-S-400C 11.2 9.5 24.4 5B-13-S-500C 11.4 12.7 24.5 *Limit calculated using the nominal yield stress (350 MPa)
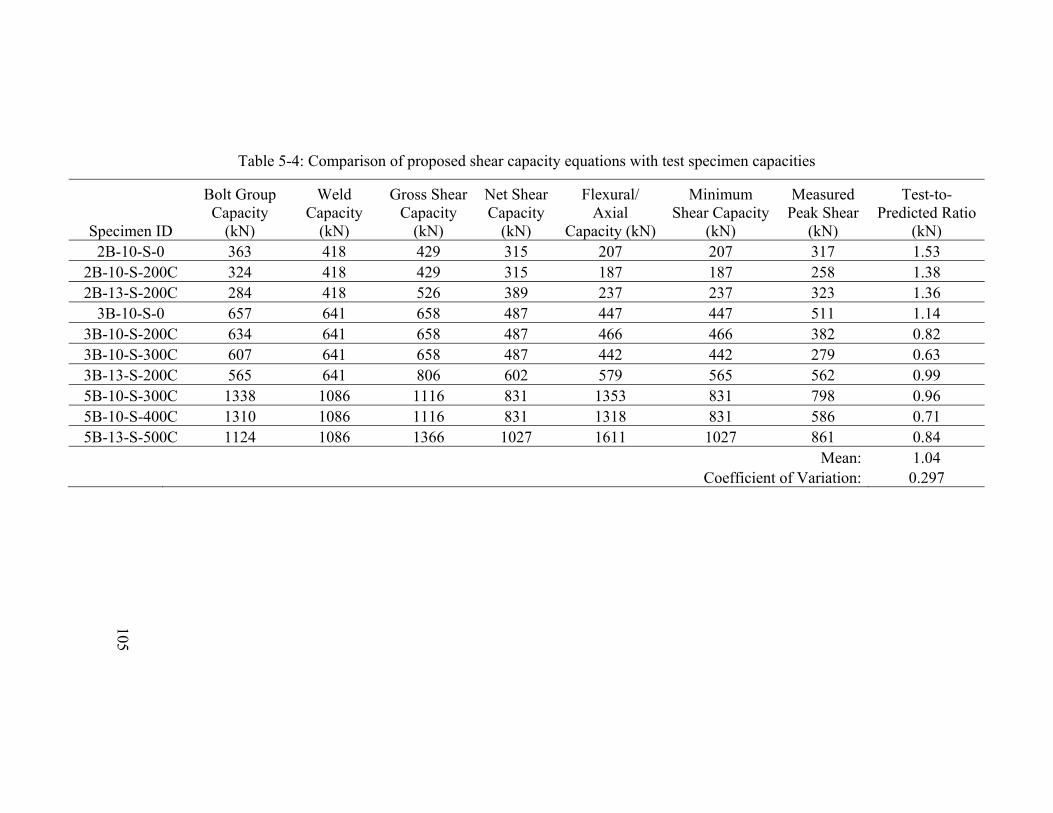
Table 5-4: Comparison of proposed shear capacity equations with test specimen capacities
Specimen ID
Bolt Group Capacity
(kN)
Weld Capacity
(kN)
Gross Shear Capacity
(kN)
Net Shear Capacity
(kN)
Flexural/ Axial
Capacity (kN)
Minimum Shear Capacity
(kN)
Measured Peak Shear
(kN)
Test-to-Predicted Ratio
(kN) 2B-10-S-0 363 418 429 315 207 207 317 1.53
2B-10-S-200C 324 418 429 315 187 187 258 1.38 2B-13-S-200C 284 418 526 389 237 237 323 1.36
3B-10-S-0 657 641 658 487 447 447 511 1.14 3B-10-S-200C 634 641 658 487 466 466 382 0.82 3B-10-S-300C 607 641 658 487 442 442 279 0.63 3B-13-S-200C 565 641 806 602 579 565 562 0.99 5B-10-S-300C 1338 1086 1116 831 1353 831 798 0.96 5B-10-S-400C 1310 1086 1116 831 1318 831 586 0.71 5B-13-S-500C 1124 1086 1366 1027 1611 1027 861 0.84
Mean: 1.04 Coefficient of Variation: 0.297
105

106
5.5 Summary
The stiffened extended shear tab specimens failed due to out of plane
deformation. In some cases, the plates deformed until bolts fractured as a
secondary failure mode. The behaviour of the specimens can be described on a
vertical load vertical deformation graph. These graphs are located in Appendix C
for all stiffened extended shear tab specimens. As expected, the peak shears of the
stiffened extended shear tabs were higher than those for analogous specimens
without stiffeners. The capacity of the stiffened specimens also increased with
plate depth and thickness, but was sensitive to the application of horizontal
compression. If a large enough compressive force was applied, the increase in
strength observed due to the presence of stiffeners was no longer evident. Because
current design procedures do not allow for an increase in strength when extended
shear tabs are stiffened, the test results could not be compared to any current
design guidelines. The design recommendations made in Chapter 4 were modified
for application to stiffened extended shear tab connections and a new maximum
plate depth to thickness ratio was proposed. These recommendations result in a
test to predicted strength ratio of 1.04 when compared to the peak vertical loads
observed during testing; however, the coefficient of variation is high and several
test-to-predicted ratios are quite low because many of the specimens exceeded the
maximum plate depth to thickness ratio.

107
CHAPTER 6: CONCLUSIONS AND RECOMMENDATIONS
6.1 Summary
Conventional and extended shear tabs are common types of shear connections
used for beam-to-girder and beam-to-column connections. Although there has
been extensive research into the design of conventional shear tabs, few testing
programs have concentrated on the behaviour of extended shear tabs. Research
programs by Sherman and Ghorbanpoor (2002), Goodrich (2005), and Metzger
(2006) have been used to develop the AISC design procedures (2005; 2011),
whereas the BCSA and SCI have verified design guidelines with research by
Moore and Owens (1992). However, these design procedures do not address the
presence of horizontal load or the increase in strength of the connection when
stiffeners are present.
To address these issues, 23 extended shear tab connections, both with and without
stiffeners, were tested under various combinations of vertical and horizontal
loads. The beam was braced laterally near its end to isolate the connection
behaviour. The tests were completed by rotating the beam to 0.03 radians,
applying horizontal load (if required), and failing the connections by applying
vertical load while holding the horizontal load and beam rotation constant. An
existing set-up was modified to meet the requirements for these tests and a variety
of instruments were used to monitor and record the behaviour of the specimens.
Additional tests were completed to determine the material properties of the
connection plates and the shear capacity of the bolts used to make the connection
to the beam.
The critical failure mode was identified for each specimen, as well as any other
failure modes that were present. The unstiffened extended shear tabs tended to fail
due to bolt fracture or weld rupture, whereas out-of-plane deformation governed
the capacities of the stiffened specimens. Current design procedures were
examined to determine their ability to predict the capacity and failure mode of the
specimens.

108
Using the test results, design recommendations are made based on procedures
currently used by the Fabricator and those recommended by AISC (2005; 2011).
Design equations to ensure both strength and ductility are proposed. The predicted
capacities and failure modes of the 23 specimens have been evaluated using these
recommendations and compared to the test results. The recommended design
procedures produce a mean test-to-predicted ratio of 1.02 for unstiffened and 1.04
for stiffened extended shear tabs when compared to the peak vertical loads
observed during testing.
6.2 Conclusions and Design Recommendations
The capacity of an extended shear tab connection can, in general, be increased by
using stiffeners. If stiffeners are not used, the capacity can be increased by using a
deeper plate with more bolts. However, increasing the plate thickness does not
necessarily strengthen unstiffened extended shear tabs, as it may reduce ductility
and thereby trigger another failure mode. When stiffeners are used, additional
shear capacity can be added by increasing the plate depth and number of bolts, or
the plate thickness. The reduction in shear strength of stiffened extended shear
tabs was observed to be more rapid with the addition of horizontal load when
compared to the unstiffened configuration, whose capacity may not decrease at all
under small horizontal compressive loads. Also, small beam rotations do not have
a large impact on the connection capacity. Ten failure modes have been identified
that need to be considered during design:
1. Gross Section Yielding
2. Bolt Fracture
3. Weld Rupture
4. Net-Section Fracture
5. Column Web Yielding
6. Out-Of-Plane Deformation
7. Bolt Bearing
8. Plate Rupture

109
9. Block Shear
10. Plate Twisting
Failure modes one through eight were observed during testing and are addressed
in the design recommendations. While bolt bearing deformations played a role in
several of the tests, in no case was bearing failure observed.
To ensure a ductile failure mode, the connection should be designed to undergo
plate yielding prior to more brittle failure modes, like weld rupture and bolt
fracture. The design recommendations for extended shear tabs made in Chapters 4
and 5 were derived to achieve this failure mode hierarchy:
1. The bolt group is designed using the instantaneous centre of rotation
method with an effective eccentricity equal to 75% of the design
eccentricity for unstiffened specimens. For the stiffened specimens, this
value can be reduced to 50% to account for the increased fixity of the
support opposite the bolt group.
2. A maximum plate thickness is calculated such that the plate will yield
prior to bolt fracture occurring. Axial load can be used to reduce the yield
capacity of the plate; however, transient axial loads cannot be included in
this calculation.
3. A minimum plate thickness is calculated to avoid out-of-plane
deformation. For unstiffened specimens, this failure mode is precluded by
equating the plastic moment capacity of the plate to the lateral-torsional
buckling capacity. A linear moment distribution is used, conservatively
assuming zero moment at the support and the maximum moment at the
bolt group. This limit is replaced with a more stringent maximum
depth-to-thickness ratio for stiffened extended shear tabs to prevent
buckling-like failure. The ratio of the depth of the plate in compression to
the plate thickness must not exceed 185/ Fy.
4. The plate is designed to resist the applied shear, and buckling need not be
considered. If the shear stress does not exceed half of the yield stress, the

110
full yield stress can be used to determine the flexural/axial capacity of the
plate. Otherwise, the normal stress is reduced using a linear relationship
based on the magnitude of the shear stress.
Additional design guidelines were developed exclusively for unstiffened extended
shear tabs. After the tests, some degree of weld rupture was observed on 12 of the
13 specimens; similarly, column web yielding was noted on all specimens.
Therefore, the following design recommendations were made:
5. The fillet welds are designed to develop the plate yield strength. Using the
factors and equations given in S16 (CSA 2009), the weld leg size should
be 1.155 times the plate thickness, multiplied by the ratio of the plate’s
nominal yield stress to the ultimate strength of the weld.
6. The ability of the column web to resist both axial load and eccentric shear
force is determined using yield line analysis. Although these capacities are
not consistent with the ultimate strength of the connection, they deter
significant deformation of thin column webs.
Because weld rupture and column web yielding were not observed during the
stiffened extended shear tab tests, the above recommendations (numbers 5 and 6)
apply only to unstiffened connections. However, for stiffened extended shear tabs:
7. The weld is sized to transfer the shear force into the column web.
6.3 Recommendations for Further Research
The design equations developed are applicable for connections that resist
eccentric shear only or a combination of eccentric shear and horizontal load. The
connection depth is limited to that required for 2 to 5 horizontal bolt lines and the
beam must be fully braced. To limit the number tests, not all potential variables
were studied. Therefore, using the results of these tests, a parametric study is
recommended to further validate or develop the design recommendations made in
Chapters 4 and 5. Additional parameters worthy of study include the plate length,

111
column web thickness, stiffener configuration, and the presence of back-to-back
extended shear tabs.
The column web thickness, stiffener configuration, and presence of back-to-back
stiffeners may influence the effective eccentricity, found to be 75% of the design
eccentricity for unstiffened extended shear tabs and 50% for the stiffened
configurations. The design eccentricity is the geometric eccentricity for the former
and the geometric eccentricity minus the stiffener depth for the latter. These
values depend on the relative rotational stiffnesses at the ends of the plate. For
example, thick column webs or back-to-back unstiffened extended shear tabs
would result in a stiffer support condition than was present for the tested
connections, and the point of inflection might be closer to the bolt group, reducing
the effective eccentricity. The sensitivity of the location of the inflection to these
changes should be studied.
The maximum plate thickness equation allows the use of thick plates, especially
for the unstiffened case. Tests to verify that sufficient ductility is provided when
using the maximum allowed plate thickness should be completed. Also, the weld
size requirement given for unstiffened extended shear tabs uses the resistance
factor given by S16 (CSA 2009), which results in a high reliability index for fillet
welds. Therefore, the required weld size could be reduced, if justified by a
reliability study.
Finally, good ductility was observed for many of the stiffened extended shear tab
connections that violated the minimum thickness requirement and therefore
exhibited out-of-plane deformation as the critical failure mode. In these cases, the
stiffeners reduced the length of the connection plate and the shorter length
allowed the plate to buckle in a controlled manner. As such, an equation
predicting the capacity of these specimens for this mode should be developed that
could be used when the maximum plate depth-to-thickness ratio cannot be met.

112
REFERENCES
AISC. (2011). Steel Construction Manual, 14th Edition. American Institute of Steel Construction, Chicago, IL.
AISC. (2005). Steel Construction Manual, 13th Edition. American Institute of Steel Construction, Chicago, IL.
Astaneh, A., Call, S. M., and McMullin, K. M. (1989). "Design of single plate shear connections." Eng. J., 26(1), 21-32.
Astaneh, A., Liu, J., and McMullin, K. M. (2002). "Behavior and design of single plate shear connections." J. Constr. Steel. Res., 58(5), 1121-1141.
Astaneh, A., McMullin, K. M., and Call, S. M. (1993). "Behavior and design of steel single plate shear connections." J. Struct. Eng., 119(8), 2421-2440.
Astaneh, A. (1989). "Demand and supply of ductility in steel shear connections." J. Constr. Steel. Res., 14(1), 1-19.
ASTM Standard A370-12a. (2012). Standard Test Methods and Definitions for Mechanical Testing of Steel Products. ASTM International, West Conshohocken, PA,
BCSA and SCI. (2002). Joints in Steel Construction, Simple Connections, Revised 2005. British Constructional Steelwork Association Limited and Steel Construction Institute, London, UK and Ascot, UK.
BSI. (2005). "Eurocode 3: Design of Steel Structures - Part 1-8: Design of Joints." BS EN 1993-1-8:2005 Incorporating Corrigenda Nos. 1 and 2, European Committee for Standardization, Brussels, Belgium.
Cheng, J. J. R. (1993). "Design of steel beams with end copes." Journal of Constructional Steel Research, 25(1–2), 3-22.
Cheng, J. J., Yura, J. A., and Johnson, C. P. (1984). “Design and behavior of coped beams”. Ph.D thesis. Univ. of Texas, Austin, Tex.
CISC. (2010). Handbook of Steel Construction, 10th Edition, Second Revised Printing 2011. Canadian Institute of Steel Construction, Markham, ON.
Crawford, S. F., and Kulak, G. L. (1971). "Eccentrically loaded bolted connections." J. Struct. Div, 97(ST3), 738-765.

113
Creech, D. D. (2005). "Behavior of single plate shear connections with rigid and flexible supports". M.Sc. thesis. North Carolina State Univ., Raleigh, NC.
CSA. (2014). S16-14 Design of Steel Structures. Canadian Standards Association, Mississauga, ON.
CSA. (2009). S16-09 Design of Steel Structures with Update No.1. Canadian Standards Association, Mississauga, ON.
Deng, K., Grondin, G. Y., and Driver, R. G. (2006). "Effect of loading angle on the behavior of fillet welds." Eng.J., 43(1), 9-24.
Gerard, G., and Becker, H. (1957). Handbook of Structural Stability Part 1 - Buckling of Flat Plates. New York Univ., New York.
Goodrich, W. (2005). "Behavior of extended shear tabs in stiffened beam-to-column web connections". M.Sc. thesis. Vanderbilt Univ., Nashville, TN.
Guravich, S. J., and Dawe, J. L. (2006). "Simple beam connections in combined shear and tension." Can. J. Civ. Eng., 33(4), 357-372.
Hewitt, C. (2006). "Simpler shear connections: design procedures for single-plate shear connections have been expanded in the new Manual to incorporate a wider variety of geometric parameters." Mod Steel Constr, 46(10), 51-53.
Kapp, R. H. (1974). "Yield line analysis of a web connection in direct tension." Eng. J., 11(2), 38-41.
Lipson, S. (1968). "Single-angle and single-plate beam framing connections." Canadian Structural Engineering Conference, Canadian Steel Industries Construction Council, Toronto, ON, 141-162.
Marosi, M., D'Aronco, M., Tremblay, R., and Rogers, C. (2011a). "Multi-row bolted beam to column shear tab connections." Eurosteel, European Convention for Constructional Steelwork, Budapest, Hungary, 555-560.
Marosi, M., Tremblay, R., and Rogers, C. A. (2011b). "Behaviour of single and double row bolted shear tab connections and weld retrofits". Research Report. Deptartment of Civil Engineering & Applied Mechanics, McGill University, Montreal, QC.
Metzger, K. A. B. (2006). "Experimental verification of a new single plate shear connection design model". M.Sc. thesis. Virginia Polytechnic Institute and State Univ., Blacksburg, VA.

114
Mohr, B. A. (2005). "Investigation of ultimate bending strength of steel bracket
plates". M.Sc. thesis. Virginia Polytechnic Institute and State Univ., Blacksburg,
Virginia.
Moore, D. B., and Owens, G. W. (1992). "Verification of design methods for
finplate connections." Struct. Eng., 70(3), 46-53.
Muir, L. S., and Hewitt, C. M. (2009). "Design of unstiffened extended single-
plate shear connections." Eng.J., 46(2), 67-79.
Muir, L. S., and Thornton, W. A. (2004). "A technical note: a direct method for
obtaining the plate buckling coefficient for double-coped beams." Eng. J., 41(3),
133-134.
Muir, L. S., and Thornton, W. A. (2011). "The development of a new design
procedure for conventional single-plate shear connections." Eng.J., 48(2), 141-
152.
Ng, K. F., Driver, R. G., and Grondin, G. Y. (2002). “Behaviour of transverse
fillet welds.” Structural Engineering Report No. 245, Department of Civil and
Environmental Engineering, University of Alberta.
Oosterhof, S. A., and Driver, R. G. (2012). "Performance of steel shear
connections under combined moment, shear, and tension." Structures Congress,
American Society of Civil Engineers, Chicago, Il, 146-157.
Porter, K. A., and Astaneh, A. (1990). "Design of single plate shear connections
with snug-tight bolts in short slotted holes." Rep. No. UCB/SEMM-90/23,
Department of Civil Engineering, University of California, Berkeley, CA.
Richard, R. M., Kriegh, J. D., and Hormby, D. E. (1982). "Design of single plate
framing connections with A307 bolts." Eng. J., 19(4), 209-213.
Richard, R. M., Gillett, P. E., Kriegh, J. D., and Lewis, B. A. (1980). "The
analysis and design of single plate framing connections." Eng. J., 17(2), 38-52.
Salvadori, M. G., (1955). “Lateral buckling of I-beams.” T. Am. Soc. Civ. Eng.,
120(1), 1165-1177.
Shaw, A. L., and Astaneh, A. (1992). "Experimental study of single-plate steel
beam-to-girder connections." Rep. No. UCB/SEMM-92/13, Department of Civil
Engineering, University of California, Berkeley, CA.

115
Sherman, D. R., and Ghorbanpoor, A. (2002). "Final report: design of extended shear tabs." American Institute of Steel Construction, University of Wisconsin-Milwaukee.
Tamboli, A. (2010). "Design of connections for axial, moment, and shear forces." Handbook of Structural Steel Connection Design and Details, Second Edition, McGraw Hill Professional, AccessEngineering.
Thornton, W. A. (1997). "Strength and ductility requirements for simple shear connections with shear and axial load." National Steel Construction Conference, American Institute of Steel Construction, Chicago, IL, 38-1-38-17.
Thornton, W. A., and Fortney, P. J. (2011). "On the need for stiffeners for and the effect of lap eccentricity on extended single-plate connections." Eng. J., 48(2), 117-125.

116
APPENDIX A:
APPENDIX A: SAMPLE CALULATIONS

117
WAIWARD STEEL FABRICATORS LTD. DESIGN PROCEDURE
Sample calculation for specimen 3B-10-U-200C
Loads:
Shear Capacity: 182 kN
Axial Load: 0 kN
Given:
Plate:
tp = 9.52 mm
dp = 230 mm
s = 80.0 mm
eg = 273 mm
L = 233 mm
Fy = 455 MPa
Fu = 507 MPa
Ry = 1 (using actual yield stress)
E = 189383 MPa
Bolts:
Rn = 149 kN
dBH = 20.6 mm
n = 6
nh = 3
Weld:
D = 6.00 mm
Beam:
tb = 13.0 mm
Calculations:
1. Check the bolt group using the instantaneous centre of rotation. From iterative analysis: a. VBG = 245 kN b. mo = 0.0720 mm

118
c. Lo = 33.2 mm
P = VBG2+NF
2
P = 243 kN 2+ 200 kN 2 = 316 kN
β = tan-1 VBG
NF
β = tan-1 243 kN
-200 kN=-0.882 radians
MBG = VBGeeff
MBG = 243 kN(273 mm) = 66.3 kNm
eBG = MBG
P
eBG = 66.3 kNm
314 kN=211 mm
XIC = -Lo sin β -mo cos β
XIC = - 33.2 mm sin -0.882 - 0.0720 mm cos -0.882 = 25.7 mm
YIC = Lo cos β -mo sin β
YIC = (33.2 mm) cos (-0.882) - (0.0720 mm) sin (-0.882) = 21.1 mm
Bolt Calculations:
Bolt Xi (mm) Yi (mm) θi (rad) di (mm) ∆i (mm) Ri (kN) Ri*sinθi Ri*cosθi Ri*di 1 -40.0 80.0 0.840 88.3 6.32 169 126 113 149262 40.0 80.0 -0.238 60.6 4.34 159 -38 155 96513 -40.0 0.0 -4.40 69.0 4.94 163 155 -50 112524 40.0 0.0 -2.55 25.5 1.82 123 -69 -102 31375 -40.0 -80.0 -3.72 121 8.64 174 95 -146 209636 40.0 -80.0 -3.00 102 7.31 172 -24 -170 17526
Sum: 245 -200 77454
di = Yi-YIC2+ Xi-XIC
2
d1 = 80 mm-21.1 mm 2 + -40 mm-25.7 mm 2 = 88.3 mm
θi = tan-1 Yi-YIC
Xi-XIC-π
2
θ1 = tan-1 80 mm -21.1 mm
-40 mm - 25.7 mm - π
2= 0.840 radians

119
∆i = ∆maxdi
dmax
∆1 = 8.34 mm(88.3 mm)
121 mm=6.32 mm
Ri = Rn 1-e-0.4∆i 0.55
R1 = 177 kN 1 - e-0.4(6.32 mm) 0.55= 169 kN
0 = Ri sin θi +P sin β
0 = 245 kN+ (316 kN) sin (-0.886) = 245 kN - 241 kN ~ 0 (rounding)
0 = Ri cos θi +P cos β
0 = -200 kN+ (316 kN) cos (-0.866) = -200 kN + 204 kN ~ 0 (rounding)
0 = Ridi-P eBG+Lo
0 = 77.5 kNm- (316 kN) 211 mm+33.2 mm = 77.5 kNm - 77.2 kNm ~ 0 (rounding)
2. Check the gross section capacity of the plate
τ = V
dptp
τ = 182 kN
230 mm 9.52 mm= 83.1 MPa
σn = Fy2-3τ2
σn = 455 MPa 2-3(83.1 MPa)2 = 431 MPa
Mp = σntp
4dp
2-
NF
σntp
2
Mp = (431 MPa)(9.52 mm)
4230 mm 2-
200 kN
(431 MPa)(9.52 mm)
2
Mp = 51.9 kNm
M = Veg = (182 kN)(273 mm) = 49.7 kNm Mp
3. Check the net section capacity of the plate (neutral axis is 71.6 mm from the compression face of the plate determined by trial and error; all axial load is considered

120
tensile and bolt holes are ignored in tensile zone)
σn = Fy+Fu
2
2
-2.8τ2
σn = 455 MPa+507 MPa
2
2
- (83.1 MPa)2 = 459 MPa
C = (71.6 mm)(9.52 mm)(459 MPa) = 313 kN
T1 = (35 mm - 20.6mm/2)(9.52 mm)(459 MPa) = 108 kN
T2 = (80 mm - 20.6mm)(9.52 mm)(459 MPa) = 260 kN
T3 = (230 mm/2-20.6mm/2-71.6 mm)(9.52 mm)(459 MPa) = 145 kN
Mp = 313 kN(79.2 mm)/2 + 108 kN(102.7 mm) + 260 kN(40.0 mm) -145 kN(26.7 mm)
Mp = 42.4 kNm
M = VL = (182 kN)(233 mm) = 42.4 kNm Mp
4. Block shear due to axial load: will not govern.
5. Check the weld capacity
VW = 0.67XuAw(1.00+0.5 sin θw1.5)
VW = 0.67 490 MPa2 6 mm 230 mm
√20 = 641 kN
6. Check plate ductility
a. Minimum plate thickness: can be ignored as the column web is thin
tmin = 0.877Fydpeg
E
tmin = 0.877(455 MPa)(230 mm)(273 mm)
189383 MPa= 10.8 mm
b. Maximum plate thickness
MOBG = Rn Xi2+Yi
2
MOBG = 177 kN 4 40 mm 2 + 80 mm 2 + 2 40 mm 2 + 0

121
MOBG = 77.5 KNm
tmax = 6MOBG
RyFydp
2
tmax = 6(75.7 kNm)
1(455 MPa) 230 mm 2 = 19.3 mm
9.52 mm 19.3 mm

122
THE AMERICAN INSTITUTE OF STEEL CONSTRUCTION EXTENDED
CONFIGURATION DESIGN PROCEDURE (2011)
Sample calculation for specimen 3B-10-U-0
Loads:
Shear Capacity: 119 kN (Stiffener plate requirement)
Axial Load: 0 kN
Given:
Plate:
tp = 9.52 mm
dp = 230 mm
s = 80.0 mm
eg = 273 mm
L = 233 mm
Fy = 455 MPa
Fu = 507 MPa
Bolts:
Rn = 177 kN
dBH = 20.6 mm
n = 6
nh = 3
Weld:
D = 6.00 mm
Beam:
tb = 13.0 mm
Calculations:
1. Check weld size:
D 5
8tp

123
D 5
89.52 =5.95 mm 6 mm
2. Check bolt group capacity:
C = 1.46 (eg = 254 mm)
C = 1.25 (eg = 305 mm)
C = 1.46+(1.25-1.46)*(273-254)/(305-254)
C = 1.38
VBG = CRn
VBG = 1.38(177 kN) = 244 kN
3. Check plate thickness for ductility requirement:
C’ = 401 (in mm)
MOBG = RnC’
MOBG = 177 kN (401 mm) = 71.0 kNm
tmax = 6MOBG
Fydp2
tmax = 6(71.0 kNm)
455 MPa (230 mm)2 =17.7 mm > 9.52 mm
4. Check the plate strength:
a. Gross section yielding
VGS = 0.6Fytpdp
VGS = 0.6(455 MPa)(9.52 mm)(230 mm) = 598 kN
b. Net section fracture
VNS = 0.6Futp(dp - nhdBH)
VNS = 0.6(507 MPa)(9.52 mm)(230 mm - 3(20.6 mm)) = 487 kN
c. Block shear – will not govern
5. Check stabilizer plate requirement:

124
VLTB = 10.3πdptp
3
L2 (in metric)
VLTB = 10.3π(230 mm)(9.52 mm)3
233 2 = 119 kN
6. Check plate buckling (using “all other cases” double coped beam equations):
λ =
dp Fy
tp 47500+112000dp
2L
2
λ =
230 mm 455 MPa (0.145ksi/MPa)
9.52 mm 47500+112000230 mm
2(233 mm)
2
= 0.717
Q = 1.34 - 0.486λ ( for λ>0.7)
Q = 1.34 - 0.486(0.717) = 0.992
Fcr = QFy
Fcr = 0.992(455 MPa) = 451 MPa
VPB = Fcrtpdp
2
6eg
VPB = 451 MPa(9.52 mm)(230 mm)
6(273 mm)
2
= 139 kN
7. Determine capacity:
V = min(205 kN, 598 kN, 487 kN, 119 kN, 139 kN) = 119 kN
8. Check plate flexure:
Mp = Fytpdp2
4
Mp = 455 MPa(9.52 mm)(230 mm)
4
2
= 57.3 kNm

125
1 V
VGS
2
+Veg
Mp
2
1 119 kN
598 kN
2
+119 kN(273 mm)
57.3 kNm
2
= 0.0396+0.321=0.361
9. Check torsion (likely not required as beam is fully braced):
Mta = Vtb+tp
2
Mta = 119 kN13.0 mm+9.52 mm
2= 1.34 kNm
Mtn = 0.6Fy-V
Ltp
Ltp2
2>Mta
Mtn = 0.6(455)-119 kN
230(9.52 mm)
230 mm(9.52 mm)2
2= 2.28 kNm > 1.34 kNm

126
BCSA/SCI DESIGN PROCEDURE (2002)
Sample calculation for specimen 3B-10-U-0
Loads:
Shear Capacity: 164 kN
Axial Load: 0 kN
Given:
Plate:
tp = 9.52 mm
dp = 230 mm
s = 80.0 mm
eg = 273 mm
L = 233 mm
Fy = 455 MPa
Fu = 507 MPa
Bolts:
Fub 830 MPa
Rn = 177 kN
dBH = 20.6 mm
n = 6
nh = 3
Weld:
D = 6.00 mm
Beam:
db = 318 mm
Column:
w = 10.9 mm
Fyc = 385 MPa

127
Calculations:
1. Show that it is a “long” shear tab:
0.15 tpL
0.15 9.52 mm
233 mm=0.0409 mm
2. Check geometry of the connection:
a. Bolt Strength
Fub 800 MPa
830 MPa 800 MPa
b. Check plate depth with respect to the beam depth
dp 0.6db
230 mm 0.6(318 mm) = 191 mm
c. Check end distance
en 2d
35 mm 2(19.1 mm) = 38.1 mm (NOT MET)
d. Check bolt spacing
s 2.5d
35 mm 2.5(19.1 mm) = 47.6 mm
e. Check bolt hole diameter
dbh d+2
20.6 mm 19.1+2 = 21.05 (NOT MET)
f. Check maximum plate thickness
tp 0.42d
9.52 mm 0.42(19.1 mm) = 8.02 mm (NOT MET)
g. Check minimum plate thickness
tp 6 mm
9.52 mm 6 mm
h. Check weld size

128
D 0.8tp
6 mm 0.8(9.52 mm) = 7.62 mm (NOT MET)
3. Check bolt group capacity: two vertical bolt lines
IBG = Xi2+ Yi
2
IBG = 4 40 mm 2+ 80 mm 2 +2 40 mm 2+ 0mm 2 = 35400 mm2
MBG = V L+s
2
MBG = 164 kN 233 mm +80mm
2= 44.8 kNm
Rn V
n+
MBGXi-max
IBG
2
+MBGYi-max
IBG
2
Rn 164 kN
6+
(52.0 kNm)(40 mm)
35400 mm2
2
+(52.0 kNm)(80 mm)
35400 mm2
2
177 kN 128 kN
4. Check the shear capacity of the plate
a. Gross shear
Ag = 0.9[2en + (nh - 1)s]tp
Ag = 0.9[2(35.0 mm) + (3 - 1)80.0 mm](9.52 mm) = 1970 mm2
VGS = 0.6FyAg
VGS = 0.6(455 MPa)(1971 mm2) = 538 kN
b. Net shear
An = Ag - nh(dbh)tp
An = 1971 mm2 - 3(20.6 mm)(9.52 mm) = 1382 mm2
VNS = 0.7Fy(1.1)An
VNS = 0.7(455 MPa)(1.1)( 1382 mm2) = 484 kN
c. Block shear: not critical for this connection
5. Check the shear/moment interaction
V 0.75[min{VGS, VNS}] for a low shear connection
164 kN min{528 kN, 484 kN} = 484 kN

129
My = Fytpdp2
6
My = 455 MPa(9.52 mm)(230 mm)2
6= 38.2 kNm
M = VL = 164 kN(233 mm) = 38.2 kNm My
6. Check the lateral-torsional buckling capacity (See Annex B of BS5950 for definitions)
λlt = 2.8Ldp
1.5tp2
0.5
=2.8233 mm(230 mm)
1.5(9.52 mm)2
0.5
= 55.6
Pe = π2E
λlt=605.4 MPa
λlo = 0.4π2E
Fy
2
=25.6
2λlo = 51.3 λlt
ηlt =14λlo/1000 = 0.359
Φlt = Fy+ ηlt+1 Pe
2=639 MPa
Fcr = PeFy
Φlt+ Φlt2-PeFy
0.5 =275MPa
Mcr = Fcrtpdp
2
6(0.6)=38.4 kNm
M = 38.2 kNm 38.4 kNm
7. Beam capacity checks not required.
8. Check column web capacity:
VCW = 0.6Fyc 0.9wdp
VCW = 0.6(385 MPa)(0.9)(10.9 mm)(230 mm) = 521 kN
VCW 0.5V = 0.5(164 kN) = 82 kN

130
TAMBOLI DESIGN PROCEDURE (2010)
Sample calculation for specimen 3B-10-U-200C
Loads:
Shear Capacity: V = 180 kN (Net-section interaction)
Axial Load: N = 200 kNC
Given:
Plate:
tp = 9.52 mm
dp = 230 mm
s = 80.0 mm
eg = 273 mm
L = 233 mm
Fy = 455 MPa
Fu = 507 MPa
E = 189 GPa
Bolts:
Rn = 177 kN
dBH = 20.6 mm
n = 6
nh = 3
Weld:
D = 6.00 mm
Xu = 490 MPa
Beam:
tb = 13.0 mm
Calculations:
1. Determine Resultant Load and it’s angle:
P = V2+N2 180 kN 2 + 200 kN 2 = 269 kN

131
β = tan-1 N
V tan-1 200 kN
180 kN= 48.0 deg
2. Check bolt group capacity: (AISC Table 7-8)
C = 1.96 (β = 45 deg, eg = 254 mm)
C = 1.68 (β = 45 deg, eg = 305 mm)
C = 1.96 + (1.68 - 1.96)*(273 - 254)/(305 - 254) = 1.86 (β = 45 deg, eg = 273 mm)
C = 2.52 (β = 60 deg, eg = 254 mm)
C = 2.21 (β = 60 deg, eg = 305 mm)
C = 2.52 + (2.21 - 2.52)*(273 - 254)/(305 - 254) = 2.40 (β = 60 deg, eg = 273 mm)
C = 1.86 + (2.4 - 1.86)*(48.0 - 45)/(60 - 45) = 1.97 (β = 48.0 deg, eg = 273 mm)
VBG = CRn2-N2 1.97(177 kN) 2 - 200 kN 2 = 285.6 kN
3. Check plate thickness for ductility requirement:
C’ = 401 (in mm)
MOBG = RnC’ = 149 kN (401 mm) = 59.8 kNm
tmax = 6MOBG
Fydp2
6(59.8 kNm)
455 MPa (230 mm)2 = 14.9 mm > 9.52 mm
4. Check the gross shear, axial, and bending capacity of the plate:
a. Axial capacity
k = 0.65
r = tp
√12=
9.52 mm
√12=2.75 mm
Fe = π2E
keg r⁄2 =
π2(189 GPa)
0.65(233) 2.75⁄ 2 = 616 MPa
Fcr = 0.659Fy Fe⁄ Fy= 0.659455 MPa 616 MPa⁄ 455 MPa = 334 MPa
NGS = Fcrtpdp= 334 MPa 9.52 mm 230 mm = 731 kN
b. Bending capacity

132
λ =
dp Fy
tp 47500+112000dp
2L
2
230 mm 455 MPa (0.145ksi/MPa)
9.52 mm 47500+112000230 mm
2(233 mm)
2
=0.717
Q = 1.34 - 0.486λ = 1.34 - 0.486(0.717) = 0.992
Fcr = QFy = 0.992(455 MPa) = 451 MPa
VPB = Fcrtpdp
2
4eg
451 MPa(9.52 mm)(230 mm)
4(233 mm)
2
=244 kN
c. Shear capacity
VGS = 0.6Fytpdp = 0.6(455 MPa)(9.52 mm)(230 mm) = 598 kN
d. Gross section interaction
1 V
VGS
2
+N
NGS+
8V
9VPB
2
=180 kN
598 kN
2
+200 kN
731 kN+
8(180 kN)
9(244 kN)
2
=0.955
5. Check the net shear, axial, and bending capacity of the plate:
a. Shear Capacity
VNS = 0.6Futp(dp - nhdBH) = 0.6(507 MPa)(9.52 mm)(230 mm - 3(20.6 mm)) = 487 kN
6. Net section interaction (axial net section not required if axial load is compression)
1 V
VGS
2
+N
NGS+
8V
9VPB
2
=180 kN
487 kN
2
+200 kN
731 kN+
8(180 kN)
9(244 kN)
2
=1.00
7. Check weld capacity:
Aw = 2dpD
√2=
2(230 mm)(6 mm)
√2= 1951 mm2
Vw = 0.6XuAw 1+0.5 sin β 1.5 =0.6 490 MPa 1951 mm2 1+0.5 sin 48 deg 1.5
Vw = 757 kN
8. Block shear check will not govern

133
APPENDIX B:UNSTIFFENED EXTENDED SHEAR TAB LOAD–
DEFORMATION CURVES

134
Figure B-1: Specimen 2B-10-U-0
Figure B-2: Specimen 2B-10-U-00
0
50
100
150
200
0 10 20 30 40 50 60 70 80 90
Verti
cal L
oad
(kN
)
Vertical Deformation (mm)
GSY
BF
BF
WR
0
50
100
150
200
0 10 20 30 40 50 60 70 80 90
Verti
cal L
oad
(kN
)
Vertical Deformation (mm)
BF
WR
GSY

135
Figure B-3: Specimen 2B-10-U-200C
Figure B-4: Specimen 2B-13-U-200C
0
50
100
150
200
0 10 20 30 40 50 60 70 80 90
Verti
cal L
oad
(kN
)
Vertical Deformation (mm)
BF
BFGSY
0
50
100
150
200
0 10 20 30 40 50 60 70 80 90
Verti
cal L
oad
(kN
)
Vertical Deformation (mm)
BF
BFGSY

136
Figure B-5: Specimen 3B-10-U-0
Figure B-6: Specimen 3B-10-U-200C
0
50
100
150
200
250
300
350
0 10 20 30 40 50 60 70 80 90
Verti
cal L
oad
(kN
)
Vertical Deformation (mm)
WR
BF
BF
GSY
0
50
100
150
200
250
300
350
0 10 20 30 40 50 60 70 80 90
Verti
cal L
oad
(kN
)
Vertical Deformation (mm)
GSYBF
WR

137
Figure B-7: Specimen 3B-10-U-300C
Figure B-8: Specimen 3B-10-U-200T
0
50
100
150
200
250
300
350
0 10 20 30 40 50 60 70 80 90
Ver
tica
l Loa
d (k
N)
Vertical Deformation (mm)
BF
BF
GSY
0
50
100
150
200
250
300
350
0 10 20 30 40 50 60 70 80 90
Ver
tica
l Loa
d (k
N)
Vertical Deformation (mm)
WR

138
Figure B-9: Specimen 3B-13-U-200C
Figure B-10: Specimen 5B-10-U-0
0
50
100
150
200
250
300
350
0 10 20 30 40 50 60 70 80 90
Ver
tica
l Loa
d (k
N)
Vertical Deformation (mm)
BF
BF
0
100
200
300
400
500
600
700
800
0 10 20 30 40 50 60 70 80 90
Ver
tica
l Loa
d (k
N)
Vertical Deformation (mm)
CWT
BF
BF
GSY

139
Figure B-11: Specimen 5B-10-U-300C
Figure B-12: Specimen 5B-10-U-200T
0
100
200
300
400
500
600
700
800
0 10 20 30 40 50 60 70 80 90
Verti
cal L
oad
(kN
)
Vertical Deformation (mm)
GSY
BF
BF
BF
BF
0
100
200
300
400
500
600
700
800
0 10 20 30 40 50 60 70 80 90
Verti
cal L
oad
(kN
)
Vertical Deformation (mm)
WR
BF
BF
GSY

140
Figure B-13: 5B-13-U-300C
0
100
200
300
400
500
600
700
800
0 10 20 30 40 50 60 70 80 90
Verti
cal L
oad
(kN
)
Vertical Deformation (mm)
BF
BF
BF
GSY

141
APPENDIX C: STIFFENED EXTENDED SHEAR TAB LOAD–
DEFORMATION CURVES

2
Figure A-1: Specimen 2B-10-S-0
Figure A-2: Specimen 2B-10-S-200C
0
50
100
150
200
250
300
350
0 10 20 30 40 50 60
Ver
tica
l L
oad
(kN
)
Vertical Deformation (mm)
GSY BF
BF
PROPD
0
50
100
150
200
250
300
350
0 10 20 30 40 50 60
Ver
tica
l L
oad
(kN
)
Vertical Deformation (mm)
BFGSYOPD

143
Figure C-3: Specimen 2B-13-S-200C
Figure C-4: Specimen 3B-10-S-0
0
50
100
150
200
250
300
350
0 10 20 30 40 50 60
Verti
cal L
oad
(kN
)
Vertical Deformation (mm)
GSYBF
BF
OPD
0
100
200
300
400
500
600
0 10 20 30 40 50 60
Verti
cal L
oad
(kN
)
Vertical Deformation (mm)
OPD
BFPR
GSY

144
Figure C-5: Specimen 3B-10-S-200C
Figure C-6: Specimen 3B-10-S-300C
0
100
200
300
400
500
600
0 10 20 30 40 50 60
Verti
cal L
oad
(kN
)
Vertical Deformation (mm)
OPD
GSY
0
100
200
300
400
500
600
0 10 20 30 40 50 60
Verti
cal L
oad
(kN
)
Vertical Deformation (mm)
OPD
GSY

145
Figure C-7: Specimen 3B-13-S-200C
Figure C-8: Specimen 5B-10-S-300C
0
100
200
300
400
500
600
0 10 20 30 40 50 60
Verti
cal L
oad
(kN
)
Vertical Deformation (mm)
OPD
GSY
0
100
200
300
400
500
600
700
800
900
0 10 20 30 40 50 60
Verti
cal L
oad
(kN
)
Vertical Deformation (mm)
OPD
GSY

146
Figure C-9: Specimen 5B-10-S-400C
Figure C-10: Specimen 5B-13-S-500C
0
100
200
300
400
500
600
700
800
900
0 10 20 30 40 50 60
Verti
cal L
oad
(mm
)
Vertical Deformation (mm)
OPD
GSY
0
100
200
300
400
500
600
700
800
900
0 10 20 30 40 50 60
Verti
cal L
oad
(kN
)
Vertical Deformation (mm)