UNIVERSITY FACTBOOK - Illinois State University
62
FALL 2019 FACTBOOK UNIVERSITY
Transcript of UNIVERSITY FACTBOOK - Illinois State University

F A L L 2 0 1 9
FACTBOOKU N I V E R S I T Y

TABLE OF CONTENTS
QUICK GLANCEBoard of Trustees & University Administrators – Fall 2019 ………………………………………………………………………… 1Deans, Department Chairs, and School Directors – Fall 2019 2University Facts – Fall 2019 3Undergraduate Students – Fall 2019 4Graduate Students – Fall 2019 5College Enrollment by Race/Ethnicity – Fa 6Departmental Faculty Characteristics – Fall 7
ORGANIZATIONAL CHARTSPresident – Larry Dietz 8Vice President Academic Affairs & Provost – Jan Murphy 9Vice President for Finance & Planning – Dan Stephens 10Vice President for Student Affairs – Levester Johnson 11Vice President for University Advancement – Pat Vickerman 12
STUDENTSNew
Applicants, Acceptances, & Enrollments – Fall 2019 13First Time in College Students Test Scores – Fall 2019 14FTIC ACT Scores – Fall 2015 through Fall 2019 15Race/Ethnicity – Fall 2015 through Fall 2019 16New Undergraduate Transfers – Fall 2015 through Fall 2019 …..………………………………………………………… 17
Total EnrollmentCareer Level – Fall 2010 through Fall 2019 18On-Off-Campus & Academic Level – Fall 2019 19College & Career Level – Fall 2019 20Race/Ethnicity & Career Level – Fall 2019 21Undergraduate Academic Level, Gender, & Race/Ethnicity – Fall 2019 …………………………………………………… 22Graduate Academic Level, Gender, & Race/Ethnicity – Fall 2019 23College & Race/Ethnicity – Fall 2019 24College & Gender – Fall 2019 25Academic Level & Age – Fall 2019 26Non-U.S. Citizen Students by College – Fall 2019 27Academic Level & Credit Hours – Fall 2010 through Fall 2019 28Gender, Career Level, & Hours – Fall 2015 through Fall 2019 29Illinois Residents by County – Fall 2019 30State of Residence – Fall 2019 31Non-U.S. Citizen Students – Fall 2019 ………………………………………………………………………… 32
…………………………………………………………………………
………………………………………………………………………………………………………………………………………………………………………………………………………………………………
2019 …………………………………………………………………………………….2019 …………………………………………………………………………………….
…………………………………………………………………………
………………………………………………………………………………………………………………………………………………………………………………………………………………………………………………………………………………………………
………………………………………………………………………………………………….…….……
………………………………………………………………………………………………………………………………………………………………………………………………………………………………
…………………………………………………………………………
…………………………………………………………………………
…………………………………………………………………………
………………………………………………………………………………………………
……………………………………………………………………………………………………………………………………………………
…………………………………………………………………………………………………………………………………………………………………………………………………………………………………………………………………………………………
……………………………………………………………………………..……………………………………………………………..…………………………………………………………
…………………………………………………………………………
……………………………………………………………
i

TABLE OF CONTENTS
STUDENTS (continued)Degrees Conferred
College – Fiscal Years 2015 through 2019 …………………………………………………………………………………… 33Undergraduate by Gender & Race/Ethnicity – Fiscal Years 2015 through 2019 34Graduate by Academic Level & Race/Ethnicity – Fiscal Years 2015 through 2019 …………………………………………… 35
OtherUndergraduate Class Size – Fall 2019 36Retention Rates, Graduation Rates and Time to Degree ……………………………………………………………………… 37
FACULTY/STAFFEmployee Full-Time Equivalency – Fall 2019 38Category, Gender, & Race/Ethnicity – Fall 2019 ………………………………………………………………………………..… 39Rank & Race/Ethnicity – Fall 2019 40Full-Time Equivalent (FTE) by College, Gender, & Tenure Status – Fall 2019 …………………………………….……………… 41College & Percent Appointment – Fall 2015 through Fall 2019 ……………………………………………………………………… 42Tenured/Tenure Track Departmental Rank by Age – Fall 2019 43
RESOURCESHistorical Expenditures – Fiscal Years 2015 through 2019 44Historical Appropriations – Fiscal Years 2016 through 2020 ……………………………………………………………………… 45Revenues by Source – Fiscal Years 2018 and 2019 ………………………………………………………………………………..… 46Sponsored Research, Instruction, Creative Works, & Service ……………………………………………………………………… 47Student Financial Aid & Institutional Support – Fiscal Year 2019 48Undergraduate Student Tuition & Fee Rates …………………………………………..…………………………………..…… 49Graduate Student Tuition & Fee Rates …………………………………………..…………………………………………..…… 50Milner Library ……………………………………………………………………………………………………………………… 51Gift Production, Alumni & Endowment – Fiscal Year 2019 ……………………………………………………………………… 52
REFERENCEUndergraduate Plan Inventory – Fall 2019 ………………………………………………………………………………………………… 53Graduate Plan Inventory - Master's and Doctoral - Fall 2019 ……………………………………………………………………… 54Graduate Plan Inventory - Certificates - Fall 2019 …………………………………………………………………………………… 55Peer Institutions ……………………………………………………………………………………………………………… 56
UNIVERSITY DEFINITIONSStudent Terms 57Employee Terms 58Other Terms 59
………………………………………………………………………………………………………………………..……………………………………………………………………………………………………………………………..……………………………………………………………………………………………………………………………..……
……………………………………………
………………………………………………………………………
………………………………………………………………………
………………………………………………………………………………..…
…………………………………………………………………………………………………
………………………………………………………………………
…………………………………………………………………………………………………
ii

QUICK GLANCEBOARD OF TRUSTEES & UNIVERSITY ADMINISTRATORS
Term ExpiresJanuary 2025 Larry Dietz PresidentJanuary 2023 Jan Murphy Vice President for Academic Affairs and ProvostJanuary 2023 Daniel Stephens Vice President for Finance and PlanningJanuary 2023 Levester Johnson Vice President for Student AffairsJanuary 2023 Pat Vickerman Vice President for University AdvancementJanuary 2025January 2025Student Trustee
Charles E. Hovey 1857-1862 David K. Berlo 1971-1973Richard Edwards 1862-1876 Gene A. Budig 1973-1977Edwin C. Hewett 1876-1890 Lloyd Watkins 1977-1988John W. Cook 1890-1899 Thomas Wallace 1988-1995Arnold Thompkins 1899-1900 David A. Strand 1995-1999David Felmley 1900-1930 Victor John Boschini Jr. 1999-2003Harry A. Brown 1930-1933 Al Bowman 2003-2013Raymond W. Fairchild 1933-1955 Timothy Flanagan 2013-2014Robert G. Bone 1956-1967 Larry Dietz 2014-PresentSamuel J. Braden 1967-1970
Mary Ann LouderbackRobert NavarroSharon RossmarkSarah Aguilar
Past and Current Presidents
Rocky Donahue
Board of Trustees Current Administrators
Julie Annette Jones- ChairKathryn BohnRobert Dobski
1 FACTBOOK - FALL 2019

QUICK GLANCEDEANS, DEPARTMENT CHAIRS, & SCHOOL DIRECTORS – FALL 2019
College of Applied Science and Technology Dean, Dr. Todd McLodaDepartment of Agriculture……………………………………………… Chair, Dr. Brent Beggs*Department of Criminal Justice Sciences………………………………… Chair, Dr. Brent TeasdaleDepartment of Family and Consumer Sciences……………………….. Chair, Dr. Marla Reese-Weber*Department of Health Sciences…………………………………………… Chair, Dr. Chris GrieshaberSchool of Information Technology……………………………………… Director, Dr. Traci CarteSchool of Kinesiology and Recreation…………………………………… Director, Dr. Barb Schlatter*Department of Military Science………………………………………… Chair, Major Kraig KlineDepartment of Technology……………………………………………… Chair, Dr. Ted Branoff
College of Arts and Sciences Dean, Dr. Diane Zosky*School of Biological Sciences…………………………………………… Director, Dr. Craig GattoDepartment of Chemistry………………………………………………… Chair, Dr. Craig McLauchlanSchool of Communication……………………………………………… Director, Dr. Stephen HuntDepartment of Communication Sciences and Disorders………………… Chair, Dr. Scott Seeman*Department of Economics……………………………………………… Chair, Dr. David CleetonDepartment of English…………………………………………………… Chair, Dr. Ricardo Cruz*Department of Geography-Geology……………………………………… Chair, Dr. Dagmar BudikovaDepartment of History…………………………………………………… Chair, Dr. Ross KennedyDepartment of Languages, Literatures, and Cultures…………………… Chair, Dr. Bruce BurninghamDepartment of Mathematics……………………………………………… Chair, Dr. George SeelingerDepartment of Philosophy……………………………………………… Chair, Dr. Chris HorvathDepartment of Physics…………………………………………………… Chair, Dr. Dan HollandDepartment of Politics and Government………………………………… Chair, Dr. T.Y. WangDepartment of Psychology……………………………………………… Chair, Dr. Scott JordanSchool of Social Work…………………………………………………… Director, Dr. Doris Houston*Department of Sociology/Anthropology………………………………… Chair, Dr. Joan Brehm
College of Business Dean, Dr. Ajay SamantDepartment of Accounting……………………………………………… Chair, Dr. Deborah SeifertDepartment of Finance, Insurance, and Law…………………………… Chair, Dr. Domingo Joaquin*Department of Management & Quantitative Methods…………………… Chair, Dr. Roberta Trites*Department of Marketing………………………………………………… Chair, Dr. Horace Melton
College of Education Dean, Dr. Jim WolfingerSchool of Teaching and Learning………………………...……………… Director, Dr. Alan Bates*Department of Educational Administration & Foundations……………… Chair, Dr. Lenford SuttonDepartment of Special Education………………………………………… Chair, Dr. Susan Hildebrandt*
College of Fine Arts Dean, Jean M. K. MillerSchool of Art……………………………………………………………… Director, Mr. Michael WilleSchool of Music………………………………………………………… Director, Dr. Steve Parsons School of Theatre and Dance…………………………………………… Director, Dr Anne Haugo
Mennonite College of Nursing Dean, Dr. Judy NeubranderUniversity Libraries Dean, Dr. Shari Zeck**Interim/Acting
2 FACTBOOK - FALL 2019

QUICK GLANCEUNIVERSITY FACTS – FALL 2019
Enrollment Total Retention and Graduation Rates Milner Library HoldingsUndergraduate 18,250 78.6% 1,425,469Graduate 2,628 141,899
Total 20,878Research and Sponsored Programs
Enrollment by Gender Living Alumni 143Male 9,050 134,160 $28.5 millionFemale 11,792 50,997Non-Binary or Not Disclosed 36 1,330 Grounds, Buildings, and Facilities
32,694Enrollment by Race/Ethnicity 219,181American Indian/Alaskan Native 24Black or African American 1,880 Student Financial AidAsian 477Hispanic 2,260 $476.41 Hawaiian or Pacific Islander 21 $495.87 White 14,865 Student HousingTwo or More Selections 666No Response 127Non-U.S. Citizen 558
University Accreditation AgenciesNew Students Fall 2019 University Employees
358 1,3721,510 64
First Time in College (FTIC) Cohort 3,860 23 Average ACT Score 23.3 97
726 Student to Faculty RatioDegrees Conferred in Fiscal Year 2019 1,518 19:1Baccalaureate 4,472 3,800 Masters 730Certificates 136Doctoral/First Professional 65
Total 5,403
Locations Unknown ISU has 1,180 acres and 188 buildings. The estimated replacement value of the facilities is $4.5 billion.Total
FTIC returning for second fall Volumes6-Year Graduation Rate (before 7th fall)
69.5% Printed and Electronic Periodicals
Proposals AwardedIllinois Funds Awarded in Fiscal Year 20Other U.S. StatesForeign Countries
Fall 2019 Tuition & Fees Per Credit Hour - New Students (State Resident)79.3 percent (17,733) of all students received
financial support in fiscal year 2019. UndergraduateGraduate
29.7 percent of students live in on-campus housing; another 0.5 percent live in off-campus, University-owned housing.
Fiscal Year 2019 Operating $479 million
Higher Learning Commission of the North Central Association of Colleges and Schools and Council for the Accreditation of Educator Preparation (formerly NCATE)
4-Year College Transfers Departmental FacultyCommunity College Transfers Non-Departmental Faculty
Library FacultyLab School FacultyAdministrative/ProfessionalCivil ServiceTotal
3 FACTBOOK - FALL 2019
QUICK GLANCEUNDERGRADUATE STUDENTS – FALL 2019
Academic Level Headcount FTE1 Average AgeFreshman 5,152 4,897 18.4 Sophomore 3,638 3,415 19.7 Junior 4,357 4,019 21.1 Senior 5,052 4,406 22.6 Non-Degree Seeking Undergraduate 51 27 20.7
Total 18,250 16,764
Race/Ethnicity HeadcountAmerican Indian/Alaskan Native 21 Black or African American 1,705 Asian 419 Hispanic2 2,106 Hawaiian or Pacific Islander 19 White 13,165 Two or More Selections3 609 No Response4 70 Non-U.S. Citizen4 136
Total 18,250
2 Hispanic students of any race are reported as Hispanic3 Excludes Hispanic4 Beginning in fall 2019, 'Non-U.S. Citizen' students taking courses outside the U.S. are now included in the 'No Response' category per federal guidelines.
1 Undergraduate Full-Time Equivalency (FTE) = Sum of Credit Hours / 15
Freshman28.2%
Sophomore19.9%
Junior23.9%
Senior27.7%
Non-Degree Seeking
0.3%
Undergraduate Students by Academic Level
Fall 2019
0 500 1,000 1,500 2,000 2,500
American Indian/Alaskan Native (0.1%)
Black or African American (9.3%)
Asian (2.3%)
Hispanic (11.5%)
Hawaiian or Pacific Islander (0.1%)
Two or More Selections (3.3%)
No Response (0.4%)
Non-U.S. Citizen (0.7%)
Undergraduate Enrollment by Race/EthnicityFall 2019
Excludes White Students (72.1%)
4 FACTBOOK - FALL 2019

QUICK GLANCEGRADUATE STUDENTS – FALL 2019
Academic Level Headcount FTE1 Average AgeMaster's 1,927 1,310 28.0 Certificate 117 55 34.6 Doctoral/First Professional 468 235 36.7 Non-Degree Seeking Graduate 116 40 35.8
Total 2,628 1,640
Race/Ethnicity HeadcountAmerican Indian/Alaskan Native 3 Black or African American 175 Asian 58 Hispanic2 154 Hawaiian or Pacific Islander 2 White 1,700 Two or More Selections3 57 No Response4 57 Non-U.S. Citizen4 422
Total 2,628
2 Hispanic students of any race are reported as Hispanic3 Excludes Hispanic4 Beginning in fall 2019, 'Non-U.S. Citizen' students taking courses outside the U.S. are now included in the 'No Response' category per federal guidelines.
1 Graduate Full-Time Equivalency (FTE) = Sum of Credit Hours / 12Master's73.3%
Certificate4.5%
Doctoral17.8%
Non-Degree Seeking Graduate
4.4%
Graduate Students by Academic Level Fall 2019
0 100 200 300 400 500
American Indian/Alaskan Native (0.1%)
Black or African American (6.7%)
Asian (2.2%)
Hispanic (5.9%)
Hawaiian or Pacific Islander (0.1%)
Two or More Selections (2.2%)
No Response (2.2%)
Non-U.S. Citizen (16.1%)
Graduate Enrollment by Race/EthnicityFall 2019
Excludes White Students (64.7%)
5 FACTBOOK - FALL 2019
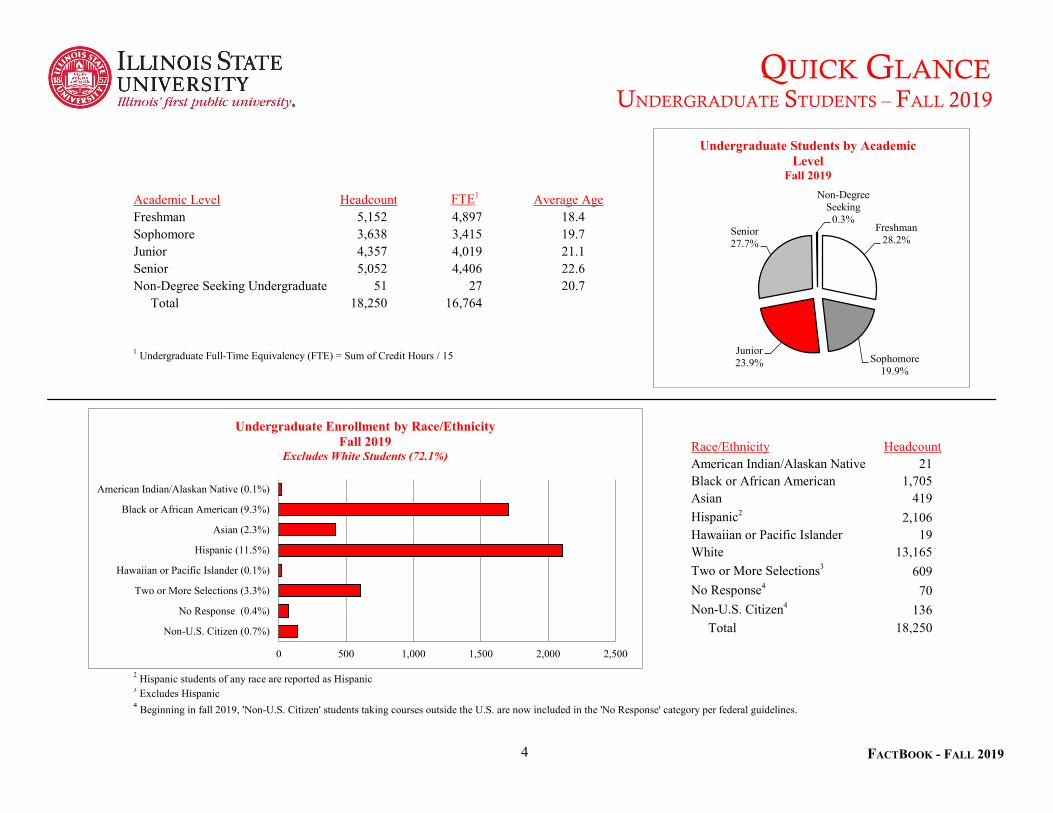
QUICK GLANCECOLLEGE ENROLLMENT BY RACE/ETHNICITY – FALL 2019
American Indian/ Black/African Hawaiian/ Two or More No Non-U.S.Alaskan Native American Asian Hispanic Pacific Islander White Selections4 Response5 Citizen5 Total
College1
Applied Science and Technology 2 467 120 488 5 3,147 139 3 125 4,496Arts and Sciences 5 604 122 724 6 4,094 229 22 162 5,968Business 5 290 105 364 3 2,797 122 76 73 3,835Education 7 181 45 282 1 2,428 56 9 16 3,025Fine Arts -- 100 26 139 2 877 42 11 41 1,238Mennonite College of Nursing 1 17 29 72 2 638 16 2 2 779Office of the Provost 2 4 221 30 191 2 884 62 4 139 1,537
Total 24 1,880 477 2,260 21 14,865 666 127 558 20,878
3 Hispanic students of any race are reported as Hispanic4 Excludes Hispanic5 Beginning in fall 2019, 'Non-U.S. Citizen' students taking courses outside the U.S. are included in the 'No Response' category per federal guidelines.
1 Primary College 2 Office of the Provost includes Interdisciplinary Studies, University Studies, Undeclared, and Non-Degree Seeking Undergraduate and Graduate students.
CAST21.5%
CAS28.6%COB
18.4%
COE14.5%
CFA5.9%
MCN3.7%
Provost7.4%
Total Enrollment by College Fall 2019
6 FACTBOOK - FALL 2019
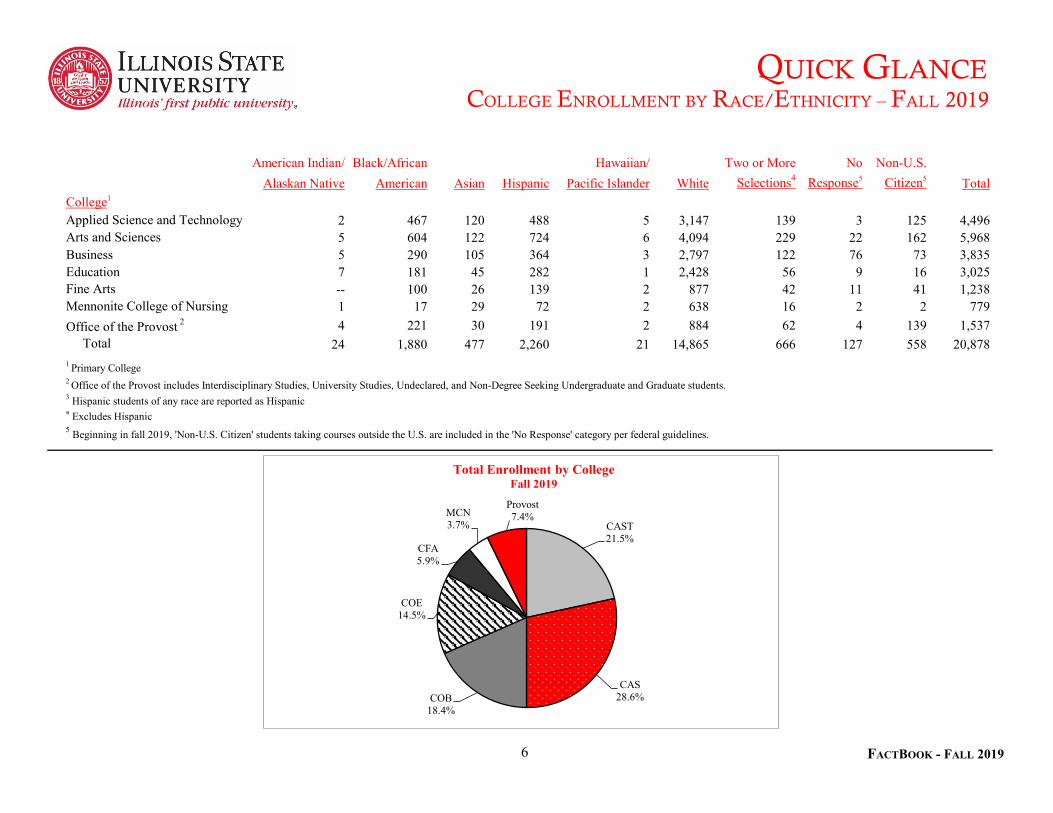
QUICK GLANCEDEPARTMENTAL FACULTY CHARACTERISTICS – FALL 2019
Rank Male Female NBND1 Total Rank Full-Time Part-Time TotalProfessor 175 102 -- 277 Professor 261 16 277Associate Professor 133 138 -- 271 Associate Professor 249 22 271Assistant Professor 87 109 -- 196 Assistant Professor 192 4 196Other2 211 417 -- 628 Other2 209 419 628
Total 606 766 -- 1,372 Total 911 461 1,372
Race/Ethnicity Number PercentAmerican Indian/Alaskan Native 3 0.2 Tenured/Tenure Non-TenureBlack or African American 50 3.6 Years of Service Track TrackAsian 84 6.1 0-3 Years 146 215 361Hispanic3 33 2.4 4-6 Years 82 118 200Hawaiian or Pacific Islander -- -- 7-9 Years 89 87 176White 1,025 74.7 10-14 Years 136 87 223Two or More Selections4 11 0.8 15-19 Years 131 48 179No Response5 132 9.6 20 or More Years 160 73 233Non-U.S. Citizen5 34 2.5 Total 744 628 1,372
Total 1,372 100.01 Non-Binary or Not Disclosed2 Non-Tenure Track & Emeriti Faculty3 Hispanic students of any race are reported as Hispanic4 Excludes Hispanic5 Beginning in fall 2019, 'Non-U.S. Citizen' students taking courses outside the U.S. are now included in the 'No Response' category per federal guidelines.
Gender Percent Appointment
Tenure Status
Total
0
100
200
300
400
500
Professor Associate Professor Assistant Professor Non-Tenure Track & EmeritiFaculty
Departmental Faculty by Rank and Gender Fall 2019
Male Female
7 FACTBOOK - FALL 2019

ORGANIZATIONAL CHARTSPRESIDENT – LARRY DIETZ
Larry Dietz serves as the 19th President of Illinois State University, a position he assumed on March 22, 2014. During his tenure the University has seen record enrollment, including increases in enrollment of students from underrepresented groups, while maintaining high academic quality. Illinois State University continues to be ranked among the top 100 universities in the United States, recognized for its strong retention rate, top 10% graduation rate, and very low student loan default rate. The University has achieved record fundraising in recent years surpassing its $150 million goal for Redbirds Rising: The Campaign for Illinois State with over a year left in the campaign. Despite difficult economic times in Illinois, Illinois State University has remained strong and stable under President Dietz's leadership and is making plans for the future based on values and vision.
Dietz came to Illinois State University in June 2011 as vice president for Student Affairs and tenured associate professor in the Department of Educational Administration and Foundations. Previously, he served as vice chancellor for Student Affairs at Southern Illinois University Carbondale (SIUC) for 10 years. Dietz also served as special assistant to the chancellor at SIUC and as a tenured associate professor in educational administration and higher education. Prior to his tenure there, he served as vice chancellor for Student Affairs and Enrollment Management, among other leadership positions, at the University of Missouri-Kansas City and in leadership positions at Iowa State University.
Dietz earned a Ph.D. in higher education administration and a master's degree in higher education and student personnel from Iowa State University. He has a bachelor's degree in political science from Southern Illinois University. He attended the Institute for Educational Management at Harvard University, a Fulbright International Education Seminar for Administrators in Germany and the Harvard Management Development Program.
A strong supporter of global education, Dietz has implemented plans to enhance diversity, support global learning, and create a global campus environment at Illinois State University. His international experiences include representing the American Universities Iraq Consortium on a panel with Prime Minister Al-Malaki and representing SIUC at the Iraq Education Initiative in Baghdad. In addition, he had responsibility for SIUC's campus in Japan and has negotiated agreements with institutions in China, Malaysia, Kuwait, Germany and the Czech Republic. The number of students, faculty, and administrators selected as Fulbright Scholars to study and teach in institutions across the globe has significantly increased as have the number of students studying abroad and international students enrolled at the university.
President
General Counsel
Assistant to the President/ Chief of StaffDirector of Government Relations
Director of Equal Opportunity and AccessDirector of Internal Auditing and University Ethics Officer
Director of Intercollegiate Athletics
Vice President for Academic Affairs and Provost
Vice President for Finance and Planning
Vice President for Student Affairs
Vice President for University Advancement
Director of Presidental and Trustee Events
8 FACTBOOK - FALL 2019
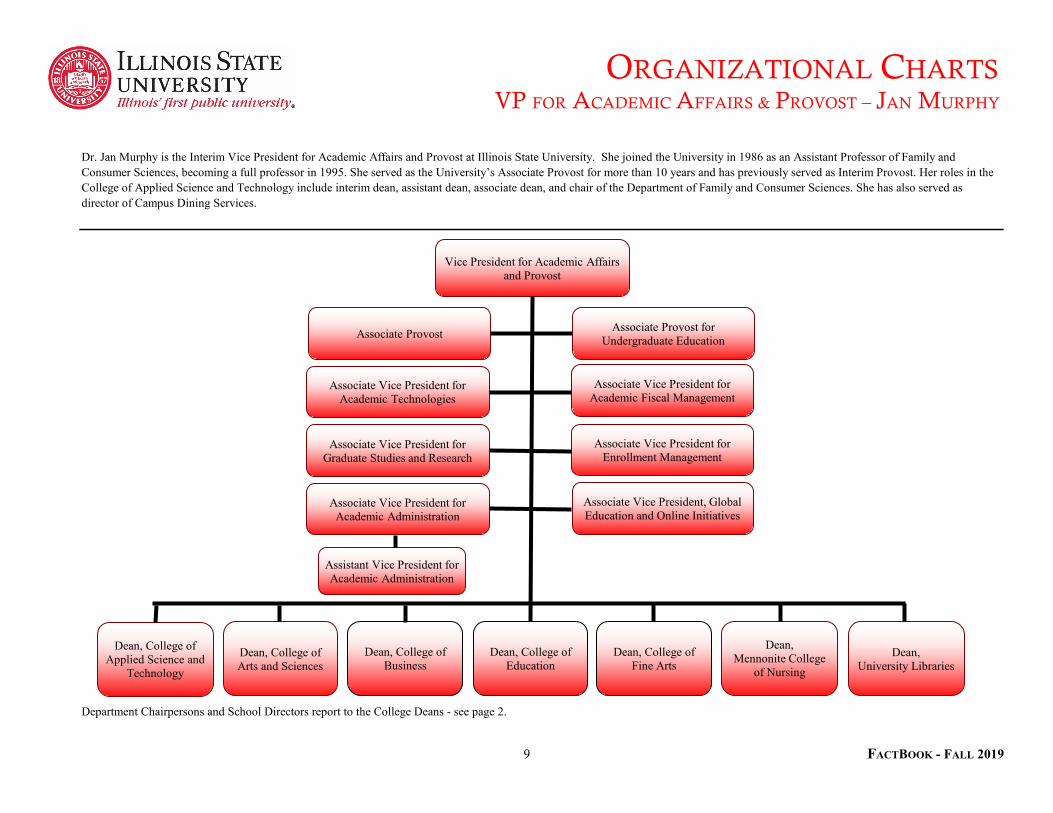
ORGANIZATIONAL CHARTSVP FOR ACADEMIC AFFAIRS & PROVOST – JAN MURPHY
Department Chairpersons and School Directors report to the College Deans - see page 2.
Dr. Jan Murphy is the Interim Vice President for Academic Affairs and Provost at Illinois State University. She joined the University in 1986 as an Assistant Professor of Family and Consumer Sciences, becoming a full professor in 1995. She served as the University’s Associate Provost for more than 10 years and has previously served as Interim Provost. Her roles in the College of Applied Science and Technology include interim dean, assistant dean, associate dean, and chair of the Department of Family and Consumer Sciences. She has also served as director of Campus Dining Services.
Associate Provost Associate Provost for Undergraduate Education
Associate Vice President for Academic Technologies
Associate Vice President for Academic Fiscal Management
Associate Vice President for Graduate Studies and Research
Dean, Mennonite College
of Nursing
Dean, College of Applied Science and
Technology
Dean, College of Business
Dean, College of Fine Arts
Dean, University Libraries
Dean, College of Education
Vice President for Academic Affairs and Provost
Associate Vice President for Enrollment Management
Dean, College of Arts and Sciences
Associate Vice President for Academic Administration
Associate Vice President, Global Education and Online Initiatives
Assistant Vice President for Academic Administration
9 FACTBOOK - FALL 2019
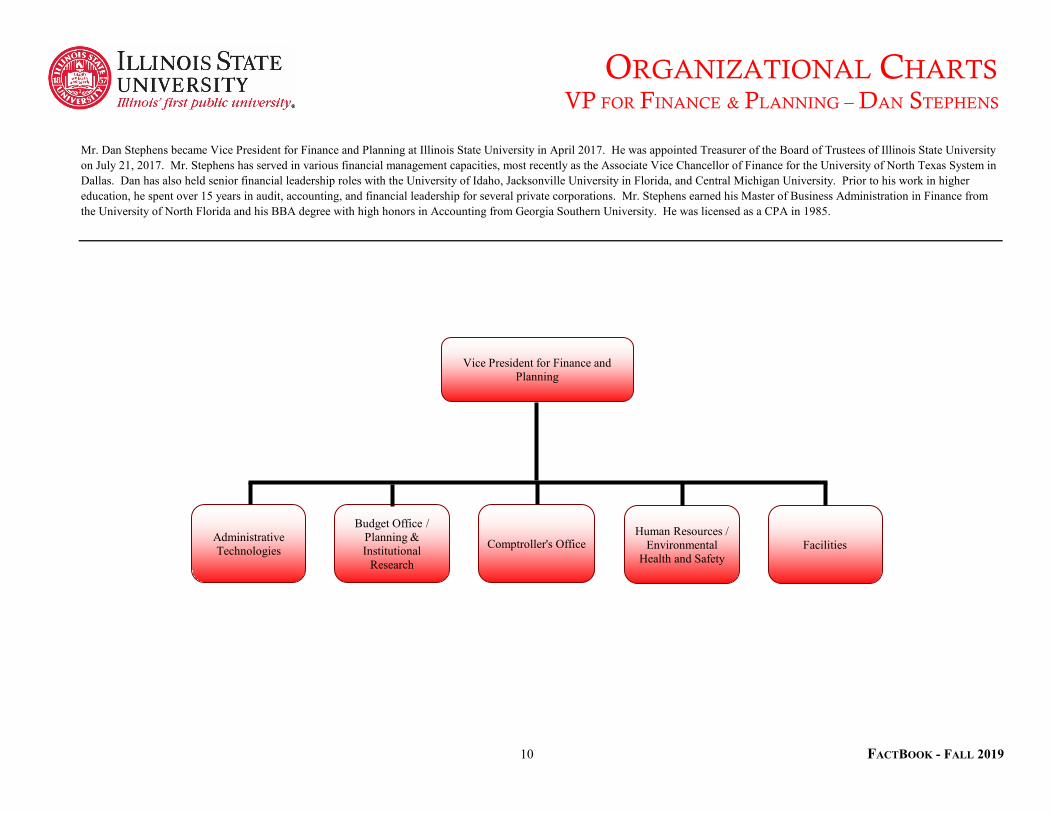
ORGANIZATIONAL CHARTSVP FOR FINANCE & PLANNING – DAN STEPHENS
Mr. Dan Stephens became Vice President for Finance and Planning at Illinois State University in April 2017. He was appointed Treasurer of the Board of Trustees of Illinois State University on July 21, 2017. Mr. Stephens has served in various financial management capacities, most recently as the Associate Vice Chancellor of Finance for the University of North Texas System in Dallas. Dan has also held senior financial leadership roles with the University of Idaho, Jacksonville University in Florida, and Central Michigan University. Prior to his work in higher education, he spent over 15 years in audit, accounting, and financial leadership for several private corporations. Mr. Stephens earned his Master of Business Administration in Finance from the University of North Florida and his BBA degree with high honors in Accounting from Georgia Southern University. He was licensed as a CPA in 1985.
Vice President for Finance and Planning
AdministrativeTechnologies
Budget Office / Planning & Institutional
Research
Comptroller's OfficeHuman Resources /
Environmental Health and Safety
Facilities
10 FACTBOOK - FALL 2019

ORGANIZATIONAL CHARTSVP FOR STUDENT AFFAIRS – LEVESTER JOHNSON
Dr. Levester Johnson became the Vice President for Student Affairs in July of 2016. Johnson has over 30 years of experience within student affairs including over 20 years at the Vice President level. He has held numerous leadership positions within professional organizations including NASPA-Student Affairs Administrators in Higher Education where he served as the first Chair of the Board of Directors and was recognized as a Pillar of the Profession. A native of Milwaukee, WI, Johnson holds a Bachelor of Arts Degree in Broadcast Communications from Marquette University, a Masters of Science Degree in College Student Personnel from Southern Illinois University, and an Education Doctorate Degree in Higher Education Administration from Indiana University.
Johnson has also been recognized throughout Higher Education for his innovative and effective use of social media in engaging campus communities. He is often asked to speak on the topic of social media within the U.S. and abroad.
Vice President for Student Affairs
Assistant Vice President Assistant Vice PresidentDean of Students
Assistant Vice President Executive Director, Business Operations
Executive Administrative Associate
Director, Student AffairsMarketing & Communication
Chief, University Police
Director, University Housing Services
Associate Director
Director, Student Access and Accommodation Services
Associate DeanLeadership Develoment,
Students Atty, Fraternity and Sorority Life, Student
Associate Dean Parent and Family Services,
Marketing, Commencement & Special Events, Diversity
Advocacy
Acting Director, Center for Community Engagement and
Service Learning
Director, Student Affairs Information Technology
Director, Assessment & Engagement Initiatives
Director, Career Center
Coordinator for Professional Development
Director, Event Management, Dining, & Hospitality
Executive Director, Campus Recreation
Director, Health Promotion & Wellness
Director, Student Counseling Services
Director, Student Health Services
Director, Emergency Management
11 FACTBOOK - FALL 2019

ORGANIZATIONAL CHARTSVP FOR UNIVERSITY ADVANCEMENT – PAT VICKERMAN
Pat Vickerman is the Vice President for University Advancement at Illinois State University. He served as Senior Associate Vice President for University Advancement from 2013 until September 2014 when he became Interim Vice President. He was named Vice President in May 2015. Pat has more than 20 years of experience in higher education fundraising including serving as a planned giving specialist in the University of Iowa’s first $1 billion campaign, campaign director for Iowa State University’s $867 million campaign, and vice president for Bradley University’s $163 million campaign. The $150 million Redbird Rising: The campaign for Illinois State was launched in 2018 and is the most ambitious fundraising campaign in the University's history. Emphasizing the importance of giving in advancing an institution’s mission and fostering a deeper level of engagement with donors have been hallmarks of Vickerman’s career. Vickerman is an active member of the Council for Support and Advancement of Education, Partnership for Philanthropic Planning, and the Chicago Council on Planned Giving. He earned his bachelor’s and master’s degrees from the University of Iowa.
Vice President for University Advancement & Executive Director
ISU Foundation
Executive Director, University
Marketing and Communication
Assistant Vice President,
Development
Executive Director, Alumni Relations
Executive Director, Development
Assistant to the Vice President
Chief Operations Officer,
Advancement and Foundations Operations
12 FACTBOOK - FALL 2019

STUDENTS — NEW APPLICANTS, ACCEPTANCES, & ENROLLMENTS – FALL 2019
First Time in College Students1 Applicants2 Acceptances Total Enrollments Yield Rate3 Total Show Rate3
American Indian or Alaskan Native 22 17 9 77% 53%Black or African American 3,138 1,832 440 58% 24%Asian 633 563 103 89% 18%Hispanic4 3,823 2,993 526 78% 18%Hawaiian or Pacific Islander 17 12 5 71% 42%White 7,780 7,223 2,599 93% 36%Two or More Selections - Excluding Hispanic 582 477 149 82% 31%No Response5 59 48 6 81% 13%Non-U.S. Citizen5 97 69 23 71% 33%
Total 16,151 13,234 3,860 82% 29%New Undergraduate Transfer Students1 Applicants2 Acceptances Total Enrollments Yield Rate3 Total Show Rate3
American Indian or Alaskan Native 4 4 2 100% 50%Black or African American 305 254 131 83% 52%Asian 102 86 41 84% 48%Hispanic4 431 395 212 92% 54%Hawaiian or Pacific Islander 1 1 1 100% 100%White 2,366 2,222 1,393 94% 63%Two or More Selections - Excluding Hispanic 127 112 66 88% 59%No Response5 18 11 15 61% 136%Non-U.S. Citizen5 26 16 8 62% 50%
Total 3,380 3,101 1,869 92% 60%New Graduate Students Applicants2 Acceptances Total Enrollments Yield Rate3 Total Show Rate3
American Indian or Alaskan Native 2 1 1 50% 100%Black or African American 153 97 57 63% 59%Asian 47 33 20 70% 61%Hispanic4 116 79 54 68% 68%Hawaiian or Pacific Islander 1 1 1 100% 100%White 1,071 748 450 70% 60%Two or More Selections - Excluding Hispanic 42 33 22 79% 67%No Response5 12 10 6 83% 60%Non-U.S. Citizen5 720 479 160 67% 33%
Total 2,164 1,481 771 68% 52%1 Excludes non-degree seeking undergraduate students.2 Only applicants with completed applications were included in these counts.3 Yield rate is the ratio of students who were accepted vs those who applied, while show rate is the ratio of students who enrolled vs those accepted. Cases that exceed 100% due to data anomalies.4 Hispanic students of any race are reported as Hispanic5 Beginning in fall 2019, 'Non-U.S. Citizen' students taking courses outside the U.S. are included in the 'No Response' category per federal guidelines.
13 FACTBOOK - FALL 2019
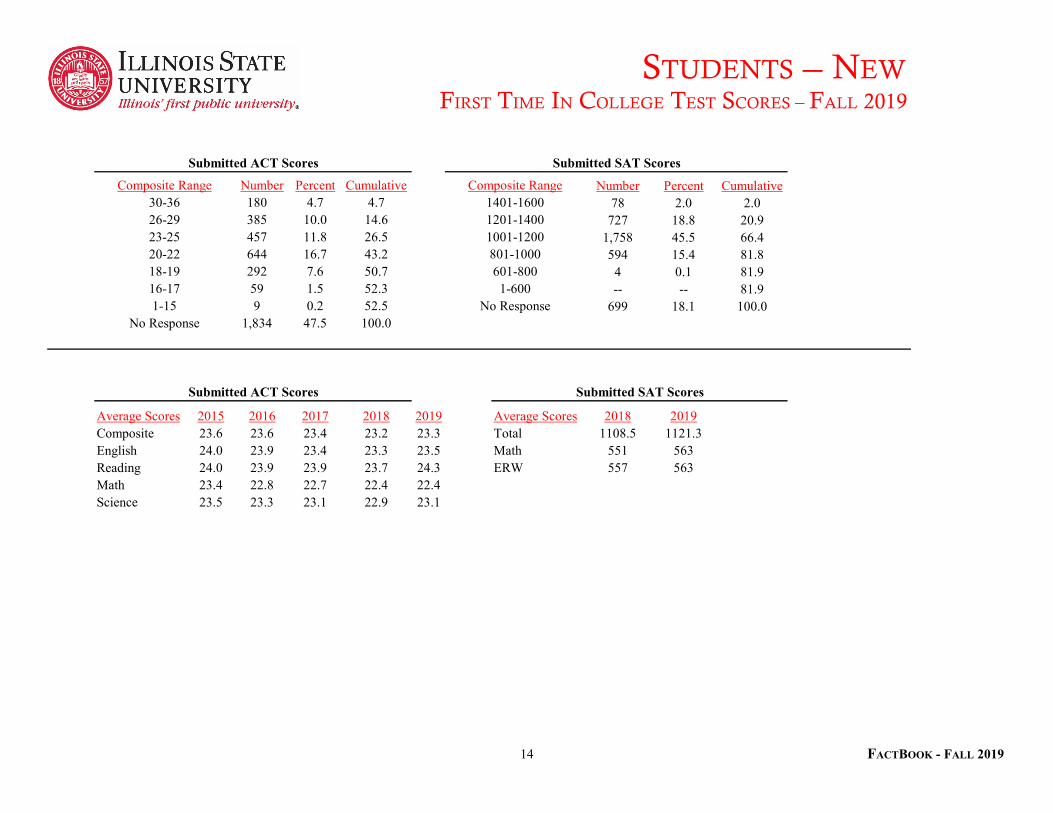
STUDENTS — NEW FIRST TIME IN COLLEGE TEST SCORES – FALL 2019
Number Percent Cumulative Number Percent Cumulative30-36 180 4.7 4.7 78 2.0 2.026-29 385 10.0 14.6 727 18.8 20.923-25 457 11.8 26.5 1,758 45.5 66.420-22 644 16.7 43.2 594 15.4 81.818-19 292 7.6 50.7 4 0.1 81.916-17 59 1.5 52.3 -- -- 81.91-15 9 0.2 52.5 699 18.1 100.0
No Response 1,834 47.5 100.03,860 --
Average Scores 2015 2016 2017 2018 2019 Average Scores 2018 2019Composite 23.6 23.6 23.4 23.2 23.3 Total 1108.5 1121.3English 24.0 23.9 23.4 23.3 23.5 Math 551 563Reading 24.0 23.9 23.9 23.7 24.3 ERW 557 563Math 23.4 22.8 22.7 22.4 22.4Science 23.5 23.3 23.1 22.9 23.1
1201-1400
Submitted ACT Scores Submitted SAT Scores
Composite Range Composite Range1401-1600
1001-1200801-1000601-800
1-600No Response
Submitted ACT Scores Submitted SAT Scores
14 FACTBOOK - FALL 2019

STUDENTS — NEW FIRST TIME IN COLLEGE TEST SCORES – FALL 2019
Number Percent Cumulative30-36 279 7.2 7.226-29 710 18.4 25.623-25 856 22.2 47.820-22 1,235 32.0 79.818-19 654 16.9 96.716-17 101 2.6 99.41-15 2 0.1 99.4
No Response 23 0.6 100.03,860
ACT Scores (including Converted SAT Scores)
Composite Range
30-367.2%
26-2918.4%
23-2522.2%
20-2232.0%
18-1916.9%
16-172.6%
1-150.1%
No Response0.6%
First Time in College StudentsACT Composite Scores
(including Converted SAT Scores)Fall 2019
15 FACTBOOK - FALL 2019
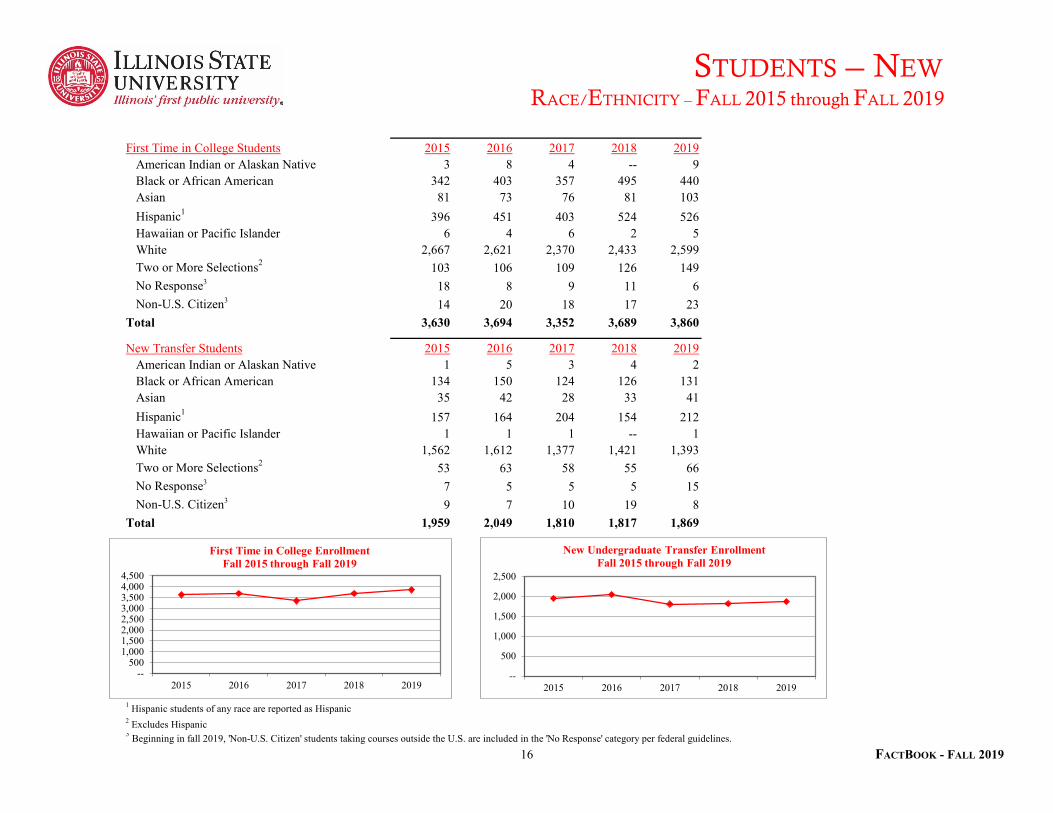
STUDENTS — NEW RACE/ETHNICITY – FALL 2015 through FALL 2019
First Time in College Students 2015 2016 2017 2018 2019American Indian or Alaskan Native 3 8 4 -- 9Black or African American 342 403 357 495 440Asian 81 73 76 81 103Hispanic1 396 451 403 524 526Hawaiian or Pacific Islander 6 4 6 2 5White 2,667 2,621 2,370 2,433 2,599Two or More Selections2 103 106 109 126 149No Response3 18 8 9 11 6Non-U.S. Citizen3 14 20 18 17 23
Total 3,630 3,694 3,352 3,689 3,860
New Transfer Students 2015 2016 2017 2018 2019American Indian or Alaskan Native 1 5 3 4 2Black or African American 134 150 124 126 131Asian 35 42 28 33 41Hispanic1 157 164 204 154 212Hawaiian or Pacific Islander 1 1 1 -- 1White 1,562 1,612 1,377 1,421 1,393Two or More Selections2 53 63 58 55 66No Response3 7 5 5 5 15Non-U.S. Citizen3 9 7 10 19 8
Total 1,959 2,049 1,810 1,817 1,869
1 Hispanic students of any race are reported as Hispanic2 Excludes Hispanic3 Beginning in fall 2019, 'Non-U.S. Citizen' students taking courses outside the U.S. are included in the 'No Response' category per federal guidelines.
--500
1,0001,5002,0002,5003,0003,5004,0004,500
2015 2016 2017 2018 2019
First Time in College EnrollmentFall 2015 through Fall 2019
--
500
1,000
1,500
2,000
2,500
2015 2016 2017 2018 2019
New Undergraduate Transfer EnrollmentFall 2015 through Fall 2019
16 FACTBOOK - FALL 2019

STUDENTS — NEW NEW UNDERGRADUATE TRANSFERS – FALL 2015 through FALL 2019
Enrollment 2015 2016 2017 2018 2019Total 1,959 2,049 1,810 1,817 1,869
Transfer Institution Type 2015 2016 2017 2018 2019Community College 1,545 1,673 1,477 1,509 1,5104-Year College 351 370 329 305 358Unknown 63 6 4 3 1
Total 1,959 2,049 1,810 1,817 1,869
Gender 2015 2016 2017 2018 2019Male 1,036 1,070 942 925 936Female 923 978 864 887 927Non-Binary or Not Disclosed -- 1 4 5 6
Entering Academic Level 2015 2016 2017 2018 2019Freshman (0-29 Hours) 672 424 271 217 243Sophomore (30-59 Hours) 618 939 618 582 670Junior (60-89 Hours) 608 604 846 925 857Senior (90 or More Hours) 61 82 75 93 99
Associate Degree 2015 2016 2017 2018 2019Yes N/A 315 525 531 597
Average Number of Hours Transferred into ISU N/A 45.7 52.2 54.1 52.2
Average Transfer GPA 3.12 3.10 3.12 3.16 3.16
17 FACTBOOK - FALL 2019
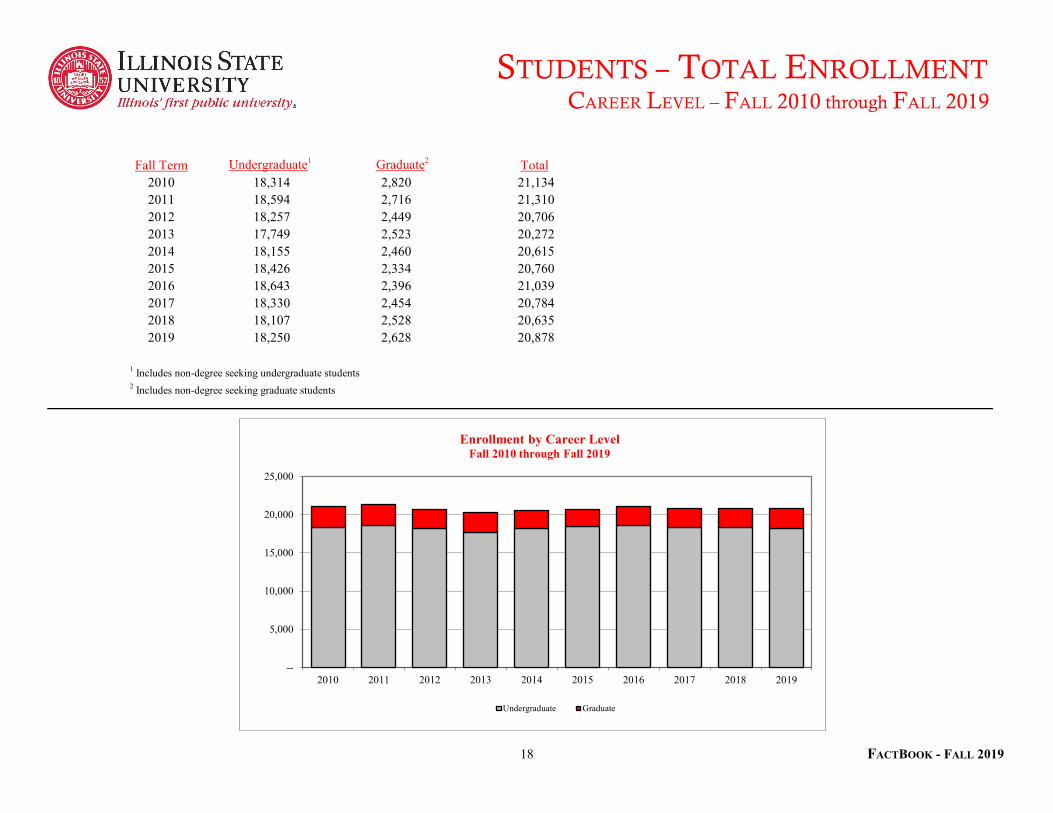
STUDENTS – TOTAL ENROLLMENT CAREER LEVEL – FALL 2010 through FALL 2019
Fall Term Undergraduate1 Graduate2 Total2010 18,314 2,820 21,1342011 18,594 2,716 21,3102012 18,257 2,449 20,7062013 17,749 2,523 20,2722014 18,155 2,460 20,6152015 18,426 2,334 20,7602016 18,643 2,396 21,0392017 18,330 2,454 20,7842018 18,107 2,528 20,6352019 18,250 2,628 20,878
1 Includes non-degree seeking undergraduate students2 Includes non-degree seeking graduate students
--
5,000
10,000
15,000
20,000
25,000
2010 2011 2012 2013 2014 2015 2016 2017 2018 2019
Enrollment by Career Level Fall 2010 through Fall 2019
Undergraduate Graduate
18 FACTBOOK - FALL 2019
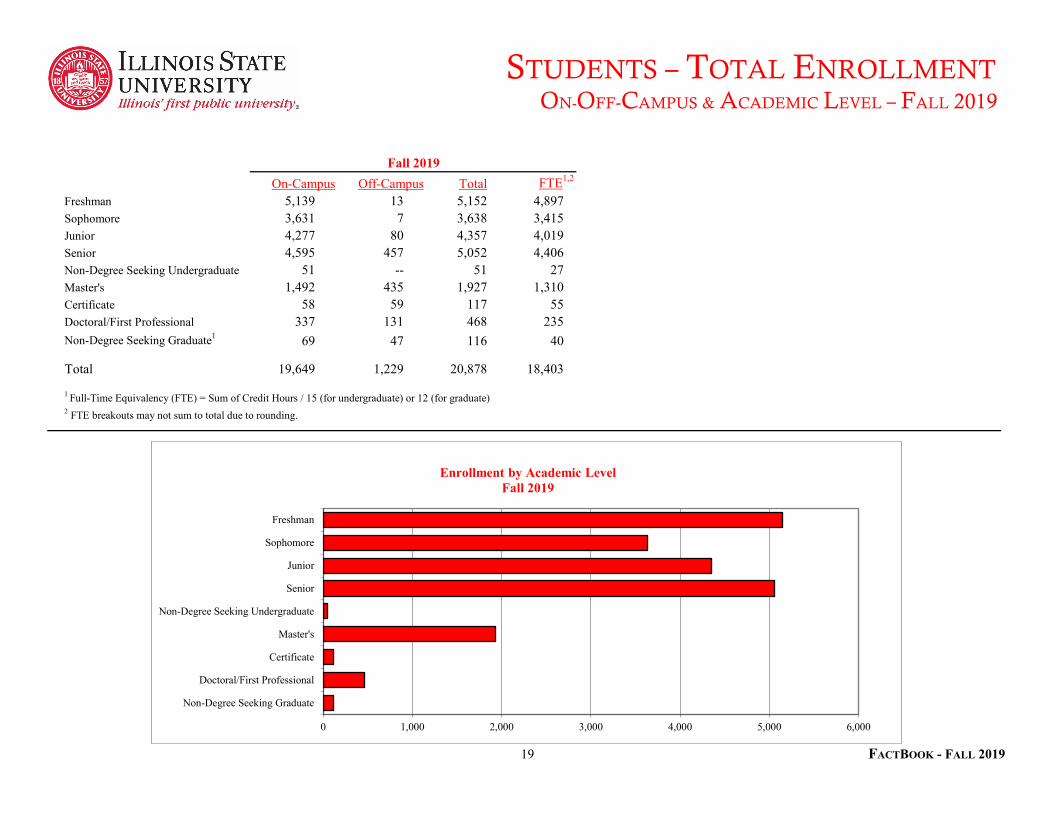
STUDENTS – TOTAL ENROLLMENT ON-OFF-CAMPUS & ACADEMIC LEVEL – FALL 2019
On-Campus Off-Campus Total FTE1,2
Freshman 5,139 13 5,152 4,897Sophomore 3,631 7 3,638 3,415Junior 4,277 80 4,357 4,019Senior 4,595 457 5,052 4,406Non-Degree Seeking Undergraduate 51 -- 51 27Master's 1,492 435 1,927 1,310Certificate 58 59 117 55Doctoral/First Professional 337 131 468 235Non-Degree Seeking Graduate1 69 47 116 40
Total 19,649 1,229 20,878 18,403
1 Full-Time Equivalency (FTE) = Sum of Credit Hours / 15 (for undergraduate) or 12 (for graduate)2 FTE breakouts may not sum to total due to rounding.
Fall 2019
0 1,000 2,000 3,000 4,000 5,000 6,000
Freshman
Sophomore
Junior
Senior
Non-Degree Seeking Undergraduate
Master's
Certificate
Doctoral/First Professional
Non-Degree Seeking Graduate
Enrollment by Academic LevelFall 2019
19 FACTBOOK - FALL 2019

STUDENTS – TOTAL ENROLLMENT COLLEGE & CAREER LEVEL – FALL 2019
Undergraduate Graduate Total
College/Provost Office1
Applied Science and Technology 4,117 379 4,496Arts and Sciences 5,127 841 5,968Business 3,569 266 3,835Education 2,369 656 3,025Wonsook Kim College of Fine Arts 1,091 147 1,238Mennonite College of Nursing 649 130 779Office of the Provost2 1,328 209 1,537Total 18,250 2,628 20,878
1 Primary College2 Office of the Provost includes Interdisciplinary Studies, University Studies, Undeclared, and Non-Degree Seeking Undergraduate and Graduate Students.
Fall 2019
20 FACTBOOK - FALL 2019

STUDENTS – TOTAL ENROLLMENT RACE/ETHNICITY & CAREER LEVEL – FALL 2019
Race/Ethnicity Undergraduate4 Graduate5 TotalAmerican Indian or Alaskan Native 21 3 24Black or African American 1,705 175 1,880Asian 419 58 477Hispanic1 2,106 154 2,260Hawaiian or Pacific Islander 19 2 21White 13,165 1,700 14,865Two or More Selections2 609 57 666No Response3 70 57 127Non-U.S. Citizen3 136 422 558Total 18,250 2,628 20,878
1 Hispanic students of any race are reported as Hispanic2 Excludes Hispanic3 Beginning in fall 2019, 'Non-U.S. Citizen' students taking courses outside the U.S. are included in the 'No Response' category per federal guidelines.4 Includes non-degree seeking undergraduate students5 Includes non-degree seeking graduate students
Fall 2019
0 500 1,000 1,500 2,000 2,500
Am. Indian/Alaskan Native
Black or African American
Asian
Hispanic
Hawaiian or Pacific Islander
Two or More Selections
No Response
Non-U.S. Citizen
Student Enrollment by Race/EthnicityFall 2019
Excludes White Students
21 FACTBOOK - FALL 2019

STUDENTS – TOTAL ENROLLMENT UGRD ACADEMIC LEVEL, GENDER, & RACE/ETHNICITY – FALL 2019
American Indian/ Black/African Hawaiian/ Two or More No Non-U.S.Alaskan Native American Asian Hispanic1 Pacific Islander White Selections2 Response3 Citizen3 Total
FreshmanMale 1 307 64 300 4 1,501 89 10 25 2,301Female 9 401 62 407 2 1,824 120 4 15 2,844Non-Binary or Not Disclosed -- -- 1 -- -- 6 -- -- -- 7
SophomoreMale 1 139 44 182 3 1,113 59 6 15 1,562Female 2 191 30 245 -- 1,520 67 5 9 2,069Non-Binary or Not Disclosed -- 1 -- -- -- 5 -- 1 -- 7
JuniorMale 2 144 46 211 3 1,532 63 8 11 2,020Female 1 192 61 268 3 1,700 70 16 13 2,324Non-Binary or Not Disclosed -- -- -- 2 -- 11 -- -- -- 13
SeniorMale 3 138 44 223 2 1,725 69 11 13 2,228Female 2 191 58 268 2 2,206 71 8 16 2,822Non-Binary or Not Disclosed -- -- -- -- -- 2 -- -- -- 2
Non-Degree SeekingMale -- -- 4 -- -- 8 1 1 5 19Female -- 1 5 -- -- 12 -- -- 14 32Non-Binary or Not Disclosed -- -- -- -- -- -- -- -- -- --
Undergraduate TotalMale 7 728 202 916 12 5,879 281 36 69 8,130Female 14 976 216 1,188 7 7,262 328 33 67 10,091Non-Binary or Not Disclosed -- 1 1 2 -- 24 -- 1 -- 29
1 Hispanic students of any race are reported as Hispanic2 Excludes Hispanic3 Beginning in fall 2019, 'Non-U.S. Citizen' students taking courses outside the U.S. are included in the 'No Response' category per federal guidelines.
22 FACTBOOK - FALL 2019

STUDENTS – TOTAL ENROLLMENT GRAD ACADEMIC LEVEL, GENDER, & RACE/ETHNICITY – FALL 2019
American Indian/ Black/African Hawaiian/ Two or More No Non-U.S.Alaskan Native American Asian Hispanic1 Pacific Islander White Selections2 Response3 Citizen3 Total
Master'sMale 2 33 19 28 1 413 20 18 192 726Female -- 48 22 72 -- 806 26 26 194 1,194Non-Binary or Not Disclosed -- -- -- 2 -- 3 1 1 -- 7
CertificateMale -- -- -- -- -- 11 -- -- 1 12Female -- 3 -- 6 -- 94 -- 1 1 105Non-Binary or Not Disclosed -- -- -- -- -- -- -- -- -- --
Doctoral/First ProfessionalMale 1 28 2 14 -- 84 -- 4 9 142Female -- 54 9 27 -- 204 6 5 21 326Non-Binary or Not Disclosed -- -- -- -- -- -- -- -- -- --
Non-Degree SeekingMale -- 2 3 3 1 29 1 -- 1 40Female -- 7 3 2 -- 56 3 2 3 76Non-Binary or Not Disclosed -- -- -- -- -- -- -- -- -- --
Graduate TotalMale 3 63 24 45 2 537 21 22 203 920Female -- 112 34 107 -- 1,160 35 34 219 1,701Non-Binary or Not Disclosed -- -- -- 2 -- 3 1 1 -- 7
1 Hispanic students of any race are reported as Hispanic2 Excludes Hispanic3 Beginning in fall 2019, 'Non-U.S. Citizen' students taking courses outside the U.S. are included in the 'No Response' category per federal guidelines.
23 FACTBOOK - FALL 2019
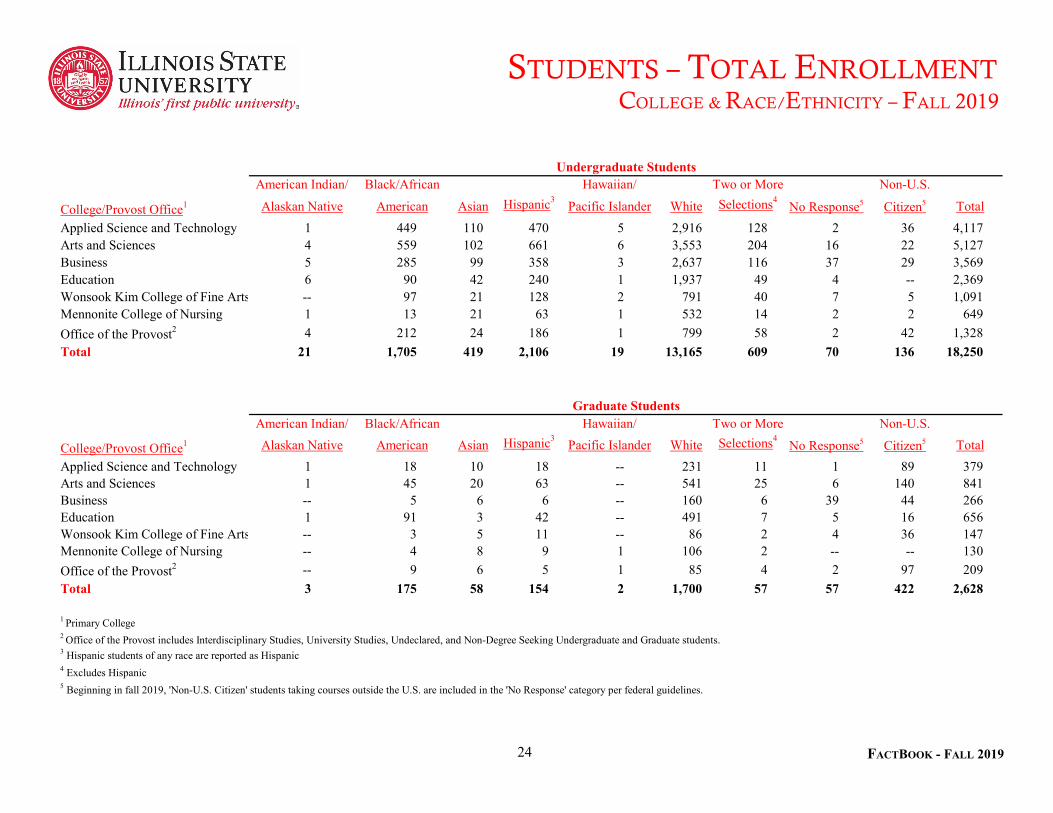
STUDENTS – TOTAL ENROLLMENT COLLEGE & RACE/ETHNICITY – FALL 2019
American Indian/ Black/African Hawaiian/ Two or More Non-U.S.
College/Provost Office1 Alaskan Native American Asian Hispanic3 Pacific Islander White Selections4No Response5 Citizen5 Total
Applied Science and Technology 1 449 110 470 5 2,916 128 2 36 4,117 Arts and Sciences 4 559 102 661 6 3,553 204 16 22 5,127 Business 5 285 99 358 3 2,637 116 37 29 3,569 Education 6 90 42 240 1 1,937 49 4 -- 2,369 Wonsook Kim College of Fine Arts -- 97 21 128 2 791 40 7 5 1,091 Mennonite College of Nursing 1 13 21 63 1 532 14 2 2 649 Office of the Provost2 4 212 24 186 1 799 58 2 42 1,328 Total 21 1,705 419 2,106 19 13,165 609 70 136 18,250
American Indian/ Black/African Hawaiian/ Two or More Non-U.S.
College/Provost Office1 Alaskan Native American Asian Hispanic3 Pacific Islander White Selections4No Response5 Citizen5 Total
Applied Science and Technology 1 18 10 18 -- 231 11 1 89 379 Arts and Sciences 1 45 20 63 -- 541 25 6 140 841 Business -- 5 6 6 -- 160 6 39 44 266 Education 1 91 3 42 -- 491 7 5 16 656 Wonsook Kim College of Fine Arts -- 3 5 11 -- 86 2 4 36 147 Mennonite College of Nursing -- 4 8 9 1 106 2 -- -- 130 Office of the Provost2 -- 9 6 5 1 85 4 2 97 209 Total 3 175 58 154 2 1,700 57 57 422 2,628
1 Primary College2 Office of the Provost includes Interdisciplinary Studies, University Studies, Undeclared, and Non-Degree Seeking Undergraduate and Graduate students.3 Hispanic students of any race are reported as Hispanic4 Excludes Hispanic5 Beginning in fall 2019, 'Non-U.S. Citizen' students taking courses outside the U.S. are included in the 'No Response' category per federal guidelines.
Undergraduate Students
Graduate Students
24 FACTBOOK - FALL 2019

STUDENTS – TOTAL ENROLLMENT COLLEGE & GENDER – FALL 2019
College/Provost Office1 Male FemaleNon-Binary or Not Disclosed Total
Applied Science and Technology 2,502 1,988 6 4,496Arts and Sciences 2,239 3,707 22 5,968Business 2,495 1,340 -- 3,835Education 387 2,638 -- 3,025Wonsook Kim College of Fine Arts 495 736 7 1,238Mennonite College of Nursing 122 657 -- 779Office of the Provost2 810 726 1 1,537Total 9,050 11,792 36 20,8781 Primary College2 Office of the Provost includes Interdisciplinary Studies, University Studies, Undeclared, and Non-Degree Seeking Undergraduate and Graduate students.
Fall 2019
0 1,000 2,000 3,000 4,000 5,000 6,000 7,000
CAST
CAS
COB
COE
WKCFA
MCN
Provost
Enrollment by CollegeFall 2019
25 FACTBOOK - FALL 2019

STUDENTS – TOTAL ENROLLMENT ACADEMIC LEVEL & AGE – FALL 2019
Total
Age as of September 3, 2019 Freshman Sophomore Junior Senior
Non-Degree Seeking
Undergraduate Total Master's Certificate
Doctoral/First
Professional
Non-Degree Seeking
Graduate TotalGrand Total
Under 18 62 2 1 -- 18 83 -- -- -- -- -- 8318 - 19 4,859 1,913 153 14 8 6,947 -- -- -- -- -- 6,94720 - 21 182 1,563 3,358 2,570 13 7,686 37 -- 1 -- 38 7,72422 - 24 33 117 621 1,958 8 2,737 766 27 35 20 848 3,58525 - 29 7 31 144 294 -- 476 585 16 95 30 726 1,20230 - 39 6 7 56 134 1 204 384 37 173 30 624 82840 - 49 2 3 16 59 3 83 114 27 112 16 269 35250 - 59 1 2 7 17 -- 27 36 8 44 13 101 12860 or over -- -- 1 6 -- 7 5 2 8 7 22 29
Total 5,152 3,638 4,357 5,052 51 18,250 1,927 117 468 116 2,628 20,878
Undergraduate Graduate
0 1,000 2,000 3,000 4,000 5,000 6,000
Enrollment by Academic LevelFall 2019
26 FACTBOOK - FALL 2019

STUDENTS – TOTAL ENROLLMENT NON-U.S. CITIZEN STUDENTS BY COLLEGE – FALL 2019
College/Provost Office3 Undergraduate Graduate TotalApplied Science and Technology 36 89 125Arts and Sciences 22 140 162Business 29 44 73Education -- 16 16Wonsook Kim College of Fine Arts 5 36 41Mennonite College of Nursing 2 -- 2Office of the Provost3 42 97 139
Total 136 422 5581 Beginning in fall 2019, 'Non-U.S. Citizen' students taking courses outside the U.S. are included in the 'No Response' category per federal guidelines.2 Primary College3 Office of the Provost includes Interdisciplinary Studies, University Studies, Undeclared, and Non-Degree Seeking Undergraduate and Graduate Students.
Fall 20191
0 10 20 30 40 50 60 70 80 90 100 110 120 130 140 150 160 170 180
CAST
CAS
COB
COE
WKCFA
MCN
Provost
Non-U.S. Citizen Students by CollegeFall 2019
27 FACTBOOK - FALL 2019
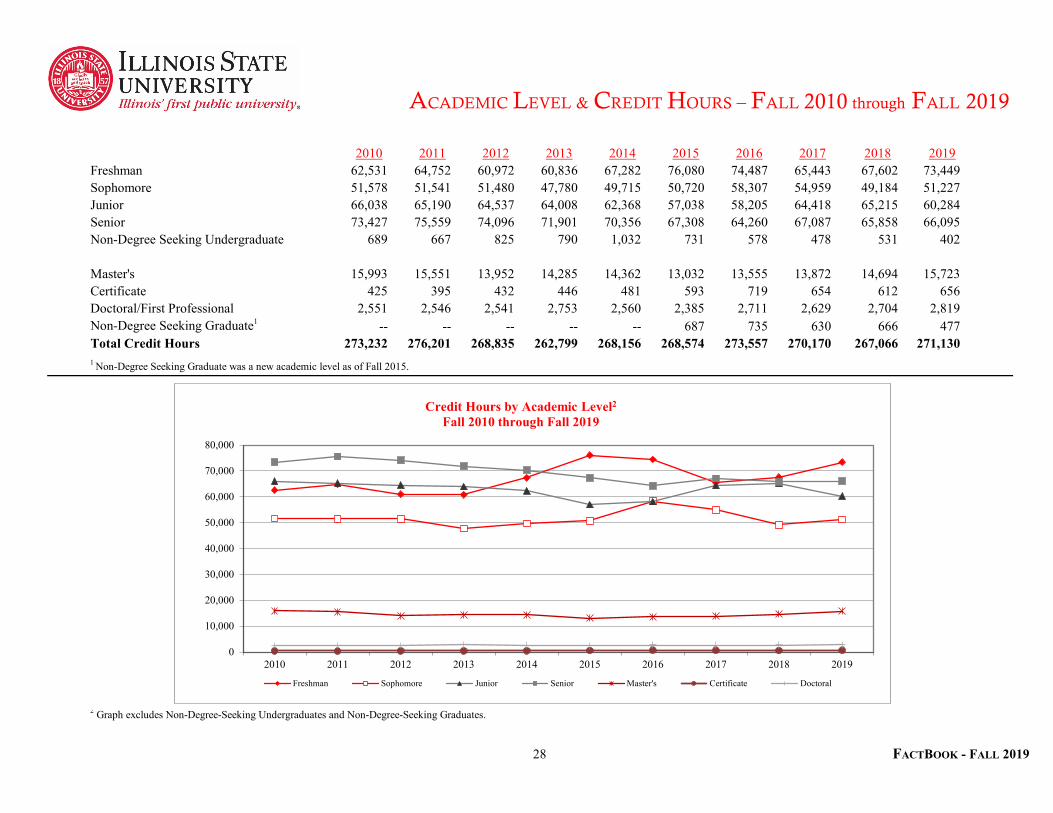
ACADEMIC LEVEL & CREDIT HOURS – FALL 2010 through FALL 2019
2010 2011 2012 2013 2014 2015 2016 2017 2018 2019Freshman 62,531 64,752 60,972 60,836 67,282 76,080 74,487 65,443 67,602 73,449Sophomore 51,578 51,541 51,480 47,780 49,715 50,720 58,307 54,959 49,184 51,227Junior 66,038 65,190 64,537 64,008 62,368 57,038 58,205 64,418 65,215 60,284Senior 73,427 75,559 74,096 71,901 70,356 67,308 64,260 67,087 65,858 66,095Non-Degree Seeking Undergraduate 689 667 825 790 1,032 731 578 478 531 402
Master's 15,993 15,551 13,952 14,285 14,362 13,032 13,555 13,872 14,694 15,723Certificate 425 395 432 446 481 593 719 654 612 656Doctoral/First Professional 2,551 2,546 2,541 2,753 2,560 2,385 2,711 2,629 2,704 2,819Non-Degree Seeking Graduate1 -- -- -- -- -- 687 735 630 666 477Total Credit Hours 273,232 276,201 268,835 262,799 268,156 268,574 273,557 270,170 267,066 271,1301 Non-Degree Seeking Graduate was a new academic level as of Fall 2015.
2 Graph excludes Non-Degree-Seeking Undergraduates and Non-Degree-Seeking Graduates.
0
10,000
20,000
30,000
40,000
50,000
60,000
70,000
80,000
2010 2011 2012 2013 2014 2015 2016 2017 2018 2019
Credit Hours by Academic Level2
Fall 2010 through Fall 2019
Freshman Sophomore Junior Senior Master's Certificate Doctoral
28 FACTBOOK - FALL 2019
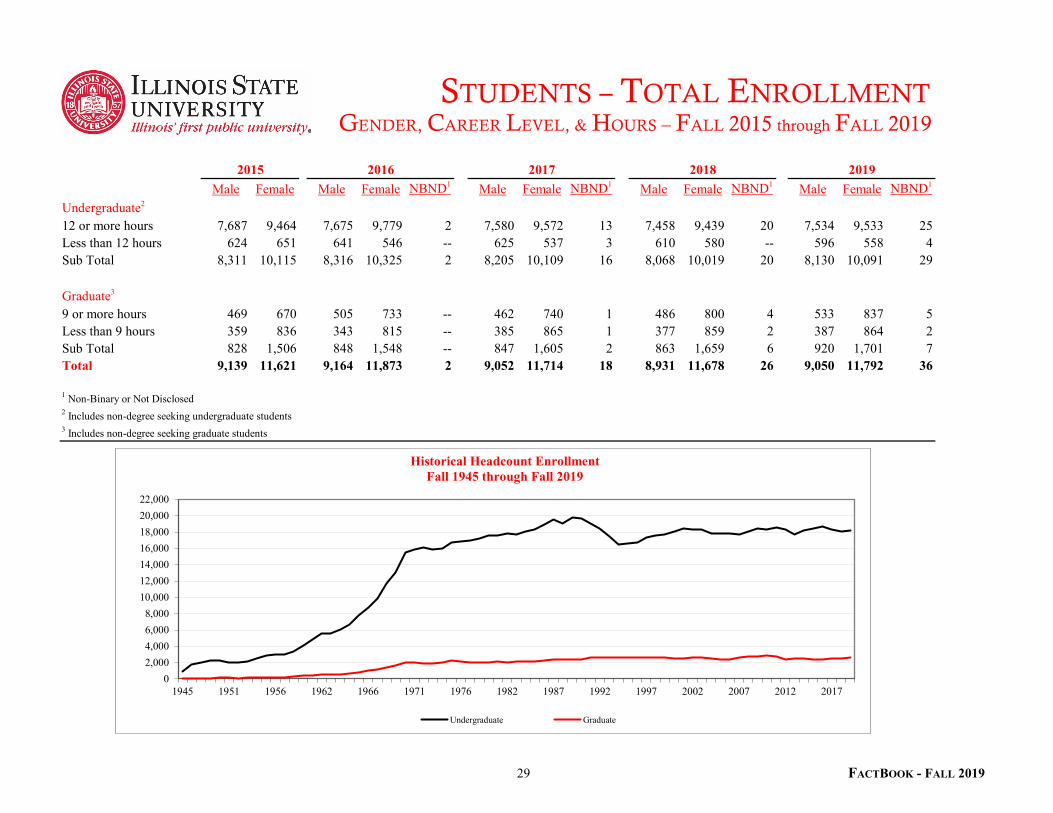
STUDENTS – TOTAL ENROLLMENT GENDER, CAREER LEVEL, & HOURS – FALL 2015 through FALL 2019
Male Female Male Female NBND1 Male Female NBND1 Male Female NBND1 Male Female NBND1
Undergraduate2
12 or more hours 7,687 9,464 7,675 9,779 2 7,580 9,572 13 7,458 9,439 20 7,534 9,533 25Less than 12 hours 624 651 641 546 -- 625 537 3 610 580 -- 596 558 4Sub Total 8,311 10,115 8,316 10,325 2 8,205 10,109 16 8,068 10,019 20 8,130 10,091 29
Graduate3
9 or more hours 469 670 505 733 -- 462 740 1 486 800 4 533 837 5Less than 9 hours 359 836 343 815 -- 385 865 1 377 859 2 387 864 2Sub Total 828 1,506 848 1,548 -- 847 1,605 2 863 1,659 6 920 1,701 7Total 9,139 11,621 9,164 11,873 2 9,052 11,714 18 8,931 11,678 26 9,050 11,792 36
1 Non-Binary or Not Disclosed2 Includes non-degree seeking undergraduate students3 Includes non-degree seeking graduate students
2015 2016 2017 2018 2019
02,0004,0006,0008,000
10,00012,00014,00016,00018,00020,00022,000
1945 1951 1956 1962 1966 1971 1976 1982 1987 1992 1997 2002 2007 2012 2017
Historical Headcount Enrollment Fall 1945 through Fall 2019
Undergraduate Graduate
29 FACTBOOK - FALL 2019

STUDENTS – TOTAL ENROLLMENT ILLINOIS RESIDENTS BY COUNTY – FALL 2019
County Undergrad Grad County Undergrad Grad County Undergrad GradAdams 39 3 Jackson 15 3 Randolph 5 --Alexander -- 1 Jasper 2 -- Richland 2 1Bond 8 -- Jefferson 8 2 Rock Island 81 10Boone 44 1 Jersey 10 -- Saint Clair 79 6Brown 4 -- Jo Daviess 7 -- Saline 2 1Bureau 91 5 Kane 783 28 Sangamon 385 57Calhoun 1 -- Kankakee 195 15 Schuyler 8 --Carroll 10 1 Kendall 272 9 Scott 2 --Cass 8 1 Knox 46 9 Shelby 19 5Champaign 356 73 La Salle 251 27 Stark 8 1Christian 33 6 Lake 957 40 Stephenson 29 1Clark 1 -- Lee 54 1 Tazewell 463 125Clay 3 -- Livingston 188 27 Vermilion 90 11Clinton 19 -- Logan 82 11 Wabash 1 --Coles 29 7 Macon 190 34 Warren 12 2Cook 4,685 222 Macoupin 49 5 Washington 7 1Crawford 2 2 Madison 107 6 Wayne 3 1Cumberland 3 1 Marion 2 1 Whiteside 47 2DeKalb 105 8 Marshall 23 2 Will 1,552 52DeWitt 65 16 Mason 12 1 Williamson 8 1Douglas 29 6 McDonough 32 3 Winnebago 202 17DuPage 1,791 56 McHenry 716 27 Woodford 217 39Edgar 6 -- McLean 1,885 737Edwards -- 1 Menard 23 1Effingham 28 1 Mercer 17 2Fayette 10 -- Monroe 22 --Ford 50 6 Montgomery 19 --Franklin 2 -- Morgan 42 5Fulton 37 3 Moultrie 18 4Greene 5 1 Ogle 54 5 Bold - McLean and Bordering CountiesGrundy 140 16 Peoria 432 94Hancock 7 2 Perry 2 -- Red - Cook and Bordering CountiesHenderson 1 -- Piatt 57 10Henry 82 5 Pike 2 -- Unknown IL County 6 3Iroquois 62 4 Putnam 20 3 Illinois Total 17,578 1,896
30 FACTBOOK - FALL 2019
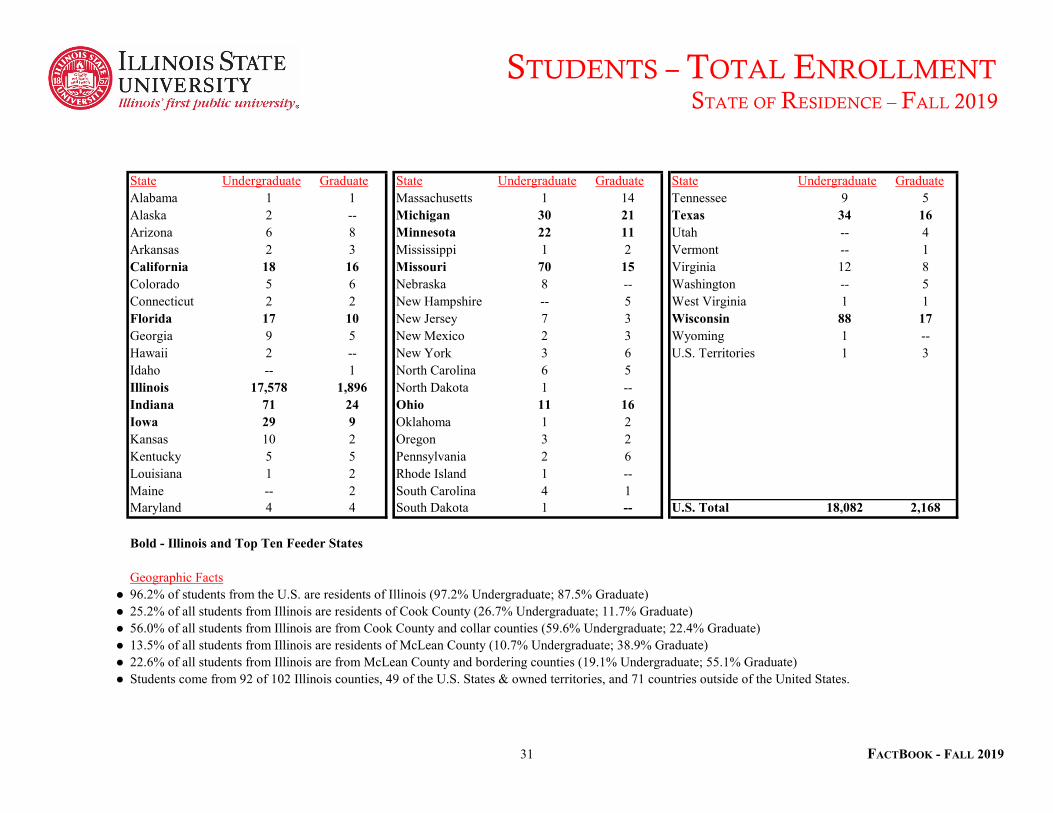
STUDENTS – TOTAL ENROLLMENT STATE OF RESIDENCE – FALL 2019
State Undergraduate Graduate State Undergraduate Graduate State Undergraduate GraduateAlabama 1 1 Massachusetts 1 14 Tennessee 9 5Alaska 2 -- Michigan 30 21 Texas 34 16Arizona 6 8 Minnesota 22 11 Utah -- 4Arkansas 2 3 Mississippi 1 2 Vermont -- 1California 18 16 Missouri 70 15 Virginia 12 8Colorado 5 6 Nebraska 8 -- Washington -- 5Connecticut 2 2 New Hampshire -- 5 West Virginia 1 1Florida 17 10 New Jersey 7 3 Wisconsin 88 17Georgia 9 5 New Mexico 2 3 Wyoming 1 --Hawaii 2 -- New York 3 6 U.S. Territories 1 3Idaho -- 1 North Carolina 6 5Illinois 17,578 1,896 North Dakota 1 --Indiana 71 24 Ohio 11 16Iowa 29 9 Oklahoma 1 2Kansas 10 2 Oregon 3 2Kentucky 5 5 Pennsylvania 2 6Louisiana 1 2 Rhode Island 1 --Maine -- 2 South Carolina 4 1Maryland 4 4 South Dakota 1 -- U.S. Total 18,082 2,168
Bold - Illinois and Top Ten Feeder States
Geographic Facts• 96.2% of students from the U.S. are residents of Illinois (97.2% Undergraduate; 87.5% Graduate)• 25.2% of all students from Illinois are residents of Cook County (26.7% Undergraduate; 11.7% Graduate)• 56.0% of all students from Illinois are from Cook County and collar counties (59.6% Undergraduate; 22.4% Graduate)• 13.5% of all students from Illinois are residents of McLean County (10.7% Undergraduate; 38.9% Graduate)• 22.6% of all students from Illinois are from McLean County and bordering counties (19.1% Undergraduate; 55.1% Graduate)• Students come from 92 of 102 Illinois counties, 49 of the U.S. States & owned territories, and 71 countries outside of the United States.
31 FACTBOOK - FALL 2019

STUDENTS – TOTAL ENROLLMENT NON-U.S. CITIZEN STUDENTS – FALL 2019
Undergraduate Graduate Undergraduate Graduate Undergraduate GraduateAFRICA ASIA (cont.) EUROPE (cont.)Angola 1 -- Korea, Republic of 11 14 Slovenia -- 1Cameroon 1 1 Kuwait 1 -- Spain 3 5Congo, The D.R. 7 -- Malaysia 1 -- Sweden 1 --Egypt -- 3 Nepal -- 7 Ukraine -- 1Ethiopia -- 2 Pakistan 3 10 United Kingdom 7 --Ghana 1 52 Philippines -- 4Kenya 1 7 Russian Federation -- 3 NORTH AMERICAMali 1 -- Saudi Arabia -- 4 Canada 7 4Morocco 1 9 Sri Lanka -- 1 Haiti 1 1Nigeria 2 20 Taiwan, Province of China 5 20 Mexico 2 --Senegal 1 -- Thailand 4 23 Panama 1 --Sierra Leone -- 1 Turkey 1 4South Africa 2 -- Uzbekistan -- 3 OCEANIATanzania, U.R. 1 2 Vietnam 1 12 Australia 6 1Uganda -- 2 New Zealand 1 2Zambia 1 -- EUROPE
Austria -- 1 SOUTH AMERICAASIA Bulgaria 1 1 Brazil 1 4Afghanistan -- 1 Croatia 1 -- Chile -- 1Bangladesh -- 29 Czech Republic -- 1 Colombia 2 5China 24 71 Fmr Yugoslav Rep of Macedonia 1 -- Ecuador 1 --Georgia 1 1 France 4 1 Peru 1 --Hong Kong -- 1 Germany 2 9 Venezuela -- 1India 11 51 Ireland 3 --Indonesia -- 4 Netherlands 1 --Iran (Islamic Republic Of) -- 15 Norway 1 --Israel 1 -- Portugal 1 --Japan -- 3 Republic of Serbia 2 -- Unknown Country -- --Kazakhstan 1 2 Slovakia -- 1 Non-U.S. Citizen Total 136 422
Beginning in fall 2019, 'Non-U.S. Citizen' students taking courses outside the U.S. are included in the 'No Response' category per federal guidelines.
32 FACTBOOK - FALL 2019

DEGREES CONFERREDCOLLEGE – FISCAL YEARS 2015 through 2019
College FY2015 FY2016 FY2017 FY2018 FY2019Applied Science and Technology 1,096 1,129 1,154 1,209 1,198Arts and Sciences 1,349 1,313 1,245 1,350 1,274Business 806 879 871 980 995Education 519 522 582 410 494Wonsook Kim College of Fine Arts 215 224 209 208 189Mennonite College of Nursing 187 177 199 180 180Office of the Provost 1 150 141 154 141 142
Total 4,322 4,385 4,414 4,478 4,472
College FY2015 FY20162 FY2017 FY2018 FY2019Applied Science and Technology 138 308 274 236 221Arts and Sciences 271 331 299 290 301Business 125 98 107 99 99Education 130 179 185 165 205Wonsook Kim College of Fine Arts 51 54 52 44 62Mennonite College of Nursing 24 37 43 36 43
Total 739 1,007 960 870 931
College FY2015 FY20162 FY2017 FY2018 FY2019Applied Science and Technology 1,234 1,437 1,428 1,445 1,419Arts and Sciences 1,620 1,644 1,544 1,640 1,575Business 931 977 978 1,079 1,094Education 649 701 767 575 699Wonsook Kim College of Fine Arts 266 278 261 252 251Mennonite College of Nursing 211 214 242 216 223Office of the Provost 1 150 141 154 141 142
Total 5,061 5,392 5,374 5,348 5,403
1 Office of the Provost includes Interdisciplinary Studies and University Studies2 As of fiscal year 2016, non-IBHE approved certificates are included in graduate degree counts. Prior fiscal years, non-IBHE approved certificates were excluded.
Undergraduate
Graduate
Total
33 FACTBOOK - FALL 2019
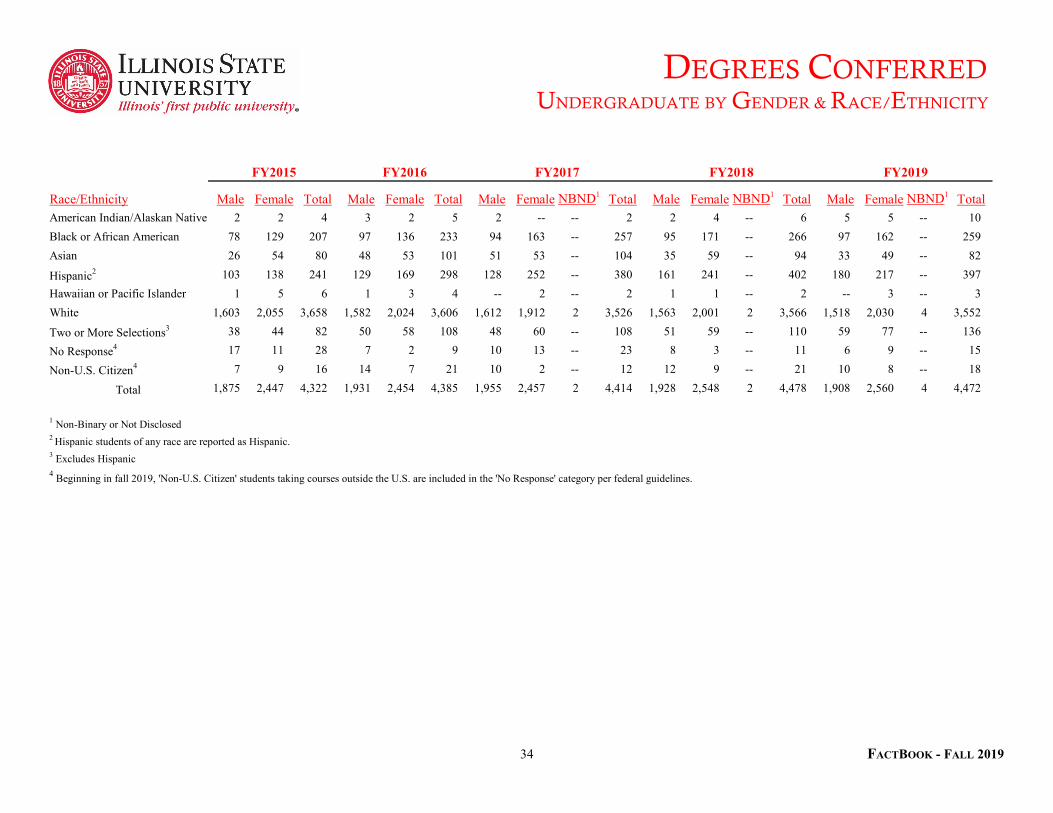
DEGREES CONFERREDUNDERGRADUATE BY GENDER & RACE/ETHNICITY
Race/Ethnicity Male Female Total Male Female Total Male Female NBND1 Total Male Female NBND1 Total Male Female NBND1 TotalAmerican Indian/Alaskan Native 2 2 4 3 2 5 2 -- -- 2 2 4 -- 6 5 5 -- 10 Black or African American 78 129 207 97 136 233 94 163 -- 257 95 171 -- 266 97 162 -- 259 Asian 26 54 80 48 53 101 51 53 -- 104 35 59 -- 94 33 49 -- 82
Hispanic2 103 138 241 129 169 298 128 252 -- 380 161 241 -- 402 180 217 -- 397 Hawaiian or Pacific Islander 1 5 6 1 3 4 -- 2 -- 2 1 1 -- 2 -- 3 -- 3 White 1,603 2,055 3,658 1,582 2,024 3,606 1,612 1,912 2 3,526 1,563 2,001 2 3,566 1,518 2,030 4 3,552
Two or More Selections3 38 44 82 50 58 108 48 60 -- 108 51 59 -- 110 59 77 -- 136
No Response4 17 11 28 7 2 9 10 13 -- 23 8 3 -- 11 6 9 -- 15
Non-U.S. Citizen4 7 9 16 14 7 21 10 2 -- 12 12 9 -- 21 10 8 -- 18
Total 1,875 2,447 4,322 1,931 2,454 4,385 1,955 2,457 2 4,414 1,928 2,548 2 4,478 1,908 2,560 4 4,472
1 Non-Binary or Not Disclosed2 Hispanic students of any race are reported as Hispanic.3 Excludes Hispanic4 Beginning in fall 2019, 'Non-U.S. Citizen' students taking courses outside the U.S. are included in the 'No Response' category per federal guidelines.
FY2015 FY2016 FY2017 FY2018 FY2019
34 FACTBOOK - FALL 2019
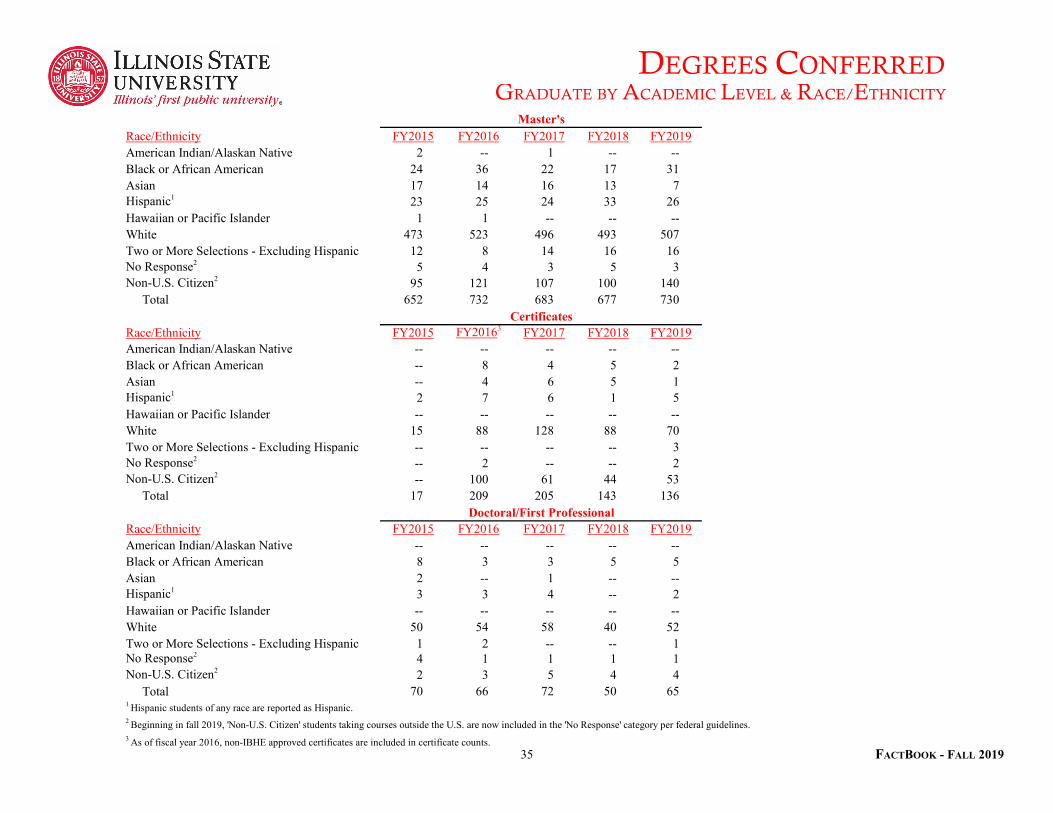
DEGREES CONFERREDGRADUATE BY ACADEMIC LEVEL & RACE/ETHNICITY
Race/Ethnicity FY2015 FY2016 FY2017 FY2018 FY2019American Indian/Alaskan Native 2 -- 1 -- --Black or African American 24 36 22 17 31Asian 17 14 16 13 7Hispanic1 23 25 24 33 26Hawaiian or Pacific Islander 1 1 -- -- --White 473 523 496 493 507Two or More Selections - Excluding Hispanic 12 8 14 16 16No Response2 5 4 3 5 3Non-U.S. Citizen2 95 121 107 100 140
Total 652 732 683 677 730
Race/Ethnicity FY2015 FY20163 FY2017 FY2018 FY2019American Indian/Alaskan Native -- -- -- -- --Black or African American -- 8 4 5 2Asian -- 4 6 5 1Hispanic1 2 7 6 1 5Hawaiian or Pacific Islander -- -- -- -- --White 15 88 128 88 70Two or More Selections - Excluding Hispanic -- -- -- -- 3No Response2 -- 2 -- -- 2Non-U.S. Citizen2 -- 100 61 44 53
Total 17 209 205 143 136
Race/Ethnicity FY2015 FY2016 FY2017 FY2018 FY2019American Indian/Alaskan Native -- -- -- -- --Black or African American 8 3 3 5 5Asian 2 -- 1 -- --Hispanic1 3 3 4 -- 2Hawaiian or Pacific Islander -- -- -- -- --White 50 54 58 40 52Two or More Selections - Excluding Hispanic 1 2 -- -- 1No Response2 4 1 1 1 1Non-U.S. Citizen2 2 3 5 4 4
Total 70 66 72 50 651 Hispanic students of any race are reported as Hispanic.2 Beginning in fall 2019, 'Non-U.S. Citizen' students taking courses outside the U.S. are now included in the 'No Response' category per federal guidelines.3 As of fiscal year 2016, non-IBHE approved certificates are included in certificate counts.
Master's
Certificates
Doctoral/First Professional
35 FACTBOOK - FALL 2019
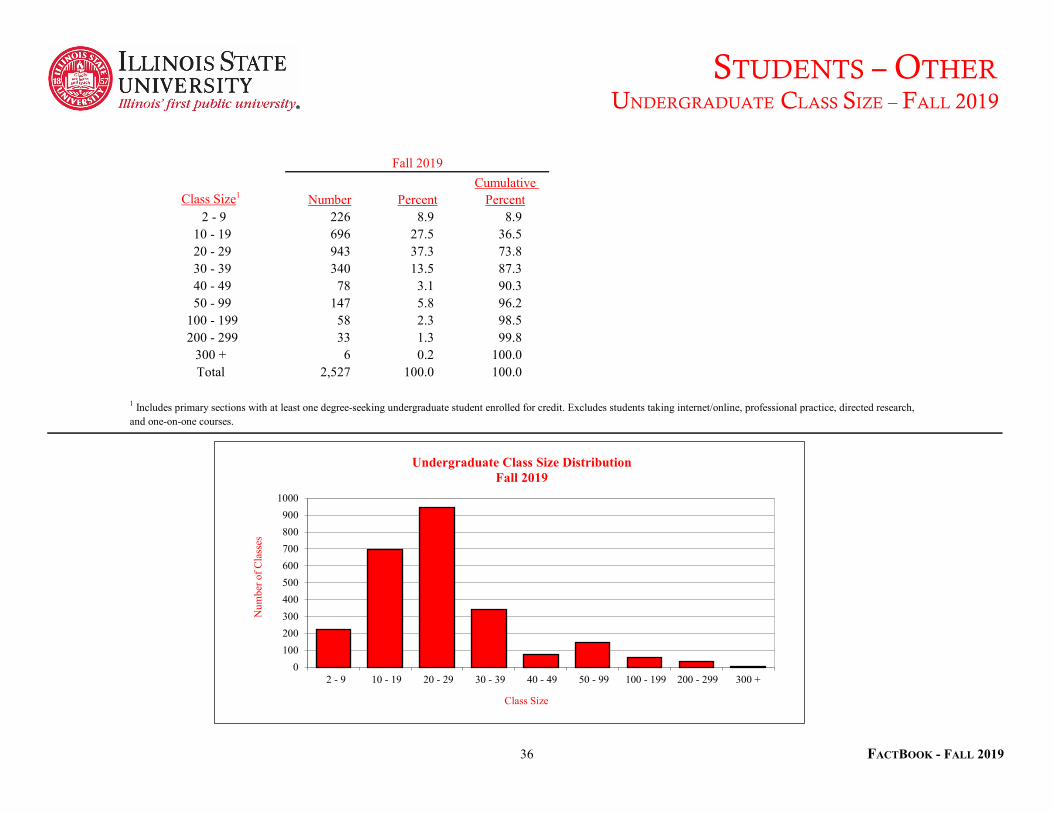
STUDENTS – OTHER UNDERGRADUATE CLASS SIZE – FALL 2019
Class Size1 Number Percent 2 - 9 226 8.9 8.9
10 - 19 696 27.5 36.5 20 - 29 943 37.3 73.8 30 - 39 340 13.5 87.3 40 - 49 78 3.1 90.3 50 - 99 147 5.8 96.2
100 - 199 58 2.3 98.5 200 - 299 33 1.3 99.8
300 + 6 0.2 100.0Total 2,527 100.0 100.0
Fall 2019Cumulative
Percent
1 Includes primary sections with at least one degree-seeking undergraduate student enrolled for credit. Excludes students taking internet/online, professional practice, directed research, and one-on-one courses.
0100200300400500600700800900
1000
2 - 9 10 - 19 20 - 29 30 - 39 40 - 49 50 - 99 100 - 199 200 - 299 300 +
Num
ber o
f Cla
sses
Class Size
Undergraduate Class Size DistributionFall 2019
36 FACTBOOK - FALL 2019

STUDENTS – OTHER RETENTION RATES, GRADUATION RATES, & TIME TO DEGREE
Fall to Fall Retention Rates 2014 Cohort 2015 Cohort 2016 Cohort 2017 Cohort 2018 CohortTotal Students 81.5% 81.1% 80.6% 78.6% 78.6%Male Students 78.1 77.6 77.9 74.5 74.2 Female Students 83.9 83.5 82.7 81.7 81.8 Black or African American Students 68.5 72.3 68.9 65.2 66.8 Hispanic Students1 75.0 73.1 72.7 72.9 67.7 1 Hispanic students of any race are reported as Hispanic.
Six Year Graduation Rates2 2009 Cohort 2010 Cohort 2011 Cohort 2012 Cohort 2013 CohortTotal Students 73.4% 72.2% 68.8% 69.1% 69.5%Male Students 68.3 67.5 65.4 61.9 62.8 Female Students 76.8 75.3 71.2 74.3 74.2 Black or African American Students 57.9 55.2 52.4 49.1 53.8 Hispanic Students3 66.3 62.1 61.5 61.6 59.9 Pell Grant Recipients 65.6 62.9 61.4 60.9 59.2
3 Hispanic students of any race are reported as Hispanic.
Time to Degree4 2015 2016 2017 2018 20194 Years or Less 64.5% 63.1% 67.3% 72.0% 71.3%5 Years 28.1 29.7 26.8 22.7 23.9 6 Years 4.4 4.5 3.8 3.1 2.5 More than 6 Years 3.0 2.6 2.1 2.1 2.3
Percent of Full-Time, First Time in College Students that Return for Second Fall Term
Percent of Full-Time, First Time in College Students Graduating Prior to 7th Fall Term
2 The six-year graduation rate is the total number of full-time, first time in college students within the given cohort who complete their degree within six years of normal time divided by the number of students in the original cohort. Thus, 69.5% of students who started in the 2013 cohort graduated through Summer 2019.
Percent of First Time in College Students by Graduating Fiscal Year
4 Time to degree is the reverse of the graduation rate. Time to degree reflects the number of first time in college students who graduated from the University in a given fiscal year and then calculates backwards to track how many years it took each student to graduate from the first term the student began. It does NOT consider cohorts in the calculation. Thus, 71.3% of students who graduated in Fiscal Year 2019 completed their degree in 4 years or less.
37 FACTBOOK - FALL 2019

FACULTY/STAFFEMPLOYEE FULL-TIME EQUIVALENCY – FALL 2019
Full-Time Part-Time Part-Time TotalEmployee Category Number3 Number3 FTE FTE
Departmental Faculty1 911 461 140.2 1,051.2Non-Departmental Faculty2 8 56 12.4 20.4Library Faculty 23 -- -- 23.0Lab School Faculty 92 5 2.2 94.2Administrative/Professional 675 51 22.1 697.1Civil Service 1,496 22 11.9 1,507.9University Total 3,205 595 188.7 3,393.7
1 Includes Department Chairs and part-time faculty whose major appointment is Administrative/Professional or Civil Service2 Includes faculty in non-academic departments (e.g. Honors Program)3 Counts may be duplicated due to the inclusion of overload positions
Fall 2019
Dept. Faculty31%
Other Faculty4%
Administrative/Professional21%
Civil Service44%
Total Employee FTE by CategoryFall 2019
38 FACTBOOK - FALL 2019
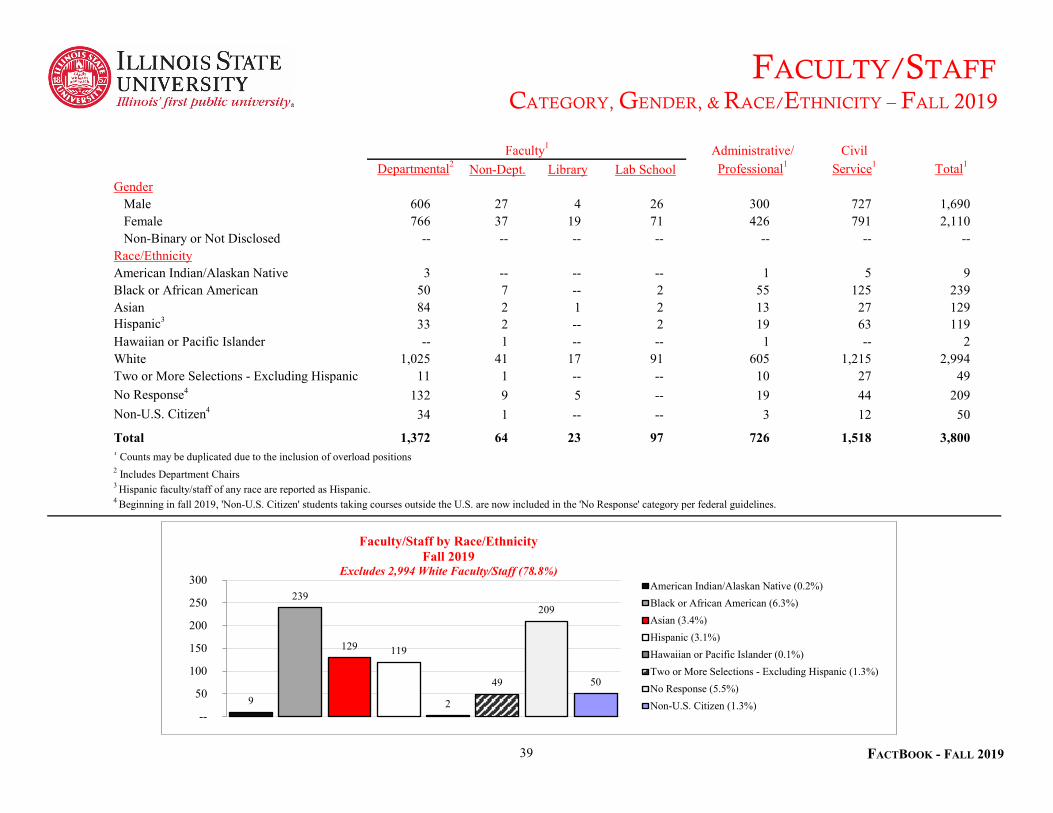
FACULTY/STAFFCATEGORY, GENDER, & RACE/ETHNICITY – FALL 2019
Administrative/ CivilDepartmental2 Non-Dept. Library Lab School Professional1 Service1 Total1
GenderMale 606 27 4 26 300 727 1,690Female 766 37 19 71 426 791 2,110Non-Binary or Not Disclosed -- -- -- -- -- -- --
Race/EthnicityAmerican Indian/Alaskan Native 3 -- -- -- 1 5 9Black or African American 50 7 -- 2 55 125 239Asian 84 2 1 2 13 27 129Hispanic3 33 2 -- 2 19 63 119Hawaiian or Pacific Islander -- 1 -- -- 1 -- 2White 1,025 41 17 91 605 1,215 2,994Two or More Selections - Excluding Hispanic 11 1 -- -- 10 27 49No Response4 132 9 5 -- 19 44 209Non-U.S. Citizen4 34 1 -- -- 3 12 50
Total 1,372 64 23 97 726 1,518 3,8001 Counts may be duplicated due to the inclusion of overload positions2 Includes Department Chairs3 Hispanic faculty/staff of any race are reported as Hispanic.4 Beginning in fall 2019, 'Non-U.S. Citizen' students taking courses outside the U.S. are now included in the 'No Response' category per federal guidelines.
Faculty1
9
239
129 119
2
49
209
50
--
50
100
150
200
250
300
Faculty/Staff by Race/EthnicityFall 2019
Excludes 2,994 White Faculty/Staff (78.8%)American Indian/Alaskan Native (0.2%)Black or African American (6.3%)Asian (3.4%)Hispanic (3.1%)Hawaiian or Pacific Islander (0.1%)Two or More Selections - Excluding Hispanic (1.3%)No Response (5.5%)Non-U.S. Citizen (1.3%)
39 FACTBOOK - FALL 2019
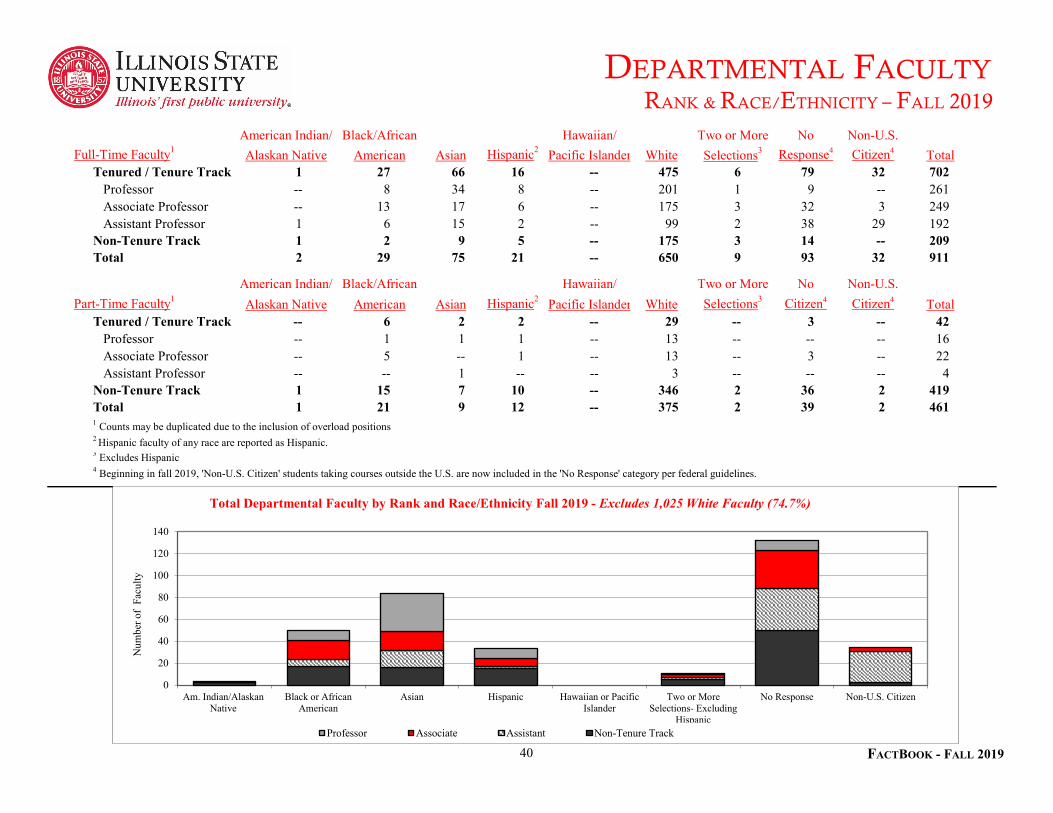
DEPARTMENTAL FACULTYRANK & RACE/ETHNICITY – FALL 2019
American Indian/ Black/African Hawaiian/ Two or More No Non-U.S.Full-Time Faculty1 Alaskan Native American Asian Hispanic2 Pacific Islander White Selections3 Response4 Citizen4 Total
Tenured / Tenure Track 1 27 66 16 -- 475 6 79 32 702Professor -- 8 34 8 -- 201 1 9 -- 261Associate Professor -- 13 17 6 -- 175 3 32 3 249Assistant Professor 1 6 15 2 -- 99 2 38 29 192
Non-Tenure Track 1 2 9 5 -- 175 3 14 -- 209Total 2 29 75 21 -- 650 9 93 32 911
American Indian/ Black/African Hawaiian/ Two or More No Non-U.S.Part-Time Faculty1 Alaskan Native American Asian Hispanic2 Pacific Islander White Selections3 Citizen4 Citizen4 Total
Tenured / Tenure Track -- 6 2 2 -- 29 -- 3 -- 42Professor -- 1 1 1 -- 13 -- -- -- 16Associate Professor -- 5 -- 1 -- 13 -- 3 -- 22Assistant Professor -- -- 1 -- -- 3 -- -- -- 4
Non-Tenure Track 1 15 7 10 -- 346 2 36 2 419Total 1 21 9 12 -- 375 2 39 2 4611 Counts may be duplicated due to the inclusion of overload positions2 Hispanic faculty of any race are reported as Hispanic.3 Excludes Hispanic4 Beginning in fall 2019, 'Non-U.S. Citizen' students taking courses outside the U.S. are now included in the 'No Response' category per federal guidelines.
0
20
40
60
80
100
120
140
Am. Indian/AlaskanNative
Black or AfricanAmerican
Asian Hispanic Hawaiian or PacificIslander
Two or MoreSelections- Excluding
Hispanic
No Response Non-U.S. Citizen
Num
ber o
f Fa
culty
Total Departmental Faculty by Rank and Race/Ethnicity Fall 2019 - Excludes 1,025 White Faculty (74.7%)
Professor Associate Assistant Non-Tenure Track
40 FACTBOOK - FALL 2019

DEPARTMENTAL FACULTY FTE
BY COLLEGE, GENDER, & TENURE STATUS – FALL 2019
TotalCollege Male Female NBND1 Male Female NBND1
66.8 56.4 -- 21.6 34.2 -- 179.0Arts and Sciences 187.5 125.5 -- 37.2 74.3 -- 424.5Business 51.3 31.0 -- 22.5 9.5 -- 114.3Education 25.0 58.0 -- 8.4 62.0 -- 153.4Wonsook Kim College of Fine Arts 44.5 43.0 -- 20.3 17.9 -- 125.7
2.0 20.1 -- 2.0 29.4 -- 53.5Vice President and Provost2 -- 1.0 -- -- -- -- 1.0
Total 377.0 335.0 -- 111.9 227.3 -- 1,051.4
2 Faculty members under the Vice President and Provost hold positions outside of the colleges.
Fall 2019
Tenured / Tenure Track Non-Tenure Track
Applied Science and Technology
Mennonite College of Nursing
1 Non-Binary or Not Disclosed
0
100
200
300
400
500
CAST CAS COB COE WKCFA MCN
FTE
Departmental Faculty FTE by CollegeFall 2019
41 FACTBOOK - FALL 2019
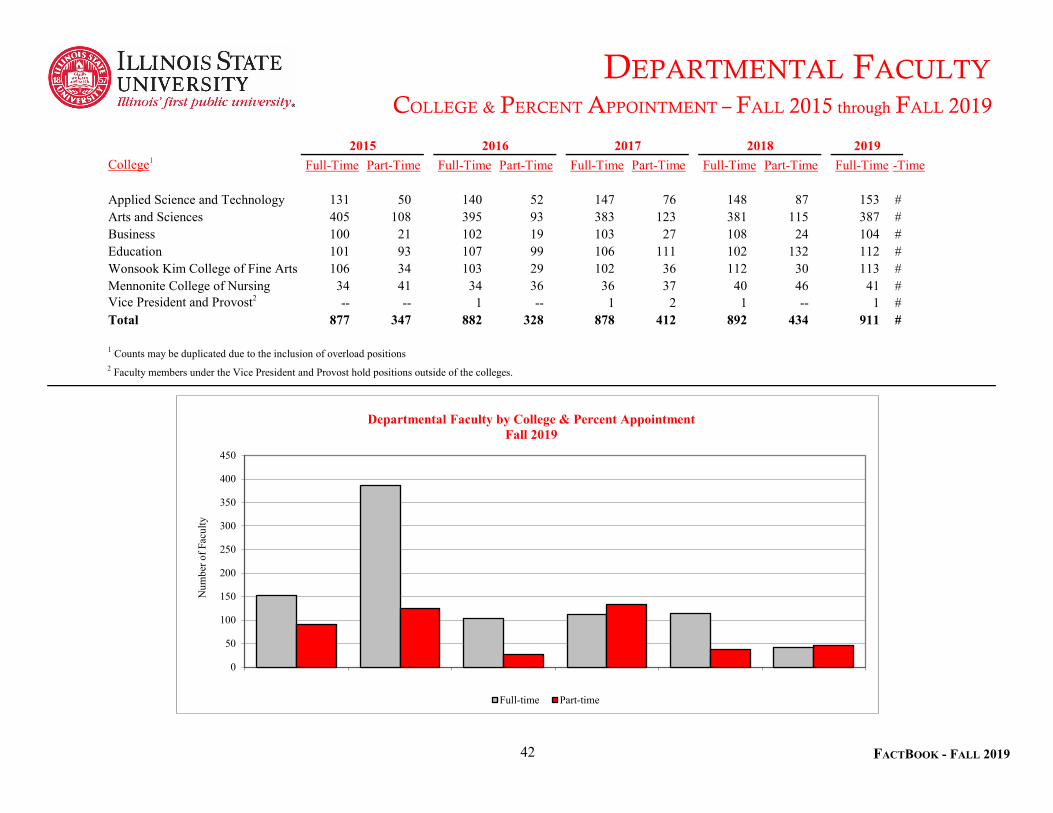
DEPARTMENTAL FACULTY COLLEGE & PERCENT APPOINTMENT – FALL 2015 through FALL 2019
College1 Full-Time Part-Time Full-Time Part-Time Full-Time Part-Time Full-Time Part-Time Full-Timet-Time
Applied Science and Technology 131 50 140 52 147 76 148 87 153 #Arts and Sciences 405 108 395 93 383 123 381 115 387 #Business 100 21 102 19 103 27 108 24 104 #Education 101 93 107 99 106 111 102 132 112 #Wonsook Kim College of Fine Arts 106 34 103 29 102 36 112 30 113 #Mennonite College of Nursing 34 41 34 36 36 37 40 46 41 #Vice President and Provost2 -- -- 1 -- 1 2 1 -- 1 #Total 877 347 882 328 878 412 892 434 911 #
1 Counts may be duplicated due to the inclusion of overload positions
2019
2 Faculty members under the Vice President and Provost hold positions outside of the colleges.
2015 2016 2017 2018
0
50
100
150
200
250
300
350
400
450
Num
ber o
f Fac
ulty
Departmental Faculty by College & Percent AppointmentFall 2019
Full-time Part-time
42 FACTBOOK - FALL 2019
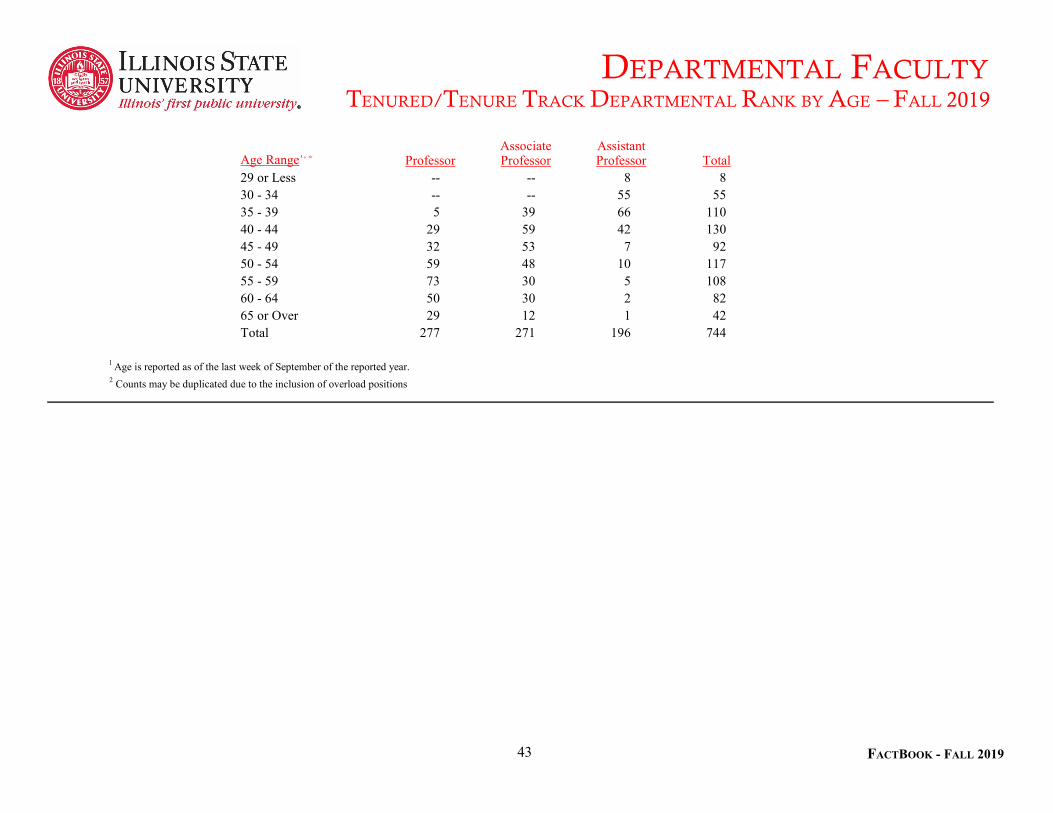
DEPARTMENTAL FACULTYTENURED/TENURE TRACK DEPARTMENTAL RANK BY AGE – FALL 2019
Associate AssistantAge Range1, 2 Professor Professor Professor Total29 or Less -- -- 8 830 - 34 -- -- 55 5535 - 39 5 39 66 11040 - 44 29 59 42 13045 - 49 32 53 7 9250 - 54 59 48 10 11755 - 59 73 30 5 10860 - 64 50 30 2 8265 or Over 29 12 1 42Total 277 271 196 744
1 Age is reported as of the last week of September of the reported year.2 Counts may be duplicated due to the inclusion of overload positions
43 FACTBOOK - FALL 2019

RESOURCESHISTORICAL EXPENDITURES – FY 2015 through FY 2019
(Dollars in thousands)Fiscal Year 2015 Fiscal Year 2016 Fiscal Year 2017 Fiscal Year 2018 Fiscal Year 2019
State Appropriated Tax Funds and University Income Fund $237,877.0 $231,560.4 $237,153.3 $244,874.7 $259,912.4Gifts, Grants and Contracts 46,991.7 47,932.2 47,949.8 53,673.6 57,338.7Agency 55,999.2 52,867.0 56,940.2 62,645.1 59,411.8Bond Revenue/Other Auxiliary 67,140.3 62,703.2 55,537.7 88,360.5 102,141.4
Total1 $408,008.2 $395,062.8 $397,581.0 $449,553.9 $478,804.3
Fiscal Year 2015 Fiscal Year 2016 Fiscal Year 2017 Fiscal Year 2018 Fiscal Year 2019Personal Services $160,012.3 $157,450.5 $157,967.7 $163,325.0 $168,481.1Contractual 32,691.4 31,050.3 30,076.6 30,549.5 31,758.8Equipment and Books 10,203.2 7,950.1 9,432.0 9,953.9 9,525.3Commodities 2,756.1 2,731.5 2,773.6 2,425.0 2,597.2Other 26,702.5 26,933.3 31,329.1 33,027.8 41,828.1Group Health Insurance 3,078.3 3,078.3 3,078.3 3,078.3 3,078.3Medicare 2,433.2 2,366.4 2,496.0 2,515.2 2,643.6
Total $237,877.0 $231,560.4 $237,153.3 $244,874.7 $259,912.4
Fiscal Year 2015 Fiscal Year 2016 Fiscal Year 2017 Fiscal Year 2018 Fiscal Year 2019Instruction $116,224.8 $108,726.5 $109,687.8 $113,532.3 $116,737.0Operation and Maintenance 35,053.0 34,063.9 35,481.6 37,406.8 42,576.4Institutional Support 34,848.9 36,738.2 35,367.0 35,847.9 36,662.1Organized Research 2,684.3 2,701.9 2,731.5 2,074.4 2,291.4Public Service 1,969.5 1,985.8 2,274.8 2,117.9 2,204.5Academic Support 19,938.1 19,804.2 20,315.7 20,459.4 20,076.6Student Services 21,646.9 22,095.2 25,720.6 27,842.5 33,642.5Group Health Insurance 3,078.3 3,078.3 3,078.3 3,078.3 3,078.3Medicare 2,433.2 2,366.4 2,496.0 2,515.2 2,643.6
Total $237,877.0 $231,560.4 $237,153.3 $244,874.7 $259,912.41 Excludes payments made on behalf of the University (e.g., retirement contributions);
$136.1 million in FY15, $152.1 million in FY16, $176.1 million in FY17, $170.2 million in FY18 and $82.3 million in FY19.
Total Operating Funds by Fund Type
State Appropriated and University Income Funds by Object Class
State Appropriated and University Income Funds by Functional Classification
44 FACTBOOK - FALL 2019

RESOURCESHISTORICAL APPROPRIATIONS – FY 2016 through FY 2020
(dollars in thousands)Fiscal Year 2016 Fiscal Year 2017 Fiscal Year 2018 Fiscal Year 2019 Fiscal Year 2020
State Appropriation - Operating $20,934.9 $72,226.7 0 $65,004.0 $66,304.1 $69,619.3State College and University Trust Fund1 0.0 0.0 0.0 50.0 150.0
Total State Appropriation $20,934.9 $72,226.7 $65,004.0 $66,354.1 $69,769.3
Historical Appropriations
1Collegiate License Plate Revenue
0%
10%
20%
30%
40%
50%
60%
70%
80%
90%
100%
1985 1986 1987 1988 1989 1990 1991 1992 1993 1994 1995 1996 1997 1999 2000 2001 2002 2003 2004 2005 2006 2007 2008 2009 2010 2011 2012 2013 2014 2015 2016 2017 2018 2019 2020
Historical Appropriations Fiscal Year 1985 through Fiscal Year 2020
Educational Assistance Fund Amer. Recovery & Reinvestment Funds State College and University Trust Fund State Appropriation
45 FACTBOOK - FALL 2019

RESOURCESREVENUES BY SOURCE – FY 2018 and FY 2019
Percent PercentSource Amount (in thousands) of Total Amount (in thousands) of TotalTuition and Fees $200,168 50.6 $199,747 49.6 State Government Tax Funds Appropriations 65,004 16.4 66,354 16.5 Government Grants and Contracts
Federal 14,686 3.7 17,699 4.4 State 2,526 0.6 2,356 0.6
Non-Governmental Gifts, Grants and Contracts 3,165 0.8 2,200 0.5 Sales & Services of Education Activities 3,160 0.8 3,130 0.8 Sales & Services of Auxiliary Enterprises 85,783 21.7 90,801 22.5 Other Sources 20,989 5.3 20,595 5.1
Total $395,481 1 100.0% $402,882 2 100.0 %
1 Excludes $170.2 million in Payments on Behalf of the University.2 Excludes $82.3 million in Payments on Behalf of the University.
Source: Report of the Comptroller
Fiscal Year 2018 Fiscal Year 2019
Tuition and Fees50.3%
Appropriations16.3%
Government Grants & Contracts
5.0%
Non-Government Gifts, Grants & Contracts
0.7%
Education Activities0.8%
Auxiliary Enterprises21.5%
Other5.3%
Revenues by Source Fiscal Year 2018
46 FACTBOOK - FALL 2019

RESOURCESSPONSORED RESEARCH, INSTRUCTION, CREATIVE WORKS, & SERVICE
Amount Number Amount Number Amount Number Amount Number Amount NumberResearch $22,626,350 107 $39,014,025 115 $46,346,659 129 $29,780,138 127 $21,336,677 95Instruction 969,653 64 1,438,303 85 3,196,107 62 3,534,786 47 $2,658,502 10Public Service 2,880,578 42 2,966,266 37 3,075,117 18 3,494,597 22 $5,194,828 23Other 16,008,942 57 15,547,080 66 15,484,665 56 7,211,843 61 $15,666,643 43
Total $42,485,523 270 $58,965,674 303 $68,102,548 265 $44,021,365 257 $44,856,650 171
Amount Number Amount Number Amount Number Amount Number Amount NumberResearch $6,721,472 46 $7,343,865 64 $6,580,763 61 $12,362,004 86 $15,326,056 76 Instruction 1,952,665 61 2,108,771 84 2,091,602 70 496,853 53 $1,991,994 12 Public Service 3,240,260 37 3,064,070 34 966,521 23 3,270,723 13 $5,948,564 25 Other 6,812,114 47 4,091,791 33 9,484,046 56 8,107,896 57 $5,269,692 30
Total $18,726,511 191 $16,608,496 215 $19,122,932 210 $24,237,476 209 $28,536,306 143
Amount Percent Amount Percent Amount Percent Amount Percent Amount PercentFederal Awards $9,534,373 50.9 $7,406,546 44.6 $10,919,946 57.1 $12,915,365 53.3 $17,754,982 62.22 Federal Flow-through 5,519,410 29.5 4,615,789 27.8 2,853,749 14.9 5,784,719 23.9 $6,929,681 24.28 State Awards 1,518,038 8.1 1,341,920 8.1 2,037,849 10.7 2,374,834 9.8 $2,253,484 7.89 Corporate Awards 35,780 0.2 90,019 0.5 14,560 0.1 56,068 0.2 $9,950 0.04 Other Awards 2,118,910 11.3 3,154,222 19.0 3,296,828 17.2 3,106,489 12.8 $1,589,209 5.57
Total Awards $18,726,511 100.0 $16,608,496 100.0 $19,122,932 100.0 $24,237,476 100.0 $28,536,306 100.00
Awards by Type of FundingFiscal Year 2015 Fiscal Year 2016 Fiscal Year 2017 Fiscal Year 2018 Fiscal Year 2019
Awards (Approved between July 1 and June 30)Fiscal Year 2015 Fiscal Year 2016 Fiscal Year 2017 Fiscal Year 2018 Fiscal Year 2019
Submissions (Proposals submitted between July 1 and June 30)Fiscal Year 2015 Fiscal Year 2016 Fiscal Year 2017 Fiscal Year 2018 Fiscal Year 2019
47 FACTBOOK - FALL 2019
RESOURCESSTUDENT FINANCIAL AID & INSTITUTIONAL SUPPORT – FISCAL YEAR 20191
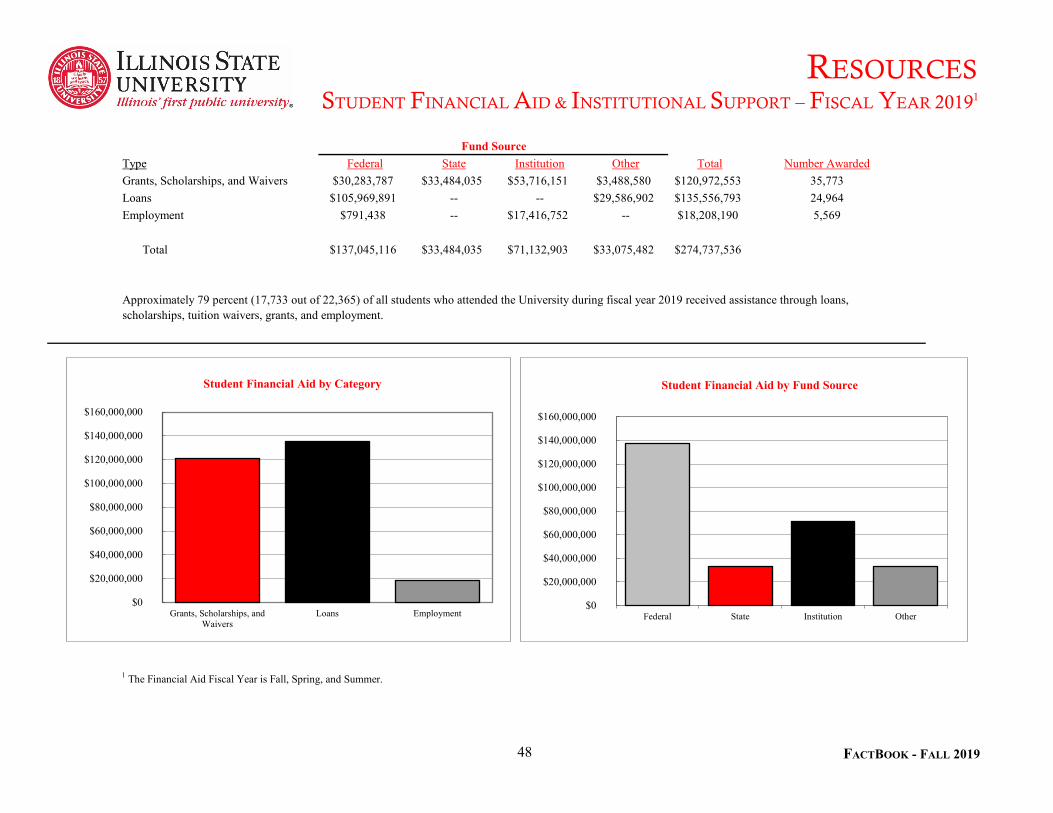
Type Federal State Institution Other Total Number AwardedGrants, Scholarships, and Waivers $30,283,787 $33,484,035 $53,716,151 $3,488,580 $120,972,553 35,773Loans $105,969,891 -- -- $29,586,902 $135,556,793 24,964Employment $791,438 -- $17,416,752 -- $18,208,190 5,569
Total $137,045,116 $33,484,035 $71,132,903 $33,075,482 $274,737,536
Fund Source
Approximately 79 percent (17,733 out of 22,365) of all students who attended the University during fiscal year 2019 received assistance through loans, scholarships, tuition waivers, grants, and employment.
1 The Financial Aid Fiscal Year is Fall, Spring, and Summer.
$0
$20,000,000
$40,000,000
$60,000,000
$80,000,000
$100,000,000
$120,000,000
$140,000,000
$160,000,000
Federal State Institution Other
Student Financial Aid by Fund Source
$0
$20,000,000
$40,000,000
$60,000,000
$80,000,000
$100,000,000
$120,000,000
$140,000,000
$160,000,000
Grants, Scholarships, andWaivers
Loans Employment
Student Financial Aid by Category
48 FACTBOOK - FALL 2019

RESOURCESUNDERGRADUATE STUDENT TUITION & FEE RATES
Insurance required of all students Resident School Year Tuition Plan1 Tuition Rate Required Fees taking 9 or more credit hours Tuition Required Fees Total
Current Rates 2019-2020 New 2 384.13 92.28 540.00 11,523.90 3,308.40 14,832.30Continuing 2 Yr 384.13 82.28 524.00 11,523.90 2,468.40 14,516.30Continuing 3 Yr 370.25 81.84 498.00 11,107.50 2,455.20 14,060.70Continuing 4 Yr 370.25 81.84 498.00 11,107.50 2,455.20 14,060.70Continuing 5+ Yr 359.47 79.46 498.00 10,784.10 2,383.80 13,665.90
Historical Rates 2018-2019 New 2 384.13 82.28 524.00 11,523.90 2,468.40 14,516.30Continuing 2 Yr 384.13 82.28 524.00 11,523.90 2,468.40 14,516.30Continuing 3 Yr 370.25 81.84 498.00 11,107.50 2,455.20 14,060.70Continuing 4 Yr 370.25 81.84 498.00 11,107.50 2,455.20 14,060.70Continuing 5+ Yr 359.47 79.46 498.00 10,784.10 2,383.80 13,665.90
2017-2018 New 2 370.25 81.84 498.00 11,107.50 2,455.20 14,060.70Continuing 2 Yr 370.25 81.84 498.00 11,107.50 2,455.20 14,060.70Continuing 3 Yr 359.47 79.46 498.00 10,784.10 2,383.80 13,665.90Continuing 4 Yr 349.00 78.66 466.00 10,470.00 2,359.80 13,295.80Continuing 5+ Yr 342.00 77.12 436.00 10,260.00 2,313.60 13,009.60
Non-Resident
Current Rates 2019-2020 New 2 768.26 92.28 540.00 23,047.80 3,308.40 26,356.20Continuing 2 Yr 768.26 82.28 524.00 23,047.80 2,468.40 26,040.20Continuing 3 Yr 740.50 81.84 498.00 22,215.00 2,455.20 25,168.20Continuing 4 Yr 740.50 81.84 498.00 22,215.00 2,455.20 25,168.20Continuing 5+ Yr 620.00 79.46 498.00 18,600.00 2,383.80 21,481.80
Historical Rates 2018-2019 New 2 768.26 82.28 524.00 23,047.80 2,468.40 26,040.20Continuing 2 Yr 740.50 81.84 498.00 22,215.00 2,455.20 25,168.20Continuing 3 Yr 740.50 81.84 498.00 22,215.00 2,455.20 25,168.20Continuing 4 Yr 620.00 79.46 498.00 18,600.00 2,383.80 21,481.80Continuing 5+ Yr 602.00 78.66 466.00 18,060.00 2,359.80 20,885.80
2017-2018 New 2 740.50 81.84 498.00 22,215.00 2,455.20 25,168.20Continuing 2 Yr 740.50 81.84 498.00 22,215.00 2,455.20 25,168.20Continuing 3 Yr 620.00 79.46 498.00 18,600.00 2,383.80 21,481.80Continuing 4 Yr 602.00 78.66 466.00 18,060.00 2,359.80 20,885.80Continuing 5+ Yr 590.00 77.12 436.00 17,700.00 2,313.60 20,449.60
Full-Time (based on 15 credit hours per semester) AnnualPer Credit Hour
1 Freeze rates, for undergraduate tuition (in-state/out-of-state) and general fees, shall depend on qualified primary major(s)/sequence(s) carried within the individual's catalog year as of census day of the last undergraduate semester attended within the four continuous calendar years after being classified as first enrolled.2 New Students enrolled for their first semester in a degree-seeking program and in attendance on census day.
49 FACTBOOK - FALL 2019

RESOURCESGRADUATE STUDENT TUITION & FEE RATES
ResidentInsurance required of all students
School Year Tuition Rate Required Fees taking 9 or more credit hours Tuition Required Fees TotalCurrent Rates 2019-20 $403.59 $92.28 $540.00 7,264.62 1,661.04 9,465.66
Historical Rates 2018-19 $403.59 $82.28 $524.00 7,264.62 1,481.04 9,269.66 2017-18 389.00 81.84 498.00 7,002.00 1,473.12 8,973.12 2016-17 389.00 81.84 498.00 7,002.00 1,473.12 8,973.12 2015-16 374.00 79.46 498.00 6,732.00 1,430.28 8,660.28 2014-15 360.00 78.66 466.00 6,480.00 1,415.88 8,361.88 2013-14 345.00 77.12 436.00 6,210.00 1,388.16 8,034.16 2012-13 308.00 75.60 408.00 5,544.00 1,360.80 7,312.80 2011-12 285.00 73.40 398.00 5,130.00 1,321.20 6,849.20 2010-11 264.00 68.23 340.00 4,752.00 1,228.14 6,320.14
Non-ResidentInsurance required of all students
School Year Tuition Rate Required Fees taking 9 or more credit hours Tuition Required Fees TotalCurrent Rates 2019-20 $838.30 $92.28 $540.00 15.089.40 1,661.04 17,290.44
Historical Rates 2018-19 $838.30 $82.28 $524.00 15,089.40 1,481.04 17,094.44 2017-18 808.00 81.84 498.00 14,544.00 1,473.12 16,515.12 2016-17 808.00 81.84 498.00 14,544.00 1,473.12 16,515.12 2015-16 777.00 79.46 498.00 13,986.00 1,430.28 15,914.28 2014-15 747.00 78.66 466.00 13,446.00 1,415.88 15,327.88 2013-14 716.00 77.12 436.00 12,888.00 1,388.16 14,712.16 2012-13 639.00 75.60 408.00 11,502.00 1,360.80 13,270.80 2011-12 592.00 73.40 398.00 10,656.00 1,321.20 12,375.20 2010-11 548.00 68.23 340.00 9,864.00 1,228.14 11,432.14
Full-Time (based on 9 credit hours per semester) AnnualPer Credit Hour
Full-Time (based on 9 credit hours per semester) AnnualPer Credit Hour
50 FACTBOOK - FALL 2019

RESOURCESMILNER LIBRARY
2015 2016 2017 2018 2019Patron Services and Usage
717,541 680,994 691,419 738,384 615,143132,069 129,621 132,771 129,022 116,455
13,411 23,510 10,880 11,461 10,81218,696 22,965 15,262 13,596 12,07129,565 28,857 26,732 23,486 20,391
45,906 27,561 145,862 170,678 151,049724 525 538 509 529
14,468 12,395 11,749 11,491 11,456645,474 608,321 637,819 1,084,123 693,399
Collections1,654,745 1,578,256 1,445,837 1,435,309 1,425,469
20,320 17,401 21,929 15,967 15,17810,157 74,441 152,859 9,757 23,725
e-Books 328,030 179,874 190,817 194,782 208,21984,641 102,711 97,570 106,327 141,304
Databases 265 252 251 278 2841,493 1,079 975 650 595
216,130 219,083 210,498 229,642 214,847
Library Staffing30.0 33.0 26.0 27.0 25.049.0 51.0 51.0 50.0 45.012.0 11.0 11.5 11.4 10.291.0 95.0 85.5 88.4 80.2
Source: Milner Library
Library Civil Service and Other Professional StaffLibrary Student Assistants FTETotal Library Staff
Volumes AddedVolumes Withdrawn
Electronic Serial Titles
Print Periodical TitlesUnique Titles among State of Illinois libraries
Library Faculty
Total Volumes in Milner
Fiscal Year
Building Usage Gate CountCirculation (inside and outside of Milner)Items Borrowed for ISU PatronsItems Loaned to Other LibrariesReference Transactions (in person, phone, text, email, IM)Computer Lab Gate CountNumber of Library Instruction SessionsLearners Receiving Library InstructionVisits to Milner's Web Site
51 FACTBOOK - FALL 2019
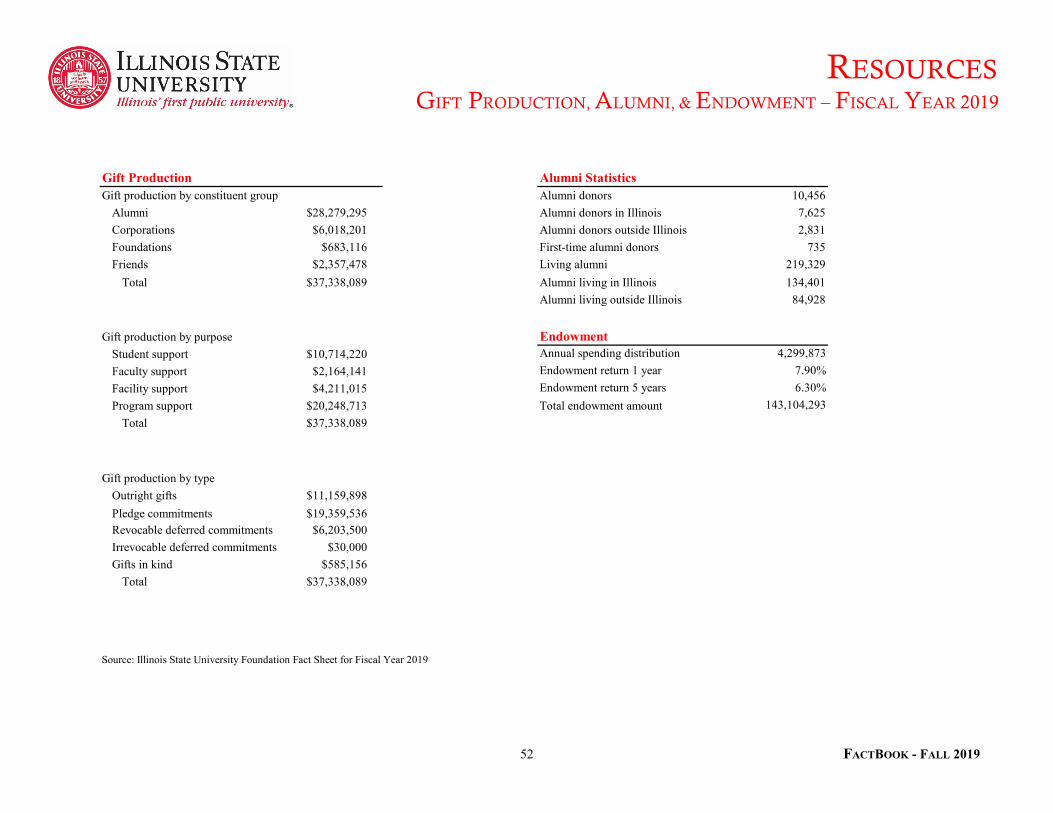
RESOURCESGIFT PRODUCTION, ALUMNI, & ENDOWMENT – FISCAL YEAR 2019
Gift Production Alumni StatisticsGift production by constituent group Alumni donors 10,456
Alumni $28,279,295 Alumni donors in Illinois 7,625Corporations $6,018,201 Alumni donors outside Illinois 2,831Foundations $683,116 First-time alumni donors 735Friends $2,357,478 Living alumni 219,329
Total $37,338,089 Alumni living in Illinois 134,401Alumni living outside Illinois 84,928
Gift production by purpose EndowmentStudent support $10,714,220 Annual spending distribution 4,299,873Faculty support $2,164,141 Endowment return 1 year 7.90%Facility support $4,211,015 Endowment return 5 years 6.30%Program support $20,248,713 Total endowment amount 143,104,293
Total $37,338,089
Gift production by type Outright gifts $11,159,898 Pledge commitments $19,359,536 Revocable deferred commitments $6,203,500 Irrevocable deferred commitments $30,000 Gifts in kind $585,156
Total $37,338,089
Source: Illinois State University Foundation Fact Sheet for Fiscal Year 2019
52 FACTBOOK - FALL 2019

REFERENCEUNDERGRADUATE PLAN INVENTORY – FALL 2019
CIP Plan B.A.
B.S.B.S. E
d.
B.M. E
d.
CIP Plan B.A.
B.S.B.S.W
.
B.F.A.
B.M.
B.S.N.
B.S./M.P.A
.
01.0000 Agriculture x 31.0505 Exercise Science x05.0106 European Studies x 38.0101 Philosophy x09.0101 Communication Studies x x 40.0501 Chemistry x09.0102 Mass Media x x 40.0601 Geology x09.0401 Journalism x x 40.0801 Physics x09.0902 Public Relations x x 42.0101 Psychology x x10.0301 Graphic Communications x 43.0104 Criminal Justice Sciences x x11.0103 Information Systems x 44.0701 Social Work x11.0701 Computer Science x 45.0201 Anthropology x x11.0901 Network & Telecom Management x 45.0601 Economics x x11.1003 Cybersecurity x 45.0701 Geography x x13.1001 Special Education x 45.1001 Political Science x x13.1202 Elementary Education x x 45.1101 Sociology x x13.1203 Middle Level Teacher Education x x 50.0408 Interior Design x x13.1210 Early Childhood Education x x 50.0501 Theatre x x13.1303 Business Education x x x 50.0701 Art x x13.1307 Health Promotion and Education x x 50.0702 Art x13.1309 Technology & Engineering Educucation x 50.0901 Music (Liberal Arts) x x13.1312 Music Education x 50.0903 Music Performance x13.1314 Physical Education x x 50.9999 Arts Technology x x13.1322 Biological Sciences Teacher Education x 51.0204 Communication Sciences & Disorders x15.0000 Engineering Techology x 51.0706 Health Information Management x15.0503 Sustainable and Renewable Energy x 51.0913 Athletic Training x15.0612 Industrial Technology x 51.1005 Medical Laboratory Science x16.0501 German x 51.2202 Environmental Health x16.0901 French and Francophone Studies x 51.2206 Safety x16.0905 Spanish x 51.3101 Food, Nutrition, and Dietetics x x19.0101 Family and Consumer Sciences x x 51.3801 Nursing x19.0701 Human Development and Family Science x x 52.0201 Business Administration x19.0901 Fashion Design and Merchandising x x 52.0301 Accountancy x22.0302 Legal Studies x x 52.0301A Accountancy, Integrated x23.0101 English x 52.0801 Finance x24.0101 Interdisciplinary Studies x x 52.1101 International Business x x24.0102 University Studies x x 52.1201 Business Information Systems x26.0101 Biological Sciences x 52.1301 Management x26.0202 Biochemistry x 52.1401 Marketing x26.0406 Molecular and Cellular Biology x 52.1701 Risk Management and Insurance x27.0101 Mathematics x x 52.2001 Construction Management x31.0301 Recreation and Park Administration x 54.0101 History x x
53 FACTBOOK - FALL 2019

REFERENCEGRADUATE PLAN INVENTORY – FALL 2019
Master's Level Master's Level (continued)
CIP Plan M.A.
M.S.M.S.Ed.
M.M.
M.M.Ed.
M.S.W.
M.F.A.
M. Che
m. Ed.
M.S. Che
m. Ed.
CIP Plan M.A.
M.S.M.S.N
.
M.B.A.
B.S./M.P.A
.
01.0000 Agriculture x 51.3801 Nursing x09.0101 Communication x x 52.0201 Business Administration x11.0103 Information Systems x 52.0301 Accountancy x13.0301 Teaching and Learning x 52.0301A Accountancy, Integrated x13.0401 Educational Administration x x 54.0101 History x x13.1001 Special Education x x13.1102 College Student Personnel Admin. x13.1312 Music Education x
Doctoral Level
13.1315 Reading xu D.
d D.h D.
N.P.13.1323 Chemistry Education x x CIP Plan15.0612 Technology x 13.0301 Teaching and Learning x16.0101 Languages, Literatures, & Cultures x 13.0401 Educational Administration x x19.0101 Family and Consumer Sciences x x 13.1001 Special Education x23.0101 English x x 13.1311 Mathematics Education x26.0101 Biological Sciences x 23.0101 English Studies x27.0101 Mathematics x 26.0101 Biological Sciences x31.0501 Kinesiology and Recreation x 42.2805 School Psychology x40.0501 Chemistry x 51.0204 Audiology x40.0699 Hydrogeology x 51.3808 Nursing x42.0101 Psychology x x 51.3818 Nursing Practice x42.2803 Clinical-Counseling Psychology x x43.0104 Criminal Justice Sciences x x44.0701 Social Work x45.0201 Anthropology x x45.0601 Applied Economics x x45.1001 Political Science x x45.1101 Sociology x x50.0501 Theatre Studies x x x50.0701 Art x x50.0702 Art x50.0901 Music x50.9999 Arts Technology x51.0204 Speech-Language Pathology x x
Au.D Ed.D Ph.D D.N.P
54 FACTBOOK - FALL 2019

REFERENCEGRADUATE PLAN INVENTORY – FALL 2019
Certificate Level
CIP Plan P.B.P.M
.S.S.P.
P.M.FNP
05.0207 Women's and Gender Studies Graduate Certificate x11.0501 Systems Analyst Graduate Certificate x11.0801 Internet Application Development Graduate Certificate x11.8020 Data Scientist: Business Information Systems in Accounting Graduate Certificate x11.0901 Network and Telecommunications Management Graduate Certificate x11.1003 Information Assurance and Security Graduate Certificate x11.1099 Enterprise Computing Systems Graduate Certificate x13.0401 Teacher Leader Certificate, Post-Baccalaureate x13.0402 Director of Special Education, Post-Master's Graduate Certificate for x13.0409 General Administrative Certification in Educational Administration, Post-Master's Graduate Certificate x13.0411 Superintendent Endorsement in Educational Administration, Post-Master's Graduate Certificate x13.0499 Chief School Business Official, Post-Master's Graduate Certificate x13.0501 Technology Specialist Graduate Certificate x13.1003 Deaf and Hard of Hearing Listening and Spoken Language Professional Graduate Specialization Certificate x13.1005 Behavior Intervention Specialist Graduate Certificate x13.1007 Multiple Disabilities Specialist Graduate Certificate x13.1009 Early Intervention Vision Specialist Graduate Certificate x13.1019 Transition Specialist Graduate Certificate x13.1099 Curriculum Adaptation Specialist Graduate Certificate x13.1306 Instructional Technology in World Languages Graduate Certificate x13.1320 Training and Development Graduate Certificate x13.1399 STEM Education and Leadership Graduate Certificate x13.1401 Teaching English to Speakers of Other Languages (TESOL) Graduate Certificate x15.0702 Quality Management and Analytics Graduate Certificate x23.1301 Teaching of Writing in High School/Middle School, Post-Baccalaureate Graduate Certificate in x25.0101 Library Information Specialist Certificate, Post-Baccalaureate x26.9999 Biology Geographic Information Systems (GIS) Graduate Certificate x30.1101 Social Aspects of Aging Graduate Certificate x40.0699 Hydrogeology Geographic Information Systems (GIS) Graduate Certificate x42.2805 School Psychology, Specialist in (S.S.P.) x43.0117 Forensic Accountant Graduate Certificate x45.0299 Anthropology Geographic Information Systems (GIS) Graduate Certificate x51.3101 Dietetic Internship Graduate Certificate x51.3805 Family Nurse Practitioner Certificate, Post-Master's x52.0211 Project Management Graduate Certificate x52.0213 Organizational Leadership Graduate Certificate x52.1301 Business Analytics Graduate Certificate x
55 FACTBOOK - FALL 2019
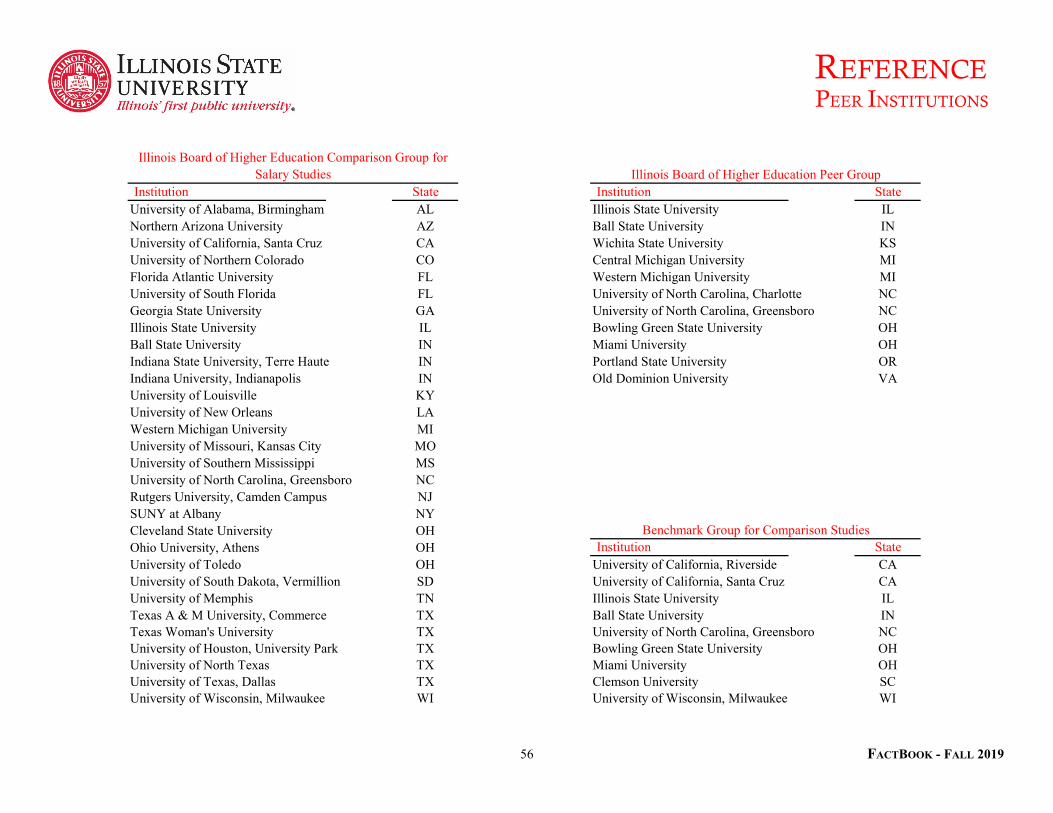
REFERENCEPEER INSTITUTIONS
Institution State Institution StateAL ILAZ INCA KSCO MIFL MIFL NCGA NCIL OHIN OHIN ORIN VAKYLAMIMOMSNCNJNYOHOH Institution StateOH CASD CATN ILTX INTX NCTX OHTX OHTX SCWI WI
Northern Arizona University Ball State University
Illinois Board of Higher Education Comparison Group for Salary Studies Illinois Board of Higher Education Peer Group
University of Alabama, Birmingham Illinois State University
Georgia State University University of North Carolina, Greensboro
University of California, Santa Cruz Wichita State UniversityUniversity of Northern Colorado Central Michigan UniversityFlorida Atlantic University Western Michigan UniversityUniversity of South Florida University of North Carolina, Charlotte
Illinois State University Bowling Green State UniversityBall State University Miami UniversityIndiana State University, Terre Haute Portland State UniversityIndiana University, Indianapolis Old Dominion University
Rutgers University, Camden Campus
University of LouisvilleUniversity of New OrleansWestern Michigan UniversityUniversity of Missouri, Kansas CityUniversity of Southern MississippiUniversity of North Carolina, Greensboro
SUNY at AlbanyCleveland State University Benchmark Group for Comparison StudiesOhio University, AthensUniversity of Toledo University of California, RiversideUniversity of South Dakota, Vermillion University of California, Santa CruzUniversity of Memphis Illinois State UniversityTexas A & M University, Commerce Ball State University
University of Texas, Dallas Clemson UniversityUniversity of Wisconsin, Milwaukee University of Wisconsin, Milwaukee
Texas Woman's University University of North Carolina, GreensboroUniversity of Houston, University Park Bowling Green State UniversityUniversity of North Texas Miami University
56 FACTBOOK - FALL 2019

REFERENCEUNIVERSITY DEFINITIONS
STUDENT TERMS
Cohort: The group of first time in college or transfer students entering the University within a given fall semester; beginning in fall 2015, summer starters are included.
Academic Level: Student's academic (class) level based on completed credit hours: Freshman, Sophomore, Junior, Senior, Non-Degree Seeking Undergraduate, Master's, Certificate, Doctoral/First Professional, and Non-Degree Seeking Graduate.Applicant: An individual who has fulfilled the institution's requirements to be considered for admission (including payment or waiving of the application fee, if any) and who has been notified of one of the following actions: admission, nonadmission, placement on waiting list, or application withdrawn by applicant or institution.Career: All of the course work undertaken by a student that is maintained in a single record. Illinois State University offers two academic careers: undergraduate and graduate.Census Day: The University’s official date for enrollment each semester. This is typically the 10th day of class.Certificates: Illinois State University currently offers three types of certificates at the graduate level within two different categories: IBHE Approved Certificates:
Post-Baccalaureate Graduate Certificate: Requires a minimum of 18 semester hours of graduate courses beyond the baccalaureate degree, but less than required for a master's degree. This type of certificate is approved/reviewed by the IBHE.Post-Master’s Graduate Certificate: Requires a minimum of 24 semester hours of graduate courses beyond the master’s degree but less than a doctoral degree. This type of certificate is approved/reviewed by the IBHE.
Non- IBHE Approved Certificates: Graduate Certificate: Requires a minimum of nine but no more than 17 semester hours of graduate courses beyond the bachelor’s degree. This type of certificate is not approved/reviewed by the Illinois Board of Higher Education (IBHE).
CIP Codes: Classification of Instructional Programs (CIP). A federal coding system used to provide a taxonomic scheme that will support the accurate tracking, assessment, and reporting of fields of study and program completions activity.
Graduation Rate: Total number of first time in college students within the given cohort who complete their degree within six years of normal time divided by the number of students in the original cohort. Headcount: The count of each student enrolled at the University as of Census Day.
Credit Hour: A standard unit of measuring course work; credit hours are assigned to a particular course and count toward graduation.Degree Program: A program which has specific requirements and number of credits, including a common core (general education) for all students seeking a particular degree. Degree programs are approved through a curricular process through the Illinois Board of Higher Education. First Time in College Students (FTIC): First-time, first year students who have not attended any college since graduating from high school (includes students who attend a college or university the summer after high school graduation, students with advanced placement credits, and students who took courses for college credit while attending high school).Full-Time Enrollment: Undergraduate students are considered full-time in the fall semester if they are enrolled in 12 or more credit hours as of census day; graduate students are considered full-time in the fall semester if they are enrolled in nine or more credit hours as of Census Day. Full-Time Equivalent (FTE): The sum of a student's current term credit hours / 15 (for undergraduate) and 12 (for graduate)Grade Point Average (GPA): The total number of grade points divided by the total graded semester hours attempted at Illinois State University.
57 FACTBOOK - FALL 2019
REFERENCEUNIVERSITY DEFINITIONS
STUDENT TERMS (CONTINUED)
Major/Plan: The course of study a student follows to fulfill the requirements of a degree.
On-Campus: A student who is enrolled in at least one on-campus course and/or is living in the residence halls.Off-Campus: A student who is 100 percent enrolled in online classes or off-campus classes or a combination of the two and is not living in the residence halls.
Total Enrollment: Combination of on- and off-campus student enrollment as of Census Day.
EMPLOYEE TERMS
Non-Resident: A student whose principle residence is not in Illinois.
Interdisciplinary: A plan or course that spans two or more academic disciplines.
Minority: Includes American Indian/Alaskan Native, Black/African American, Asian, Hispanic and Hawaiian/Pacific Islander. Excludes White, No Response and Non-U.S. Citizen following IPEDS and the Department of Education categories.Native Students: Students who start as first time in college students at Illinois State University.New Students: Students attending Illinois State University for the first time (Illinois State University baccalaureate recipients entering their first semester working on a second bachelor's degree are considered readmitted students).Non-Degree Seeking: A student who has not been admitted to a plan leading toward a degree; these include visiting students, dual-enrolled students and international exchange students.
Emeritus: Retired faculty with rank who continue employment at Illinois State University are accorded the privilege of retaining their professorial title after retirement with the added designation of the word "emeritus" or "emerita."
Non-U.S. Citizen: International students who are neither a citizen nor a permanent resident of the United States.
Office of the Provost: Includes Interdisciplinary Studies, University Studies, Undeclared, and Non-Degree Seeking Undergraduate and Graduate Retention Rate: Number of first time in college students within a given cohort who return for their second fall semester divided by the original cohort.Semester: A semester at Illinois State is the 16-week academic session offered each fall and spring. The summer session is not considered a semester.Show Rate: Ratio of students who enrolled compared to the number who were accepted.Time to Degree: Time to degree reflects the number of first time in college students who graduated from the University in a given fiscal year and then calculates backwards to track how many years it took each student to graduate from the first term the student began. Time to Degree does not consider cohorts in the calculation.
Transfer Student: Students who previously attended one or more semesters at a community or four-year college after graduating from high school (whether or not any course work was completed).Undergraduate Class Size: Includes primary sections with at least one degree-seeking undergraduate student enrolled for credit. Excludes internet, online abroad and one-on-one courses. Excludes students in professional practice and music research.Yield Rate: Ratio of the number of students who were accepted compared to the number of students that applied.
Administrative/Professional: Appointments primarily for the purpose of mission support and include a wide range of responsibilities.Civil Service: Civil Service positions are governed by the State Universities Civil Service System. Candidates must demonstrate their ability to perform by passing a test specifically designed for the job. Areas of Civil Service employment include professional, technical, clerical, crafts, and service. The civil service system has four classifications of employees: Exempt, Non-Exempt, Negotiated, and Extra Help.
58 FACTBOOK - FALL 2019
REFERENCEUNIVERSITY DEFINITIONS
EMPLOYEE TERMS (CONTINUED)
OTHER TERMS
Full-time: A work schedule of 37.5 to 40 hours per week; considered to be 100 percent.
Faculty: Any Tenure-Track or Non-Tenure Track appointment, ranked or unranked, for the purpose of instruction, organized research, and/or public service in one of the academic (credit hour producing) departments and related areas.
Departmental: Faculty teaching in an academic department.Non-departmental: Faculty in a non-academic department such as University College instructors.Lab School Associates: Appointments that do not hold rank in an academic department and are assigned primarily to Thomas Metcalf School or University High School.Library Faculty: Can hold academic rank and are assigned primarily to the Library.
Tenured/Tenure Track: Tenure is granted by the University under the authority granted to the President by the Board of Trustees. Tenure appointments are held only in academic departments or similar academic units.
IBHE: Illinois Board of Higher Education, the statewide planning and coordinating board for higher education in Illinois, approves/reviews degree programs, provides budget recommendations to the Governor and General Assembly, administers a variety of grant programs, approves operating authority for independent institutions, engages in master planning, and maintains comprehensive higher education databases.IPEDS: The Integrated Postsecondary Education Data System conducted by National Center of Education Statistics (NCES). IPEDS began in 1986 and involves annual data collections. Survey data are required from all postsecondary institutions that have a Program Participation Agreement (PPA) with the Office of Postsecondary Education, U.S. Department of Education. IPEDS also requests limited data from approximately 3,000 other schools offering postsecondary education programs.
Headcount: The count of each faculty enrolled at the University as of the Faculty/Staff Census Day (after first full month of semester).Minority: Includes American Indian/Alaskan Native, Black/African American, Asian, Hispanic and Hawaiian/Pacific Islander. Excludes White, No Response and Non-U.S. Citizen following IPEDS and the Department of Education categories.Non-Tenure Track: Appointments for full and part-time positions are for a specific purpose and for a specified period of time appropriate to that purpose.No time served in any of the non-tenure track titles counts toward fulfillment of a probationary period leading to tenure.Part-time: A work schedule of less than 100 percent.Rank: The academic ranks that are conferred for tenure at Illinois State University are: Professor, Associate Professor, and Assistant Professor. Promotionwithin the academic ranks is recommended by the Provost to the President for approval.Tenure: Tenure is an important means of protecting the rights of members of the faculty to freedom of inquiry, research, discourse, teaching, learning, and publications. Tenure entails the faculty member's obligation to strive continuously to improve competence and to cooperate with colleagues in an effort to improve the quality of scholarship and teaching at the institution. The freedom and security provided through academic tenure are fundamental to the success of a university in fulfilling its obligations. After the expiration of a probationary period, faculty have permanent or continuous tenure, and their service should be terminated only for adequate cause, except in the case of retirement for age, or under extraordinary circumstances because of financial exigencies.
59 FACTBOOK - FALL 2019