University, - dtic.mil · SUPPLEMENTARY NOTES ... ts were performed in a torsional Kolsky bar a;...
45
,ql-.o /I 9/'- J74.6-•-- NBrown University,_ DIVISION OF ENGINEERIV•f•Q LU a PROVIDENCE, R.I. 029121 Strain Rare Effects and Temperatur- 1Historv E;;ccts I for Thrt , Different Tempers r'. 43-40 VAR Sc-p•. by S. Tanimura and J. Duff>) C- -j E~ SE I , 8 1`934 .4 84 09 99
-
Upload
dinhkhuong -
Category
Documents
-
view
217 -
download
0
Transcript of University, - dtic.mil · SUPPLEMENTARY NOTES ... ts were performed in a torsional Kolsky bar a;...

,ql-.o /I 9/'- J74.6-•--
NBrown University,_
DIVISION OF ENGINEERIV•f•Q
LU a PROVIDENCE, R.I. 029121
Strain Rare Effects and Temperatur- 1Historv E;;ccts
I for Thrt , Different Tempers r'. 43-40 VAR Sc-p•.
by
S. Tanimura and J. Duff>)
C-
-j E~
SE I , 8 1`934 .4
84 09 99

July, 1984
0
Strain Rate Effects and Temperature History Effects
for Three Different Tempers of 4340 VAR Steel. 0
by
S. Tanimura and J. Duffy
DTICr:fti
Army Research Office . . 1Report No. DAAG 29-81-K-0121/4 *
Materials Research LaboratoryBrown University
,. .. •- , .

. .JI±CfT. n --SECURITY' CLAS',IFICATION OF THIS PAGE ("a.ts Dole Enforod)
REPORT DOCUMENTATION PAGE READ INSTRUCTIONSBEFORE COMPLEI ING FORM
1. REPORT tlUMBER 2. GOVT ACCESSICN NO. 3. RECIPIENT'S CATALOU NUMBER
APO 18414.7-EG N/A NIA4. TITLE (ad Subtlti,) S. TYPE OF REPORT & PERIOD COVERE, .
STRAIN RATE EFFECTS AND TEMPERATURE TECHNICAL REPORTHISTORY EFFECTS FOR THREE DIFFERENT . .TEMPERS OF 4340 VAR STEEL 6. PERFORMING ORG. REPORT NUMBER
7. AUTWOR(e) •. CONTRACT OR GRANT NUMBER(@)
S. TANIN1JRA AND J. DUFFY DAAG 29 81-K-0121
9. PERFCRMING ORGANIiATION NAME AND ADDRESS 10. PROGRAM I.-LEMEII1. PROJECT, TASKAREA & WORK UNIT NLUMBERS
BROWN UNIVERSITYDIVISION OF ENGINEERINGPROW I DENCI." .. RI 02912 |. •
II. CONTROLL;tnr, OFFICE NAME AND ADDRESS .2. nEPORTr OAT-E
U.S . Arriv RXearch Off-;ce JULY, 1984Po'st Of.ice 13ox 12211 13. NUMBER OF PA(ý.
lIONl rOnhIJG -CJ.ENCy ?JAME Ao RESS(It dtff it goat Cro nifr)om IS. SECURI ry (i. ASS. .r n.' r| IS..t)
Unclassi 'itd .
ISa. DECLASSIrICATION;O.•,WI'•RArDINGSCH ELUUI.•
16. DISTRIUUTION S1 AIEM N'T (o1 chi* Repo,,)
Approved for public release; distribution unlimited. , -
17. UISTRIBUTION S fATEMENT (of the Abetract toeied In Bloch 20, Il dilfferent irom Report)
NA
II. SUPPLEMENTARY NOTES
The view, opinions, and/or findings contained in this report are0 those of tlhe author(, ) and should not be construed as an official 0
Department of the Army position, policy, or decision, unless so_n -s j,-,tart-d 1b'' othcer docitmi,nr inn .
19. KEy WORDS rContlinue on reverse old II tnecessary amid Idonilly by block number)
STRAIN RA'F"TEMPERATURE iU] STORY4340 VAR STEEL
120- AV,' TflC ,w4Lu an reverse4 s it 1 nec..ar ýd Idaminlbl, hlbl'ck n-.b4v)
A serites of experiments is described in which specii.men; of Al SI ;434U VAK1. "st,,el are deformed in shear at temperatures ranging from -19( C to 20°'. Tlete-:ts were performed in a torsional Kolsky bar a;- quasi-stat!c and dywnai,"strain rotes. Before testing all the specimens were normalized, aI..Lottitized -ani tenmrtred either at 200"C, 425 C or 600 °:, repyr.seLiting iardnesses of 55,44, and 3j, rcApec Lively, on the Rockwell C scale. It, addition to conistaLnttemperature and constant strain tests, a number of experilmenLs was periormcd
- - -an _= -
-D D I J•AMJ • 1473 EuItosO F II NOV6% IS OSOL CTE WNC[ ASStFII- D ["D
SECURITY CL-ASSIFIr ATION OF THIS PAGF (Ph- Vat. 1-t.,4l)

A' lCT- A ;S IFT PT EDSECURITY CL ASI9ICATION OF THIS PAGE(Whe D.)eta Sunered)
to study history effects in these three tempers. For this purpose a prestrainwas imposed at one temperature and strain rate, followed by continued SLraixingat a new temperature or at a new strain rate.
Results provide stress-strain curves in shear for the three tempers of0 0this steel. Temperature effects appear greater between -190 C and .-50 C thanbetween -50°C and room temperature, particularly for the 200°C temper, while
Sthe strain rate sensitivity is about the same as found in mild steel. Historyeffects are quite small for the 60 0 0C and 425°C tempers, even at large strains.However, for the 200 0 C temper a prestrain at -50oC followed by a temperature ! •change to -190°C requires a higher flow stress than does deformation imposed
Sentirely at the lower temperature. A comparison is made to history effects inother BCC metals.
Accession For
DTTC Lr', i
UZI 0 ,.JU52ti:'ic&' •:_By3
Diztrab1 .i /
Avail•o•lii ilv Codes pIAvz'ij m&4l/0r
DI~ Spcia i..* i i
;. * .
UNJCLASSIFIEDJ5
SECURITY CLASSIFICATION OF THIS PAGErIWho, L111 Fninet,.-

Strain Rate Effects and Temperature History Effects
for Three Different Tempers of 4340 VAR Steel 0
by
S. Tanimura* and J. Duffy**
ABSTRACT
A A series of experiments is described in which specimens of AISI 4340 VAR
steel are deformed in shear at temperatures ranging from -190 0 C to 200 C. The
tests were performed in a torsional Kolsky bar at quasi-static and dynamic
strain rates. Before testing all the specimens were normalized, austenitized
and tempered either at 200C, 425&C or 6001C, representing hardnesses of 55,
44, and 33, respectively, on the Rockwell C scale. In addition to constant S
temperature and constant strain rate tests, a number of experiments was
performed to study history effects in these three tempers. For this purpose a
prestrain was imposed at one temperature and strain rate, followed by
continued straining at a new temperature or at a new strain rate. -
Results provide stress-strain curves in shear for the three tempers of
this steel. Temperature effects appear greater between -190 0 C and -50 0 C than
between -50 0 C and room temperature, particularly for the 200 0 C temper, while
the strain rate sensitivity is about the same as found in mild steel. History
effects are quite small for the 600 0 C and 425 0 C tempers, even at large
strains. However, for the 2000 C temper a prestrain at -50 0 C followed by a
temperature change to -190C requires a higher flow stress than does
deformation imposed entirely at the lower temperature. A comparison is made
to his toi y ef fects in other BCC •e-al .
* VisiLing Associate Professor, Division of Engineering, Brown University.Permanent address: Uni-errit-* of Osaka Prefecture, Department of Mechanic.alEngineuring, Mozu, Tlmemachi, Sakai, Osaka, Japan.
•**Professor, Division of Engineering, Brown University, Providence, RI, 02912
9

t0
I Introduction
The stress-strain behavior of steels, and of other BCC metals, in the low
temperature range differs in a number of respects from that of the FCC metals.
It has been found, for instance, that strain rate sensitivity generally is
greater for steels, while strain rate history and temperature history effects
usually are not as pronounced, at least in the neighborhood of room
temperature (1,2). One factor that influences strongly the behavior of steels
is dynamic strain aging, which results in the familiar peak in the stress
versus temperature curve usually occurring in the neighborhood of room
temperature (3). The influence of strain rate on this peak is to shift its
position to higher temperatures as strain rate is increased. Similarly, a
plot of flow stress versus strain rate frequently shows a relative minimura
rather than a monotonic increase with strain rate as in the FCC metals.
History effects in BCC metals reveal a complex and as yet not well-understood Al
behavior particularly at low termperatures and for some ranges of strain rates
(4-10). Experimental evidence demonstrates that the influence of strain rate
and temperature history on flow stress is far more complicated for steels than
for aluminum or copper.
Due to its many applications, a particularly interesting steel is AISI
4340 alloy and, for the present investigation, round bars of this steel,
"processed by vacuum arc remelting (VAR), were obtained from Republic Steel
Corporation. Since the mechanical properties of this steel are strongly
sensitive to the choice of heat treatment, specimens were subjected to one of
three different heat treatments to provide a representative range of
properties. Both quasi-static and dynamic stress-strain curves in shear were
then obtained by twisting short thin-walled tubular specimens in a torsional
Kolsky bar (split-Hopkinson bar). These stress-strain curves covered the
* temperature range from -190 0 C to room temperature. In addition to tests at
constant temperature and strain rate, a ceries of incremental temperature
tests was performed, in some cases combined with increments in strain rate.
The ultimate purpose of this work is to establish experimental data for
• derivation of a constitutive relation for this steel, preferably based on
* concepts of dislocation dynamics (II). An example of such a relation that
includes strain rLta and temperature effects as well as history effects is
"given by Tanimura (12).
, .. . . . ..m " " " - "1 " i. . . . .I . . .I " '" ' " " "- ""-1 - 1I

II Apparatus and Specimens
1) Apparatus
All tests described in this report were performed using short thin-walled •
tubular specimens loaded in a torsional Kolsky bar (split-Hopkinson bar).
With it one can perform dynamic or quasi-static tests over a broad temperature -
range by enclosing the specimen in an environmental chamber (13), the rate of
flow of liquid nitrogen into the chamber setting the specimen's temperature to .0
any value between 20 0 C and -190 0 C. As part of this investigation, incremental
temperature tests were also performed. By adjusting the flow of liquid
nitrogen into the chamber the specimen's temperature can be changed quickly
from one value to a lower value: a drop in specimen temperature from 200C to 0
-190 0 C requires about one minute, as measured by a thermocouple 2 mm from the
specimen and in contact with the Kolsky bar. This thermocouple is carefully
insulated so it is not in contact with the atmosphere within the environmental
chamber. .0
In some of the incremental temperature tests the temperature was changed
in decrements of 700C each from 20 0 C to -50 0 C, then to -120 0 C, and finally to
-190 0 C, all within a small range of strains, so that the thermal effects on
flow stress could be determined at a number of different temperatures. These 0
multiple decrements in temperature performed on a single specimen eliminate
the effects of variations in grain size, heat treatment, microstructure,
inclusions and dimensions between test specimens. In addition, in a few tests
a temperature increment was imposed by reheating the cold specimen while it 9
was deforming quasi-statically. Reheating was effected using an electric heat
gun; the temperature increment from -190 0 C to -50 0 C requires 8 m;.nutes.
Although the torsional Kolsky bar has been fully described in previous
publications (14,15), a brief summary of the technique is presented here. The S
dynamic strain rate in the torsional Kolsky bar is achieved by the sudden
release of a stored torque at the end of the incident bar. This provides a
torsional pulse that propagates down the incident bar to load the specimen in
shear. In contrast, quasi-static loading is achieved by slowly twisting the .
further end of the transmitter bar while the incident bar is clamped to "
prevent rotation. In addition, the apparatus makes it possible to combine. . "
0e

static and dynamic loading to perform an incremental strain rate test in which
the specimen is loaded first quasi-statically to a desired value of strain,
whereupon the dynamic strain rate is superposed. The increment in strain rate 0
from the quasi-static to the dynamic rate takes place in about 15 micro-
seconds. In the case of quasi-static tests, the elastic response of the
Kolsky bar between the rotary displacement transducers on either side of the
specimen is subtracted from the recorded displacement to provide the net e0
rotation between the ends of the specimen. The quasi-static strain rate for
the present tests was 6 x 10⁻⁴ s-1 and the dynamic strain rate was in the
range 400 s-l to 600 s-1 .
2) Specimens
The specimens were all machined from round stock of AISI 4340 VAR (vacuum
arc remelted) steel whose chemical composition is given in Table 1. Before
machining, all specimens were normalized, austenitized and tempered at one of
three temperatures 200 0 C, 425 0 C and 6000 C. Since loading is imposed in
torsion, the specimen is shaped as a thin-walled tube, with hexagonal flanges
at each end to permit mounting in the Kolsky bar; dimensions are given in
Figure 1. For the heat treatment, the specimens were placed in groups of six
j at the center of a 24-inch long tube-furnace. An argon atmosphere that first
passed over copper chips was used to prevent oxidation during the heat
treatment. The heat treating cycle, given in Table 2, consisted of three
steps: (1) normalizing for 1/2 hour at 900 0 C, then cooling in argon; (2)
austenitizing for 1/2 hour at 8450C, followed by an oil quench; (3) tempering
for 1/2 hour. Specimens tempered at 425 0 C or at 600 0 C were oil quenched;
specimens tempered at 200 0 C were cooled in argon. After the heat treatment,
the specimens showed no visible signs of oxidation. Their hardness was
measured as HRC 55, 44, 33 for the 200 0 C, 4250 C and 600 0 C tempers, 0
respectively. All specimens were cleaned inside and out and their dimensions
measured carefully. If a specimen was found to have a taper along the gage
length or a variation in wall thickness that was greater than 0.01 mm, it was
rejected. For those tests designed to compare the flow stress characteristics
of the same temper, the specimens were heat treated in one batch. This
procedure had to be followed since it appears there are variations in stress
levels due to minor variations in heat treatment between batches, occurring
perhaps during the brief time necessary to drop the specimen in the quenching
fluid.
-3-

-!Figure 2 shows photographs of the microstructures resulting from each of
the three different tempers. The samples were taken from heat-treated
specimens before mechanical testing. They were polished and given a nital .0
etch which revealed a microstructure typical of tempered martensite, with
randomly oriented lath packets. After testing, a check of carbon content in
the thin-walled portion of two samples gave 0.41% and 0.42% t 0.02%, thus
providing no evidence of carbon depletion during the heat treatment. These 0
percentages were determined by a combustion analysis with a LECO carbon
determinator.
JO
i -.
- 0.A
2, - - - . . . . .

III Results and Discussion
The test results are presented primarily by means of graphs showing the 0
stress-strain curves obtained under the different test conditions. These are
summarized in Table 3, which groups the specimens in batches according to the
heat-treatment, gives specimen numbers and a very brief description of the
test performed. Since a fairly large variety of different tests was performed, *
it is necessary for the sake of clarity to group the results according to the
type of test. A convenient grouping is as follows.
1) Tests at a constant quasi-static strain rate and constant temperature.
The stress-strain curves obtained for deformation at a constant strain ke
rate are shown in Figures 3a to 3c. In all these tests the imposed strain
rate was 6 x 10⁻⁴ s-l in shear and deformation was carried to fracture. For
each heat-treatment, the tests were performed at four different temperatures
ranging from room temperature down to -1900C. In comparing these curves, the
most obvious result is perhaps the pronounced influence of the heat-treatment.
With a temper of 200 0 C the flow stress is about twice as great as found with a
6000C temper. As mentioned previously, this sensitivity to the heat treatment
imposes the need for great care in the experimental procedure if the
mechanical properties are not to vary from specimen to specimen. In
particular, if the stress levels between different specimens are to be
compared with one another and if any accuracy is to be achieved, then it is
necessary that the specimens be heat-treated simultaneously and remain in
close contact with one another during the heat-treatment. This procedure was
followed in the present investigations. The results in Figures 3a to 3c also
show that the heat treatment influences the strain at which the specimen
finally fractures. In general, the fracture strain is quite low for the 2000C
temper, while strains greater than 100% are attained with the 600°C temper.
However, the experiments show considerable variation in the values of fracture
. strain, probably due to small variations in the specimens' wall-thicknesses
combined with a low work-hardening rate. In addition to the above, the
stress-strain curves show that the mechanical properties of this steel are
* fairly sensitive to test temperature, irrespective of the temper. The one
Sexception to this statement cones for the 2000C temper, Figure 3c, where the
flow stress is about the same at room temperature as at -500C. This may be
due to a more pronounced dynamic strain aging effect in the 200 0 C temper.
.- . %o'-'.'-5-
t l - - .- . . .

Table 4 compares the flow stress levels found in the present quasi-static ...
tests with the results of other investigations on 4340 steels (17-19). Since
the other tests were performed in tension, the present shear stress and strain
values were converted to axial values using the Mises flow rule and
incompressibility of plastic deformation. A precise comparison can not be
expected since only Hickey and Anctil (17) tested a VAR steel and since, even
for this steel, there are invariably differences from billet to billet as well
as differences in the heat-tre~atment. Nevertheless, it appears that the
present quasi--tatic results for all three tempers are in fairly close
agreement with ýhe results of others.
2) Tests at a Quasi-Static Strain Rate with an Increment in Temperature
between -50 0 C and -190 0 C
The stress-strain behavior resu' ting from a sudden change in temperature
during quasi-static deformation is shown in Figures 4a and 4b for the 6000 C
and the 200 0 C tempers, respectively. For the former, it appears that the
effect of a prior deformation at one temperature followed by c.ntinued
deformation at a different temperature is not very great. Indeed, if the drop
in temperature from -50°C to -190 0 C occurs at a strain of about 4% (Specimen
VT-228), then the temperature history effect is almost imperceptible, cf. the
stress levels at -190 0 C in specimens VT-228 and VT-233. When the change
occurs after 40% strain has accumulated (Specimen VT-231), then some history
effect appears: initially the subsequent flow stress is somewhat lcwer than
for deformation entirely at -190 0 C, and the work-hardening rate is somewhat
greater. However, neither of these effects is pronounced. It should be
pointed out here that, while it takes about one minute to change the
temperature from -50 0 C to -190 0 C, the new flow stress level is not established .
until after about 3 minutes have expired. In other words, the specimen is at
the new temperature long before the new flow stress level is established, so
that any difference in the stress level can be attributed to a history effect
rather than to any lag in the temperature change. When a temperature rise is
imposed from -190 0 C to -50 0 C at 40% strain (Specimen VT-228 in Figure 4a),
"* then history effects again are very small. There appears to be no difference
'" in the initial flow stress aifer the temperature rise, but the work-hardening
rate seems to change somewhat at the 40% strain when comparing Specimen VT-231
with VT-228. Results indicate also that the flow stress after the temperature
6-
t~i• .

*. rise remains substantially constant from a strain of 40% to about 100%. In Icontrast, for a specimen deformed entirely at -50 0 C, the stress in this range
does increase although the work-hardening rate is low (Specimen VT-66 in
Figure 3a).
The behavior of the 2000 C temper steel subjected to a rapid drop in
temperature during deformation is quite different from that of the 600 0C
temper. As may be seen in Figure 4b, a prestrain at -50 0 C results in a higher
flow stress at -190 0 C (Specimen VT-305) as compared with the flow stress in a
specimen deformed entirely at -190 0 C (Specimen VT-304). While an overshoot of
this type does not occur in the other two tempers, it has been observed in
previous investigations w.th steels and other BCC metals. For instance, it
was seen by Lindley (9) in experiments with a low carbon steel when its
temperature was reduced during deformation from room temperature to -120 0 C.
The overshoot occurred whether the change in temperature was imposed at 5, 10,
15 or 20 percent strain. A similar result was seen by Hartley and Duffy (5)
with a 1020 hot-rolled steel when its temperature was reduced to -190 0 C. The
reasons for the overshoot are not clear. By metallographic examination
Lindley showed that the prestrain at room temperature inhibits twinning during
the subsequent deformation at -120 0 C, whereas prestrain at -120 0 C does not, or
at least does so only to a far lesser extent. Hartley and Duffy, on the other
hand, did not observe twins. Another possible explanation might involve
differences in dislocation multiplication rates at different temperatures and,
as will be seen subsequently, at different strain rates. Perhaps the most O
likely explanation was proposed by Smith (10). He found that a prestrain at
7.5 s-1 results iL, a lower subsequent flow stress than a quasi-static
prestrain, and suggested that there may be a larger density of mobile
dislocations upon reloading due to the greater number of dislocation sources
generated at the higher rate. As mentioned previously, a more pronounced
dynamic strain aging effect in the 2000 C temper deformed at room temperature
appears to raise its flow stress so it is near the -500C curve, Figure 3c.
This same effect might explain the sharper yield point obtained with this
temper after a temperature decrement, Figure 5c, than with the other tempers.
Furthermore, if strain aging is larger at -500C than at -190 0 C, then a
. decrement in temperature at -50 0 C would lead to the appearance of an
overshoot.
7 / -
[.S

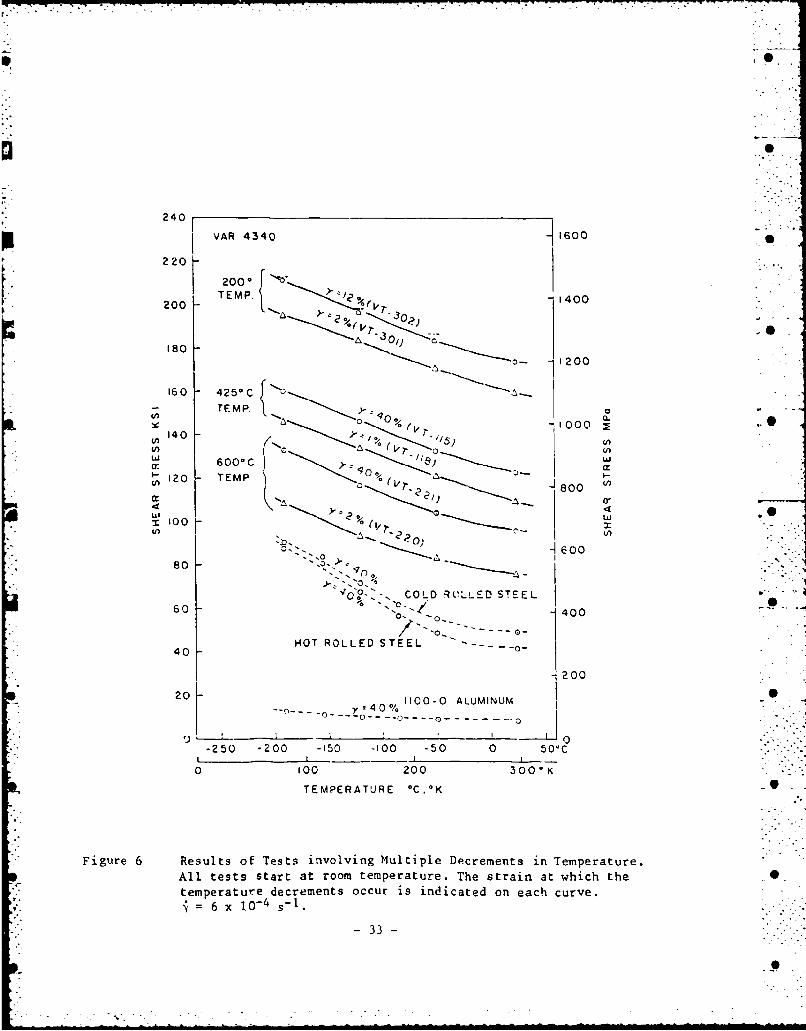
3) Tests at a Quasi-Static Strain Rate with Multiple Increments in Temperature.
For a number of specimens the test temperature during quasi-static S
deformation was changed from room temperature to -190 0 C in three successive
steps, each of -70 0 C. The reason for performing tests with multiple drops in . .. -
temperature is tc establish the variation of flow stress with test
temperature. By employing a single specimen one avoids variations in S
properties between specimens. The dotted line in rigure 5a shows the stress-
strain behavior of a 600 0 C temper specimen (VT-220) subjected to multiple
drops in temperature just after initial yield: the test temperature waschanged in rapid succession from room temperature to -500C, from -500C ,to -120 0 C and finally from -120 0 C to -190 0 C. Since it was desired to impose
the multiple increments at approximately constant strain, the deformation
process was halted whenever the specimen's temperature was decreased.
Simultaneously, a small drop in load was imposed, as shown by the stress
history in the figure. Once the new temperature was established, which took
about one minute, twisting of the end of the bar was resumed at the same rate
is before. As a result, the stress increased at approximately constant strain
until renewed yielding was observed; this process took about two minutes from ,
the start of reloading. As soon as renewed yielding was established, then the
next temperature drop was imposed. As may be seen from Figure 5a, in the case
of specimen VT-220 the sequence of three consecutive drops in temperature was
carried out at a very low strain. For specimen VT-221 a strain of about 40% -
was imposed at room temperature before the first drop in temperature was
impoeed. In addition, deformation in this specimen was stopped at about 60%
strain and the stress allowed to drop back to a value approximately equal to
that of the flow stress in a specimen deformed to the same strain entirely at .
room temperature. This unloading and reloading took abnut seven minutes. The
* brief drop in load does not seem to influence the subsequent stress-strain -
behavior except for the generation of some serrations.
Similar multiple drops in temperature were imposed on specimens cf the 3
425 0 C and 200 0 C tempers, Figures 5b and 5c. It is evident that preloading at
* room temperature to 40% strain gives evidence of some history effect. In the
case of the 2000 C temper, Figure 5c, there appears again to he an overshoot
for multiple drops in temperature as there was for a single drop in
temperattire, Figure 4b. In this case there is also some evidence of a small
.. upper Pnd lower yield point on each reloading.
-8-.° .,

In order tc draw conclusions from the multiple temperature drop .ests it
is useful to plot flow stress as a function of temperature, Figure 6. In the
case cf the 2000 C temper, for example, repeated temperature drops were imposed
on specimen VT-301, Figure 5c, at a strain of about 2%. Figure 6 shows the
flow stress at 2% strain in this specimen at room temperature and the
subsequent yield stresses at each of the lower temperatures. The best curve
drawn through the experimental points is close to a straight line, except
perhaps in the neighborhood of room temperature. If, for the 200 0C temper the
multiple drops in temperature are imposed at a strain of 12%, specimen VT-302,
it can be expected that the values of the stress will be somewhat greater, and
this is indeed the case. It is significant, however, that the two curves, VT-
301 and VT-302, are nearly parallel. A discussion of this result is presented
below. Since for specimen VT-302 upper and lower yield points were obtained,
both results are shown in the figure: the stress at the lower yield point is .
represented by small circles, while for the upper yield point a very short
dotted line is used. Figure 6 also shows the results of the multiple
temperature drop tests for the 425 0 C and 600 0C tempers. These two tempers
produce a more ductile steel, making it possible to impose successive *0
temperature drops at a greater strain (40%). The curves in Figure 6, giving
the flow stress of the 4340 VAR steel, are all nearly parallel for the three
heat treatments and over the strain range considered. Furthermore, the curves
are almost straight lines at least in the range -190 0 C to -50 0 C. This means
that the effect of temperature is the same for the three heat treatments up to
fairly large strains. From -50 0 C to room temperature there is some departure
from a linear relation due probably to strain aging effects. For purposes of
comparison, experiments were conducted with two plain carbon steels, as well
as with an aluminum, and their respective values of flow stress are plotted in
- the same figure.
4) Incremental Strain Rate Tests
A number of tests were performed in which an initial deformation was
imposed at a quasi-static rate (6 x10- 4 s-) followed by a sudden increase in -7
strain rate to about 400 s-1. The torsional Kolsky bar is ideally suited for
this type of test. Quasi-static deformation can be continued to any desired
value of strain and the change in strain rate occurs quite rapidly (about 15
microseconds) and with no significant unloading of the specimen, Furthermore,
.9
, ,..................................*l " " ' * * ... i. . '• . . l

- -- - -. ...-
during the dynamic portion of the test the output of the transmitter gages,
Figure 7, gives a direct measure of the stress increment rather than giving
the total stress, thus avoiding errors due to small differences between large
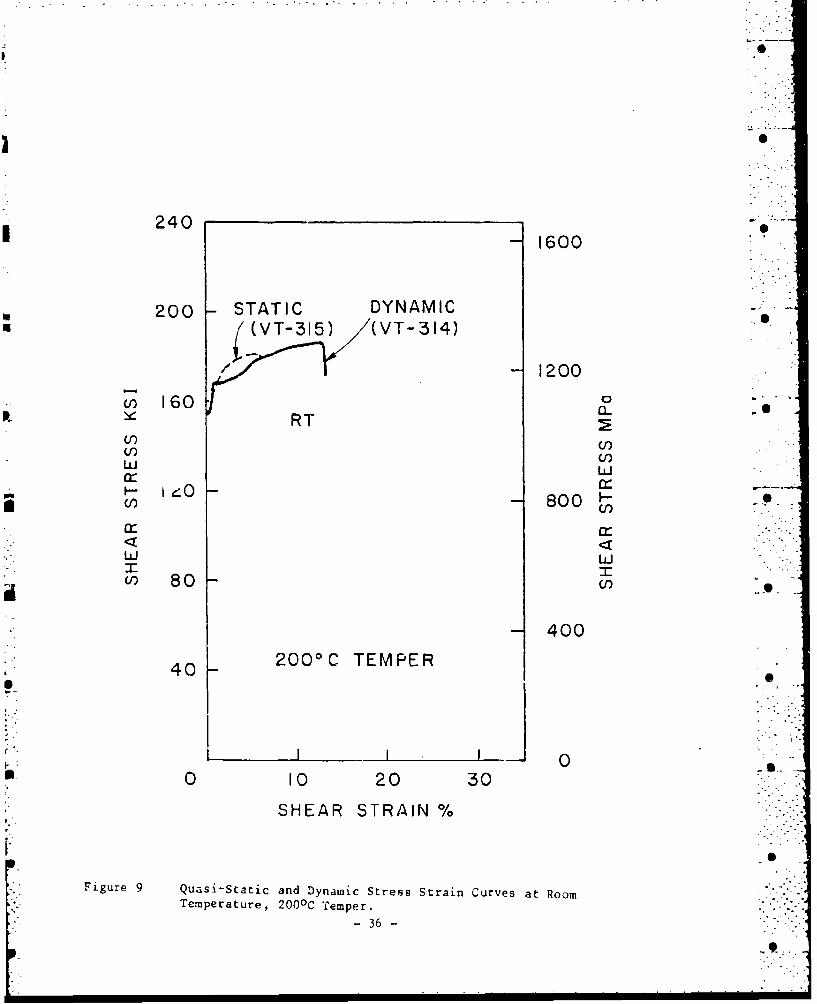
numbers. In the oscillogram shown in Figure 7, for VT-314, T. represents the
stress just before the increment in strain rate is imposed. Hence T. is the
maximum quasi-static stress, which equals about 1075 MPa for specimen VT-314.
At the instant designated by ts in the figure the stress starLs to increase
rapidly due to the change in strain rate, and the vertical coordinate gives a
measure of the subsequent increase in stress above the T. value. Theseresults can be replotted to give the increment in stress as a function of
strain, as shown in Figure 8, where the origin represents the values of Te and
'Ys, and the coordinates give the subsequent change in stress and strain. The
origin for this test (Specimen VT-314) is at Tsm1075 MPa and Y,=0.5%. The
initial increment in stress is about 100 MPa and subsequent work-hardening
resulrs in a stress of about 225 MPa above the value of T., i.e. a total of
1300 MPa. The complete stress-strain curve is shown as the solid line in
Figure 9. Judging from the two tests shown in this figure it would appear
that, at room temperature, the 2000C temper is not particularly sensitive tostrain rate. Although not evident from the figure, the initial stress level
for the two curves shown is approximately the same. At 0.5% strain the stress
* for specimen VT-314 increases suddenly due to the imposed strain rate
increment which gives evidence of a positive strain rate sensitivity.
However, the stress in the quasi-static test (VT-315) also increases showing a
pronounced work-hardening rate. Hence, for different reasons the quasi-static
and dynamic stress levels are nearly the same. The best conclusion one can
draw is that, at room temperature, strain rate sensitivity for the 2000 C
temper is not great in the range from the quasi-static to 400 s- 1 . A
. comparison with other steels is given below,
"Two examples of incremental strain rate tests conducted for the 4250 C
temper, are given in Figure 10. In each test, quasi-static deformation was
carried to about 3% strain at which point a small amount of unloading was
imposed followed by the strain rate increment. As may be seen, fracture in
both specimens ocrcjrred at a low value of strain. The results show a positive
but modest strain rate sensitivity, comparable with that found in mild steel.
S10 -
Figure 11 shows the results of a series of incremental strain rate tests
with specimens of the 6000C temper. In some of these tests the increment in
strain rate was imposed following a decrement in temperature. In all four
tests the quasi-static prestrain was carried to 40% before the temperature was
changed.
A summary of the results obtained in the incremental strain rate tests is
presented in Figure 12, and Table 5. The stress values plotted in the figure
represent the flow stress either immediately before or immediately after the
strain rate increment. The former are plotted as a point and the latter as a
point placed within a capital letter D. Dotted lines are used to connect
static flow stress values found in testing specimens heat-treated within the
same batch, and solid lines for the stress immediately following the increment
in strain rate. Values of the strain at which the rate increment was imposed
are also presented. For the 2000C temper they are specified for each specimen
with the specimen number. For the 425 0 C temper all increments were imposed at
3% strain, while for the 600 0 C temper the lower pair of curves (VT-222 and VT-
226) represents an increment at 2% strain and the higher pair at 40% strain
(VT-234, 237, 238 amd 239).
Based on the results shown in Figure 12, values of strain rate
sensitivity and an activation volume have been calculated as detailed below,and are .shown in Table 5, in which the grouping is by heat-treatment batch.
In this table, ysrefers to the value of the strain at which the increment in ,
strain rate is imposed to raise the strain rate from Ys to id, while the
stress jumps froi T. to Td. Two measures of strain rate sensitivit,
frequently used are defined by
in Td/Ts 1/6 Td Tsmt an/d •i /
in jd/'s and in Yd/YS,S
where the subscript t designates a "true" strain rate sensitivity, i.e. one
based on results of incremental tests, rather than the more usual "apparent"
• .strain rate sensitivity which is found by comparing results of two tests at
different but constant strain rates. For FCC and HCP metals values of
apparent strain rate sensitivity are greater than true values because of
- 11 -.
history effects (16). In contrast, for BCC metals the two tend to be almost
equal since history effects are small. This is the case in the present tests, .0
except for the 200 0 c temper for which the overshoot makes the true strain rate
sensitivity exceed the apparent. A similar overshoot with iron or mild steel
had been seen by Harding (8), by Eleiche and Campbell (20) and by Klepaczko
and Duffy (4). Present results are consistent in that the effect is limited .0
to low temperatures or at least is most pronounced at low temperatures.
Campbell and Briggs (7) observed an overshoot with two other BCC metals:
molybdenum and niobium. All their tests were conducted at room teraperature
but the overshoot appeared to be limited to an intermediate range of strain ,•
rates (0.5 to 5 3-l). Thus the behavior of BCC metals is complicated and it
is not surprising that an overshoot can occur with a particular temper of 4340
steel.
The numerical values of strain rate sensitivities listed in Table 5 are
close to those found in tests with mild steel (20). In the case of the 600 0 C
temper, for which more tests were conducted and for which the strain rate
increment was imposed always at the smne strain, there appears to be a peak in -
Sthe strain rate sensitivity at about 153 0 K, i.e. at T/Tm = 0.085. A similar
• ipeak, occurring at about the same temperature, has been observed by a number
* of other investigators, albeit in tests limited to lover strain rates (22).
In this respect, the trend shown in the strain rate sensitivities of the 200 0 C q
temper again appears to indicate art anomalous behavior.
Values of activation volume v* were calculated using
v* -2 T t kT
"where k is Boltzmann's constant and T is the temperature in degrees absolute.
Use of this equation presumes that the deformation mechanism is thermally -
activated and that the change in activation free energy XG necessary to
overcome the barriers to flow is a linear function of applied stress. In
Table 5 these values are presented in non-dimensionaL form by dividing v* by
bwhere b, the Burgers vector, is equal t'# 2.49 A. Figure 13 compares .
present values tor the 600 0 C temper with those obtained by other investigators
,_12 -

for a variety of steels and iron, as presented by Conrad (21), but derived
from tests at lower strain rates. The values of activation volume are given .0
as a function of the thermal stress component T* = T - T., where r is the
applied shear stress and Tp its athermal component. In plotting this figure,
Conrad took Tr as equal to the applied stress at T = 3000 K. For the present
tests and the 600 0C temper at 40% strain this makes TI = 628 MPa. As may be
seen in Figure 13, agreemert between the two curves is quite good.
The temperature dependence of the values of v*/b 3 agrees quite closely
with that of Eleiche and Campbell in te3ts with a mild steel (0.125% carbon)
at strain rates comparable to those presented here (20). They found, for
instance, that v*/b 3 decreased from 50 to 20 to 10 as test temperature went
from 3000 K to 200 0 K to 130 0 K. The values of v*/b 3 all lie within a range for
which the dominant deformation mechanism is overcoming the Peierls-Narbarro
stress (22,23).
-.13 -
-. %• °

iV Conclusions
Experiments were performed to determine the quasi-static and dynamic 0
stress-strain behavior ia shear of specimens of AISI 4340 VAR steel, tempered
to hardnesses of 55, 44 and 33 on the Rockwell C scale. For this purpose short
tubular specimens were loaded in a torsional Kolsky bar at strain rates in
shear of 6 x 10⁻⁴ s-1 and 400 s-1 and over the temperature range -190 0 C to 0
room temperature. In addition, temperature history effects were examined by
deforming the specimen first at one temperature up to a given value of strain,
and then imposing a rapid decrement or increment in temperature and allowing
deformation to continue to fracture. A faw specimens were also subjected to
multiple increments in temperature during deformation. Similarly, incremental
strain rate experiments were conducted in which the strain rate was increased
rapidly from the quasi-stctic to the dynamic rate.
Only the results of the quasi-static tests at room temperature can be
compared with those of other investigators and these show close agreement.
As expected these results show that the flov stress level in 4340 VAR steel
depends quite strongly on the temper, increasing from about 520 MPa for the
6000C temper to 760 MPa for the 425 0 C temper to 1140 MPa for the 2000C tem-,r -
The change in flow stress with test temperature, in the range -190 0 C to -500
is about the same for all three tempers even up to large strains. Furthermore,
for this range of temperatures it appears that flow stress decreases linearly
with an increase in temperature. However, the rate of change is smaller in
the range -50 0 C to 200C, particularly for the 2000 C temper. This is probably
due to the effects of dynamic strain aging and is in agreement with the
general trend seen by lanjoine for plain carbon steels (3).
Strain rate sensitivity for all three tempers of the 4340 VAR steel is 0
about the same as found in mild steel and considerably greater than that seen
in aluminum or other FCC metals (2). For the 4250C and 6001C tempers it is
nearly independent of test temperature in the range -190oC to room
temperature, although there is a small relative maximum at about -120 0 C. For .
the 2000C temper, the strain rate sensitivity is considerably greater at
-190 0 C than at room temperature. Based on these results, an activation . ,'-
volume was calculated and, for the 6000C temper, its value was found to agree
closely with the results of other experiments on iron and steels. For an .
- 14 -S-

increase in applied stress, the numerical values of activation volume were
found to decrease from about 50 b 3 to about 10 b 3 , where b is the Burgers
vector. According to Conrad this indicates that the dominant deformation
mechanism is overcoming the Peierls-Nabarro stress (22).
The effects of temperature history and strain rate history on the
subsequent flow stress are complicated, but at the same time are charac-
teristic cf BCC metals. For the 2000C temper the effects of a prior
deformation are pronounced, whereas they are small for the other two tempers.
For the 6000 C temper, for instance, history effects at a 5% strain are within
the range of experimental error. Even at large strains (40%) the effect i3
small; there is evidence, however, that the flow stress at -190 0 C is somewhat
lower after preloading at a higher temperature. There is also some evidence
that the work-hardening rate may be slightly lower following an increase in
temperature from -190 0 C to -500C during deformation. It is clear, however,
that the 200 0 C temper does not behave in the same way as the othe!r two
tempers. For instance, for this temper, a sudden drop in temperature from
-500C to -190 0 C raises the flow stress to a value that exceeds considerably
that found in a like specimen deformed entirely at -1900C. An overshoot of
this nature is quite characteristic of deformation in BCC metals, and
generally is limited to certain temperature and strain rate ranges.
The fact that the experiments described included increments in both
temperature and strain rate, in addition to the more conventional tests under
constant temperature and strain rate conditions, should make it possible to
develop uniaxial constitutive equations for different hardnesses of AISI 4340
VAR steel that include temperature, strain rate and their history.
ACKNOWLEDGEMENTS
The research support of the Army Research Office under Grant
No. DAAG29-81-K-0121 and of the NSF Materials Research Laboratory at
Brown is gratefully acknowledged. The authors are also grateful to the
College of Engineering, University of Osaka Prefecture, for the support
provided toward this collaborative project., .
Finally the authors wish to acknowledge the competent assistance of
Mr. G.J. LaBonte in performing the experiments.
-1

REFERENCES
1. U.S. Lindholm and R.L. Bessey, "A Survey of Rate Dependent Strength
Properties of Metals", Air Force Materials Laboratory, Technical Report
69-119, 1969.
2. J. Duffy, "Testing Techniques and-Material-Behaviour at High Rates of
Strain", The J.D. Campbell Memorial Lecture, Second Conf. Mechanical
Properties of Materials at High Rates of Strain, J. Harding,
Editor, pp 1-15, 1979.
3. M.J. Manjoine, "Influence of Rate of Strain and Temperature on Yield
Stresses of Mild Steel", J. Appl. Mech., Vol.11, pp A211-218, 1944.
4. J. Klepaczko and J. Duffy, "Strain Rate History Effects in BCC
Metals", ASTM-STP 765, Mechanical Testing for Deformation Model
Development, R.W. Rohde and J.C. Swearengen, Editors, pp 251-268, 1982.
5. K.A. Hartley and J. Duffy, "Strain Rate and Temperature History Effects
During Deformation of FCC and BCC Metals", to appear in Proc., Third
Conf. Mechanical Properties of Materials at High Rates of Strain,
J. Harding, Editor, Oxford, England, 9-12 April, 1984.
6. D.R. Barraclough and C.M. Sellars, "The Effect of Varying Deformation
Conditions During Hot Torsion Testing", Conf. Mechanical Properties of
Materials at High Rates of Strain, J. Harding, Editor, pp 111-123, 1974.
7. J.D. Campbell and T.L. Briggs, "Strain-Rate History Effects in Poly-
crystalline Molybdenum and Niobium", J. Less Common Metals, Vol. 44.,
pp 235-250, 1975.
8. J. Harding, Discussion of paper by J. Klepaczko and J. Duffy in Conf.
Mechanical Properties of Materials at High Rates of Strain, J. Harding,
Editor, pp 190-191, 1974.
"9. T.C. Lindley, "The Effect of a Pre-Strain on the Low Temperature
. Mechanical Properties of a Low Carbon Steel", Acta Met, Vol 13,
pp 681-689, 1965.
10. R.C. Smith, "Studies of Effect of Dynamic Preloads on Mechanical
Properties of Steel" Exp. Mech., Vol. 1, No. 11, pp 153-159, 1961.
- 16 -

11. J.D. Campbell, "Dynamic Plasticity: Macroscopic and Microscopic
Aspects", Mater. Sci. Eng., Vol. 12, pp 3-21, 1973.
12. S. Tanimura, "Practical Constitutive Equations for an Elastic/Visco-
plastic Body Covering a Wide Range of Strain Rates", P:oc.
Twentyfifth Japan Congress on Materials Research, Soc. of Hat. SAi.,
Kyoto, Japan, pp 25-30, 1982. lei
13. A.M. Eleiche and J. Duffy, "The Effects of Temperature on the Static and
Dynamic Stress-Strain Characteristics in Torsion of an 1100-0 Aluminum"
Int'l. J. Mech. Sciences, Vol. 17, pp 85-96, 1975.
14. J. Duffy, J.D. Campbell and R.H. Hawley, "On the Use of a Torsional
Split Hopkinson Bar to Study Rate Effects in 1100-0 Aluminum,"
J. Appl. Mech., March, pp 83-91, 1971.
15. L.S. Costin, E.E. Crisman, R.H. Hawley and J. Duffy, "On the Localization
of Plastic Flow in Mild Steel Tubes under Dynamic Torsional Loading" .
Second Conf. Mechanical Properties of Materials at High Rates of Strain,J. Harding, Editor, pp 90-100, 1979.
16. Senseny, P.E., Duffy, J. and Hawley, R.H., "Experiments on Strain Rate
History and Temperature Effects During the Plastic Deformation of Close-
Packed Metals", J. Appl. Mech., Vol. 45, pp 60-66 March, 1978.
17. C.F. Hickey, Jr. and A. A. Anctil, "Split Heat Mechanical Property
Comparison of ESR and VAR 4340 Steel", A•MMRC Technical Report, 83-27,
Army Materials and Mechanics Research Center, Watertown, Mass, May 1983.
18. R. Chait, "Factors Influencing the Strength Differential of High Strength
Steels", Met. Trans., Vol. 3, pp 365-371, Feb. 1972.
19. G.B. Olson, A.A. Anctil, T.S. DeSisto, E.B. Kula, "Anisotropic
Embrittlement in High Hardness ESR 4340 Steel Forgings", ANMRC
Technical Report 82-1, Army Materials and Mechanics Research Center,
Watertown, Mass, January, 1982.
20. A.M. Eleiche and J.D. Campbell "The Influence of Strain Rate History and
Temperature on the Shear Strength of Copper, Titanium and Mild Steel",
University of Oxford, Report AFML - TR-76-90, 1976.
-. -
S-q

-0
21. H. Conrad, "The Cryogenic Properties of Metals", High Strength Materials
2nd Interrational Materials Conference, V.F. Zackay, Editor, Wiley, NY, 0
Ch 11, pp 436-509, 1965.
22. H. Conrad, "Thermally Activated Deformation of Metals", J. Metals,
pp 582-588, 1964.
23. P. Guyot and J.E. Dorn, "A Critical Review of the Peierls Mechanism", e
Canadian J. Phys. Vol. 45, Pts 2 & 3, pp 983-1016, 1967.
.0
-18 -

TABLE I
Chemical Composition of 4340 VAR SteelData from Republic Steel: Heat No. 3841687
(Wt. % of 4340 Steel Alloy)
C Mn P S Si Cu Ni Cr Mo Al N 0 H • ,
.42 .46 .009 .001 .28 .19 1.74 .89 .21 .031 .005 .001 1.0
I.i
TABLE 2
Heat Treatments
Temperature Time Cooling°C (Hours)
Normalize 900 1/2 Argon Cool
Austenitize 845 1/2 Oil Quench
Temper 600 1/2 Oil Quench
425 1/2 Oil Quench
200 1/2 Argon Cool
"""19 -
--

TABLE 3 L " -
List of Tests Performed 0
Specimen Numbers Temper Test Description Strain RateArranged by Batch °C (s-1)
VT-19 Dynamic Jump at y = 3% 450 % 600VT-20 425 Dynamic Jump at y - 3% 400 ' 500VT-21 Double Jump at Y = 3% 450 " 600
VT-63, VT-65, 600 Static 6 x 10⁻⁴VT-66, VT-67
VT-I07, VT-108 425 Static 6 x 10⁻⁴VT-109, VT-1O0
VT-II5, VT-116 425 Static, Temperature Jump 6 x 10⁻⁴VT-118
VT-220, VT-221 600 Static, Temperature Jump 6 x 10⁻⁴
VT-222 600 Dynamic Jump at Y - 2% 500 650 .VT-226 Dynamic Jump at Y = 2% 500 % 650
VT-228, VT-231, 600 Static, Temperature Jump 6 x 10⁻⁴VT-223
VT-234 Dynamic Jump at Y = 40% 1450 • 1550VT-237 600 Double Jump at Y = 40% 400 " 600VT-238 Double Jump at Y = 40% 400 % 500VT-239 Double Jump at Y = 40% 400 • 500
VT-301, VT-302, 200 Static, Temperature Jump 6 x 20-4VT-304, VT-305
VT-313 Static, Temperature Jump 6 x 10⁻⁴VT-314 200 Dynamic Jump at Y = 0.5% 400VT-315 Static 6 x 10⁻⁴VT-318 Dynamic Jump at Y = 4% 400
VT-319 Dynamic Jump at Y = 2% 400 % 500VT-320 200 Dynamic Jump at Y = 3% 400 % 500VT-324 Double Jump at y = 11% 200 % 350
VT-325, VT-326 200 Static 6 x 10⁻⁴
VT-327, VT-330
- 20 -

TABLE 4
Quasi-Static Experiments:
Comparison with Results of Other Investigators
Investigators- (Heat Rockwell Initial UltimateSteel Treatment) Hardness Yield Tensile
(Mode of & Rc Stress StrengthLoading) Tempers Cy Guts
(MPa) (MPa)
Hickey- (900C 1 Hr AC
Anctil (17) 845C 1 Hr OQ)
4340 VAR 204C 54 1610 2000
(Tension) 427C 44 1350 1480
649C 31 840 980
Chait (18) (845C ½ Hr OQ)
4340 204C 2 Hr AC 51 1860 2340*
(Tension) 427C 2 Hr AC 44 1410 1580".
538C 2 Hr AC 38 1170 1450*
Present (900C ½ Hr AC
Results 845C ½ Hr OQ)
4340 VAR 200C ½ Hr AC 55 1860** 2200**
(Torsion) 425C ½ Hr OQ 44 1290** 1510**
600C ½ Hr OQ 33 860** 1170**
*Stress values converted by Chait to account for necking.
**Equivalent stress values were obtained from torsional results
using a = -'3 ; = '
20

TABLE 5
Calculation of Strain Rate Sensitivity and Activation Volume
.0 &4
Data from Jump Tests Strain Rate Act.a• Sensitivity Vol.
-Y• s T d Ts 5 YYMt lI/t v*/b30d S Td-T•
(%) (MPa) (MPa) (s-1) (s-i) (MPa)
200 314 295 0.5 1159 1076 400 6.10-4 .0055 6.19 42.7
318 13 4 1497 1339 400 6.10-4 .0083 11.78 6.3
200 320 295 3 1228 1139 450 6.10-4 .0056 6.58 39.8
324 223 11 1366 1270 275 6.10-4 .0056 7.36 26.9
319 83 2 1553 1401 450 6.10-4 .0076 11.23 6.6
425 19 295 3 828 759 525 6.10-4 .0064 5.04 52.3
21 223 3 932 842 525 6.10-4 .0074 6.58 30.4
20 83 3 1118 1035 450 6.10-4 .0057 6.13 12.1
600 234 295 40 697 628 1500 6.10-4 .0071 4.68 56.3
237 223 40 780 676 500 6.10-4 .0105 7.63 26.3
238 153 40 883 773 450 6.10-4 .0098 8.13 16.8 1239 83 40 973 869 450 6.10-4 .0098 7.69 9.7
600 222 295 2 600 524 575 6.10-4 .0098 5.52 47.9
226 83 2 883 773 575 6.10- ,004,7 7.99 e.3
22 •
............ .................................. •" '•.... •"""; ""

0
2.5 LA
Figure 1 Details of Torsion3l Specimen w;ith PeXagOLVI1 Mriunt-ing Flan~ges.Dimensions are in millinieLers.
230
- .23
00
SFigure 1 Details f Torsionl----------------------------------an-es--

S •
ww
•• . . . . H S':'
00
449
cr--
w .
L-
ui
AA, I
4L
-24 -

DdN SS381S HV3HS
000 0 0 0 00 0 0 000-
SI I I I i 0O•
0
(D0
LlL
0
!d 0
N~ ol(0 <
w 0
p. I-
-o
(0 0,I--I'-•i ,.,
0 0 0 " -v 0 0 - . .
* I Io • a -
* 0 0 " , -
00"I 0
o 0 0 0 0 0
IS>A SS3d.LS UV3HS
--2 5. '
• C) " .9

I , -. - - - - .--.-..
C..
1601900C (VT-I09)
-_120 0 C (VT-11O)1000
140 -50 0 C (VT-108)
0 RT (V T- 107)
Vl) S o CL
U) 100 (0
w w200 -
i s c VT-'"
240 -
1 0 , I- IIR (V -07,, I..1.
20 40 60 80 100 120 140 160 S
SHEAR STRAIN %
Figure 3b Results of Quasi-Static Tests, 4250C Temper.
- .26 -
Figue 3 Reult o[Quas-StticTess, 25°[email protected]

2401600
-190 0DC (VT-330)
200 -120 0 C (VT-326)RT (VT- 325)-500C (VT.-.327)- 1200 0.L
U) C,)
UU)
80 80
20000C TEMPER 400
4 0 -.
I I 00 10 20 3 0 40 -
SHEAR STRAIN %
Figure 3c Results of Quasi-Static Tesqts 200 0C Temper.
-27 -

DdI SS38iS ýIV3HS
00o 0 0C'J0 0 o
o o0 30
'4
00I0
So 00 0 '
cr-S
0 <
28- - ' '-
~o.i
H~jo
C))
0 CJE c
Cc~j
TS>i SSý]HJS HVBHS-28

!S.:
Odd SS39US UIV3HS
00 0 0
.: •
So I
0 '- . . .
LII () 0
0 - .. .
00
0 0 •-
I-- ,- -:.
LIi t 0~ O 0 - -LO CCO
coC
L LOz
crr1 ~12
iT 0%0. N L
0 <
00 0a)t
C. .o)
0 0 0 0 0 0 0_..
0 (.0 NM O I
- ..J -,
$ 0,-" ~~~~~~~~~
~ ~ .. .... .... ' . ...
.. .i"
"'

Odd SS8I1S HV3HS
oLo 0 0 ,.0
0 0 0
SQ0
00 00
<x
I-- - - .Ž- .
-' ..o •'
C3_ 0 M:-
0
0 0 0- .
a' 0 0 .
0 i0 0 -0. 1...
SI0 0 0
" ,0 0'00 4
"... ,-." ..3
"o0 0 0 0 0 0
o5-
• °.. - •0--
b - . - -.• . .: • . - . • . --- - - . - . - - . . . . . . .

Dd~q SS3ýdiS ýIV1HS
000
co
I" I I0
>0U0 0
0 LL U)
\o- o
0 L 000 • --
L))
0~ 0 UzU00
0 0. 0• crO 0-,
"..-
0 ~ LUo
U IC0
o O0
-31 -
r-.-~
i _Ii i•

00
00
o 00o 0
(0 0 -.2 c
roo
.0 -w
0 0
N .-. " .. .
0 <
€.D od I- C O "?
0 0 "-'-
0 0 0 0)U') •'. L
00) 0t( 00
I Q* -
0 W Oj OO
IS >, SS3ýJIS 8IV3HS • __
32 - -
N . - " Ir i 1
TEMP. -1400
"ISO -
120160 4250 C
-.TEMP. -
NA -'ý000 .2"140
S600 -00
c C120 TEMP "40-
0 -~~800 I
T- 100 % L 7 .
180
% -,,oo0 i "20 T1M- ALUMINUM0.-.- T006O x 1.-4 s- ,I.
" 33'o - COLD (':LED STEEL6 0 - ,. "o ' 4 0 0
40*
-- 200
20 llOO-O ALUMINUM -
9j - L-------'---'-----' 0 .. ' ,'
-250 -200 -ISO -100 -50 0 5O'C-.,,.'
0 I00 200 300 K . '""
TEMPERATURE °C,0
K- -
*Figure 6 Results of Tests involving Mlultipl~e Decrements in Temperature.All tests start at room temperature. The strain at which the ..0temperature decrements occur is indicated on each curve.
S= 6 x I0-4 s- . .. "*.
-33 - " '1
. .. - _ . - . . " . . .." . - . . .0

41 ..4
r- V
1: 0Ink
I'- 0)
"CI C4 c
0 A
u--mamn.' '&0o
-4 C
Aw *11
... EE.e/ill3 O..:'-
AWC' •-
- 34 -

o 0 0 0 0o 0 0 0N o IT I
()V N N ýOI SS IS HV H
0
0~
zC
--- I
D NV9NISS diS NI']HS 'C .
LOu
00 0 0 0 0 1..i
IIII i I f 0
ocn
°F- -.
04~~L md >-- -
LU
03
,,- to> ."•O _
C m
.- I- F-fn..2! -.
La3I z --
cru
• • I• " .
f-. C rrl),. . - .
L 6-
o LU[
0 0 0 0
IS) iN3N3HONI SS]diS d\YIHS
- 35 -
- o9
240
240 16000
200 STATIC DYNAMIC
(V~~ T- 31) ( -314
1200160 0-
..-S
V)
U)
iLii U)~
20
Li Lii
80 - V0
400
2001 TEMPER
440
F 0
m10 10 2-0 -
SHEAR STRAIN %
Figure 9 Quasi-Static and Dynamic Stress Strain Curves at RoomTemperature, 2000C Temper.
-36
!--9

* 1200
160 DYNAMiC
-190 0 C (VT-20) -10
140 V STATIC
p 120 DYNAMIC80
U) RT (VT-I19)
U)100V STATIC (n
600
a:80 a
w w
20F
400
0 20 40 60
SHEAR STRAIN %/
Figure 10 Incremental Strain Rate Tes-ts, 4250 C Temper. Test temperature
as :Indicated.- 37 -

OdN SS31.S •V-HS
o 00 0 0
- 0. _ _ _ _ '-.0
00a o ~rO ®
I-- CM ..
C~C
Z0 .
z U CO0 ~ CM
*~ / 0
LLJ >J 0....
H--a: - L °0',--- -- -
_ 0 I- F• 2 -:
0 <
0- 0 0 -z .".
> 4)J
V))L
0 0
iC 000J
I I I . •
o 0 CM C O "...0\ ---- 'ii: '
ISAI S :3dIS 8V3HS-38-

U S
240
IDYNAMIC 160013 2%(VT-319)
220 STATIC200*C;TEMP. /.-
200 =I. 1-. y~ (VT-324) 40
Y=4%-180 (VT-318)
240L "
-DY yI3% 1200 a-
160=I"M/ /o (VT-32')-5,c VT-20)o i 00
6000 C CVT
120 " y=.%V
TEMP. - /2 ,/VT-2l
1200 -LT-22"- ?:1o(T34
1 -T-19 CC
-- - . - - _" -- _')- O 1 ,0 00 •
1400
80k VT- 222
<
S,,,(V T - 14 1 . -....
- 2 50-- 2 0 0 - - 5 0> - 0 -0 0 0
/ \vT- '" •VT-237"10 -200 034, • -
T-19 600
8 YT-2242-
I"k -25 ,/2002 6000 -10 -5 0
0 100 200 3000 K
TEMPERATURE OC,OK
Figure 12 Re3sults of Incremental Strain Rate Tests. Dashed lines showstress values just before increments in strain rate and solidlines just after. increments in strain rate are imposed atstrain values indicated on curves.
-39-

100Data from Conrad (2!)
-Present results (6001C Temper)
*>
010
I000
Y igur~t 13 Activation Volumte during Plastic Flow as a Function of theThermnal Stress Component. Results for AISI 4340 VAR steeltempered at 600 0C are compared with average of datiacompiled by Conrad (21) for iron and steels.
-40 -
n I I .., 0
.... ... ... .... ... ... .... ... ... ... .... ... . . . .. . . . . . . . . .