University decentralization as regional policy: the...
18
Journal of Economic Geography 4 (2004) pp. 371–388 doi: 10.1093/jnlecg/lbh031 University decentralization as regional policy: the Swedish experiment Roland Andersson*, John M. Quigley** and Mats Wilhelmson*** Abstract During the past 15 years, Swedish higher education policy has emphasized the spatial decentralization of post-secondary education. We investigate the economic effects of this decentralization policy on productivity and output per worker. We rely upon a 14-year panel of output and employment for Sweden’s 285 municipalities, together with data on the location of university-based researchers and students, to estimate the effects of exogenous changes in educational policy upon regional development. We find important and significant effects of this policy upon the average productivity of workers, suggesting that the economic effects of the decentralization on regional development are economically important. We also find evidence of highly significant, but extremely localized, externalities in productivity. This is consistent with recent findings (e.g., Rosenthal and Strange, 2003) on agglomeration in ‘knowledge industries.’ Keywords: agglomeration economies, knowledge spillovers, regional productivity JEL classifications: O31, N34, R11 Date submitted: 15 January 2003 Date accepted: 14 January 2004 1. Introduction Sweden undertook a conscious spatial decentralization of its system of higher education beginning in 1987. This decentralization was motivated by a complex variety of political, social, and economic factors. In this paper, we analyse one aspect of this policy, its economic effect, and we provide evidence on the effects of the decentralization policy upon regional development. From a broader perspective, there has been intense debate during the past decade about the role of university research, and the spin-offs of that research, in affecting regional growth. The popular press has documented—endlessly it seems—the role of Stanford and Berkeley in fostering the growth of the Silicon Valley in Northern California. One implication seems to be that investment in post-secondary education may affect the geographical distribution of economic activity as well as its level. * Royal Institute of Technology, 100 44 Stockholm, Sweden. email < [email protected]> ** Department of Economics, University of California, Berkeley, CA 94720, USA. email < [email protected]> *** Royal Institute of Technology, 100 44 Stockholm, Sweden. email < [email protected]> Journal of Economic Geography, Vol. 4, No. 4, # Oxford University Press 2004; all rights reserved.
Transcript of University decentralization as regional policy: the...

Journal of Economic Geography 4 (2004) pp. 371–388 doi: 10.1093/jnlecg/lbh031
University decentralization as regional policy:the Swedish experimentRoland Andersson*, John M. Quigley** and Mats Wilhelmson***
AbstractDuring the past 15 years, Swedish higher education policy has emphasizedthe spatial decentralization of post-secondary education. We investigate theeconomiceffectsof thisdecentralizationpolicyonproductivityandoutputperworker. We rely upon a 14-year panel of output and employment for Sweden’s285 municipalities, together with data on the location of university-basedresearchers and students, to estimate the effects of exogenous changes ineducational policy upon regional development. We find important andsignificant effects of this policy upon the average productivity of workers,suggesting that the economic effects of the decentralization on regionaldevelopment are economically important. We also find evidence of highlysignificant, but extremely localized, externalities in productivity. This isconsistent with recent findings (e.g., Rosenthal and Strange, 2003) onagglomeration in ‘knowledge industries.’
Keywords: agglomeration economies, knowledge spillovers, regional productivity
JEL classifications: O31, N34, R11
Date submitted: 15 January 2003 Date accepted: 14 January 2004
1. Introduction
Sweden undertook a conscious spatial decentralization of its system of higher education
beginning in 1987. This decentralization was motivated by a complex variety of political,
social, and economic factors. In this paper, we analyse one aspect of this policy, itseconomic effect, and we provide evidence on the effects of the decentralization policy
upon regional development.
From a broader perspective, there has been intense debate during the past decade about
the role of university research, and the spin-offs of that research, in affecting regional
growth. The popular press has documented—endlessly it seems—the role of Stanford and
Berkeley in fostering the growth of the Silicon Valley in Northern California. One
implication seems to be that investment in post-secondary education may affect the
geographical distribution of economic activity as well as its level.
* Royal Institute of Technology, 100 44 Stockholm, Sweden.email < [email protected]>** Department of Economics, University of California, Berkeley, CA 94720, USA.email <[email protected]>*** Royal Institute of Technology, 100 44 Stockholm, Sweden.email <[email protected]>
Journal of Economic Geography, Vol. 4, No. 4, # Oxford University Press 2004; all rights reserved.

At a more theoretical level, Alfred Marshall’s insights about agglomeration economieshave been made more precise in the work of Barro and Romer, and the role of spatial
arrangements in affecting economic growth and development is suddenly respectable in
scientific circles. It was only in past decade that these external economies (‘economies of
localized industry’ in Marshall’s terms) were formally modeled as endogenous outcomes,
literally caused by the co-location of individuals and firms in urban areas. This powerful
insight, the new growth theory, has opened up an enormously powerful range of
theoretical and empirical research.
In any case, it is now quite natural to consider the putative ‘productivity gains from thegeographical concentration of human capital’ (Rauch, 1993) and to measure spillovers in
the returns to the geographical concentration of knowledge industries (Jaffe et al., 1993).
This paper analyses the consequences of the decentralization policy introduced in
higher education in Sweden in 1987. We trace the implications of this exogenous
change in regional conditions and geographical access upon economic output and
productivity. In particular, we investigate the effects arising from decentralizing the
concentrations of technical labor (i.e., university-based researchers and technicians) as
a concomitant of higher educational policy in Sweden.Section 2 provides a brief review of Swedish university policies during the recent past.
Section 3 surveys the literature on knowledge spillovers and concentrations as they affect
economic growth. Section 4 presents the models used in our statistical analysis. Section 5
summarizes our results and conclusions.
2. Swedish university policy
As late as 1977, only six universities operated in Sweden, a country of eight million people
about the size of California. Universities were located in Stockholm, Goteborg, Lund,
Uppsala, Linkoping, and Umea. In addition, there were three large technical institutes
in Stockholm: the Royal Institute of Technology; the Karolinska Institute of Medicine;
and the Stockholm School of Economics; and two others: the Chalmers Institute of
Technology in Goteborg; and the Institute of Agriculture near Uppsala. The locations
of these 11 institutions, the old established universities, are depicted in Figure 1. Inaddition, fourteen small colleges existed; each was affiliated with a university. In 1977,
the university structure was changed, establishing eleven new institutions, raising the
status of the 14 colleges and placing all 36 universities, institutes and colleges (located
in 26 different municipalities) under one administration. The ‘new’ university structure is
also indicated in Figure 1.
In almost all cases, the sites chosen for the 11 new institutions of higher education were
formerly occupied by teacher training schools, or by military training facilities. Five sites
of university expansion formerly housed institutions of preschool education; eightformerly housed affiliates of Sweden’s Institute of Education; two had been schools of
naval science (several sites had housed more than one of these facilities). In only one
instance is there any indication that regional economic considerations affected the
location chosen for a new institution.1
1 The college established in Karlskrona-Ronneby was in an area of high unemployment caused by the closing ofa major shipyard. In all other cases, the new colleges were locatedto replace or upgrade existingpost secondaryschool and training activities. See De forsta 20 aren, 1998, for an extensive discussion.
372 � Andersson et al.

Despite the change in status, new institutions of higher education developed relativelyslowly during the first ten years after reorganization. Thus, the number and distribution of
students between the universities and colleges of higher education was about the same
in 1987 as it had been in 1977. However, beginning in 1987, there was a substantial
expansion. During the subsequent period, the number of students at the newer
colleges has more than doubled while the number of students at the older universities
has increased half again. Moreover, the resources for research at the small and medium-
sized colleges have been increased, particularly during the most recent period. By 1998, the
small and medium-sized colleges had a total of 84,000 students. At that time, more than athird of all the students enrolled in higher education attended one of these colleges.
Figure 2 indicates the growth in enrollment and in research capacity in the newer
institutions.
The expansion of these regional colleges is generally considered an important part of the
government’s regional policy, perhaps the most important one. During this period, a
new college was established in Sodertorn in the south suburbs of Stockholm; another one
was established in Malmo. Four of the larger colleges were upgraded to the status of
Luleå
Stockholm
Gotland
Eskilstuna/Västerås
Hörnösand
Umeå
Uppsala
Falun/Borlänge
Jönköping
Karlskrona/Ronneby
Kalmar
Gävle
Sundsvall
Östersund
Växjö
Kristianstad
Trollhättan/UddevallaLinköping
Skövde
Karlstad
Göteborg
Halmstad
Lund
Malmö
Borås
Figure 1. Location of institutions of higher education in Sweden.
Location of pre-1977 Institutions in Bold.
University decentralization � 373

universities: Lulea, Karlstad, V€aaxjo and Orebro. Today, there are a total of 13 universities
and 23 colleges. The policy of deconcentrating universities and colleges throughout the
country was rapid and unprecedented.
What were the motives for such a policy change? One important motivation for
the establishment of these new colleges was desire to make undergraduate education
geographically more accessible in all parts of Sweden. Another motivation was to
increase the representation in higher education of students from areas geographically
0
50000
100000
150000
200000
250000
1985 1986 1987 1988 1989 1990 1991 1992 1993 1994 1995 1996 1997 1998
Older Institutions
Newer Institutions
0
2000
4000
6000
8000
10000
12000
14000
16000
18000
20000
1985 1986 1987 1988 1989 1990 1991 1992 1993 1994 1995 1996 1997 1998
Newer Institutions
Older Institutions
(b)
(a)
Figure 2. (a) Number of enrolled students at ‘old’ and ‘new’ institutions. (b) Number ofuniversity-based researchers at ‘old’ and ‘new’ institutions.
374 � Andersson et al.

more remote from the established universities. The policy also sought to increase theaccess to higher education of different social classes, especially those for which higher
education has not been a tradition. Government representatives also claim that by their
actions in this area they sought to favor those who would like to stay, to live, and to work
locally. The success of this regional policy is based on the premise that the allocation of
resources to the newer regional colleges will increase not only the educational level, but
also the number of jobs in these regions. To some extent, the government’s university
policy can be interpreted as the expression of a regional redistribution goal (Andersson,
2001).2
This policy could also be interpreted simply as fiscal policy, a central government
response to regions where there is persistent unemployment. Alternatively, the
decentralization of education and research could result in more permanent employ-
ment in the problematic regions, since a more highly educated labor force could help
to attract other economic activity. In both these senses, the university experiment during
the last decade has been described as a tool in promoting regional growth (Regeringens
Proposition 1997/1998, p. 62).
Two effects of this fiscal policy can be identified. The first is the increase in regionalemployment due to the direct investment, i.e., the construction and the operation of the
new facilities (operating, for example, through the local multiplier; see Florax, 1992). The
second is the expectation that the institution provides spillovers or externalities that could
lead to regional expansion by existing companies or by start-up firms. Perhaps a more
educated work force can better attract economic activity. Alternatively, research at a
regional college or university could lead to innovation and increased entrepreneurial
activity. This is the ‘Silicon Valley model’, and domestic critics suggest that Swedish
policy-makers are obsessed with this vision.However, building a good research environment at a new institution, even in one
narrow field, may take some time, and there may be a substantial lag before any
effects can be noticed—in the form of start-up firms, innovations from research
results, etc. It also takes some time—three or four years—to educate the students
before they can be productive in postgraduate employment. Even beyond any lags in
observing responses, the relationship between the emphasis chosen for education and
research by the various regional colleges (science, technology, social science, etc.) and the
economic activities in the region probably matters in generating economic activity.Finally, the migratory response of the newly educated students surely matters.
3. Knowledge and agglomeration
More than a century ago, Alfred Marshall identified the important relevant concepts:
‘agglomeration effects,’ the external returns to scale and scope emanating from a
2 As notedabove, there is no evidence that the sites chosenfor thesenew institutions were thosepoised to benefit,for other reasons, from productivity growth and increased economics activity. Indeed, at least one site seemsto have been chosen in response to exogenous reversals in economic fortunes. More generally, during1968–1976, the cities in which the new institutions were located, grew by 4.9% in population, while thosein which the old institutions were located declined by 4.3% (and the remaining cities in Sweden increased by6.3%). During 1977–1999, the cities in which the new institutions were located grew by 4.6%, while those inwhich the old institutions were located grew by 1.4% (and the remaining cities in Sweden increased by 7.1%).
University decentralization � 375

concentration or ‘cluster’ of companies into an ‘industrial district’ (Marshall 1890, 1920).Agglomeration effects are assumed to exist when resources are more productive in dense
and large geographical areas than in small ones. Marshall also identified ‘external eco-
nomies of scale’ as an increase in efficiency due to the complementary presence of other
companies in a cluster or industrial district. Today, ‘knowledge spillovers’ is a shorthand
expression for the external benefits that may accrue to a company in the form of new
knowledge and information emanating from the education and research at universities,
as well as from the presence of other knowledge-intensive companies in its surroundings.
Externalities flowing from human capital in regional development had a scientificrevival with the endogenous growth models starting with Romer (1986, 1990), Lucas
(1988), and Grossman and Helpman (1991). Griliches (1979, 1998) and Jaffe (1986, 1989)
have modeled this effect in a simple production function using industry and university
research as inputs. Both found a significant and positive effect of university research on
output, which they interpreted as evidence of knowledge transfers arising from the
presence of the university.
As Marshall and later Krugman (1991), Feldman (1994), Audretsch and Feldman
(1996), and Anselin et al. (1997) have emphasized, space itself forms a barrier to thediffusion of knowledge. Daily face-to-face contact may be quite important in the diffusion
of results from research and development (R&D) at universities and research centers. If
so, it is beneficial for commercial developers to locate close to universities and other
centers of basic research. Geographic proximity may be of even greater importance in
stimulating applied research. Jaffe et al. (1993) have used patent citations to trace the
geographic distribution of knowledge spillovers from university and corporate research,
finding clear evidence that spillovers are more likely come from nearby sources. Using
different models of spatial econometrics, Florax (1992) showed that income and jobopportunities increase in proximity to the universities in the Netherlands. However,
he did not find that private investments were larger or worker production was higher
in closer proximity to Dutch universities.
Attila Varga (1998) has investigated the importance of agglomeration effects and
knowledge spillovers in the US using a production function approach. He measured
the output of R&D by regional registrations of more than four thousand product innova-
tions recorded in 1982. His data confirmed the high concentration of innovation in the
states of California on the West Coast and New Jersey and New York on the East Coast.As inputs, he measured annual expenditures for research in American universities as well
as the number of employees in laboratories and research institutes within private
companies. He then related the number of innovations to annual expenditures for
university research, finding that important returns to scale and scope exist. Vargas
concluded that there is a critical mass relating the density and size of a region to the
output of innovative activity.
Several analyses of firm locations and university infrastructure have been undertaken in
Sweden. Karl-Johan Lundquist (2001) analysed cross sectional data for Sweden for 1996,finding little or no statistical relationship between the locations of start-ups and the
location of colleges and universities. The neighborhood of a college or university is
not a significant factor in explaining regional variations in the incidence and location
of new start-up companies. In the Swedish language literature, Henrekson (2002) has
argued that linkages between university research in Sweden and technology-oriented
firms are weak, arising from blunt incentives for researchers to commercialize their
results. This argument is controversial.
376 � Andersson et al.

Sorlin and Tornqvist (2000) gathered cross sectional data for some 70 regions in Swedenin 1996. According to their analysis, the Stockholm region has a considerably larger share
of research-intensive industries than would be expected on the basis of the university
research undertaken in the region. Thus, university capacity is ‘too small’ in this region. At
the same time, the relationship in Goteborg, Malmo, Uppsala, Umea, Lulea, and other
cities and regions is one of excess supply. This provides an explanation for the out-
migration of better educated labor, and graduates of regional colleges and newer
universities in particular, to the Stockholm region. Research-intensive industry has
expanded in Stockholm during the same time that a large expansion of the regionalcolleges and universities has taken place. Sorlin and Tornqvist thus view the
decentralization experiment as a failed regional development policy.
These conclusions are controversial and have received substantial methodological
criticism. (See Andersson, 2000; Wibe, 2000.)
4. Empirical analysis
4.1. The data
We investigate the relationship between the decentralization of post secondary education
to various regions in Sweden and the labor productivity of those regions. The number of
full-time-equivalent research positions at each institution measures the extent of direct
university-sponsored research, and the number of full-time-equivalent students measuresthe overall scale of the university. As reported in Table 1, during the period of 1985–1998,
the number of university research positions (R) tripled from 6,091 to 18,737. Most of this
increase (R�) occurred at the older established institutions. Beginning in 1987, research
positions were established in the newer colleges, and during the subsequent eight-year
period, the number of researchers (RN) increased sevenfold. Research positions at these
new institutions are only about 6% of the technical and research positions in Swedish post
secondary education, but the scale of these positions is expected to grow. These trends are
noted in Figure 2.During this same period, university enrollment (S) increased by almost 90%, from
160 thousand students to 306 thousand. There was an increase of roughly 63 thousand
students in the older established universities (S�) and 83 thousand students in the newer
universities (SN). The capacity of the newer colleges and universities more than tripled to
114 thousand students.
We relate these exogenous changes in educational policy to productivity, output per
worker, measured at the level of the community. Annual data are available on gross
regional product (Y) for each of Sweden’s 285 municipalities beginning in 1985.3
Employment (E), population (P), and area (km2) are all available at the municipal
level for each year, and the centroid of each municipality has been geocoded.
Table 1 summarizes the temporal variation in these measures during the 1985–1998
period. As noted in the table, aggregate employment declined slightly during the period,
from 4.3 million workers to 4.1 million, while productivity (output per worker) increased
by an average of 2.3% per year. The variability in productivity across Swedish
3 Gross regional product is estimated by the value-added approach for 45 different business sectors at themunicipal level. For a few sectors (for example, the agricultural sector), the income approach is utilized at thenational level and is then imputed to the regional level (for example, using acreage in various crops).
University decentralization � 377

Table1.
Tre
nd
sin
emp
loy
men
t,o
utp
ut,
an
du
niv
ersi
tysc
ale
an
dd
isp
ersi
on
acr
oss
mu
nic
ipa
liti
es,
19
85
–1
99
8
Ou
tpu
tp
erw
ork
er,
(Y/E
)
Un
iver
sity
stu
den
ts(S
)
Un
iver
sity
rese
arc
her
s(R
)
Un
iver
sity
gra
du
ate
sU
niv
ersi
tyg
rad
ua
tes/
wo
rkfo
rce
Yea
r
Em
plo
ym
ent
(E)
tho
usa
nd
s
Th
ou
san
ds
of
SE
K
Co
eff.
of
va
riati
on
To
tal
Co
eff.
of
va
riati
on
To
tal
Co
eff.
of
va
ria
tio
nT
ota
l
Co
eff.
of
va
ria
tio
n
Co
eff.
of
va
riati
on
19
85
4,3
22
13
1,0
45
0.1
57
16
1,0
91
6.0
12
6,0
91
8.3
33
81
5,1
14
2.5
37
0.3
87
19
86
4,3
48
13
7,1
43
0.2
25
15
7,1
81
5.9
28
7,3
50
7.9
23
85
3,3
75
2.5
52
0.3
82
19
87
4,3
83
13
9,9
82
0.1
83
16
2,1
17
5.8
56
8,6
12
7.9
00
87
8,9
97
2.5
42
0.3
76
19
88
4,4
43
14
1,8
16
0.1
99
16
4,0
01
5.7
95
9,9
99
7.6
86
90
2,1
81
2.5
23
0.3
71
19
89
4,5
08
14
5,2
33
0.1
96
16
8,6
36
5.7
14
11
,32
17
.52
59
52
,18
02
.48
70
.36
5
19
90
4,5
50
14
3,5
06
0.1
90
17
9,2
89
5.6
23
12
,83
07
.42
21
,10
0,8
67
2.5
59
0.3
70
19
91
4,4
78
13
9,9
21
0.1
91
19
8,2
47
5.4
30
13
,70
47
.39
61
,11
9,8
65
2.5
45
0.3
65
19
92
4,2
79
14
3,3
21
0.1
83
21
8,5
37
5.3
64
14
,58
07
.39
21
,16
8,3
45
2.5
59
0.3
65
19
93
4,0
52
14
0,5
79
0.2
01
23
3,6
39
5.1
46
15
,45
57
.37
01
,21
4,1
68
2.5
74
0.3
66
19
94
4,0
07
14
8,4
23
0.1
83
24
7,9
28
5.0
68
15
,45
57
.37
01
,29
3,5
89
2.6
59
0.3
69
19
95
4,0
69
15
4,8
90
0.2
05
26
7,6
46
4.9
56
16
,57
77
.32
81
,33
3,6
40
2.6
73
0.3
69
19
96
4,0
47
15
6,6
33
0.1
86
28
3,6
89
4.8
05
15
,52
57
.16
41
,37
2,1
63
2.6
95
0.3
70
19
97
4,0
14
16
9,8
59
0.1
82
29
4,6
61
4.6
87
17
,71
67
.16
11
,41
5,2
25
2.7
31
0.3
69
19
98
4,0
63
17
3,7
86
0.1
67
30
6,7
67
4.4
96
18
,73
77
.07
61
,45
2,6
34
2.7
55
0.3
67
An
nu
al
cha
ng
e
(per
cen
t)
�0
.4%
2.3
%6
.5%
14
.8%
5.6
%
So
urc
e:S
tati
stic
sS
wed
en(S
CB
)a
nd
Na
tio
na
lA
gen
cyfo
rH
igh
erE
du
cati
on
(HS
V).
378 � Andersson et al.

communities (measured by the ratio of the standard deviation of productivity measured atthe community level relative to the national average) exhibits no trend. The number of
university students increased by 6.5% per year while the number of full-time researchers
employed at these universities increased by almost 15% per year. The variation in the
average number of university students enrolled across communities declined
monotonically as did the variation in the number of university-based researchers
employed. These reductions in spatial variation are, of course, the outcomes of the
government policy of decentralization of university facilities.
The table also presents information on the total number of people in the Swedish laborforce with a university degree. The number of graduates increased by more than 600
thousand during the period 1985–1998, but the coefficient of variation increased—
suggesting an increased spatial concentration of highly educated labor in the
economy. Finally, the table presents the coefficient of variation of the fraction of
college graduates in the workforce. This has declined. Overall, these trends suggest
that labor has become more concentrated spatially, but that university graduates have
become more evenly distributed throughout the labor force.
Table 2 reports rudimentary information on the spatial character of higher education inSweden. For each of the six older university cities, the table reports the resident population
within 40, 100, and 200 kilometers. The table also reports the unweighted average distance
of each of the old university towns to all other communities in Sweden. The table indicates,
Table 2. Resident population at various distances from municipalities containing universities, 1998
A. Cumulative resident population
at various distances from locations
of older universities 40 km 100 km 200 km
Umea 109,588 135,663 410,768
Uppsala 234,461 2,288,376 3,420,737
Stockholm 1,568,832 2,325,316 3,580,240
Linkoping 186,213 836,283 4,377,098
Lund 624,448 1,146,756 1,766,513
Goteborg 725,386 1,269,268 2,400,353
B. Cumulative resident population
at various distances from locations of
older and newer institutions
Newer institutions 3,341,259 5,792,355 8,092,973
Older Institutions 3,353,295 7,852,810 8,755,228
All institutions 6,191,626 8,528,638 8,759,227
C. Minimum average distance
(kilometers) of communities to
Average Std.dev
Older institutions 116 85
Newer institutions 62 49
Note: Total Population 8,841,583.
University decentralization � 379

for example, that the university in the northern city of Umea is the most remote.Universities in Stockholm and Uppsala are the most accessible. More than a third of
the population resides within 200 kilometers of these centers of higher education.
The table also reports the shortest distance from a community to the location of the
older universities, averaged over the 285 communities, as well as the shortest distance to
the location of the newer institutions.
4.2. Empirical models
We investigate the relationship between educational policy changes and economic activ-
ity using a simple stylized model. We relate the average productivity of workers by
community to exogenous changes in the size of the universities, measured by
enrollment, and the number of researchers. We conduct this analysis at the level of
the municipality, using time-series data for 1985–1998. The use of panel data permits
us to hold constant a variety of unmeasured region-specific characteristics affecting
variations in average productivity, as well as unmeasured factors affecting the courseof productivity over time.4 We estimate models employing fixed effects for municipality
and year.
Our models estimate the effects of university students and university-based researchers
on the productivity of local areas and compare the effects for the older established
(pre-1977) universities with those for the newer, smaller, and less centralized insti-
tutions established since then.
The geographical areas are generally quite small, and our research design attempts to
control for potential spillovers across geographical boundaries in a variety of ways. Thegeneral form of the model is:
log Yit=Eitð Þ ¼ aUit þX285
j¼1
bjCj þX1998
k¼1986
gkTk þ eit: ð1Þ
The dependent variable is worker productivity, output per worker, in community i in
year t. Uit characterizes post secondary education in community i in year t, Cj is a dummy
variable with a value of one for community i¼ j and zero otherwise (i 6¼ j), and Tk is a
dummy variable with a value of one for year t and zero otherwise.a,b and g are estimatedparameters and e is an error term.
In various regressions, we measure U by the number of post secondary students (S)
enrolled in institutions located in the community or by the number of university-based
researchers (R) working in the community. In other regressions, we distinguish between
students enrolled in the older established institutions (S�) and those enrolled in
institutions newly established after the policy change (SN). Similarly, we distinguish
between university-based researchers employed at the ‘old’ and the ‘new’ institutions
(R� and RN, respectively).Table 3 reports the most basic set of results, regressions, relating average producti-
vity in each community in each year to the number of university students and university-
based researchers in each jurisdiction. All regression models include fixed effects for
4 The first year of the panel corresponds to the first year for which output per worker can be measured at themunicipal level.
380 � Andersson et al.

285 communities and 13 time periods, so the coefficients are identified by the within-community and within-time period deviations in log productivity.
The regressions explain about three-quarters of the variation in log productivity, and
the coefficients of each variable are highly significant. Interpreted literally, an increase of
100 university students in a community is associated with an increase in labor productivity
of 0.25% (or about a quarter of a percentage point at the means). University-based
postgraduate researchers are about 17 times as important in increasing productivity,
as are students. An increase of 100 university researchers is associated with a
productivity increase of about 0.6% (or roughly 2.6 percentage points).It is also clear from the table that the marginal effect of students or researchers at the
‘new’ institutions of higher education on productivity is larger than the effect of students
or researchers at the ‘old’ institutions—roughly twice as large for students and eight times
as large for university-based researchers. These estimated differences are statistically
significant.5
A major drawback in interpreting these results is the neglect of any intercommunity
spillovers arising from the economic activity stimulated by investment in post secondary
institutions. An implicit assumption in interpreting Table 3 is that all enhanced
Table 3. Basic regression models of regional productivity (t ratios in parentheses)
Specification (1) (2) (3) (4)
S� 105 0.988
(5.19)
SN� 105 1.625
(4.44)
S� � 105 0.774
(3.56)
R� 104 0.561
(3.92)
RN� 104 4.003
(2.84)
R� � 104 0.532
(3.71)
R2 0.766 0.766 0.765 0.766
Moran’s I 9.278 9.447 8.706 8.741
Note: All models include fixed effects for 285 municipalities and 13 time periods. The sample consists of a panelof 3990 observations, one for each municipality for each of 14 years.
5 In other regressions, available upon request, we estimated analogous models using one-, two-, and three-yearlags for both students and researchers. In other regressions, we also included squared terms for both studentsand researchers in the statistical models. The results reported in the text are robust to those changes inspecification.
We also investigated models in which the dependent variable was specified as output, not productivity. Inthese models, the pattern of significance of the coefficients was identical (although the explained variance inthe models was much higher, above 0.99); the importance of students (and researchers) was larger at newinstitutions than for the older institutions, and the importance was larger for researchers than for students.
University decentralization � 381
productivity stimulated by increased university investment occurs in the same communityin which the university is located. Although this simplification may be plausible in very
rural regions, it is hardly defensible in denser metropolitan or suburban regions. The last
line of the table reports values for Moran’s I (distributed as t). These test statistics suggest
that the hypothesis of spatial dependence among the data can not be rejected. This spatial
dependence is simply ignored in Table 3.
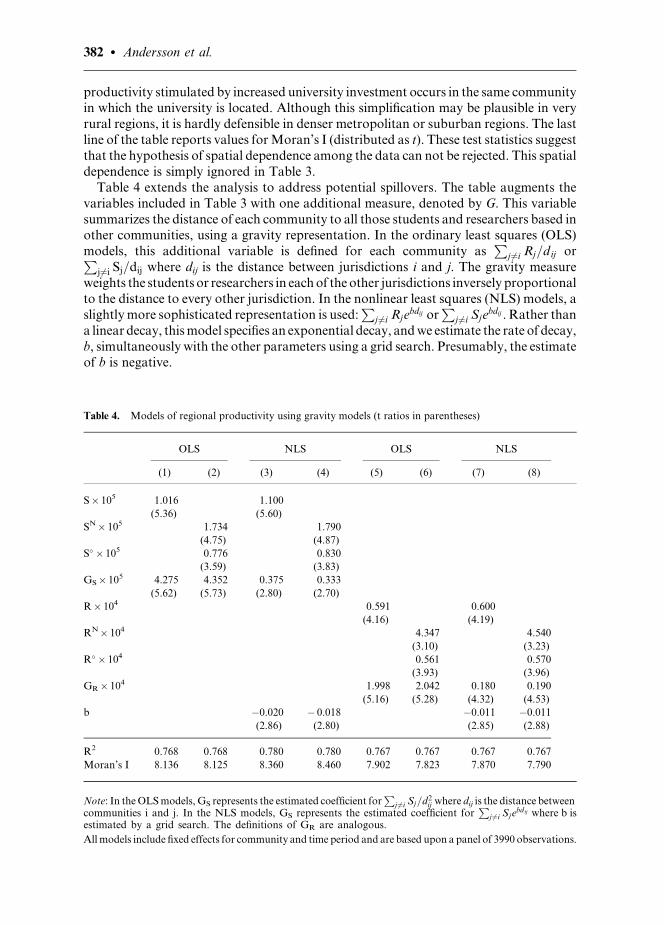
Table 4 extends the analysis to address potential spillovers. The table augments the
variables included in Table 3 with one additional measure, denoted by G. This variable
summarizes the distance of each community to all those students and researchers based inother communities, using a gravity representation. In the ordinary least squares (OLS)
models, this additional variable is defined for each community asP
j 6¼i Rj=dij orPj6¼i Sj=dij where dij is the distance between jurisdictions i and j. The gravity measure
weights the students or researchers in each of the other jurisdictions inversely proportional
to the distance to every other jurisdiction. In the nonlinear least squares (NLS) models, a
slightly more sophisticated representation is used:P
j 6¼i Rjebdij or
Pj 6¼i Sje
bdij . Rather than
a linear decay, this model specifies an exponential decay, and we estimate the rate of decay,
b, simultaneously with the other parameters using a grid search. Presumably, the estimateof b is negative.
Table 4. Models of regional productivity using gravity models (t ratios in parentheses)
OLS NLS OLS NLS
(1) (2) (3) (4) (5) (6) (7) (8)
S� 105 1.016
(5.36)
1.100
(5.60)
SN� 105 1.734
(4.75)
1.790
(4.87)
S� � 105 0.776
(3.59)
0.830
(3.83)
GS� 105 4.275
(5.62)
4.352
(5.73)
0.375
(2.80)
0.333
(2.70)
R� 104 0.591
(4.16)
0.600
(4.19)
RN� 104 4.347
(3.10)
4.540
(3.23)
R� � 104 0.561
(3.93)
0.570
(3.96)
GR� 104 1.998
(5.16)
2.042
(5.28)
0.180
(4.32)
0.190
(4.53)
b �0.020
(2.86)
� 0.018
(2.80)
�0.011
(2.85)
�0.011
(2.88)
R2 0.768 0.768 0.780 0.780 0.767 0.767 0.767 0.767
Moran’s I 8.136 8.125 8.360 8.460 7.902 7.823 7.870 7.790
Note: In the OLS models, GS represents the estimated coefficient forP
j 6¼i Sj=d2ij where dij is the distance between
communities i and j. In the NLS models, GS represents the estimated coefficient forP
j 6¼i Sjebdij where b is
estimated by a grid search. The definitions of GR are analogous.
All models include fixed effects for community and time period and are based upon a panel of 3990 observations.
382 � Andersson et al.

The coefficients of the variables measuring students and university-based researchersare very similar in magnitude and statistical significance to those reported in Table 3. If
anything, the estimated magnitudes are slightly larger, but they are generally within the
sampling errors reported in Table 3. The pattern of the coefficients is identical. The
number of students at the ‘new’ universities has about twice the impact on
productivity as does the number of students at the ‘old’ universities; the number of
university-based researchers at ‘new’ institutions again has about eight times the effect
on productivity as does the number at ‘old’ established institutions.
The magnitude and statistical significance of the gravity measures provides strongevidence that there are positive spillovers among jurisdictions, but there is little to
choose between in the specifications. The simple linear model seems to be almost as
accurate as the more sophisticated exponential model, but it implies a somewhat less
pronounced decay with distance. Importantly, however, the values of the Moran’s I
statistic are still quite large, suggesting that neither model captures the underlying
spatial relationship very well.
As an alternative, we consider a general spatial lag model to incorporate the spatial
structure into the analysis.6 In its most general form,
log Yit=Eitð Þ ¼ rX
j 6¼i
W 1ij log Yjt=Ejt
� �þ aUit þ � � � þ eit;
eit ¼ lX
j 6¼i
W2ijeit þ mit:
ð2Þ
In this formulation, the productivity of labor in any town also depends upon the
productivity of labor in neighboring towns. The spatial lag formulation indicates that
productivity depends upon the productivity observed in other municipalities, where W 1ij
are the weights. The parameterl is the coefficient in the spatial autoregressive structure forthe distance and W 2
ij are the weights for the errors in other towns. If there are no a priori
reasons to suppose that the spatial interaction patterns are different, then W1ij ¼ W 2
ij . In
this instance, r and l are not separately identified.
In this spatial application, we assume W1ij ¼ W 2
ij ¼ 1=d2ij that is, we assume that the
weight matrix is of the form of the gravity model. If r defines the autoregressive spatial
structure in equation (2), we can estimate the Spatial Autoregressive Model (SAR):
log Yit=Eitð Þ ¼ rX
j 6¼i
½1=d2ij �log Yjt=Ejt
� �þ aUit þ � � � þ eit ð3Þ
Alternatively, if l defines the autoregressive spatial structure, we can estimate the Spatial
Error Model (SEM):
log Yit=Eitð Þ ¼ aUit þ � � � þ eit;
eit ¼ lX
j 6¼i
ejt=d2ij þ mit:
6 Anselin (1988) is the standard reference documenting these spatial models.
University decentralization � 383

Table 5 reports the coefficients of the SAR and SEM models, estimated by maximumlikelihood methods, assuming normality of the errors e and m. As reported in the table,
when spatial autocorrelation is recognized in the models, the coefficients of the other
variables are reduced in magnitude and statistical significance. But the basic pattern of
coefficients is unchanged. The alternate models of spatial autocorrelation yield quite
similar results. Either measure of spatial dependence, r or l, is highly significant, and
the statistical insignificance of the LM statistic (distributed as x2) confirms that the SAR
model controls adequately for the spatial autocorrelation in the data.
In models relating productivity to university scale as measured by the number ofstudents, the coefficient on the number of students in the same community is only
Table 5. Spatial autoregressive models of regional productivity (asymptotic t ratios in parentheses)
SAR SEM SAR SEM
(1) (2) (3) (4) (5) (6) (7) (8)
S� 105 0.084
(1.42)
0.098
(1.66)
SN� 105 0.045
(0.18)
0.018
(0.07)
S� � 105 0.085
(1.41)
0.103
(1.69)
GS� 105 0.644
(3.49)
0.641
(3.47)
0.668
(3.29)
0.669
(3.29)
R� 104 0.102
(1.51)
0.124
(1.81)
RN� 104 3.069
(2.16)
3.043
(2.15)
R� � 104 0.098
(1.44)
0.119
(1.75)
GR� 104 0.928
(4.34)
0.944
(4.41)
0.971
(4.09)
0.984
(4.14)
l 0.199
(29.41)
0.197
(28.81)
0.181
(25.97)
0.182
(25.96)
r 0.205
(110.07)
0.207
(110.66)
0.193
(108.43)
0.196
(109.80)
LM test 0.235 0.256 0.279 0.238
Note: Spatial autoregressive models (SAR) are of the form:
log Yit=Eitð Þ¼ rX
j 6¼i
½1=d2ij �log Yjt=Ejt
� �þaUit þ�� �þ eit
Spatial error models (SEM), are of the form:
logðYit=EitÞ ¼ aUit þ � � � þ eit
eit ¼ lX
j 6¼i
ejt=d2ij þ mit
GS and GR represent the estimated coefficients forP
j 6¼i Sj=d2ij and
Pj 6¼i Rj=d2
ij respectively.
All models are estimated by maximum likelihood assuming normality of the error terms.
The Lagrange Multiplier (LM) statistic is distributed as x2 with one degree of freedom.
384 � Andersson et al.

significant at the 0.20 level. However, the gravity measure of distance to universitystudents remains highly significant in all cases.
As before, the results are somewhat stronger for the models that rely upon university-
based researchers. In all cases, the coefficients indicate that productivity is higher in
communities in which more university-based researchers are employed. These results
are significant at the 0.15 level. We also find clear evidence that this effect is
substantially larger for those researchers employed at the newer institutions than for
those employed at the older institutions. Finally, we find that productivity is greater in
communities in closer proximity to pools of university-based researchers.
5. Conclusion
During the past 15 years, Swedish higher education policy encouraged the
decentralization of post secondary education. We investigate the spatial and economic
effects of this decentralization on productivity and output. We rely upon a 14-year panel
of output and employment for Sweden’s 285 municipalities, together with data on the
location of university researchers and students, to estimate the effects of exogenous
changes in educational policy upon regional development.We provide several tests of the hypothesis that the establishment or expansion of
university research in a region enhances regional productivity. We find systematic
evidence that the average productivity of labor is higher in regions that have received
larger university-based investments as measured by the number of researchers employed
on staff or the number of students enrolled. We also find that productivity gains are larger
in regions in which the ‘new’ colleges and universities are located. Finally, we find the
effects of university-based researchers are considerably larger than the effects of the size of
the student body. Both influences are larger for newly established institutions than for theolder universities.
These results are based upon data on output and employment for each of Sweden’s
municipalities over an extended period, as well as data on the course of higher educational
policy by municipality over the same period. Our analysis permits us to incorporate fixed
effects for municipalities and time, thereby improving the precision of estimates. By
framing the analysis at the municipal level, we focus on very local effects of university
expansion on productivity.
We analyse spillovers among jurisdictions, emphasized in the modern theoreticalliterature on agglomeration, using a variety of techniques. We summarize the spatial
distribution of university students and workers using gravity models in two formulations.
We also investigate several explicit models of spatial autocorrelation.
The results are broadly consistent across theoretical models and statistical results.
There is strong evidence that an expansion of university presence in a municipality,
measured by the size of the student body or the number of university-based
researchers, is associated with increases in the average productivity of labor in that
community.The scale of the university as measured by the number of researchers is consistently
more important in increasing productivity than the scale as measured by the number of
students. This may arise for several reasons. New researchers are more-or-less bound to
the local area by their worksites; new graduates are not. It takes three to five years before a
student matriculates and enters the workforce, and many matriculate without technical
expertise. Researchers are productive in technical jobs as soon as they are recruited.
University decentralization � 385

The importance of the university in affecting productivity is consistently larger for the
new institutions. This could arise if the new institutions are more like vocational and
technical institutions than like more traditional regional colleges. Of course, some of the
new institutions are, in fact, upgrades of former technical colleges. So this may explainsome of the differences.
But the productivity boost, from whatever source, also extends to communities located
near these university facilities. The statistical results denoting productivity gains and
spillovers are highly significant and are robust to alternative statistical methods and
specifications. These externalities are highly localized, however. Table 6 summarizes
the localization of these externalities as measured by the coefficients of the models
reported in Table 5. The coefficients are used to estimate the effect of an increase in
students or university-based researchers on productivity in the community containing theinstitution and on productivity at various distances from its border. The table presents
the fraction of the net productivity gain which is achieved at various distances from the
municipality. It is clear that external benefits are highly concentrated geographically.
More than half of the total productivity gain from university expansion is reported to
occur within 20 kilometers of the municipality containing the institution of higher
education; about 75% occurs within 100 kilometers of the border.
It is also possible, at least in principle, to estimate the net change in output arising from
the spatial rearrangement of students and researchers. Using the results presented inTable 5, for example, worker productivity in each municipality can be computed
under the counterfactual of no decentralization of Swedish universities. To do this, we
reallocate the researchers employed in the 25 newly established institutions in 1998, as well
as the students attending them, back to the 11 institutions which had been in existence in
1987. We reallocate researchers and students to the pre-existing institutions in proportion
to their distribution in 1987. Data on the number of workers in each municipality allows us
to estimate total output in the economy. A comparison of this counterfactual with realized
output yields the net change in GDP arising from the decentralization of higher education.Using the coefficients in equations (6) and (8) in Table 5 (which we prefer on statistical
grounds), we estimate the net effect of this spatial rearrangement to be an increase in GDP
Table 6. Cumulative productivity gains at various distances from university (As a percentage of total gains)
Students University-based researchers
DistanceOld New Old New
(km) SAR SEM SAR SEM SAR SEM SAR SEM
1 15.34 15.58 14.62 14.11 15.01 15.20 40.47 39.56
2 22.11 22.33 21.44 20.98 21.80 21.98 45.23 44.39
5 32.71 32.91 32.14 31.74 32.45 32.61 52.69 51.97
8 38.60 38.77 38.07 37.71 38.36 38.50 56.83 56.17
10 41.46 41.63 40.96 40.61 41.23 41.36 58.84 58.21
15 46.73 46.88 46.27 45.95 46.52 46.64 62.54 61.97
20 50.51 50.66 50.09 49.79 50.32 50.43 65.21 64.67
100 72.04 72.12 71.80 71.63 71.93 71.99 80.34 80.04
Note: Distance is measured in kilometers from the center of the municipality containing the university.
Source: Estimates are based on the coefficients reported in Table 5 in columns 2, 4, 6, and 8 respectively.
386 � Andersson et al.
of between 0.113% (equation (6)) and 0.066% (equation (8)).7 If this gain in output wereattributable entirely to the decentralization of university researchers, these results suggest
that the increment of GDP is roughly the same order as the initial contribution to the GDP
of these workers.8
This finding is consistent with a growing body of empirical research in other countries
on the agglomerative tendencies of so-called ‘knowledge industries.’ Saxenian (1994), for
example, suggested that knowledge generated at a firm is more likely to spill out locally if it
originates in a small firm. Rosenthal and Strange (2003) found that small establishments
in the knowledge industry have larger effects on locational attractiveness than larger ones.In a recent paper using micro data from Dunn and Bradstreet, Rosenthal and Strange
(2001) found that proxies for knowledge spillovers in the US affect firm agglomeration
only at the very local (postal code) level. Adams (2002) compared the localization of
academic and industrial spillovers in the US, concluding that spillovers from academic
institutions are quite localized. Our Swedish data also suggest significant, but highly
localized, productivity effects arising from the geographical locations chosen for these
institutions.
Our findings are consistent with a substantial effect of investment in highereducation upon the productivity of local areas and the local economies in which they
are situated.
References
Adams, J. D. (2002) Comparative localization of academic and industrial spillovers. Journal ofEconomic Geography, 2(3): 253–278.
Andersson, R. (2001) Swedish regional policy. Uddevalla Symposium 2000, Research Report 01:1.Papers presented at the Uddevalla Symposium 2000, 15–17 June, Trollh€aattan, Sweden.
Andersson, R. (2000) Sverker Sorlin och Gunnar Tornqvist: Kunskap for v€aalstand. Universitetenoch omvandlingen av Sverige. Ekonomisk Debatt, No 5.
Anselin, L. (1988) Spatial Econometrics: Methods and Models. Dordecht: Kluwer AcademicPublishers.
Anselin, L., Varga, A., Acs, Z. (1997) Local geographic spillovers between university research andhigh technology innovations. Journal of Urban Economics, 42: 422–448.
Audretsch, D., Feldman, M. (1996) R&D spillovers and the geography of innovation andproduction. American Economic Review, 86: 641–652.
De forsta 20 aren. Utvecklingen vid de mindre och medelstora hogskolorna sedan 1977 (1998),Stockholm: Hogskoleverket (National Agency for Higher Education).
Feldman, M. (1994) The Geography of Innovation, Boston, MA: Kluwer Academic Publishers.Florax, R. (1992) The University: A Regional Booster? Aldershot, Avebury.Griliches, Z. (1979) Issues in assessing the contribution of R&D to productivity growth. Bell Journal
of Economics, Spring, 10: 92–116.Griliches, Z. (1998) R&D and Productivity, Chicago, IL: The University of Chicago Press.Grossman, G. M., Helpman, E. (1991) Innovation and Growth in the Global Economy. Cambridge,
MA: The MIT Press.
7 Note that we have no statistical confidence in the magnitudes of these estimates. The counterfactual effectscalculated from the results in Table 5 are well within the standard error of the estimate for any of the regressionresults reported.
8 The annual direct and indirect cost of a university-based researcher is roughly 600 thousand to 1 M SEK, or upto 2 B SEK for 2000 researchers. The total gain from decentralization is estimated (from Table 5, equations (6)and (8)) to be 1 B SEK to 4 B SEK. But these magnitudes, too, should be taken with a grain of salt.
University decentralization � 387

Henrekson, M. (2002) Strategier for en framgangsrikare kommersialiseringav svenskuniversitetsforskning.’ Ekonomisk Debatt, 30(2): 159–170.
Jaffe, A. (1986) Technological opportunity and spillovers of R&D: evidence from firms patents,profits and market value. American Economic Review, 76: 984–1001.
Jaffe, A. (1989) Real effects on academic research. American Economic Review, 79: 957–970.Jaffe, A., Trajtenberg, M., Henderson, R. (1993) Geographic localization of knowledge spillovers as
evidenced by patent citations. Quarterly Journal of Economics, 434: 578–598.Krugman, P. (1991) Increasing returns and economic geography. Journal of Political Economy, 99:
483–499.Lucas, R. (1988) On the mechanics of economic development. Journal of Monetary Economics, July,
22(1): 3–42.Lundquist, K.-J. (2001) Universities and firms. Uddevalla Symposium 2000, Research Reports 01:2,
Papers presented at the Uddevalla Symposium 2000, 15–17 June, Trollh€aattan, Sweden.Marshall, A. (1890/1920) Principles of Economics, Macmillan Press Ltd, London.Rauch, J. E. (1993) Productivity gains from geographic concentration of human capital: Evidence
from the Cities. Journal of Urban Economics, 34(3): 380–400.Regeringens Proposition (The [Swedish] Government’s Proposition) (1997/98:62) Regional tillv€aaxt –
for arbete och v€aalf€aard.Romer, P. (1986) Increasing returns and long-run growth. Journal of Political Economy, 94(5):
1002–1037.Romer, P. (1990) Endogenous technological change. Journal of Political Economy, 98: 71–102.Rosenthal, S. S., Strange, W. C. (2001) The determinants of agglomeration. Journal of Urban
Economics, 50: 191–229.Rosenthal, S. S., Strange, W. C. (2003) Geography, industrial organization, and agglomeration.
Review of Economics and Statistics, 85(2): 377–393.Saxenian, A. (1994) Regional Advantage: Culture and Competition in Silicon Valley and Route 128,
Cambridge, MA: Harvard University Press.Sorlin, S., Tornquist, G. (2000) Kunskap for v€aalstand. Universiteten och omvandlingen av Sverige,
Stockholm: SNS Forlag.Varga, A. (1998) University Research and Regional Innovation. Boston, MA: Kluwer Academic
Publishers.Wibe, S. (2000) Ovetenskapligt om forskningens lokalisering. Ekonomisk Debatt, No 7.
388 � Andersson et al.