Universities of Leeds, Sheffield and York...
49
promoting access to White Rose research papers White Rose Research Online [email protected] Universities of Leeds, Sheffield and York http://eprints.whiterose.ac.uk/ This is an author produced version of a paper published in Agricultural Systems White Rose Research Online URL for this paper: http://eprints.whiterose.ac.uk/id/eprint/77536 Paper: Kay, P, Edwards, AC and Foulger, M (2009) A review of the efficacy of contemporary agricultural stewardship measures for ameliorating water pollution problems of key concern to the UK water industry. Agricultural Systems, 99 (2-3). 67 - 75 (9). ISSN 0308-521X http://dx.doi.org/10.1016/j.agsy.2008.10.006
Transcript of Universities of Leeds, Sheffield and York...
promoting access to White Rose research papers
White Rose Research [email protected]
Universities of Leeds, Sheffield and Yorkhttp://eprints.whiterose.ac.uk/
This is an author produced version of a paper published in AgriculturalSystems
White Rose Research Online URL for this paper:
http://eprints.whiterose.ac.uk/id/eprint/77536
Paper:
Kay, P, Edwards, AC and Foulger, M (2009) A review of the efficacy ofcontemporary agricultural stewardship measures for ameliorating water pollutionproblems of key concern to the UK water industry. Agricultural Systems, 99 (2-3).67 - 75 (9). ISSN 0308-521X
http://dx.doi.org/10.1016/j.agsy.2008.10.006

1
A review of the efficacy of contemporary agricultural1
stewardship measures for ameliorating water pollution2
problems of key concern to the UK water industry3
4
Paul Kay1*, Anthony C. Edwards2 and Miles Foulger35
6
1School of Geography, University of Leeds, LS2 9JT, UK7
2Centre for Research into Environment and Health (CREH), Institute of8
Geological and Earth Science, University of Wales, Llandinian Building,9
Aberystwyth, Ceredigion, SY23 2DB, UK10
3Yorkshire Water Services Ltd, Western House, Western Way, Bradford, BD611
2LZ, UK12
13
*Corresponding author: email [email protected], tel. +44 (0) 113 3433328,14
fax +44 (0) 113 343330815
16
2
Abstract17
The UK water industry faces a number of water quality issues which mean that18
capital must be spent on treating raw water in order to meet regulatory standards.19
Moreover, other policies exist that require improved water quality (e.g. the Water20
Framework Directive) and contemporary regulation is encouraging water companies21
to deal with the problem at source, rather than relying exclusively on ‘end-of-pipe’22
treatment solutions. Given that much of this pollution results from agricultural23
practices, agricultural stewardship measures could offer a means of source control.24
Although numerous schemes are available that encourage farmers to adopt25
environmentally friendly farming practices, uncertainty exists as to the specific26
impacts of these measures on water quality. The current study has, therefore,27
reviewed the scientific literature to establish those agricultural stewardship measures28
that have been proven to impact water quality for three pollutant groups of key29
concern to the UK water industry, namely dissolved organic carbon, nutrients and30
pesticides. It has been found that, whilst for many measures there is little or no31
evidence for impacts on water quality, a range of stewardship practices are available32
that have been proven to improve water quality. Their effectiveness is subject to a33
number of factors though (e.g. soil type and pollutant chemistry) and so they should34
be implemented on a case-by-case basis. Further research is needed to ascertain35
more fully how contemporary agricultural stewardship measures really do impact36
water quality.37
38
Keywords: Agriculture; stewardship; water quality; dissolved organic carbon;39
nutrients; pesticides.40
41
42
43
44

3
1. Introduction45
Water may become polluted with a range of contaminants due to the use of land for46
agriculture (e.g. Hooda et al., 2000; Lovell and Sullivan, 2006). Of these pollutants,47
dissolved organic carbon (DOC) (Freeman et al., 2001; Holden, 2005; Wallage et al.,48
2006), nutrients (nitrogen (N) and phosphorus (P)) (Heathwaite et al., 1996; Haygarth49
and Jarvis, 2002; Dorioz et al., 2006) and pesticides (Environment Agency, 1999;50
Blanchoud et al., 2007; Garrod et al., 2007) represent the most significant issues for51
some land-owning UK water utilities due to the need to remove them from raw waters52
to meet regulatory standards. Whilst nutrients (Brett and Benjamin, 2008) and53
pesticides (Brack et al., 2007) also represent a direct ecological risk, DOC is54
problematic due to the formation of carcinogenic trihalomethane compounds during55
the chlorination process (Nieuwenhuijsen et al., 2008). Although a range of potential56
pollutant sources exist in addition to agriculture, including rural sewage treatment57
works, septic tanks (Ahmed et al., 2005; Gaddis et al., 2007) and amenity usage of58
pesticides (Knapp, 2005; Lapworth and Gooddy, 2006), agriculture is regarded as the59
key reason for their presence in UK waters (Defra, 2004).60
61
The costs of treating these pollutants to meet drinking water standards is highly62
significant to water companies and ultimately paid for by the consumer. Pretty et al.63
(2000) estimated the costs of treating pesticides, nitrate, phosphorus (and sediment),64
and organic carbon (and sediment) in water for drinking in the UK to be £120 M, £1665
M, £55 M and £106 M respectively. Monitoring and advice on pesticides and66
nutrients is estimated to cost a further £11 M per annum. In addition to drinking water67
standards, environmental standards are also imposed by the Water Framework68
Directive (WFD) (EC, 2000), which specifies that all waterbodies must be of good69
chemical and ecological status (or potential) by 2015 and that the costs of any clean-70
up should be charged to the polluter. Whilst the ecological impacts of chemicals in71
water (Ashauer et al., 2007; Brack et al., 2007; Gilliom, 2007) are known to result in72

4
additional economic losses, these cannot be calculated at present due to a lack of73
information (Pretty et al., 2000).74
75
Agricultural pollutants can be treated to meet drinking water standards using76
engineered solutions, although as the costs can be significant, in both economic and77
environmental terms, control of these pollutants at source is desirable and a range of78
management techniques are available that aim to achieve this. These include79
measures that seek to reduce inputs of pollutants to catchment systems (e.g.80
reduced usage of chemicals), those that reduce the transport of pollutants from81
agricultural land (e.g. improved soil management) and others that aim to capture and82
degrade pollutants that have been transported towards waterbodies (e.g. buffer83
zones and wetlands). For a number of years, agri-environment schemes have been84
available to land managers in order that these measures can, theoretically, be85
implemented without compromising the financial viability of farm businesses.86
Recently (since 2005), agricultural stewardship has been pursued with renewed87
vigour due to the importance of controlling agricultural pollution and a number of88
highly significant policy developments have taken place, particularly Common89
Agricultural Policy (CAP) reform (Defra, 2005a) and the development of new90
agricultural stewardship schemes; Entry Level Stewardship (ELS) (Defra, 2005b) and91
Higher Level Stewardship (HLS) (Defra 2005c). These new policies that aim to92
control agricultural pollution offer opportunities for water companies to encourage93
implementation of measures on the ground that could reduce water pollution and,94
thus, result in capital and operational expenditure savings. At present, however,95
understanding of the impacts of these land management measures on water quality96
is uncertain. Whilst some recent work has been undertaken (Parry et al., 2006; Cuttle97
et al., 2007) this has not covered DOC and has only discussed pesticide pollution to98
a limited extent. Moreover, empirical evidence has not been thoroughly reviewed and99
modelling has been relied upon to determine some likely impacts on water quality. If100
5
water companies are to build these land management measures into their business101
plans then a sound knowledge of their impacts is urgently needed. The current102
review summarises peer-reviewed literature in order to develop a state-of-the-art103
understanding of the effects of contemporary agricultural stewardship measures on104
water pollution by DOC, nutrients and pesticides. This information could be used in105
the business planning of water companies and by other interested parties, such as106
Government and its agencies, as well as to guide future research in this area.107
108
2. Dissolved organic carbon/water colour109
Only catchments dominated by organic soils will generate DOC levels significant to110
the water industry (Holden et al., 2007a) and so it is only stewardship measures for111
moorlands that offer water companies an option for reducing DOC. Limited moorland112
options actually exist in current stewardship schemes and even less data are113
available to indicate their efficacy for improving water quality.114
115
Some work has shown grip blocking to significantly (by up to 70 %) reduce DOC116
concentrations in some cases (Wallage et al., 2006; Armstrong et al., 2008) (Table117
1). This could therefore offer water companies that take raw water from the uplands a118
means of controlling this significant problem. Many moorland areas in the UK have119
been drained (gripped), particularly during the 1960’s and 70’s, to increase120
agricultural productivity (Robinson and Armstrong, 1988). Damming these drains121
raises the water table, slows peat degradation and reduces the transport of DOC122
(and therefore water colour) off-site (Holden et al., 2007a; Worrall et al., 2007).123
Effects on the composition of the DOC are uncertain with Wallage et al. (2006)124
reporting more colour per unit carbon, indicating an increase in humic substances,125
but Armstrong et al. (2008) showing more easily treated colour. Grip blocking may126
not always result in decreased DOC/colour contamination however. In some cases127
DOC may increase after blocking (Worrall et al., 2007) and in others the peat may128
6
not necessarily recover its original physical and chemical properties (Freeman et al.,129
2001; Holden et al., 2006; Wallage et al, 2006; Holden et al., 2007b).130
131
Further research is needed if water companies are to be able to pursue other132
catchment management measures available in stewardship schemes with the133
expectation of reducing DOC contamination of streams. Holden et al. (2007a)134
comment that virtually nothing is known about the impacts of moorland burning on135
water quality and soil hydrology, although a number of papers have eluded to the fact136
that increased burning will lead to higher levels of water colour (Mitchell and137
McDonald, 1995; Garnett et al., 2000). A study at Moorhouse in the northern138
Pennines showed that severe burning reduced the water holding capacity of the soil139
and created a more flashy hydrograph (Robinson, 1985), factors that could increase140
the generation and delivery of DOC to surface waters. Burning also leads to141
increases in the amount of heather that is present and this has subsequently been142
shown to increase the density of soil pipes, which move runoff from soils to streams,143
lower the water table and increase the generation and flux of colour to surface waters144
(Holden, 2005). Data describing the impacts of livestock grazing on water colour are145
almost entirely lacking from the literature, although one study found there to be no146
significant difference between soil water colour in grazed and ungrazed plots (Worrall147
et al., 2007).148
149
3. Nutrients150
In comparison to DOC/water colour, water companies may select from a much wider151
range of agricultural stewardship options which may reduce pollution of waterbodies152
by nutrients. A number of these would require that utilities work with farmers to153
reduce inputs of fertilisers into catchment systems. Limiting nitrogen additions to crop154
requirements (Lord and Mitchell, 1998; Coelho et al., 2006, 2007) or quantities155
specified in Nitrate Vulnerable Zone (NVZ) regulations (Vertés et al., 1997; Lord et156

7
al., 1999; Hanegraaf and den Boer, 2003) have been found to reduce water pollution157
substantially (Table 1). Nitrate losses have been reduced to 10 kg ha-1 (Goulding et158
al., 2000) and leaching to groundwater (1 m depth) by 57 % using this mechanism159
(Lord and Mitchell, 1998). Whilst impacts on nitrogen compounds have been160
desirable, phosphorus concentrations in runoff will be affected to a much lesser161
extent due to their build-up in soils however (Stålnacke et al., 2003, 2004). It has,162
therefore, been suggested that 10 years would be needed to see a reduction in163
dissolved phosphorus whilst a number of decades would be required in order to164
observe a decline in particulate-associated phosphorus concentrations reaching165
waters (Withers et al., 2001; Haygarth et al., 2002). In some case, reductions in166
nutrient losses to water have been negligible, however, due to soil type, crop and167
prevailing hydrological conditions (Dukes and Evans, 2006; Harmel et al., 2006; de168
Ruijter et al., 2007), leading some workers (Macgregor and Warren, 2006; Schröder169
et al., 2007) to be sceptical of the benefits of these measures as many farmers claim170
already to be applying nitrogen below specified limits and yet water pollution is still171
occurring.172
173
Other measures aim to reduce nutrient concentrations in water not by reducing inputs174
to catchments but by changing the way in which they are applied. The injection of175
slurry, rather than broadcast spreading, has resulted in reductions of 93, 82 and 94176
% of dissolved reactive P (DRP), total P (TP) and algal-available P (AAP) in runoff177
(Daverede et al., 2004). Moreover, nutrient losses from poultry litter were reduced by178
80-95 % (Pote et al., 2003) whilst incorporation of inorganic fertilizers has been found179
to reduce nutrient losses to the water environment to background levels (Pote et al.,180
2006). Where tile drains are present losses may be greater though (Coelho et al.,181
2007), highlighting that implementation of stewardship measures needs to be carried182
out on a site-specific basis. Other fertiliser-specific measures are available for183
implementation (i.e. not allowing runoff from in-field manure heaps, not applying184

8
organic fertilisers when the soil is saturated and not applying manure within 10 m of a185
surface water and within 50 m of a borehole) although these demonstrate the dearth186
of scientific evidence for the impacts of many measures on water quality.187
188
Some specific soil management measures have also been proven to be effective at189
reducing nutrient pollution. Planting a green cover crop is one of the single most190
effective ways of decreasing the risk of nitrate leaching (Shepherd et al., 1996) and,191
in general, cover crops lead to a 50 % reduction compared to a winter-sown cereal192
(Goss et al., 1988; Shepherd et al., 1993; Lord et al., 1999). Good establishment193
before the start of drainage is key to getting the most from a cover crop and uptake of194
N can actually range between 10-150 kg ha-1 (Fielder and Peel, 1992; Shepherd,195
1999).196
197
Ensuring a rough soil surface by ploughing or discing is another soil management198
measure which can have a useful, but variable, impact on nutrient transport (Angle et199
al., 1993; Rasmussen, 1999; Benham et al., 2007). The transport of soluble P in200
surface runoff may be reduced by a factor of 2-3 compared to an untilled surface201
(Zeimen et al., 2006) although some workers have found that nitrate leaching is202
unaffected (Stoddard et al., 2005) due to site-specific factors (Rasmussen, 1999).203
Farmers may also be able to help water companies by working fields along the204
contour and Withers et al. (2006) found no significant differences in runoff quantity,205
sediment and total P concentrations where tramlines ran across-slope compared to206
areas without tramlines. Schonning et al. (1995) also compared the effects of the207
direction of drilling (winter wheat) on runoff, soil loss and total P for two sandy Danish208
soils. Reductions of 9 %, 13 %, and 12 % (Site 1) and 19 %, 58 %, and 57 % (Site 2)209
were reported for runoff volume, suspended solids and total P losses respectively.210
Even if the direction of traffic is unaltered, conservation tillage techniques can have211
significant impacts on nutrient losses to water. Mean losses in surface runoff were212

9
reduced by 63, 67, 46 and 49 % for total nitrogen, total Kjeldahl nitrogen, ammonia213
and nitrate respectively whilst reductions for total phosphorus and orthophosphate214
were 73 and 17 % (Benham et al., 2007). Winter N losses from drained plots at215
Brimstone Farm averaged 24 % less from land that had been direct drilled instead of216
ploughed (Goss et al., 1988). A comparison of concentrations of sediment and P in217
runoff from the Greensand and Chalk soils showed them to be consistently lower218
when the soil was minimally tilled rather than ploughed (Withers et al., 2007), with the219
benefits of reduced cultivation being attributed to better surface cover and a firmer220
surface for tractor wheelings. Impacts of reduced tillage on soil macroporosity (which221
has significant implications for nutrient transport) have been noted, with Schjonning222
and Rasmussen (2000) demonstrating a smaller volume of macropores in the top 20223
cm of soil compared to a ploughed treatment. Johnson and Smith (1996) also found224
that shallow cultivation, rather than ploughing, decreased N leaching by 44 kg N ha-1225
over a five-year period but that the difference between cultivation types diminished226
over time. Conversely, some research has shown that minimum tillage can actually227
increase nutrient pollution. Carter (1998) reviewed a large number of studies carried228
out on a range of soil types and found that, whilst the technique was effective in229
reducing particulate associated P in 31 % of studies, no effect occurred in 8 % and230
increased P loss actually resulted in 23 % of cases. The same study also showed231
that conservation tillage increased leaching volumes and nitrate loss to groundwater.232
Whilst some work has shown that direct drilling decreases soil macroporosity, other233
studies (Shipitalo et al., 2000; Petersen et al., 2001) reported that the most effective234
way of reducing macroporosity was intensive cultivation (i.e. ploughing) and that235
conservation tillage increases transport through macropores, partially attributable to236
the increased activity of earthworms (Edwards and Lofty, 1982). The build up of237
nutrients as a consequence of surface applications and limited mixing associated238
with reduced cultivation has been reported (Rasmussen, 1999), particularly in239
grassland soils (Haygarth and Jarvis, 1999)240
10
241
A number of livestock management techniques have been proven to reduce nutrient242
pollution. A significant relationship has been reported between grazing intensity and243
N losses to water (Huging et al., 1995) and, under extensively managed pasture, N244
leaching losses were reduced by 69 %. Limiting overgrazing through careful245
management can, therefore, have significant benefits for the water environment.246
More heavily grazed fields usually receive higher levels of fertiliser, however, and it247
can be hard to separate these two factors (Cuttle et al., 2004). It is also possible that248
nutrient losses could still be significant from pasture where overgrazing is not249
occurring but where stocking densities remain high. Similarly, limiting soil poaching250
by grazing of saturated soils and not locating supplementary feeding sites on poorly251
drained areas can significantly improve runoff quality. Using exclusion cages, Kurz et252
al. (2006) demonstrated the effect of cattle on soil physical properties and nutrient253
losses in overland flow. Grazed areas were characterised by 57–83 % lower254
macroporosity, 8–17 % higher bulk density and 27–50 % higher resistance to255
penetration than areas from which the cattle were excluded. Increased256
concentrations of total N, organic P and potassium (K) were measured in surface257
runoff from the grazed areas. Other workers have reported high P losses in land258
drainage that could only be attributed to heavy winter sheep grazing, with259
concentrations in drain waters reaching up to 20 mg P l-1 and nearly a third of the260
total annual P loss occurring during one month immediately after the sheep had been261
grazing the study site (Jordan and Smith, 1985). In another study, the effect of262
different grazing pressures on P export in surface runoff generated after artificial263
rainfall events resulted in 2, 7.6 and 291 mg total P m-2 loss for ungrazed, lightly264
grazed (4 stock ha-1) and heavily grazed land (>15 stock ha-1), respectively265
(Heathwaite and Johnes, 1996).266
267

11
In some instances water companies may be able to encourage farmers to take268
certain actions through the provision of capital grants. Unpublished research by Kay269
et al. in the Ingbirchworth catchment in South Yorkshire (one of Defra’s Associate270
Catchment Senstive Farming pilot projects) has indicated that farmers would be271
much more likely to install fencing to exclude livestock from watercourses if272
supported financially. Parkyn et al. (2003) reported that streams in New Zealand273
within fenced-off areas showed rapid improvements in visual water clarity and274
channel stability, although nutrient and faecal contamination responses were actually275
variable and significant changes in macroinvertebrate populations were not apparent.276
Soluble reactive phosphorus decreased by up to 33 % in some streams but was277
found to increase by up to 20 % in others. Similarly, total N decreased by up to 40 %278
in some fenced-off streams but increased by up to 31 % in others. More positively,279
when a fenced-off area of 335 m length and 10-16 m width was created to stop dairy280
cattle entering a North Carolina stream, total organic nitrogen, Kjeldahl nitrogen and281
total phosphorus were reduced by 33, 78 and 76 % respectively (Line, 2003).282
Further encouragement can be provided, particularly on tenanted land, to provide283
water troughs so that cattle do not have to drink from streams (Sheffield et al., 1997).284
In this study total phosphorus concentrations were reduced by 54 %, whilst total285
nitrogen concentrations fell by 81 %.286
287
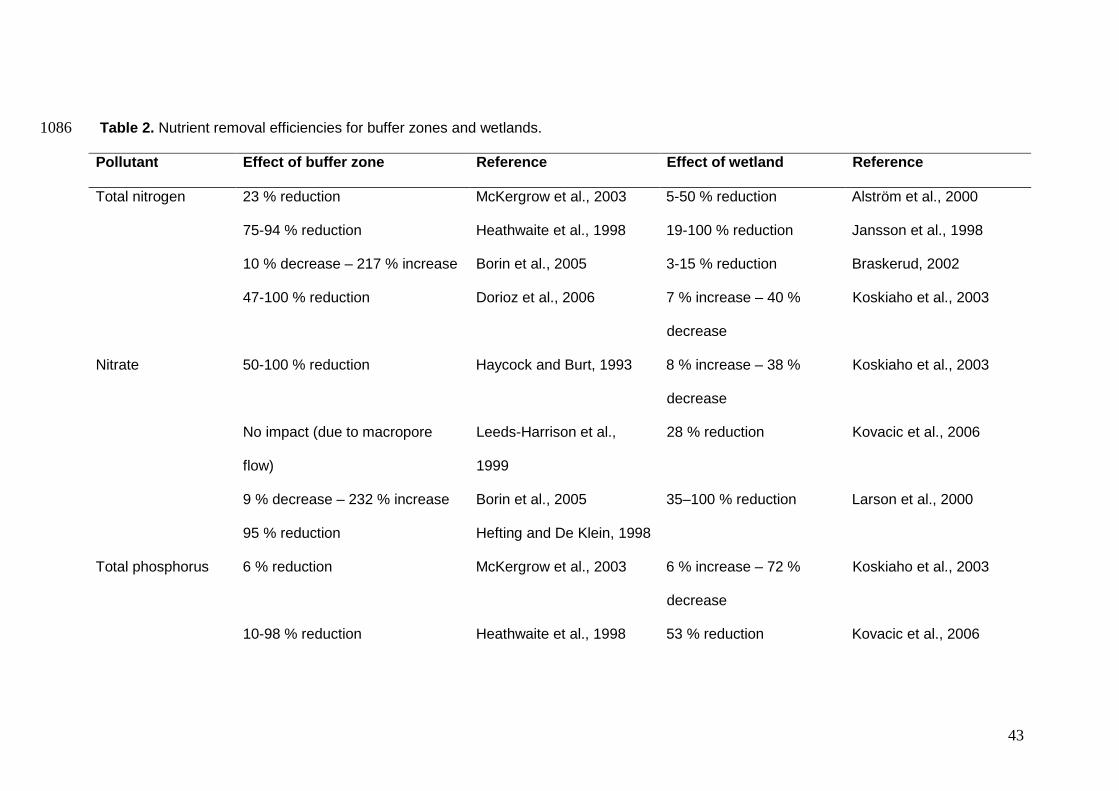
The installation of ‘edge of field’ measures (i.e. buffer zones and wetlands) could288
potentially offer significant water quality gains to water companies. A number of289
management issues need to be considered for buffer zones as Table 2 shows that290
their effectiveness for reducing concentrations of nutrients in surface waters is very291
variable and actual operational efficiency will be highly season and location specific.292
Important factors include soil properties, climate, vegetation cover, physical293
dimensions, sediment characteristics and the presence of underdrainage (Barling294
and Moore, 1994; Tate and Nader, 2000). Unfortunately, the maximum delivery295

12
period of nutrients (i.e. winter) (Uusi-Kämppä et al., 2000) overlaps with the least296
efficient period for many buffer zones due to a combination of high local water tables,297
reduced infiltration capacities and poor plant growth/cover. The highest rates of298
suspended solids deposition (and therefore particulate associated phosphorus) occur299
in the upper part of the buffer strip, and retention rates decline with increasing width300
when expressed as an amount per unit area (i.e. g m-2 y-1). Poor filtering efficiency of301
the finest material may be an issue however (Le Bissonnais et al., 2004; Owens et302
al., 2007), especially because this represents the most reactive and preferentially303
enriched soil fraction (Syversen and Borch, 2005).304
305
Recommended widths range from 3-200 m (Castelle et al., 1994) although 5-15 m is306
most common and Haycock and Burt (1993) reported that the majority of nitrogen307
capture occurred in the first 5-8 m. Long-term management is a key issue - Dorioz et308
al. (2006) state that the retention of phosphorus is unlikely to be sustained and that309
dissolved phosphorus release from the buffer zone will increase. Lovell and Sullivan310
(2006) note a host of more wide-ranging limitations of buffer zones for treating311
nutrients in runoff, including a lack of catchment-scale research, a need for more312
clearly defined and targeted goals, a lack of cooperation between scientific313
disciplines and agencies, an absence of accountability from landowners for314
investment in buffers, as well as limited attention to the aesthetic quality of buffers. It315
is perhaps somewhat surprising that such a recent review is still raising what are316
rather basic issues.317
318
Wetlands have often been shown to be very effective at removing nutrients from319
runoff (Table 2), although operational efficiencies again vary seasonally and with320
time. For example, seasonal removal percentages of nitrate by a wetland were 100,321
35, 55 and 96 % of the autumn, winter, spring and summer loads respectively, with a322
total removal of 55 % (Larson et al., 2000). Generally, the efficiency of wetland323

13
systems is reduced during high flow periods when retention times are shorter324
Koskiaho et al. (2003). Whilst there are other examples which appear to operate well325
(Jansson et al., 1998; Koskiaho et al., 2003), there are also others which do not326
(Wedding, 2000; Braskerud, 2002). The ratio wetland:catchment area is often used327
as an indicator of retention capacity and whilst wetland size is recommended to be 1-328
5 % of the contributing catchment (Kadlec et al., 2000), many ponds and constructed329
wetlands are often <0.3 % (Braskerud, 2002). These authors argue that, unlike buffer330
strips, wetlands are more effective at retaining the finer clay-sized material with the331
mean annual retention of suspended solids being 57-71 %. Despite the fact that332
much information is available on the impacts of some stewardship measures for333
nutrients, none is available for many.334
335
4. Pesticides336
A wide range of measures exists within contemporary agricultural stewardship337
schemes that seek to reduce pesticide pollution by limiting their input into catchment338
systems. Some of these have been proven to have very significant impacts (50-100339
% reduction in concentrations in runoff and surface waters) (Table 1), including not340
spraying when surface runoff is likely to be generated or enter land drains (Barnes341
and Kalita, 2001; CPA and AIC, 2004). Measures to reduce spray drift can also be342
highly effective at reducing pesticide pollution of water bodies and it has been shown343
that drift can be reduced by between 20 and 50 % using core-tipped rather than flat344
nozzles (de Snoo and de Wit, 1998) whilst band spraying may reduce drift by 90 %345
(van der Zande et al., 2001). Windbreaks (e.g. miscanthus) can also reduce drift346
significantly; a wind-break that was 0.5 m above the crop (sugar beet) reduced drift347
by 80 % and when this height was raised to 1 m then drift was further reduced to 90348
%. Moreover, biobeds offer a very effective means of combating pesticide pollution349
by degrading residues in waste and washings by over 98 % in some instances (Fogg350
et al., 2004; Spliid et al., 2006). In contrast, taking measures to reduce reliance on351

14
pesticides would seem to have a negligible effect on water pollution. Of the limited352
evidence that is available (Pacini et al., 2003; Hole et al., 2005) losses from farms353
with reduced inputs appear to be similar to those from conventional farms. Sheep dip354
pollution may be combated by disposing of spent sheep dip to land or farming355
organically. The effectiveness of the first measure will depend on the physico-356
chemical properties of the compounds used and the characteristics of the land357
disposed to (Grant et al., 2002; Cooke et al., 2004; Levot, 2007). Appropriate siting of358
dip disposal areas is, therefore, critical and detections of sheep dips in watercourses359
have previously been attributed to poor citing (Virtue and Clayton, 1997). No studies360
have quantified the impacts of organic sheep farming on pesticide pollution of the361
water environment to date. A further input reduction measure available to water362
companies is reversion of arable land to grassland which has been shown to reduce363
pesticide application to land generally (Herzog et al., 2006).364
365
A range of measures are available that may reduce pesticide transport to366
watercourses through improved soil management and it is well documented that367
higher levels of organic matter encourage sorption of certain pesticides and reduce368
their mobility (Ding et al., 2002; Hernandez-Soriano et al., 2007). Other factors are369
also important though, including the properties of a substance, the clay content of the370
soil, the pH of the soil solution, and the coverage of ion exchange sites (Delle Site,371
2001; Beulke and Brown, 2006). Facilitated transport due to an increase in the DOC372
and colloidal content of soil water may actually lead to the increased mobility of373
pesticides however (Worrall et al., 1995; Li et al., 2005). Organic amendments may374
also alter the pH of the soil solution and, therefore, the degradation rate of pesticide375
residues, the degradation rate of carbofuran being reduced for example (Worrall et376
al., 2001). Whilst previous studies have shown that conservation tillage reduces377
runoff generation and soil erosion, the fate of pesticides is less certain (Uri, 1998;378
Rose and Carter, 2003; Ghidey et al., 2005). Although overall delivery to waterbodies379

15
will be reduced by at least an order of magnitude due to runoff production and380
sediment transport being lower than in conventional production systems, pesticide381
concentrations will be higher in both the aqueous and particulate phases under382
minimum-tillage due to the smaller quantities of runoff in which residues will be383
present. This may not be a significant issue at the catchment scale, however, as384
pesticides will be diluted in streams and if mass losses from land are actually lower385
under minimum-tillage then stream concentrations may be lower (Kenimer et al.,386
1987; Tebrügge and Düring, 1999; Shipitalo and Owens, 2006). The build up of soil387
macropores in no-till systems may be problematic though and increase pesticide388
losses (Smith and Chambers, 1993; Tebrügge and Düring, 1999; Holland, 2004).389
Ensuring the presence of a rough soil surface will limit the mobility of pesticides in the390
environment as a finer soil tilth increases a soil’s water holding capacity and, thus,391
reduces runoff production and pesticide movement (Brown et al., 1999; Hyer et al.,392
2001). Tillage of the soil surface by discing or ploughing will also disrupt macropores393
in the soil and so reduce pesticide transport by encouraging the transfer of solutes394
from macropores to micropores (Jarvis et al., 1994) and reducing the connectivity of395
desiccation cracks with land drains (Kay et al., 2004). Current agricultural396
stewardship schemes are likely to do little to reduce pesticide transport to397
waterbodies via this mechanism, however, as tillage is only encouraged following398
harvest. Whilst this practice may be useful for reducing soil erosion and transport of399
nutrients in the post-harvest period when soils are relatively bare, pesticide400
application will take place at different times prior to this cultivation. It is well known401
that the most significant pesticide transport usually occurs in the first period of runoff402
generation after application, before much time has elapsed for degradation to take403
place and sites available for chemical sorption in the soil may be saturated (Ng and404
Clegg, 1997; Kamra et al., 1999; Zehe and Flühler, 2001). In order to have a405
significant impact on pesticide transport, tillage would have to be carried out406
repeatedly whilst the crop was growing and pesticides were being applied.407
16
408
As for nutrients, buffer zones and wetlands can have a significant impact on the409
environmental fate of pesticides although it is generally accepted that only a limited410
amount of empirical research has been carried out (Harris and Forster, 1997;411
Andreoli and Tellarini, 2000; Kleijn et al., 2001). In the context of many of the412
measures advised under agricultural stewardship schemes, however, a considerable413
body of research is actually available and a number of studies have highlighted the414
importance of buffer strips as a management technique for limiting surface water415
pollution by pesticides (Klöppel et al., 1997; Patty et al., 1997; Dabrowski et al.,416
2002). Specific changes in pesticide mass losses and concentrations due to the417
creation of buffer zones are shown in Tables 3 and 4 respectively. Strongly sorbed418
compounds have been found to require a buffer zone of only several metres to be419
trapped, with greater width having little additional effect. For hydrophilic compounds a420
more linear relationship has been reported, where greater width increases the421
chances of the pesticide being retained and degraded (Krutz et al., 2005). Those422
studies reported in Tables 3 and 4 have generally employed buffer zones of 5-20 m.423
Other work has addressed the issue of buffer zone size by comparing this to424
catchment area and Arora et al. (2003) found that small buffer zones (30:1 ratio425
between drainage area and buffer strip) were just as effective as larger ones (15:1426
ratio). Of key importance to the water industry is the fact that research that has been427
carried out to-date is of limited use in determining the effectiveness of buffer zones428
from improving water quality at the catchment scale (and therefore treatment works).429
Although some studies have investigated the fate of pesticides in wetland systems430
this subject area is not understood as well as for nutrients and sediment (Schulz and431
Peall, 2001). Some studies have shown that wetlands reduce mass losses of432
pesticides by 25-100 % (Table 5). The size of a wetland relative to the catchment433
from which it is receiving runoff is a key issue when considering the use of wetlands434
for treatment of pesticide residues in runoff. Constructed wetlands on farms covering435

17
1 % of the catchment area have reduced pesticide concentrations reaching water436
bodies to non-toxic levels through sorption and degradation in the wetland437
(Braskerud and Haarstad, 2003). Some studies have indicated that pesticides are438
totally degraded in wetland systems rather than simply stored as analyses of439
sediments have proved to be negative (Chapman, 2003). Despite much positive440
data, other studies have found that wetlands do not offer an effective way of stripping441
pesticides from runoff. High concentrations of atrazine, metolachlor and442
chlorpyriphos (2.5, 0.25, and 1 mg l-1 respectively) were not degraded at all in one443
particular study (Mazanti et al., 2003), although at lower concentrations (2, 0.2, and444
0.1 mg l-1) some loss was observed, with detection of degradation products showing445
that breakdown of the compounds was occurring rather than sorption alone. The446
structure of a pesticide is important in determining whether it will be effectively447
removed from water in a wetland system; structures based on nitrogen compounds448
being degraded most effectively (Fogg et al., undated).449
450
5. Conclusion451
The current project has sought to elucidate those agricultural stewardship measures452
that can be implemented in river catchments with reasonable certainty, based on453
scientific findings, that improvements in water quality will result, focussing on454
pollutants of key concern to the UK water industry, namely, dissolved organic carbon,455
nutrients and pesticides. Whilst those measures detailed in Table 1 have been456
proven to improve water quality the success of all of these will be site specific due to457
factors such as soil type, hydrology and pollutant chemistry and so measures should458
be implemented on a case-by-case basis. Moreover, there is a dearth of information459
quantifying the impacts of many stewardship measures on water quality, which is460
perhaps not surprising given that many were developed for terrestrial ecology gain461
rather than from a water quality perspective. It is highly pertinent to note that no462
studies have been undertaken to date that have quantified the impact of agricultural463
18
stewardship measures at the catchment scale, those that have been carried out have464
focussed on the plot and individual field scale, and further research in this area is,465
therefore, urgently needed. It is likely to be important to implement a range of466
measures throughout an entire catchment (dependant upon farming practices in the467
catchment) in order that benefits are not negated by areas where new management468
techniques have not been pursued (Kay et al., 2005). A further pertinent point to be469
considered when implementing stewardship measures in a catchment is that470
farmers/land managers have to be given responsibility for implementing certain471
measures (e.g. controls on N application rates and timing) and it is, therefore,472
essential that they are adequately trained and can be relied upon to carry out the473
task effectively. Moreover, research that quantifies the impacts of agricultural474
stewardship on farm incomes is largely lacking and is urgently needed if farmers/land475
managers are to be convinced that environmental stewardship represents business476
sense. Overall, despite significant attention from many stakeholders, there is a477
striking lack of scientific evidence to underpin the use of agri-environment measures478
for water quality management. This may limit their usage by businesses, such as the479
water industry, which are required to make steadfast decisions based on sound480
economics.481
482
Acknowledgements483
The work reported in this paper was funded by Yorkshire Water Services Ltd under484
the company’s Strategic Research Partnership.485
486
19
References487
Ahmed, W., Neller, R., Katouli, M., 2005. Evidence of septic system failure488
determined by a bacterial biochemical fingerprinting method. Journal of Applied489
Microbiology, 98(4), 910-920.490
491
Alström, T., Holmström, K., Krook, J., Reuterskiöld, D., Torle, C., Tranvik, L.492
Wedding, B., 2000. Wetlands in agricultural areas: complementary measures to493
reduce nutrient transport to inland and coastal waters. Final Report to EU/Life,494
Project LIFE96ENV/S/346, Ekologgruppen I Landskrona AB, Landskrona, Sweden.495
496
Andreoli, M., Tellarini, V., 2000. Farm sustainability evaluation: methodology and497
practice. Agriculture, Ecosystems and Environment, 77(1-2), 43-52.498
499
Angle, J.S., Gross, C.M., Hill, R.L., McIntosh, M.S., 1993. Soil nitrate concentrations500
under corn as affected by tillage, manure, and fertilizer applications. Journal of501
Environmental Quality, 22(1), 141-147.502
503
Armstrong, A., Holden, J., Kay, P., Chapman, P., Clements, S., Foulger, M.,504
McDonald, A., Walker, A., 2008. Grip blocking in upland catchments; costs and505
benefits. Yorkshire Water Strategic Research Partnership final report.506
507
Arora, K., Mickelson, S.K., Baker, J.L., 2003. Effectiveness of vegetated buffer strips508
in reducing pesticide transport in simulated runoff. Transactions of the ASAE, 46(3),509
635-644.510
511
Ashauer, R., Boxall, A.B.A., Brown, C.D., 2007. New ecotoxicological model to512
simulate survival of aquatic invertebrates after exposure to fluctuating and sequential513
pulses of pesticides. Environmental Science and Technology, 41(4), 1480-1486.514

20
515
Barling, R.D., Moore, I.D., 1994. Role of buffer strips in management of waterway516
pollution - a review. Environmental Management, 18, 543-558.517
518
Barnes, P.L., Kalita, P.K., 2001. Watershed monitoring to address contamination519
source issues and remediation of the contaminant impairments, Water Science and520
Technology, 44(7), 51-56.521
522
Benham, B.L., Vaughan, D.H., Laird, M.K., Blake, B.R., Peek, D.R., 2007. Surface523
water quality impacts of conservation tillage practices on burley tobacco production524
systems in southwest Virginia. Water, Air and Soil Pollution, 179(1-4), 159-166.525
526
Benoit, P., Barriuso, E., Vidon, P. and Real, B., 2000. Isoproturon movement and527
dissipation in undisturbed soil cores from a grassed buffer strip. Agronomie, 20(3),528
297-307.529
530
Beulke, S., Brown, C.D., 2006. Impact of correlation between pesticide parameters531
on estimates of environmental exposure. Pest Management Science, 62(7), 603-609.532
533
Blanchoud, H., Moreau-Guigon, E., Farrugia, F., Chevreuil, M., Mouchel, J. M., 2007.534
Contribution by urban and agricultural pesticide uses to water contamination at the535
scale of the Marne watershed. Science of the Total Environment, 375(1-3), 168-179.536
537
Brack, W., Klamer, H.J.C., de Ada, M.L., Barcelo, D., 2007. Effect-directed analysis538
of key toxicants in European river basins - A review. Environmental Science and539
Pollution Research, 14(1), 30-38.540
541
21
Braskerud, B.C., 2002. Factors affecting nitrogen retention in small constructed542
wetlands treating agricultural non-point source pollution. Ecological Engineering, 18,543
351-370.544
545
Braskerud, B.C., Haarstad, K., 2003. Screening the retention of thirteen pesticides in546
a small constructed wetland. Water Science and Technology, 48(5), 267-274.547
548
Brett, M.T. and Benjamin, M.M., 2008. A review and reassessment of lake549
phosphorus retention and the nutrient loading concept. Freshwater Biology, 53, 194-550
211.551
552
Brown, C.D., Marshall, V.L., Deas, A., Carter, A.D., Arnold, D., Jones, R.L., 1999.553
Investigation of the effect of tillage on solute movement to drains through a heavy554
clay soil. II. Interpretation using a radio-scanning technique, dye-tracing and555
modelling. Soil Use and Management, 15, 94-100.556
557
Carter, M.R., 1998. Conservation tillage practices and diffuse pollution. In:558
Proceedings of the Conference on Diffuse Pollution (II), Edinburgh, 9-11 April.559
560
Castelle, A.J., Johnson, A.W. and Conolly, C., 1994. Wetland and Stream Buffer Size561
Requirements - A Review. Journal of Environmental Quality, 23(5), 878-882.562
563
Chapman, H., 2003. Removal of endocrine disruptors by tertiary treatments and564
constructed wetlands in subtropical Australia. Water Science and Technology, 47(9),565
151-156.566
567

22
Coelho, B.R.B., Roy, R.C., Bruin, A.J., 2006. Nitrogen recovery and partitioning with568
different rates and methods of sidedressed manure. Soil Science Society of America569
Journal, 70(2), 464-473.570
571
Coelho, B.R.B., Roy, R.C., Topp, E., Lapen, D.R., 2007. Tile water quality following572
liquid swine manure application into standing corn. Journal of Environmental Quality,573
36(2), 580-587.574
575
Cooke, C.M., Shaw, G., Lester, J.N., Collins, C.D., 2004. Determination of solid-liquid576
partition coefficients (K-d) for diazinon, propetamphos and cis-permethrin:577
implications for sheep dip disposal. Science of the Total Environment, 329(1-3), 197-578
213.579
580
CPA and AIC., 2004. Water protection special. National Register of Spray Operators581
report.582
583
Cuttle, S.P., Macleod, C.J.A., Chadwick, D.R., Scholefield, D., Haygarth, P.M.,584
Newell-Price, P., Harris, D., Shepherd, M.A., Chambers, B.J., Humphrey, R., 2007.585
An inventory of methods to control diffuse water pollution from agriculture. Report for586
Defra project ES0203.587
588
Cuttle, S.P., Shepherd, M.A., Lord, E.I., Hillman, J., 2004. Literature review of the589
effectiveness of measures to reduce nitrate leaching from agricultural land. Report for590
Defra project NT2511.591
592
Dabrowski, J.M., Peall, S.K.C., Van Niekerk, A., Reinecke, A.J., Day, J.A., Schulz,593
R., 2002. Predicting runoff-induced pesticide input in agricultural sub-catchment594

23
surface waters: linking catchment variables and contamination. Water Research, 36,595
4975-4984.596
597
Daverede, .IC., Kravchenko, A.N., Hoeft, R.G., Nafziger, E.D., Bullock, D.G., Warren,598
J.J., Gonzini, L.C., 2004. Phosphorus runoff from incorporated and surface-applied599
liquid swine manure and phosphorus fertilizer. Journal of Environmental Quality,600
33(4), 1535-1544.601
602
de Ruijter, F.J., Boumans, L.J.M., Smit, A.L., van den Berg, M., 2007. Nitrate in603
upper groundwater on farms under tillage as affected by fertilizer use, soil type and604
groundwater table. Nutrient cycling in agroecosystems, 77(2), 155-167.605
606
de Snoo, G.R., de Wit, P.J., 1998. Buffer zones for reducing pesticide drift to ditches607
and risks to aquatic organisms. Ecotoxicology and Environmental Safety, 41(1), 112-608
118.609
610
Defra, 2004. Summary of responses to the joint Defra-HM Treasury consultation611
‘Developing Measures to Promote Catchment Sensitive Farming’. Defra, London.612
613
Defra, 2005a. CAP: Single Payment Scheme – Cross Compliance. Defra, London.614
615
Defra, 2005b. Entry Level Stewardship (ELS). Defra, London.616
617
Defra, 2005c. Higher Level Stewardship (HLS). Defra, London.618
619
Delle Site, A., 2001. Factors affecting sorption of organic compounds in natural620
sorbent/water systems and sorption coefficients for selected pollutants. A review.621

24
Journal of Physical and Chemical Reference Data, 30(1), 187-439.622
623
Ding, G.W., Novak, J.M., Herbert, S., Xing, B.S., 2002. Long-term tillage effects on624
soil metolachlor sorption and desorption behavior. Chemosphere, 48(9), 897-904.625
626
Dorioz, J.M., Wang, D., Poulenerd, J., Trévisan, D., 2006. The effect of grass buffer627
strips on phosphorus dynamics – A review and synthesis as a basis for application in628
agricultural landscapes in France. Agriculture, Ecosystems and Environment, 117, 4-629
21.630
631
Dukes, M.D., Evans, R.O., 2006. Impact of agriculture on water quality in the North632
Carolina Middle Coastal Plain. Journal of Irrigation and Drainage Engineering-ASCE,633
132(3), 250-262.634
635
EC, 2000. Council Directive 2000/60/EC establishing a framework for community636
action in the field of water policy, OJ L327.637
638
Edwards, C.A., Lofty, J.R., 1982. The effect of direct drilling and minimal cultivation639
on earthworm populations. Journal of Applied Ecology. 19, 723-734.640
641
Environment Agency, 1999. Pesticides in the aquatic environment. Environment642
Agency National Centre for Ecotoxicology and Hazardous Substances report.643
644
Fielder, A.G., Peel, S., 1992. The selection and management of species for cover in645
grassland systems. Aspects of Applied Biology 30, 283-290.646
647

25
Fogg, P., Boxall, A.B.A., Walker, A., Jukes, A., 2004. Degradation and leaching648
potential of pesticides in biobed systems. Pest Management Science, 60(7), 645-649
654.650
651
Fogg, P., King, J.A., Shepherd, M.A., Clemence, B., undated. A review of ‘soft652
engineering’ techniques for on-farm bioremediation of diffuse and point sources of653
pollution. ADAS research report for Defra contract ES0132.654
655
Freeman, C., Evans, C.D., Monteith, D.T., Reynolds, B., Fenner, N., 2001. Export of656
organic carbon from peat soils. Nature, 412, 785-785.657
658
Gaddis, E.J.B., Vladich, H., Voinov, A., 2007. Participatory modeling and the659
dilemma of diffuse nitrogen management in a residential watershed. Environmental660
Modelling and Software, 22(5), 619-629.661
662
Garnett, M., Ineson, P., Stevenson, A.C., 2000. Effects of burning and grazing on663
carbon sequestration in a Pennine blanket bog. Holocene, 10, 729-736.664
665
Garrod, G.D., Garratt, J.A., Kennedy, A., Willis, K.G., 2007. A mixed methodology666
framework for the assessment of the Voluntary Initiative. Pest Management Science,667
63(2), 157-170.668
669
Ghidey, F., Blanchard, P.E., Lerch, R.N., Kitchen, N.R., Alberts, E.E., Sadler, E.J.,670
2005. Measurement and simulation of herbicide transport from the corn phase of671
three cropping systems. Journal of Soil and Water Conservation, 60(5), 260-273.672
673
Gilliom, R.J., 2007. Pesticides in U.S. streams and groundwater. Environmental674
Science and Technology, 41(10), 3407-3413.675

26
676
Goss, M.J., Colborun, P., Harris, G.L., Howse, K.R., 1988. Leaching of nitrogen677
under autumn-sown crops and the effects of tillage. In: Jenkinson, D. S., Smith, K. A.678
(Eds.), Nitrogen efficiency in agricultural soils, Elsevier Applied Science, London pp.679
269-282.680
681
Goulding, K.W.T., Poulton, P.R., Webster, C.P., Howe, M.T., 2000. Nitrate leaching682
from the Broadbalk Wheat Experiment, Rothamsted, UK, as influenced by fertilizer683
and manure inputs and the weather. Soil Use and Management, 16(4), 244-250.684
685
Grant, R.J., Daniell, T.J. and Betts, W.B., 2002. Isolation and identification of686
synthetic pyrethroid-degrading bacteria. Journal of Applied Microbiology, 92(3), 534-687
540.688
689
Hanegraaf, M.C., den Boer, D.J., 2003. Perspectives and limitations of the Dutch690
minerals accounting system (MINAS). European Journal of Agronomy, 20(1-2), 25-691
31.692
693
Harmel, D., Potter, S., Casebolt, P., Reckhow, K., Green, C., Haney, R., 2006.694
Compilation of measured nutrient load data for agricultural land uses in the United695
States. Journal of the American Water Resources Association, 42(5), 1163-1178.696
697
Harris, G.L., Forster, A., 1997. Pesticide contamination of surface waters-The698
potential role of buffer zones. In: Haycock, N.E., Burt, T.P., Goulding, K.W.T., Pinay,699
G. (Eds.). Buffer zones: their processes and potential in water protection, Quest700
Environmental, Harpenden, UK, pp. 62–69.701
702

27
Haycock, N.E. and Burt, T.P., 1993. Role of floodplain sediments in reducing the703
nitrate concentration of subsurface run-off: A case study in the Cotswolds, UK.704
Hydrological Processes, 7(3), 287 – 295.705
706
Haygarth, P.M., Jarvis, S. (Eds.), 2002. Agriculture, Hydrology and Water Quality.707
CAB International, Wallingford.708
709
Haygarth, P.M., Jarvis, S., 1999. Transfer of phosphorus from agricultural soils.710
Advances in Agronomy, 66, 195-249.711
712
Haygarth, P.M., Withers, P.J.A., Hutchins, M., 2002. Theoretical and practical713
effectiveness of phosphorus and associated nutrient/sediment mitigation measures in714
England and Wales. Report for Defra project PE0203.715
716
Heathwaite, A.L., Johnes, P.J., 1996. The contribution of nitrogen species and717
phosphorus fractions to stream water quality in agricultural catchments. Hydrological718
Processes. 10, 971-983.719
720
Heathwaite, A.L., Johnes, P.J., Peters, N.E., 1996. Trends in nutrients. Hydrological721
Processes, 10(2), 263-293.722
723
Hernandez-Soriano, M.C., Pena, A., Mingorance, M.D., 2007. Retention of724
organophosphorous insecticides on a calcareous soil modified by organic725
amendments and a surfactant. Science of the Total Environment, 378(1-2), 109-113.726
727
Herzog, F., Steiner, B., Bailey, D., Baudry, J., Billeter, R., Bukacek, R., De Blust, G.,728
De Cock, R., Dirksen, J., Dormann, C.F., De Filippi, R., Frossard, E., Liira, J.,729

28
Schmidt, T., Stockli, R., Thenail, C., van Wingerden, W., Bugter, R., 2006.730
Assessing the intensity of temperate European agriculture at the landscape scale.731
European Journal of Agronomy, 24(2), 165-181.732
733
Holden, J., 2005. Peatland hydrology and carbon cycling: why small-scale process734
matters. Philosophical Transactions of the Royal Society A, 363, 2891-2913.735
736
Holden, J., Burt, T.P., Evans, M.G., Horton, M., 2006. Impact of land drainage on737
peatland hydrology. Journal of Environmental Quality, 35(5), 1764-1778.738
739
Holden, J., Chapman, P., Evans, M., Hubacek, K., Kay, P., Warburton, J., 2007b.740
Vulnerability of organic soils in England and Wales. Final report to Defra (project741
SP0532) and Countryside Council for Wales (contract FC 73-03-275).742
743
Holden, J., Shotbolt, L., Bonn, A., Burt, T.P., Chapman, P.J., Dougill, A.J., Fraser,744
E.D.G., Hubacek, K., Irvine, B., Kirkby, M.J., Reed, M.S., Prell, C., Stagl, S., Stringer,745
L.C., Turner, A., Worrall, F., 2007a. Environmental change in moorland746
landscapes. Earth-Science Reviews, 82(1-2), 75-100.747
748
Hole, D.G., Perkins, A.J., Wilson, J.D., Alexander, I.H., Grice, F., Evans, A.D., 2005.749
Does organic farming benefit biodiversity? Biological Conservation, 122(1), 113-130.750
751
Holland, J.M., 2004. The environmental consequences of adopting conservation752
tillage in Europe: reviewing the evidence. Agriculture, Ecosystems and Environment,753
103(1), 1-25.754
755

29
Hooda, P.S., Edwards, A.C., Anderson, H.A., Miller, A., 2000. A review of water756
quality concerns in livestock farming areas. Science of the Total Environment, 250(1-757
3), 143-167.758
759
Huging, H., Anger, M., Khbauch, W., 1995. On the effect of intensive and extensive760
grazed grassland with a special regard to nitrate leaching. Wirtschaftseigene Futter,761
41, 172-181. (In German).762
763
Hyer, K.E., Hornberger, G.M., Herman, J.S., 2001. Processes controlling the episodic764
streamwater transport of atrazine and other agrichemicals in an agricultural765
watershed. Journal of Hydrology, 254, 47-66.766
767
Jansson, A., Folke, C., Langaas, S., 1998. Quantifying the nitrogen retention capacity768
of natural wetlands in the large-scale drainage basin of the Baltic Sea. Landscape769
Ecology, 13(4), 249-262.770
771
Jarvis, N.J., Stahli, M., Bergstrom, L., Johnsson, H., 1994. Simulation of dichlorprop772
and bentazon leaching in soils of contrasting texture using the MACRO model.773
Journal of Environmental Science and Health Part A – Environmental Science and774
Engineering and Toxic and Hazardous Substance Control, 29(6), 1255-1277.775
776
Johnson, P.A., Smith, P.N., 1996.The effects of nitrogen fertilizer rate, cultivation and777
straw disposal on the nitrate leaching from a shallow limestone soil cropped with778
winter barley. Soil Use and Management, 12(2), 67-71.779
780
Jordan, C., Smith, R.V., 1985. Factors affecting leaching of nutrients from an781
intensively managed grassland in County Antrim, Northern Ireland. Journal of782
Environmental Management, 20, 1-15.783

30
784
Kadlec, R., Knight, R., Vymazal, J., Brix, H., Cooper, P., Haberl, R., 2000.785
Constructed Wetlands for Pollution Control. Processes, Performance, Design and786
Operation. IWA Publishing, London.787
788
Kamra, S.K., Michaelson, J., Wichtmann, W., Widmoser P., 1999. Preferential solute789
movement along the interface of soil horizons. Water Science and Technology, 40,790
61-68.791
792
Kay, P., Blackwell, P.A., Boxall, A.B.A., 2004. Fate of veterinary antibiotics in a793
macroporous tile drained clay soil. Environmental Toxicology and Chemistry, 23(5),794
1136-1144.795
796
Kay, P., Humphrey, R., Shepherd, M., 2005. Review of European/American797
catchment studies to control diffuse water pollution. ADAS final report for Defra798
project ES0133.799
800
Kenimer, A.L., Mostaghimi, S., Young, R.W., Dillaha, T.A., Shanholtz, V.O., 1987.801
Effects of residue cover on pesticide losses from conventional and no-tillage802
systems. Transactions of the ASAE, 30(4), 953-959.803
804
Kleijn, D., Berendse, F., Smit, R., Gilissen, N., 2001. Agri-environment schemes do805
not effectively protect biodiversity in Dutch agricultural landscapes. Nature,806
413(6857), 723-725.807
808
Klöppel, H., Kördel, W., Stein, B., 1997. Herbicide transport by surface runoff and809
herbicide retention in a filter strip – rainfall and runoff simulation studies.810
Chemosphere, 35(1/2), 129-141.811
31
812
Knapp, M.F., 2005. Diffuse pollution threats to groundwater: a UK water company813
perspective. Quarterly Journal of Engineering Geology, 38, 39-51.814
815
Koskiaho, J., Ekholm, P., Räty, M., Riihimäki, J., Puustinen, M., 2003. Retaining816
agricultural nutrients in constructed wetlands – experiences under boreal conditions.817
Ecological Engineering, 20, 89-103.818
819
Kovacic, D.A., Twait, R.M., Wallace, M.P. and Bowling, J.M., 2006. Use of created820
wetlands to improve water quality in the Midwest - Lake Bloomington case study.821
Ecological Engineering, 28 (3), 258-270.822
823
Krutz, L.J., Senseman, S.A., Zablotowicz, R.M., Matocha, M.A., 2005. Reducing824
herbicide runoff from agricultural fields with vegetative filter strips: a review. Weed825
Science, 53, 353-367.826
827
Kurz, I., O’Reilly, C.D., Tunney, H., 2006. Impact of cattle on soil physical properties828
and nutrient concentrations in overland flow from pasture in Ireland. Agriculture,829
Ecosystems and Environment, 113, 378–390.830
831
Lapworth, D.J. and Gooddy, D.C., 2006. Source and persistence of pesticides in a832
semi-confined chalk aquifer of southeast England. Environmental Pollution, 144(3),833
1031-1044.834
835
Larson, A.C., Gentry, L.E., David, M.B., Cooke, R.A., Kovacic, D.A., 2000. The role836
of seepage in constructed wetlands receiving agricultural tile drainage. Ecological837
Engineering, 15, 91–104.838
839

32
Le Bissonnais, Y., Lecomte, V., Cerdan, O., 2004. Grass strip effects on runoff and840
soil loss. Agronomie, 24(3), 129-136.841
842
Levot, G.W., 2007. Effective remediation of diazinon from spent sheep dip wash by843
disposal to land. Australian Journal of Experimental Agriculture, 47(1), 13-16.844
845
Li, K., Xing, B.S., Torello, W.A., 2005. Effect of organic fertilizers derived dissolved846
organic matter on pesticide sorption and leaching. Environmental Pollution, 134(2),847
187-194.848
849
Line, D.E., 2003. Changes in a stream's physical and biological conditions following850
livestock exclusion. Transactions of the ASAE, 46(2), 287-293.851
852
Lord, E.I., Mitchell, R.D.J., 1998. Effect of nitrogen inputs to cereals on nitrate853
leaching from sandy soils. Soil Use and Management, 14, 78-83.854
855
Lord, E.I., Johnson, P.A., Archer, J.R., 1999. Nitrate Sensitive Areas: a study of large856
scale control of nitrate loss in England. Soil Use and Management, 15(4), 201-207.857
858
Lovell, S.T. and Sullivan, W.C., 2006. Environmental benefits of conservation buffers859
in the United States: Evidence, promise, and open questions. Agriculture,860
Ecosystems and Environment, 112, 249–260.861
862
Macgregor, C.J., Warren, C.R., 2006. Adopting sustainable farm management863
practices within a Nitrate Vulnerable Zone in Scotland: The view from the farm.864
Agriculture Ecosystems and Environment, 113(1-4), 108-119.865
866

33
Mazanti, L., Rice, C., Bialek, K., Sparling, D., Stevenson, C., Johnson, W.E., Kangas,867
P. and Rheinstein, J., 2003. Aqueous-phase disappearance of atrazine, metolachlor,868
and chlorpyrifos in laboratory aquaria and outdoor macrocosms. Archives of869
Environmental Contamination and Toxicology, 44(1), 67-76.870
871
Mitchell, G., McDonald, A.T., 1995. Catchment characterisation as a tool for upland872
water-quality management. Journal of Environmental Management, 44(1), 83-95.873
874
Moore, M.T., Schulz, R., Cooper, C.M., Smith, S. and Rodgers, J.H., 2002. Mitigation875
of chlorpyrifos runoff using constructed wetlands. Chemosphere, 46(6), 827-835.876
877
Ng, H.Y.F., Clegg, S.B., 1997. Atrazine and metolachlor losses in runoff events from878
an agricultural watershed: the importance of runoff components. The Science of the879
Total Environment, 193, 215-228.880
881
Nieuwenhuijsen, M.J., Toledano, M.B., Bennett, J., Best, N., Hambly, P., de Hoogh,882
C., Wellesley, D., Boyd, P.A., Abramsky, L., Dattani, N., Fawell, J., Briggs, D., Jarup,883
L. and Elliott, P., 2008. Chlorination disinfection by-products and risk of congenital884
anomalies in England and Wales. Environmental Health Perspectives, 116(2), 216-885
222.886
887
Owens, P.N., Duzant, J.H., Deeks, L.K., Wood, G.A., Morgan, R.P.C., Collins, A.J.,888
2007. Evaluation of contrasting buffer features within an agricultural landscape for889
reducing sediment and sediment-associated phosphorus delivery to surface waters.890
Soil Use and Management, 23(1), 165-175.891
892

34
Pacini, C., Wossink, A., Giesen, G., Vazzana, C., Huirne, R., 2003. Evaluation of893
sustainability of organic, integrated and conventional farming systems: a farm and894
field-scale analysis. Agriculture, Ecosystems and Environment, 95(1), 273-288.895
896
Parkyn, S.M., Davies-Colley, R.J., Halliday, N.J., Costley, K.J., Croker, G.F., 2003.897
Planted riparian buffer zones in New Zealand: Do they live up to expectations?898
Restoration Ecology, 11(4), 436-447.899
900
Parry, H., Ramwell, C., Bishop, J., Cuthbertson, A., Boatman, N., Gaskell, P., Dwyer,901
J., Mills, J., Ingram, J., 2006. Quantitative approaches to assessment of farm level902
changes and implications for the environment. Agricultural Change and Environment903
Observatory Programme report OBS 03.904
905
Patty, L., Real, B., Gril, J.J., 1997. The use of grassed buffer strips to remove906
pesticides, nitrate and soluble phosphorus compounds from runoff water. Pesticide907
Science, 49(3), 243-251.908
909
Petersen, C.T., Jensen, H.E., Hansen, S., Koch, C.B., 2001. Susceptibility of a sandy910
loam soil to preferential flow as affected by tillage. Soil and Tillage Research, 58(1-911
2), 81-89.912
913
Popov, V.H., Cornish, P.S. and Sun, H., 2006. Vegetated biofilters: The relative914
importance of infiltration and adsorption in reducing loads of water-soluble herbicides915
in agricultural runoff. Agriculture, Ecosystems and Environment, 114(2-4), 351-359.916
917
Pote, D.H., Kingery, W.L., Aiken, G.E., Han, F.X., Moore, P.A., 2006. Incorporating918
granular inorganic fertilizer into perennial grassland soils to improve water quality.919
Journal of Soil and Water Conservation, 61(1), 1-7.920

35
921
Pote, D.H., Kingery, W.L., Aiken, G.E., Han, F.X., Moore, P.A., Buddington, K., 2003.922
Water-quality effects of incorporating poultry litter into perennial grassland923
soils. Journal of Environmental Quality, 32(6), 2392-2398.924
925
Pretty, J.N., Brett, C., Gee, D., Hine, R.E., Mason, C.F., Morison, J.I.L., Raven, H.,926
Rayment, M.D., van der Bijl, G., 2000. An assessment of the total external costs of927
UK agriculture. Agricultural Systems, 65(2), 113-136.928
929
Rasmussen, K.J., 1999. Impact of ploughless soil tillage on yield and soil quality: A930
Scandinavian review. Soil & Tillage Research, 53(1), 3-14.931
932
Robinson, M., 1985. The hydrological effects of moorland gripping: a reappraisal of933
Moor House research. Journal of Environmental Management, 21, 205-211.934
935
Robinson, M., Armstrong, A.C., 1988. The extent of agricultural field drainage in936
England and Wales, 1971-1980. Transactions of the Institute of British Geographers,937
13, 19-28.938
939
Rose, S.C., Carter, A.D., 2003. Agrochemical leaching and water contamination. In:940
Garcia-Torres, L., Benites, J., Martinez-Vilela, A., Holgado-Cabrera, A. (Eds.),941
Conservation agriculture: environment, farmers experiences, innovations, socio-942
economy, policy. Kluwer Academic, Dordrecht, pp. 417–424.943
944
Schjonning, P., Rasmussen, K.J., 2000. Soil strength and soil pore characteristics for945
direct drilled and ploughed soils. Soil and Tillage Research. 57(1-2), 69-82.946
947

36
Schjonning, P., Sibbesen, E., Hansen, A.C., Hasholt, B., Heidmann, T., Madsen,948
M.B., Nielsen, J.D., 1995. Surface runoff, erosion and loss of phosphorus at two949
agricultural soils in Denmark – plot studies 1989-92. SP report No. 14, Danish950
Institute of Plant and Soil Science, Foulum, Denmark.951
952
Schröder, J.J., Aarts, H.F.M., van Middelkoop, J.C., Schils, R.L.M., Velthof, G.L.,953
Fraters, B., Willems, W.J., 2007. Permissible manure and fertilizer use in dairy954
farming systems on sandy soils in The Netherlands to comply with the Nitrates955
Directive target. European Journal of Agronomy, 27, 102–114.956
957
Schulz, R., Peall, S.K.C., 2001. Effectiveness of a constructed wetland for retention958
of nonpoint-source pesticide pollution in the Lourens River catchment, South Africa.959
Environmental Science and Technology, 35(2), 422-426.960
961
Sheffield, R.E., Mostaghimi, S., Vaughan, D.H., Collins, E.R., Allen, V.G., 1997. Off-962
stream water sources for grazing cattle as a stream bank stabilization and water963
quality BMP. Transactions of the ASAE, 40(3), 595-604.964
965
Shepherd, M.A., 1999. The effectiveness of cover crops during eight years of a UK966
sandland rotation. Soil Use and Management, 15, 41-48.967
968
Shepherd, M.A., Davies, D.B., Johnson, P.A., 1993. Minimising nitrate losses from969
arable soils. Soil Use and Management, 9, 94-99.970
971
Shepherd, M.A., Stockdale, E.A., Powlson, D.S. and Jarvis, S.C., 1996. The972
influence of organic nitrogen mineralization on the management of agricultural973
systems in the UK. Soil Use and Management, 12, 76-85.974
975

37
Shipitalo, M.J., Owens, L.B., 2006. Tillage system, application rate, and extreme976
event effects on herbicide losses in surface runoff. Journal of Environmental Quality,977
35(6), 2186-2194.978
979
Shipitalo, M.J., Dick, W.A., Edwards, W.M., 2000.Conservation tillage and macropore980
factors that affect water movement and the fate of chemicals. Soil and Tillage981
Research, 53(3-4), 167-183.982
983
Schulz, R. and Peall, S.K.C., 2001. Effectiveness of a constructed wetland for984
retention of nonpoint-source pesticide pollution in the Lourens River catchment,985
South Africa. Environmental Science and Technology, 35(2), 422-426.986
987
Smith, K.A., Chambers B.J., 1993. Utilising the nitrogen content of organic manures988
on farms – problems and practical solutions. Soil Use and Management. 9, 106-112.989
990
Spliid, N.H., Helweg, K., Heinrichson, K., 2006. Leaching and degradation of 21991
pesticides in a full-scale model biobed. Chemosphere, 64(11), 2223-2232.992
993
Stålnacke, P., Grimvall, A., Libiseller, C., Laznik, A., Kokorite, I., 2003. Trends in994
nutrient concentrations in Latvian rivers and the response to the dramatic change in995
agriculture. Journal of Hydrology, 283, 184-205.996
997
Stålnacke, P., Vandsemb, S.M., Vassiljev, A., Grimvall, A., Jolanjal, G., 2004.998
Changes in nutrient levels in some Eastern European rivers in response to large-999
scale changes in agriculture. Water Science and Technology, 49, 29-36.1000
1001

38
Stearman, G.K., George, D.B., Carlson, K. and Lansford, S., 2003. Pesticide removal1002
from container nursery runoff in constructed wetland cells. Journal of Environmental1003
Quality, 32(4), 1548-1556.1004
1005
Stoddard, C.S., Grove, J.H., Coyne, M.S., Thom, W.O., 2005. Fertilizer, tillage, and1006
dairy manure contributions to nitrate and herbicide leaching. Journal of1007
Environmental Quality, 34(4), 1354-1362.1008
1009
Syversen, N. and Bechmann, M., 2004. Vegetative buffer zones as pesticide filters1010
for simulated surface runoff. Ecological Engineering, 22(3), 175-184.1011
1012
Syversen, N., 2005. Cold-climate vegetative buffer zones as pesticide-filters for1013
surface runoff. Water Science and Technology, 51(3-4), 63-71.1014
1015
Syversen, N. and Borch, H., 2005. Retention of soil particle fractions and phosphorus1016
in cold-climate buffer zones. Ecological Engineering, 25, 382-394.1017
1018
Tate, K.W., Nader, G.A., 2000. Evaluation of buffers to improve the quality of runoff1019
from irrigated pastures. Journal of Soil and Water Conservation, 55, 473-478.1020
1021
Tebrugge, F., During, R.A., 1999. Reducing tillage intensity - a review of results from1022
a long-term study in Germany. Soil and Tillage Research, 53(1), 15-28.1023
1024
Uri, N.D., 1998.The environmental consequences of the conservation tillage adoption1025
decision in agriculture in the United States. Water, Air and Soil Pollution, 103(1-4), 9-1026
33.1027
1028

39
Uusi-Kämppä, J., Braskerud, B., Jansson, H., Syversen, N., Uusitalo, R., 2000.1029
Buffer zones and constructed wetlands as filters for agricultural phosphorus. Journal1030
of Environmental Quality, 29, 151-158.1031
1032
Van der Zande, J.C., Heijne, B., Wenneker, M., 2001. Spray drift reduction in orchard1033
spraying. Institute of Agricultural and Environmental Engineering. IMAG report 2001-1034
19.1035
1036
Vertés, F., Simon, J.C., LeCorre, L., Decau, M.L., 1997. Nitrogen flows in grazed1037
pastures. II. Flows and their effects on leaching. Fourages, 151, 263-280. (In1038
French).1039
1040
Virtue, W.A., Clayton, J.W., 1997. Sheep dip chemicals and water pollution. Science1041
of the Total Environment, 194, 207-217.1042
1043
Wallage, Z.E., Holden, J., McDonald, A.T., 2006. Drain blocking is an effective1044
treatment for reducing dissolved organic carbon loss and water colour in peatlands.1045
Science of the Total Environment, 367(2-3), 811-821.1046
1047
Wedding, B., 2000. Dammar som reningsverk. Ekologgruppen report, Landskrona,1048
Sweden.1049
1050
Withers, P.J.A., Edwards, A.C., Foy, R.H., 2001. Phosphorus cycling in UK1051
agriculture and implications for phosphorus loss from soil. Soil Use and1052
Management, 17, 139-149.1053
1054

40
Withers, P.J.A., Hodgkinson, R.A., Bates, A., Withers C.L., 2007. Soil cultivation1055
effects on sediment and phosphorus mobilization in surface runoff from three1056
contrasting soil types in England. Soil and Tillage Research. 93, 438–451.1057
1058
Withers, P.J.A., Hodgkinson, R.A., Bates, A., Withers C.M., 2006. Some effects of1059
tramlines on surface runoff, sediment and phosphorus mobilisation on an erosion-1060
prone soil. Soil Use and Management, 22, 245-255.1061
1062
Worrall, F., Armstrong, A., Adamson, J.K., 2007. The effect of burning and sheep-1063
grazing on water table depth and soil water quality in a blanket bog. Journal of1064
Hydrology, 339(1-2), 1-14.1065
1066
Worrall, F., Fernandez-Perez, M., Johnson, A.C., Flores-Cesperedes, F., Gonzales-1067
Pradas, E., 2001. Limitations on the role of incorporated organic matter in reducing1068
pesticide leaching. Journal of Contaminant Hydrology, 49, 241-262.1069
1070
Worrall, F., Parker, A., Rae, J.E., 1995. A study of suspended and colloidal matter in1071
the leachate from lysimeters: Implications for pollution and lysimeter studies. In:1072
BCPC Monograph No. 62: Pesticide Movement to Water, pp. 129-134. Alton.1073
1074
Zehe, E., Flühler, H., 2001. Preferential transport of isoproturon on a plot and a field1075
scale, tile-drained site. Journal of Hydrology, 247, 100-115.1076
1077
Zeimen, M.B., Janssen, K.A., Sweeney, D.W., Pierzynski, G.M., Mankin, K.R.,1078
Devlin, D.L., Regehr, D.L., Langemeier, M.R., Mcvay, K.A., 2006. Combining1079
management practices to reduce sediment, nutrients, and herbicides in runoff.1080
Journal of Soil and Water Conservation, 61 (5), 258-267.1081
1082

41
Table 1. Stewardship measures available in contemporary agri-environment1083
schemes that have been proven to reduce water pollution by dissolved organic1084
carbon, nutrients and pesticides.1085
Pollutant Measures scientifically proven to improve water quality
Dissolved organic
carbon/water
colour
Block grips and gullies
Nutrients Limit nutrient application to crop requirements
Limit total N from manures to 170 kg ha-1 yr-1 (arable) and 250
kg ha-1 yr-1 (grassland)
Arable reversion to grassland
Inject slurry or incorporate soon after application
Do not apply dirty water to high-risk areas
Ensure soil is bare for a minimum of time
Traffic fields across slope
Use direct drilling
Avoid poaching
Limit overgrazing
Limit livestock access to watercourses
Buffer zones
Wetlands
Pesticides Do not apply when land is frozen, saturated or rain is forecast
in next 3 days
Do not apply when pesticides may enter land drains
Reduce spray drift
Use a biobed
Dispose of spent sheep dip to land

42
Arable reversion to grassland
Increase and maintain soil organic matter
Ensure soil is bare for a minimum length of time
Use direct drilling
Buffer zones
Wetlands
43
Table 2. Nutrient removal efficiencies for buffer zones and wetlands.1086
Pollutant Effect of buffer zone Reference Effect of wetland Reference
Total nitrogen 23 % reduction McKergrow et al., 2003 5-50 % reduction Alström et al., 2000
75-94 % reduction Heathwaite et al., 1998 19-100 % reduction Jansson et al., 1998
10 % decrease – 217 % increase Borin et al., 2005 3-15 % reduction Braskerud, 2002
47-100 % reduction Dorioz et al., 2006 7 % increase – 40 %
decrease
Koskiaho et al., 2003
Nitrate 50-100 % reduction Haycock and Burt, 1993 8 % increase – 38 %
decrease
Koskiaho et al., 2003
No impact (due to macropore
flow)
Leeds-Harrison et al.,
1999
28 % reduction Kovacic et al., 2006
9 % decrease – 232 % increase Borin et al., 2005 35–100 % reduction Larson et al., 2000
95 % reduction Hefting and De Klein, 1998
Total phosphorus 6 % reduction McKergrow et al., 2003 6 % increase – 72 %
decrease
Koskiaho et al., 2003
10-98 % reduction Heathwaite et al., 1998 53 % reduction Kovacic et al., 2006

44
0-97 % reduction Uusi-Kämppa et al., 2000
31 % reduction Abu-Zreig et al., 2003
60-80 % reduction Vallières, 2005
8-97 % reduction Dorioz et al., 2006
27 % decrease – 41 % increase Borin et al., 2005
Soluble phosphorus 16 % reduction Vaananen et al., 2006 <10 % reduction Braskerud, 2002
61 % increase McKergrow et al., 2003 12-31% reduction Wedding, 2000
Soluble phosphorus
cont.
Effect of buffer zone Reference Effect of wetland Reference
17 % decrease – 475 % increase Borin et al., 2005 33 % increase – 33 %
decrease
Koskiaho et al., 2003
0-30 % decrease Dorioz et al., 2006

45
Table 3. The effect of buffer zones on mass losses of pesticides to waterbodies.1087
Pesticide Effect of buffer zone Reference
Atrazine 30 % reduction Barnes and Kalita, 2001
83-99 % reduction Patty et al., 1997
57-93 % reduction Popov et al., 2006
Fenpropimorph 71 % reduction Syversen and Bechmann,
2004
34 % reduction Syversen, 2005
Glyphosate 39 % reduction Syversen and Bechmann,
2004
48 % reduction Syversen, 2005
Isoproturon 87 % reduction Benoit et al., 2000
Lindane 76-100 % reduction Patty et al., 1997
Metolachlor 40-85 % reduction Popov et al., 2006
Propiconazole 63 % reduction Syversen and Bechmann,
2004
85 % reduction Syversen, 2005
1088
1089
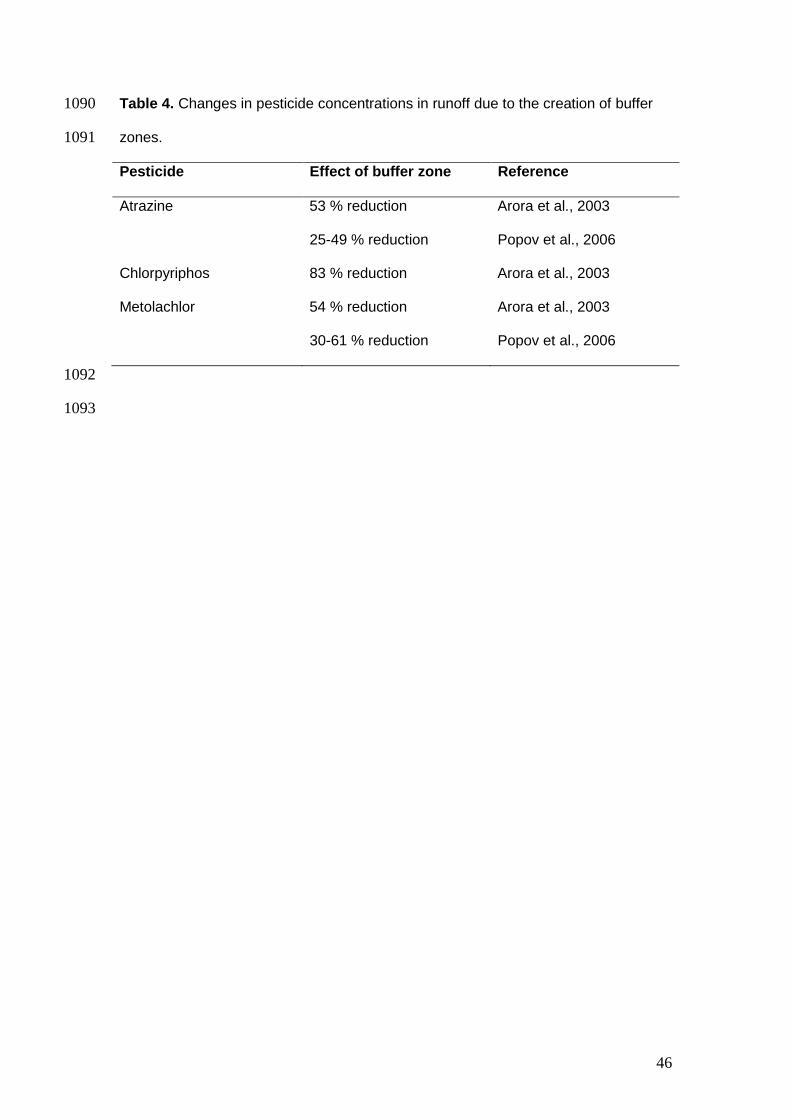
46
Table 4. Changes in pesticide concentrations in runoff due to the creation of buffer1090
zones.1091
Pesticide Effect of buffer zone Reference
Atrazine 53 % reduction Arora et al., 2003
25-49 % reduction Popov et al., 2006
Chlorpyriphos 83 % reduction Arora et al., 2003
Metolachlor 54 % reduction Arora et al., 2003
30-61 % reduction Popov et al., 2006
1092
1093

47
Table 5. Changes in mass losses of pesticides to surface waters due to the1094
construction of wetlands.1095
Pesticide Effect of wetland Reference
Atrazine 25-95 % reduction Stearman et al., 2003
Azinphosmethyl 77-93 % reduction Shulz and Peall, 2001
Carbaryl 43 % reduction Chapman, 2003
Chlorpyriphos 100 % reduction Shulz and Peall, 2001
100 % reduction Chapman, 2003
47-65 % reduction Moore et al., 2002
Diazinon 85 % reduction Chapman, 2003
Dimethoate 100 % reduction Chapman, 2003
Endosulphan 100 % reduction Shulz and Peall, 2001
Metolachlor 82 % reduction Stearman et al., 2003
Simazine 77 % reduction Stearman et al., 2003

48
Captions1096
1097
Table 11098
Stewardship measures available in contemporary agri-environment schemes that1099
have been proven to reduce water pollution by dissolved organic carbon, nutrients1100
and pesticides.1101
1102
Table 21103
Nutrient removal efficiencies for buffer zones and wetlands.1104
1105
Table 31106
The effect of buffer zones on mass losses of pesticides to waterbodies.1107
1108
Table 41109
Changes in pesticide concentrations in runoff due to the creation of buffer zones.1110
1111
Table 51112
Changes in mass losses of pesticides to surface waters due to the construction of1113
wetlands.1114
1115