Universities of Leeds, Sheffield and York...
14
promoting access to White Rose research papers White Rose Research Online [email protected] Universities of Leeds, Sheffield and York http://eprints.whiterose.ac.uk/ This is the published version of an article in Ocean Science, 9 (1) White Rose Research Online URL for this paper: http://eprints.whiterose.ac.uk/id/eprint/77210 Published article: Norris, SJ, Brooks, IM, Moat, BI, Yelland, MJ, de Leeuw, G, Pascal, RW and Brooks, B (2013) Near-surface measurements of sea spray aerosol production over whitecaps in the open ocean. Ocean Science, 9 (1). 133 - 145. ISSN 1812- 0784 http://dx.doi.org/10.5194/os-9-133-2013
Transcript of Universities of Leeds, Sheffield and York...

promoting access to White Rose research papers
White Rose Research [email protected]
Universities of Leeds, Sheffield and Yorkhttp://eprints.whiterose.ac.uk/
This is the published version of an article in Ocean Science, 9 (1)
White Rose Research Online URL for this paper:
http://eprints.whiterose.ac.uk/id/eprint/77210
Published article:
Norris, SJ, Brooks, IM, Moat, BI, Yelland, MJ, de Leeuw, G, Pascal, RW andBrooks, B (2013) Near-surface measurements of sea spray aerosol productionover whitecaps in the open ocean. Ocean Science, 9 (1). 133 - 145. ISSN 1812-0784
http://dx.doi.org/10.5194/os-9-133-2013

Ocean Sci., 9, 133–145, 2013www.ocean-sci.net/9/133/2013/doi:10.5194/os-9-133-2013© Author(s) 2013. CC Attribution 3.0 License.
EGU Journal Logos (RGB)
Advances in Geosciences
Open A
ccess
Natural Hazards and Earth System
Sciences
Open A
ccess
Annales Geophysicae
Open A
ccess
Nonlinear Processes in Geophysics
Open A
ccess
Atmospheric Chemistry
and Physics
Open A
ccess
Atmospheric Chemistry
and Physics
Open A
ccess
Discussions
Atmospheric Measurement
Techniques
Open A
ccess
Atmospheric Measurement
Techniques
Open A
ccess
Discussions
Biogeosciences
Open A
ccess
Open A
ccess
BiogeosciencesDiscussions
Climate of the Past
Open A
ccess
Open A
ccess
Climate of the Past
Discussions
Earth System Dynamics
Open A
ccess
Open A
ccess
Earth System Dynamics
Discussions
GeoscientificInstrumentation
Methods andData Systems
Open A
ccess
GeoscientificInstrumentation
Methods andData Systems
Open A
ccess
Discussions
GeoscientificModel Development
Open A
ccess
Open A
ccess
GeoscientificModel Development
Discussions
Hydrology and Earth System
Sciences
Open A
ccess
Hydrology and Earth System
Sciences
Open A
ccess
Discussions
Ocean Science
Open A
ccess
Open A
ccess
Ocean ScienceDiscussions
Solid Earth
Open A
ccess
Open A
ccess
Solid EarthDiscussions
The Cryosphere
Open A
ccess
Open A
ccess
The CryosphereDiscussions
Natural Hazards and Earth System
Sciences
Open A
ccess
Discussions
Near-surface measurements of sea spray aerosol production overwhitecaps in the open ocean
S. J. Norris1, I. M. Brooks1, B. I. Moat2, M. J. Yelland2, G. de Leeuw3,4,5, R. W. Pascal2, and B. Brooks1
1School of Earth and Environment, University of Leeds, UK2National Centre of Oceanography, Southampton, UK3Climate Change Unit, Finnish Meteorological Institute, Helsinki, Finland4Department of Physics, University of Helsinki, Helsinki, Finland5Netherlands Organisation for Applied Scientific Research – TNO, Utrecht, The Netherlands
Correspondence to:S. J. Norris ([email protected])
Received: 10 September 2012 – Published in Ocean Sci. Discuss.: 18 October 2012Revised: 18 January 2013 – Accepted: 29 January 2013 – Published: 19 February 2013
Abstract. Simultaneous measurements of near-surfaceaerosol (0.12< R < 9.25 µm) and bubble spectra(13< R < 620 µm) were made during five buoy deploymentsin the open ocean of the North Atlantic and used to estimateaerosol fluxes per unit area of whitecap. The measurementswere made during two cruises as part of the Sea Spray, GasFlux, and Whitecaps (SEASAW) project, a UK contributionto the international Surface Ocean Lower Atmosphere Study(SOLAS) program. The mean bubble number concentrationsfor each deployment are in broad agreement with otheropen ocean spectra and are consistently one to two ordersof magnitude lower than surf zone studies. Productionfluxes per unit area of whitecap are estimated from themean aerosol concentration for each buoy deployment.They are found to increase with wind speed, and span therange of values found by previous laboratory and surf-zonestudies for particles with radius at 80 % relative humidity,R80< 1 µm, but to drop off more rapidly with increasingparticle size for larger particles. Estimates of the mean seaspray flux were made by scaling the whitecap productionfluxes with in situ estimates of whitecap fraction. The seaspray fluxes are also compared with simultaneous individualeddy covariance flux estimates, and with a sea spray sourcefunction derived from them.
1 Introduction
Sea spray aerosol is an important component of the climatesystem and the largest single source of aerosol mass in-jected into the atmosphere after wind-blown dust (Hoppelet al., 2002). Under clear skies over the remote ocean, seasalt aerosol is the dominant scatterer of incoming solar ra-diation (Haywood et al., 1999); it plays a significant role incontrolling the microphysics and chemistry of marine stra-tocumulus (O’Dowd et al., 1999) and provides a substantialsink for atmospheric trace gases, both natural and anthro-pogenic (O’Dowd et al., 2000). To quantify the effects of seaspray aerosol on the environment, a detailed knowledge ofthe numbers and sizes of aerosol particles produced at theocean surface is required.
There are two production mechanisms for sea spray par-ticles: mechanical tearing of water droplets (spume) fromwave crests at high wind speeds, and the bursting of bub-bles at the water surface. Bubbles form predominantly frombreaking wind waves in the open ocean (Kolovayev, 1976);these entrain air into the near-surface water column produc-ing a plume of bubbles (Blanchard and Woodcock, 1957);as the bubbles rise they form regions of foam at the surface-whitecaps. Other potential production mechanisms for bub-bles include production by the respiration of phytoplank-ton (Medwin, 1970; Johnson and Wangersky, 1987), releasefrom the sea bed (e.g. Leighton and Robb, 2008), gases com-ing out of solution as gas-saturated water warms (Norris etal., 2011), and where sea ice is present the release of bubbles
Published by Copernicus Publications on behalf of the European Geosciences Union.

134 S. J. Norris et al.: Near-surface measurements of sea spray aerosol production
trapped in melting ice or expelled during the freezing process(Wettlaufer, 1998).
Bursting bubbles produce droplets by two distinct mech-anisms: disintegration of the bubble film produces a largenumber (100s to 1000s) of droplets smaller than aboutR = 2 µm, while the collapse of the sides of the bubble cav-ity results in the ejection of a jet of water from the cen-tre of the collapsing bubble, which breaks into a handful ofdroplets of radii between about 1 and 50 µm. The precisesize and number of droplets produced by a single bubbledepends on the bubble size (Blanchard, 1983), water prop-erties (Martensson et al., 2003) and the presence of sur-face active material (Morelli et al., 1974; Blanchard, 1990).The smallest bubbles produce only jet droplets, while thelargest produce only film droplets; the limits between themare not well defined, however, and depend on the propertiesof both water and surface microlayer. Day (1964) found abubble radius of approximately 50 µm to be the minimumsize producing film droplets, while Spiel (1997) found thelimit to be 600 µm. The largest jet droplet produced by abubble is roughly 1/10 the radius of the parent bubble (Blan-chard, 1963; Spiel, 1994). The upper limit on bubble radiusfor the production of jet droplets is variously cited to be aslow as 450 µm (Blanchard, 1963) and as high as 2.94 mm(Georgescu et al., 2002); this latter value is double the of-ten quoted value of 1.5 mm from Spiel’s (1997) experimentalstudy.
Turbulent air motion mixes the ejected droplets upwards,opposed by their gravitational fall speed, resulting in achange in particle spectra with altitude (Monahan, 1968; Wuet al., 1984; de Leeuw, 1989; Parameswaran, 2001). Duringtransport, transformation due to coagulation, evaporation andchemical processes may occur, resulting in high variability inthe aerosol’s physical and chemical properties. Newly gener-ated sea spray droplets shrink via evaporation until they reacha state of equilibrium with the ambient relative humidity, incontrast to fresh water droplets which evaporate entirely. Forease of comparison aerosol spectra are usually adjusted toa reference humidity – commonly 80 %, with the radius de-notedR80. The size of a particle influences its life cycle in theatmosphere. Particles in the nucleation mode (R80< 0.1 µm)grow by condensation and coagulation, eventually becomingaccumulation mode particles (0.1< R80< 5 µm), which havethe longest residence times. For particles withR80> 10µman increasing fraction fall back to the surface before reach-ing equilibrium (Andreas et al., 2010), imposing an uppersize limit on the resulting aerosol spectra. Turbulent mixingmeans that any measured aerosol spectrum will represent amixture of newly generated with pre-existing aerosol.
Many parameterizations for the sea spray generation func-tion have been proposed, based on a variety of observationaltechniques (see Lewis and Schwartz, 2004 for an overview).One approach has been to estimate the interfacial produc-tion flux per unit area of whitecap and to scale this by thefractional area coverage of whitecaps on the sea surface,W ,
in turn often parameterized as a function of the mean localwind speed. It has usually been assumed that the productionflux is independent of the nature and extent of the white-cap, including its production mechanism. One of the mostcommonly used such formulations is that of Monahan andO’Muircheartaigh (1986), which is based on the productionflux of particles per unit area of whitecap obtained in a lab-oratory study (Spiel, 1983) and an empirical relationship forthe whitecap fraction as a function of wind speed (Monahanand O’Muircheartaigh, 1980):
W = 3.84× 10⁻⁴U3.4110 , (1)
whereU10 is the wind speed at 10 m above the sea surface,andW is in %. There are many different whitecap fractionparameterizations derived from photographs and videos ofthe sea surface from towers, aircraft, and ships. Anguelovaand Webster (2006) provide an extensive summary of manystudies, and find that they span a range of approximately2–3 orders of magnitude at all wind speeds. It is generallyrecognized that whitecap fraction is zero for wind speeds lessthan about 3 m s−1 (Blanchard, 1963; Monahan, 1971).
The production flux of aerosol from a unit area of white-cap has been estimated from laboratory studies (Monahan etal., 1982; Cipriano et al., 1983, 1987; Woolf et al., 1988;Martensson et al., 2003; Tyree et al., 2007; Keene et al.,2007; Facchini et al., 2008; Fuentes et al., 2010), thoughonly the study of Martensson et al. (2003) is readily com-parable with this study, and measurements over natural surfzone whitecaps (Woodcock et al., 1963; Blanchard, 1969; deLeeuw et al., 2000; Clarke et al., 2006). The advantage oflaboratory measurements is the ability to control the environ-mental conditions; however, it is difficult to create conditionstruly representative of the open ocean, particularly those ofwell-developed sea states, mixed seas or high winds. A morerepresentative approach would be to make in situ estimatesof the direct aerosol production from whitecaps at sea. How-ever, making measurements in the open ocean close enoughto the surface to isolate the aerosol generated by individualwhitecaps from the background aerosol is difficult. Histori-cally, optical particle counters have been heavy and physi-cally bulky instruments, which are difficult to locate near theocean surface. Therefore, the majority of the field measure-ments of sea spray particle number concentrations have beenmade 5–25 m above the surface and then interpolated to areference level for comparison (usually the surface or 10 mabove mean surface level) (Andreas, 2002). New technologyis now making small, lightweight, and relatively cheap sen-sors increasingly available (e.g. Hill et al., 2008) enablingmeasurement approaches that were not previously viable.
De Leeuw et al. (2000) and Clarke et al. (2006) used mea-surements over surf zone whitecaps to estimate the produc-tion of sea spray aerosol. Measuring over the surf zone al-lows the instruments to be located on solid ground; how-ever, a major concern is the extent to which the surf zonewhitecaps are representative of whitecaps in the open ocean.
Ocean Sci., 9, 133–145, 2013 www.ocean-sci.net/9/133/2013/

S. J. Norris et al.: Near-surface measurements of sea spray aerosol production 135
The size spectra are very different for bubbles larger thanabout 50 µm radius, and surf zone bubble number concen-trations can be two orders of magnitude larger than those inthe open ocean (Brooks et al., 2009a). The wave breakingprocess in the surf zone results from interaction with the seabed, whereas in the open ocean wave breaking is forced bywind stress and wave–wave interactions. It has not been veri-fied that the aerosol spectra produced are the same in the surfzone, and the open ocean (Lewis and Schwartz, 2004).
Here we present near-surface measurements of aerosolspectra over open ocean whitecaps in the North Atlantic, de-rive sea spray production fluxes per unit area whitecap, andfinally make estimates of the mean surface source fluxes.
2 Measurements
In order to estimate the production of sea spray aerosol fromindividual wave breaking events, a Compact LightweightAerosol Spectrometer Probe (CLASP) (Hill et al., 2008) wasmounted on a small buoy with an inlet approximately 1 mabove the surface (Fig. 1). The buoy was deployed from theRRSDiscoveryduring the two cruises of the Sea Spray, GasFlux, and Whitecaps (SEASAW) project, part of the UK con-tribution to the international Surface Ocean Lower Atmo-sphere Study (SOLAS) (Brooks et al., 2009a, b). The cruiseswere undertaken in the North Atlantic off the west coast ofScotland and Ireland during the periods 7 November to 2 De-cember 2006 (D313) and 21 March to 12 April 2007 (D317).The buoy is surface following but held in a fixed location,about 8 m from the ship, by a weighted cable suspended froma crane. The wire passes through the buoy’s tubular centralcolumn, allowing the buoy to ride freely up and down the ca-ble as waves pass it. The weight is held at a depth of roughly25 m below the ocean surface, beneath the immediate effectof wave motions so as to help restrict sideways movement ofthe buoy. Power and serial communications to CLASP wereprovided by a single cable running from the ship.
CLASP provides a 16-channel size spectrum atambient relative humidity covering the size range0.12< Ramb< 9.25 µm at a sample rate of 10 Hz (Hillet al., 2008). The inlet is 0.25 m in length, with one60 degree bend; particle losses to the walls of the inlet arenegligible for particles with radii below 1 µm, 10 % at 3 µmand 20 % at 5 µm. These losses are determined specificallyfor this inlet and conditions experienced here using themodel of Pui et al. (1987) and corrections applied to thespectra. The humidity at 1 m was estimated based on a logprofile, using the measured humidity at 21 m and an effectiverelative humidity at the sea surface of 98 % (Lewis andSchwartz, 2004). Size spectra are subsequently adjusted to80 % relative humidity via Gerber’s (1985) growth modelfor sea salt.
A video-based bubble measuring system (Leifer et al.,2003a) was mounted on the underside of the buoy, approx-
Fig. 1.The tethered buoy. The CLASP units are the two narrow greyboxes; their inlets are visible to the left. The lower unit was dam-aged and not used in subsequent deployments. The bubble imagingsystem is mounted below the buoy’s floatation ring.
imately 0.4 m below the surface, to make measurements ofbubble size spectra in the range 13< R < 620 µm. The sam-ple volume (20× 2.9× 1.9 mm3) is imaged by a video cam-era, illuminated on-axis from directly opposite the camera.Bubbles appear as a dark ring with a brighter surroundingring and central bright spot. An automated algorithm iden-tifies candidate bubbles, while rejecting other particles suchas algae. Full technical details of system and image process-ing algorithms are given by Leifer et al. (2003a, b). The sys-tem has previously been used to examine bubble spectra inboth the ocean (de Leeuw and Cohen, 2001; de Leeuw et al.,2003; Norris et al., 2011) and the laboratory (Martensson etal., 2003 (MN03 hereafter); Leifer et al., 2003a; Sellegri etal., 2006; Fuentes et al., 2010; Hultin et al., 2010; Zabori etal., 2012). Two minutes of image data were collected at five-minute intervals throughout each deployment. A total of 154two-minute samples were obtained over 5 successful deploy-ments: 4 during D317 in the open ocean and 1 during D313in a fetch limited (∼ 5 km) environment behind the Isle of Ar-ran. Each deployment lasted for between one and four hours.
A vertically oriented accelerometer allowed the movementof the buoy over the waves to be determined, along with esti-mates of the individual wave heights. One-second resolutiondigital images of the buoy and the surrounding ocean surfacewere recorded from a webcam on the ship providing a visualcheck on the buoy and the surface conditions in its immediate
www.ocean-sci.net/9/133/2013/ Ocean Sci., 9, 133–145, 2013

136 S. J. Norris et al.: Near-surface measurements of sea spray aerosol production
vicinity. Two Nikon CoolPix 8800 digital SLR cameras wereinstalled on the port side of the bridge, approximately 13 mabove sea level, from which to estimate the whitecap fractionof breaking waves at the sea surface (Brooks et al., 2009a, b).Images were taken every 30 s during daylight hours. Duringanalysis a portion of each image was selected; this was cho-sen to exclude the region where the ship’s bow wave might bevisible, and cropped out the sky and the region of increasedbrightness close to the horizon. The automated image pro-cessing algorithm of Callaghan and White (2009) was usedto determine the whitecap fraction for each image. This de-termines a suitable threshold intensity value for each imagewith which whitecaps can be separated from the backgroundwater. Although effective, the algorithm can fail under someconditions; as a quality control measure each processed im-age was manually checked to verify its suitability. Images arerejected if they had contamination from sun-glint, sky reflec-tion, birds within the image, or uneven illumination resultingin misidentification of whitecap area by the automated algo-rithm. Multiple images were averaged to obtain a total of 6315-min mean whitecap fractions during the periods for whichthe buoy was deployed.
Mean meteorological conditions were obtained from sen-sors located on the foremast (see Brooks et al., 2009b fordetails). One-dimensional wave spectra were obtained froma shipborne wave recorder (SBWR) (Tucker and Pitt, 2001;Holliday et al., 2006). From this wave data the significantwave height,Hs, and mean wave slope (MWS) were cal-culated. Slopes greater than 0.03 indicate undeveloped seastates; those less than 0.03 indicate well-developed seas(Bourassa et al., 2001). The meteorological and oceano-graphic conditions during the deployments are summarizedin Table 1 and Fig. 2.
3 Results
3.1 Mean aerosol concentrations
The mean aerosol concentration spectra for each deploymentare shown in Fig. 3. These are a combination of the back-ground aerosol concentration spectra with the freshly gen-erated aerosol concentration spectra from breaking waves.There is no indication of a systematic wind speed depen-dence; forR80< 1 µm there is little change in concentrationbetween cases, but the spectra diverge substantially at largersizes. The persistent concentration of small particles is con-sistent with their long residence time, while the variability inmean concentration, uncorrelated with wind speed, likely re-flects the air mass history. A 30-min long time series of 1-smean aerosol number concentration from the deployment on31 March 2007 is shown in Fig. 4. Short periods, typically ofthe order of a few seconds in duration, have concentrationsgreater than that for the majority of the record by a factorof 3–7. Comparison of the concentration time series with the
Fig. 2.Time series of mean conditions during the two cruises. Greyshading indicates the times of the buoy deployments.(a) 10 m windspeed,U10 (m s−1) (black) and friction velocity,u∗ (m s−1) (red);(b) air temperature at∼ 17 m (red) and near-surface water temper-ature (black);(c) significant wave heightHs (m) (black) and meanwave slope (MWS) (red);(d) mean half hourly whitecap coverageWC (%); (e)CLASP 28 min averages of particle number concentra-tion (m−3) (0.12< R80< 9.25).
photographic record shows that these peaks in concentrationcorrespond with the occurrence of active whitecaps aroundthe buoy. Only one previous study, that of Wu (1993), hasdemonstrated the simultaneity of increases in aerosol con-centration with breaking wave crests. The source footprint ofaerosol reaching the CLASP instrument on the tethered buoyis small, typically about 3 m, estimated using the model ofHorst and Weil (1992). This is comparable to the scale of thewhitecaps; thus the excess aerosol measured within the con-centration peak should be representative of those generatedby the whitecap and it should be possible to isolate the spec-trum produced by individual whitecaps occurring around thebuoy from the mean background spectrum.
A threshold for fresh whitecap aerosol plumes was deter-mined for each individual deployment by applying a 30-point(3-s) running median to the number concentration time seriesand accepting concentrations greater than two standard devi-ations above the median. An absolute threshold of approxi-mately double the mean total concentration (N for each de-ployment) was also applied in order to fully capture plumeslasting longer than three seconds.
Aerosol concentrations greater than the threshold levelcorrespond to fresh plumes over whitecaps and are a mix-ture of aerosol resulting directly from the whitecap withthat of the background; concentrations below the threshold
Ocean Sci., 9, 133–145, 2013 www.ocean-sci.net/9/133/2013/

S. J. Norris et al.: Near-surface measurements of sea spray aerosol production 137
Table 1.Summary of the meteorological and oceanographic conditions including the 10 m wind speed,U10; friction velocity,u∗; air temper-ature at 21 m,Ta; relative humidity at 1 m and 21 m; water temperature,Tw; salinity,S; mean wave slope (MWS); significant wave height,Hs; and whitecap fraction,W . The entries in italics are for buoy deployments where bubble spectra were obtained but no aerosol data areavailable. The deployment date is also shown in Julian Day (JD) format.
Date Times Cruise U10 u∗ Ta RH RH Tw S MWS Hs W
(m s−1) (m s−1) (◦C) 21 m (%) at 1 m (%) at 21 m (◦C) (‰) (m) (%)
20 Nov 2006 11:20–13:15 D313 15.1 0.69 8.9 92 67.2 11.2− 0.01 0.98 2.1258JD 324 rising fast24 Mar 2007 09:15–13:15 D317 14.3 0.51 7.6 92 66.4 9.11 35.5 0.031 3.6 1.9163JD 83 rising slowly28 Mar 2007 09:27–11:20 D317 10.7 0.40 6.04 91 63.4 9.32 35.2 0.032 2.2 2.11JD 87 steady30 Mar 2007 09:00–10:10 D317 14.2 0.50 8.4 95 86.9 9.04 35.5 0.031 3.3 1.143JD 89 steady31 Mar 2007 09:17–11:20 D317 14.1 0.49 8.8 97.5 93.2 9.24 35.5 0.035 2.8 1.48JD 90 steady1 Apr 2007 09:05–13:30 D317 7.3 slowly 0.24 9.3 97.5 93.4 9.39 36.0 0.031 2.8 0.066JD 91 falling4 Apr 2007 13:20–16:30 D317 10.7 0.41 11.4 94 77.8 12.3 35.5 0.028 1.8 0.45JD 94 rising5 Apr 2007 09:10–11:41 D317 11.3 0.43 11.9 95 84.5 11.6 35.5 0.032 2.4 0.49JD 95 steady
Fig. 3.The mean aerosol concentration spectra for each of the buoydeployments. The deployments are ordered by increasing windspeed, and the same colour scheme, identifying different days, isused throughout all subsequent figures.
represent the ambient background aerosol spectra. The dif-ference between the two provides an estimate of the meanfresh aerosol concentration generated by the whitecaps,dN /dR80.
3.2 Bubble concentrations
Figure 5 shows the mean bubble spectra from each deploy-ment. Also shown for comparison are three other open ocean
spectra (de Leeuw et al., 2003; Phelps and Leighton, 1998;and measurements from DOGEE summarised by Brooks etal., 2009a), two spectra measured in the surf zone (Phelps etal., 1997; Deane and Stokes, 1999), and the MN03 labora-tory spectra at water temperatures of 5◦C and 15◦C (mea-sured with the same instrument used here). For completionwe have also included bubble spectra from three additionalbuoy deployments (4, 5 April and 28 March) where there areno corresponding aerosol data available, but were obtainedat wind speeds of 10–11 m s−1, lying between those of theother deployments. The mean conditions for these cases arealso given in Table 1.
The MN03 bubble spectra were generated in a small con-tainer in the laboratory and are clearly not representative ofeither the surf zone or the open ocean. The bimodal distribu-tion of the MN03 spectra in particular is not observed in anyof the natural bubble spectra, and is likely due to the artificialgeneration. We include them here because, although the bub-ble spectrum is unrealistic and thus the aerosol productionis also unlikely to closely match natural production, the seaspray source function derived from MN03 is used widely inthe aerosol modelling community. It is worth noting that themore recent studies of bubble spectra in the laboratory haveused weirs (Sellegri et al., 2006) or water jets (Fuentes et al.,2010; Hultin et al., 2010; Zabori et al., 2012) and produce amore realistic open-ocean-like bubble spectra.
For the smallest bubble sizes the concentrations span justover three orders of magnitude across the SEASAW deploy-ments, while forR > 50 µm there is much less variability –about one order of magnitude. The observations shown inFig. 5 span wind speeds of 5–15 m s−1, and thus large differ-ences in the bubble concentrations and spectral distributions
www.ocean-sci.net/9/133/2013/ Ocean Sci., 9, 133–145, 2013

138 S. J. Norris et al.: Near-surface measurements of sea spray aerosol production
Fig. 4. A 30 min section of the aerosol number concentration(cm−3) (0.12< R80< 9.25) time series (top) and a closer view of1 min of data (bottom) from the deployment on 31 March. Greypoints are the selected whitecap plumes; black points show the am-bient background concentration. The red line depicts the threshold.
Fig. 5. Mean bubble spectra for each buoy deployment (colouredlines, pale blue lines are cases where no corresponding aerosol mea-surements are available). A number of previous measurements areshown for comparison (grey lines). The open ocean spectra (opensymbols) of de Leeuw et al. (2003) (dL03,U = 5.8 m s−1), Phelpsand Leighton (1998) (PL98, depth 0.5 m,U = 12− 14 m s−1), andmeasurements by Leighton and Coles, summarized in Brooks etal. (2009a) and Pascal et al. (2011) (DOGEE, averaged over a depthof 0–3 m, U = 13 m s−1), and the surf zone spectra (filled sym-bols) of Phelps et al. (1997) (PRL97), and Deane and Stokes (1999)(DS99) along with the laboratory bubbles spectra of Martensson etal. (2003) at 5◦C (solid grey line) and 15◦C (dashed grey line) areshown for comparison. The Deane and Stokes (1999) measurementsare restricted to actively breaking regions of surf.
would be expected. However, although the wind speed isconsistent across 24, 30, and 31 March (14.1–14.3 m s−1),there remain significant differences in the bubble spectra; thismay result from the variation in wave state between these de-ployments (Table 1). Significant wave height decreases from3.6 m on 24 March to 2.8 on 31 March; the concentrationfor the majority of the bubble spectrum increases with in-creasingHs, while that of the smallest bubbles decreaseswith increasingHs, the crossover occurring between radii of25–50 µm. The bubble spectra from 20 November (15 m s−1)have a number of peaks, and the bubble concentration dropsoff more steeply with increasing bubble size than the otherspectra. The ocean conditions were very different on this de-ployment compared to the three high wind deployments inMarch 2007 due to the limited fetch of the deployment site,approximately 5 km from the coast. The wave heights werevery low with a significant wave height of only 0.98 m com-pared to∼ 3 m for the 14 m s−1 deployments.
The SEASAW bubble spectra broadly agree with the threeother open ocean spectra. All have similar shapes, span asimilar range of concentrations and show a similar increasein concentration of the smallest bubbles with increasing windspeed. The surf zone spectra have concentrations 2–3 ordersof magnitude higher than the open ocean spectra across thewhole measured size range, the difference increasing slightlywith increasing size. The MN03 laboratory spectra have con-centrations similar to the open ocean spectra forR < 50 µm,but increase at larger sizes, and match the surf zone spectrafor 100< R < 350 µm.
The variability of individual 2-min estimates of the bubblespectra about the deployment mean is illustrated in Fig. 6 forthe cases with one of the highest (31 March, 14 m s−1) andlowest (1 April, 7 m s−1) wind speeds under open ocean con-ditions. For bubbles smaller than 300 µm, the difference be-tween deployments is much greater than the variability aboutthe deployment mean spectra; for larger bubbles the variabil-ity increases significantly – this is due primarily to the oc-currence of individual spectral estimates with no bubbles insome of the larger size bins.
Note that the bubble spectra measured here are time av-erages over the whole deployment and are not restricted tothe freshly generated bubble plumes within breaking waves.The other open ocean spectra shown here are similarly timeaverages; the surf zone spectrum of Phelps et al. (1997) isalso a time average, but that of Dean and Stokes (1999) isrestricted to the active portion of breaking waves. Withinthe near-surface layer (depth< 1 m), populations of smallerbubbles have been found to be persistent, varying little overtime (Farmer and Vagil, 1989). Leifer et al. (2006) showedthat the smallest bubbles (R < 200 µm) remain in the sur-face waters after the main body of the plume has sur-faced. Bubble terminal rise velocities were calculated fol-lowing Leifer et al. (2000); they range from 0.0005 m s−1
at R = 15 µm to 0.14 m s−1 at R = 570 µm (the largest meanradius measured). The bubble rise velocities suggest that
Ocean Sci., 9, 133–145, 2013 www.ocean-sci.net/9/133/2013/

S. J. Norris et al.: Near-surface measurements of sea spray aerosol production 139
Fig. 6. The mean bubble size spectra (solid lines) for 1 April(7 m s−1 winds, blue) and 31 March (14 m s−1 winds, green) andall individual measurements from those deployments (pale blue andpale green). Open ocean and surf zone spectra in grey are as inFig. 5.
bubbles smaller than a few hundred µm can be consideredwell mixed, with larger bubbles being significantly depletedbetween wave breaking events. The concentration of bubbleswithin actively breaking waves will be higher than the meanconcentrations measured here, increasingly so with increas-ing bubble size. The measured spectra are thus not directlyrepresentative of those within breaking waves.
3.3 Whitecap coverage
It is well understood that the whitecap fraction on theocean surface increases with wind speed (Monahan andO’Muircheartaigh, 1980). Figure 7 shows the Monahan andO’Muircheartaigh (1980) parameterisation (Eq. 1) alongwith that of Callaghan et al. (2008a) and one derived fromthe measurements obtained during the SEASAW cruises fol-lowing the method of Monahan and Lu (1990):
W = 1.03× 10⁻³ (U10− 2.62)3 . (2)
The SEASAW whitecap parameterization is very simi-lar to that of Callaghan et al. (2008a) in the wind speedrange 8 to 17 m s−1 but drops off faster at lower windspeeds. Both are systematically lower than Monahan andO’Muircheartaigh (1980) as are most of the whitecap frac-tion estimates observed over the last 10 yr (de Leeuw et al.,2011). The 15-min average whitecap fractions for periodsmatching the bubble spectra estimates during each deploy-ment are also shown in Fig. 7. The overall mean whitecapfractions for each buoy deployment period are given in Ta-ble 1. At low wind speeds, 3–5 m s−1, the whitecap param-eterizations become problematic; all three of Monahan and
Fig. 7.The SEASAW whitecap estimates during each buoy deploy-ment (symbols), and the whitecap parameterizations from the fullSEASAW cruise data set, Callaghan et al. (2008a) and Monahanand O’Muircheartaigh (1980).
O’Muircheartaigh (1980), Callaghan et al. (2008a) and theSEASAW parameterisations predict low whitecap fractionsalthough they differ by more than an order of magnitude. Inpractice there are cases where no whitecaps are observed atthese low wind speeds.
3.4 Aerosol fluxes
The sea spray source flux,F, is defined here as the productof the particle production flux per unit area of whitecap,Fp,and the whitecap coverageW :
dF
dR80= W ×
(dFp
dR80
). (3)
First we estimateFp, the particle production flux per unitarea whitecap, from the aerosol concentrations. The aerosolconcentrations measured on the buoy reflect the net effect ofthe particle production during the residence time of the airadvected past the whitecaps around the buoy. The produc-tion flux, Fp, can be estimated as the product of the aerosolnumber concentration, dN /dR, with the height of the aerosolplume divided by the residence time of the plume over thewhitecap, an approach used by Monahan et al. (1982, 1986).Precise measurements of aerosol plume size and residencetime over individual whitecaps are not available, and so werely here on characteristic scales. A characteristic plumeheight can be defined as the product of a turbulent veloc-ity scale – the friction velocityu∗ – and transit time over thewhitecap. The particle production flux is thus estimated sim-ply as the product of excess aerosol number concentration in
www.ocean-sci.net/9/133/2013/ Ocean Sci., 9, 133–145, 2013

140 S. J. Norris et al.: Near-surface measurements of sea spray aerosol production
Table 2. Summary of the main studies discussed in this paper.Martensson et al. (2003), Clarke et al. (2006) and de Leeuw etal. (2000) all use the Monahan and O’Muircheartaigh (1980) white-cap function.
Study Method WaterT ◦C U10 m s−1
Martensson et al. (2003) Tank 5 to 25 –Clarke et al. (2006) Surf zone ∼ 25 7.3± 1.1de Leeuw et al. (2000) Surf zone 13 to18 0 to 9This study Open ocean 9 to 11.2 7 to 15
the plume andu∗:
dFp
dR80=
(dN
dR80
)u∗. (4)
The production fluxes for each deployment are shown inFig. 8, along with production fluxes from MN03, Clarke etal. (2006), and de Leeuw et al. (2000). Conditions for boththis and the 3 previous studies are summarised in Table 2.For particles smaller than about 1–2 µm, the SEASAW pro-duction fluxes show an increasing trend with wind speed.At U10= 7 m s−1 the production flux is only slightly higherthan that of Clarke et al. (2006), increasing to a factor of 6–7higher at winds of 14–15 m s−1, but the spectra have a similarslope to those of both Clarke et al. (2006) and de Leeuw etal. (2000). They decrease more rapidly with increasing par-ticle size forR80> 1 µm, and for particles withR80> 2 µmthe production flux falls below those of the previous stud-ies. For these largest particles there is no distinct trend withwind speed. Sea spray source functions based on whitecapfraction usually assume that the production flux is a con-stant, unaffected by wind speed or the consequent wave state.Here we find both a distinct increase in the total productionflux with increasing wind speed, and a change in the shapeof the production flux spectra, which steepens with increas-ing wind speed. Variability in the production flux with windspeed makes physical sense, because the volume of air en-trained and depth to which it is injected into the water columnwill both increase as the size of breaking waves increases.
It is difficult to relate the wind-speed dependence of theproduction flux directly to the bubble spectra because of thetime-averaged nature of the bubble measurements. We note,however, that an increase in production of smaller particlesis consistent with an increase in the total volume of air en-trained by a breaking wave and consequent increase in thenumber of large bubbles that rise rapidly to the surface andburst, since these bubbles generate small film drops. Thelarger aerosols resulting from jet drops are generated by bub-bles smaller than about 1 mm (Lewis and Schwartz, 2004);the vast majority of these bubbles are smaller than∼ 250 µmand will tend to remain within the water column. It is notobvious that an increase in the volume of air entrained by abreaking wave will necessarily result in more small bubblescontributing to the short-duration peak in aerosol measured
Fig. 8.The mean production flux per unit area of whitecap for eachdeployment. The production flux functions from previous studiesutilizing similar methods are also shown for comparison. The pinkshaded area shows the range of the production fluxes estimated byde Leeuw et al. (2000) for a range of wind speeds between 0 and9 m s−1. The error estimate for the estimated production flux is thesame for all the SEASAW deployments: 38.5 %.
directly over an active whitecap. We might, however, expectan increase in the number of small bubbles reaching the sur-face and bursting over time within the residual foam left af-ter a breaking wave, but these would not be identified by ourmeasurement of the production flux over an active whitecap.
Similar reasoning offers a possible explanation for the dif-ferences between the production flux spectra here and thosefrom surf zone studies where the wave breaking process, bub-ble populations, and bubble plume dynamics are all differentfrom the open ocean case. De Leeuw et al. (2000) estimatedthe flux from the difference in aerosol concentration on ei-ther side of the surf zone under onshore winds, and assumedthat production took place throughout the full width of thesurf zone. Their production flux is thus an average over ac-tive breakers, residual foam between breaking waves, andany foam-free water within the surf zone, and this is likelyto be lower than the production flux from actively breakingwhitecaps. Clarke et al. (2006) adopted an approach similarto that used here, isolating broad peaks in the aerosol con-centration measured upwind of the surf zone, and associatingit with individual breaking waves and the residual foam be-hind them. They estimated the foam fraction between break-ing waves and scaled the production flux accordingly. Theirproduction flux is thus an average for active whitecaps andresidual foam, and is slightly higher than that of de Leeuwet al. (2000), but again will be lower than that for activewhitecaps only. These differences in averaging of source ar-eas can plausibly explain the differences in production flux
Ocean Sci., 9, 133–145, 2013 www.ocean-sci.net/9/133/2013/
S. J. Norris et al.: Near-surface measurements of sea spray aerosol production 141
for the smaller aerosol, but not the steeper drop-off with sizeand lower flux obtained here for large particles. We specu-late that this may result from differences in wave and bub-ble plume dynamics between the open ocean and surf zone.The large particles are generated from jet drops, the majorityof which result from bubbles small enough to remain withinthe water column for an extended period of time. In the surfzone, the shallow water column, high turbulence intensity,and more frequent repeated wave breaking mean that thesebubbles may be forced back to the surface much more rapidlythan in the open ocean, enhancing the production of jet dropsand large aerosol. We note that forR80> 2 µm our produc-tion flux matches that of Martensson et al. (2003) and thattheir laboratory bubble spectra match our open ocean spectrafor the relevant size range,R < 50 µm.
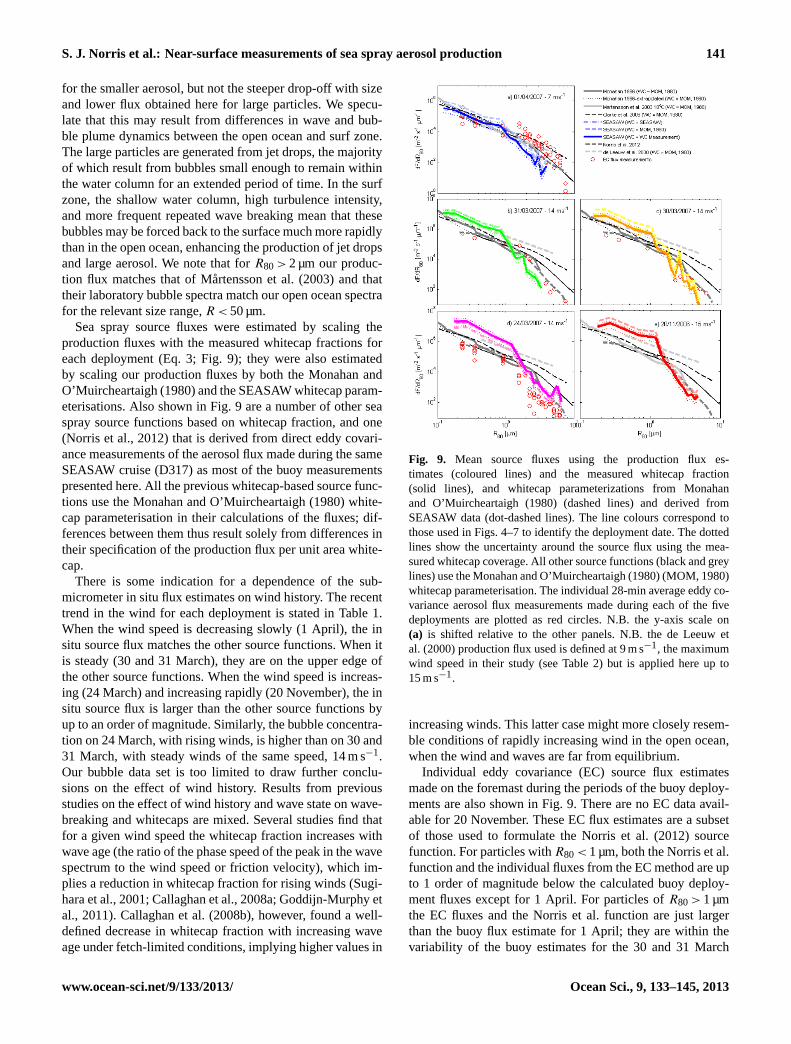
Sea spray source fluxes were estimated by scaling theproduction fluxes with the measured whitecap fractions foreach deployment (Eq. 3; Fig. 9); they were also estimatedby scaling our production fluxes by both the Monahan andO’Muircheartaigh (1980) and the SEASAW whitecap param-eterisations. Also shown in Fig. 9 are a number of other seaspray source functions based on whitecap fraction, and one(Norris et al., 2012) that is derived from direct eddy covari-ance measurements of the aerosol flux made during the sameSEASAW cruise (D317) as most of the buoy measurementspresented here. All the previous whitecap-based source func-tions use the Monahan and O’Muircheartaigh (1980) white-cap parameterisation in their calculations of the fluxes; dif-ferences between them thus result solely from differences intheir specification of the production flux per unit area white-cap.
There is some indication for a dependence of the sub-micrometer in situ flux estimates on wind history. The recenttrend in the wind for each deployment is stated in Table 1.When the wind speed is decreasing slowly (1 April), the insitu source flux matches the other source functions. When itis steady (30 and 31 March), they are on the upper edge ofthe other source functions. When the wind speed is increas-ing (24 March) and increasing rapidly (20 November), the insitu source flux is larger than the other source functions byup to an order of magnitude. Similarly, the bubble concentra-tion on 24 March, with rising winds, is higher than on 30 and31 March, with steady winds of the same speed, 14 m s−1.Our bubble data set is too limited to draw further conclu-sions on the effect of wind history. Results from previousstudies on the effect of wind history and wave state on wave-breaking and whitecaps are mixed. Several studies find thatfor a given wind speed the whitecap fraction increases withwave age (the ratio of the phase speed of the peak in the wavespectrum to the wind speed or friction velocity), which im-plies a reduction in whitecap fraction for rising winds (Sugi-hara et al., 2001; Callaghan et al., 2008a; Goddijn-Murphy etal., 2011). Callaghan et al. (2008b), however, found a well-defined decrease in whitecap fraction with increasing waveage under fetch-limited conditions, implying higher values in
Fig. 9. Mean source fluxes using the production flux es-timates (coloured lines) and the measured whitecap fraction(solid lines), and whitecap parameterizations from Monahanand O’Muircheartaigh (1980) (dashed lines) and derived fromSEASAW data (dot-dashed lines). The line colours correspond tothose used in Figs. 4–7 to identify the deployment date. The dottedlines show the uncertainty around the source flux using the mea-sured whitecap coverage. All other source functions (black and greylines) use the Monahan and O’Muircheartaigh (1980) (MOM, 1980)whitecap parameterisation. The individual 28-min average eddy co-variance aerosol flux measurements made during each of the fivedeployments are plotted as red circles. N.B. the y-axis scale on(a) is shifted relative to the other panels. N.B. the de Leeuw etal. (2000) production flux used is defined at 9 m s−1, the maximumwind speed in their study (see Table 2) but is applied here up to15 m s−1.
increasing winds. This latter case might more closely resem-ble conditions of rapidly increasing wind in the open ocean,when the wind and waves are far from equilibrium.
Individual eddy covariance (EC) source flux estimatesmade on the foremast during the periods of the buoy deploy-ments are also shown in Fig. 9. There are no EC data avail-able for 20 November. These EC flux estimates are a subsetof those used to formulate the Norris et al. (2012) sourcefunction. For particles withR80< 1 µm, both the Norris et al.function and the individual fluxes from the EC method are upto 1 order of magnitude below the calculated buoy deploy-ment fluxes except for 1 April. For particles ofR80> 1 µmthe EC fluxes and the Norris et al. function are just largerthan the buoy flux estimate for 1 April; they are within thevariability of the buoy estimates for the 30 and 31 March
www.ocean-sci.net/9/133/2013/ Ocean Sci., 9, 133–145, 2013

142 S. J. Norris et al.: Near-surface measurements of sea spray aerosol production
deployments; but for the 24 March deployment, all the in-dividual EC measurements are lower than any of the othersource fluxes. For the lowest wind speed deployment on 1April, the individual EC fluxes scatter across the full rangeof the various source functions. Note that the EC estimates,Norris et al. (2012) and both de Leeuw et al. (2000) andClarke et al. (2006) are effective fluxes at the measurementheight, while all others in Fig. 9 are interfacial fluxes; how-ever, forR80< 10 µm interfacial and effective source fluxesdiffer little and are often assumed to be directly comparable(de Leeuw et al., 2011).
4 Conclusions
Sea spray source fluxes have been estimated from joint in situmeasurements of the aerosol produced by individual white-caps and the fractional coverage of whitecaps in the openocean of the North Atlantic. Near-surface measurements ofaerosol size spectra were made at 1 m above the sea sur-face from a small tethered buoy, and mean production fluxesestimated per unit area of whitecap. The mean sea spraysource flux was then estimated by scaling the whitecap pro-duction flux with the observed whitecap fraction. The lim-ited range of wind speeds encountered during the buoy de-ployments precludes developing a full sea spray source func-tion; however, the results are instructive. Sea spray sourcefluxes were also estimated by scaling the production fluxwith two parameterizations of whitecap fraction: Monahanand O’Muircheartaigh (1980) – the most widely used pa-rameterization – and one derived from measurements madeduring the SEASAW cruises. The in situ whitecap frac-tion estimates were very scattered, but in general they, andthe parameterization derived from the full set of SEASAWwhitecap imagery, agree closely with the parameterizationof Callaghan et al. (2008b); all of these are significantlylower than the widely used parameterization of Monahan andO’Muircheartaigh (1980).
Bubble size spectra were measured approximately 0.4 mbelow the surface from the same buoy as the aerosol. Thebubble spectra are comparable to previous measurements inthe open ocean, and 2–3 orders of magnitude lower thanmeasurements in the surf zone. Note, however, that both ourand the previous open ocean measurements cited are timeaverages, more representative of the persistent backgroundbubble population resulting from wave breaking than of thepopulations within actively breaking waves. The surf zonemeasurements include both time-averaged and active breakerbubble spectra; direct comparisons between the two are thusdifficult, and some caution should be employed when at-tempting to infer relationships with aerosol production. Themeasured bubble concentrations increased with wind speed.
The aerosol production flux per unit area of whitecap de-rived from mean particle spectra was found to vary withwind speed. For particles withR80< ∼ 1–2 µm, the produc-
tion flux increased with wind speed, while for larger par-ticles there was no clear dependence. The production fluxdecreased more rapidly with particle size than those of ear-lier studies. This behaviour is consistent with the observedoverall increase in bubble concentrations with wind speed,and implies that a simple single aerosol production flux can-not be defined and scaled by whitecap fraction to determinethe mean sea spray source flux. Previous source functionsadopting this approach have generally defined a single pro-duction flux, often from relatively limited ranges of forcingconditions and none representative of open ocean conditions.Clarke et al. (2006) used surf zone measurements at a singlewind speed. De Leeuw et al. (2000) do define a wind-speed–dependent function valid up to 9 m s−1, but since the mea-surements are from the surf zone, the physics of the wavebreaking is rather different from that in the open ocean.
The mean source flux estimates reflect the productionflux results: forR80< 1 µm the flux spectra span the val-ues from previous studies (Monahan et al., 1986; de Leeuwet al., 2000; Martensson et al., 2003; Clarke et al., 2006),but decrease more rapidly with increasing size for largerparticles. The mean source flux estimates and the EC flux-derived source function of Norris et al. (2012) all decreasemore rapidly with increasing particle size than the surfzone functions. This supports the suggestion (Lewis andSchwartz, 2004) that the surf zone is not representative ofopen ocean whitecapping processes, bubble populations, andaerosol production, since the wave breaking process and bub-ble plume dynamics are very different for the open ocean andsurf zone.
Acknowledgements.SEASAW was funded by the UK NaturalEnvironment Research Council, grant number NE/C001842/1as part of UK-SOLAS. We would like to thank Captain RogerChamberlain and the crew of the RRSDiscovery, and Dan Comben,Chris Barnard, Martin Bridger and Leighton Rolley of the NationalFacilities Sea Systems for their assistance during the cruises.Contributions by G. de Leeuw are supported by the ESA STSEproject Oceanflux Sea Spray Aerosol.
Edited by: A. Sterl
References
Andreas, E. L.: A review of the sea spray generation function forthe open ocean, in: Atmosphere-Ocean Interactions, edited by:W. Perrie, 1, 1–46, WIT Press, Southampton, UK, 2002.
Andreas, E. L., Jones, K. F., and Fairall C. W.: Production ve-locity of sea spray droplets, J. Geophys. Res., 115, C12065,doi:10.1029/2010JC006458, 2010.
Anguelova, M. D. and Webster, F.,: Whitecap coverage fromsatellite measurements: A first step toward modelling the vari-ability of oceanic whitecaps, J. Geophys. Res., 111, C03017,doi:10.1029/2005JC003158, 2006.
Ocean Sci., 9, 133–145, 2013 www.ocean-sci.net/9/133/2013/

S. J. Norris et al.: Near-surface measurements of sea spray aerosol production 143
Blanchard, D. C.: The electrification of the atmosphere by particlesfrom bubbles in the sea, Prog. Oceanogr., 1, 171–202, 1963.
Blanchard, D. C.: The oceanic production rate of cloud nuclei, J.Res.-Atmos., 4, 1–6, 1969.
Blanchard, D. C.: The Production, Distribution, and Bacterial En-richment of the Sea-Salt Aerosol, Air-Sea Exchange of Gasesand Particles, edited by: Slinn, W. G. N. and Liss, P. S., KluwerAcademic Publishers, 1983.
Blanchard, D. C.: Surface-active monolayers, bubbles and jet drops,Tellus B, 42, 200–205, 1990.
Blanchard, D. C. and Woodcock, A.: Bubble formation and modi-fication in the sea and its meteorological significance, Tellus, 9,145–158, 1957.
Bourassa, M. A., Vincent, D. G., and Wood, W. L.: A Sea State Pa-rameterization with Nonarbitrary Wave Age Applicable to Lowand Moderate Wind Speeds, J. Phys. Oceanogr., 31, 2840–2851,2001.
Brooks, I. M., Yelland, M. J., Upstill-Goddard, R. C., Nightingale,P. D., Archer, S., d’Asaro, E., Beale, R., Beatty, C., Blomquist,B., Bloom, A. A., Brooks, B. J., Cluderay, J., Coles, D., Dacey,J., DeGrandpre, M., Dixon, J., Drennan, W. M., Gabriele, J.,Goldson, L., Hardman-Mountford, N., Hill, M. K., Horn, M.,Hsueh, P.-C., Huebert, B., de Leeuw, G., Leighton, T. G., Lid-dicoat, M., Lingard, J. J. N., McNeil, C., McQuaid, J. B., Moat,B. I., Moore, G., Neill, C., Norris, S. J., O’Doherty, S., Pas-cal, R. W., Prytherch, J., Rebozo, M., Sahlee, E., Salter, M.,Schuster, U., Skjelvan, I., Slagter, H., Smith, M. H., Smith, P.D., Srokosz, M., Stephens, J. A., Taylor, P. K., Telszewski, M.,Walsh, R., Ward, B., Woolf, D. K., Young, D., and Zemmelink,H.: Physical Exchanges at the Air-Sea Interface: Field Measure-ments from UK-SOLAS, B. Am. Meteorol. Soc., 90, 629–644,doi:10.1175/2008BAMS2578.1, 2009a.
Brooks, I. M., Yelland, M. J., Upstill-Goddard, R. C., Nightingale,P. D., Archer, S., d’Asaro, E., Beale, R., Beatty, C., Blomquist,B., Bloom, A. A., Brooks, B. J., Cluderay, J., Coles, D., Dacey,J., DeGrandpre, M., Dixon, J., Drennan, W. M., Gabriele, J.,Goldson, L., Hardman-Mountford, N., Hill, M. K., Horn, M.,Hsueh, P.-C., Huebert, B., de Leeuw, G., Leighton, T. G., Lid-dicoat, M., Lingard, J. J. N., McNeil, C., McQuaid, J. B., Moat,B. I., Moore, G., Neill, C., Norris, S. J., O’Doherty, S., Pas-cal, R. W., Prytherch, J., Rebozo, M., Sahlee, E., Salter, M.,Schuster, U., Skjelvan, I., Slagter, H., Smith, M. H., Smith, P.D., Srokosz, M., Stephens, J. A., Taylor, P. K., Telszewski, M.,Walsh, R., Ward, B., Woolf, D. K., Young, D., and Zemmelink,H.: UK-SOLAS Field Measurements of Air-Sea Exchange: In-strumentation, B. Am. Meteorol. Soc., 90, Supplement, 9–16,doi:10.1175/2008BAMS2578.2, 2009b.
Callaghan, A. H. and White, M.: Automated processing of sea sur-face images for the determination of whitecap coverage, J. At-mos. Ocean. Tech., 26, 383–394. 2009.
Callaghan, A. H., de Leeuw, G., Cohen, L., and O’Dowd,C. D.: Relationship of oceanic whitecap coverage to windspeed and wind history, Geophys. Res. Lett., 35, L23609,doi:10.1029/2008GL036165, 2008a.
Callaghan, A. H., Deane, G. B., and Stokes, M. D.: Observed phys-ical and environmental causes of scatter in whitecap coveragevalues in a fetch-limited coastal zone, J. Geophys. Res., 113,C05022,doi:10.1029/2007JC004453, 2008b.
Cipriano, R. J., Blanchard, D. C., Hogan, A. W., and Lala, G. G.: Onthe production of Aitken nuclei from breaking waves and theirrole in the atmosphere, J. Atmos. Sci., 40, 469–479, 1983.
Cipriano, R. J., Monahan, E. C., Bowyer, P. A., and Woolf, D. K.:Marine condensation nucleus generation inferred from whitecapsimulation tank results, J. Geophys. Res., 92, 6569–6576, 1987.
Clarke, A. D., Owens, S. R., and Zhou, J.: An ultra fine sea–saltflux from breaking wave: Implications for cloud condensationnuclei in the remote marine atmosphere, J. Geophys. Res., 111,D06202,doi:10.1029/2005JD006565, 2006.
Day, J. A.: Production of droplets and salt nuclei by the bursting ofair bubble films, Q. J. Roy. Meteor. Soc., 90, 72–78, 1964.
Deane, G. B. and Stokes, M. D.: Air entrainment processes and bub-ble size distributions in the surf zone, J. Phys. Oceanogr., 29,1393–1403, 1999.
de Leeuw, G.: The occurrence of large salt-water droplets at low-elevations over the open ocean, in: The Climate and HealthImplications of Bubble-Mediated Air-Sea Exchange, edited by:Monahan, E. C. and Van Patten, M. A., 65–82, Connecticut SeaGrant College Program CT-SG-89-06, 1989.
de Leeuw, G. and Cohen, L. H.: Bubble size distributions on theNorth Atlantic and the North Sea in Gas Transfer and water Sur-faces, edited by: Donelan, M. A., Drennan, W. M., Salzman, E.S., and Wanninkhof, R., 271–277, AGU, 2001.
de Leeuw, G., Neele, F. P., Hill, M., Smith, M. H., and Vignati,E.,: Production of sea spray aerosol in the surf zone, J. Geophys.Res., 105, 29397–29409, 2000.
de Leeuw, G., Moerman, M., Cohen, L., Brooks, B., Smith, M.,and Vignati, E.: Aerosols, bubbles and sea spray production stud-ies during the RED experiments, Proceedings AMS conference,Long Beach, CA, 9–13 February, 2003.
de Leeuw, G., Andreas, E. L., Anguelova, M. D., Fairall, C. W.,Lewis, E. R., O’Dowd, C., Schulz, M., and Schwartz S. E.: Pro-duction Flux of Sea-Spray Aerosol, Rev. Geophys., 49, RG2001,doi:10.1029/2010RG000349, 2011.
Facchini, M. C., Rinaldi, M., Decesari, S., Carbone, C., Finessi, E.,Mircea, M., Fuzzi, S., Ceburnis, D., Flannigan, R., Nilsson, E.D., de Leeuw, G., Martino, M., Woeltjen, J., and O’Dowd, C. D.:Primary submicron marine aerosol dominated by insoluble or-ganic colloids and aggregates, Geophys. Res. Lett., 35, L17814,doi:10.1029/2008GL034210, 2008.
Farmer, D. M. and Vagil, S.: Waveguide propagation of ambientsound in the ocean-surface bubble layer. J. Acoust. Soc. Am., 86,1897–1908,doi:10.1121/1.398568, 1989.
Fuentes, E., Coe, H., Green, D., de Leeuw, G., and McFiggans,G.: Laboratory-generated primary marine aerosol via bubble-bursting and atomization, Atmos. Meas. Tech., 3, 141–162,doi:10.5194/amt-3-141-2010, 2010.
Georgescu, S.-C., Achard, J., and Canot, E.: Jet drops ejection inbursting gas bubble processes, Eur. J. Mech. B-Fluid., 21, 265–280, 2002.
Gerber, H. E.: Relative-humidity parameterization of the navyaerosol model (NAM), Report No. NRL Report 8956, 17 pp.,Navel Research Laboratory, Washington, DC, 1985.
Goddijn-Murphy, L., Woolf, D., and Callaghan, A. H.: Param-eterizations and Algorithms for Oceanic Whitecaps, J. Phys.Oceanogr., 41, 741–756, 2011.
Haywood, J. M., Ramaswamy, V., and Soden, B. J.: TroposphericAerosol Climate Forcing in Clear-Sky Satellite Observations
www.ocean-sci.net/9/133/2013/ Ocean Sci., 9, 133–145, 2013

144 S. J. Norris et al.: Near-surface measurements of sea spray aerosol production
over the Ocean, Science, 283, 1299–1303, 1999.Hill, M. K., Brooks, B. J., Norris, S. J., Smith, M. H., Brooks, I.
M., de Leeuw, G., and Lingard, J. J. N.: A Compact LightweightAerosol Spectrometer Probe (CLASP), J. Atmos. Ocean. Tech.,25, 1996–2006,doi:10.1175/2008JTECHA1051.1, 2008.
Holliday, N. P., Yelland, M. J., Pascal, R. W., Swail, V. R., Taylor, P.K., Griffiths, C. R., and Kent, E. C.: Were extreme waves in theRockall Trough the largest ever recorded?, Geophys. Res. Lett.,33, L05613,doi:10.1029/2005GL025238, 2006.
Hoppel, W. A., Frick, G. M., and Fitzgerald, J. W.: The SurfaceSource Function for Sea-Salt Aerosol and Aerosol Dry Deposi-tion to the Ocean Surface, J. Geophys. Res., 107, 4382–4399,2002.
Horst, T. W. and Weil, J. C.: Footprint Estimation for Scalar FluxMeasurements in the Atmospheric Surface Layer, Bound.-Lay.Meteorol., 59, 279–296, 1992.
Hultin, K. A. H., Nilsson, E. D., Krejci, R., Martensson, M., Ehn,M., Hagstrom,A., and de Leeuw, G.,: In situ laboratory sea sprayproduction during the Marine Aerosol Production 2006 cruise onthe northeastern Atlantic Ocean, J. Geophys. Res., 115, D06201,doi:10.1029/2009JD012522, 2010.
Johnson, B. D. and Wangersky, P. J.: Microbubbles: Stabilization bymonolayers of adsorbed particles, J. Geophys. Res., 92, 14641–14647, 1987.
Keene, W. C., Maring, H., Maben, J. R., Kieber, D. J., Pszenny,A. A. P., Dahl, E. E., Izaguirre, M. A., Davis, A. J., Long, M.S., Zhou, X., Smoydzin, L, and Sander, R.: Chemical and physi-cal characteristics of nascent aerosols produced by bursting bub-bles at a model air sea interface, J. Geophys. Res., 112, D21202,doi:10.1029/2007JD008464, 2007.
Kolovayev, P. A.: Investigation of the concentration and statisticalsize distribution of wind-produced bubbles in the near-surfaceocean layer, Oceanology, 15, 659–661, 1976.
Leifer, I., Patro, R. K., and Bowyer, P.: A study on the tempera-ture variation of rise velocity for large clean bubbles, J. Atmos.Ocean. Tech., 17, 1392–1402, 2000.
Leifer, I., de Leeuw, G., and Cohen, L. H.: Optical Measurementof Bubbles: System Design and Application. J. Atmos. Ocean.Tech., 20, 1317–1332, 2003a.
Leifer, I., de Leeuw, G., Kunz, G., and Cohen, L. H.: Calibratingoptical bubble size by the displaced mass method, Chem. Eng.Sci., 58, 5211–5216, 2003b.
Leifer, I., Caulliez, G., and de Leeuw, G.: Bubbles generatedfrom wind-steepened breaking waves: 2. Bubble plumes, bub-bles, and wave characteristics, J. Geophys. Res., 111, C06021,doi:101029/2004JC002676 2006.
Leighton, T. G. and Robb, G. B. N.,: Preliminary mapping of voidfractions and sound speeds in gassy marine sediments from sub-bottom profiles, J. Acoust. Soc. Am., 124, EL313–EL320, 2008.
Lewis, E. R. and Schwartz, S. E.,: Sea Salt Aerosol Production –Mechanisms, Methods, Measurements, and Models, AmericanGeophysical Union, 2004.
Martensson, E. M., Nilsson, E. D., de Leeuw, G., Cohen, L. H., andHansson, H. C.: Laboratory simulations and parameterization ofthe primary marine aerosol production, J. Geophys. Res., 108,4297, 2003.
Medwin, H.: In situ acoustic measurements of bubble populationsin coastal waters, J. Geophys. Res., 75, 599–611, 1970.
Monahan, E. C.: Sea Spray as a function of low elevation windspeed, J. Geophys. Res., 73, 1127–1137, 1968.
Monahan, E. C.: Oceanic whitecaps, J. Phys. Oceanogr., 1, 139–144, 1971.
Monahan, E. C. and Lu, M., : Acoustically relevant bubble assem-blages and their dependence on meteorological parameters, IEEEJ. Oceanic Eng., 15, 340–349, 1990.
Monahan, E. C. and O’Muircheartaigh, I.: Optimal Power-Law De-scription of Oceanic Whitecap Coverage Dependence on WindSpeed, J. Phys. Oceanogr., 10, 2094–2099, 1980.
Monahan, E. C. and O’Muircheartaigh, I.: Review Article: White-caps and the Passive Remote Sensing of the Ocean Surface, Int.J. Remote Sens., 7, 627–642, 1986.
Monahan, E. C., Spiel, D. E., and Davidson, K. L.,: Whitecapaerosol productivity deduced from simulation tank measure-ments, J. Geophys. Res., 87, 8898–8904, 1982.
Monahan, E. C., Spiel, D. E., and Davidson, K. L.: A model ofmarine aerosol generation via whitecaps and wave disruption, in:Oceanic Whitecaps, edited by: Monahan, E. C. and Mac Niocaill,G. D., Reidel Publishing Company, 167–174, 1986.
Morelli, J., Buat-Menard, P., and Chesselet, R.,: Production experi-mentale d’aerosols a la surface de la mer, J. Res.-Atmos., 8, 961–986, 1974.
Norris, S. J., Brooks, I. M., de Leeuw, G., Sirevaag, A., Leck, C.,Brooks, B. J., Birch, C. E., and Tjernstrom, M.: Measurements ofbubble size spectra within leads in the Arctic summer pack ice,Ocean Sci., 7, 129–139,doi:10.5194/os-7-129-2011, 2011.
Norris, S. J., Brooks, I. M., Hill, M. K., Brooks, B. J., Smith, M. H.,and Sproson, D. A. J.: Eddy Covariance Measurements of theSea Spray Aerosol Flux over the Open Ocean, J. Geophys. Res.,117, D07210,doi:10.1029/2011JD016549, 2012.
O’Dowd, C. D., Lowe, J. A., and Smith, M. H.,.: Coupling of sea-salt and sulphate interactions and its impact on cloud droplet con-centration predictions, Geophy. Res. Lett., 26, 1311–1314, 1999.
O’Dowd, C. D., Lowe, J. A., Clegg, N., Smith, M. H., and Clegg,S. L.: Modelling heterogeneous sulphate production in maritimestraiform clouds. J. Geophys. Res., 105, 7143–7160, 2000.
Pascal, R. W., Yelland, M. J., Srokosz, M. A., Moat, B. I., Waugh,E. M., Comben, D. H., Clansdale, A. G., Hartman, M. C., Coles,D. G. H., Ping-Chang Hsueh, and Leighton, T. G.: A spar buoyfor high frequency wave measurements and detection of wavebreaking in the open ocean, J. Atmos. Ocean. Tech., 28, 590–605, 2011.
Parameswaran, K.: Influence of micrometeorological features oncoastal boundary layer aerosol characteristics at the tropical sta-tion, Trivandrum, J. Earth Syst. Sci., 110, 247–265, 2001.
Phelps, A. D. and Leighton, T. G.,: Oceanic bubble population mea-surements using a buoy-deployed combination frequency tech-nique, IEEE J. Oceanic Eng., 23, 400–410, 1998.
Phelps, A. D., Ramble, D. G., and Leighton, T. G.: The use of acombination frequency technique to measure the surf zone bub-ble population, J. Acoust. Soc. Am., 101, 1981–1989, 1997.
Pui, D. Y. H., Romay-Novas, F., and Lui, B. Y. H.: Experimentalstudy of particle deposition in bends of circular cross section,Aerosol Sci. Tech., 7, 301–315, 1987.
Sellegri, K., O’Dowd, C. D., Yoon, Y. J., Jennings, S. G., and deLeeuw. G.,: Surfactants and submicron sea spray generation, J.Geophys. Res., 111, D22215,doi:10.1029/2005JD006658, 2006.
Ocean Sci., 9, 133–145, 2013 www.ocean-sci.net/9/133/2013/

S. J. Norris et al.: Near-surface measurements of sea spray aerosol production 145
Spiel, D. E.: A study of aerosols generated in a whitecap simulationtank, BDM Tech, Rep. 006-83, Monterey, 35 pp., 1983.
Spiel, D. E.: The sizes of the jet drops produced by air bubbles burst-ing on sea and fresh-water surfaces, Tellus B, 46, 325–338, 1994.
Spiel, D. E.: A hypothesis concerning the peak in film drop produc-tion as a function of bubble size. J. Geophys. Res., 102, 1153–1161, 1997.
Sugihara, Y. H., Tsumori, T., Ohga, T., Yoshioka, H., and Serizava,S.: Variation of whitecap coverage with wave-field conditions, J.Marine Syst., 66, 47–60, 2007.
Tucker, M. J. and Pitt, E. G.,.: Waves in Ocean Engineering, OceanEng. Book Ser., 5, Elsevier, New York, 521 pp., 2001.
Tyree, C. A., Hellion, V. M., Alexandrova, O. A., and Allen, J. O.:Foam droplets generated from natural and artificial seawaters, J.Geophys. Res., 112, D12204,doi:10.1029/2006JD007729, 2007.
Wettlaufer, G.: Introduction to crystallization phenomena in naturaland artificial sea ice, in: The Physics of ice covered seas, editedby: Lepparanta, M., Univ. of Helsinki, Helsinki, 105–195, 1998.
Woodcock, A. H., Blanchard, D. C., and Rooth, C. G. H.: Salt-induced convection and clouds, J. Atmos. Sci., 20, 159–169,1963.
Woolf, D. K., Monahan, E. C., and Spiel, D. E.,: Quantification ofthe marine aerosol produced by whitecaps, in: Seventh Congresson Ocean – Atmosphere Interaction, 182–185, American Meteo-rological Society, Anaheim, CA, 1988.
Wu, J.: Production of spume drops by the wind tearing of wavecrests: The search for quantification, J. Geophys. Res., 98,18221–18227, 1993.
Wu, J., Murray, J. J., and Lai, R. J.: Production and distributions ofsea spray, J. Geophys. Res., 89, 8163–8169, 1984.
Zabori, J., Krejci, R., Ekman, A. M. L., Martensson, E. M.,Strom, J., de Leeuw, G., and Nilsson, E. D.: Winter-time Arctic Ocean sea water properties and primary marineaerosol concentrations, Atmos. Chem. Phys., 12, 10405–10421,doi:10.5194/acp-12-10405-2012, 2012.
www.ocean-sci.net/9/133/2013/ Ocean Sci., 9, 133–145, 2013