UNIVERSITI PUTRA MALAYSIA THE HYPOGLYCAEMIC ACTIVITY...
25
UNIVERSITI PUTRA MALAYSIA THE HYPOGLYCAEMIC ACTIVITY OF MENGKUDU (MORINDA CITRIFOLIA) CHEE BENG JIN FSAS 2001 49
Transcript of UNIVERSITI PUTRA MALAYSIA THE HYPOGLYCAEMIC ACTIVITY...

UNIVERSITI PUTRA MALAYSIA
THE HYPOGLYCAEMIC ACTIVITY OF MENGKUDU (MORINDA CITRIFOLIA)
CHEE BENG JIN
FSAS 2001 49

THE HYPOGLYCAEMIC ACTIVITY OF MENGKUDU (MORINDA CITRIFOLIA)
By CHEE BENGJIN
Thesis Submitted to the School of Graduate Studies, Universiti Putra Malaysia, in Fulfilment of the Requirements for the Degree of Master of Science
November 2001

A Work, Dedicated to ...
My parents, brother and my beloved family members,
Relatives and friend s,
Brothers and sisters in Christ,
Diabetes research.
Worship the LORD your God, and his blessings will be on your food and water. I will take away sickness from among you.
Cbee Beng Jin Biology Department, Universiti Putra Malaysia, 43400 Serdang.
Exodus 23:25
2

Abstract of thesis presented to the Senate of Universiti Putra Malaysia in fulfilment of the requirement for the degree of Master of Science
THE HYPOGLYCAEMIC ACTIVITY OF MENGKUDU (MORINDA CITRIFOLIA)
By
CHEE BENG JIN
November 2001
Chairman: Associate Professor Hamdan Noor, Ph.D.
Faculty: Science and Environmental Studies
Diabetes mellitus has existed for at least 2000 years and has been treated with
materials derived from plants in many cultures of the world. The mengkudu
(Morinda cUrl/olia) are known for countless medicinal values and the ripe fruits
were being used traditionally in Malaysia for the treatment for diabetes mellitus. This
study was carried out to verify the hypoglycaemic property and its possible effect on
insulin secretion. Freeze-dried aqueous extracts of various doses of3mglkg, 30mglkg
and 300mglkg were administered to normal rats in an acute effect study and the
doses of 3mglkg, 3Omglkg, 300mglkg, 60Omglkg, 900mglkg and 1200mglkg were
administered to streptozotocin induced type 2 diabetic rats in a chronic effect study
in an Oral Glucose Tolerance Test (OGTI). Results from the choric effect study
showed that the 300mglkg dose treated rats had an apparent hypoglycaemic effect as
evident from the blood glucose level measured as the area under the OGTT curve
(AUe: 4370.70 ± 99.13 mgo/omin) after 6 weeks of oral administration.
Hypoglycaemic activity was also observed in the 600mglkg dose after 5 weeks of
oral administration (AUe: 4486.70 ± 35.60 mgo/omin), the 900mglkg dose after 4
weeks of oral administration (AUe: 4340.40 ± 72.90 mg%min) and the 1200mglkg
dose after 4 weeks of oral administration (AUe: 4554.00 ± 49.80 mg%min). All the
3

Ave values were significantly lower compared to control. The aqueous extracts
were also able' to impede the rate of glucose increase and enhance the glucose
clearance. However, the results from the insulin assay did not show any significant
change in the insulin release profile as compared to control. As a conclusion, the
aqueous extract of mengkudu (Morlnda eim/olia) fruit preparations in the doses of
30Omglkg, 6OOmg/kg, 90Omg/kg and 1200mglkg might contain plant compounds
that have substantial hypoglycemic property only in the chronic effect study but did
not affect the insulin secretion in the type 2 diabetic rats. Future studies should be
carried out in order to further discover its mechanisms of action, isolation and
identification of the hypoglycaemic components particularly with regard to the
healing of diabetes by means of plant resources.
4

Abstrak tesis yang dikemukakan kepada Senat Universiti Putra Malaysia sebagai memenulu keperluan untuk ijazah Master Sains
AKTIVITI HIPOGLISEMIK BUAH MENGKUDU (MORINDA CITRIFOLIA)
Oleh
CHEE BENG JIN
November 2001
Pengerusi: Profesor Madya Hamdan Noor, Ph.D.
Fakulti: Sains dan Pengajian Alam Sekitar
Penyakit diabetes mellitus telah dikesan semenjak 2000 tahun dahulu dan eara
rawatannya dengan menggunakan tumbuhan telah dikenalpasti di pelbagai
kebudayaan di merata dunia. Mengkudu (Morinda citrifolia) amat terkenal dengan
pelbagai nilai perubatan dan telah digunakan seeara tradisional untuk merawat
diabetes mellitus di Malaysia. Objektif eksperimen ini ialah untuk membuktikan
kesan bipoglisemik dan kesannya terhadap perembesan hormon insulin. Ekstrak buah
berakua yang telah disejukbekukan telah diberikan kepada tikus normal (3mglkg,
30mglkg dan 30Omglkg) untuk kajian kesan akut dan tikus diabetik jenis 2 (3mglkg,
30mglkg, 300mglkg, 60Omglkg, 9OOmg/kg dan 1200mg/kg) untuk kajian kesan
kronik di dalam Ujian Toleransi Glukosa. Keputusan kajian kesan kronik
menunjukkan bahawa tikus kajian yang diberikan dos 300mg/kg mempunyai aras
glukosa darah yang lebih rendah berdasarkan nilai keluasan dibawah graf (AUC:
4370.70 ± 99.13 mg%min) setelah rawatan oral selama 5 minggu. Kesan
bipoglisemik juga diperhatikan untuk dos 600mglkg selepas rawatan 5 minggu
(AUe: 4486.70 ± 35.60 mgo/omin), dos 900mg/kg selepas rawatan 4 minggu (AUC:
4340.40 ± 72.90 mg'l/omin) dan dos 1200mg/kg juga selepas 4 minggu rawatan
(AUe: 4554.00 ± 49.80 mgolomin). Kesemua nilai keluasan di bawah graf (AUC)
5
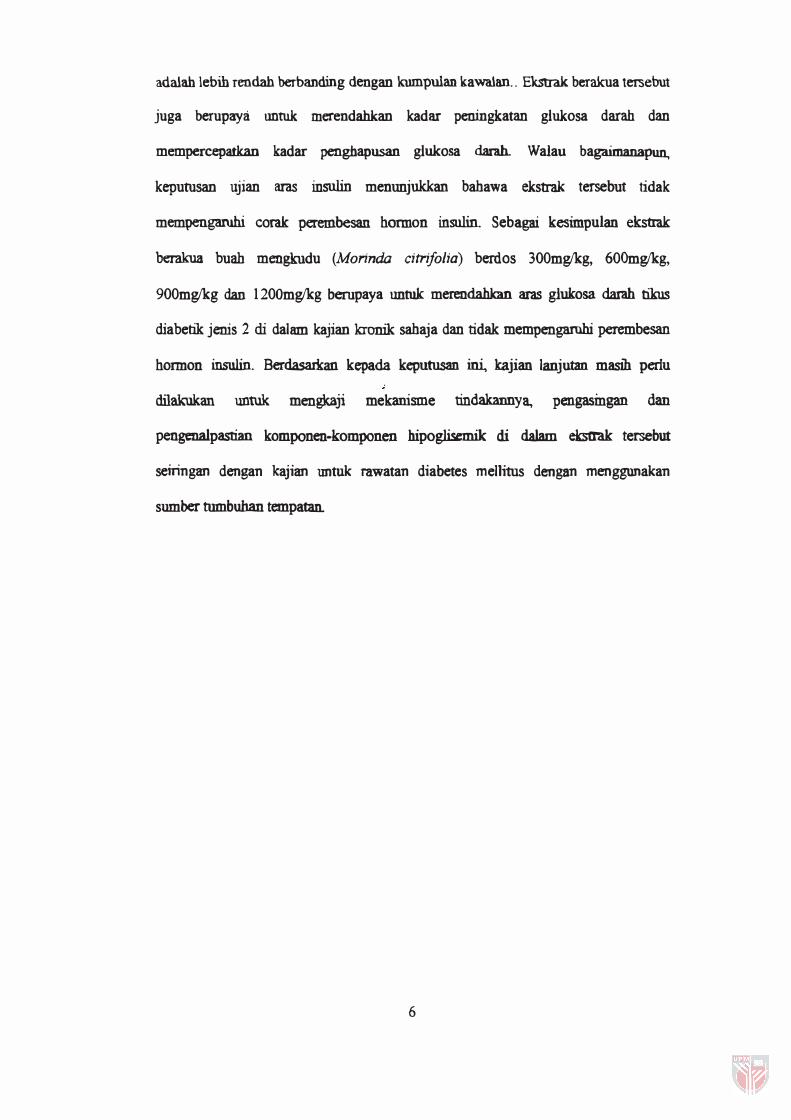
adalah lebih rendah berbanding dengan kumpulan kawalan .. Ekstrak berakua tersebut
juga berupaya untuk merendahkan kadar peningkatan glukosa darah dan
mempercepatkan kadar penghapusan glukosa d.arah. Walau bagairnanapun,
keputusan ujian am insulin menunjukkan bahawa ekstrak tersebut tidak
mempengaruhi corak perembesan harmon insulin. Sebagai kesimpulan ekstrak
berakua buah menglrudu (Monnda citrifolia) berdos 300mglkg, 60Omglkg,
900mglkg dan 1200mglkg berupaya untuk merendahkan aras glukosa darah tikus
diabetik jenis 2 di dalam kajian kronik sahaja dan tidak mempengarnhi perembesan
hormon insulin. Berdasarkan kepada keputusan iDL kajian lanjutan masih perlu
dilakukan untuk mengkaji mekanisme tindakannya, pengasmgan dan
pengenalpastian komponen-komponen bipoglisemik di da1am eksttak tersebut
seiringan dengan kajian 1D1tuk rawatan diabetes mellitus dengan menggunakan
sumber tumbuhan tempatan.
6

ACKNOWLEDGEMENTS
My sincere praises and thanksgiving to God Almighty for His tmfailing love and
grace in guiding me to complete my Master of Science project successfully.
I am very grateful to my supervisors. Associate Professor Dr. Hamdan Noor,
Associate Professor Dr. Umi Kalsom Yusuf and EnCk Zolkepli Othman.
Remembering you for your patience and assistance throughout my work.
My warmest gratitude to EnCk Haji Nordin Kassim for guiding and passing on your
experiences and advices on animal physiology experiments.
Last but not least, thanking my beloved family members, friends, Animal Physiology
T earn, all the academic and non-academic staff in the Biology Department.
The prayers, time, effort, energy and finances sacrificed throughout the years are
indeed a memorable event in my life. May God bless each one of you abundantly.
Amen.
7
I certify that an Examination Committee met on 5th November 2001 to conduct the fmal examination of Mr. Chee Beng Jin on his Master of Science thesis entitled "The Hypoglycaemic Activity of Mengkudu (Morinda citri/olia)" in accordance with Universiti Pertanian Malaysia (Higher Degree) Act 1980 and Universiti Pertanian Malaysia (Higher Degree) Regulations 1981. The Committee recommends that the candidates be awarded the relevant degree. Members of the Examination Committee are as follows:
ABDUL SALAM ABDULLAH, Ph.D. Professor, Faculty of Veterinary Medicine, Universiti Putra Malaysia. (Chairman)
HAMDAN NOOR, Ph.D. Associate Professor, Faculty of Science and Environmental Studies, Universiti Putra Malaysia. (Member)
UMI KALSOM YUSUF, Ph.D. Associate Professor, Faculty of Science and Environmental Studies, Universiti Putra Malaysia. (Member)
ZOLKEPLI OTHMAN, Faculty of Science and Environmental Studies, Universiti Putra Malaysia. (Member)
SHAMSHER MOHAMAD RAMADILI, Ph.D. Professor/Deputy Dean School of Graduate Studies Universiti Putra Malaysia
Date: 1 3 MAY 2002
8
The thesis submitted to the Senate of Universiti Putra Malaysia has been accepted as fulfilment of the requirement for the degree of Master Science.
9
AINI IDERIS, Ph.D. ProfessorlDean School of Graduate Studies Universiti Putra Malaysia
Date: t 3 JffM 2m?

DECLARATION
I hereby declare that the thesis is based on my original work except for quotations and citations which have been duly acknowledged. I also declare that it has not been previously or concurrently submitted for any other degree at UPM or other institutions
a:k=. Chee Beng Jin
Date: 13th May 2002
10

TABLE OF CONTENTS
Page DEDICATION ABSTRACT 3
5 7 8 10 11 l3 16 20
ABSTRAK ACKNOWLEDGEMENTS APPROVAL SHEETS DECLARATION FORMS TABLE OF CONTENTS LIST OF TABLES LIST OF FIGURES LIST OF ABBREVIATIONS
CHAPTER
1 INTRODUCTION 21
2 LITERATURE REVIEW
3
2.1 The Regulation of Blood Glucose Level 25 2.2 Diabetes Mellitus
2.2.1 Type 1 Diabetes Mellitus 28 2.2.2 Type 2 Diabetes Mellitus 30
2.2.3 Glibenclamide 31 2.3 Modem Treatment for Diabetes Mellitus and Side Effects 32 2.4 Plants with Hypoglycaemic Property 37 2.5 Hypoglycaemic Mechanism. of Plant Extract
2.5.1 Stimulation of Insulin Secretion 44 2.5.2 Reduction of Hepatic Glucose Output 47 2.5.3 Fiber in Blood Glucose Regulation 49 2.5.4 Insulin-1ike Compounds or Chemica1s 56 2.5.5 Other Proposed Mechanisms 58
2.6 Morinda cim/olia: A Plant of Many Uses 59 2.6.1 Traditional Use of M citrifolia 60 2.6.2 Scientific Research onM citri/olia 63 2.6.3 The Morinda citrifolia Plant as a Traditional
Cure for Diabetes 67
METHODOLOGY. 3.1 Type 2 Diabetic Rat Model 3.2 Plant Extract Preparation 3.3 Experimental Design. 3.4 Oral Glucose Tolerance Test (OOTT). 3.5 Blood Glucose Assay 3.6 Blood Insulin Assay
3.6.1 Insulin Hormone Level Test 3.7 Statistical Analysis
1 1
68 68 68 69 69 70 70 71

4 RESULTS 4. 1 Hypoglycaemic Studies
4. 1 . 1 Acute Effect Study (3mglkg, 3Omglkg, 300mglkg) 72 4. 1 .2 Chronic Effect Study
4. 1.2. 1 Aqueous Fruit Extract (3mlY'kg, 30mg1kg, 30Omglkg) 78
4. 1 .2.2 Aqueous Fruit Extract (6OOmglkg, 900mglkg, 120Omglkg) 94
4.1.3 Area Under Curves (AUCs) for Glucose Level (mgo/omin) 4. 1 .3. 1 Aqueous Fruit Extract (3mglkg, 3Omglkg,
30Omg/kg) 107 4.1 .3.2 Aqueous Fruit Extract (60Omglkg, 9OOmglkg,
1200mWkg) 113 4.2 Insulin Studies
4.2.1 Blood Insulin Level in Chronic Effect Study 4.2 .1 . 1 Aqueous Fruit Extract (3mg/kg, 3Omglkg,
300mglkg) 120 4.2. 1 .2 Aqueous Fruit Extract (60Omglkg, 9OOmg/kg,
1200mglkg) 127 4.2.2 Area Under Curves (AUCs) for Insulin Level (pg/mbnin)
4.2.2.1 Aqueous Fruit Extract (3mWlcg, 30mg1kg, 30Omg/kg) 135
4.2.2.2 Aqueous Fruit Extract (600mg/kg, 900mglkg, 120Omglkg) 138
4.3 Rate of Glucose Increase and Decrease 4.3. 1 Aqueous Fruit Extract (3mg/kg, 3Omg/kg, 300mg/kg) 141 4.3.2 Aqueous Fruit Extract (6OOmglkg, 900mglkg, 1200mglkg) 143
5 DISCUSSION 5.1 Experimental Animal and Blood Sampling 145 5.2 Type 2 Diabetic Model 1 46 5.3 Hypoglycaemic Property of the Aqueous Extracts 147 5.4 Effect of the Aqueous Extract on Insulin 153 5.5 Possible Hypoglycaemic Effect of Morindo citrifolia
Aqueous Extract 155
6 CONCLUSION 157
REFERENCES 1 60 APPENDICES 174 BIODATA OF THE AUTHOR 220
12

LIST OF TABLES
Table Page
1 The blood glucose level for different treatments (3mg1kg, 30mglkg and 30Omglkg) at different time intervals in the acute effect study 74
2 Area under glucose tolerance curves for different treatments (3mglkg. 30mg1kg and 300mg/kg) in the acute effect study 75
3 Rate of glucose increase for saline, glibenclamide, 3mglkg, 30mglkg and 300mglkg dose. 76
4 Rate of glucose decrease for saline, glibenclamide, 3mglkg, 30mglkg and 300mglkg dose. 77
5 Blood glucose levels for different treatments (3mglkg, 30mglkg and 300m.g/kg) at Trial I 80
6 Blood glucose levels for different treatments (3mglkg, 30mglkg and 300mglkg) at Trial 2 81
7 Blood glucose levels for different treatments (3mglkg, 30mglkg and 300mglkg) at Trial 3 82
8 Blood glucose levels for different treatments (3mglkg, 30mgikg and 300m.g/kg) at Week I 83
9 Blood glucose levels for different treatments (3mglkg, 30mglkg and 300mglkg) at Week 2 84
10 . Blood glucose levels for different treatments (3mg/kg, 3Omg/kg and 30Omglkg) at Week 3 85
11 Blood glucose levels for different treatments (3mglkg, 30mWkg and 300mg/kg) at Week 4 86
12 Blood glucose levels for different treatments (3mglkg, 30mglkg and 300mglkg) at Week 5 87
13 Blood glucose levels for different treatments (3mglkg, 30mWkg and 300mglkg) at Week 6 89
14 Blood glucose levels for different treatments (3mglkg. 30mglkg and 300mg/kg) at Week 7 90
15 Blood glucose levels for different treatments (3mg/kg, 3Omw'kg and 300mglkg) at Week 8 91
13

16 Blood glucose levels for different treatments (3mglkg, 3�glkg and 30Omg/kg) at Week 9 92
17 Blood glucose levels for different treatments (3mglkg, 30mglkg and 30Omg/kg) at Week 10 93
18 Blood glucose levels for different treatments (60Omglkg, 900mglkg and 1200 mglkg) at Trial 1 95
19 Blood glucose levels for different treatments (60Omglkg, 900mglkg and 1200 mglkg) at Trial 2 96
20 Blood glucose levels for different treatments (6OOmglkg, 900mglkg and 1200 mglkg) at Trial 3 97
21 Blood glucose levels for different treatments (60Omglkg, 9OOmg/kg and 1200 mg/kg) at Week 1 98
22 Blood glucose levels for different treatments (60Omg/kg, 900mglkg and 1200 mglkg) at Week 2 99
23 Blood glucose levels for different treatments (600mglkg, 900mglkg and 1200 mglkg) at Week 3 100
24 Blood glucose levels for different treatments (60Omglkg, 9OOmg/kg and 1200 mg/kg) at Week 4 102
25 Blood glucose levels for different treatments (60Omglkg, 9OOmg/kg and 1200 mg/kg) at Week 5 103
26 Blood glucose levels for different treatments (6OOmg;lkg, 900mglkg and 1200 mglkg) at Week 6 104
27 Blood glucose levels for different treatments (60Omglkg, 900mglkg and 1200 mglkg) at Week 7 105
28 Blood glucose levels for different treatments (600mg/kg, 900mglkg and 1200 mglkg) at Week 8 106
29 Area under glucose tolerance curves for different treatments (3mglkg, 30mglkg and 30Omg/kg) at different weeks 109
30 Area under glucose tolerance curves for different treatments (60Omglkg, 9OOmg/kg and 1200 mglkg) at different weeks 115
31 Blood insulin levels for different treatments (3mg;1kg, 30mglkg and 300mg/kg) at Week 5 122
32 Blood insulin levels for diffeIent treatments (3mglkg, 30mglkg and 30Omglkg) at Week 6 123
14
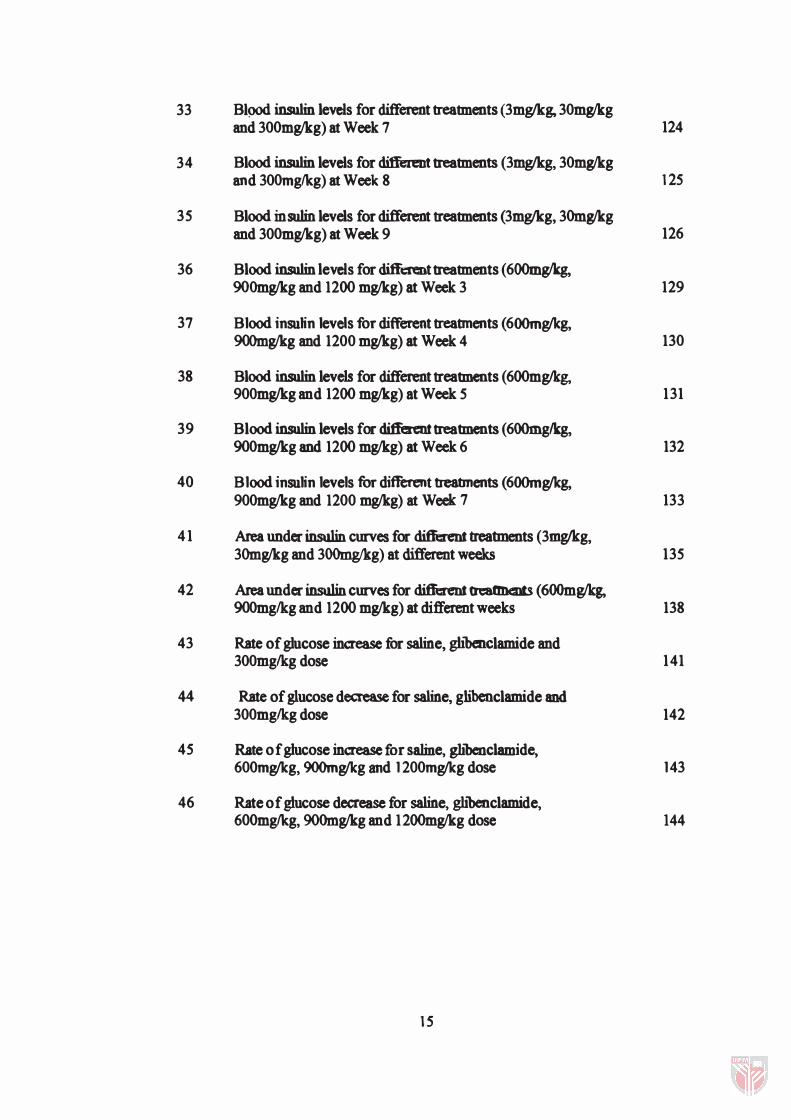
33 BI90d insulin levels for different treatments (3mglkg, 30mglkg and 30Omglkg) at Week 7 124
34 Blood insulin levels for diffelent treatments (3mglkg, 30mglkg and 30Omglkg) at Week 8 125
35 Blood insulin levels for different treatments (3mglkg, 30mglkg and 30Omglkg) at Week 9 126
36 Blood insulin levels for different treatments (600mglkg, 900mglkg and 1200 mglkg) at Week 3 129
37 Blood insulin leve1s for different treatments (600mglkg, 900mglkg and 1200 mglkg) at Week 4 130
38 Blood insulin levels for different treatments (600mglkg, 900mg/kg and 1200 mglkg) at Week 5 131
39 Blood insulin levels for different treatments (6OOmg/kg, 9OOmg/kg and 1200 mglkg) at Week 6 132
40 Blood insulin levels for different treatments (6OOmglkg, 900mglkg and 1200 mglkg) at Week 7 133
4 1 Area under insulin curves for different treatments (3m.g1kg, 30mglkg and 300mg/kg) at different weeks 135
42 Area under insulin curves for different treatments (6OOmg/kg, 9OOmg/kg and 1200 mglkg) at different weeks 138
43 Rate of glucose increase for saline, glibenclamide and 300m.glkg dose 141
44 Rate of glucose decrease for saline, glibenclamide and 300mglkg dose 142
45 Rate of glucose increase for saline, glibenclamide, 600mglkg, 900mglkg and 1 200mglkg dose 143
46 Rate of glucose decrease for saline, glibenclamide, 6OOmglkg, 900mglkg and 1200mglkg dose 144
15

LIST OF FIGURES
Figure Page
1 Blood glucose tolerance curves for different treatmmts (3mglkg, 30mglkg and 300mglkg) in acute effect study 74
2 Blood glucose tolerance curves for different treatments at Trial 1 (3mglkg, 30mglkg and 300mglkg) 80
3 Blood glucose tolerance curves for different treatments at Trial 2 (3mglkg, 30mglkg and 300mglkg) 81
4 Blood glucose tolerance curves for different treatments at Trial 3 (3mglkg, 30mglkg and 300mg/kg) 82
5 Blood glucose tolerance curves for different treatments at Week 1 (3mglkg, 30mglkg and 30Omglkg) 83
6 Blood glucose tolerance curves for different treatments at Week 2 (3mglkg, 3Omg/kg and 30Omglkg) 84
7 Blood glucose tolerance curves for different treatments at Week 3 (3mglkg, 3Omg/kg and 300mglkg) 85
8 Blood glucose tolerance curves for different treatments at Week 4 (3mglkg, 3Omg/kg and 30Omglkg) 86
9 Blood glucose tolerance curves for different treatments at Week S (3mglkg, 30mglkg and 30Omglkg) 87
10 Blood glucose tolerance curves for different treatments at Week 6 (3mglkg, 3Omg/kg and 30Omglkg) 89
1 1 Blood glucose tolerance curves for different treatments at Week 7 (3mglkg, 30mglkg and 30Omglkg) 90
12 Blood glucose tolerance curves for different treatments at Week 8 (3mglkg, 30mglkg and 300mg1kg) 91
13 Blood glucose tolerance curves for different treatments at Week 9 (3mglkg, 30mglkg and 30Omglkg) 92
14 Blood glucose tolerance curves for different treatments at Week 10 (3mglkg, 30mglkg and 30Omglkg) 93
15 Blood glucose tolerance curves for different treatments at Trial 1 (600mglkg, 900mglkg and l200mglkg) 95
16 Blood glucose tolerance curves for different treatments at Tria12 (600mglkg, 900mglkg and 1200mglkg) 96
16

17 Blood glucose tolerance curves for different treatments at Trial 3 (6OOmglkg, 900mglkg and 1200mglkg) 97
18 Blood glucose tolerance curves for different treatments at Week 1 (6OOmglkg, 900mglkg and 1200mglkg) 98
19 Blood gluoose tolerance curves for d.iffaent treatments at Week 2 (600mglkg, 900mgIkg and 1200mglkg) 99
20 Blood glucose tolerance curves for different treatments at Week 3 (6OOmglkg, 900mglkg and 1200mglkg) 100
21 Blood glucose tolerance curves for different treatments at Week 4 (6OOmglkg, 900mglkg and 1200mg1kg) 102
22 Blood glucose tolerance curves for different treatments at Week 5 (6OOmglkg, 900mgIkg and 1200mglkg) 103
23 Blood glucose tolerance curves for different treatments at Week 6 (6OOmglkg, 900mglkg and 1200mglkg) 104
24 Blood glucose tolerance curves for·different treatments at Week 7 (6OOm.glkg, 900mglkg and 1200mglkg) 105
25 Blood glucose tolerance curves for different treatments at Week 8 (6OOmglkg, 900mglkg and 1200mglkg) 106
26 Area under glucose tolerance curves for saline at different weeks 110
27 Area under glucose tolerance curves for g1ibenclamide at different weeks 110
28 Area under glucose tolerance curves for 3mglkg aqueous extract at different weeks 110
29 Area under glucose tolerance curves for 30mglkg aqueous extract at different weeks 111
30 Area under glucose tolerance curves for 300mg/kg aqueous extract at different weeks 111
31 Areas under glucose tolerance curves for different treatments (3mglkg, 30mglkg and 300mglkg) at Week 6 112
32 Areas under glucose tolerance curves for different treatments (3mg/kg, 30mg1kg and 300m.gIkg) at Week 7 112
33 Areas under glucose tolerance curves for different treatments (3mg1kg, 30mg1kg and 300mglkg) at Week 8 112
17
34
35
36
37
38
39
40
41
42
43
44
45
46
47
48
49
50
Area under glucose tolerance curves for saline at different weeks
Area under glucose tolerance curves for glibenclamidc at different weeks
Area under glucose tolerance curves for 600mgIkg at different weeks
Area under glucose tolerance curves for 900mglkg at different weeks
Area under glucose tolerance curves for 120Omg/kg at different weeks
AIeas under glucose tolerance curves for different treatments (600mglkg, 900mglkg and 1200mglkg) at Week 4
AIeas under glucose tolerance curves for different treatments (6OOmglkg, 900mglkg and 1200mglkg) at Week 5
AIeas under glucose tolerance curves for different treatments (6OOm.gIkg, 900mglkg and 1200mglkg) at Week 6
Blood insulin curves for different treatments at week 5 (3mg/kg, 30mglkg and 300mglkg)
Blood insulin curves for different treatments at week 6 (3mglkg, 30mglkg and 300mglkg)
Blood insulin curves for different treatments at week 7 (3mglkg, 30mglkg and 3�g)
Blood insulin curves for different treatments at week 8 (3mglkg, 30mglkg and 300mglkg)
Blood insulin curves for different treatments at week 9 (3mglkg, 30mglkg and 300mglkg)
Blood insulin curves for different treatments at week 3 (6OOmglkg, 900mglkg and 1200mglkg)
Blood insulin curves for diffenD treatments at week 4 (6OOmg/kg, 900mglkg and 120Omglkg)
Blood insulin curves for different treatments at week 5 (6OOmglkg, 900mglkg and 1200mglkg)
Blood insulin curves for different treatments at week 6 (6OOmglkg, 900mglkg and 1200mglkg)
1 8
116
116
116
117
117
118
118
119
122
123
124
125
126
129
130
131
132

5 1 Blood insulin curves for different treatments at week 7 (�glkg. 900mglkg and 120Omglkg) 134
52 Areas under insulin curves for saline at different weeks 136
53 Areas under insulin curves for glibenclamide at different weeks 136
S4 Areas under insulin curves for 3mglkg aqueous extract at different weeks 1 36
5S Areas under insutin curves for 30mglkg aqueous extract at different weeks 137
56 Areas under insutin curves for 300mglkg aqueous extract at different weeks 137
57 Areas under insulin curves for saline at different weeks 1 39
58 Areas under insulin curves for glibenclamide at different weeks 139
59 Areas under insulin curves for 600mglkg aqueous extract at different weeks 139
60 Areas \Ulder insulin curves for 900mg/kg aqueous extract at different weeks 140
61 Areas under insulin curves for 1200mg/kg aqueous extract at different weeks 140
19

LIST OF ABBREVlA TIONS
mgolo milligram per 100 milliter
00 Optical Density
n number of replicates or individuals
b.w. body weight
[G] Blood glucose concentration
[I] Blood insulin concentration
20

CHAPTERl
INTRODUCTION
Diabetes mellitus is currently a major global issue in public health. The
occurrence and prevalence of this disease are alanningly escalating in developing and
newly industrialized countries (King, 1993). The prevalence of diabetes worldwide was
estimated to be 4% (135 million people) in 1995 and to increase to 5.4% (estimated 300
million people) by the year 2025 (King et aI., 1998.)
The World Health Organization (WHO) bas recognized 2 major clinical forms of
diabetes mellitus, namely Insulin-Dependant Diabetes Mellitus (lDDM) or Type 1
Diabetes Mellitus and Non-Insulin-Dependent Diabetes Mellitus (NIDDM) or Type 2
Diabetes Mellitus. About 9C)OA, of all cases of diabetes in developed and developing
countries are NIDDM, primarily found in adult of more than 30 years old (WHO Study
Group, 1994).
Asia faces the greatest threat of an epidemic of NIDDM. In 1994, over 43
million people in Southern, Southeast and East Asia were estimated to have NIDDM.
WHO has recognized that Asia as having a potential increase with 2.5 to 3 times more
common diabetes than the situation today. Hence by the year 201 0, Asia is estimated to
have 138 million diabetic patients (Amos et aI., 1997).
21

In Malaysia, diabetes is a growing concern among the population especially the
government and health practitioners. Throughout the six years Healthy lifestyle
Campaign by the Ministry of Hea.lth, which started in 1991, diabetes mellitus became
the theme for the year 1995. Tn 1986, the prevalence of the disease in Peninsular
Malaysia as reported in the First National Health and Morbidity Survey was 6.3% and in
1995, the Cardiovascular Unit in the Department of Public Health, Ministry of Health
...
reported that the prevalence to at 7.7010. The prevalence seemed to be on the rise.
Recognizing diabetes as a growing public health problem in Malaysia, a scope on
diabetes was introduced in the Second National Health and Morbidity Survey (NHMS2).
It was carried out to provide a comparative picture of the epidemiology of diabetes
mellitus in the population of Malaysia within the last ten years since 1986. In 1997, the
survey reported that the national prevalence was found to be 8.3% in the population of
age 30 years and above. (Ministry of Health, 1999)
The highest occurrence of identified diabetics by ethnicity was amongst Indians
(11.5%) and they were considerably higher than other ethnic groups. The prevalence
amid Chinese was 6.3% and Malays was 5.2% whilst other Bmniputera had significantly
lower prevalence 2.7%. The prevalence of known diabetics by gender showed that males
reported to have higher prevalence (5.9%) compared to females (5.8%)(Ministry of
Health, 1999).
Undiagnosed diabetes was defined as whole blood capillary glucose level of
equal or more that 11.1 mmoll1 among those who did not report themselves as known
22

diabetics. From the survey, the national prevalence of undiagnosed diabetics was 2.5%.
By ethriicity, Indians had the highest prevalence of undiagnosed diabetics, which was
3.4% and by gender� females recorded higher prevalence (2.6%) than males
(2.5%)(Ministry of Health, 1999).
In Malaysia, a number of reported death cases from the Ministry of Health
(1999) were related to heart disease, stroke or chronic renal failure, some of which might
be associated to diabetes. It is projected that the number of diabetics will be rising from
418,000 cases in 1994 to 810,000 cases and 1,201,000 estimated cases in year 2000 and
2010 respectively (Ministry of Health, 1999)
The Ministry of Health in Malaysia has reported that in 1994, about 4.3% of
diabetic patients seek treatment in private and government hospitals and about 0.9%
seeks treatment in traditional medicine practitioner (Ministry of Health, 1995). Even
today, the practice of various traditional medicinal systems are still flourishing in
different countries and among different ethnic groups and nearly 80% of the rural
population still depend on plant based medicines (Sasson, 1996). About 80% of the rural
population in many tropical developing countries still depends on traditional
practitioners for their health care, which means that the community has to rely on
medicinal plants for treatment (Farnsworth, 1983).
23

The traditional method of treating diabetes is yet to be explored; Malaysia is
richly endowed with diverse flora with good potential to be developed into various
useful natural products (Soepadmo, 1993). Our country is known to have a large amount
of plant species and a number of them have been traditionally used to treat many disease
and ailments. Similar to other diseases, diabetes mellitus has been treated traditionally
by oral consumption of plant extracts based on folk and traditional cures since ancient
times (Ajgoankar, 1979).
24