Universitas Muhammadiyah Yogyakarta PROGRESS REPORT TWG I: Energy Policy Analysis by Rahmat A. Al...
11
Universitas Muhammadiyah Yogyakarta PROGRESS REPORT TWG I: Energy Policy Analysis by Rahmat A. Al Hasibi Semarang July, 13 th 2011
-
Upload
derick-horton -
Category
Documents
-
view
217 -
download
0
Transcript of Universitas Muhammadiyah Yogyakarta PROGRESS REPORT TWG I: Energy Policy Analysis by Rahmat A. Al...

Universitas Muhammadiyah Yogyakarta
PROGRESS REPORT TWG I: Energy Policy Analysis
by Rahmat A. Al HasibiSemarang
July, 13th 2011
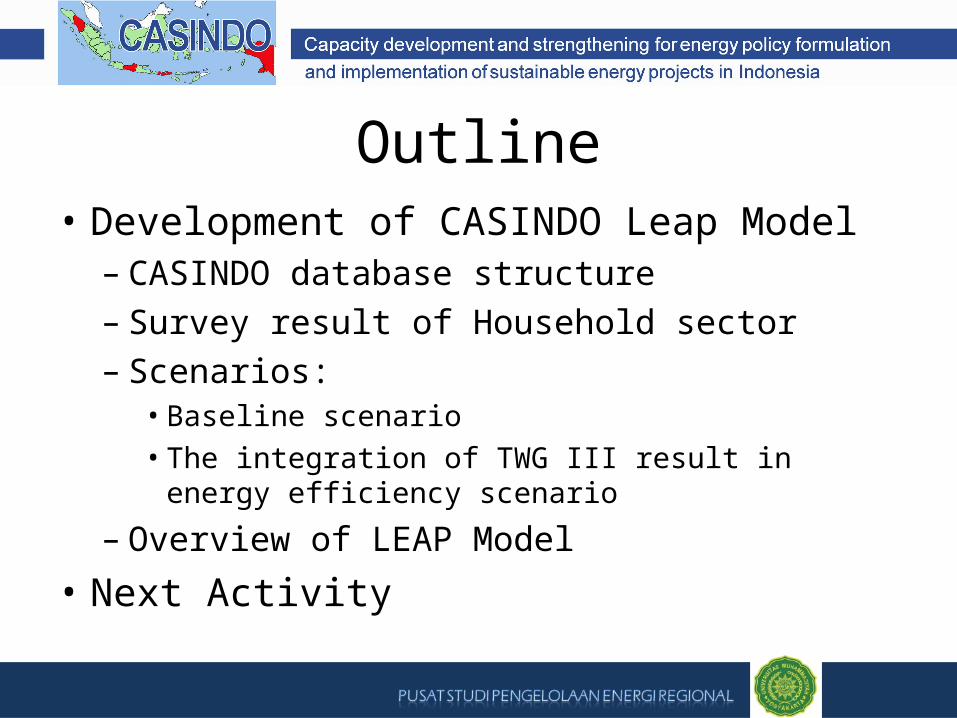
Outline• Development of CASINDO Leap Model
– CASINDO database structure– Survey result of Household sector– Scenarios:
• Baseline scenario• The integration of TWG III result in energy efficiency
scenario
– Overview of LEAP Model
• Next Activity
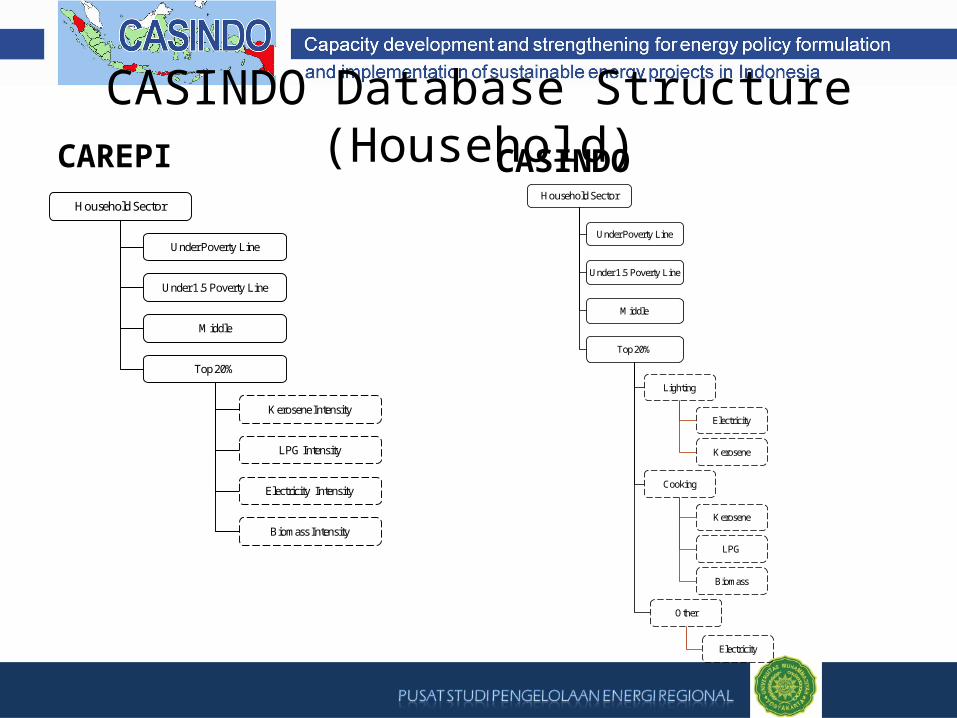
CASINDO Database Structure (Household)CAREPI CASINDO
Household Sector
Under Poverty Line
Under 1.5 Poverty Line
Middle
Top 20%
Kerosene Intensity
LPG Intensity
Electricity Intensity
Biomass Intensity
Household Sector
Under Poverty Line
Under 1.5 Poverty Line
Middle
Top 20%
Lighting
Cooking
Other
Electricity
Kerosene
LPG
Kerosene
Biomass
Electricity

The Result of Household Survey• adjusted to 2008 condition
Rural (Fuel Allocation) Urban (Fuel Allocation)Under Poverty Line Kerosene Electrictiy LPG Biomass Under Poverty Line Kerosene Electrictiy LPG Biomasscooking 97.65 100 100 cooking 100.00 100 100 lighting 2.35 70.23 lighting - 40.46 other 29.77 other 59.54 % 100 100 100 100 % 100 100 100 100
Under 1.5 Poverty Line Kerosene Electrictiy LPG Biomass Under 1.5 Poverty Line Kerosene Electrictiy LPG Biomasscooking 97.96 100 100 cooking 100.00 100 100 lighting 2.04 65.82 lighting - 44.18 other 34.18 other 55.82 % 100 100 100 100 % 100 100 100 100
Middle Kerosene Electrictiy LPG Biomass Middle Kerosene Electrictiy LPG Biomasscooking 98.76 100 100 cooking 100.00 100 100 lighting 1.24 40.23 lighting - 42.32 other 59.77 other 57.68 % 100 100 100 100 % 100 100 100 100
Top 20% Kerosene Electrictiy LPG Biomass Top 20% Kerosene Electrictiy LPG Biomasscooking 100.00 100 100 cooking 100.00 100 100 lighting - 35.92 lighting - 30.94 other 64.08 other 69.06 % 100 100 100 100 % 100 100 100 100

Baseline Scenario• Population and population growth
– Population of Y ogyakarta Province in 2008:3, 4 6 8,502 people
– Population growth in 2005 – 2008: 1.01 %– Population growth assumption in scenario:
• GDP and GDP growth:– GDP of Yogyakarta Province in 2008: 19 , 208, 9 3 6– GDP growth in 2008: 5.02 %– GDP growth assumption in 2025: 6 .0 %
• kerosene to LPG conversion:– End in 2010
• Electrification ratio:– 100 % in 2020
No. Year Interval Population Growth1. 2010-2015 0.81%2. 2015-2020 0.63%3. 2020-2025 0.44%
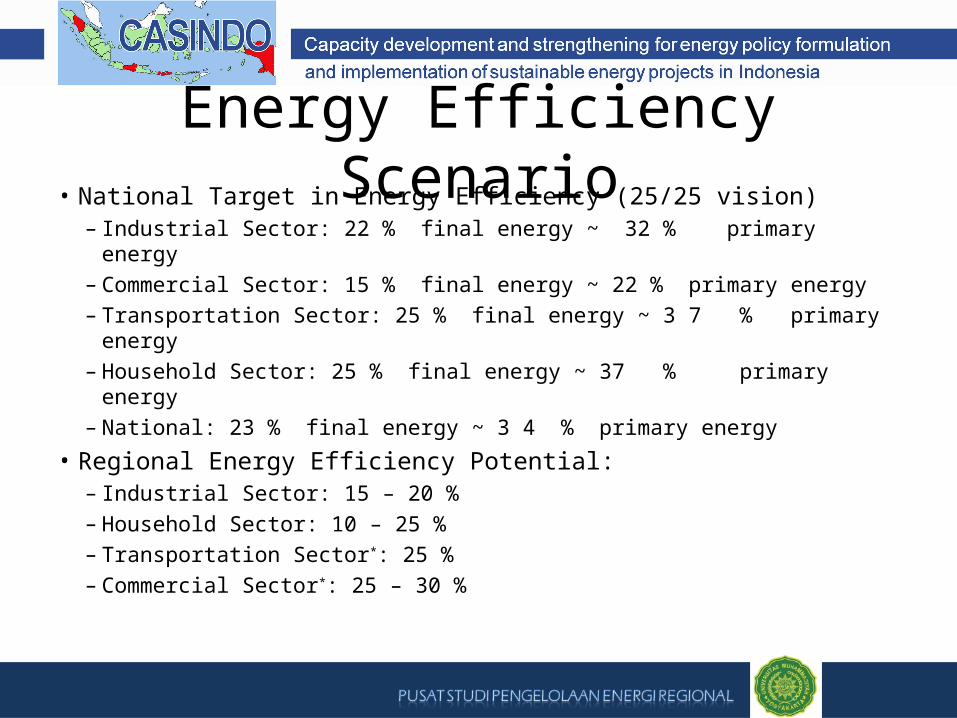
Energy Efficiency Scenario• National Target in Energy Efficiency (25/25 vision)
– Industrial Sector: 22 % final energy ~ 32 % primary energy– Commercial Sector: 15 % final energy ~ 22 % primary energy– Transportation Sector: 25 % final energy ~ 3 7 % primary energy– Household Sector: 25 % final energy ~ 37 % primary energy– National: 23 % final energy ~ 3 4 % primary energy
• Regional Energy Efficiency Potential:– Industrial Sector: 15 – 20 %– Household Sector: 10 – 25 %– Transportation Sector*: 25 %– Commercial Sector*: 25 – 30 %

LEAP Model (Overview)

LEAP Model (Overview)
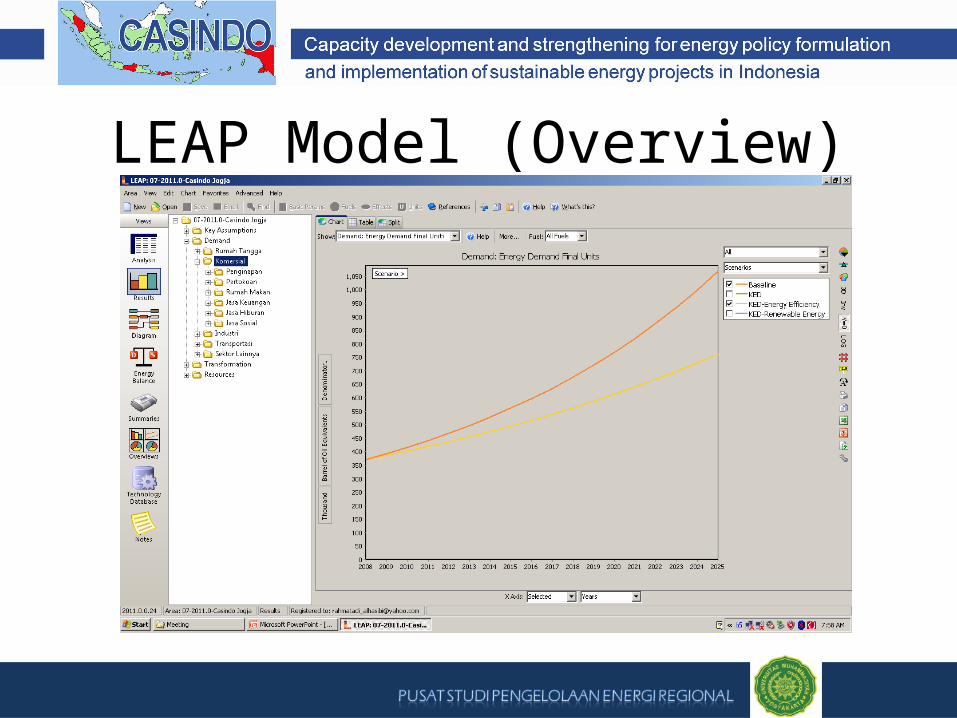
LEAP Model (Overview)

Next Activity
• July-September 2011, to finalize:– scenarios of LEAP model– D28 report

THANK YOU