UNIVERSITÀ DEGLI STUDI DI TRIESTE - justin will creations · UNIVERSITÀ DEGLI STUDI DI TRIESTE ....
49
UNIVERSITÀ DEGLI STUDI DI TRIESTE MASTER IN COFFEE ECONOMICS AND SCIENCE – ERNESTO ILLY MASTER THESIS “Collaborative International Expansion of Smallholder Coffee Farms: A Business Model for Partnerships in Consuming Markets” Student: Supervisors: Justin Will Prof. Pierpaolo Andriani Prof. Eliana Cossio Prof. Andrea Tracogna Anno Accademico 2015/2016
Transcript of UNIVERSITÀ DEGLI STUDI DI TRIESTE - justin will creations · UNIVERSITÀ DEGLI STUDI DI TRIESTE ....

UNIVERSITÀ DEGLI STUDI DI TRIESTE
MASTER IN COFFEE ECONOMICS AND SCIENCE – ERNESTO ILLY
MASTER THESIS
“Collaborative International Expansion of Smallholder Coffee Farms:
A Business Model for Partnerships in Consuming Markets”
Student: Supervisors: Justin Will Prof. Pierpaolo Andriani Prof. Eliana Cossio Prof. Andrea Tracogna
Anno Accademico 2015/2016

ACKNOWLEDGEMENTS
Special thanks to:
- My family and cohort, who are always ready to listen to my ideas,
no matter how outlandish they may be.
- My ever-supportive advisors, Professors Andriani, Cossio, and
Tracogna.
- The Ernesto Illy Foundation for creating such an amazing
program, and the Master’s Staff who made it so much more!
- And finally, my wife Elise, for whom there are no words to
express the endless contributions she’s made to my life, and to
my personal and professional development.

. . : : Hic sunt leones : : . .
ABSTRACT
In a word, the goal of this thesis is disintermediation, or the empowerment that comes to
small businesses by removing intermediaries that are unnecessary to them. Even for the
professional coffee farmer, the supply chain is nearly incomprehensible. Its length, costs, and
sheer geographical span are immensely complex and diverse. A farmer, like a consumer,
doesn’t have the time to study-up on how to best use its complexity. To address this issue, I
am proposing a collaborative business partnership that will unite farmer and roaster in a
dynamic equity venture with the objective of stabilizing each other’s financial forecasts and
enabling future growth. Furthermore, this partnership will bridge the information gap
between farm and cup by directly aligning the business interests of both entities, creating a
direct communication channel to the consumer never before seen in the coffee industry.

TABLE OF CONTENTS
CHAPTER I. INTRODUCTION a. Abstract b. Wait, but why? c. How?
CHAPTER II. GOALS a. Identify the interests and benefits for roasters and farmers b. Numerically estimate the value created by an international partnership c. Consider strategies for implementation
CHAPTER III. METHODS CHAPTER IV. MARKET CONDITIONS
a. System b. Smallholder Farms c. Small Business Roasters
CHAPTER V. EXISTING MODELS a. Traditional Commodity Supply Chain b. Traceable Sourcing c. Direct Trade d. Vertical Integrations
CHAPTER VI. PROPOSED MODEL a. Bulk Investment Mechanism b. Continuous Equity Dispersal Mechanism
CHAPTER VII. FINDINGS AND RESULTS a. Data Parameters b. Cost Escalation c. Profit d. Direct Trade
CHAPTER VIII. DISCUSSION a. Barriers b. Advantages of the International Partnership c. Disadvantages of the International Partnership d. Thoughts on Implementation
CHAPTER IX. CONCLUSIONS CHAPTER X. BIBLIOGRAPHY

..:: 1 ::..
CHAPTER I. INTRODUCTION
a. Wait, but why?
Coffee commodity markets are notoriously complex and undifferentiated, not to mention
volatile. For coffee, it is a labyrinth of stakeholders spread across the world, making
communication unreliable and inconsistent from one end of the chain to the other. This lack of
information fosters a significant misunderstanding of coffee’s true value, leaving the end
consumer grossly under-informed. This is not the ideal system for smallholder farms, most of
whom lack the time and resources to play on this level.
Such a coffee farmer becomes a “price-taker” because their produce is valued by the
speculative commodity market, not by the end consumer, forcing the farmer to accept
whatever price the market is offering. This unpredictability to the farmer’s finances makes
year-to-year forecasting and investments very difficult to manage, in addition to a lack of
available business loans.
Furthermore, smallholder coffee farmers are struggling to keep pace with the global
challenges. There are increasing demands and costs put on coffee producers. Climate Change
for example, has had devastating effects on coffee farms in places like South America and
Africa, and may threaten the majority of suitable land on these continents over the next
several decades. In the meantime, worldwide consumption is increasing, putting more and
more pressure on farmers to simultaneously increase quantity and quality, all-the-while only
receiving a fraction of what the customer pays per cup.
Likewise, small business roasters face challenges when competing with the big players in the
industry. Although growing in popularity, third wave coffee shops and coffee roasters
represent a small portion of the US market for coffee, limiting their influence on the global
market. Roasters face equally difficult challenges when faced with the market volatility, and
opportunities for expansion.

..:: 2 ::..
b. How?
As is often the solution for small businesses, partnerships can address some of these
difficulties in the coffee industry. An international partnership between smallholder farms and
small business roasters can help serve as a stabilizing force to both businesses, as well as
enabling them for improved growth.

..:: 3 ::..
CHAPTER II. GOALS
The purpose of this thesis is to explore opportunities for direct international partnerships and
disintermediation to improve the business prospects for smallholder coffee farms and small
coffee roasters. To this end, the goals of this thesis will be:
i. Identify the interests and benefits for roasters and farmers
ii. Numerically estimate the value created by an international
partnership
iii. Consider strategies for implementation

..:: 4 ::..
CHAPTER III. METHODS
I will begin with a review of existing literature and market conditions to describe the current
business environment, as well as elaborate on the troubles experiences by these small
businesses. I will then analyze the current supply chain models and their capacity to address
the struggles of small business. Next, using real world transactions as the dataset, I will present
the status quo for supply chain actors, estimating their value-additions and profit share in the
chain. Finally, I will propose and describe an international partnership model aimed at
stabilizing and enabling the market for small coffee businesses. I will contextualize this
proposal using those same real world transactions, concluding with numerical and qualitative
estimates to the value it would create for these key smallholder players.

..:: 5 ::..
CHAPTER IV. MARKET CONDITIONS
a. The Coffee Industry
Market Volatility
One of the first things any coffee trader will tell you, is that the market for coffee is heavy with
speculation, causing it to behave very erratically. Over the last few decades, the market price
has doubled and halved, multiple times, compared to its long-run average of around $1.03 / lb.
Figure 1: Graph of Coffee Price History (www.ico.org)
When the price of coffee fluctuates, the frequency of fluctuations benefits those that can stay
informed. This is not an advantage of smallholder farms that are already minimally staffed, and
can’t afford to engage in speculation or hedging. Large coffee farming operations and
exporters may be able to afford to employ a commodity trader whose sole task is to optimize
their company’s performance in the commodity market. There’s simply no way a smallholder
farmer can compete with that, and the end result is that farmers must accept whatever price is
offered, while informed traders can play the market to their own profit.
This price volatility also impacts life for the roaster who relies on buying low to make profit as
well. On the other hand, for a roaster, the only thing worse than overpaying for coffee, is not
$0.00
$0.50
$1.00
$1.50
$2.00
$2.50
Coffee Prices to the Farmer(1990 – 2016)
Coffee Prices

..:: 6 ::..
having any. So this leaves the roaster with equally little choice, and is likewise forced to be a
“price-taker”.
Figure 2: Constructing the Coffee Commodity Price
The unpredictability is worse when you factor in the price differential. Typically, in the
commodity coffee market, coffee pricing is based on two factors, the market price, and a price
differential. The commodity price is what fluctuates erratically with the stock market, but the
“differential is determined by the coffee broker, the farm, or the country of origin, and is
based on the quantity and quality available, in the long and short term.” (Graham, S.) Price
differentials can be positive (a.k.a. premiums) or negative (a.k.a. discounts).
Differential Countries
- $0.04/lb Dominican Republic, Ecuador, and Peru
- $0.03/lb Burundi, India, and Rwanda
- $0.01/lb Honduras and Venezuela
At Par Costa Rica, El Salvador, Guatemala, Kenya, Mexico, New
Guinea, Nicaragua, Panama, Tanzania, and Uganda
+ $0.02/lb Colombia
Table 1: Price Differentials by Country (www.stocktongraham.com)
Total Coffee Price
Commodity Price
Premium (usually for quality)

..:: 7 ::..
Climate Change
In the world of commodity economics, coffee has a special personality. It is one of the most
traded commodities in the world, but it’s almost exclusively produced in developing countries
and consumed in developed ones. Climate Change is the biggest challenge facing this industry,
and the planet for that matter. It is increasing global temperatures, shifting and intensifying
weather patterns, and causing increasingly restrictive governmental policies aimed at
improving sustainability. Farmers certainly have their work cut out for them.
In the next several years, the land considered suitable for coffee production will decrease
considerably (Figure 2). This can be the result of both increases in temperature, known as
global warming, or changing weather patterns that cause extensive droughts (Figure 3) or
untimely frosts. These effects are most extreme in places like Brazil, where the change in
climate will damage much of their current farmland. And as the world’s biggest coffee-
producing country, Brazil’s climate issues have significant ripple effects on the coffee
commodity market.
Figure 3: Changes in Suitable Coffee-growing Land in Central America (World Coffee Research)

..:: 8 ::..
Another example of the destructive power of climate change is Columbia, for reasons that
might not be evident to consumers, which is all the more reason to bring both sides to the
table. Columbia is in a region of South America that is directly affected by the temperature
shifts of the Pacific Ocean, something known as the El Niño and La Niña effects. Both are
naturally occurring cycles in the earth’s climate, but when global temperatures shift, so do the
intensity of these cycles. In the case of Columbia, this can mean extremely wet seasons, filled
with near-constant, and heavy rains (Figure 3). This sounds horrible already, but one might not
realize the effects that extensive rain can have – not just on the crops, but on the diseases and
pests that feed on them. One in particular, coffee rust, is a fungus that spreads from plant to
plant through wind and rain splatter, so when it rains continuously, the growth becomes
epidemic. And this is precisely what happened in 2008 when Columbia lost nearly a third of
their crop to rust. Columbia, the third largest producer in the world, losing so much coffee had
a huge impact on the market. It wasn’t until 2014 that they fully recovered to pre-epidemic
production levels.
Figure 4: Changes in Precipitation Patterns of South America (National Geographic)

..:: 9 ::..
Communication
The coffee supply chain is a geographically spread out series of multiple actors. By magnitude
alone it is an inefficient system for communication, as messages are changed and
miscommunicated throughout each link of the chain. The result of these inefficiencies is a
dissonance between what a consumer wants, and what a farmer believes the consumer wants
– or vice versa, what a farmer does, and what a consumer believes a farmer does. It is a system
that is currently incapable of overcoming the geographical and technological distances
between these two parties.
This lack of information fosters a significant misunderstanding of the coffee’s impact. For much
of the coffee available, labor conditions and production methods differ from that which the
consumer might prefer if he or she readily had access to that knowledge. But this is not the
fault of the consumers, nor the producers. It’s an institutionalized shortcoming that results
from systemic complexity, allowing only the most quantifiable and binary information to pass
through. This is why “yes or no” characteristics like Organic and Fair Trade Certifications can
work, or why cup quality scores have so much bearing – they are all easily described and
translated across the chain. Consumer behavior isn’t that binary however, and customer
preferences can fluctuate on intangible characteristics like fads and marketing that have no
relevance to the farmer, proving the disconnect.
b. The Smallholder Farm
Profit Share
One of the downsides of having such a long and complicated supply chain is that
intermediaries are often necessary to move the product along. Each intermediary in turn
performs an action and receives a profit, which adds to the total cost of that product. This
phenomenon is called “cost escalation” and it is particularly relevant in the coffee supply
chain.

..:: 10 ::..
Sources vary on what percentage of the final price is received by the coffee farmer, but it’s
generally considered to be very low. PBS estimates that 12% of every dollar ends up in the
farmers’ hands, but even that seems optimistic. (Whalen, K.) In a later section I’ll discuss how
these compare to my own findings, and how it would be affected by an international
partnership.
Supply Chain Actor Share of Revenue
Farmers 10-12%
Traders 2-3%
Shippers 4%
Roasters 65-70%
Retailers 10-15%
Table 2: Revenue Share by Supply Chain Actor (www.pbs.org)
Certifications
As mentioned above, certifications serve as a more efficient and binary manner of conveying
information up the supply chain by consolidating all the information about organics, fair trade,
sustainability etc. into a simple up or down vote. There are conflicting opinions in the world
about whether this is a positive or a negative for the industry, but if nothing else, it does give
the customer at least some level of specific evaluation criteria with which to judge products.
For the farmers however, certifications can often feel like an over-burdensome set of
restrictions, and even worse, a costly expense when it comes to paying for inspectors to visit
every year. (Janssen, R.) (Charles, D.)
Price-fixing certifications like Fair Trade are most useful to farmers when the market price is
low, ensuring that the farmers are receiving enough to survive. When the market is up,
however, the certification isn’t really contributing to the farmers’ bottom line, and it often
leads them to seek market pricing for their best specialty coffees which can fetch even more
than the fair trade price. The trouble with this strategy is similar to other challenges faced by
smallholder farms, they simply aren’t market experts. Smallholder farms have to rely on supply

..:: 11 ::..
chain intermediaries to seek out the best price, like coffee traders, who in turn take a share of
the profit.
Access to Finance
One of the least understood problems for farmers is their lack of access to modern financial
instruments. It’s a trouble that’s rooted in how agricultural capital management compares to
other industries, because farming involves large transaction costs, very long-term capital
investments, high costs associated with operating in isolated markets, and low-value, high-
volume returns.
In the meantime, farmers have little access to credit, and therefore have little credit history or
familiarity with credit processes. This has an even more profound effect when considering that
their social circles also lack credit experience, creating a society-wide lack of credit culture.
This makes financing riskier for lenders, who expect borrowers to have a good grip on payback
policies and the consequences of default. Without a culture of crediting, farmers lack the
experience to properly manage their financial risks, and without experience in lending to the
agricultural sector, lenders are unable to properly manage transaction and market risks.
(Galindo, M.)

..:: 12 ::..
Figure 5: Perceived Risks and Access to Financing (Galindo, M.)
Additionally, farmers cannot offer much in terms of collateral, which in other cases may
assuage wary lenders. There are options out there for farmers to leverage their harvest as
collateral, but time has shown that these farmers tend to find themselves in a perpetual state
of debt, having given away their entire crop before they have even harvested it.
The situation is not limited to coffee farmers either. According to multiple sources, global
unmet demand for smallholder finance is estimated between $200 and $450 billion, and
bound to increase as the global food demand increases with population growth. (Carroll, T.)
(CSAF)
Smallholders
The majority of coffee farmers in the world are smallholder farmers, meaning they cultivate on
small tracts of land, the size of which varies by country and climate. (United Nations) In
Colombia, for example, despite its contribution as the third largest coffee-producing country,

..:: 13 ::..
the average plantation is just 2 hectares. (Café de Colombia) But size isn’t the only
characteristic of a smallholder farm, because the term also describes the economic prospects
of the business. They are generally engaged in non-farming income streams as well, so they
often find themselves in a vulnerable position of being impacted by market volatility, yet less
able to respond to market shifts.
In simpler terms, smallholder farms do not benefit from economies of scale like larger farms,
so they are often hindered in their ability to compete. This is a natural occurrence in free
markets, to be sure, but as customer preferences continue to narrow from origin country, to
origin region, to origin farm, smallholder farmers are facing an incredible opportunity to
prosper.
c. The Small Business Roaster
Third Wave Coffee
This shift in customer preferences is credited to what’s called, the third wave coffee
movement. It’s characterized with increasing standards in coffee sourcing and beverage
preparation. It’s similar to the emergence of the craft beer industry – in both cases, a
traditional industry has been challenged by the emergence of an artisan elite, crafting a new
level of appreciation. Arguably, this may have been the case for the rise of fine wines and
scotches as well.
Customers are demanding specialized coffees that are distinguished, either with certifications,
or colorful histories. One of the histories popular as of late, is “Farm-to-cup” identification.
This isn’t a certification, per se, but rather a description of the sourcing channel, a concept
valued by young consumers that participate in “glocal” consumption schemes. When a
consumer can link their beverage with a time and place in the world, they feel connected, an
intangible value-addition to the pastime.

..:: 14 ::..
Small Business Failure Rates
The market response to a “glocally-minded” customer base has been an expansion in the
number of small roasters that coincide with the growth of coffee chains like Starbucks. Small
roasters are riding the tide in increasing coffee consumption, but offer something the national
chains can’t – a way to create a uniquely-local relationship with the surrounding community.
The trouble with any small business however, is the mediocre probability of economic success.
According to the US Small Business Association (SBA), one third of all small businesses fail
within the first 2 years, and 50% within in 5 years. The good news though, for those that make
it past year 5, the failure rate levels out and the outlook is very positive. Additionally, the food
industry demonstrates similar failure rates to all other industries, which contradicts the
conventional wisdom that it’s a riskier business to go into.
However, a substantial threat still looms when small businesses have to compete with national
chains, and that is the advantages of economies-of-scale. Big players can compete better on
price because of their size, leaving small businesses to fight out the battle of start-up and
operating costs with significantly less resources.
Roaster Costs
In the case of the coffee shop, start-up costs are high compared to the value of the product
being sold. Coffee, for example, is a lot less expensive that an entrée served at a restaurant,
though similar requirements exists for equipment and infrastructure needed to meet health
codes in a café. However, in the event that the roaster is not selling brewed coffee on-site, and
instead focuses on wholesale, the costs are more manageable, along the lines of the following
estimates:

..:: 15 ::..
Start-up Costs $
Roasting Machine $15,000
Packaging Equipment $5,000
Quality Control Equipment $5,000
Space Modifications $15,000
First Rent and Deposit $4,000
Raw Materials (500kg) $5,000
TOTAL $49,000
Table 3: Roaster Start-up Costs
Operating Costs $/lb
Fixed Costs (Rent, Labor) $3.00
Variable Costs (Coffee, Fuel) $5.37
Roasting Losses (15%) $0.95
TOTAL COGS $9.32
Table 4: Roaster Operating Costs
Fortunately, the market for a pound of locally-roasted coffee is asking about $22.00 / lb in
retail, and $15 / lb in wholesale. At that rate, assuming the roaster sells 500 lbs / month, it will
take him/her 1.5 years to get out of the red.
Figure 6: Breakeven Curve for a Typical Roaster
-$60,000
-$40,000
-$20,000
$0
$20,000
$40,000
$60,000
Jan Apr Jul Oct Jan Apr Jul Oct Jan Apr Jul Oct
..:: 16 ::..
CHAPTER V. EXISTING MODELS
Do international partnerships already exist? Well, yes and no. There does not appear to be any
evidence of an original partnership being formed between roaster and farmer, however we
have seen evidence of vertically integrated coffee companies, as well as a trend of roasters
purchasing from coffee farmers through a single intermediary.
Based on my research and experience, I have identified 4 categories of supply chain models
within the coffee industry, each with its own level of fidelity when it comes to buyer-grower
relations:
1. Traditional Commodity Chain
2. Traceable Sourcing
3. Direct Trade
4. Vertical Integrations
a. Traditional Commodity Chain
The traditional commodity supply chain is composed of multiple independent actors, each
contributing a value addition. The many actors in this arrangement make for a very specialized
and effective chain. Each level is beholden to its customer at the next level, so the business
focus is often narrowed to one level up, or one level down. The levels are also dispersed
geographically, as the product moves from origin to consuming countries.

..:: 17 ::..
Figure 7: Diagram of the Typical Coffee Supply Chain (www.forbes.com)
In simpler terms though, and for the sake of argument in this thesis, we can view the supply
chain as just 5 or 6 levels: Farmer, Exporter, Freight Forwarder, Import, Roaster, and in some
cases, an independent Retailer.
Figure 8: Typical Actors in the Coffee Supply Chain

..:: 18 ::..
b. Traceable Sourcing
Coffee can be referred to as traceable when, even at the end of the chain, it can be tracked
back to the original farm or co-op. While the physical coffee can still be traded between
multiple parties in the supply chain, as long as the final roaster knows the origin, it can be
marketed as a traceable coffee. Traceability is useful when building regional or farm
reputations in the market, and recognizing consistent quality from specific sources that can
then be reflected in the market price. It’s also very useful in tracking down the precise source,
or ground zero, of defects and diseases. The consumer market is increasingly demanding
traceability, and many coffee-producing countries are incorporating traceability into their
national coffee programs and regulations. The comparison to fine wines and scotches becomes
yet again, apparent.
The short-coming of traceable coffees is that they are not synonymous with quality coffee.
While it may be worth a few dollars in retail value to be able to identify the origin of a coffee, if
the quality is not consistent with the marketing value of that origin, then the customer will
move on. The risk is a result of branded products that make it possible for a customer to
associate a bad quality coffee to an origin, and specifically avoid anything with that
brand/origin in the future.
c. Direct Trade
Independent Roasters however, don’t simply opt for traceable sourcing because it may still
require several intermediaries, resulting in some of the communication and cost challenges I
mentioned before. Instead, ambitious roasters reach out directly to farmers in coffee-
producing countries. This often involves research trips to origin countries where the roaster
visits farms and interviews farmers in search of sourcing partners. This arrangement is often
credited for having a true hands-on approach to sourcing, giving the roaster the most control
over the product with minimal interference. The communication channel that is established
between the grower and roaster is very useful in collaboratively improving quality of product,
and quality of business. The two are able to communicate defects or customer feedback in
order to continue to improve quality over time. When a deal is made, a third-party freight
entity is usually used for the physical movement of goods and customs clearance.

..:: 19 ::..
The struggle for roasters is that they rarely have the time and resources to do such origin trips.
Small businesses are very time-demanding, and a small roaster will likely have to cease
operations while he/she is on a trip. Secondly, while origin trips are not expensive by vacation-
standards, they are not like a weekend at the lake either. Flights can cost upwards of $600-
1000 round-trip, plus all of the missed revenue and income while he or she is away. And lastly,
a roaster also lacks the professional network to plan an ad hoc origin trip. A roaster would
need to spend more time and money making the connections necessary to fill an itinerary and
make the trip worthwhile. And, not to mention, that’s all assuming that a roaster even knows
what to look for!
Figure 9: Three-way Direct Trade Relationships
d. Vertical Integrations
The next level of direct sourcing is to own both ends of the chain. We’ve seen several
examples of large roasters buying farms, like Starbucks in China and Costa Rica, and
occasionally farmers opening their own roasters. The latter case however, is much more
difficult because of the reverse flow of purchasing power between currencies. A large roaster
from the US has the advantage of the currency exchange rate when expanding into producing
countries. It does happen, however. El Recreo in Boston and La Fortuna in Chicago, are both
farmers that own and operate a café, roastery and distribution center in the US. In both cases,
the farmers were successful family-run farms that sought to move to and open a café in the

..:: 20 ::..
states. With the help of third-party investors, they were able to open shops, begin roasting,
and have been very successful in offering direct farmer-to-customer interactions and
education programs.
One of the drawbacks of either of these integrations is that it does not immediately rectify the
geographic knowledge gap. The lack of familiarity a farmer has with the consumer psychology
is inherent, as is that of a roaster going into the farming business. Farmer-led education
programs will offer authentic insight, but farmer-led marketing and niche market-building are
bound to experience a steeper learning curve.

..:: 21 ::..
CHAPTER VI. THE PROPOSED PARTNERSHIP MODEL
Given the market conditions, the problems faced by small businesses on both ends, and the
inability for current models to address them, there are two effects any solution must have in
order to be effective. The solution must be both stabilizing, and enabling.
Stabilizing Enabling
A solution must offer stability for
both roaster and farmer in their
capacity to forecast pricing, locate
sources and markets, and maintain
positive yet simple control over their
business relationships.
A solution must enable small
businesses to survive in an
industry dominated by big players
by creatively managing equity and
creating a niche market.
With these effects in mind, my proposed model uses two equity-earning mechanisms in
conjunction with a direct trade relationship. The first mechanism addresses the initial start-up
of a new roaster. The second describes a model for continued partnership through the on-
going supply of raw materials (e.g. green coffee). The direct trade format is utilized in order to
minimize the presence, and profit-share, of intermediary entities while maximizing the
influence and control of the business owners.
Figure 10: Direct Trade Partners

..:: 22 ::..
a. The Bulk Investment Mechanism
Opening a roaster, as I’ve shown, is a costly endeavor – perhaps even riskier as a small
business entrepreneur. In simplest term, this first mechanism is intended to pool the
resources of both parties to alleviate the financial burden of opening a roaster, while offering
the farmer a valuable intangible benefit in return, stability. The farmer will provide the raw
materials (e.g. green coffee) to the roaster in exchange for equity in the business. The material
provision will decrease the initial cash outlay for the roaster, as well as decrease the negative
cash flow for the goods sold in the first several operational cycles.
Figure 11: Bulk Investment Diagram
Based on the numbers earlier, we estimated that a new wholesale roaster will cost around
$50,000 to open, and the roaster will make about a $5 margin on each pound of coffee sold.
Also continuing with the estimate of a roaster selling 500 lbs/month, or about 588 lbs in green
beans (before roasting losses), the farmer can provide the first year’s-worth of coffee. This
would be about 7,000+ lbs of green coffee, worth roughly $30,000 in equity. If equity were
dispersed dollar-for-dollar, $30,000 would be 42% when compared to the roasters initial
investment of the remaining $41,000, including the anticipated cost of raw materials for one
year.

..:: 23 ::..
Figure 12: Breakeven Curve for a Roaster Employing the Bulk Investment Mechanism
As you can see by this graph, the roasting business will begin operating in the black within the
first 3 quarters of operation, indicating that the farmer’s infusion of investment-in-kind
significantly reduces the financial burden and risk of starting up.
b. Continuous Equity Dispersal Mechanism
The obvious flaw in this mechanism is that a farmer cannot possibly forgo $30,000 in revenue
for the year without going-under him/herself. Instead, it makes sense to pair the bulk
investment mechanism with a long-term one. For example, let’s say the initial investment was
set to a maximum of $10,000, or roughly a 4 months’ supply of coffee. After this initial supply
of raw materials is used up, a standardized equity-payment plan will take over.
The premise of this mechanism is based on that little country-by-country variance built into
coffee market pricing, the price differential. The flexibility of this pricing scheme is repurposed
as an opportunity to create stability for the farmer, and also enable the roaster. In terms of
cash-flow, this mechanism will help the roaster by allowing him/her to pay for a portion of the
raw materials in shares instead of cash. This is similar to the first mechanism, except that it
only applies to the portion of the total coffee price that covers a “premium”, leaving the
commodity price intact for the farmer to receive in cash. This mechanism also ensures that the
premium will be paid in a value equivalent to or better than what a certification such as Fair
-$60,000
-$40,000
-$20,000
$0
$20,000
$40,000
$60,000
Jan Apr Jul Oct Jan Apr Jul Oct Jan Apr Jul Oct
New Breakeven Point

..:: 24 ::..
Trade would offer. In simple terms, it guarantees that the farmer pockets a minimum amount
of cash, while paying out equity as rewards for high quality.
Figure 13: Diagram of Payments for Continuous Equity Dispersal Mechanism
In keeping with the roaster projections we’ve been analyzing, a combined arrangement of both
mechanisms will look like the graph below. A maximum investment is made in-kind by the
farmer with $10,000-worth of green coffee, and then sells coffee after month 4 in accordance
with the cash-equity payment plan. The roaster will breakeven after 4 quarters, much less than
the 1.5 years he/she would otherwise need on their own.
Figure 14: Breakeven Curve for a Roaster Employing Both Mechanisms
-$60,000
-$40,000
-$20,000
$0
$20,000
$40,000
$60,000
Jan Apr Jul Oct Jan Apr Jul Oct Jan Apr Jul Oct
New Breakeven Point
..:: 25 ::..
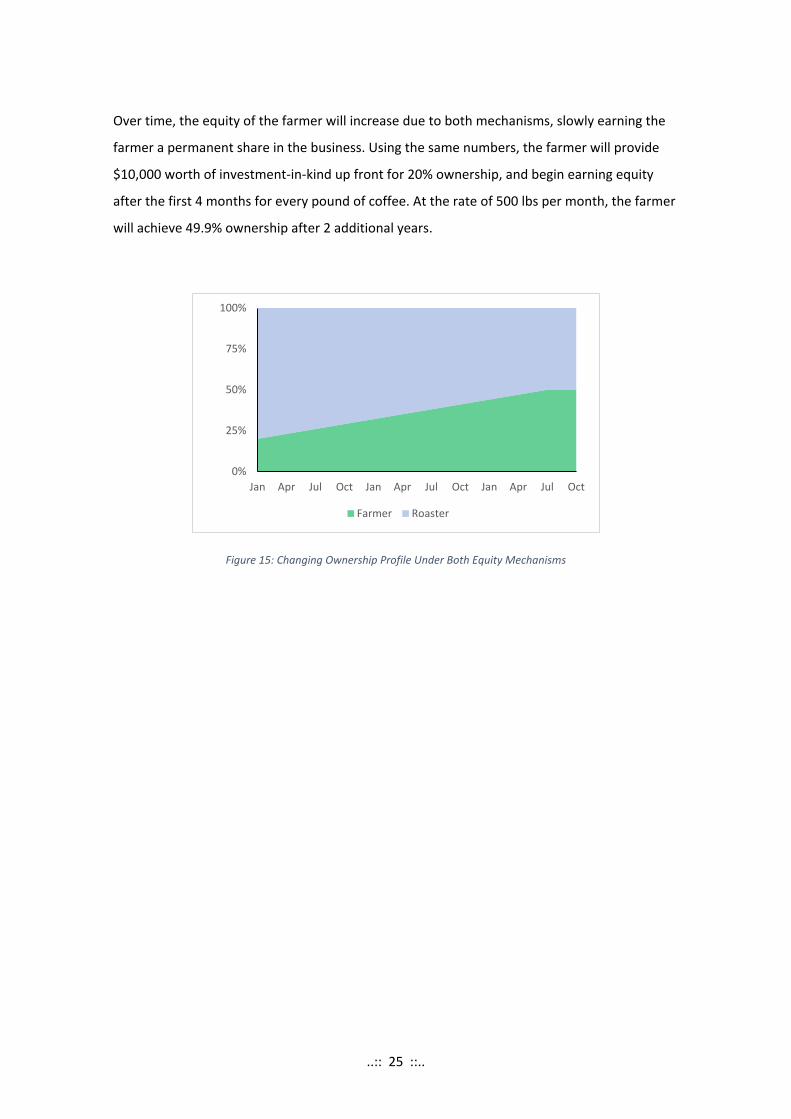
Over time, the equity of the farmer will increase due to both mechanisms, slowly earning the
farmer a permanent share in the business. Using the same numbers, the farmer will provide
$10,000 worth of investment-in-kind up front for 20% ownership, and begin earning equity
after the first 4 months for every pound of coffee. At the rate of 500 lbs per month, the farmer
will achieve 49.9% ownership after 2 additional years.
Figure 15: Changing Ownership Profile Under Both Equity Mechanisms
0%
25%
50%
75%
100%
Jan Apr Jul Oct Jan Apr Jul Oct Jan Apr Jul Oct
Farmer Roaster

..:: 26 ::..
CHAPTER VII. FINDINGS AND RESULTS
a. Data Parameters
In order to determine if this model will meet my desired effects of stability and enabling, we
must first establish a baseline average for the coffee industry. There are a number of problems
that I wish to address, but I believe the single best indicator will be to improve farmer profits,
with a neutral or similarly positive effect on the roaster’s. Because this model is based on the
premise of disintermediation, i.e. direct trade, much of this profit increase will be withdrawn
from the supply chain itself, because the final price of the (specialty) coffee will not change.
In order to realistically analyze data coming from a diverse market like coffee, where many,
many variables are present, I set the following parameters to control the variables:
Controlled Variable #1: Average retail price of specialty coffee is $21.94 / lb
(Transparent Trade Coffee Organization)
Controlled Variable #2: Coffee is rated as “specialty”, with a cup (Q) score above 85
Controlled Variable #3: Coffee is destined for the US market
I briefly mentioned earlier what the revenue share looked like in the industry according to PBS.
In order to corroborate these numbers, I investigated several other independent channels of
trade. While not identical, one can distill averages from the results. I chose 4 additional
channels with which to compare the PBS numbers. These channels represent different origins,
logistics channels, and organizational levels, and are all real-world cases, though the names
have been changed for privacy purposes.
1. PBS, public broadcasting in the United States, using data from Guatemala
2. Economics Intelligence Unit, The Economist magazine in the United
Kingdom

..:: 27 ::..
3. Tsongo Café, coffee exporter in the Democratic Republic of Congo
4. Tierra Real, coffee exporter in Colombia
5. Hacienda Optima, prospective direct trade farmer in Nicaragua
In order to standardize costs across the different sources and channels, I categorized all supply
chain costs under the 6 supply chain actors we’ve mentioned before.
Controlled Variable #4: There are 6 levels of the supply chain
Figure 16: Typical Supply Chain Actors + Retail
There are a number of fees and costs at each level, so to be consistent, I’ve grouped them to
each of the 6 levels using the following criteria.
FARM EXPORT FREIGHT IMPORT ROAST RETAIL Production Milling Land Transport
Exporter Fees Preparation Port Fees Traders
Transport Insurance
Importer Fees Duties Port Fees
Roaster 15% Loss Wholesale
Beverage Prep. Sales Tax
Table 5: Supply Chain Costs Grouped by Category
b. Cost Escalation
When compiling these supply chain breakdowns, it is important to differentiate two metrics of
comparison: cost escalation, and revenue share. Cost escalation is the increasing price paid
between the levels of the supply chain, leading to the higher, end-user price. Revenue share is

..:: 28 ::..
the portion of the end-user price that is received by each level of the chain. Both of these
numbers, in addition to operating costs, are necessary to reach our final metric, Profit Share.
SELLING PRICE PBS EIU Tsongo Tierra Optima
Farm $2.63 $2.90 $1.18 $2.67 $2.71
Export $3.29 $4.86 $1.53 $3.77 $3.05
Freight $4.17 $5.45 $1.65 $3.89 $3.16
Import $4.83 $6.65 $2.65 $5.06 $4.16
Roast $19.09 $18.67 $15.56 $18.69 $17.52
Retail $21.94 $21.94 $21.94 $21.94 $21.94
Table 6: Selling Prices at Each Level of the Supply Chain
REVENUE SHARE PBS EIU Tsongo Tierra Optima
Farm 12% 13% 5% 12% 12%
Export 3% 9% 2% 5% 2%
Freight 4% 3% 1% 1% 1%
Import 3% 5% 5% 5% 5%
Roast 65% 55% 59% 62% 61%
Retail 13% 15% 29% 15% 20%
Table 7: Revenue Share at Each Level of the Supply Chain
c. Profit
While the numbers above for revenue are fairly reliable because they are public information,
calculating profit and profit share is based on closely-held accounting. The operational costs of
a business are key to its success, and reveal their profit margin, so most businesses are not
quick to share them. I was able to obtain these cost estimates on the condition anonymity.
Because of this unreliability, the next variable I had to control was with regard to the
operational costs of each level, in particular the coffee roaster. Since most coffees are
imported green and roasted in the states, I felt it was appropriate to use the same import and

..:: 29 ::..
roasting costs for all sourcing channels. Note: These are the same numbers that were used in
the cost estimates above for the roaster.
Controlled Variable #5: All channels experience similar roasting and importing costs
Standardized Costs $/lb
Sea Freight $0.10
Air Freight $1.13
Importer $0.30
Roaster $9.32
Table 8: Standardized Cost Assumptions for Supply Chain Actors
PROFIT PBS EIU Tsongo Tierra Optima
Farm $1.53 $1.80 $0.88 $1.57 $1.36
Export $0.41 $1.71 $0.10 $0.85 $0.09
Freight $0.83 $0.54 $0.07 $0.07 $0.06
Import $0.36 $0.90 $0.70 $0.87 $0.70
Roast $4.94 $2.70 $3.59 $4.31 $4.04
Retail $1.85 $1.35 $5.38 $2.25 $3.42
Table 9: Gross Profit for Each Level of the Supply Chain
PROFIT SHARE PBS EIU Tsongo Tierra Optima
Farm 15% 20% 8% 16% 14%
Export 4% 19% 1% 9% 1%
Freight 8% 6% 1% 1% 1%
Import 4% 10% 7% 9% 7%
Roast 50% 30% 33% 43% 42%
Retail 19% 15% 50% 23% 35%
Table 10: Profit Share for Each Level of the Supply Chain

..:: 30 ::..
As you can see, the bulk of the profit is retained by the roaster, followed by the retailer and
farmer. This makes sense given that the costs of operating and living in the consuming
countries is a lot higher than in the producing countries. To account for this disparity, I’ve
adjusted the profits using the Purchasing Power Parity conversion factor at the World Bank to
more accurately reflect the value of these incomes in the countries in which they are received.
PROFIT (PPP) PBS EIU Tsongo Tierra Optima
Farm $3.07 $3.60 $1.47 $3.93 $3.40
Export $0.82 $3.42 $0.17 $2.13 $0.23
Freight $0.83 $0.54 $0.07 $0.07 $0.06
Import $0.36 $0.90 $0.70 $0.87 $0.70
Roast $4.94 $2.70 $3.59 $4.31 $4.04
Retail $1.85 $1.35 $5.38 $2.25 $3.42
Table 11: Gross PPP Profit for Each Level of the Supply Chain
PPP SHARE PBS EIU Tsongo Tierra Optima
Farm 26% 29% 13% 29% 29%
Export 7% 27% 2% 16% 2%
Freight 7% 4% 1% 1% 1%
Import 3% 7% 6% 6% 6%
Roast 42% 22% 32% 32% 34%
Retail 16% 11% 47% 17% 29%
Table 12: PPP Profit Share for Each Level of the Supply Chain
When accounting for purchasing power, the farmer comes off much better than before, even
competing with the roaster at times. It also illustrates the differences between these supply
channels. The farmer receives the least in Congo, likely a reflection of the market price, and
the country’s coffee supply chain’s reputation on the world stage.
We also see a stark difference in the EIU numbers when it comes to the Exporter’s profit share.
This is likely because this channel includes a dedicated coffee trader, whose role fell under

..:: 31 ::..
Exporter in our data arrangement, and he/she has created an arbitrage market for him/herself
to thrive on. This role will not exist in shorter supply chains, and especially not in direct trade.
d. Direct Trade
So the question remains, what impact does direct trade have on profit? Using the standardized
numbers above, we can estimate the cost escalation and profit share of a direct trade model,
but we’ll need to establish more parameters.
Controlled Variable #6: Coffee farmers have the capacity to export their coffee
Controlled Variable #7: Coffee roasters import their own coffee, or hire a courier
By assuring that the farmer can export his/her own coffee, we can remove that individual from
the chain. This is not an unusual capacity for a professional farmer to have, particularly in
moderately proficient coffee producing countries. Large exporters like Brazil, Ethiopia and
Colombia have more restrictions though, because the market has been become its own
bureaucracy. On the other hand, low volume countries like Congo and Indonesia have less
restrictions, but farmers are simply too far removed from the market to be involved in
exporting. The better candidates are in countries like Honduras and Guatemala where the
process for becoming a legal exporter costs a less-than-outrageous sum of money and an
acceptable amount of time to fill out the paperwork. Furthermore, with a direct trade
relationship, there is no need for trading or buyer-finding, so there’s no need for a trader.
On the roaster side, in most cases, direct trade quantities are small and do not require specific
customs brokering. This is particularly relevant when using express couriers like UPS, DHL or
FedEx because they are able to clear customs on behalf of the recipient. For this reason, we
have calculated the cost of direct trade for both air and sea freight.

..:: 32 ::..
SELLING PRICE Direct (Air) Direct (Ship)
Farm $3.90 $3.90
Export $3.90 $3.90
Freight $5.03 $4.02
Import $5.03 $4.02
Roast $18.88 $17.99
Retail $21.94 $21.94
Table 13: Selling Prices for Each Level of the Supply Chain under Direct Trade
REVENUE SHARE Direct (Air) Direct (Ship)
Farm 18% 18%
Export 0% 0%
Freight 5% 1%
Import 0% 0%
Roast 63% 64%
Retail 14% 18%
Table 14: Revenue Share for Each Level of the Supply Chain under Direct Trade
And finally, we have to establish some specific locations and prices in order to estimate the
profit share. For the sake of argument, we will use the same Hacienda Optima farm as our
source, which will allow us to compare it side-by-side with the 5th channel from above.
Controlled Variable #8: The direct trade farmer is located in Nicaragua
Controlled Variable #9: Direct trade will pay $1 more / lb than the next best channel
Our objective in pricing is going to parallel that of Fair Trade arrangements, and in this case,
we’re going to guarantee at least $1 higher per lb than the next best channel, which in our
data set is in the EIU numbers. So for this example, we will use a farm price of $3.90 / lb.

..:: 33 ::..
PROFIT (PPP) Direct (Air) Direct (Ship)
Farm $7.00 $7.00
Export $0.00 $0.00
Freight $0.13 $0.07
Import $0.00 $0.00
Roast $4.03 $4.15
Retail $2.06 $2.95
Table 15: Gross PPP Profit for Each Level of the Supply Chain under Direct Trade
PPP SHARE Direct (Air) Direct (Ship)
Farm 53% 49%
Export 0% 0%
Freight 1% <1%
Import 0% 0%
Roast 30% 29%
Retail 16% 21%
Table 16: PPP Profit Share for Each Level of the Supply Chain under Direct Trade
PROFIT (PPP) 5-Channel Average Direct Trade (Air)
Farm $3.09 $7.00
Roaster $3.92 $4.03
Table 17: Comparing the 5 Channel Average for Gross PPP Profit to Direct Trade
PPP Profit has doubled for the farmer via either air or sea freight, with no appreciable change
to the roaster’s gross profits. It’s interesting to note that the increased freight charges of air
shipments don’t actually affect the profit margins much for either entity. This makes sense
given the immense volumes handled by express couriers, and therefore the efficiency with
which they’re able to move goods. In a sense, despite direct trade being considered
disintermediation, it does in fact only consolidate the roles in the middle of the chain, allowing
the one-stop-shop couriers to handle all of the similar logistics tasks at once.

..:: 34 ::..
CHAPTER VIII. DISCUSSION
a. Barriers
There are many reasons why direct trade hasn’t replaced the commodity market already,
many of which are simply the result of a geographically spread-out industry. Fortunately for
the future however, the internet has already helped close some of these divides, and it can be
leveraged to help small businesses cross distances they never could have dreamt of before.
Restricted Professional Networks
The world of coffee, and logistics for that matter, is an “old world” industry of paper reports
and phone calls. It’s a mesh network of experienced professionals who make things happen,
and products move, based on who and what they know. These networks are not documented,
traceable, or easy to learn. Expanding one’s professional network in such a spread out industry
isn’t easy, and would require ample amounts of time and financial resources. With limits like
these on the personal interconnectedness of the industry professionals, the speed of change is
slackened.
Communication Challenges
It is inherent in a complex system to struggle with communication. The logistics system of the
world is an ad hoc arrangement of independent intermediaries that speak thousands of
languages, currencies and cultures, all of which do not always coordinate or co-develop. There
are international standards, to be sure, but the system will always be restricted by the lowest
common denominator. The best example of this is the continued reliance on paper bills of
laden (BOL), the proof of ownership document necessary for international logistics. There have
been several tech start-ups that have tried to revolutionize this system with an electronic BOL,
but it just hasn’t stuck. (Demetriou, N.) Like any platform, or technological innovation, it only
works if everyone uses it, and that’s hard with several countries around the world experiencing
different levels of technological access.

..:: 35 ::..
Limited Access to Knowledge
Knowledge of the supply chain is tribal, passed from person to person by necessity and lore.
There’s no “Coffee Logistics for Dummies” book that can teach someone everything about the
system, and even if there was, it would be outdated immediately because the system is so
complex, minute changes will happen fast and often.
It’s also difficult to gather hard numbers from anyone in the supply chain because there is a
protective culture of information, each person fearful of losing their competitive advantage.
Most crucially, there is a widespread dearth of familiarity with other parts of the supply chain.
While there may be some camaraderie between supply chain actors for participating in the
same global industry, they are not familiar with the requirements and objectives of each
other’s roles in it. The gap is largest between the top and the bottom, where consumers and
farmers are on different planets when it comes to trans-world understanding.
Inertia of Traditions
For many, the system is working just fine the way it is, and there is no reason to change it.
Tradition has served them well, whether they are a farmer or a roaster, they’ve always sold in
the market and are comfortable where they’re at. For many as well, the income they’re
making is just enough to feed their families, so any risk is unwelcome.
Fear of the Unknown
General fear of the unknown makes any industry development or change unnerving. New
business ventures, such as an international partnership, means new people and new risks.
Without more education or exposure, currently prevented by the previously-mentioned
barriers, fear will always slow the pace of worldwide progress.

..:: 36 ::..
b. Advantages of the International Partnership
The advantages of an international direct trade partnership, especially one with collaborative
investments like the proposed model, are numerous and varied.
Farmer Roaster
Stab
ilizi
ng - Predictable sales location
- Predictable sales price - Predictable sales quantity - Less price volatility - Evened out cash flow thru
season - Time saved “following the
market” - Increased profit share - Won’t need to pursue
certifications
- Ease of sourcing raw materials - Semi-controllable quality - Direct information channel - Shared investment costs - Lowered COGS
Enab
ling - Expand business operations
- Build equity - Direct customer feedback - Potential for future profit
earnings - Potential to sell other farm
products - Can invest without cash
- (Best) Farm to Cup Story - Potential for site visits by farmer - Potential for field trips to origin - Potential for other farm products
Table 18: Advantages of the International Partnership
Stabilizing
Some benefits are simply good for predictability and peace of mind, a.k.a. stability. This
includes knowing in advance how much coffee the farmer is going to sell, for how much, and
to whom. Essentially, it liberates the farm from the effort normally required to follow the
market and sell his/her coffee for the best price, to the point where the farmer doesn’t even
need to follow the commodity market. Time-saving is a big deal for smallholder farmers, so
they’re eager to reclaim time that can be used to accomplish other tasks. On a similar note, the
farmer may not have the same incentives to pay for the time and expenses of certifications,
adding more to his savings.

..:: 37 ::..
It also means the bookkeeping is more predictable, so capital investments in farm equipment
can be planned out more easily. This also applies to the roaster, who can keep his/her own
accounts steady with accurate revenue and cost forecasts. The roaster enjoys a lower cost of
goods sold (COGS) under both investment mechanisms as well, substantially reducing the risk
of failure during the critical first couple years of operation.
Furthermore, the roaster is reassured of the quality coming in because he/she knows that
there is a communication channel open with which to have some control over the raw
materials he’s using.
Enabling
The partnership is also a boon to business, enabling the farm by building direct equity in
another business, and offering him new incentives and tools to improve his existing
operations. Communication is the key to the later, and a direct relationship is simply the best
way to communicate up and down the chain. As the farmer’s quality improves with the
collaboration of the partnership, so will the value of both of his businesses.
The farmer can also earn through more income streams. For example, once the direct supply
channel is established, the farmer can also offer related products like Cascara, or cultural
merchandise. And better yet, with equity shares in the roaster, the farmer will be entitled to a
growing business’ increasing worth, and depending on the agreement, perhaps a direct share
of the profits. What’s more, this model enables a farmer to expand his business without having
to invest cash, but instead welcomes an investment-in-kind that is more readily accessible to
him/her.
For the roaster, it’s all about the marketing. The third wave coffee movement is here to stay,
and a thoroughly Farm-to-Cup enterprise is bound to succeed. The roaster will not only be able
to claim the most direct connection with a farmer, but also offer a suite of other products and

..:: 38 ::..
services tied to it, such as origin trips, cultural merchandise, and seminar visits from the
farmers themselves.
c. Disadvantages of the International Partnership
There are certainly disadvantages to this partnership model as well, and it wouldn’t work or be
the best fit for everyone. The scalability is limited by these restrictions, as well as the greater
ethos of the “glocal” movement, which is basically antithetical to the concept of scalability.
Farmer Roaster
Disa
dvan
tage
s - Added risk of roaster viability - Miss out on high price markets - Opportunity Cost of Investment
- Reliance on a single source - Shared ownership control
Table 19: Disadvantages of the International Partnership
Both parties are accepting a new risk that they were not previously familiar with, and that’s
the human risk of a business partner. In both directions, each person runs the risk of the other
being incapable of managing a profitable business, or worse, that the person is a scammer.
This issue of trust is best addressed by building a background together through conversations,
visits, and whenever possible, through mutual acquaintances that can serve as character
witnesses.
The farmer also runs the risk of missing out on higher market prices that could be available
elsewhere had he/she sold their coffee directly to market. This can be addressed by giving the
farmer the option to sell a portion or all of his crop to market if it will serve him better, but
ultimately I believe it will be better for him to accept the already negotiated high price because
of the predictability it offers him in the long run. For example, it is highly unlikely the market
price for coffee will rise anywhere near $3.90 / lb, which is what our direct trade model
offered the partner farmer earlier in our analysis.

..:: 39 ::..
For the roaster, the main concern is sourcing from a single farm. Should the farm experience
any harvest mishaps and not be able to deliver, the roaster will have to source from
somewhere else, leaving him right where he was when he started. While market-sourcing still
works as a distant back-up option, additional mechanisms can be arranged in advance that
keep with the social mission as well. One idea would be to build a community of local roasters,
each with their own direct trade relationships spread out around the world. If something were
to happen to a source farm, other roasters in the community would be able to provide green
coffee from their own direct trade farms to help cover the loss. This would ensure the
continuity of the direct trade mission, and build collaboration communities at home.
Additionally, both parties will undoubtedly struggle with the idea of sharing control. This is a
common problem in all partnerships, personal and professional, and it will have to be
discussed during contracting – topics such as naming rights, dividends, profit reinvestment,
and marketing strategies to name a few.
d. Thoughts on Implementation
Discussions on contracting bring up a lot of concerns about how to actually implement an
international partnership. There are nearly unlimited ways to structure the business
relationship, but there are some key attributes that would be ideal to find in the target
candidates for such a collaboration.
Identifying the Right Candidate
Farmer Roaster

..:: 40 ::..
Idea
l Tra
its - Access to coffee processing
(preferably in-house) - Able to export - Small to Medium-sized farm - Able to invest ~ $10,000 of
coffee - Professional, entrepreneurial
attitude - Wants more stability over prices - Wants to expand operations - Willing to hear customer
feedback
- Looking for investment partner - Able to import coffee - Interested in direct trade - Wants to sell a story - Wants better access to coffee
origins - Sells 500+ lbs per month - Experienced roaster - Interested in coffee education
Table 20: Identifying the Ideal Traits
There are a lot of desirable qualities, but in both cases the ideal candidates will be professional
and entrepreneurial-minded individuals. There will need to be a desire and a willingness to
deal in direct trade, coffee education programs, and more importantly, a mutually-constructive
collaboration relationship with someone on the other side of the world.
A farmer should be small to medium-size, and have the ability to process and export their
coffee. A roaster should have the ability to import coffee themselves, or through a contracted
courier, and sell at least 500 lbs of roasted coffee per month.
Furthermore, there is a lot of room for flexibility in the terms of the contract regarding
quantities, prices, timing and equity dispersal methods. A farmer may settle on virtually any
percentage as an equity goal, but I imagine that most roasters will not be willing to give up
more than 49%. There is also room to split up that 49% among multiple farms, in the event
that an international partnership is formed between a roaster and a farming co-op or guild.
The specific conditions and terms of a contract are best left to a legal expert, and would be an
interesting follow-on topic for this thesis.

..:: 41 ::..
CHAPTER IX. CONCLUSIONS
Collaboration is the ultimate tool for small businesses because it serves as a force-multiplier
that lets limited-resource entities compete with big players. In the case of coffee, we are
talking about smallholder farms, local roasters, and independent cafes. It’s a small, but
turbulent niche market though. There are competing demands to produce commercial volume,
high quality products, and at the same time, maintain the intimacy of local sourcing. This is the
proving ground for small businesses – a time to capitalize on a market that craves them. They
only need the tools to enter the game. Collaboration is that tool, and partnerships are the
most direct manifestation of it. In the long-run, smallholder farmers can benefit tremendously
from setting up an international partnership, and in-turn, help a small roaster survive a start-
up period that’s known to be rife with difficulties. Collaborative partnerships offer a
harmonious balance of stability and enabling to keep the company both steady and forward-
moving.
There are clear communication benefits as well, all of which help advance the industry as a
whole, rather than only furthering the needs of individual businesses. By bridging the global
communication gap in the coffee supply chain, small coffee businesses will be able to connect
consumers directly with their products’ origin, a concept under-realized by the status quo of
traceability and certifications. With a direct channel from farmer to roaster, i.e. Farm-to-Cup,
consumers will consume not only coffee, but specific knowledge and personal familiarity with
coffee farming. And this is good news for all specialty coffee businesses, because better
consumer education leads to more-informed purchases, and more purchases means more
business in the café. As they say, “a rising tide lifts all ships”.

..:: 42 ::..
CHAPTER X. BIBLIOGRAPHY
Cafe De Colombia. "The Coffee People." Cafe De Colombia, n.d. Web. 16 Sept. 2016.
<http://www.cafedecolombia.com/particulares/en/la_tierra_del_cafe/la_gente_del_cafe/>.
Carroll, Tom, Andrew Stern, and Dan Zook. "Catalyzing Smallholder Agricultural Finance." Catalyzing
Smallholder Agricultural Finance Acknowledgements and Authorship (2012): n. pag. Dalberg. Sept. 2012.
Web. 16 Sept. 2016. <http://dalberg.com/documents/Catalyzing_Smallholder_Ag_Finance.pdf>.
Charles, Dan. "Coffee For A Cause: What Do Those Feel-Good Labels Deliver?" NPR. NPR, 24 Apr. 2014.
Web. 16 Sept. 2016.
Council on Smallholder Agricultural Finance. "2014 Year In Review." (2015): n. pag. The Council on
Smallholder Agricultural Finance (CSAF), 16 July 2015. Web. 16 Sept. 2016. <http://www.csaf.net/wp-
content/uploads/2015/07/2014-Year-In-Review-web.pdf>.
Demetriou, Nicholas. "Electronic Bills of Lading: Why It’s Different This Time." The Baltic Briefing.
EssDOCS, 4 Mar. 2015. Web. 16 Sept. 2016. <http://thebalticbriefing.com/2015/03/04/electronic-bills-
of-lading-why-its-different-this-time/>.
Field, Anne. "A Supply Chain Overhaul To Boost Coffee Farmers' Income 400%." Forbes. Forbes
Magazine, 16 July 2014. Web. 16 Sept. 2016. <http://www.forbes.com/sites/annefield/2014/07/16/a-
supply-chain-overhaul-to-boost-coffee-farmers-income-400/#2eccd76947b3>.
Galindo, Mauricio. "Climate Change and Coffee." Masters of Coffee Science and Economics - Ernesto Illy.
Trieste, Italy. Lecture.
Gualdi, Silvio. "Coffee Cultivation and Climate Changes." Masters of Coffee Science and Economics -
Ernesto Illy. Trieste, Italy. Lecture.
Graham, Stockton. "What Determines the Price of Green Coffee? -." Stockton Graham Co. N.p., 12 Aug.
2014. Web. 16 Sept. 2016.
Janssen, Rivers. "The Certificate Conundrum." Roast Magazine (2011): n. pag. Roast Magazine. Web. 16
Sept. 2016.
Lyall, Sarah. "Trying to Pin Down the Mosaic of Millennial Tastes." The New York Times. The New York
Times, 15 May 2016. Web. 15 June 2016.
National Coffee. "What Are We Drinking? Understanding Coffee Consumption Trends." The First Pull.
National Coffee Association USA, 19 Mar. 2016. Web. 15 June 2016.

..:: 43 ::..
Peressotti, Alessandro. "Coffee Cultivation and Climatic Changes." Masters of Coffee Science and
Economics - Ernesto Illy. Trieste, Italy. Lecture.
SBA Office of Advocacy. "Small Business Economics." (n.d.): n. pag. Small Business Administration (SBA),
June 2012. Web. 16 Sept. 2016. <https://www.sba.gov/sites/default/files/Business-Survival.pdf>.
Specialty Coffee Retail Price Index. "Specialty Coffee Retail Price Index – 2015, Q2." Transparent Trade
Coffee Organization (TTCO), 15 July 2015. Web. 16 Sept. 2016.
<http://transparenttradecoffee.org/insights/specialty-coffee-retail-price-index-2015-q2>.
United Nations. Food and Agricultural Organization (FAO). Framework for Analysing Impacts of
Globalization on Smallholders. By John Dixon, Aysen Tanyeri-Abur, and Horst Wattenbach. Rome:
Agricultural Management, Marketing and Finance Service (AGSF), 2004. Smallholders,globalization and
Policy Analysis. Agricultural Management, Marketing and Finance Service (AGSF), 2004. Web. 16 Sept.
2016.
Whalen, Kelly. "Your Coffee Dollar." PBS. PBS, May 2003. Web. 16 Sept. 2016.

The End


![Blandino GIovanni MD CV January 2013 31[1] · p53 axis promotes aggressiveness in breast cancer", Università degli Studi di Trieste, Trieste, Italy 2010 (Opponent). Organization](https://static.fdocuments.in/doc/165x107/5b2dd5797f8b9a594c8cef3e/blandino-giovanni-md-cv-january-2013-311-p53-axis-promotes-aggressiveness.jpg)