Università degli Studi di Padova Dipartimento di Biologia ...

UNIVERSITÀ DEGLI STUDI DI PADOVA
Dipartimento di Scienze Economiche ed Aziendali “Marco Fanno”
LATE CAREER OF SUPERSTAR SOCCER PLAYERS:
WIN, PLAY, OR GAIN?
MARTINA GIANECCHINI
University of Padova
ALBERTO ALVISI
University of Padova
January 2015
“MARCO FANNO” WORKING PAPER N.192
Late career of superstar soccer players: win, play, or gain?
Martina Gianecchini
“M. Fanno” Department of Economics and Management University of Padova
Via del Santo 33, 35123 Padova (Italy) [email protected]
Alberto Alvisi “M. Fanno” Department of Economics and Management
University of Padova Via del Santo 33, 35123 Padova (Italy)
Paper submitted to 30th EGOS Colloquium,
Rotterdam, July 3-5, 2014
Sub-theme 01 (SWG): Beyond the Mainstream: Careers of Special Groups

1
Introduction
Athletic career is defined as “multiyear sport activity, voluntarily chosen by the person and
aimed at achieving his or her individual peak in athletic performance in one or several sport
events” (Alfermann & Stambulova, 2007; p. 713). The career of athletes has received
considerable attention by sport psychology and medicine (e.g. Stambulova, Alfermann, Statler
& Côté, 2009; Wylleman, Alfermann & Lavallee, 2003; Willeman & Lavallee, 2003). On
average, athletes start their career at the age of 7 to 10 years and sometimes even earlier,
depending on the type of sport. After the age of 27 their sport-related performance starts
progressively to decrease due to the ageing process (Stambulova, Stephan & Jäphag, 2007),
and by their mid-thirties they retire. However, the trajectory described by this process poorly
fits the career of some athletes who extended their career over the “regular” transition points
indicated by the literature, at the same time continuing to compete at professional level and
earning rich salaries. Such as Kobe Bryant, 35 year old basketball player of Los Angeles
Lakers, who is the NBA's highest-paid player and who has signed at the end of 2013 a two
years contract according to which he will receive USD 23.5 million in the first year and USD
25 million in the second year. Or like Didier Drogba, Ivorian soccer player who signed in
2012, when he was 34, a one-year contract with the Chinese team Shanghai Shenhua for the
value of USD 14 million. These athletes are characterized by being superstar players (just
superstars from now on), such as talented performers who are in the highest percentiles of the
salary distribution in their occupational market (Rosen, 1981). Therefore, even if they are
entering the latter part of their career (when the ageing process decreases their athletic
performances, thus reducing their job alternatives) such athletes have, possibly for the last
time, good career opportunities, due to their individual characteristics (Forrier, Sels & Stynen,
2009). For instance, in the case of team sports, they may join a top team in order to achieve
relevant sport-related results (e.g. win a national or international competition), or sign a
contract with lower-tier teams, or teams competing in emerging leagues, in order to obtain
more favourable per-year salary, to maximize their overall compensation, or to lengthen their
athletic career. In all these cases, their career trajectory deviates from the “traditional” model,
thus suggesting alternatives strategies to manage late career.
The aim of this study is to explore the job mobility of superstar soccer players who are
entering the declining phase of their athletic career. Studying a sample of European soccer
superstars, we will describe their last job transitions identifying a typology of individuals and
their relative late career choices.

2
This study offers potential contributions to both sports and career literature. The sport
psychology literature focuses on describing the feelings and the emotional reactions related to
the retirement from sport: we add to this literature exploring the job changes which precede
the declining phase and the retirement. Secondly, our study is relevant also for the career
literature, because it explores the career choices of a special group which characteristics
resemble the profile of other professional groups (e.g. high level professionals, top managers)
but that received scant attention. Finally, exploring the transition between career cycles (from
athletic to post-athletic career), we contribute to the developmental approach to career.
Theoretical background
Athletes’ career development
Descriptive models of athletic career (Côté, 1999; Stambulova, 1994; Wylleman & Lavallee,
2003) define it as a succession of stages (initiation/sampling, development/specialization,
perfection/mastery/investment, final/maintenance, and discontinuation), which represent a
common pattern in the careers of athletes, regardless of the sport practiced and the
individual’s characteristics. Similar models have been also proposed by the non-sport related
literature (e.g. Levinson, 1986; Super, 1980), suggesting that people experience three main
career stages: early career (development of the work-related skills); middle career (mastering
of the work competencies and development a broader perspective about life and work); late
career (progressive disengagement from work and exploration of activities outside the current
job).
The athletic career development is punctuated by transitions between the stages: some of
them are related to the sport activity (e.g. injuries, transition from amateur to professional),
other concern non-athletic aspects of the individuals’ life (e.g. getting married, graduating).
Wylleman and Lavallee (2003) suggested to classify all these transitions in two categories:
normative and non-normative. The former includes predictable passages from one stage to
another, that can be anticipated and planned by the athletes. The latter is related to unplanned
events that take place in an unforeseen and involuntary way. Retirement due to the aging
process is one of the most important normative transitions in the athletic career, which has
been generally studied in terms of perceived transition demands, coping strategies and
resources for the adaptation to the post-career, and life consequences (e.g. Cecić Erpič,
Wylleman & Zupančič, 2004; Torregrosa, Boixadós, Valiente & Cruz, 2004).

3
Focusing our attention on the career stage preceding the retirement (namely the
discontinuation phase), only few models included it (e.g. Côté, 1999; Wylleman & Lavallee,
2003). During such phase, athletes usually reduce their participation in competitions at the
level they had previously achieved, at the same time continue training. Because their focus is
on concluding their athletic career and starting a new professional career, they redirect their
life and perceive sport as a part of their life history (Alfermann & Stambulova, 2007).
The process of transitioning out of competitive sport can have a relatively long duration
(Wylleman, Alfermann & Lavallee, 2004), and it is characterized by some problematic
aspects.
First, individuals who identify strongly with the athlete role may experience identity
difficulties (Lally, 2007). During the discontinuation phase, individuals foresee a time
following retirement when their identities would be suspended between their athlete selves
and new selves: they will loose their status, be barred from their peer group, reduce their
physical commitment. In order to smooth this process, some athletes can engage in forms of
“phased retirement” (Inkson, Richardson & Houkamau, 2013), intended as formal and
informal employment arrangements aimed at reducing the individual workload while allowing
the player to continue to contribute to the team, or they can decide to close their career with a
“bridge employment” (Greller & Simpson, 1999), hence signing a short-term contract aimed
at transitioning to the retirement. Whichever the chosen alternative would be, studies
consistently demonstrated a positive but decreasing impact of player age on salary (Frick,
2007), hence suggesting that the late career arrangements are, on average, scarcely profitable.
Together with a decrease in their economic status, older athletes must face a change in the
professional goals due to the ageing process (Salmela-Aro, 2009). Indeed, during the
discontinuation phase, the individuals have fewer opportunities to achieve top athletic goals
(Heckhausen, Wrosch & Schulz, 2010). For instance, as showed in soccer by Fry, Galanos
and Posso (2014) in an analysis of a top Champions League goals scorers from 1991 to 2011,
the relationship between the age of the player and the goals scored in match has a reverse U-
shape: as a player gets older he becomes more technical and accustomed to playing high level
football, however his physical capacity decreases. Schulz and Heckhausen (1996) described
this process in their “life span theory of control”, suggesting that as the age increases,
individuals progressively lose their primary control over the environment (i.e. changing the
world to bring the environment into line with one’s wishes) hence being forced to adapt their
goals to external contingencies. Therefore, individuals will more likely avoid devoting their
effort to career goals where major gains are no longer attainable, while engaging in goals
4
where the attainment opportunities are favourable.
Superstar players
According to a recent article published in Forbes (May 7, 2014), Cristiano Ronaldo is the
highest-paid soccer player for the 2013 having earned a salary of USD 49 million, which is
about forty times the average pay of a player in the soccer league (the Spanish La Liga) where
he plays. Why does Cristiano Ronaldo earn such a disproportionately high salary? The answer
to this question represent the core of the “superstar phenomenon”, which is defined by Rosen
to be one “wherein relatively small numbers of people earn enormous amounts of money and
dominate the activities in which they engage” (1981, p. 845).
In the literature, there are basically two competing—but not mutually exclusive—theories of
superstar formation proposed by Rosen (1981) and Adler (1985).
According to Rosen (1981), extraordinary salaries earned by superstars are driven by a market
equilibrium that rewards talented people with increasing returns to ability. In her works, the
author shows how, for a restricted number of lyrics performers, even small differences in
talent could lead to enormous differences in revenues, also because of the amplifying effect of
technology. Therefore, superstars arise in markets in which the production technology allows
for joint consumption and where a vast audience is reachable because of scale economies.
Still in the music industry, Krueger (2005) demonstrates how uneven the revenue distribution
is in the so called “Rockeconomy”, i.e. the market for rock concerts, where top 1% and 5%
artists, respectively, escalated their share of total revenues from 26% and 62% in 1982, to
56% and 84% in 2003. Because poorer quality is only an imperfect substitute for higher
quality, most people tend not to be satisfied with the performance of a less talented but
cheaper player when they are able to enjoy a top performance, even if the costs are somewhat
higher. As a consequence, small differences in talent among performers are magnified into
large earnings differentials. For instance, in the sports market, analysing the revenues
distribution in the Professional Golf Association (PGA), Scully (2002) demonstrated that
despite an average of USD 658,000, top PGA performers reach the USD 9mil mark, which is
roughly 2347 times more than what the worst performers.
A second interpretation of the superstar phenomenon is offered by Adler (1985), who
analyses the role played by positive network externalities of popularity. Adler argues that the
marginal utility of consuming a superstar service increases with the ability to appreciate it,
which depends not only on the star’s talent, but also on the amount of star-specific knowledge
the consumer has acquired. This specific knowledge—called consumption capital—is
5
accumulated through past consumption activities or by discussing the star’s performance with
likewise knowledgeable individuals. The latter effect gives rise to positive network
externalities. For instance, Franck and Nüesch (2012) demonstrated that non performance-
related popularity (measured in terms of number of articles mentioning the player’s name)
contributes to the market value differentials in the highest German soccer league.
But, what are the motivations for a team to pay a disproportionate salary to a superstar player?
Superstars have superior skills (e.g., talent, experience in high-level competitions, knowledge
of the most subtle facets of the game, guile) that can contribute to the team performance both
sustaining field successes and offering learning opportunities to the other players in the team
(Scully, 1989). Furthermore, because of their superstar status, they are internationally
recognizable and their popularity attracts audience to both the team and the league in which
they play in (Hausman & Leonard, 1997).
Given the peculiarities of the superstar phenomenon, we are then interested in analysing to
what extent the late career of such players fits the characteristics of the “discontinuation
phase” depicted in the previous paragraph. Or rather, whether their status influences their
career opportunities opening alternative avenues to their late career.
Methodology
In our quest for superstar players, we decided to focus on the four most important European
soccer leagues in terms of total revenues: Italy, Germany, Spain, and England.
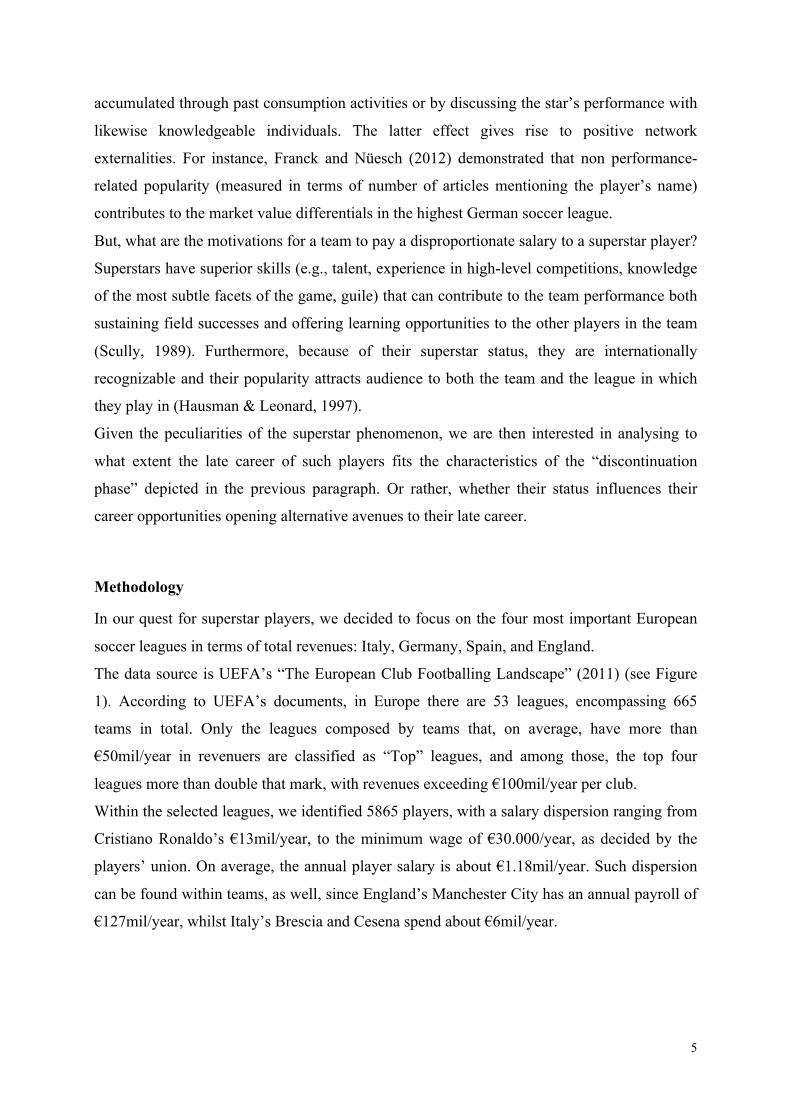
The data source is UEFA’s “The European Club Footballing Landscape” (2011) (see Figure
1). According to UEFA’s documents, in Europe there are 53 leagues, encompassing 665
teams in total. Only the leagues composed by teams that, on average, have more than
€50mil/year in revenuers are classified as “Top” leagues, and among those, the top four
leagues more than double that mark, with revenues exceeding €100mil/year per club.
Within the selected leagues, we identified 5865 players, with a salary dispersion ranging from
Cristiano Ronaldo’s €13mil/year, to the minimum wage of €30.000/year, as decided by the
players’ union. On average, the annual player salary is about €1.18mil/year. Such dispersion
can be found within teams, as well, since England’s Manchester City has an annual payroll of
€127mil/year, whilst Italy’s Brescia and Cesena spend about €6mil/year.
6
Figure 1 - The European soccer leagues (Source: UEFA, The European Club Footballing
Landscape, 2011)
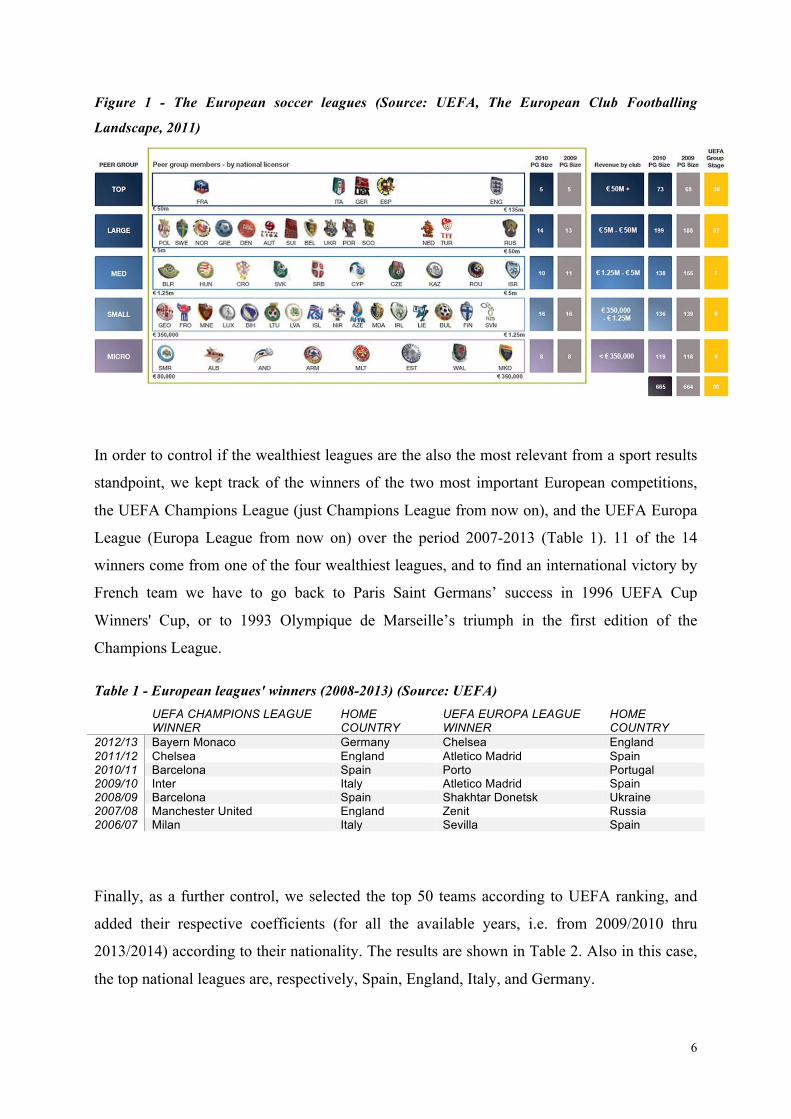
In order to control if the wealthiest leagues are the also the most relevant from a sport results
standpoint, we kept track of the winners of the two most important European competitions,
the UEFA Champions League (just Champions League from now on), and the UEFA Europa
League (Europa League from now on) over the period 2007-2013 (Table 1). 11 of the 14
winners come from one of the four wealthiest leagues, and to find an international victory by
French team we have to go back to Paris Saint Germans’ success in 1996 UEFA Cup
Winners' Cup, or to 1993 Olympique de Marseille’s triumph in the first edition of the
Champions League.
Table 1 - European leagues' winners (2008-2013) (Source: UEFA) UEFA CHAMPIONS LEAGUE
WINNER HOME COUNTRY
UEFA EUROPA LEAGUE WINNER
HOME COUNTRY
2012/13 Bayern Monaco Germany Chelsea England 2011/12 Chelsea England Atletico Madrid Spain 2010/11 Barcelona Spain Porto Portugal 2009/10 Inter Italy Atletico Madrid Spain 2008/09 Barcelona Spain Shakhtar Donetsk Ukraine 2007/08 Manchester United England Zenit Russia 2006/07 Milan Italy Sevilla Spain
Finally, as a further control, we selected the top 50 teams according to UEFA ranking, and
added their respective coefficients (for all the available years, i.e. from 2009/2010 thru
2013/2014) according to their nationality. The results are shown in Table 2. Also in this case,
the top national leagues are, respectively, Spain, England, Italy, and Germany.

7
Table 2 - Top European leagues as a sum of clubs’ UEFA coefficients (Source: UEFA) Nation Sum of UEFA clubs’ coefficients
ESP 692.422
ENG 627.265
ITA 467.919
GER 417.556
FRA 353.742
RUS 235.683
POR 232.948
NED 228.498
BEL 58.949
AUT 45.949
SUI 52.959
UKR 189.726
GRE 61.387
TUR 55.340
DEN 71.042
In Appendix we present see the overview of the main indicator for the selected leagues.
We then proceeded in collecting data for any of the 5865 players that played during the
observation period. The variables include:
• Salary (net), irrelevant of performance-related prizes, image rights agreements, and
other tangible or intangible emoluments (housing, means of transport, etc)
• Minutes played, weighted. Extra times are accounted for, but for uniformity’s sake we
decided to exclude:
o National competitions (Coppa Italia, FA Cup, DB Pokal, Copa del Rey,
Capital One Cup)
o National “Supercups” (i.e. matches between winners of different national
competitions)
o International competitions (Intertoto Cup, Europa League, Champions League,
UEFA Supercup, FIFA Club World Cup)
o Tie-breaker matches for relegation or promotion, present in Bundesliga since
the 2009/2010 season
o The need to weight the playing time comes from the smaller number of teams
playing the Bundesliga, just 18, compared to other leagues’ 20
• Age, what was calculated according to the solar year of birth, instead of to the age at the
beginning of the official UEFA season, not to discriminate between players born
before and after July, 1st. For example, despite his month of birth, a player born in

8
1982 was listed as 30 years old at the beginning of the 2012-2013 season.
• Nationality, including by birth and any other citizenship acquired thereafter
• Expiry date of the current contract, calculated in years, and conventionally set at June
30th of that year.
Just for the players composing the final sample (see next paragraph), we collected further
information:
• Number of national trophies won: championships, national cups, league cups, national
supercups;
• Number of international trophies won: Champions league, Europa League, European
Supercup, other intenational trophies equivalent to UEFA tournaments, FIFA Club
World Cup);
• Number of trophies won with the national team: FIFA World Cup, Continental
Championships, Confederations Cup, Olympics. Juvenile or youth tournaments were
not considered;
• Number of games played with the national team;
• International event year: we kept track of any major international event during the year
of observation
• Number of previous teams, excluding current team
• Team’s UEFA ranking
• Δ player salary (compared to previous year’s salary)
Our primary data source was the website www.fussballtransfert.com. Since it was almost
impossible to obtain official data, which are extremely hard to obtain for such a large number
of players, we run a reliability test comparing the data with the one published annually by the
Italian most important sports newspaper, “La Gazzetta dello Sport”. As we can see in Table 3,
on average the two sources of data differ by 4.06%. Furthermore, we run a Kolmogorov-
Smirnov test to compare the two distributions, looking for differences in between the two sets
of data.
Table 3 - Comparison between Gazzetta dello Sport and Fussball-transfert (values in € millions) Gazzetta dello
sport* Fussball-transfert*
Difference Difference %
2008/09 425.17 432.06 6.89 1.62 2009/10 449.19 467.47 18.28 4.07 2010/11 447.41 475.03 27.61 6.17 2011/12 432.35 448.56 16.21 3.75 2012/13 339.48 417.14 17.66 4.67
Total 2153.61 2240.26 86.65 4.06

9
The results, shown in Table 4, confirm the overall fit of the two distributions.
Table 4 - Kolmogorov-Smirnov rest results Gazzetta dello Sport Fussball-transfert N 2627 2627
Normal Parameters a.b Mean .8253 .8541 Std. Deviation 1.07193 1.09565
Most Extreme Differences Absolute .259 .238 Positive .259 .238 Negative -.229 -.226
Kolmogorov-Smirnov Z 13.271 12.224 Asymp. Sig. (2-tailed) .000 .000
The sample
Since our aim is to explore superstars’ late careers, we have first to define who is a
“superstar” in the world of professional soccer and then which is the transition moment to the
discontinuation phase.
Despite a number of performance-related measures which tried to measure the “talent” factor
identified by Rosen (1981) as the key element in order to explain the disproportionate salaries
of superstar players (see for example Brown, Spiro & Keenan, 1991; Burdekin & Idson, 1991;
Groothuis, Hill & Perri, 2009; Hausman & Leonard, 1997; Scott, Long & Somppi, 1985), the
lack of an unambiguous performance indicator and the variety of roles in soccer rendered this
approach to identify superstars extremely difficult. We therefore followed Hakes and Turner
(2009) example and defined as superstars the players belonging to the fifth quintile in salary
distribution. Before drawing the final sample, we must be sure that the professional soccer
market labor is indeed a superstar economy. In order to answer to this requisite, we calculated
the Gini coefficient for the European soccer leagues. According to Scully (1995), in team
sports the Gini coefficient is usually 0.27 (with 0 being an extremely homogenous
distribution, and 1 an extremely inhomogeneous one), but in PGA he found a Gini coefficient
of 0.57 which indicates a strong superstar effect in salary distribution. As we can see in Table
5, over the observation period the average Gini coefficient was 0.53, extremely close to
Scully’s results, thus indicating that indeed we are facing a superstars economy.
Table 5 - Gini coefficient for the top 4 European soccer leagues SERIE A EPL BUNDESLIGA LIGA AVERAGE
2008/09 0.58 0.49 0.53 0.54 0.54 2009/10 0.54 0.50 0.53 0.57 0.54 2010/11 0.53 0.50 0.53 0.60 0.54 2011/12 0.52 0.50 0.50 0.59 0.53 2012/13 0.49 0.49 0.51 0.60 0.52
AVG. 0.53 0.50 0.52 0.58 0.53

10
Concerning the definition of the discontinuation phase, we were not able to find any specific
evidence of the average sports longevity of soccer players, so we relied on similar studies
about the careers of other athletes. According to Stambulova et al. (2007), an athlete’s career
is over after, on average, 15 years. Unfortunately, just 23 of the 157 subjects of that study
played in team sports, thus making the conclusions hardly extendable to our context. In
addition, different contributions disagree about the age at which an athlete’s performance
peaks (Hakes & Turner, 2009; Horowitz & Zappe, 1998; Stambulova et al., 2007), an
additional indicator that team and non-team based sports, as well as contact (such as
American football) and non-contact sports (such as tennis) may differ severely in terms of
athletic and psychological requirements and wear. The contribution that was closest to our
need, and was eventually used as a blueprint, is a hazard rate-based study by Groothius and
Hill (2004), that found out that superstar National Basketball Association athletes peak at age
27, have an average career of 14 years and retire at 35 (given an average age at draft of 21).
We therefore calculated the average length of the contracts signed by our players during the
observation period, which turned out to be 3 years, and therefore decided to focus on players
that were 32 or older during the observation period.
The result is as shown in Table 6, giving us a population of 348 players.
Table 6 - Superstar players that turned 32 during the observation period Serie A EPL Bundesliga Liga Total
2008/09 35 12 10 11 68 2009/10 28 16 14 16 74 2010/11 28 12 15 14 69 2011/12 32 21 13 11 77 2012/13 26 14 11 9 60
Total 149 75 53 61 348
Among these, we selected all players that made a career-related decision, in terms of signing a
new employment contract. The decision is articulated as follows:
• Change of team/league. This decision is further articulated as: within the same league,
within one of the top 4 leagues, in other leagues
• Salary. Any salary change beyond €0.18mil, which is the threshold often used by team
to spread salary over several contract years, looking for fiscal benefits
• Contract expiry date. Of course no variation was registered if, for example, expiry date
was 3 years late at t0, and 2 years later at t1.
Finally, we excluded those players that retired from professional soccer within the 2nd year of
the observation period. Our final sample is therefore composed by 192 players.

11
Results
We conducted a K-means cluster analysis, in order to identify a typology of players’ late
career. The descriptive statistics of the variable used for clustering are shown in Table 7.
Table 7 - Descriptive statistics (n=192). Standardized variables. 1=new contract/new team
Minimum Maximum Mean Std.
Deviation Variance Salary (old team) 1 10 3.17 1.482 2.198 Minutes old team (weighted) 0.0000 1.0000 .464337 .2806231 .079 Uefa rank old team 1 155 32.52 43.628 1903.424 Old contract expiry date 1 5 1.58 .775 .601 Salary (new team) .17 8.85 2.4991 1.65937 2.754 Minutes new team (weighted) 0.0000 1.0000 .458647 .2747960 .076 Uefa rank new team 1 256 61.98 61.010 3722.173 New contract expiry date 1 4 1.52 .738 .544 Valid N (listwise)
Our results are shown in Table 8 show three clusters of players:
• Cluster 1 (n = 35) includes players that are willing to sacrifice a great deal of their
previous salary in order to compensate for the decrease of the Uefa rank, that seems to
affect most players in our sample. On average, within the sample the Uefa rank of the
new team is twice as low as the previous one. Players in Cluster 1 show significant
and strong deviation from the sample average, both in terms of salary (strong
decrease, whereas the average shows a modest decline) and of Uefa Rank (which
increases, contrarily to the other two clusters), that basically compensate the average
decline of the sample. They do not differ from the sample average under the other two
dimensions.
• Cluster 2 (n = 48) players suffer a decrease in salary similar to the sample average
(21%), but are very active in seeking longer contracts. The incoming team has a
considerably lower Uefa rank than the one they left. At the same time, the minutes
played seem to increase, maybe showing the increased role of the “status” of the
player within the new team.
• Cluster 3 (n = 109) is the most populous. Is composed by players that seem to leverage
their fame in order to obtain a last, relatively short but lucrative contract. In exchange,
they seem to be willing to accept a conspicuous drop in the prestige of the incoming
team, and the minutes they play are limited.

12
Table 8 - Final cluster results. Distance form cluster centers
Cluster
1 2 3 Variation in salary -.79913 .09513 .22749 New contract lenght -.00038 .99627 -.48950 Variation in Uefa Rank -1.67454 .24336 .47584 Variantion in minutes played (weigthed) .11070 .67529 -.37375
We run additional post-hoc analysis, in order to identify differences among clusters along
personal characteristics of the players (Table 9).
Table 9 – Post-hoc Anova tests (only statistically significant coefficient are shown) Quantitative variables Mean difference Age No diff Number of previous teams No diff N. of national trophies won No diff N. of international trophies won No diff N. of trophies won with the national team No diff N. of games played with the national team No diff Total career payroll No diff Qualitative variables At least one national trophy won Cl1 – Cl3 = -3.217* At least one international trophy won Cl1 – Cl3 = -.92631* At least one trophy won with the national team No diff Same incoming and outgoing leagues No diff World Cup year No diff Confederations Cup year No diff Other federation cup year No diff
Our ANOVA results show significance for just two of the qualitative variables (Games–
Howell test), namely Number of national trophies won and Number of international trophies
won. In both cases, Cluster 1 players won considerably more trophies than Cluster 3 players
did. As for the quantitative variables, the Crosstabs analyses did not show any significant
difference among clusters, as demonstrated by the Chi-squared values.
Discussion and conclusions
The aim of this paper was to explore the late career of superstar players in order to verify to
what extent their “superstar status” brings them to deviate from the trajectories depicted by
the descriptive models of athletic career. The results of our analysis, conducted on a sample of
superstar soccer players competing in the four major European leagues, offer interesting
insights for both the sport management and the career literature.
Firstly, our findings suggest that within the group of the older superstar players not all of
them follow the same late career trajectory. And that such trajectories are only marginally
13
affected by the players’ athletic and professional background. This simple finding supports an
approach to the career decision-making where the agent (and not the structure in which he is
embedded) is more relevant in determining his/her professional development. Therefore, as
suggested by Drahota and Eitzen (1998), even if on average superstar players may benefit of
more job opportunities compared with non-superstar players, because their fame makes them
“marketable” for their public relations value, they can exploit such opportunities in different
ways according to their motivations (Park, Tod & Lavallee, 2012) and their image of the
retirement (Torregrosa et al., 2004). In these terms, this result suggests that they can benefit of
an extended primary control over their professional environment (as in Schulz and
Heckhausen (1996) model) compared with non-superstar players. In our analysis, we do not
have information about the individual decision-making process, but further studies may
analyse such aspects in order to verify to what extent superstar players differ from “regular”
athletes.
Our findings offer a clear picture of three distinct disengagement trajectories.
The majority of the sample (Cluster 3) follows a trajectory that we may label as “profit-
oriented”. Leveraging their “superstar status” they sign short-term contracts with low-tier
teams in order to preserve their economic wealth. The newspapers frequently report stories of
former soccer champions who sign short-term contracts in rich developing leagues, such as
China and Saudi Arabia. These individuals clearly sacrifice their sport-related aspirations in
order to maximize the return of their prestigious professional past.
An opposite trajectory is instead pursued by the players included in Cluster 1, that we may
label as “win oriented”. Less interested in maintaining their economic status, such players
accept a significant pay cut in order to sign a contract with a prestigious team, where they can
continue to compete in high-tier leagues and international competitions, therefore preserving
their superstar status. Probably due to healthy physical conditions, they continue to play the
same amount of minutes as during the previous contract. Furthermore, the new contract is
comparable with the previous one in terms of length.
The third group (Cluster 2) is composed by “play-oriented” individuals. Such players partially
exploit their superstar status signing a contract with less ranked teams, where they can benefit
of a limited salary reduction. At the same time, though, even if the aging process reduces their
athletic performance, they sign longer-term contracts (compared with the players in the other
clusters), therefore preserving their athletic identity.
As a whole, the three clusters resemble the classical dialectic between profit and utility
maximization which characterizes the sport management literature with reference to the
14
strategies of professional sports teams. Rottenberg (1965) explains the profit-orientation in
this way (p. 252): “Representatives of organized baseball often say that the owners are
interested more in providing opportunities for wholesome sport than they are in turning a
profit”, but concludes that “It seems unlikely that people will subject capital of this magnitude
to large risk of loss for the pure joy of association with the game.” In Rottenberg’s view, “A
team will seek to maximize the difference between its revenue and its costs” (p. 255), no
matter if this is achieved by combining players of higher or lower level than its rivals. In this
approach, sports teams are thus completely rationale, profit-seeking actors. Such view is
contrasted by Sloane (1971), according to whom “It is quite apparent that directors and
shareholders invest money in football clubs not because of expectations of pecuniary income
but for such psychological reasons as the urge for power, the desire for prestige” (p. 134).
Soccer clubs are no longer listed as profit-maximizing entities, but rather as utility
maximizers, with utility being defined as a complex, multifaceted variable including (in an
unpredictable balance) wins, attendance, level of interest in the league, financial
sustainability, ego, and so on.
Starting from our findings, we suggest an extension of this dichotomy to the superstars’ late
career strategies. On the one side, indeed, Cluster 3 players appear attracted to join a team
because of the salary they may obtain, consequently satisfying their profit maximization goal.
On the other side, Cluster 1 and Cluster 2 individuals appear attracted by goals (e.g. the
opportunity to win championships or to compete in top leagues, for the former, and the
opportunity to continue to play and to extend their career, for the latter) that are different from
the salary.
References Adler, M. (1985). Stardom and talent. The American Economic Review, 75(1), 208-212.
Alfermann, D., & Stambulova, N. (2007). Career transitions and career termination. In Tenenbaum, G.
and Eklund, R. (Eds). Handbook of Sport Psychology (pp. 712-733). Hoboken, NJ: John Wiley &
Sons, Inc.
Brown, E., Spiro, R., & Keenan, D. (1991). Wage and non-wage discrimination in professional
basketball: Do fans affect it? American Journal of Economics and Sociology, 50(3), 333–345.
Burdekin, R. C. K., & Idson, T. L. (1991). Customer preferences , attendance and the racial structure
of professional basketball teams. Applied Economics, 23(1), 179–186.
Cecić Erpič, S., Wylleman, P., & Zupančič, M. (2004). The effect of athletic and non-athletic factors
on the sports career termination process. Psychology of Sport and Exercise, 5(1), 45-59.

15
Côté, J. (1999). The influence of the family in the development of talent in sport. The Sport
Psychologist, 13(4), 395-417.
Dietl, H. M., Grossmann, M., & Lang, M. (2011). Competitive balance and revenue sharing in sports
leagues with utility-maximizing teams. Journal of Sports Economics, 12(3), 284-308.
Drahota, J. A. T., & Eitzen, D. S. (1998). The Role Exit of Professional Athletes. Sociology of Sport
Journal, 15(3), 263-278.
Forrier, A., Sels, L., & Stynen, D. (2009). Career mobility at the intersection between agent and
structure: A conceptual model. Journal of Occupational and Organizational Psychology, 82(4),
739-759.
Franck, E., & Nüesch, S. (2012). Talent and/or Popularity: What does it take to be a Superstar?.
Economic Inquiry, 50(1), 202-216.
Frick, B. (2007). The football players' labor market: Empirical evidence from the major European
leagues. Scottish Journal of Political Economy, 54(3), 422-446.
Fry, T. R., Galanos, G., & Posso, A. (2014). Let's Get Messi? Top‐Scorer Productivity in the European
Champions League. Scottish Journal of Political Economy. DOI: 10.1111/sjpe.12044
Greller, M. M., & Simpson, P. (1999). In search of late career: A review of contemporary social
science research applicable to the understanding of late career. Human Resource Management
Review, 9(3), 309-347.
Groothuis, P. A., & Hill, J. R. (2004). Exit Discrimination in the NBA: A Duration Analysis of Career
Length. Economic Inquiry, 42(2), 341–349.
Groothuis, P. A., Hill, J. R., & Perri, T. (2009). The dilemma of choosing talent: Michael Jordans are
hard to find. Applied Economics, 41(25), 3193–3198.
Hakes, J. K., & Turner, C. (2009). Pay, Productivity and Aging in Major League Baseball. Journal of
Productivity Analysis, 35(1), 61–74.
Hausman, J. A., & Leonard, G. K. (1997). Superstars in the National Basketball Association:
Economic value and policy. Journal of Labor Economics, 15(4), 586-624.
Heckhausen, J., Wrosch, C., & Schulz, R. (2010). A motivational theory of life-span development.
Psychological Review, 117(1), 32.
Horowitz, I., & Zappe, C. (1998). Thanks for the memories: baseball veterans’ end-of-career salaries.
Managerial and Decision Economics, 19(6), 377–382.
Inkson, K., Richardson, M., & Houkamau, C. (2013), New patterns of late career employment. In
Field, J., Burke, R., & Cooper, C. (Eds), The SAGE Handbook of Aging, Work and Society.
Thousand Oaks, CA: Sage.
Krueger, A. B. (2005). The economics of real superstars: The market for rock concerts in the material
world. Journal of Labor Economics, 23(1), 1–30.
Lally, P. (2007). Identity and athletic retirement: A prospective study. Psychology of Sport and
Exercise, 8(1), 85-99.

16
Levinson, D. J. (1986). A conception of adult development. American Psychologist, 41(1), 1-13.
Park, S., Tod, D., & Lavallee, D. (2012). Exploring the retirement from sport decision-making process
based on the transtheoretical model. Psychology of Sport and Exercise, 13(4), 444-453.
Rosen, S. (1981). The Economics of Superstars. The American Economic Review, 71(5), 845–858.
Rottenberg, S. (1956). The baseball players' labor market. The Journal of Political Economy, 64(3),
242-258.
Salmela-Aro, K. (2009). Personal goals and well-being during critical life transitions: The four C's—
Channelling, choice, co-agency and compensation. Advances in Life Course Research, 14(1), 63-
73.
Schulz, R., & Heckhausen, J. (1996). A life span model of successful aging. American Psychologist,
51(7), 702.
Scott, F. A. J., Long, J. E., & Somppi, K. (1985). Salary Vs . Marginal Revenue Product Under
Monopsony and Competition : The Case of Professional Basketball. Atlantic Economic Journal,
13(3), 50–59.
Scully W. G. (1989). The Business of Major League Baseball. Chicago: University of Chicago Press.
Scully, G. W. (1995). The market structure of sports. Chicago: University of Chicago Press.
Scully, G. W. (2002). The Distribution of Performance and Earnings in a Prize Economy. Journal of
Sports Economics, 3(3), 235–245.
Stambulova, N. (1994). Developmental sports career investigations in Russia: A post-perestroika
analysis. The Sport Psychologist, 8(3), 221-237.
Stambulova, N., Alfermann, D., Statler, T., & Côté, J. (2009). ISSP position stand: Career
development and transitions of athletes. International Journal of Sport and Exercise Psychology,
7(4), 395-412.
Stambulova, N., Stephan, Y., & Jäphag, U. (2007). Athletic retirement: A cross-national comparison
of elite French and Swedish athletes. Psychology of Sport and Exercise, 8(1), 101-118.
Super, D. E. (1980). A life-span, life-space approach to career development. Journal of Vocational
Behavior, 16(3), 282-298.
Torregrosa, M., Boixadós, M., Valiente, L., & Cruz, J. (2004). Elite athletes’ image of retirement: The
way to relocation in sport. Psychology of Sport and Exercise, 5(1), 35-43.
Wylleman, P., Alfermann, D., & Lavallee, D. (2004). Career transitions in sport: European
perspectives. Psychology of Sport and Exercise, 5(1), 7-20.
Wylleman, P., & Lavallee, D. (2003). A developmental perspective on transitions faced by athletes. In
M. Weiss (Ed.), Developmental sport psychology (pp. 507-527). Morgantown, WV: Fitness
Information Technology.
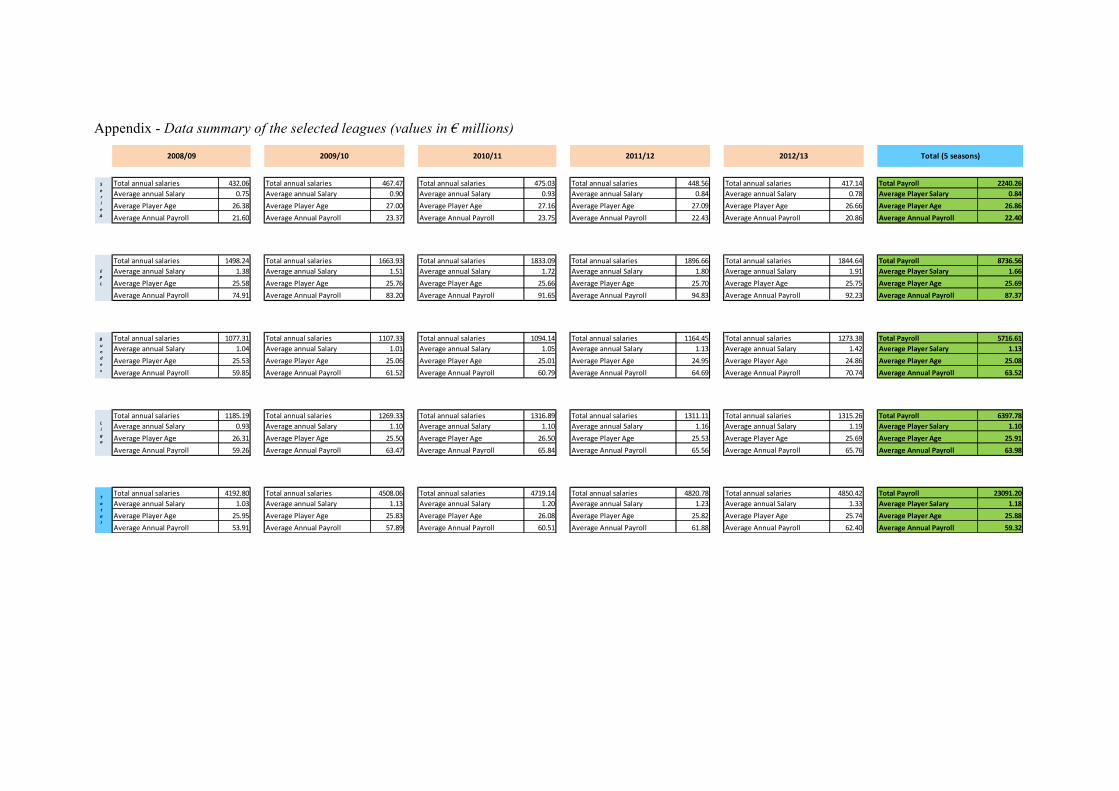
Appendix - Data summary of the selected leagues (values in € millions)
Total annual salaries 432.06 Total annual salaries 467.47 Total annual salaries 475.03 Total annual salaries 448.56 Total annual salaries 417.14 Total Payroll 2240.26Average annual Salary 0.75 Average annual Salary 0.90 Average annual Salary 0.93 Average annual Salary 0.84 Average annual Salary 0.78 Average Player Salary 0.84Average Player Age 26.38 Average Player Age 27.00 Average Player Age 27.16 Average Player Age 27.09 Average Player Age 26.66 Average Player Age 26.86Average Annual Payroll 21.60 Average Annual Payroll 23.37 Average Annual Payroll 23.75 Average Annual Payroll 22.43 Average Annual Payroll 20.86 Average Annual Payroll 22.40
Total annual salaries 1498.24 Total annual salaries 1663.93 Total annual salaries 1833.09 Total annual salaries 1896.66 Total annual salaries 1844.64 Total Payroll 8736.56Average annual Salary 1.38 Average annual Salary 1.51 Average annual Salary 1.72 Average annual Salary 1.80 Average annual Salary 1.91 Average Player Salary 1.66Average Player Age 25.58 Average Player Age 25.76 Average Player Age 25.66 Average Player Age 25.70 Average Player Age 25.75 Average Player Age 25.69Average Annual Payroll 74.91 Average Annual Payroll 83.20 Average Annual Payroll 91.65 Average Annual Payroll 94.83 Average Annual Payroll 92.23 Average Annual Payroll 87.37
Total annual salaries 1077.31 Total annual salaries 1107.33 Total annual salaries 1094.14 Total annual salaries 1164.45 Total annual salaries 1273.38 Total Payroll 5716.61Average annual Salary 1.04 Average annual Salary 1.01 Average annual Salary 1.05 Average annual Salary 1.13 Average annual Salary 1.42 Average Player Salary 1.13Average Player Age 25.53 Average Player Age 25.06 Average Player Age 25.01 Average Player Age 24.95 Average Player Age 24.86 Average Player Age 25.08Average Annual Payroll 59.85 Average Annual Payroll 61.52 Average Annual Payroll 60.79 Average Annual Payroll 64.69 Average Annual Payroll 70.74 Average Annual Payroll 63.52
Total annual salaries 1185.19 Total annual salaries 1269.33 Total annual salaries 1316.89 Total annual salaries 1311.11 Total annual salaries 1315.26 Total Payroll 6397.78Average annual Salary 0.93 Average annual Salary 1.10 Average annual Salary 1.10 Average annual Salary 1.16 Average annual Salary 1.19 Average Player Salary 1.10Average Player Age 26.31 Average Player Age 25.50 Average Player Age 26.50 Average Player Age 25.53 Average Player Age 25.69 Average Player Age 25.91Average Annual Payroll 59.26 Average Annual Payroll 63.47 Average Annual Payroll 65.84 Average Annual Payroll 65.56 Average Annual Payroll 65.76 Average Annual Payroll 63.98
Total annual salaries 4192.80 Total annual salaries 4508.06 Total annual salaries 4719.14 Total annual salaries 4820.78 Total annual salaries 4850.42 Total Payroll 23091.20Average annual Salary 1.03 Average annual Salary 1.13 Average annual Salary 1.20 Average annual Salary 1.23 Average annual Salary 1.33 Average Player Salary 1.18Average Player Age 25.95 Average Player Age 25.83 Average Player Age 26.08 Average Player Age 25.82 Average Player Age 25.74 Average Player Age 25.88Average Annual Payroll 53.91 Average Annual Payroll 57.89 Average Annual Payroll 60.51 Average Annual Payroll 61.88 Average Annual Payroll 62.40 Average Annual Payroll 59.32
Total
Total (5 seasons)
SerieA
EPL
Bundes
Liga
2008/09 2009/10 2010/11 2011/12 2012/13