UNIVERSITÀ DEGLI STUDI DI MILANO · cardiotocography ( CTG) has been widely used for fetal...
31
1 UNIVERSITÀ DEGLI STUDI DI MILANO SCUOLA DI DOTTORATO IN SCIENZE FISIOPATOLOGICHE, NEUROPSICOBIOLOGICHE E ASSISTENZIALI DEL CICLO DELLA VITA Ciclo XXV DIPARTIMENTO Scienze della Salute TESI DI DOTTORATO DI RICERCA NOVEL APPROACH FOR INTERPRETAZTION OF FETAL HEART RATE IN THE SECOND STAGE OF LABOR MED/40 Dottoranda Mona Mansour TUTOR Prof.ssa: Anna Maria Marconi DIRETTORE DELLA SCUOLA: Prof.: Roberto L. Weinstein Anno Accademico 2013/2014
Transcript of UNIVERSITÀ DEGLI STUDI DI MILANO · cardiotocography ( CTG) has been widely used for fetal...

1
UNIVERSITÀ DEGLI STUDI DI MILANO
SCUOLA DI DOTTORATO IN
SCIENZE FISIOPATOLOGICHE, NEUROPSICOBIOLOGICHE E ASSISTENZIALI
DEL CICLO DELLA VITA
Ciclo XXV
DIPARTIMENTO
Scienze della Salute
TESI DI DOTTORATO DI RICERCA
NOVEL APPROACH FOR INTERPRETAZTION OF FETAL HEART RATE IN
THE SECOND STAGE OF LABOR
MED/40
Dottoranda
Mona Mansour
TUTOR
Prof.ssa: Anna Maria Marconi
DIRETTORE DELLA SCUOLA:
Prof.: Roberto L. Weinstein
Anno Accademico 2013/2014

2

3
Novel approach for interpreting the fetal heart rate in the II stage of labor
Introduction
Fetal surveillance in labor is performed to identify fetuses at risk of hypoxia with the aim to reduce
neonatal morbidity and mortality by prompt intervention. Since its introduction in the 1960s,
cardiotocography ( CTG) has been widely used for fetal surveillance during labor and normal and
abnormal CTGs patterns in the first stage have been identified and classified (1-2-3).
On the contrary, the classification of CTG patterns in the second stage of labor has been often
neglected from a cultural and clinical viewpoint because of its usual short duration and because
considered the final stage after conclusion of the more prolonged high risk phase of cervical
dilatation.
There have been some previous studies attempting to determine the characteristics of an abnormal
second stage CTGs and its relation to neonatal status.
Fetal bradycardia, either persistent or progressive, has been shown to be strongly suggestive of fetal
hypoxemia and Apgar score <7 at 5 minutes (4). Similarly, fetal tachycardia has been shown to be
associated with low Apgar scores at five minutes and with neonatal acidemia (pH <7.10 ) in up to
20% of neonates (5). Also, absent CTG variability has been shown to be associated with an increased
risk of neonatal acidemia , even in the presence of an otherwise normal CTG (6-7). The presence of
bradycardia preceded by decreased baseline variability strongly predicts the development of
pathologic neonatal acidemia thus indicating the need for prompt delivery. (8)
Accelerations were noted not to be commonly present in the second stage; decelerations were more
common, and seen in more than 70 percent of second stage heart rate traces (5). Early decelerations
did not appear to increase the risk of low 5 minute Apgar score and, as in the first stage, should be
viewed as benign, regardless of baseline heart rate (4). Variable decelerations were much common
and seen in approximately half of the second stage CTGs patterns. If the baseline heart rate was
normal, mild variable decelerations appeared to have little influence on the incidence of low Apgar
scores (4). However, variable decelerations with a drop in fetal rate of >70 beats per minute have
been shown to be associated with an increased risk of metabolic acidosis (7). Late decelerations,
although relatively uncommon in the second stage of labor, markedly increased the risk of low 5
minute Apgar scores, regardless of baseline heart rate (4).

4
Thus far, the only thoroughly classification of the fetal heart rate in the second stage of labor, is that
performed by Melchior and Bernard (9) and modified by Piquard et al in 1988 (10) .
However, this classification was performed analyzing the tracings of a small number of pregnant
women (145 primiparous and 89 multiparous) and has not been validated since then.
We performed this study to revise the classification of Piquard of the CTG patterns in the II stage of
labor in a larger number of low risk pregnancies with the aim to identify patterns at high risk of
neonatal acidemia at birth. In addition, to verify whether this classification might be applicable and
useful also in high risk pregnancies we analyzed also tracings recorded in women with pre
pregnancy or pregnancy related complications.
To do so, we analyzed the data with three main objectives:
• reanalysis of the classification of Piquard in a large number of nulliparous and multiparous
women and in low and high risk pregnancies;
• relationship between the CTG tracing recorded in the II stage of labor to that recorded in the
final 60 minutes of the I stage;
• analysis of the results according to the presence of neonatal academia defined as umbilical
cord arterial pH ≤ 7.10 at the time of delivery.
Patients and Methods
This retrospective study was performed at the Department of Obstetrics and Gynecology of the San
Paolo Hospital Medical School of Milan (Italy) from January 1ST 2012 until October 30st 2013.
Only women who delivered vaginally in this time period were eligible. Inclusion criteria were:
singleton pregnancy, vertex presentation, at least 60 minutes of a technically interpretable tracing
recorded in the final part of the first stage and preceding the second stage (first stage CTG), a
technically interpretable tracing recorded continuously in the second stage, a second stage of labor
lasting at least 10 minutes and umbilical arterial oxygenation and acid base balance measured at the
time of delivery. Only live births with normal karyotype and without malformations were included.
Data collected regarded demographic and obstetric characteristics including maternal age, parity,
pre pregnancy BMI (kg/m2), smoking and information on the course of actual and previous
pregnancies.

5
At the time of delivery we collected gestational age (which was determined by the last menstrual
period and confirmed by an ultrasound examination performed within the 20th
week), length of the
second stage, type of labor (spontaneous, induced or augmented), mode of delivery (spontaneous or
operative vaginal), neonatal sex and weight, Apgar score at 5 minutes. Growth centiles were
calculated according to the Italian birth weight gestational age standards (11). Information on early
neonatal morbidity (need for resuscitation and NICU admission) were also collected.
Fetal heart rate and uterine contractions were recorded using a universal cardiotocography device
(Philips series 50 IP) with a paper speed set at 1cm/min.
CTGs were extracted prospectively and analyzed retrospectively blind to clinical information by a
single reviewer trained in FHR interpretation.
Fetal heart rate tracings recorded continuously for last 60 minutes of the first stage of labor were
analyzed according to the NICHD classification (Macones et al 2008) (12) but we simplified this
classification for practical analysis as:
- category I (normal base line heart rate between 110-160, variability 6-25, presence of
accelerations and absence of decelerations);
- category IIA (base line heart rate characterized by tachycardia)
- category IIB (repetitive variable decelerations)
- category IIC (variability ≤ 5 bpm )
- Category III not found because usually it prompted immediate caesarean delivery.
The beginning of the second stage was set with the beginning of the voluntary bearing-down efforts
and midwives were instructed to report the time on the CTG paper.
The CTG patterns in the second stage of labor were analyzed according to the classification of
Piquard et al (10) as depicted in Table 1.

6
Table 1. The six types of CTG patterns in the classification of Piquard
Type Description
0 Stable heart rate
1 Deceleration at each contraction and maintenance of a
normal baseline between contractions
2A Decreased baseline between 90-120 beats per minute, with
decelerations often occurring during the contractions
2B Decreased baseline under 90 BPM, with frequent
decreased variability
3 Severe fall of the baseline associated with marked
accelerations during the contractions
4 Fall of the base line under 90 BPM, but occurring much
later, practically at the extreme end of labor
The vertical dotted line depicted in the figures represents the beginning of the II stage.
As the description of type 1 CTG is very little detailed in terms of the characteristics of the
decelerations , we observed specific criteria of such decelerations which was present either alone
or combined with other criteria as described and showed in (table 2)

7
Table 2:
Description
1. repetitive decelerations (≥
3 in10 minutes);
2. deep decelerations (≥ 70
bpm);
3. duration (>2 minutes);

8
4. interval between
decelerations (<2 min);
5. lack of return to the
baseline;
6. baseline characterized by
tachycardia (> 160 bpm)
and repeated decelerations
7. reduced variability (<6
bpm).

9
Umbilical arterial blood was collected into heparinized syringes from a doubly clamped segment of
the umbilical cord and complete Blood Gas Analysis was measured using a universal radiometer
(ABL 700, Autocheck)
Non universal accordance has been established for the definition of acidemia . We had as a
reference pH ≤ 7.10 (13)
8. reduced variability and
reapeted decelerations

10
Statistical analysis
Data are presented as mean ± SD. The significance of the differences between groups was
calculated with the Student’s t test or the chi-square test as appropriate. Odds ratios and
corresponding 95% confidence intervals (lower confidence limit (LCI) - upper confidence limit
(UCI)) were calculated through multiple logistic regression models. This model was used to
investigate the independent contributions of obstetric factors to neonatal acidemia at birth.
Included factors were: pattern of CTG in the II stage; pattern of CTG in the I stage; parity;
gestational age; presence of obstetric pathologies; duration of the II stage; induction/augmentation
of labor; spontaneous vs vacuum assisted delivery; birth weight. Adjusting variables were selected
from available literature on the topic and using the likelihood ratio test for model comparison. P
<0.05 was considered statistically significant. Analyses were performed using the R statistical
software.

11
Results
Out of 2954 vaginal deliveries occurred in the study period, 2296 (77%) fulfilled the inclusion
criteria and were included in the analysis.
Table 1 presents the clinical characteristics of the study patients. 1307 (56.9%) women were at their
first delivery whereas 989 (43.1%) had had at least one previous vaginal delivery
Table 3
Nulliparous
N= 1307
Multiparous
N= 989 p
Maternal age, years 29.9 ± 5.8 32.8 ± 5.4 0.001
Maternal height, cm 163.4 ± 6.3 162.9 ± 5.9 0.07
Maternal pre pregnancy weight, kg 60.8 ± 11.1 63 ± 12.7 0.001
Maternal pre pregnancy body mass index, kg/m2
<18.5 kg/m2
≥30 kg/m2
22.8 ± 4
114 (8.7)
71 (5.4)
23.7 ± 4.4
60 (6.1)
92 (9.3)
0.001
0.02
0.001
Weight increase, kg 12.7 ± 4.6 11.6 ± 4.7 0.001
Gestational age, weeks
≤34 weeks
39.4 ± 1.4
3 (0.2)
39.5 ± 1.2
1 (0.1)
0.8
0.6
Duration of II stage, minutes 48 ± 34 26 ± 20.4 0.001
Neonatal weight, grams
<2500 grams
3250 ± 426
46 (3.5)
3384 ± 437
20 (2.02)
0.001
0.04
Male fetus (%) 668 (51.1) 525 (53.1) 0.3
Apgar score at 5’
Apgar score ≤7 at 5’ (%)
9.9 ± 0.4
8 (0.6)
9.9 ± 0.3
2 (0.2)
0.03
0.2
Umbilical artery pH
pH ≤7.10 (%)
7.255 ± 0.08
34 (2.6)
7.275 ± 0.08
14 (1.4)
0.001
0.055
Umbilical artery BD, mmol
BD ≥-12 (%)
-4.4 ± 3.6
12 (0.9)
-3.2 ± 3.2
3 (0.3)
0.001
0.1
Complicated pregnancy (%) 130 (9.9) 76 (7.7) 0.07
Smoker (%) 126 (9.6) 89 (9) 0.6
Vacuum extraction (%) 212 (16.2) 27 (2.7) 0.001

12
As expected maternal age, pre pregnancy weight and BMI were significantly higher in multiparous
(p<0.001); on the contrary, there was no difference in the rate of pregnancy complications and
smoking habit.
The duration of the second stage was almost doubled in nulliparous when compared to multiparous;
operative vaginal delivery occurred in 16.2% nulliparous and 2.7% multiparous (p<0.001).
Neonatal weight was significantly higher in multiparous, although gestational age was similar in the
two groups. At delivery 48 neonates had acidemia: of these, only 6 had umbilical arterial pH values
<7.00 and they were all born from nulliparous: ten had a BD ≥-12 mmol/L.
Analysis of the CTG in the I stage of labour
The analysis of the FHR in the final 60 minutes of the first stage showed that 1163 (89%)
nulliparous and 919 (92.9%) multiparous had a type I CTG (p<0.001); type II CTG was
significantly more frequent in nulliparous (11% vs 7.1%; p<0.001) and this was mainly due to an
increase frequency of type IIB tracings in this group (Figure 1).
Figure 1.

13
Analysis of the FHR in the II stage of labor
When we analyzed the CTGs recorded in the II stage, surprisingly we found that slightly less than
50% of the tracings (49.2% in nulliparous and 46.7% in multiparous) could be classified according
to the original six types of the FHR patterns proposed by Piquard et al. In addition, types 2B, 3 and
4 were very rare accounting only for 0.5% of tracings both in nulliparous and multiparous (Figure
2). The remaining tracings were actually a combination of patterns.
Figure 2.

14
The following CTGs are examples of combined CTGs secondary to Piquard classification:
Piquard :1-2A-4
Piquard 1-0

15
Piquard 1-2A
Piquard 1-2A

16
Piquard 1-0
Piquard 1-4

17
Figure 3 shows the 9 types that accounted for 98.3% and 98.4% of tracings in nulliparous and
multiparous, respectively. The most frequent CTG pattern in the II stage of labor both in nulliparous
and multiparous was a combination of type 0 and 1, regardless of the CTG type present in the last
60 minutes of the first stage.
Figure 3. The 9 most frequent combinations of CTG patterns in the II stage of labor
When we analyzed the CTG patterns found in the II stage of labor in relation to that found in the I
stage we found that 32.8% of nulliparous and 35.7% of multiparous with a type I CTG in the first
stage exhibited this combination in the second stage (type 01). These data are shown in Figure 4.

18
Figure 4. Percentage of type I CTG in the I stage of labor compared to the different patterns found
in the II stage.

19
Table 4 shows that 54/144 nulliparous (37.5%) and 27/70 (38.6%) multiparous with a type II CTG
in the first stage had also this combination in the second stage.
Table 4.
CTG type I stage
I IIA IIB IIC I IIA IIB IIC
CTG
Type II
stage
Nulliparous n=1307 Multiparous n= 989
0 1 381 (32.8) 12 (46.2) 29 (33.7) 13 (40.6) 328
(35.7) 5 (35.7) 15 (35.7) 7 (50)
1 282 (24.2) 5 (19.2) 19 (22.1) 7 (21.9) 221 (24) 3 (21.4) 14 (33.3) 3 (21.4)
0 199 (17.1) 4 (15.4) 13 (15.1) 4 (12.5) 132
(14.4) 2 (14.3) 5 (11.9)
2A 95 (8.2) 3 (11.5) 3 (3.5) 2 (6.3) 73 (7.9) 4 (9.5)
0 2A 70 (6) 6 (7) 2 (6.3) 67 (7.3) 2 (14.3) 1 (2.4) 2 (14.3)
1 2A 39 (3.4) 6 (7) 1 (3.1) 30 (3.3) 1 1 (2.4) 1 (7.1)
1 0 25 (2.1) 3 (3.5) 2 (6.3) 9 (1)
1 4 39 (3.4) 5 (5.8) 1 (3.1) 29 (3.2)
0 4 14 (1.2) 1 (1.2) 17 (1.8) 1 (2.4)
Others 19 (1.6) 2 (7.7) 1 (1.2) 13 (1.4) 1 (7.1) 1 (2.4) 1 (7.1)
Total 1163 26 86 32 919 14 42 14

20
CTG patterns and neonatal acidemia
48/2297 (2.1%) neonates had umbilical arterial cord blood pH values ≤7.10.
Table 5 shows the characteristics of acidemic and non acidemic pregnancies.
Acidemic
N= 48
Non Acidemic
N= 2248 p
Maternal age, years 32.1 ± 6.4 31,1 ± 5.8 0.24
Maternal height, cm 162 ± 4.8 163 ± 6.2 0.35
Maternal pre pregnancy weight, kg 65.8 ± 12.2 61.6 ± 11.8 0.016
Maternal pre pregnancy body mass index, kg/m2
<18.5 kg/m2
≥30 kg/m2
24.9 ± 4.3
1 (2)
7 (14.5)
23.1 ± 4.2
173 (7.6)
156 (6.9)
0.016
0.254
0.0452
Weight increase, kg 13.2 ± 3.8 12.2 ± 4.7 0.148
Nulliparous (%) 34 (70.8) 1273 (56.6) 0.0554
Gestational age, weeks
≤34 weeks
39.5 ± 1.9
1 (2)
39.4 ± 1.3
3 (0.13)
0.8
0.08
Duration of II stage, minutes 55.2 ± 44 38.1 ± 30 0.0001
Neonatal weight, grams
< 2500 grams
> 4000 grams
3341 ± 524
2 (4.1)
4 (8.3)
3305 ± 433
71 (3.1)
140 (6.2)
0.09
0.66
0.545
Male fetus (%) 27(56.2) 1193(53) 0.77
Apgar score at 5’
Apgar score ≤7 at 5’ (%)
9.2 ± 0.9
3 (6.2)
9.9 ± 0.3
7 (0.31)
0.001
0.001
Umbilical artery pH 7.056 ± 0.05 7.268 ± 0.07 0.001
Umbilical artery BD, mmol
BD ≥-12 (%)
-9.9 ± 2.4
10 20.8)
-4.4 ± 2.5
38 (1.7)
0.001
0.001
Complicated pregnancy (%) 4 (8.3) 197 (8.7) 1
Smoker (%) 5 (10.4) 210 (9.33) 0.8
Vacuum extraction (%) 13 (27) 226 (10) 0.0008
Induction of labor (%) 19 (39.5) 569 (25.3) 0.03
NICU 31 (65) 7 (0.3) 0.001

21
This table shows that maternal BMI is significantly higher in mothers of acidemic fetuses and also
the rate of obesity is significantly increased in these women, due to a significantly higher pre
pregnancy weight. Induction of labor was more common in acidemic pregnancies but the rate of
complicated pregnancy was similar in the two groups. Also, the length of the second stage was
increased by more than 50% in acidemic pregnancies. More acidemic fetuses were delivered by
vacuum. Not surprisingly, the mean Apgar score at 5’ and the rate of neonates with Apgar scores ≤7
was higher in acidemic fetuses as was the rate of NICU admission. On the contrary, we could not
find differences in maternal age, smoking habit, gestational age and neonatal sex and weight. The
rate of nulliparity, was higher in acidemic pregnancies but it did not reach statistical significance.
When we analyzed the relationship between acidemia and type of CTG recorded in the I stage of
labor we found that the presence of variable decelerations (type II B) and a reduced long term
variability (type II C) were strongly associated with acidemia at birth whereas tachycardia (type II
A) occurred too infrequently to found a difference (6 Table)
Acidemic
N= 48
Non Acidemic
N= 2248 p
Type I CTG in the I stage 35 (72.9) 2082 (92.5) 0.0001
Type II A CTG in the I stage 0 (0) 40 (1.7) 1
Type II B CTG in the I stage 9 (18.7) 128 (5.6) 0.0017
Type II C CTG in the I stage 4 (8.3) 46 (2) 0.0191
To assess independent factors associated with acidemia at birth, we then constructed a multiple
logistic regression model that included all the relevant variables that were associated with acidemia
in the univariate analysis (maternal pre pregnancy weight and BMI, obesity, length of the second
stage, and induction of labor).
22
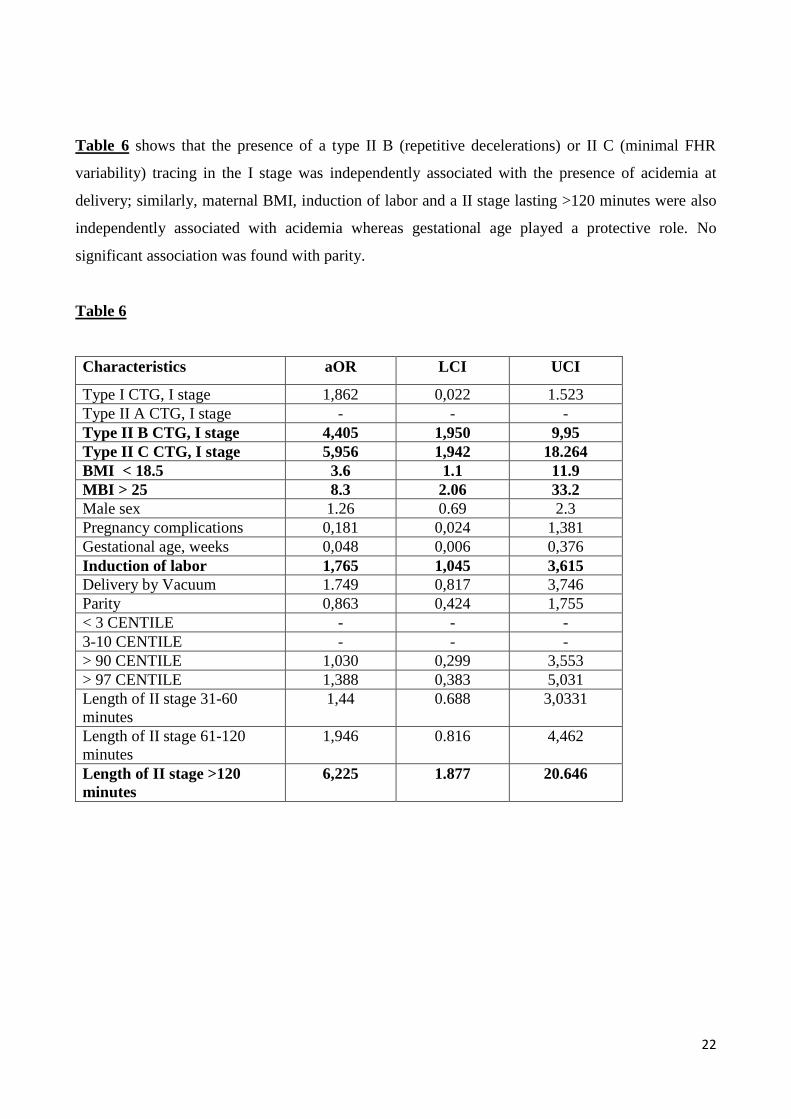
Table 6 shows that the presence of a type II B (repetitive decelerations) or II C (minimal FHR
variability) tracing in the I stage was independently associated with the presence of acidemia at
delivery; similarly, maternal BMI, induction of labor and a II stage lasting >120 minutes were also
independently associated with acidemia whereas gestational age played a protective role. No
significant association was found with parity.
Table 6
Characteristics aOR LCI UCI
Type I CTG, I stage 1,862 0,022 1.523
Type II A CTG, I stage - - -
Type II B CTG, I stage 4,405 1,950 9,95
Type II C CTG, I stage 5,956 1,942 18.264
BMI < 18.5 3.6 1.1 11.9
MBI > 25 8.3 2.06 33.2
Male sex 1.26 0.69 2.3
Pregnancy complications 0,181 0,024 1,381
Gestational age, weeks 0,048 0,006 0,376
Induction of labor 1,765 1,045 3,615
Delivery by Vacuum 1.749 0,817 3,746
Parity 0,863 0,424 1,755
< 3 CENTILE - - -
3-10 CENTILE - - -
> 90 CENTILE 1,030 0,299 3,553
> 97 CENTILE 1,388 0,383 5,031
Length of II stage 31-60
minutes
1,44 0.688 3,0331
Length of II stage 61-120
minutes
1,946 0.816 4,462
Length of II stage >120
minutes
6,225 1.877 20.646

23
We then analyzed the relationship between the CTG types recorded in the II stage and neonatal
acidemia. The results are presented in table 7, showing that only 2 acidemic fetuses (4%) presented
a CTG without anomalies in the second stage (type 0) when compared to 347 (15.4%) non acidemic
fetuses (p<0.03). On the contrary, the rate of tracings with anomalies was not different in the two
groups. Only the combination of type 1 and 4 was doubled in acidemic fetuses but this didn’t reach
statistical significance.
Table 7
Acidemic
N= 48
Non Acidemic
N= 2248 p
0 2 (4) 347 (15.4) 0.0254
1 15 (31) 562 (25) 0.3159
0 1 19 (39.5) 780 (34.6) 0.54
2A 2 (4) 181 (8) 0.58
0 2A 3 (6.2) 150 (6.6) 1
1 2A 2 (4) 84 (3.7) 0.70
1 0 1 (2) 42 (1.8) 0.226
1 4 4 (8.3) 78 (3.5) 0.0895
0 4 0 32 (1.4) 1
Others 0 40 (1.7) 1

24
When we repeated the multiple logistic regression analysis to assess independent factors associated
with acidemia we found that type 0 tracing was protective against acidemia whereas type 1-4
tracing was significantly associated with acidemia and type 1 was associated with acidemia with
border like significance. Induction of labor and a II stage lasting >120 minutes were also
significantly associated with acidemia whereas gestational age played a protective role.
Table 8
OR LCI UCI
Piquard 0 0,048 0,004 0,577
Piquard 1 4,397 0,988 19,564
Piquard 0-1 3,932 0,898 17,207
Piquard 1-0 3,820 0,281 46,019
Piquard 2A 2,043 0,551 14,832
Piquard 0-2A 3,741 0,552 20,713
Piquard 1-2A 3,678 0,492 28,427
Piquard 1-4 9,054 1,590 51,546
Piquard Other - - -
Length of II stage 31-60 min 1,697 0,813 3,545
Length of II stage 61-120 min 1,880 0,794 4,452
Length of II stage >120 min 4,312 1,291 14,396
Pregnancy complications 0,224 0,031 1,652
Gestational age, weeks 0,066 0,009 0,500
Induction of labor 1,886 1,017 3,496
Delivery by Vacuum 1,923 0,910 4,065
BMI < 18.5 3.77 1.15 12.3
BMI > 25 8.1 2.04 32.7
Male sex 1.86 0.64 2.18
Parity 0,838 0,410 1,714

25
In the acidemic group, type 1 alone o combined was present in 41/48 (85%) fetuses: 32/41 neonates
(78%) had ominous characteristics criteria that we called malignant type I when decelerations were
characterized by one or more of the following characteristics :
1. repetitive decelerations (≥ 3 in 10 minutes);
2. deep: ≥70 bpm;
3. duration: more than 2 minutes;
4. interval < 2 minutes between decelerations;
5. lack of return to the base line;
6. baseline characterized by tachycardia (> 160 bpm);
7. reduced variability (<6 bpm).
Table 9
acidemic Non acidemics p
repetitive decelerations (≥ 3 in 10
minutes)
7 12 0.0002
deep: ≥70 bpm 6 9 0.0002
duration: more than 2 minutes; 1 1 0.043
interval < 2 minutes between
decelerations
3 3 0.0002
lack of return to the base line 4 15 0.091
baseline characterized by tachycardia
(> 160 bpm)
1 5 0.12
reduced variability (<6 bpm) 2 30 0.08
Repeated decelerations and duration> 2
minutes
3 21 0.012
Repeated decelerations and tachycardia 2 11 0.028
Repeated decelerations and deep 2 2 0.0025
Repeated deep decelerations and
tachicardia
1 5 0.0003
26
As shown in table 9, when the first four criteria were present alone (repetitive decelerations, deep
decelerations, duration more than 2 minutes and interval < 2 minutes between decelerations) or
combined, the risk for acidemia was higher. Less “malignant” criteria were: lack of return to the
baseline between decelerations, baseline characterized by tachycardia and reduced variability.
Interestingly, all acidemic neonates admitted in the NICU had type 1 CTG in the second stage with
at least one malignant criteria.
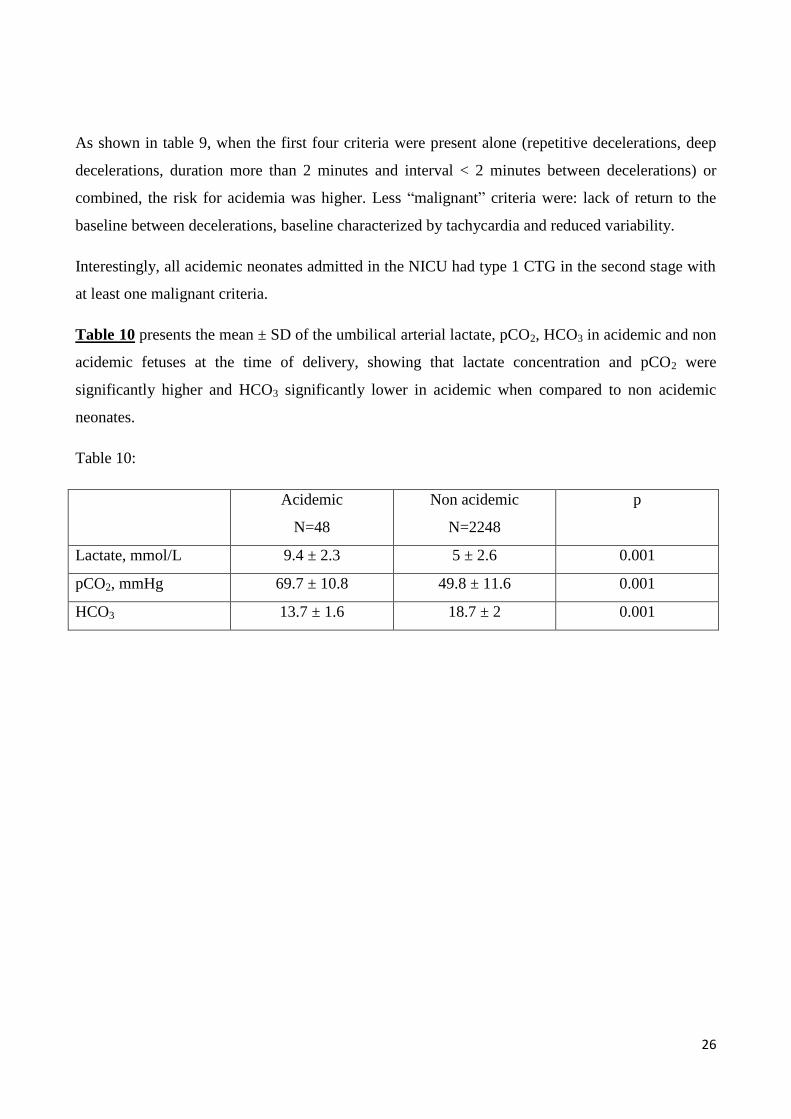
Table 10 presents the mean ± SD of the umbilical arterial lactate, pCO2, HCO3 in acidemic and non
acidemic fetuses at the time of delivery, showing that lactate concentration and pCO2 were
significantly higher and HCO3 significantly lower in acidemic when compared to non acidemic
neonates.
Table 10:
Acidemic
N=48
Non acidemic
N=2248
p
Lactate, mmol/L 9.4 ± 2.3 5 ± 2.6 0.001
pCO2, mmHg 69.7 ± 10.8 49.8 ± 11.6 0.001
HCO3 13.7 ± 1.6 18.7 ± 2 0.001

27
Discussion
The main objective of our study was to reanalyze the classification of Piquard of the CTGs in the II
stage of labor.
In fact, in our opinion, this study has two main limitations: the first is that it includes only 234
women (145 nulliparous and 89 multiparous) and the second is that the tracings were recorded in a
very short time period, approximately 12 minutes, defined as the “final stage of labor” i.e. the
period between the first voluntary bearing-down effort and the moment of delivery. In recent years,
many Authors have challenged the guidelines on the length of the first and second stages of labor
based on Friedman’s studies (14) . Although human biology likely has not changed, the duration and
definition of delay in the second stage of labor nowadays have an upper limit of three hours in
nulliparous and two hours in multiparous (15) . As a matter of fact in the present study the main
length of the active II stage was 48 ± 34 minutes in nulliparous and 26 ± 20.4 minutes in
multiparous.
Despite this, there is no doubt that the classification of Piquard, is the only one and comprehensive
for the description of the tracings in this stage of labor.
As a matter of fact, the most widely used classifications of the CTG patterns in labor do not
specifically consider the second stage of labor other than for the time intervals in recording.
The American College of Obstetrician and Gynecologists in 2009 in the evaluation of critical
decelerations takes into consideration the prolonged decelerations defined as the decrease of the
FHR of ≥15 bpm below the base line that lasts for ≥2 minutes but less than 10 minutes of without
distinguishing between I and II stage (17).
Similarly, the British National Institute of Health and Clinical Excellence guideline considers
abnormal a single prolonged decelerations lasting 3 minutes or more but do not differentiate
between I and II stage (18).
The Royal College of Obstetricians and Gynaecologists in its 2001 guidelines gave undifferentiated
interpretations of recommendations between the 2 stages (19).
The Society of Obstetricians and Gynaecologists of Canada in its 2007 guidelines considered
abnormal the presence of repetitive (≥3 times) decelerations to ≤ 70 bpm for ≥ 60 seconds, baseline

28
tachycardia or bradycardia and single prolonged deceleration lasting more than 3 minutes but less
than 10 minutes, but again they did not differentiate between I and II stage( 20).
The International Federation of Gyneacology and Obstetrics only underlines that the late first stage
and II stage are the moments of increased fetal stress and recommends an adequate and careful
choice of mode and time of surveillance (21).
Thus, the interpretation of CTGs in the second stage of labor remains neglected whether culturally
and clinically even though it represents a critical time for the fetus that is often subject to reduced
oxygenation. In this stage the uterine contractions become stronger and the expulsive forces are
greater and more frequent when the woman begins to bear-down; the fetal head starts its descent
through the birth canal which increases the intracranial pressure and reduces cerebral blood flow.
Baroreceptors are then activated which produces decelerations of the fetal heart rate usually
synchronous with the uterine contraction.
When we started analyzing the CTG tracings we indeed found not only that less than 50% of the
tracings could be classified according to the original six types proposed by Piquard, but also that 3
types (2B, 3 and 4) were very rare, accounting for only 0.5% of the tracings. Instead, many tracings
were actually a combination of different types, type 01 being the most representative. A possible
explanation might be that the observation time in the present study (i.e. the duration of the active II
stage) is twice as long in multiparous and approximately fourfold longer in nulliparous than the
observation time in Piquard’s study.
The main workshops in the literature and the various trials aimed to ameliorate interpretation of
FHR during labor did not differentiate between the I and the II stage although what is quietly
known that fetal stress is different between these 2 phases because more exposed to oxygen
reduction. The main difference is regarding uterine contractions which have more duration,
frequency and intensity reaching up to 50-100 mmHg causing increased intracranial pressure which
reduced cerebral blood flow. The second factor is the start of bearing down efforts which cause
additional more intrauterine pressure. These factors reduce whether umbilical than placental blood
perfusion because the augmentation of both factors can lead to intrauterine increase rise up to 150-
250 mm Hg with resulting impaired fetal oxygenation and increase of carbon dioxide level.
So the interpretation of CTGs in the I stage cannot be applied to the II one because they might have
different meanings.

29
We consider this work as a pilot study done with the aim to better evaluate CTGs in the II stage of
labor and correlate them with acidemia and to suggest to clinicians to have a different interpretation
between the first and second stage of labor.
We think that our results represent a preliminary interesting data that have to be confirmed
including a major number of acidemic fetuses.

30
BIBLIOGRAPHY:
1-Goodlin RC. History of fetal monitoring. Am J Obstet Gynecol 1979; 133: 323–52
2- Brady JP, James LS, Backer MA. Heart rate changes in the fetus and newborn infant during
labor. Am J Obstet Gynecol 1962; 84: 1–11.
3- Boehm FH. Prolonged end stage fetal heart rate decelerations. Obstet Gynecol 1975; 45: 579–82.
4-( Krebs HB, Petres RE, Dunn LJ. Intrapartum fetal heart rate monitoring. V. Fetal heart rate
patterns in the second stage of labor. Am J Obstet Gynecol 1981; 140: 435–9.
5- CG, Graca CM, Clode N. A study on second stage cardiotocographic patterns an
d umbilical acid-base balance in cases with first stage normal fetal heart rates. J Maternal Fetal
Invest 1995; 5: 144-7.
6-Gilstrap LC, Hauth JC, Toussaint S. Second stage fetal heart rate abnormalities and neonatal
acidosis. Obstet Gynecol 1984; 63: 209–13.
7-Sheiner E, Hadar A, Hallak M, Katz M, Mazor M, Shoham-Yardi I. Clinical significance of fetal
heart rate tracings during the second stage of labor. Obstet Gynecol 2001; 97: 747–52.
8-Gilstrap LC, Hauth JC, Hankins GD, Beck AW. Second stage fetal heart abnormalities and type
of neonatal acidaemia. Obstet Gynaecol 1987; 70: 191-5.
9-Melchior J, Bernard N. Incidence of and pattern of fetal heart rate alterations during labour. In:
Kunzel W, ed. Fetal heart rate monitoring. Heidelberg: Springer-Verlag, 1985:73-81
10-Piquard F, Hsiung R, Mettauer M, Schaefer A, Haberey P, Dellenbach P. The validity of fetal
heart rate monitoring during the second stage of labor. Obstet Gynecol 1988; 72: 741–50. ).
11- E Bertino, S.Milani, C Fabris AND m De Curtis : Neonatal anthropometric charts : what ther
are, what they are not ( Arch Dis Child . Fetal Neonatal Ed. 2007; 92; 7-10
12-the 2008 national institute of child health and human development workshop report on electronic
fetal monitoring ; update on definitions, interpretation and research guidelines. George A. Macones,
MD, Gary D.V.Hankins MD
13-Cahill AG, Roehl KA, Odibo AO, et al. Association and prediction of neonatal acidemia. Am J
Obstet Gynecol 2012;207:206.e1-8.
14-Harper. M, Caughey B, Roehl A, Odibo O, Cahil G. Defining an abnormal first stage of labour
based on maternal and neonatal outcomes. Annual meeting for maternal fetal medicine. San
Francisco. Feb. 11-16, 2013

31
15- ACOG 2008. Dystocia and augmentation of labor .Clinical management guidelines for
obstetricians-gynecologists. N.49.
16-NICE. Clinical guidelines. Intrapartum care: care of healthy women and their babies during
childbirth. 2007, Sep
17- ACOG Practice Bulletin. Intrapartum fetal heart reate monitoring: nomenclature, interpretation,
and general management principles.Number 106, July 2009
18-National institute for Health and Clinical Excellence.intrapartum care. September 2007
19-Royal College of Obstetricians and Gynaecologists. The use of electronic fetal monitoring .
evidence-based clinical guidelines, 2001, Number 8
20- Liston R, Sawchuck D, Young D; Society of obstetrics and gynaecologists of Canada ;British
Columbia Perinatale Health Program . Fetal health surveillance : antepartum and intrapartum
consensus guidline. J Obstet Gynaecol Can 2007;29:S3-56
21- International Federation of Gynaecology and Obstetrics. Guidelines for the use of fetal
monitoring . Int J Gynaecol Obstet 1987;25:159-167
22- Yvonne M. O'Brien, Deirde J. Murphy.European Journal of Obstetrics and Gynaecology and
reproductive Biology 167 (2013) 142-145