UNIVERSIDADE FEDERAL DE GOIÁS INSTITUTO DE CIÊNCIAS ...§ão_-_HERLANDE… · 17 relutância em...
90
UNIVERSIDADE FEDERAL DE GOIÁS INSTITUTO DE CIÊNCIAS BIOLÓGICAS PROGRAMA DE PÓS-GRADUAÇÃO EM ECOLOGIA E EVOLUÇÃO COMO O COMPORTAMENTO ANIMAL PODE INFLUENCIAR A DISTRIBUIÇÃO DAS ESPÉCIES Herlander Correia de Lima Orientador: Thiago Fernando Rangel Co-orientador: Diogo Soares Menezes Samia Goiânia Março 2018
Transcript of UNIVERSIDADE FEDERAL DE GOIÁS INSTITUTO DE CIÊNCIAS ...§ão_-_HERLANDE… · 17 relutância em...
UNIVERSIDADE FEDERAL DE GOIÁS
INSTITUTO DE CIÊNCIAS BIOLÓGICAS
PROGRAMA DE PÓS-GRADUAÇÃO EM ECOLOGIA E EVOLUÇÃO
COMO O COMPORTAMENTO ANIMAL PODE INFLUENCIAR A DISTRIBUIÇÃO
DAS ESPÉCIES
Herlander Correia de Lima
Orientador: Thiago Fernando Rangel
Co-orientador: Diogo Soares Menezes Samia
Goiânia
Março 2018
UNIVERSIDADE FEDERAL DE GOIÁS
INSTITUTO DE CIÊNCIAS BIOLÓGICAS
PROGRAMA DE PÓS-GRADUAÇÃO EM ECOLOGIA E EVOLUÇÃO
Herlander Correia de Lima
COMO O COMPORTAMENTO ANIMAL PODE INFLUENCIAR A DISTRIBUIÇÃO
DAS ESPÉCIES
Orientador: Thiago Fernando Rangel
Co-orientador: Diogo Soares Menezes Samia
Dissertação apresentada à Universidade Federal de Goiás
como parte das exigências do Programa de Pós-graduação
em Ecologia e Evolução para obtenção do título de Mestre
em Ecologia e Evolução
Goiânia
Março 2018
Herlander Correia de Lima
COMO O COMPORTAMENTO ANIMAL PODE INFLUENCIAR A DISTRIBUIÇÃO
DAS ESPÉCIES
Dissertação apresentada à Universidade Federal de Goiás
como parte das exigências do Programa de Pós-graduação
em Ecologia e Evolução para obtenção do título de Mestre
em Ecologia e Evolução
Banca avaliadora:
Membros titulares:
Dr. Fausto Nomura Dr. Jean C. G. Ortega
Dr. Thiago Fernando Rangel (orientador)
Dr. Diogo S. M. Samia (co-orientador)
Membros suplentes
Dra. Maria Anton-Pardo Dr. Luis Maurício Bini
Goiânia
Março 2018

i
“Where the determination is, the way can be found.”
Dabasir em “Richest Man in Babylon”
ii
AGRADECIMENTOS
À Marga por me ter trazido a Goiânia e por compreender que eu ainda aqui esteja. Mas acima de
tudo por ter sido minha parceira e o meu apoio ao longo de várias etapas da minha vida, e por me
fazer sentir que ainda temos muitas boas experiências para viver no futuro.
À minha familia por compreenderem os longos periodos que passo longe deles e por me tentarem
receber da melhor forma sempre que regresso.
Aos pais da Marga, por se terem deslocado a Madrid para servir de suporte à Marga durante a
minha ausência, e por fazerem com que me sinta em casa quando estou em Sevilha.
Aos amigos que fiz em Goiânia, pelos ótimos tempos que passámos juntos. Especialmente ao
Bruno e Geizi por terem sido espetaculares! Aos restantes elementos da equipa ibérica Maria, Sara e
Diego, pelos jantares, viagens, conversas, etc. Aos que vivem ou em algum momento viveram
comigo na ‘vila’ (Luciano, Fagner, Leila, Fernando, Marco, Cris, Vitor) e fizeram com me sentisse
parte de uma grande familia! E ainda ao Flávio e outros que agora não me lembro e que em algum
momento marcaram pela positiva a minha estadia em Goiânia.
Aos meus orientadores Thiago Rangel e Diogo Samia por contribuirem para várias melhorias
necessárias no meu trabalho e compreenderem algumas das falhas que tive durante o percurso do
mestrado.
Aos alunos orientados pelo Thiago Rangel por se interessarem pelo meu trabalho e apontarem
várias sugestões durante as reuniões que tivemos.
Ao Fausto Nomura e ao Mário Almeida-Neto, por participarem na banca da minha qualificação e
apontarem algumas direções para o trabalho.
Por fim, a todos os que fazem parte do programa de Ecologia e Evolução da UFG, por
proporcionarem um ambiente exemplar em termos de dedicação e competência.
SUMÁRIO
Introdução geral 2
Capítulo 1 The role of behavioral traits in species distribution: a bayesian meta-analysis
11
Capítulo 2 Do residents behave differently than migrants? Describing how behavioral variation can
contribute to partial migration
35
Apêndices Appendix A – Details on literature search
Appendix B – Prisma Diagram
Appendix C – Forest Plots
Appendix D – Table of studies
Appendix E – Results from models
Appendix F – Publication Bias
54
57
58
63
67
81
2
INTRODUÇÃO GERAL 1
A forma como nos comportamos influencia não só nossas vidas, como também o mundo à nossa 2
volta. Todas as pessoas apresentam diferenças de comportamento consistentes, que nos permitem 3
muitas vezes predizer as decisões que irão tomar frente a determinadas situações. Por exemplo, 4
diferenças de comportamento podem predizer a motivação de uma pessoa para migrar a outra 5
região, tendo um papel tão importante nos fluxos de migração, que levou à criação do conceito de 6
‘personalidade do migrante’ (Tabor et al. 2015). Estudos têm demonstrado que pessoas mais 7
extrovertidas, mais abertas a novas experiências, e mais individualistas são mais propensas a 8
abandonar o seu território em busca de novas oportunidades (Camperio Ciani et al. 2007, Jokela 9
2009, Otto and Dalbert 2012). Alguns estudos encontraram ainda uma relação entre o alelo DRD4 10
(ligado à atração por novas experiências) e a expansão global humana nos tempos pré-históricos 11
(Chen et al. 1999, Matthews and Butler 2011). Assim, na nossa espécie, indivíduos que abandonam 12
território familiar não são uma amostra aleatória da população residente, dado que diferenças 13
comportamentais podem ser um dos meios impulsionadores da decisão de partida. 14
As conclusões sobre a influência do comportamento humano nas dinâmicas de migração podem 15
ser semelhantes para as espécies de animais não-humanos. Contudo, muitos cientistas têm mostrado 16
relutância em aceitar que emoções, traços comportamentais, e capacidades cognitivas humanas 17
podem apresentar semelhanças com outros animais, embora sejam amplamente aceite tais 18
semelhanças em relação aos carácteres fisiológicos ou morfológicos (Gosling and John 1999). Isto é 19
inesperado, dado que nada em teoria evolutiva aponta para uma descontinuidade entre humanos e 20
animais relativa a comportamento, nem tampouco que o comportamento é isento de pressões 21
seletivas (Gosling and John 1999). Charles Darwin publicou em 1872 um livro intitulado “A 22
expressão de emoções em humanos e animais” descrevendo similaridades entre o comportamento 23
humano e outros animais (Shivik 2017). Dez anos depois, o biólogo evolutivo e fisiologista George 24
Romanes afirma em seu livro “Inteligência animal” que mesmo espécies muito diferentes de 25
3
humanos podem possuir emoções como medo, curiosidade e carinho (Shivik 2017). Contudo, o 26
comportamento animal era visto como ciência especulativa e subjetiva e, por vários anos, cientistas 27
preferiram adotar métodos que permitiam maior rigor de medição e maior comparabilidade, como é 28
o caso de traços morfológicos. Apenas em meados do século XX pesquisadores começaram a 29
mostrar interesse em desenvolver métodos para o estudo das diferenças comportamentais em 30
animais. Consequentemente, com o desenrolar dos anos, inúmeros estudos têm reportado a 31
existência de diferenças de comportamento entre indivíduos, consistentes ao longo do tempo e 32
sobre diferentes contextos, ao que se tem dado o nome de ‘personalidade animal’ (Carere and 33
Maestripieri 2013). Estas diferenças comportamentais podem ser governadas por mecanismos 34
fisiológicos (Groothuis et al. 2008), genéticos (Dochtermann et al. 2014), epigenéticos (Verhulst et 35
al. 2016) e hereditários (Oers et al. 2004). 36
Nos dias de hoje, um dos grandes desafios no estudo do comportamento animal é entender se 37
diferenças comportamentais podem levar a diferentes vantagens adaptativas e contribuir para a 38
explicação de padrões ecológicos e evolutivos. Estudos já revelaram que diferenças 39
comportamentais podem influenciar a atividade reprodutiva (Ariyomo and Watt 2012), 40
vulnerabilidade à predação (Sih et al. 2003), parasitismo (Seaman and Briffa 2015), seleção sexual 41
(Schuett et al. 2011), desempenho (Smith and Blumstein 2008), entre outros (revisado em Wolf and 42
Weissing 2012). Isto sugere que a fixação de diferenças comportamentais nas populações resulta 43
das inerentes vantagens ou desvantagens de cada tipo de comportamento em determinado contexto 44
ecológico-evolutivo. Por exemplo, Riechert and Hall (2000) demonstraram que indivíduos de uma 45
espécie de aranha vivendo em áreas com elevado risco de predação eram mais tímidos que 46
indivíduos em áreas de menor risco predatório e menor abundância de recursos. Transplantes 47
recíprocos de indivíduos entre as duas áreas resultaram em elevada mortalidade e baixa taxa de 48
crescimento populacional, tornando evidente que certos traços comportamentais podem determinar 49
vantagens competitivas consoante as condições ecológicas e/ou ambientais do meio. Neste sentido, 50
4
espécies que possuem elevada variação comportamental podem ser mais capazes de sobreviver a 51
perturbações no meio, que espécies com baixa variação comportamental (Sih et al. 2012). 52
Tais perturbações são cada vez mais frequentes devido às consequências das mudanças globais na 53
biodiversidade (Chapin III et al. 2000, Dirzo et al. 2014). Frente às mudanças ambientais, os 54
animais possuem geralmente duas opções: dispersar ou adaptar-se por meio de plasticidade 55
fenotípica ou mudanças genéticas (Williams et al. 2008, Wong and Candolin 2015). Um agravante é 56
que mudanças provocadas pelo homem são geralmente tão rápidas que processos evolutivos 57
dificilmente poderão garantir a persistência de muitas das espécies (Chevin and Lande 2010). 58
Assim, para espécies que não possuem variação fenotípica na população que lhes permita tolerar as 59
novas condições, a capacidade de dispersar torna-se um atributo vital. Por isso, entender as 60
motivações para o abandono de um território, e como os indivíduos conseguem sobreviver durante 61
a transição e o estabelecimento em novos meios é fundamental para conhecer que espécies estão 62
mais aptas a resistir aos novos desafios. 63
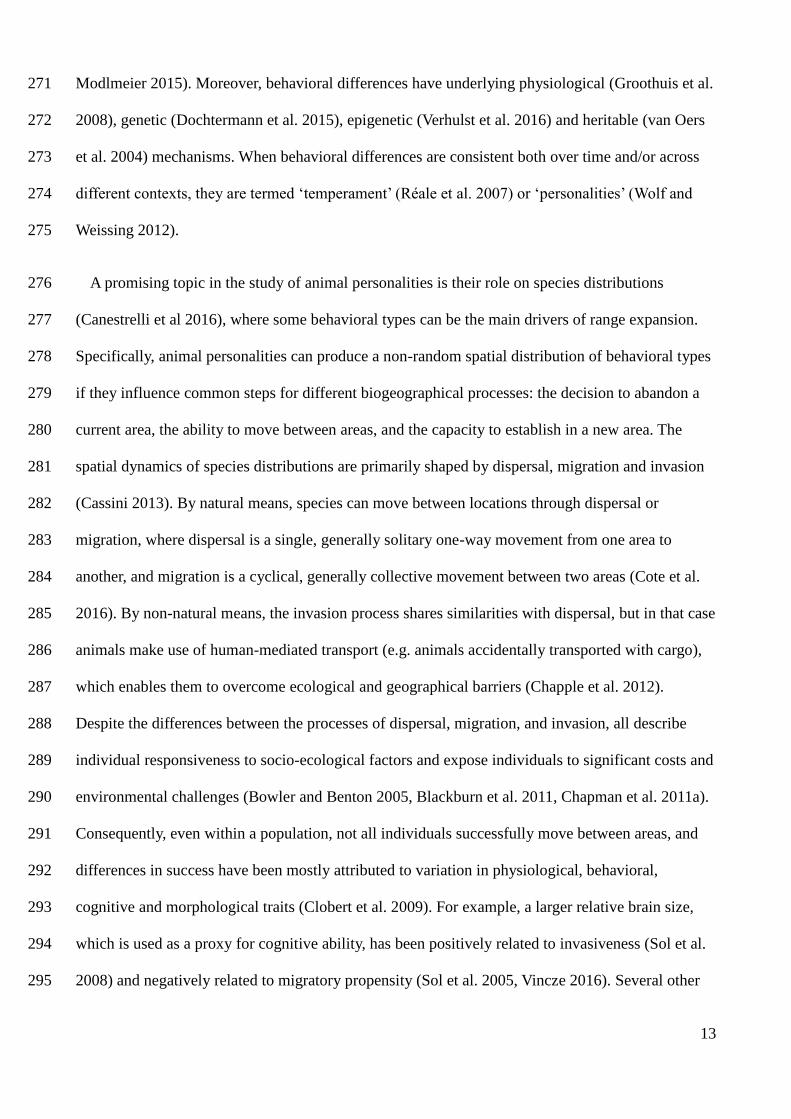
Num contexto biogeográfico, os indivíduos podem dispersar e estabelecer-se com sucesso em 64
outro meio através de três processos: a dispersão, a migração ou invasão. Apesar de existirem 65
diferenças importantes entre estes processos, todos eles englobam os estágios de partida, transição e 66
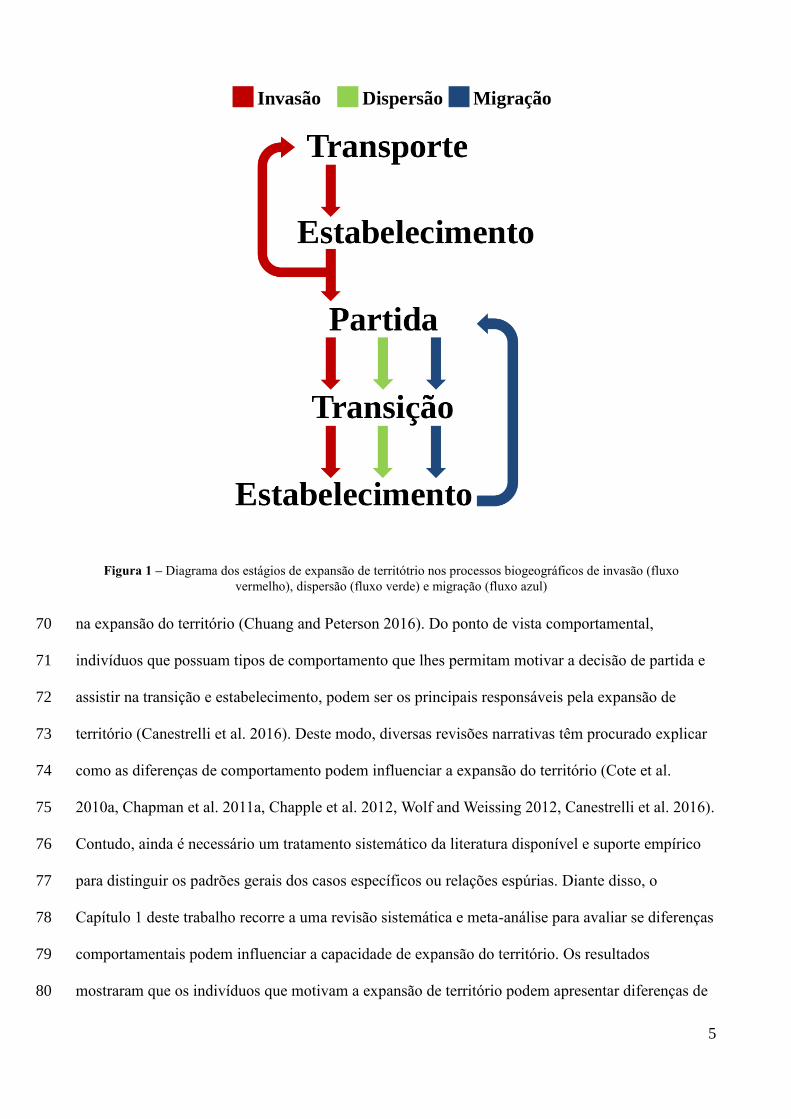
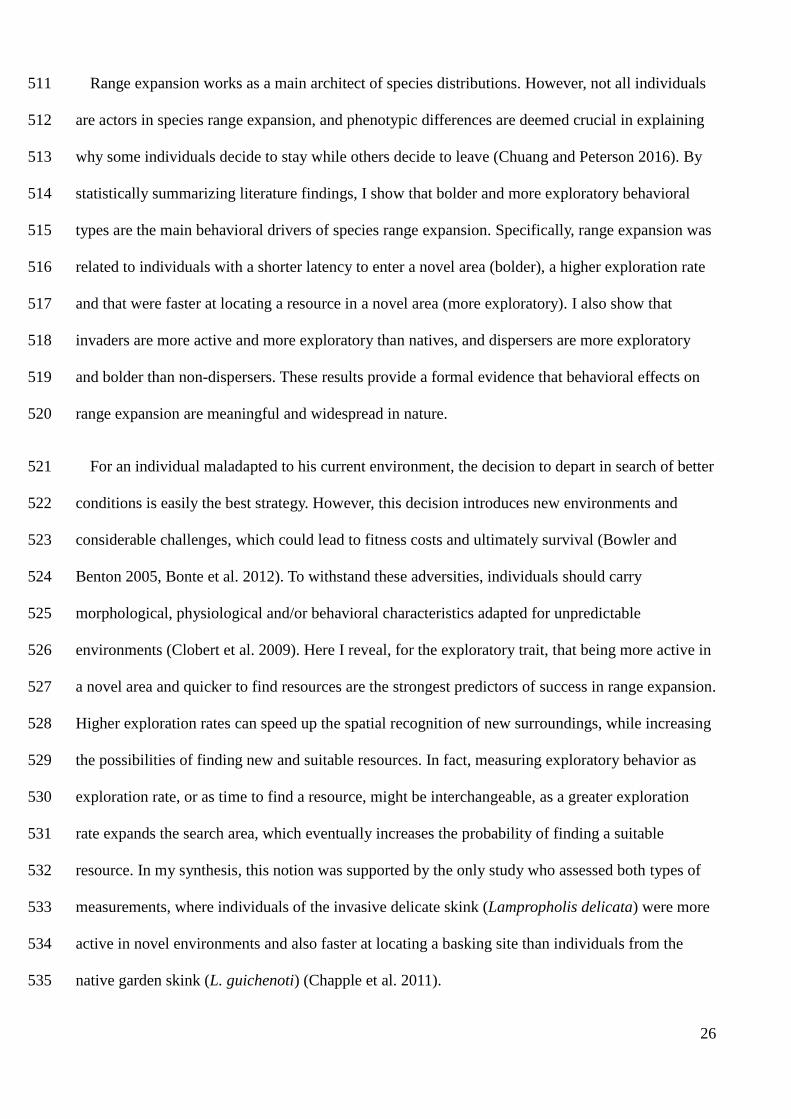
estabelecimento (Figura 1) (Clobert et al 2009, Blackburn et al. 2011, Chapman et al. 2011a). 67
Vários traços como condição corporal (Lopez et al. 2012), sucesso reprodutivo (Duckworth 2008) e 68
comportamento (Liebl and Martin 2012) são tidos como importantes para o sucesso dos indivíduos 69
5
na expansão do território (Chuang and Peterson 2016). Do ponto de vista comportamental, 70
indivíduos que possuam tipos de comportamento que lhes permitam motivar a decisão de partida e 71
assistir na transição e estabelecimento, podem ser os principais responsáveis pela expansão de 72
território (Canestrelli et al. 2016). Deste modo, diversas revisões narrativas têm procurado explicar 73
como as diferenças de comportamento podem influenciar a expansão do território (Cote et al. 74
2010a, Chapman et al. 2011a, Chapple et al. 2012, Wolf and Weissing 2012, Canestrelli et al. 2016). 75
Contudo, ainda é necessário um tratamento sistemático da literatura disponível e suporte empírico 76
para distinguir os padrões gerais dos casos específicos ou relações espúrias. Diante disso, o 77
Capítulo 1 deste trabalho recorre a uma revisão sistemática e meta-análise para avaliar se diferenças 78
comportamentais podem influenciar a capacidade de expansão do território. Os resultados 79
mostraram que os indivíduos que motivam a expansão de território podem apresentar diferenças de 80
Figura 1 – Diagrama dos estágios de expansão de territótrio nos processos biogeográficos de invasão (fluxo
vermelho), dispersão (fluxo verde) e migração (fluxo azul)
6
comportamento face aos que não abandonam o território, potencialmente criando uma distribuição 81
não-aleatória das espécies e/ou populações consoante tipos comportamentais. A expansão do 82
território é sobretudo motivada por indivíduos com um comportamento mais exploratório e mais 83
ousado. Ao analisar se os resultados podiam divergir para os distintos processos biogeográficos, 84
demonstrei também que os indivíduos dispersores são mais exploratórios e ousados que não 85
dispersores, e que invasores são mais ativos e mais exploratórios que nativos. Entretanto, o baixo 86
tamanho amostral obtido para migração impediu chegar a conclusões claras sobre que 87
comportamentos motivam este processo. 88
Tendo em conta a importância da migração para as dinâmicas dos ecossistemas a nível global, e o 89
declínio do comportamento migratório devido à ação humana (Kirby et al. 2008), o Capitulo 2 90
emerge pela necessidade de incentivar a pesquisa sobre as diferenças fenotípicas entre residentes e 91
migradores, sobretudo no contexto de diferenças comportamentais. Assim, me baseando 92
essencialmente nos estudos obtidos na revisão sistemática, no capitulo 2 apresento os principais 93
resultados da literatura sobre migração parcial (fenónemo em que uma espécie é composta por 94
indivíduos que migram e indivíduos que não migram) e comportamento animal, além de identificar 95
as principais lacunas do conhecimento sobre o tema. Concluo chamando à atenção da comunidade 96
científica para a importância do estudo do comportamento migratório nos tempos atuais. 97
CONCLUSÕES 98
A presente dissertação sintetiza formalmente a literatura sobre o papel do comportamento animal 99
em processos biogeográficos, e demonstra que diferenças comportamentais podem ajudar a explicar 100
o sucesso dos indivíduos na expansão do território. A realização de uma revisão sistemática e meta-101
análise no capítulo 1 me permitiu mostrar que indivíduos com comportamentos mais ousados e 102
mais exploratórios podem ser os principais responsáveis pela expansão do território. Através da 103
avaliação de contexto-dependências, demonstro que indivíduos com menor latência para entrar em 104
7
novo meio, maior nível de exploração do novo meio e mais rápidos a encontrar um recurso no novo 105
meio, são os que mais sucesso possuem na expansão do território. Os resultados mostraram ainda 106
que invasores são geralmente mais exploratórios e mais ativos que nativos, e que dispersores são 107
mais exploratórios e mais ousados que não dispersores. Assim, o capítulo 1 consegue apresentar 108
evidências de que diferenças comportamentais em animais podem afetar o sucesso dos indivíduos 109
na expansão do território. Para além disso, o capítulo 1 se baseia no baixo tamanho amostral obtido 110
para alguns traços comportamentais e alguns moderadores, para identificar as principais lacunas de 111
conhecimento no estudo da relação entre comportamento e expansão do território. Por exemplo, 112
poucos estudos foram coletados que estudaram o processo de migração, apesar deste ser um 113
processo de extrema importância na dinâmica dos ecossistemas a larga escala. Diante disso, o 114
capítulo 2 emerge pela necessidade de focalizar a lacuna existente no estudo de como o 115
comportamento animal pode afetar a propensão para migrar. Deste modo, no capitulo 2 eu 116
apresento as descobertas mais importantes nesta área de estudo, elaboro possíveis explicações para 117
as vantagens de cada tipo de comportamento nas estratégias de migração ou residência, e destaco o 118
papel da ação humana no comportamento migratório. Tudo isto para incentivar a comunidade 119
científica para a realização de mais estudos sobre o papel das diferenças comportamentais na 120
migração. 121
Os resultados oriundos desta dissertação mostram que diferenças comportamentais podem 122
contribuir para o sucesso na expansão do território e ultimamente ajudar a entender que 123
características tornam as espécies mais aptas a prosperar perante os novos desafios ambientais 124
impostos pelas mudanças globais. 125
REFERÊNCIAS 126
Ariyomo, T. O., and P. J. Watt. 2012. The effect of variation in boldness and aggressiveness 127
on the reproductive success of zebrafish. Animal Behavior 83:41–46. 128

8
Blackburn, T. M., P. Pyšek, S. Bacher, J. T. Carlton, R. P. Duncan, V. Jarošík, J. R. U. Wilson, 129
and D. M. Richardson. 2011. A proposed unified framework for biological invasions. 130
Trends in Ecology and Evolution 26:333–339. 131
Bowler, D. E., and T. G. Benton. 2005. Causes and consequences of animal dispersal 132
strategies: Relating individual behavior to spatial dynamics. Biological Reviews of the 133
Cambridge Philosophical Society 80:205–225. 134
Camperio Ciani, A. S., C. Capiluppi, A. Veronese, and G. Sartori. 2007. The Adaptive Value 135
of Personality Differences Revealed by Small Island Population Dynamics. European 136
Journal of Personality Eur. J. Pers 21:3–22. 137
Canestrelli, D., R. Bisconti, and C. Carere. 2016. Bolder Takes All? The Behavioral 138
Dimension of Biogeography. Trends in Ecology and Evolution 31:35–43. 139
Carere, and Maestripieri. 2013. Animal personalities Behavior Physiology and evolution. 140
University of Chicago Press, Chicago. 141
Chapin III, F. S., E. S. Zavaleta, V. T. Eviner, R. L. Naylor, P. M. Vitousek, H. L. Reynolds, 142
D. U. Hooper, S. Lavorel, O. E. Sala, S. E. Hobbie, M. C. Mack, and S. Díaz. 2000. 143
Consequences of changing biodiversity. Nature 405:234–242. 144
Chapman, B. B., C. Brönmark, J. Å. Nilsson, and L. A. Hansson. 2011. The ecology and 145
evolution of partial migration. Oikos 120:1764–1775. 146
Chapple, D. G., S. M. Simmonds, and B. B. M. Wong. 2012. Can behavioral and personality 147
traits influence the success of unintentional species introductions? Trends in Ecology and 148
Evolution 27:57–62. 149
Chen, C., M. Burton, E. Greenberger, and J. Dmitrieva. 1999. Population migration and the 150
variation of dopamine D4 receptor (DRD4) allele frequencies around the globe. Evolution 151
and Human Behavior 20:309–324. 152
Chevin, L. M., and R. Lande. 2010. When do adaptive plasticity and genetic evolution prevent 153
extinction of a density-regulated population? Evolution 64:1143–1150. 154
Chuang, A., and C. R. Peterson. 2016. Expanding population edges: Theories, traits, and 155
trade-offs. Global Change Biology 22:494–512. 156
Cote, J., J. Clobert, T. Brodin, S. Fogarty, and A. Sih. 2010. Personality-dependent dispersal: 157
characterization, ontogeny and consequences for spatially structured populations. 158
Philosophical Transactions of the Royal Society B: Biological Sciences 365:4065–4076. 159
Dirzo, R., H. S. Young, M. Galetti, G. Ceballos, N. J. B. Isaac, and B. Collen. 2014. 160
Defaunation in the Anthropocene. Science 345:401–406. 161
Dochtermann, N. A., T. Schwab, and A. Sih. 2014. The contribution of additive genetic 162
variation to personality variation: heritability of personality. Proceedings of the Royal 163
Society B: Biological Sciences 282:20142201–20142201. 164
Duckworth, R. A. 2008. Adaptive Dispersal Strategies and the Dynamics of a Range 165
Expansion. The American Naturalist 172:S4–S17. 166
Gosling, S. D., and O. P. John. 1999. Personality Dimensions in Nonhuman Animals. Current 167
Directions in Psychological Science 8:69–75. 168
Groothuis, T. G. ., C. Carere, J. Lipar, P. J. Drent, and H. Schwabl. 2008. Selection on 169
personality in a songbird affects maternal hormone levels tuned to its effect on timing of 170
reproduction. Biology Letters 4:465–467. 171
Jokela, M. 2009. Personality predicts migration within and between U.S. states. Journal of 172
Research in Personality 43:79–83. 173
9
Kirby, J. S., A. J. Stattersfield, S. H. M. Butchart, M. I. Evans, R. F. A. Grimmett, V. R. Jones, 174
J. O’sullivan, G. M. Tucker, and I. Newton. 2008. Key conservation issues for migratory 175
land- and waterbird species on the world’s major flyways. Bird Conservation International 176
18:S49–S73. 177
Liebl, A. L., and L. B. Martin. 2012. Exploratory behavior and stressor hyper-responsiveness 178
facilitate range expansion of an introduced songbird. Proceedings of the Royal Society B: 179
Biological Sciences 279:4375–4381. 180
Lopez, D. P., A. A. Jungman, and J. S. Rehage. 2012. Nonnative African jewelfish are more 181
fit but not bolder at the invasion front: a trait comparison across an Everglades range 182
expansion. Biological Invasions 14:2159–2174. 183
Matthews, L. J., and P. M. Butler. 2011. Novelty-seeking DRD4 polymorphisms are 184
associated with human migration distance out-of-Africa after controlling for neutral 185
population gene structure. American Journal of Physical Anthropology 145:382–389. 186
Oers, V., de Jong, and van Noordwijk…. 2004. Contribution of genetics to the study of animal 187
personalities: a review of case studies. Behavior:1185–1206. 188
Otto, K., and C. Dalbert. 2012. Individual differences in job‐related relocation readiness. 189
Career Development International 17:168–186. 190
Riechert, S. E., and R. F. Hall. 2000. Local population success in heterogeneous habitats: 191
Reciprocal transplant experiments completed on a desert spider. Journal of Evolutionary 192
Biology 13:541–550. 193
Schuett, W., J. G. J. Godin, and S. R. X. Dall. 2011. Do female zebra finches, Taeniopygia 194
guttata, choose their mates based on their “personality”? Ethology 117:908–917. 195
Seaman, B., and M. Briffa. 2015. Parasites and personality in periwinkles (Littorina littorea): 196
Infection status is associated with mean-level boldness but not repeatability. Behavioral 197
Processes 115:132–134. 198
Shivik, J. 2017. Mousy Cats and Sheepish Coyotes: The Science of Animal Personalities. 199
Beacon Press, Boston. 200
Sih, A., J. Cote, M. Evans, S. Fogarty, and J. Pruitt. 2012. Ecological implications of 201
behavioral syndromes. Ecology Letters 15:278–289. 202
Sih, A., L. B. Kats, and E. F. Maurer. 2003. Behavioral correlations across situations and the 203
evolution of antipredator behavior in a sunfish-salamander system. Animal Behavior 204
65:29–44. 205
Smith, B. R., and D. T. Blumstein. 2008. Fitness consequences of personality: A meta-206
analysis. Behavioral Ecology 19:448–455. 207
Tabor, A. S., T. L. Milfont, and C. Ward. 2015. The Migrant Personality Revisited : Individual 208
Differences and International Mobility Intentions. New Zealand Journal of Psychology 209
44:89–96. 210
Verhulst, E. C., A. C. Mateman, M. V. Zwier, S. P. Caro, K. J. F. Verhoeven, and K. Van Oers. 211
2016. Evidence from pyrosequencing indicates that natural variation in animal personality 212
is associated with DRD4 DNA methylation. Molecular Ecology 25:1801–1811. 213
Williams, S. E., L. P. Shoo, J. L. Isaac, A. A. Hoffmann, and G. Langham. 2008. Towards an 214
Integrated Framework for Assessing the Vulnerability of Species to Climate Change. PLoS 215
Biology 6:e325. 216
Wolf, M., and F. J. Weissing. 2012. Animal personalities: Consequences for ecology and 217
evolution. Trends in Ecology and Evolution 27:452–461. 218
10
Wong, B. B. M., and U. Candolin. 2015. Behavioral responses to changing environments. 219
Behavioral Ecology 26:665–673. 220
11
Capítulo 1 221
222
The role of behavioral traits in species distribution: a bayesian meta-analysis 223
224
ABSTRACT: Research in animal personality is increasing our understanding of what prevents a 225
species from colonizing new areas, which is one of the outstanding questions in biogeography. 226
Some behavioral types can perform better than others in specific stages involved in range 227
expansion. For example, a high exploratory behavior increases the chances of finding new resources 228
in novel environments. However, inconsistent results in the literature hindered a definite recognition 229
of the role of animal personalities on species distributions. I collected data available in the literature 230
and performed a bayesian meta-analysis to assess which behavioral types are driving range 231
expansion in the following biogeographical processes: dispersal, migration and invasion. I used 232
several moderators to try to discern context-dependencies in effect sizes. A hierarchical model, with 233
effect sizes nested within studies, revealed that more exploratory and bolder behaviors facilitate 234
range expansion. Also, I found that invasive individuals are more likely to be more exploratory and 235
more active than natives, while dispersers are generally bolder and more exploratory than non-236
dispersers. Yet, the low study sample size obtained for analysis stresses the need to conduct more 237
primary studies. Results highlight the role of behavioral traits in species distributions and increase 238
our knowledge about which ecological characteristics might prepare species to endure the current 239
global environmental challenges. 240
241
RESUMO 242
A pesquisa em personalidade animal está aumentando o nosso conhecimento sobre o que previne 243
uma espécie de colonizar novas áreas, sendo esta uma das principais questões em biogeografia. 244
Alguns tipos de comportamento podem resultar em melhor desempenho que outros em específicos 245
12
estágios de expansão do território. Por exemplo, um comportamento mais exploratório facilita a 246
descoberta de recursos em um novo meio. Contudo, resultados inconsistentes na literatura estão 247
dificultando um reconhecimento do papel da personalidade animal na distribuição das espécies. 248
Coletei dados da literatura e realizei uma meta-análise bayesiana para determinar que tipos de 249
comportamento são responsáveis pela expansão do território através dos processos biogeográficos 250
de: dispersão, invasão e migração. Fiz ainda uso de vários moderadores na tentativa de identificar 251
contexto-dependências nos tamanhos de efeito. Em um modelo hierárquico, usando tamanhos de 252
efeito aninhados dentro dos estudos, mostro que um comportamento mais ousado e mais 253
exploratório facilita o sucesso na expansão do território. Para além disso, eu demonstro que 254
invasores são mais exploratórios e mais ativos que nativos, e dispersores são mais exploratórios e 255
ousados que não-dispersores. Contudo, o baixo tamanho amostral obtido para as análises demonstra 256
a necessidade de conduzir mais estudos primários. Os resultados realçam o papel dos traços 257
comportamentais na distribuição das espécies e aumentam o nosso conhecimento sobre que 258
características ecológicas podem preparar as espécies para resistir aos desafios das mudanças 259
ambientais. 260
261
INTRODUCTION 262 263
Differences in behavior among humans are one of the building blocks of our societies, as each 264
person’s personality influences both its own life and the lives of people around. For non-human 265
animals it might be no different. Individual differences in behavior, formerly considered as noise of 266
an adaptive mean trait (Réale et al. 2007), are gaining importance as key factors in ecological and 267
evolutionary processes (Pennisi 2016). Behavioral differences were already shown to have 268
implications in fitness (Smith & Blumstein 2008), predator-prey dynamics (Sih et al 2003), range 269
expansion (Duckworth & Badyaev 2007), or even drive communities to collapse (Pruitt & 270
13
Modlmeier 2015). Moreover, behavioral differences have underlying physiological (Groothuis et al. 271
2008), genetic (Dochtermann et al. 2015), epigenetic (Verhulst et al. 2016) and heritable (van Oers 272
et al. 2004) mechanisms. When behavioral differences are consistent both over time and/or across 273
different contexts, they are termed ‘temperament’ (Réale et al. 2007) or ‘personalities’ (Wolf and 274
Weissing 2012). 275
A promising topic in the study of animal personalities is their role on species distributions 276
(Canestrelli et al 2016), where some behavioral types can be the main drivers of range expansion. 277
Specifically, animal personalities can produce a non-random spatial distribution of behavioral types 278
if they influence common steps for different biogeographical processes: the decision to abandon a 279
current area, the ability to move between areas, and the capacity to establish in a new area. The 280
spatial dynamics of species distributions are primarily shaped by dispersal, migration and invasion 281
(Cassini 2013). By natural means, species can move between locations through dispersal or 282
migration, where dispersal is a single, generally solitary one-way movement from one area to 283
another, and migration is a cyclical, generally collective movement between two areas (Cote et al. 284
2016). By non-natural means, the invasion process shares similarities with dispersal, but in that case 285
animals make use of human-mediated transport (e.g. animals accidentally transported with cargo), 286
which enables them to overcome ecological and geographical barriers (Chapple et al. 2012). 287
Despite the differences between the processes of dispersal, migration, and invasion, all describe 288
individual responsiveness to socio-ecological factors and expose individuals to significant costs and 289
environmental challenges (Bowler and Benton 2005, Blackburn et al. 2011, Chapman et al. 2011a). 290
Consequently, even within a population, not all individuals successfully move between areas, and 291
differences in success have been mostly attributed to variation in physiological, behavioral, 292
cognitive and morphological traits (Clobert et al. 2009). For example, a larger relative brain size, 293
which is used as a proxy for cognitive ability, has been positively related to invasiveness (Sol et al. 294
2008) and negatively related to migratory propensity (Sol et al. 2005, Vincze 2016). Several other 295
14
traits have been shown to influence the propensity of individuals to expand their range, such as 296
body size (McCauley et al. 2010, Thorlacius et al. 2015), parental care (Duckworth 2008, Jonker et 297
al. 2012) and corticosterone levels (de Fraipoint et al. 2000). However, phenotypic differences 298
between individuals that tend to stay and those that tend to depart do not hold in different 299
environments, as their nature rely on the suitability of each trait expression to different ecological 300
and environmental factors. In this sense, some traits can put weight on the fitness trade-off between 301
staying or departing, eventually triggering the decision to depart and ultimately assisting in the 302
arrival and establishment in a new area (Bowler and Benton 2005, Chapman et al. 2011a, Chapple 303
et al. 2012). Accordingly, studies have shown that individuals with different behavioral types are 304
favored in different environments (Riechert and Hall 2000, Sih et al. 2003, Wolf and Weissing 305
2012), thus decisions to depart from an area can come from individuals with locally unsuitable 306
behavioral types (Table 1). 307
Table 1 Behavioral traits and predicted effects on range expansion processes. ‘+’ means that a higher behavioral trait 308 value (e.g. bolder) relates to higher success in a range expansion stage, and ‘–’ means the opposite. ‘+/-’ means that 309 relation is context-dependent or uncertain. The hypothesized relationships are mainly based on Cote et al. 2010, 310 Chapman et al. 2011a, Chapple et al. 2012, Canestrelli et al. 2016. 311 312
Behavioral trait Range expansion processes
Dispersal Migration Invasion
Boldness (shier → bolder) - reaction towards a risky situation (predators or
humans). The bolder individual is more risk-prone (e.g. delay escape
response when faced with predator).
+
+
+/-
Exploratory (less exploratory → more exploratory) - reaction towards a new
situation (new habitat or new object). The more exploratory individual is
more adept to explore new situations.
+
+
+
Aggressiveness (less aggressive → more aggressive) - agonistic interactions
towards conspecifics or heterospecifics.
+/-
-
+/-
Activity (less active → more active) - general level of activity in a familiar
environment.
+
+/-
+
Sociability (asocial → more social) - tendency to aggregate or to actively
search non-aggressive interactions with conspecifics.
-
+
-
313
15
Dispersal tendency is often associated with bolder, asocial, more exploratory, more aggressive 314
and more active behavioral types (Table 1) (Canestrelli et al. 2016). However, some studies found 315
that more exploratory, but not bold or asocial individuals, had higher dispersal tendency (Thorlacius 316
et al. 2015). Others found no differentiation between behavioral types of residents and dispersers 317
when individuals were experimentally put under predation risk, probably because predator 318
avoidance dominated dispersal decisions (Cote et al. 2013). Migratory tendency, in turn, has been 319
linked to bolder behavioral types where bolder individuals might have been compelled to migrate 320
due to their higher vulnerability to predation in resource scarcity periods (Chapman et al. 2011a, 321
2011b). Interestingly, human settlements can decrease consumptive predation risk and provide areas 322
with a year-round supply of resources, which could explain why a study on elk found that bolder 323
individuals were the ones to remain resident, while shier migrated away from human settlements as 324
soon as conditions in the mountains became favorable (Found and St. Clair 2016). 325
Invasive species are considered a major biodiversity threat (Vitousek et al. 1996, Simberloff et al. 326
2013). Although propagule pressure is widely used as a predictor of invasion success, it does not 327
explain why some species fail to establish in new areas (Sagata and Lester 2009, Chapple et al. 328
2012). Behavioral research may be able to provide a complementary explanation to invasive 329
performance (Chapple et al. 2012, Weis and Sol 2016), by suggesting that individuals with 330
favorable behavioral types can withstand the environmental challenges common to the invasion 331
process (Chapple et al. 2012). Moreover, behavior plays a crucial role in determining species 332
interactions and species responses to environmental changes (Wolf and Weissing 2012), so it may 333
determine what impacts invaders will have once established (Weis and Sol 2016). A study on 334
bluebirds showed that invaders with more aggressive behavioral types fiercely outcompeted 335
individuals of native species, therefore increasing their chances to establish in new territories 336
(Duckworth 2008). However, high aggressiveness can hamper species’ capacity to reach high 337
densities, as aggressive individuals generally acquire larger territories (Duckworth 2008). 338
16
Therefore, successful invasion might rely on behavioral variation among individuals, where 339
aggressive individuals pave the way for the latter arrival of more docile individuals (Duckworth 340
2008). Other study showed that individuals from the front of range expansion were more 341
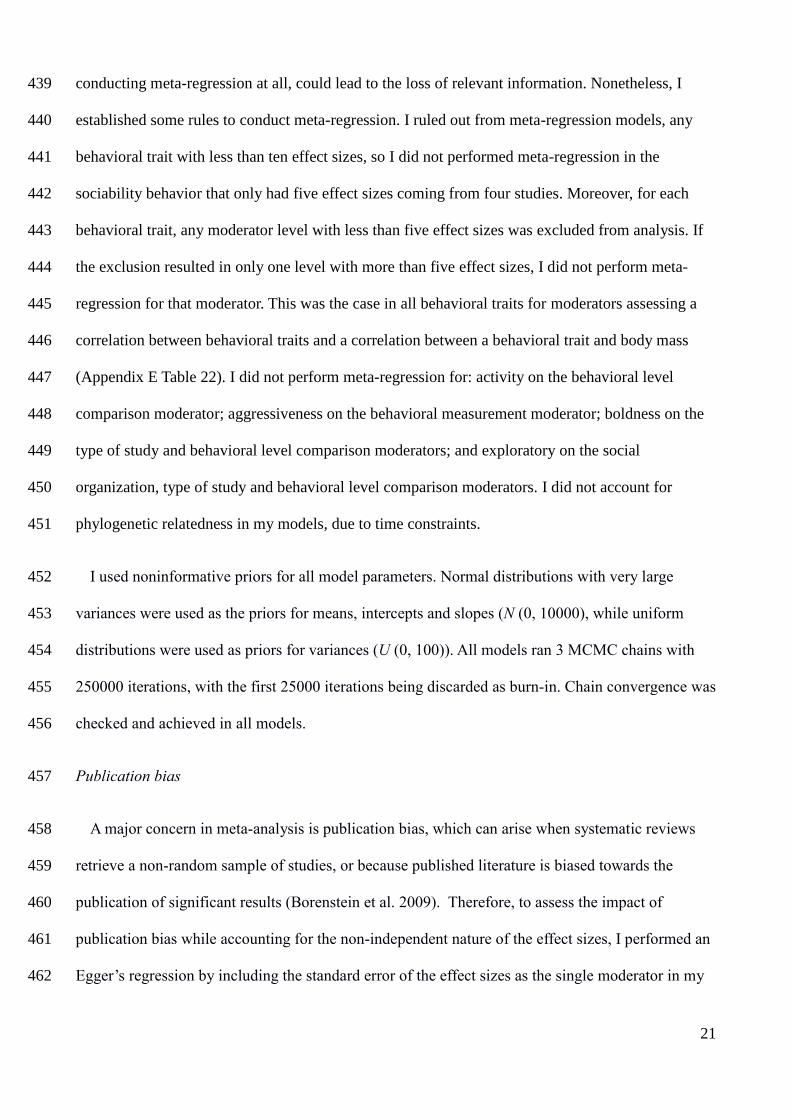
exploratory when compared with individuals in long established populations (Martin and Fitzgerald 342
2005). Individuals inhabiting long established populations may be less exploratory because they 343
have benefited from available information about locally suitable resources, made possible by the 344
previous passage of more exploratory individuals. 345
In this study I conduct a meta-analysis to determine which behavioral types are the main drivers 346
of range expansion. Then I use moderator variables to evaluate context-dependencies affecting the 347
success of behavioral types along range expansion, and to determine if different behavioral types 348
are favored in each processes of dispersal, migration or invasion. Many narrative reviews point out 349
the importance of behavior in biogeography (Cote et al 2010, Chapple et al 2011, Canestrelli et al 350
2016), but as far as I know, my study is the first to systematically analyse the available literature 351
and provide general inferences about the role of behavioral differences on species distributions. 352
Behavior is generally animals’ first response to environmental changes (Wong and Candolin 2015). 353
Thus, in a world with an unprecedented rate of human-induced changes, insights about which 354
behavioral types motivate range expansion will increase our knowledge of which species will 355
persist or even thrive in the face of new challenges. 356
METHODS 357
Literature search 358
I conducted a literature search for studies published before 17 June 2016 on Web of Science and 359
Google Scholar databases, with different combinations of keywords commonly found in studies of 360
animal behavior and range expansion processes (see Appendix A for detailed information). The 361
search turned up 15,890 studies, which were reduced to 15,513 after duplicate removal. I screened 362
17
the 15,513 studies by title and abstract using abstrackr online platform (Wallace et al. 2012) and 363
excluded the ones that failed to meet the inclusion criteria (Appendix B for PRISMA diagram). The 364
full text of all remaining studies was examined closely. 365
In general, animal behavior studies do not follow a well-defined terminology or methodology, 366
thus I will apply general rules for data extraction. I used animal personality definitions based on 367
Réale et al. (2007) framework, partitioning personality into five behavioral traits (i) activity; (ii) 368
aggressiveness, (iii) boldness, (iv) exploratory (v) and sociability (see Table 1 for behavioral trait 369
definitions). To conduct meta-analysis, I extracted data from studies that systematically measured 370
any behavior related to one of the five behavioral traits (Table 1), and provided behavioral 371
comparisons such as those between: i) non-dispersers and dispersers; ii) or residents and migrants; 372
iii) or native range and introduced range. Both intraspecific and interspecific comparisons were 373
used, with the latter being restricted to same family comparisons. 374
Effect size calculation 375
I computed the Hedge’s g as the standard effect size metric to be used in meta-analysis 376
(Borenstein et al 2009). The effect size was computed directly from the studies that reported both 377
the mean behavioral trait value and respective standard deviation for both the group with the least 378
potential for range expansion (i.e. residents, or non-dispersers or natives) and the group with the 379
highest potential for range expansion (migrants, dispersers, invaders). Whenever studies did not 380
provide this information, I proceded in the following order: (1) tried to collect correlation or linear 381
regression coefficients assessing a relation between behavioral trait values and the potencial for 382
range expansion (e.g. more exploratory are more likely to disperse farther); (2) collect binary 383
proportions which normally synthesized behavioral trait variation in two groups (e.g. bold group 384
and shy group) and assessed what proportion of each group were likely to expand their range; (3) 385
collect results of statistics based on distributions such as t-value, F or χ2 ; (4) collect median and 386
18
interquartile ranges (25% and 75%). To transform the different metrics to Hedge’s g, I used R 387
software with the compute.es package (Del Re, 2013). The only exception was for median and 388
interquartile ranges, where I followed the procedure in Wan et al (2014) to get approximations for 389
the mean and standard deviation. Some studies did not report any of the metrics aforementioned or 390
gave only incomplete data. In that case, I contacted the corresponding author to request the missing 391
data. Studies that met criteria, but lacked the data needed to compute Hedge’s g, did not report 392
species-specific data, and experimental studies that explicitly manipulated the physiology or 393
environmental variables without a control group were not included in the analysis (Appendix A for 394
PRISMA Diagram). 395
Hedge’s g effect size is centered at 0, where 0 represents no differences between the the two 396
group means (in my case, no difference between a lower behavioral trait value (less aggressive) and 397
a higher behavioral value (more aggressive) in their potencial for range expansion). A positive 398
effect size reflects an association between a higher behavioral trait value (e.g. more aggressive) 399
with a higher potential for range expansion (e.g. more likely to disperse away from home range), 400
while a negative effect size reflects an association between a lower behavioral trait value (e.g. less 401
aggressive) and a higher potential for range expansion (e.g. more likely to disperse away from 402
home range). 403
Meta-analytical models 404
To deal with non-independence arising from multiple effects in the same study I built a 405
hierarchical model and conducted a bayesian meta-analysis for each behavioral trait (Table 2). 406
Bayesian inference emerges through the combination of prior information with likelihood estimates 407
to produce a posterior distribution. In my hierarchical model, effect sizes were nested within studies 408
with random effects for studies to account for some of the within study dependency. Effect sizes 409
performed on the same individuals, but in different time periods, with different control groups or 410
19
measuring the same behavioral trait, were lumped as a composite effect size using formulas in 411
Borenstein (2009), assuming a correlation coefficient of r = 0.5. I was unable to account for all 412
dependencies (e.g. dependency arising from using the same control group for multiple effect sizes), 413
as the low study sample size deterred the possibility of using more complex models. 414
Table 2 Statistical representation and description of the meta-analytical models. 415 416 Models Model description
Model without moderator
𝑇𝑖 = 𝑁(𝜃𝑖 , 𝜎𝑖2)
𝜃𝑖 = 𝑁(𝜑𝑗[𝑖], 𝜏2 )
𝜑𝑗 = 𝑁(𝜇, 𝜔2 )
Each effect size Ti is normally distributed
around a true mean 𝜃𝑖, with 𝜃𝑖 being normally
distributed around each study mean 𝜑𝑗. These
study means are then normally distributed
around an overall mean 𝜇, which represents the
summary effect of a behavioral trait on range
expansion.
Model with single moderator
𝑇𝑖 = 𝑁(𝜃𝑖 , 𝜎𝑖2)
𝜃𝑖 = 𝑁(𝜑𝑗[𝑖] + 𝛽𝑘[𝑖] ∗ 𝑋𝑖, 𝜏2 )
𝜑𝑗 = 𝑁(𝜇, 𝜔2 )
Each effect size Ti is normally distributed
around a true mean 𝜃𝑖. 𝜃𝑖 is then normally
distributed around a mean determined by study
random intercepts 𝜑𝑗 and the effect of
moderator levels 𝛽𝑘 (k represents the number
of moderator from 1 to k) over the random
intercept mean 𝜇. The random intercept mean
𝜇 corresponds to the estimated mean for the
effect sizes coded with the moderator level that
was set in my model to be the intercept.
417
I assessed the potential for range expansion of each behavioral trait by examining the posterior 418
distribution of the summary effect size. The behavioral traits with a 95% credible interval that did 419
not overlap 0 were assumed to have an effect on range expansion. Additionally, I tested the 420
probability for each behavioral trait to have an effect size value higher than 0 over all Markov 421
Chain Monte Carlo (MCMC) iterations, using these probability values to explain the results 422
whenever credible intervals were not precise enough to exclude 0. The latter is similar to a one-423
tailed test for a null hypothesis of effect size < 0, but using Bayesian inference I am actually 424
assessing the probability of the effect size being greater than 0 given my data, instead of the 425
probability obtaining the effect size estimate, if the null hypothesis (effect size < 0) is true. 426
20
Since my research synthesis addresses different study designs (e.g. experimental and 427
observational), different species, and different range expansion processes, I assumed the presence of 428
heterogeneity in effect sizes and collected moderator variables to attempt the identification of the 429
sources of heterogeneity (Table 3). 430
Table 3 Moderators and some description of why they were collected for my analysis 431
Moderators Justification
How the behavioral trait was measured Different measurements for the same behavioral traits may not exactly produce the
same results (Garamszegi et al 2013)
Experimental or observational study Animals under observational or experimental conditions can experience a multitude of
different factors that potentially constrain their behaviors (Réale et al 2007)
Correlation between behavioral traits in
the primary study (I will collect its
reported correlation coefficient).
Allows to determine if the potential for range expansion is greater when some
behavioral traits are correlated (Sih et al 2012)
Behavioral trait correlation with body
mass (I will retrieve their correlation
coefficient)
A behavioral type’s potential for range expansion may be associated with other traits
such as body mass (Chuang and Peterson 2016)
Behavioral measurement level Behavioral traits can be measured at different taxonomic levels (Réale et al 2007). For
example, intraspecific studies may provide different information when compared to
interspecific studies (see social organization moderator for an example).
Social organization Eusocial species, such as the majority of ants, can benefit from a combination of low
intraspecific aggression and high interspecific aggression to successfully invade a new
location (Holway et al. 1998)
Biogeographical processes Factors influencing the processes of dispersal, migration and invasion can differ, so I
will categorize these processes to discern which behavioral types are most favored in
each process (Cote et al. 2010, Chapman et al. 2011a, Chapple et al. 2012)
Taxonomic class There might be ecological or evolutionary differences between different taxonomic
classes such that the behavioral types that most favor range expansion could differ
among classes.
432
The explanatory power of moderator variables was assessed using bayesian meta-regression 433
(Koricheva et al. 2013). For meta-regression, I used a hierarchical model with effect sizes nested 434
within studies with random effects for studies and using a single moderator at the effect size level 435
(Table 2). I did not conduct any additive or interactive model as the sample size was quite low for 436
all behavioral traits (Appendix E Table 1). I am aware that testing each moderator individually 437
might give rise to some spurious relations, however choosing only a subset of moderators or not 438
21
conducting meta-regression at all, could lead to the loss of relevant information. Nonetheless, I 439
established some rules to conduct meta-regression. I ruled out from meta-regression models, any 440
behavioral trait with less than ten effect sizes, so I did not performed meta-regression in the 441
sociability behavior that only had five effect sizes coming from four studies. Moreover, for each 442
behavioral trait, any moderator level with less than five effect sizes was excluded from analysis. If 443
the exclusion resulted in only one level with more than five effect sizes, I did not perform meta-444
regression for that moderator. This was the case in all behavioral traits for moderators assessing a 445
correlation between behavioral traits and a correlation between a behavioral trait and body mass 446
(Appendix E Table 22). I did not perform meta-regression for: activity on the behavioral level 447
comparison moderator; aggressiveness on the behavioral measurement moderator; boldness on the 448
type of study and behavioral level comparison moderators; and exploratory on the social 449
organization, type of study and behavioral level comparison moderators. I did not account for 450
phylogenetic relatedness in my models, due to time constraints. 451
I used noninformative priors for all model parameters. Normal distributions with very large 452
variances were used as the priors for means, intercepts and slopes (N (0, 10000), while uniform 453
distributions were used as priors for variances (U (0, 100)). All models ran 3 MCMC chains with 454
250000 iterations, with the first 25000 iterations being discarded as burn-in. Chain convergence was 455
checked and achieved in all models. 456
Publication bias 457
A major concern in meta-analysis is publication bias, which can arise when systematic reviews 458
retrieve a non-random sample of studies, or because published literature is biased towards the 459
publication of significant results (Borenstein et al. 2009). Therefore, to assess the impact of 460
publication bias while accounting for the non-independent nature of the effect sizes, I performed an 461
Egger’s regression by including the standard error of the effect sizes as the single moderator in my 462
22
hierarchical models. Credible intervals (95%) of the model intercept that do not bracket 0 indicate 463
publication bias in a given behavioral trait (Sterne and Egger 2005). 464
RESULTS 465
I selected 903 studies by title and abstract screening. From these, 45 studies passed through the 466
inclusion criteria and were ultimately used in the meta-analysis. Some studies reported more than 467
one effect size, as they could have measured multiple behavioral traits and/or multiple species 468
(Appendix B for PRISMA diagram), totalling 99 effect sizes, distributed among the five behavioral 469
traits (Appendix D for detailed information). Aggressiveness had the highest number of studies 470
(18), followed by exploratory and boldness (both 16), activity (14) and lastly sociability (4). 471
In the hierarchical models without moderators, bolder and more exploratory behavioral types had 472
a higher potential for range expansion, with a summary effect size of 0.3867 (Credible Interval 473
[0.0720, 0.6967]) (Figure 1) and 0.5822 (CI [0.2745, 08975]) (Figure 1), respectively. The summary 474
effect sizes were also positive for more active (mean = 0.4332) (Figure 1) and more social (mean = 475
0.3188) (Figure 1) behavioral types, with a more active behavior being highly likely to have a 476
greater potential for range expansion (P (effect size > 0) = 0.96), but credible intervals for activity 477
and sociability overlapped zero (Appendix E Table 1). In constrast, the summary effect for 478
aggressiveness was negative (mean = -0.1290) (Figure 1), but this result only represented a mild 479
tendency for less aggressive behaviors to have a higher potential for range expansion, because 480
credible intervals were wide (CI [-1.6940, 1.335]) and probability of having a negative effect size 481
was only 0.56 (see Appendix E Table 1). 482
483
23
484
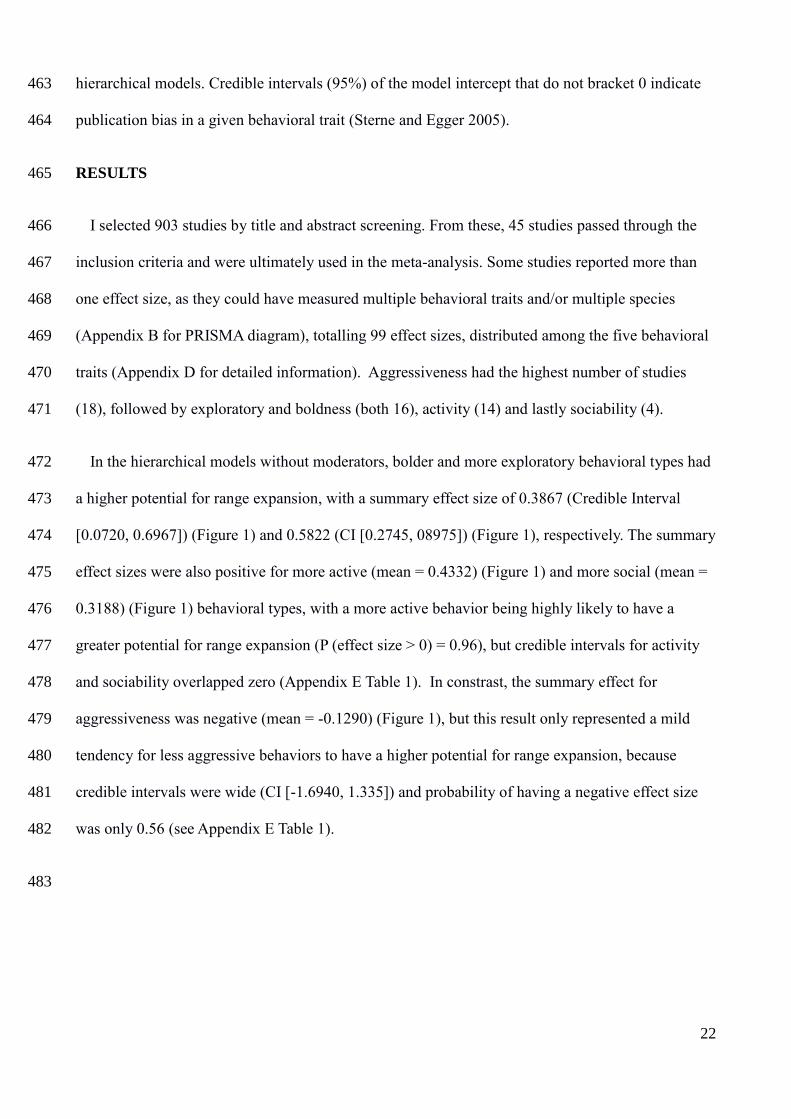
In the meta-regression models, I found that invasive individuals are more exploratory (mean = 485
0.7332, CI [0.1972, 1.2760]) and are also highly likely to be more active (P (effect size > 0) = 0.95) 486
(Figure 2 and Appendix E Tables 2 - 5). Moreover, dispersers are more exploratory (mean = 487
0.5446, CI [0.0253, 1.0560]) (Figure 2) and highly likely to be bolder (P (effect size > 0) = 0.96) 488
(Figure 2 and Appendix E Tables 2 - 5). Due to the low sample size, I only assessed migration in the 489
behavioral traits boldness and aggressiveness, but neither provided evidences of a possible effect on 490
migration (Figure 2 and Appendix E Tables 3, 4). 491
Figure 1 – Posterior distributions of activity (top left), aggressiveness (top right), boldness (bottom left), exploratory
(bottom right) and sociability (middle) behavioural traits obtained for the hierarchical model with effect sizes nested
within studies. The area in blue shows the 95% Credible Intervals. A positive effect size means that a higher behavioural
trait value (e.g. more active) have a higher potential for range expansion, while a negative effect size means a lower
behavioural trait value (less active) have a higher potential for range expansion.

24
Exploratory individuals who led range expansion scored higher on measurements of activity in a 492
novel area (mean = 0.6050, CI [0.1577, 1.0640]), and were faster in finding a resource in a novel 493
area (mean = 0.8490, CI [0.0951, 1.5860]) (Figure 3). Additionally, in boldness tests, individuals 494
who led range expansion had a shorter latency to enter a novel area (mean = 0.5401, CI [0.0859, 495
1.0020]) (Figure 3). 496
Figure 2 – Posterior distributions of activity (top left), exploratory (top right), aggressiveness (bottom left), and
boldness (bottom right) for models assessing the moderator ‘biogeographical process’. Distributions refer to the levels
of dispersal (in salmon color), invasion (green) and migration (blue). Activity and exploratory behaviors had each less
than 5 effect sizes on migration, so migration was excluded from activity and exporatory behaviors models.
25
Regarding the social organization of the studied species, my models showed that bolder 497
individuals from solitary species have higher potential for range expansion (mean = 0.7638, CI 498
0.0595, 1.4750]) (Appendix E Table 16). Furthermore, individuals pertaining to the classes 499
Actinopterygii and Aves had a higher success in range expansion if they expressed a more 500
exploratory behavior (mean = 0.6677, CI [0.1503, 1.1780] for Actinopterygii; and mean = 0.5347, 501
CI [0.0292, 1.1290] for Aves), although those were the only levels with enough sample size to be 502
included in the model (Appendix E Tables 6 – 9). 503
Model results failed to show evidence that the type of study design (only aggressiveness and 504
activity were assessed) (Appendix E Tables 18 – 19) or the behavioral measurement level (only 505
aggressiveness was assessed) (Appendix E Table 21) moderators influenced the outcome of the 506
relation between a behavioral type and range expansion. 507
Finally, Egger’s regression led me to conclude that publication bias was absent in all behavioral 508
trait hierarchical models (Appendix F, Table 1). 509
DISCUSSION 510
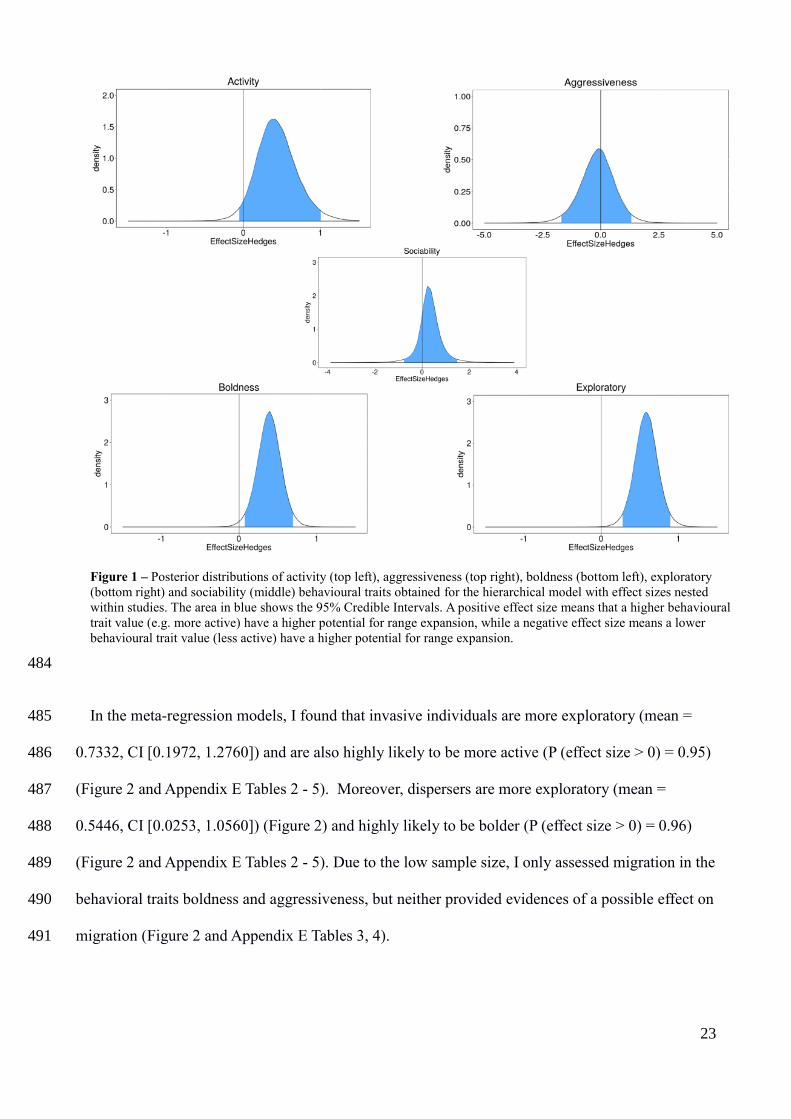
Figure 2 – Posterior distributions for boldness (left) and exploratory (right) behaviors for models assessing
moderator ‘behavioral measurement’. For boldness behavior the measurements of latency to enter a novel area
(LatNovelArea, in salmon color) and response to threat (RespThreat, in turquoise color) were used as moderator
levels. For exploratory behavior the measurements of exploration rate of a novel area (ExploreNovelArea, in
salmon color) and response to threat (RespThreat, in turquoise color) were used as moderator levels.
26
Range expansion works as a main architect of species distributions. However, not all individuals 511
are actors in species range expansion, and phenotypic differences are deemed crucial in explaining 512
why some individuals decide to stay while others decide to leave (Chuang and Peterson 2016). By 513
statistically summarizing literature findings, I show that bolder and more exploratory behavioral 514
types are the main behavioral drivers of species range expansion. Specifically, range expansion was 515
related to individuals with a shorter latency to enter a novel area (bolder), a higher exploration rate 516
and that were faster at locating a resource in a novel area (more exploratory). I also show that 517
invaders are more active and more exploratory than natives, and dispersers are more exploratory 518
and bolder than non-dispersers. These results provide a formal evidence that behavioral effects on 519
range expansion are meaningful and widespread in nature. 520
For an individual maladapted to his current environment, the decision to depart in search of better 521
conditions is easily the best strategy. However, this decision introduces new environments and 522
considerable challenges, which could lead to fitness costs and ultimately survival (Bowler and 523
Benton 2005, Bonte et al. 2012). To withstand these adversities, individuals should carry 524
morphological, physiological and/or behavioral characteristics adapted for unpredictable 525
environments (Clobert et al. 2009). Here I reveal, for the exploratory trait, that being more active in 526
a novel area and quicker to find resources are the strongest predictors of success in range expansion. 527
Higher exploration rates can speed up the spatial recognition of new surroundings, while increasing 528
the possibilities of finding new and suitable resources. In fact, measuring exploratory behavior as 529
exploration rate, or as time to find a resource, might be interchangeable, as a greater exploration 530
rate expands the search area, which eventually increases the probability of finding a suitable 531
resource. In my synthesis, this notion was supported by the only study who assessed both types of 532
measurements, where individuals of the invasive delicate skink (Lampropholis delicata) were more 533
active in novel environments and also faster at locating a basking site than individuals from the 534
native garden skink (L. guichenoti) (Chapple et al. 2011). 535
27
The decision to leave the current environment and enter in an uncertain one sets the first stage of 536
range expansion. Here I show that individuals with a shorter latency to enter a novel area have a 537
higher potential for range expansion. By being the first to depart from unfavorable environments, an 538
individual might anticipate greater dangers, thus reducing the costs of staying in a harmful place 539
(Bowler and Benton 2005). Yet, benefits of departure have to counterbalance with potential costs 540
enough, so that transient individuals could potentially survive, and ultimately establish and prosper 541
in a new location. Thus, the success in range expansion might depend on an interplay between 542
being bold enough to leave the current location and being more exploratory in new environments. 543
Actually, four out of the five studies in my synthesis that assessed both behavioral traits, found that 544
individuals with higher potential for range expansion were bolder and more exploratory (Marentette 545
et al. 2011, Mettke-Hofmann et al. 2013, Brodin et al. 2013, Debeffe et al. 2013). The only study 546
with opposing results was a study on migration, where residents lived in close proximity to human 547
settlements (Found and St. Clair 2016). I argue that human activity disrupted the conditions 548
normally found in natural environments. 549
In natural environments, higher boldness translates into an increased chance of being predated 550
(Sih et al. 2003). Human activity can reverse the consequences of a bolder behavior, as bolder 551
individuals are known to better withstand human proximity (Carrete and Tella 2011, Vincze et al. 552
2016). This consequently allows them to live close to human areas, which are characterized by 553
diminished predation risk (Beale and Monaghan 2004, Møller 2012) and year-round provision of 554
resources (Newsome et al. 2015). I emphasize that human activity has been related to declines in 555
migratory behavior (Chapman et al. 2011a, Hebblewhite and Merrill 2011), and despite numerous 556
findings showing that a bolder behavior predicts urban adaptation (Møller 2008, Sol et al. 2013, 557
Samia et al. 2015), it is surprising that only one study assessed the linkage between migration, 558
behavioral traits and human activity (Found and St. Clair 2016). In fact, migration was the least 559
studied biogeographical process in my synthesis by a large margin, even though it plays a crucial 560
28
role on ecosystem dynamics across vast geographical areas (Dingle and Drake 2007). When we 561
look at partial migration, where only a portion of a population migrates while others remain resident 562
(Chapman et al. 2011a), we could think that behavioral differences have the potential to provide 563
meaningful insights to migratory tendency. Some studies already marked the importance of 564
behavioral types in migration propensity (Mettke-Hofmann et al. 2009, Nilsson et al. 2010, 565
Chapman et al. 2011b), but the lack of studies in my synthesis hindered the possibility to reach 566
valuable generalizations and should highlight the need to conduct further research. 567
Dispersal is undoubtedly a harsh decision to dispersers and despite factors exist that could 568
disclose benefits for dispersal (e.g inbreeding avoidance), animals are now confronted with the 569
spread of human intervention (Ceballos et al. 2015). In the face of these contemporary challenges, 570
many individuals are left with the choice to disperse or perish. However, not all individuals have the 571
same motivation to depart nor the same capacity to survive (Bowler and Benton 2005), and I show 572
that dispersers are generally bolder and more exploratory than non-dispersers. As aforementioned, 573
bolder and more exploratory behaviors could indeed increase the success of individuals along range 574
expansion. Nonetheless, a bolder and more exploratory behavior during transience could make 575
individuals more prone to predation (Cote et al. 2010a), as they can be respectively less vigilant and 576
more active. Hence, the secret for survival perhaps lies on the ability to flexibly adjust the behavior 577
in response to current conditions, or in that selective filters might act to reduce the mean levels of 578
exploratory and boldness behaviors to an acceptable intensity (Weis and Sol 2016). 579
Differently from dispersal, invasion depends on human activity, and is widely accepted as one of 580
the major contemporary threats to biodiversity (Vitousek et al. 1996, Simberloff et al. 2013). Thus, 581
knowing what predicts invasion success is of tremendous importance to assist management 582
decisions. Behavioral differences have been recently put forth as important predictors of invaders 583
success and invaders’ impact on ecosystems (Weis and Sol 2016). I found that invasive individuals 584
29
are generally more exploratory and more active than their native counterparts. To become an 585
invader, an individual must be transported by a human vector to a new location (Blackburn et al. 586
2011). Once in the new location, individuals need to exit the transport vector and search the new 587
environment for food and shelter (Chapple et al. 2012). A more exploratory behavior can be crucial 588
at this stage, allowing a quicker retrieval of the information needed for survival (if any exists). 589
However, when an individual arrives at a new place, there is a high probability that some other 590
species has arrived before and is already exploiting the same resource. In this case, being more 591
active once established can allow the individuals to increment resource exploitation, consequently 592
reinforcing population growth. Other possibilities for high activity are that invaders can be released 593
from predators and/or competition in their invaded environment (Colautti et al. 2004), being thus 594
allowed to move more freely and consequently the higher levels of activity might be the result of 595
the conditions in the invaded area and not an individuals’ intrinsic advantage to withstand invasion. 596
There are many published studies linking aggressiveness with range expansion (Holway and 597
Suarez 1999, Hudina et al. 2014). However, I was unable to discern a clear pattern of its effect on 598
range expansion success. Aggression might act on range expansion in complex ways that were not 599
possible to be accounted for with my modest sample size. For example, eusocial species, such as 600
ants, might benefit from low intraspecific aggression to form cooperative supercolonies, and 601
simultaneously from high interspecific aggression to outcompete other species for resources 602
(Holway et al. 1998, Dejean et al. 2010). I gathered as moderators both the social organization of a 603
species and the level of behavioral trait comparison, but the low sample size deterred me from 604
testing interactions between moderators. 605
Despite the existence of some theoretical and empirical studies showing a relation between 606
sociability and range expansion (Cote and Clobert 2007, Fogarty et al. 2011), I could not reach any 607
conclusion on sociability, as it was the least studied behavioral trait, with less than half the number 608
30
of studies on activity (the second last). More than ten years ago a well set-up experimental study 609
with lizards clearly showed that high population density motivates the dispersal of asocial 610
individuals, whereas low population density leads to the dispersal of social individuals (Cote and 611
Clobert 2007). Asocial individuals probably dispersed when in high densities because they prefer to 612
minimize social interactions, while the opposite explained the dispersal of social individuals (Cote 613
and Clobert 2007). This iconic study showed that dispersal could be triggered by behavioral types 614
experiencing unfavorable ecological conditions. Thus, it is surprising that a decade after this study I 615
could only retrieved a handful of studies linking sociability and range expansion. 616
Although I tested each behavioral trait at a time, a single behavioral type will never be the sole 617
explanation for range expansion in a given context. Most of the times, individuals rely on a set of 618
traits that promote their ability to expand species range (Dingle 2006, Duckworth 2008, Sih et al. 619
2012, Chuang and Peterson 2016). I collected the correlation coefficients reported in primary 620
studies, assessing relations among behavioral traits and between a behavioral trait and body mass. 621
This strategy would have allowed me to see if some relation between traits was important in 622
predicting the success in range expansion, but my purposes did not come to fruition as very few 623
studies assessed these relations. Range expansion dynamics could encompass several trait 624
correlations, so I underline that in the future we should have more primary studies reporting 625
correlations of behavioral traits against other behavioral and non-behavioral traits. 626
Anthropogenic stressors are changing species distributions, leading to dramatic range shifts 627
among many taxa (Wong and Candolin 2015). Thus, we should integrate the knowledge acquired 628
from multiple fields to obtain a more complete image of what makes species succeed in new 629
environments. Coming from a relatively new research area in ecology, the results from this study 630
have the power to pave the way for an acknowledgement of the role of behavioral traits on species 631
distributions. Nonetheless, my extensive literature review still stresses the need to conduct more 632
31
primary studies, as many results were probably undermined or cryptic due to the low sample size. 633
Nonetheless, the prospects are good, as the recent excitement of the scientific community led to a 634
tremendous increase in the number of studies assessing the behavioral effects on ecological and 635
evolutionary processes (Pennisi 2016). I would not be surprised if in a couple of years stronger 636
evidences could be gathered to validate the notion that behavior may in fact matter to species 637
distributions. 638
REFERENCES 639
Beale, C. M., and P. Monaghan. 2004. Human disturbance: People as predation-free predators? 640
Journal of Applied Ecology 41:335–343. 641
Blackburn, T. M., P. Pyšek, S. Bacher, J. T. Carlton, R. P. Duncan, V. Jarošík, J. R. U. Wilson, and D. 642
M. Richardson. 2011. A proposed unified framework for biological invasions. Trends in Ecology 643
and Evolution 26:333–339. 644
Bonte, D., H. Van Dyck, J. M. Bullock, A. Coulon, M. Delgado, M. Gibbs, V. Lehouck, E. Matthysen, 645
K. Mustin, M. Saastamoinen, N. Schtickzelle, V. M. Stevens, S. Vandewoestijne, M. Baguette, K. 646
Barton, T. G. Benton, A. Chaput-Bardy, J. Clobert, C. Dytham, T. Hovestadt, C. M. Meier, S. C. 647
F. Palmer, C. Turlure, and J. M. J. Travis. 2012. Costs of dispersal. Biological Reviews 87:290–648
312. 649
Borenstein, M., L. V. Hedges, J. P. T. Higgins, and H. R. Rothstein. 2009. Introduction to Meta-650
Analysis. John Wiley & Sons, Ltd. Chichester. 651
Bowler, D. E., and T. G. Benton. 2005. Causes and consequences of animal dispersal strategies: 652
Relating individual behavior to spatial dynamics. Biological Reviews of the Cambridge 653
Philosophical Society 80:205–225. 654
Brodin, T., M. I. Lind, M. K. Wiberg, and F. Johansson. 2013. Personality trait differences between 655
mainland and island populations in the common frog (Rana temporaria). Behavioral Ecology and 656
Sociobiology 67:135–143. 657
Canestrelli, D., R. Bisconti, and C. Carere. 2016. Bolder Takes All? The Behavioral Dimension of 658
Biogeography. Trends in Ecology and Evolution 31:35–43. 659
Carrete, M., and J. L. Tella. 2011. Inter-individual variability in fear of humans and relative brain size 660
of the species are related to contemporary urban invasion in birds. PLoS ONE 6. 661
Cassini, M. H. 2013. Distribution Ecology: From Individual Habitat Use to Species Biogeographical 662
Range. Springer Science, New York. 663
Ceballos, G., P. R. Ehrlich, A. D. Barnosky, A. Garcia, R. M. Pringle, and T. M. Palmer. 2015. 664
Accelerated modern human-induced species losses: Entering the sixth mass extinction. Science 665
Advances 1:e1400253–e1400253. 666
Chapman, B. B., C. Brönmark, J. Å. Nilsson, and L. A. Hansson. 2011a. The ecology and evolution 667
of partial migration. Oikos 120:1764–1775. 668
Chapman, B. B., K. Hulthén, D. R. Blomqvist, L. A. Hansson, J. Å. Nilsson, J. Brodersen, P. Anders 669
Nilsson, C. Skov, and C. Brönmark. 2011b. To boldly go: Individual differences in boldness 670
influence migratory tendency. Ecology Letters 14:871–876. 671
Chapple, D. G., S. M. Simmonds, and B. B. M. Wong. 2011. Know when to run, know when to hide: 672
can behavioral differences explain the divergent invasion success of two sympatric lizards? 673
Ecology and Evolution 1:278–289. 674
32
Chapple, D. G., S. M. Simmonds, and B. B. M. Wong. 2012. Can behavioral and personality traits 675
influence the success of unintentional species introductions? Trends in Ecology and Evolution 676
27:57–62. 677
Chuang, A., and C. R. Peterson. 2016. Expanding population edges: Theories, traits, and trade-offs. 678
Global Change Biology 22:494–512. 679
Clobert, J., Baguette, M., Benton, T., and J. M. Bullock. 2009. Dispersal Ecology and evolution. 680
Oxford University Press. Oxford. 681
Colautti, R. I., A. Ricciardi, I. A. Grigorovich, and H. J. MacIsaac. 2004. Is invasion success explained 682
by the enemy release hypothesis? Ecology Letters 7:721–733. 683
Cote, J., G. Bocedi, L. Debeffe, M. E. Chudzińska, H. C. Weigang, C. Dytham, G. Gonzalez, E. 684
Matthysen, J. Travis, M. Baguette, and A. J. M. Hewison. 2016. Behavioral synchronization of 685
large-scale animal movements - disperse alone, but migrate together? Biological Reviews 33. 686
Cote, J., and J. Clobert. 2007. Social personalities influence natal dispersal in a lizard. Proceedings 687
of the Royal Society B: Biological Sciences 274:383–390. 688
Cote, J., J. Clobert, T. Brodin, S. Fogarty, and A. Sih. 2010. Personality-dependent dispersal: 689
characterization, ontogeny and consequences for spatially structured populations. Philosophical 690
Transactions of the Royal Society B: Biological Sciences 365:4065–4076. 691
Cote, J., S. Fogarty, B. Tymen, A. Sih, and T. Brodin. 2013. Personality-dependent dispersal cancelled 692
under predation risk. Proceedings of the Royal Society B: Biological Sciences 280:20132349. 693
Debeffe, L., N. Morellet, B. Cargnelutti, B. Lourtet, A. Coulon, J. M. Gaillard, R. Bon, and A. J. M. 694
Hewison. 2013. Exploration as a key component of natal dispersal: dispersers explore more than 695
philopatric individuals in roe deer. Animal Behavior 86:143–151. 696
Del Re, A. C. (2013). compute.es: Compute Effect Sizes. R package version 0.2-2. 697
http://CRAN.R-project.org/package=compute.es 698
Dejean, A., B. L. Fisher, B. Corbara, R. Rarevohitra, R. Randrianaivo, B. Rajemison, and M. Leponce. 699
2010. Spatial Distribution of Dominant Arboreal Ants in a Malagasy Coastal Rainforest: Gaps and 700
Presence of an Invasive Species. PLoS ONE 5:e9319. 701
Dingle, H. 2006. Animal migration: Is there a common migratory syndrome? Journal of Ornithology 702
147:212–220. 703
Dingle, H., and V. A. Drake. 2007. What Is Migration? BioScience 57:113–121. 704
Dochtermann, N. A., T. Schwab, and A. Sih. 2014. The contribution of additive genetic variation to 705
personality variation: heritability of personality. Proceedings of the Royal Society B: Biological 706
Sciences 282:20142201–20142201. 707
Duckworth, R. A. 2008. Adaptive Dispersal Strategies and the Dynamics of a Range Expansion. The 708
American Naturalist 172:S4–S17. 709
Fogarty, S., J. Cote, and A. Sih. 2011. Social Personality Polymorphism and the Spread of Invasive 710
Species: A Model. The American Naturalist 177:273–287. 711
Found, R. B., and C. C. St. Clair. 2016. Behavioral syndromes predict loss of migration in wild elk. 712
Animal Behavior 115:35–46. 713
de Fraipoint, M., J. Colbert, H. John-Alder, and S. Meylan. 2000. Increased pre-natal maternal 714
corticosterone promotes in common of offspring philopatry lizards Lacerta vivipara. Journal of 715
Animal Ecology 69:404–413. 716
Garamszegi, L. Z., G. Markó, and G. Herczeg. 2013. A meta-analysis of correlated behaviors with 717
implications for behavioral syndromes: Relationships between particular behavioral traits. 718
Behavioral Ecology 24:1068–1080. 719
Groothuis, T. G. ., C. Carere, J. Lipar, P. J. Drent, and H. Schwabl. 2008. Selection on personality in 720
a songbird affects maternal hormone levels tuned to its effect on timing of reproduction. Biology 721
Letters 4:465–467. 722
Hebblewhite, M., and E. H. Merrill. 2011. Demographic balancing of migrant and resident elk in a 723
partially migratory population through forage-predation tradeoffs. Oikos 120:1860–1870. 724
33
Holway, D. A., A. V Suarez, and T. J. Case. 1998. Loss of Intraspecific Aggression in the Success of 725
a Widespread Invasive Social Insect 282:1996–1999. 726
Holway, D., and A. Suarez. 1999. Animal behavior: an essential component of invasion biology. 727
Trends in ecology & evolution 14:328–330. 728
Hudina, S., K. Hock, and K. Žganec. 2014. The role of aggression in range expansion and biological 729
invasions. Current Zoology 60:401–409. 730
Jonker, R. M., R. H. J. M. Kurvers, A. van de Bilt, M. Faber, S. E. van Wieren, H. H. T. Prins, and R. 731
C. Ydenberg. 2012. Rapid adaptive adjustment of parental care coincident with altered migratory 732
behavior. Evolutionary Ecology 26:657–667. 733
Koricheva, J., J. Gurevitch, and K. Mengersen. 2013. Handbook of Meta-analysis in Ecology and 734
Evolution. Princeton University Press, Princeton, USA. 735
Marentette, J. R., G. Wang, S. Tong, N. M. Sopinka, M. D. Taves, M. A. Koops, and S. Balshine. 736
2011. Laboratory and field evidence of sex-biased movement in the invasive round goby. 737
Behavioral Ecology and Sociobiology 65:2239–2249. 738
Martin, L. B., and L. Fitzgerald. 2005. A taste for novelty in invading house sparrows, Passer 739
domesticus. Behavioral Ecology 16:702–707. 740
McCauley, S. J., T. Brodin, and J. Hammond. 2010. Foraging Rates of Larval Dragonfly Colonists 741
Are Positively Related to Habitat Isolation: Results from a Landscape‐Level Experiment. The 742
American Naturalist 175:E66–E73. 743
Mettke-Hofmann, C., S. Lorentzen, E. Schlicht, J. Schneider, and F. Werner. 2009. Spatial neophilia 744
and spatial neophobia in resident and migratory warblers (Sylvia). Ethology 115:482–492. 745
Mettke-Hofmann, C., H. Winkler, P. B. Hamel, and R. Greenberg. 2013. Migratory New World 746
Blackbirds (Icterids) Are More Neophobic than Closely Related Resident Icterids. PLoS ONE 8. 747
Møller, A. P. 2008. Flight distance of urban birds, predation, and selection for urban life. Behavioral 748
Ecology and Sociobiology 63:63–75. 749
Møller, A. P. 2012. Urban areas as refuges from predators and flight distance of prey. Behavioral 750
Ecology 23:1030–1035. 751
Newsome, T. M., J. A. Dellinger, C. R. Pavey, W. J. Ripple, C. R. Shores, A. J. Wirsing, and C. R. 752
Dickman. 2015. The ecological effects of providing resource subsidies to predators. Global 753
Ecology and Biogeography 24:1–11. 754
Nilsson, A. L. K., J.-åke Nilsson, T. Alerstam, and J. Bäckman. 2010. Migratory and resident blue tits 755
Cyanistes caeruleus differ in their reaction to a novel object. Naturwissenschaften 97:981–985. 756
Oers, V., de Jong, and van Noordwijk…. 2004. Contribution of genetics to the study of animal 757
personalities: a review of case studies. Behavior:1185–1206. 758
Pennisi, E. 2016. The power of personality. Science 352:644–647. 759
Pruitt, J. N., and A. P. Modlmeier. 2015. Animal personality in a foundation species drives community 760
divergence and collapse in the wild. Journal of Animal Ecology 84:1461–1468. 761
Réale, D., S. M. Reader, D. Sol, P. T. McDougall, and N. J. Dingemanse. 2007. Integrating animal 762
temperament within ecology and evolution. Biological Reviews 82:291–318. 763
Riechert, S. E., and R. F. Hall. 2000. Local population success in heterogeneous habitats: Reciprocal 764
transplant experiments completed on a desert spider. Journal of Evolutionary Biology 13:541–550. 765
Sagata, K., and P. J. Lester. 2009. Behavioral plasticity associated with propagule size, resources, and 766
the invasion success of the Argentine ant Linepithema humile. Journal of Applied Ecology 46:19–767
27. 768
Samia, D. S. M., S. Nakagawa, F. Nomura, T. F. Rangel, and D. T. Blumstein. 2015. Increased 769
tolerance to humans among disturbed wildlife. Nature Communications 6:8877. 770
Sih, A., J. Cote, M. Evans, S. Fogarty, and J. Pruitt. 2012. Ecological implications of behavioral 771
syndromes. Ecology Letters 15:278–289. 772
Sih, A., L. B. Kats, and E. F. Maurer. 2003. Behavioral correlations across situations and the evolution 773
of antipredator behavior in a sunfish-salamander system. Animal Behavior 65:29–44. 774
34
Simberloff, D., J. L. Martin, P. Genovesi, V. Maris, D. A. Wardle, J. Aronson, F. Courchamp, B. Galil, 775
E. García-Berthou, M. Pascal, P. Pyšek, R. Sousa, E. Tabacchi, and M. Vilà. 2013. Impacts of 776
biological invasions: What’s what and the way forward. Trends in Ecology and Evolution 28:58–777
66. 778
Sol, D., S. Bacher, S. M. Reader, and L. Lefebvre. 2008. Brain Size Predicts the Success of Mammal 779
Species Introduced into Novel Environments. The American Naturalist 172:S63–S71. 780
Sol, D., O. Lapiedra, and C. González-Lagos. 2013. Behavioral adjustments for a life in the city. 781
Animal Behavior 85:1101–1112. 782
Sol, D., L. Lefebvre, and J. D. Rodriguez-Teijeiro. 2005. Brain size, innovative propensity and 783
migratory behavior in temperate Palaearctic birds. Proceedings of the Royal Society B: Biological 784
Sciences 272:1433–1441. 785
Sterne, J. A. C., and M. Egger. 2005. Regression Methods to Detect Publication and Other Bias in 786
Meta-Analysis. in H. R. Rothstein, A. J. Sutton, and M. Borenstein, editors. Publication Bias in 787
Meta-Analysis: Prevention, Assessment and Adjustments. John Wiley & Sons Ltd, Chichester. 788
Thorlacius, M., G. Hellström, and T. Brodin. 2015. Behavioral dependent dispersal in the invasive 789
round goby Neogobius melanostomus depends on population age. Current Zoology 61:529–542. 790
Verhulst, E. C., A. C. Mateman, M. V. Zwier, S. P. Caro, K. J. F. Verhoeven, and K. Van Oers. 2016. 791
Evidence from pyrosequencing indicates that natural variation in animal personality is associated 792
with DRD4 DNA methylation. Molecular Ecology 25:1801–1811. 793
Vigilant, L., J. Roy, B. J. Bradley, C. J. Stoneking, M. M. Robbins, and T. S. Stoinski. 2015. 794
Reproductive competition and inbreeding avoidance in a primate species with habitual female 795
dispersal. Behavioral Ecology and Sociobiology 69:1163–1172. 796
Vincze, E., S. Papp, B. Preiszner, G. Seress, V. Bókony, and A. Liker. 2016. Habituation to human 797
disturbance is faster in urban than rural house sparrows. Behavioral Ecology 27:1304–1313. 798
Vincze, O. 2016. Light enough to travel or wise enough to stay? Brain size evolution and migratory 799
behavior in birds. Evolution; international journal of organic evolution 70:2123–2133. 800
Vitousek, P. M., C. M. D’Antonio, L. L. Loope, and R. Westbrooks. 1996. Biological invasions as 801
global environmental change. Assessment 84. 802
Wallace, B. C., K. Small, C. E. Brodley, J. Lau, and T. A. Trikalinos. 2012. Deploying an Interactive 803
Machine Learning System in an Evidence-Based Practice Center : abstrackr. Proc. of the ACM 804
International Health Informatics Symposium (IHI):819–824. 805
Wan, X., W. Wang, J. Liu, and T. Tong. 2014. Estimating the sample mean and standard deviation 806
from the sample size, median, range and/or interquartile range. BMC Medical Research 807
Methodology 14:1–13. 808
Weis, J. S., and D. Sol. 2016. Biological invasions and animal behavior. Cambridge University Press. 809
Cambridge 810
Wolf, M., and F. J. Weissing. 2012. Animal personalities: Consequences for ecology and evolution. 811
Trends in Ecology and Evolution 27:452–461. 812
Wong, B. B. M., and U. Candolin. 2015. Behavioral responses to changing environments. Behavioral 813
Ecology 26:665–673. 814
35
Capítulo 2 815
816
Do residents behave differently than migrants? Describing how behavioral 817
variation can contribute to partial migration 818
819
ABSTRACT 820
Migration is critical for ecosystem dynamics across space and time, yet it is perhaps the least 821
understood form of animal movement. An interesting question is why, within a same species, some 822
individuals migrate while others remain resident in a phenomenon called partial migration. 823
Behavioral differences might be one of the answers for this question, where the expression of 824
different behavioral types makes individuals more or less fit for either the migratory or resident 825
strategy. By building arguments upon results from a systematic review, I investigate how and why 826
residents and migrants differ in their behavior. Additionally, I attempt to identify the main 827
knowledge gaps, and suggest research topics. I argue that the rise in human activity is shifting the 828
behavioral differences between residents and migrants usually observed in natural settings. Being 829
true, it is a concerning matter and one that definitely merits further research. Migratory behavior is 830
declining due to the threats posed by global changes, so scientists should act promptly to understand 831
what conditions must be kept for the survival of migrant species and all species that depend on 832
them. 833
RESUMO 834
36
A migração é crucial para as dinâmicas dos ecossistemas ao longo do espaço e do tempo. 835
Contudo a migração é possivelmente a forma de movimento animal menos compreendida. Uma 836
questão interessante é porque, numa mesma espécie, alguns indivíduos migram enquanto outros 837
permanecem residents, num fenónemo conhecido como migração parcial. As diferenças 838
comportamentais podem ser uma das respostas para esta questão, onde a expressão de diferentes 839
tipos de comportamento torna os indivíduos mais ou menos aptos para a estratégia de migração ou a 840
estratégia de residência. Me baseando em resultados duma revisão sistemática para a construção de 841
argumentos, eu revelo algumas descobertas interessantes sobre o como e o porquê de residentes e 842
migrantes possuirem differentes tipos de comportamento. Para além disso, eu procuro identificar as 843
principais lacunas de conhecimento na tentativa de incentivar mais pesquisa neste campo. Por fim, 844
eu argumento que a crescente atividade humana está alterando as diferenças comportamentais, 845
geralmente encontradas em meios naturais, entre residentes e migrantes. Se isso for verdade, é um 846
assunto preocupante que urge mais investigação. O comportamento migratório está em declínio 847
devido às ameaças das mudanças globais, por isso os cientistas devem agir prontamente para 848
entender que condições têm de ser mantidas para salvar os migrantes e todas as espécies que 849
dependem deles para sobreviver. 850
INTRODUCTION 851
Animal migration is arguably the most impressive, but least understood, form of animal 852
movement. Each year billions of animals from all branches of the animal kingdom, embark on 853
seasonal journeys in search for food, mates, to avoid predators or to escape from severe 854
environmental conditions (Chapman et al. 2012). For some animals, these journeys cover vast 855
geographical areas shaping species distributions across space and time. By periodically moving 856
between environments migrants become important pieces in ecosystem structure and dynamics, and 857
their travels are critical for nutrient transport and trophic interactions (Brodersen et al. 2008, 858
37
Chapman et al. 2012). Yet, migratory species are facing increasing challenges with global changes 859
in climate, phenology, invasive species, exploitation and land-use changes (Kirby et al. 2008). 860
These challenges are modifying or even interrupting the migratory behavior of many animals 861
(Chapman et al. 2011a, Møller et al. 2013), which can lead to detrimental effects on ecosystem 862
dynamics (Brodersen et al. 2008) and species persistence (Chapman et al. 2011a). For example, 863
some predators rely on seasonal abundance of migratory prey to gain the needed energy to 864
withstand periods of prey scarcity. Without migratory prey, some of these predators would not 865
survive. Despite the importance of migration for ecological and evolutionary processes at all levels, 866
migration is perhaps the least understood process of animal movement. 867
An intriguing migratory phenomenon is partial migration, where in a given species or population, 868
some individuals decide to migrate while others remain resident. Partial migration is widespread in 869
nature, and it is believed that almost all migratory species are composed of a mixture of resident 870
and migratory individuals (Chapman et al. 2011a). Understanding what causes individuals to differ 871
in migratory tendency is critical to getting the bigger picture of what drives migration. Partial 872
migration studies can provide clearer results about the proximate and ultimate causes of migration, 873
because they usually compare species or individuals that closely resemble each other, except for the 874
difference expressed in migratory tendency. For instance, migrants have been shown to have a 875
smaller body size than residents (Skov et al. 2011). Smaller-sized individuals could migrate to avoid 876
predation or because they might be competitively inferior and thus unable to acquire the needed 877
resources during scarcity periods (Chapman et al. 2012). Also, studies found that migrants have a 878
smaller relative brain size and are less innovative than residents (Sol et al. 2005, Vincze 2016). One 879
hypothesis is that migrants are able to use public information by observing residents' behaviors and 880
do not need to develop their own strategies through trial-and-error (Mettke-Hofmann et al. 2013). 881
Also, residents withstand stronger environmental fluctuations in their environment and a better 882
cognitive capacity might be needed to adjust their behavior and adapt promptly (Sol et al. 2005). 883
38
The aforementioned phenotypic differences between residents and migrants are probably governed 884
by a set of trade-offs, where migration is the more energetically demanding strategy possibly 885
hindering body and brain size enlargement. 886
There is a growing interest in investigating behavioral differences between residents and migrants 887
(Chapman et al. 2011b). Different behaviors are known to be favored in different environments 888
(Riechert and Hall 2000, Wolf and Weissing 2012) and the expression of a given behavioral type 889
could lead to an increased suitability for either the resident or the migratory strategy. Here, we 890
define behavioral type as the behavior expressed by an individual in each of the five behavioral 891
traits axes: activity, aggressiveness, boldness, exploratory and sociability (Réale et al 2007). For 892
example, an individual with a more active behavioral type is scored higher in the activity axis. 893
Partial migration studies might gain explanatory power through the inclusion of individual 894
variation in behavioral traits, yet, to date, very few studies assessed behavioral differences between 895
residents and migrants (Chapman et al. 2011a). The lack of studies could be attributed to the recent 896
nature of behavioural trait research within ecology, along with logistical difficulties to collect both 897
behavioral and migratory data (Nilsson et al. 2014). The present work resulted from a systematic 898
review on the role of behavioral traits in species distributions (see Chapter One), which realized a 899
deficit in the amount of studies assessing migration in comparison to dispersal or invasion. I intend 900
to summarize the main findings of the studies gathered in my systematic review and encourage 901
further research on the exciting link between behavioral differences and migration. 902
SYSTEMATIC REVIEW OF STUDIES AND OBSERVED PATTERNS 903
Literature search and database 904
I searched the Web of Science and Google Scholar databases for studies published before 17 June 905
2016 using a mixture of terms used for behavioral traits and biogeographical processes (Appendix A 906
39
for detailed information). The search returned 15,890 studies, turned into 15,513 after duplicate 907
removal. These studies were reviewed by title and abstract using abstrackr online software (Wallace 908
et al. 2012) and excluded if they failed to meet my criteria (Appendix B for PRISMA diagram). 909
Studies that met criteria went through full text revision and given further examination if they 910
explicitly measured behavioral traits (activity, aggressiveness, boldness, exploratory and 911
sociability), and provided behavioral comparisons between residents and migrants. I defined 912
behavioral traits primarily according to Réale et al. (2007) framework. I considered five behavioral 913
traits: (i) activity, which is the general level of activity in a familiar environment; (ii) 914
aggressivenesss, defined by the display of agonistic interactions towards conspecifics or 915
heterospecifics; (iii) boldness, as the reaction towards a risky situation (e.g. predators or humans); 916
(iv) exploratory, which is the reaction towards a new situation (e.g. novel object) or the level of 917
activity in a novel environment; and lastly (v) sociability defined as the tendency to aggregate or to 918
actively search non-aggressive interactions with conspecifics. 919
I calculated the Hedge’s g effect size to gather a standardised and comparable measure of the 920
effect of behavioral types in migratory propensity. The effect size was computed from studies that 921
reported the mean behavioral trait value and respective standard deviation for both the residents and 922
the migrants. If studies did not report this data I tried the following in order: (1) collect binary 923
proportions in studies that split behavioral trait variation in two groups (e.g. bold group and shy 924
group) and assessed what proportion of each group were likely to be either migrant or resident; (2) 925
collect results of statistics based on distributions such as t-value, F or χ2; (3) collect median and 926
interquartile ranges (25% and 75%) of the behavioral measures in both migrants and residents. To 927
transform the different metrics to Hedge’s g I used R software with the compute.es package (Del 928
Re, 2013), unless the data collected were the medians and interquartile ranges, where I followed the 929
procedure in Wan et al (2014) to get approximations for the mean and standard deviation. If studies 930
40
provided relevant information, but did not report all the needed data to calculate the effect size, I 931
contacted the authors requesting the missing data. 932
In my study, a positive effect size reflects an association between a higher behavioral trait value 933
(e.g. more aggressive) and a higher migratory propensity, while a negative effect size will reflect an 934
association between a lower behavioral trait value (e.g. less aggressive) and higher migratory 935
propensity. Due to low study sample size, I did not compute a summary effect and therefore I only 936
assessed effects individually. 937
To explore some research and data patterns I collected variables describing: how a behavioral 938
trait was measured; if the study was experimental or observational; if there was a correlation 939
between different behavioral traits assessed in the primary study; if there was a correlation between 940
the behavioral trait and body mass; species taxonomic class; behavioral comparison level (i.e. if 941
study compared the behavior of individuals within a species, of between different species). These 942
variables can allow a descriptive analysis about observable patterns in the data and the investigation 943
of research biases. 944
Brief quantitative description of studies 945
A total of 9 studies were collected for all behavioral traits, providing information for 12 migratory 946
species belonging to three taxonomic classes (Mammalia, Aves and Actinopterygii). Four studies 947
were conducted in the present decade, three in the 2000s and two in the 1990s. Some studies 948
contributed with more than one effect size to my data set as they performed analysis on multiple 949
traits and/or multiple species. For example, a study investigating behavior and migratory tendency 950
in two species will have two effect sizes in my data set, representing the results obtained for each 951
species. Therefore, I collected a total of 22 effect sizes (more details in Figure 1). Aggressiveness 952
had the highest number of effect sizes (10) coming from 5 studies and sociability was the least 953
studied behavioral trait with only one effect size (Figure 1). 954
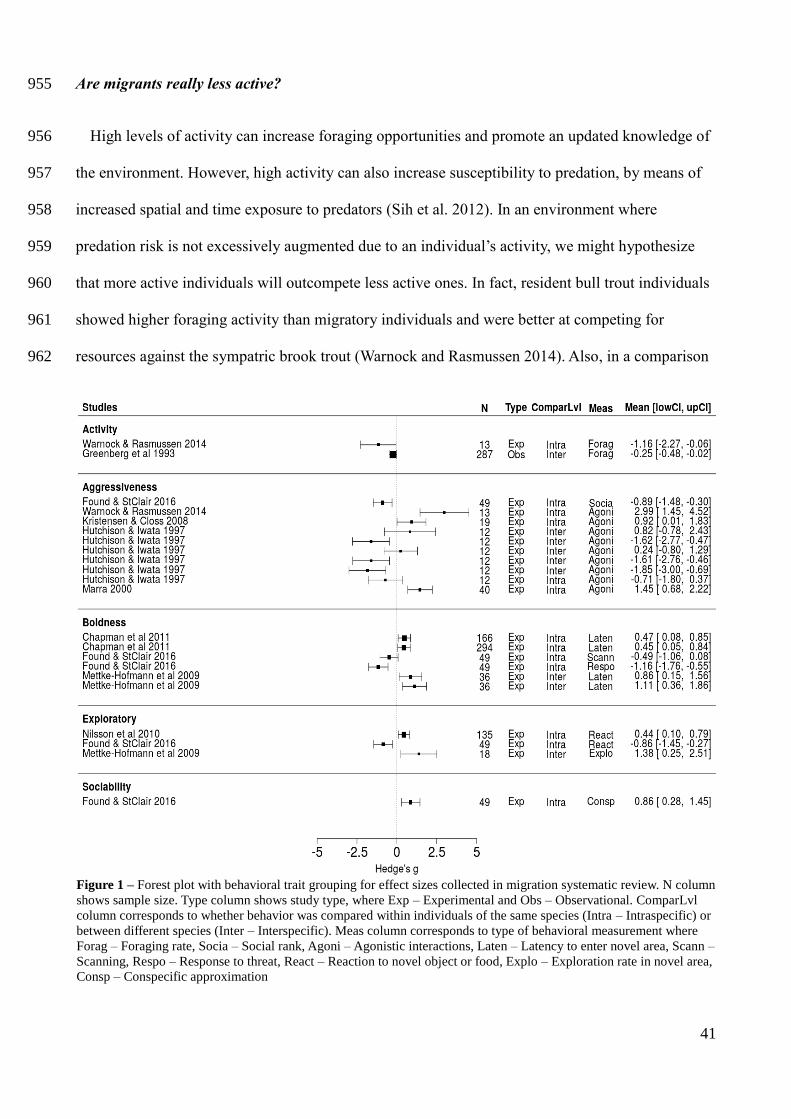
41
Are migrants really less active? 955
High levels of activity can increase foraging opportunities and promote an updated knowledge of 956
the environment. However, high activity can also increase susceptibility to predation, by means of 957
increased spatial and time exposure to predators (Sih et al. 2012). In an environment where 958
predation risk is not excessively augmented due to an individual’s activity, we might hypothesize 959
that more active individuals will outcompete less active ones. In fact, resident bull trout individuals 960
showed higher foraging activity than migratory individuals and were better at competing for 961
resources against the sympatric brook trout (Warnock and Rasmussen 2014). Also, in a comparison 962
Figure 1 – Forest plot with behavioral trait grouping for effect sizes collected in migration systematic review. N column
shows sample size. Type column shows study type, where Exp – Experimental and Obs – Observational. ComparLvl
column corresponds to whether behavior was compared within individuals of the same species (Intra – Intraspecific) or
between different species (Inter – Interspecific). Meas column corresponds to type of behavioral measurement where
Forag – Foraging rate, Socia – Social rank, Agoni – Agonistic interactions, Laten – Latency to enter novel area, Scann –
Scanning, Respo – Response to threat, React – Reaction to novel object or food, Explo – Exploration rate in novel area,
Consp – Conspecific approximation
42
of two closely related birds, resident Vireos had a higher foraging rate than migratory Vireos 963
(Greenberg et al. 1993). These results show that less active individuals might not be able to acquire 964
the needed resources to survive being forced to migrate in search for places with higher resource 965
availability. Additionally, when arriving at new places, migrants can face territorial residents with 966
established territories, and low activity levels can be useful to decrease the number of agonistic 967
interactions with residents. In contradiction, migratory individuals of the yellow American eel have 968
been shown to have higher activity levels than residents (Castonguay et al. 1990), however 969
migratory individuals were caught while migrating, which could explain their high activity levels. 970
I argue that activity, measured as the level of activity in a familiar environment (Réale et al. 971
2007), is a controversial measurement in migrants who periodically change between different 972
locations. It is possible that when migrants reach the end of a migratory journey, the level of activity 973
in the arrival area reflects exploratory behavior instead of activity behavior. When some time passes 974
since arrival, exploration should be considered stabilized and only then, levels of activity should 975
reflect the ones expected for the activity trait. Knowing which moment marks the end of exploration 976
is undoubtedly challenging, thus I can only recommend that activity studies on migrants should not 977
be performed just after migrant arrival. 978
Do residents aggressively expel migrants? 979
As activity, aggressiveness could also lead to competition superiority. The display of agonistic 980
behavior is critical in the establishment and maintenance of dominance hierarchies (Brien et al. 981
2013) which can translate in higher food acquisition (Adams et al. 1995). In environments with 982
seasonal abundance of resources, higher levels of aggression can guarantee access to the resources 983
needed for survival while mitigating the risks of staying resident (Chapman et al. 2011a). In these 984
environments, less aggressive individuals might be unable to acquire resources in scarcity periods, 985
being left with the decision to migrate or starve. Additionally, more aggressive individuals are 986
43
known for their lack of social interactions (Found and St. Clair 2016), which could explain why 987
they avoid a collective movement such as migration, whenever possible. Following these 988
interpretations, we could expect a negative relation between aggressiveness and migration 989
propensity, but results in the literature are far from conclusive. In comparisons between and within 990
salmonid species, migrant individuals showed lower aggressive levels than residents (Hutchison 991
and Iwata 1997). A study on elk reached similar results with resident individuals displaying more 992
agonistic behavior than migrants (Found and St. Clair 2016). In contrast, two studies on trout 993
showed that migratory individuals were more aggressive than residents (Kristensen and Closs 2008, 994
Warnock and Rasmussen 2014). Resident individuals are generally considered more aggressive, but 995
the establishment of social hierarchies can lead to the decrease of aggression once the positions are 996
established (Bachman 1984). High levels of aggression can also increment costs in terms of energy 997
expenditure (Harwood et al. 2002), hence when resources are scarce, residents might decrease their 998
agonistic behavior, whereas migrants travelling in large densities to resource plentiful areas can 999
increase their agonistic behavior to attain a competitive advantage in the new environments. 1000
Bold enough to leave or bold enough to stay? 1001
Partial migration has been attributed to individual differences in predation risk, where migrants 1002
typically leave to escape predation (Chapman et al. 2011a). For example, a study on common 1003
bream, showed that migrants had higher vulnerability to predation due to their smaller body size 1004
(Skov et al. 2011). In the context of behavioral traits, boldness is tightly related to predation risk, 1005
with bolder individuals being less wary of predation risk and thus more likely to get predated (Sih 1006
et al. 2012). Whenever predation risk is high, bolder individuals could suffer high mortality, unless 1007
they switch to a more cautious behavior or depart from the current area (Sih et al 2012). 1008
Nonetheless, bolder individuals should thrive in environments with low predation risk, as shier 1009
individuals might be overly cautious and miss out good opportunities to perform fitness enhancing 1010
44
activities (Sih et al. 2003). An explanation to partial migration might lie on a trade-off between 1011
predation risk and resource availability, such that when food resources are abundant it might be 1012
worth for bolder individuals to stay, but when resources become scarce, residency can become too 1013
costly and ultimately motivate their decision to migrate (Chapman et al. 2012). 1014
Using latency to enter a novel room as a measure of boldness, studies on fish and birds have 1015
shown that migratory individuals entered the novel room more promptly, being more risk-prone and 1016
probably more susceptible to predation (bird: Mettke-Hofmann et al. 2009, fish: Chapman et al. 1017
2012). On the other hand, increasing human presence around the globe can lead to high levels of 1018
perceived risk by shy individuals, turning the tables in favor of bold residency and shy migration 1019
(e.g. Found and St. Clair 2016), specially if humans do not predate or exert low predation pressure 1020
upon the migratory species. In fact, bird urbanization is sometimes associated with migratory 1021
individuals that progressively lost their migratory propensity, because of the year-round supply of 1022
resources and the milder temperatures in urban areas (Møller et al. 2013). By being able to better 1023
withstand human presence as evidenced by lower flight initiation distance and lower vigilance rates, 1024
bolder elk remain resident in peri-urban areas while shy elk migrated away from human 1025
settlements. Migrant elk only returned seasonally when the severe weather in the mountains forced 1026
them descend to lower elevation and back to the proximity of human settlements (Found and St. 1027
Clair 2016). 1028
Can exploration explain partial migration? 1029
An innate curiosity makes more exploratory individuals adept of finding novel resources either in 1030
new environments or familiar ones (Sih et al. 2012). Two ways to measure exploratory behavior are 1031
the level of activity in a novel environment and the latency to approach a novel object or food in 1032
either a new or familiar environment (Réale et al. 2007). Intuitively, migrants should be selected for 1033
more exploratory behaviors because it gives them the ability to rapidly assess high and low-quality 1034
45
areas and thrive in their newly arrived environments. A comparison of two closely related bird 1035
species revealed that migrants were faster explorers of a novel cage than residents (Mettke-1036
Hofmann et al. 2009). A study on the same species as Mettke-Hofmann et al. (2009) showed that 1037
residents, despite having scored lower in novel cage exploration, had a shorter latency to approach a 1038
novel object, thus being more exploratory regarding curiosity towards a novel object (Mettke-1039
Hofmann et al. 2005). Conversely, a within-species study on blue tits reported that migrants were 1040
the ones to approach the novel object sooner (Nilsson et al. 2010). An explanation for why residents 1041
were more exploratory towards a novel object is that residents have a stable mental map of their 1042
environment and the dangers therein, so every new situation can be worth investigating as it may 1043
represent a new profitable resource or a new threat (Mettke-Hofmann et al. 2009). On the other 1044
hand, migrants are not bound to an environment and are consistently experiencing new situations, 1045
so the safest reaction towards a novel object might be to stay away from it and limit their activities 1046
to well-known and secure situations (Mettke-Hofmann et al. 2009). However, migrants invariably 1047
find themselves in novel environments when forced to use stopover sites to rest, refuel, or avoid 1048
storms (Moore and Aborn 2000, Moore et al. 2005). Thus, an explanation for why migrants were 1049
more exploratory towards a novel object is that migrants need to investigate novel objects to 1050
acquire the needed knowledge to survive in a new environment (Nilsson et al. 2014), while 1051
residents by constantly living in the same environment and successfully exploiting the same known 1052
resources, might be more risk-averse towards a new object, as it can pose a potential danger in an 1053
otherwise comfortable situation. A different view can be achieved when looking for residents who 1054
established territory in an urbanized area. Species with more exploratory behavior are generally 1055
more innovative and more likely to become urbanized (Sol et al. 2002). Innovativeness has been 1056
shown to relate positively with brain size (Sol et al. 2005), and some studies reported that residents 1057
had a larger brain size than migrants (Sol et al. 2005, Vincze 2016). This might have been the case 1058
in elk, where residents living close to human settlements had a lower latency to approach a novel 1059
46
object than migrants (Found and St. Clair 2016). Areas close to human settlements are highly 1060
dynamic (Newsome et al. 2015), so a lower latency to approach a novel object can allow residents 1061
to find novel food opportunities and assess potential new risks. 1062
Are migrant groups composed of social individuals? 1063
Migration is generally a collective movement (Dingle and Drake 2007), and it is no surprise that 1064
social abilities should be a prerequisite to associate with the migrating group. However, sociability 1065
was the least studied behavioral trait in my systematic review with only one study. This might 1066
simply reflect the fact that sociability is the overall least studied behavioral trait with regards to 1067
species distributions (as I discussed in Chapter One). The only study I found showed that migrants 1068
were more social than residents (Found and St. Clair 2016). I emphasize the need to conduct further 1069
research in the link between sociability and partial migration, because contradictory and stimulating 1070
findings might be possible. 1071
Thoughts on behavioral-dependent migration 1072
Studying individual differences between migrants and residents can offer great insights about the 1073
proximate and ultimate causes of migratory tendency. Herein I showed that recent studies assessing 1074
behavioral-dependent migration found differences in behaviors between those who stay resident and 1075
those who undergo migration (Nilsson et al. 2010, Chapman et al. 2011b, Warnock and Rasmussen 1076
2014, Found and St. Clair 2016). Migration or residency can both arise as the most beneficial 1077
strategy depending on trait specific advantages in the environment, or as the ‘best of a bad job’ 1078
(Chapman et al. 2012). The latter, could enforce residency in individuals with poor body condition 1079
and lack of energy reserves, or enforce migration in individuals with poor competitive ability to 1080
acquire resources during periods of shortage in their current environment (Chapman et al. 2012). In 1081
either case, by making the ‘best of a bad job’ individuals still choose the best strategy to maximize 1082
their fitness (Chapman et al. 2012). For the former, we can think of behavioral types as part of a 1083
47
complex set of traits that makes individuals fit to migration in an environmental context, forming 1084
what is known as a migratory syndrome (Dingle 2006). Individuals displaying the migratory 1085
syndrome should turn into migrants, while the rest would benefit to choose residency instead. 1086
Behavioral variation is usually associated with non-behavioral differences (Wolf and Weissing 1087
2012) which could jointly form a migratory syndrome. For instance, more aggressive individuals 1088
normally have a larger body size (Edwards and Lailvaux 2013), and more exploratory individuals 1089
have a larger brain size and are better at learning new tasks (Kotrschal et al. 2014). If behavioral 1090
traits are the cause or the consequence of non-behavioral variation is difficult to answer, however a 1091
possibility is that this relation is mutually reinforced through feedback loops (Dall et al. 2004, Wolf 1092
and Weissing 2012). 1093
For a given population living in an environment characterized by predation risk and seasonal 1094
shortage of resources, the individuals showing higher levels of activity and aggressiveness might 1095
possess a competitive advantage over the dispute of resources in periods of scarcity. Furthermore, if 1096
these same individuals have low levels of boldness to prevent high levels of predator-induced 1097
mortality, they might be able to stay resident and avoid the costs of migration (Chapman et al. 1098
2011b). In this context, migrants would migrate because of their innate competitive disadvantage, 1099
and instead benefit from higher sociability to establish social bonds and cooperate throughout 1100
migration and from higher exploratory behavior, which could allow a faster search and discovery of 1101
resources in new environments (Mettke-Hofmann et al. 2009, Nilsson et al. 2010, but see Mettke-1102
Hofmann et al. 2005). 1103
Human activity has been a driving force of major ecological changes, leading to an 1104
unprecedented pace of non-natural environmental disturbance that is disrupting ecological 1105
opportunities (Hendry et al. 2008, Candolin and Wong 2012). New ecological opportunities are 1106
found in human proximity areas, sometimes associated with stable food availability and reduced 1107
48
predation (Chamberlain et al. 2009). However, humans are feared by a vast number of animals and 1108
in the case where humans do not predate on animals living in proximity, the individuals who are 1109
bold enough to withstand the fear of humans can collect the benefits of low predation and stable 1110
food resources. Even though, residency near human settlements could cancel most environmental 1111
conditions that might lead to migration (e.g. seasonal scarcity of resources), some individuals have 1112
difficulties to cope with human presence and decide to migrate once conditions are favorable to do 1113
so (Møller et al. 2013, Found and St. Clair 2016). I argue that when residents live closed to human 1114
settlements, they might be bolder in order to withstand human presence, and also more exploratory 1115
as they might have to find and experiment with novel resources and risks (Found and St. Clair 1116
2016). Because boldness becomes an advantage rather than a disadvantage, this contradicts what we 1117
expect when migration happens in natural settings (Figure 2). 1118
Figure 2 Description of how behavioral differences between residents and migrants, might change if residents stay in
natural area (left columns) or if residents stay in proximity to human settlements (right columns). For example, first row
shows that individuals with a more active behavioral type are more likely to become residents in natural areas and also
more likely to become residents when in close proximity to human settlements.
49
Human habituation has been linked to declines in migratory tendency (Partecke and Gwinner 1119
2007, Kirby et al. 2008, White et al. 2014), and despite the importance of behavioral traits to human 1120
habituation (Ellenberg et al. 2009, Samia et al. 2015), I found only one study explicitly assessing 1121
behavior and partial migration where residents went through human habituation (Found and St. 1122
Clair 2016). We should be aware that human habituation is introducing serious challenges such as 1123
property damage, rise in zoonotic diseases and physical attacks to people (Soulsbury and White 1124
2015). Interestingly, the resident elk who scored higher on boldness and aggressiveness in Found 1125
and St. Clair (2016), had a historical record of public safety incidents including one which required 1126
hospitalization of a person. I remind however that for some threatened migratory species, allowing 1127
or enforce species’ settlement near humans could have the potential to counteract population 1128
declines. 1129
CONCLUDING REMARKS 1130
The logistical challenges in the past for studying the relation between behavioral traits and 1131
migration are becoming buried by recent technological advances that allow cheaper, smaller and 1132
more effective devices to be used in migration tracking and behavioral analysis (Chapman et al. 1133
2012, Nilsson et al. 2014, Canestrelli et al. 2016). With these tools at hand, we can start more in-1134
depth studies about the proximate and ultimate causes of migration. Specifically, in animal behavior 1135
research we can try to discern which behavioral types are most likely to migrate according to 1136
different ecological contexts. I recommend new studies to try to give a better overall picture of 1137
behavioral-dependent migration by assessing multiple behavioral traits. This could give far better 1138
insights than multiple studies, studying one or two behavioral traits, on different species and under 1139
different ecological conditions. I also recommend studies to explicitly assess some factors such as 1140
predation risk, resource abundance, competition and/or other non-behavioral traits to allow 1141
encompassing results and the possible determination of general patterns in future meta-analytic 1142
studies, otherwise difficult to obtain in a single primary study. I am not aware of any study 1143
50
evaluating behavioral changes in residents and migrants throughout a migratory cycle. If residents 1144
and migrants live temporarily in sympatry, residents can be more aggressive and territorial when 1145
migrants arrive and density is high but relax this behavior once migrants depart and density 1146
decreases. Also, because of the physiological changes conferring migrants the ‘superpowers’ needed 1147
to undergo migration, migrantes could display higher activity levels if caught while migrating. 1148
I point out that in my systematic review, only one study evaluated the link between behavior, 1149
human habituation and residency and I argue that this link merits further research. In doing so, one 1150
could assess the extent of possible shifts in migratory behavior attributed to anthropogenic factors. 1151
Human-induced rapid environmental changes are taking their toll on migratory species, and unless 1152
species are fast enough to adapt, they can succumb along with all their ecological interactions. Even 1153
if species persist but migration behavior is lost, such a change can have tremendous effects on 1154
species that depend on migratory journeys for predation, parasitism, competition and mutualism. 1155
Migratory tendency is driven by the interplay of different factors in specific environmental 1156
contexts, so understanding which factors are important in each context could advance our 1157
knowledge of what conditions must be kept to protect migratory journeys and all species that rely 1158
on them. Ultimately this includes many human families around the world that depend on animal 1159
migratory paths to acquire food and money to survive. 1160
REFERENCES 1161
Adams, C. E., F. A. Huntingford, J. Krpal, M. Jobling, and S. J. Burnett. 1995. Exercise, agonistic 1162
behavior and food acquisition in Arctic charr, Salvelinus alpinus. Environmental Biology of Fishes 1163
43:213–218. 1164
Bachman, R. A. 1984. Foraging Behavior of Free-Ranging Wild and Hatchery Brown Trout in a 1165
Stream. Transactions of the American Fisheries Society 113:1–32. 1166
Brien, M. L., G. J. Webb, K. A. Christian, J. W. Lang, and K. A. McGuinness. 2013. Born to be bad: 1167
Agonistic behavior in hatchling saltwater crocodiles (Crocodylus porosus). Behavior 150:737–1168
762. 1169
Brodersen, J., P. A. Nilsson, L. A. Hansson, C. Skov, and C. Brönmark. 2008. Condition-dependent 1170
individual decision-making determines cyprinid partial migration. Ecology 89:1195–1200. 1171
51
Candolin, U., and B. B. M. Wong. 2012. Behavioral responses to a changing world: mechanisms & 1172
consequences. Behavioral responses to a changing world: mechanisms & consequences.:i–xix, 1-1173
256. 1174
Canestrelli, D., R. Bisconti, and C. Carere. 2016. Bolder Takes All? The Behavioral Dimension of 1175
Biogeography. Trends in Ecology and Evolution 31:35–43. 1176
Castonguay, M., J.-D. Dutil, C. Audet, and R. Miller. 1990. Locomotor Activity and Concentration 1177
of Thyroid Hormones in Migratory and Sedentary Juvenile American Eels. Transactions of the 1178
American Fisheries Society 119:946–956. 1179
Chamberlain, D. E., A. R. Cannon, M. P. Toms, D. I. Leech, B. J. Hatchwell, and K. J. Gaston. 2009. 1180
Avian productivity in urban landscapes: A review and meta-analysis. Ibis 151:1–18. 1181
Chapman, B. B., C. Brönmark, J. Å. Nilsson, and L. A. Hansson. 2011a. The ecology and evolution 1182
of partial migration. Oikos 120:1764–1775. 1183
Chapman, B. B., K. Hulthén, D. R. Blomqvist, L. A. Hansson, J. Å. Nilsson, J. Brodersen, P. Anders 1184
Nilsson, C. Skov, and C. Brönmark. 2011b. To boldly go: Individual differences in boldness 1185
influence migratory tendency. Ecology Letters 14:871–876. 1186
Chapman, B. B., K. Hulthén, J. Brodersen, P. A. Nilsson, C. Skov, L. A. Hansson, and C. Brönmark. 1187
2012. Partial migration in fishes: Causes and consequences. Journal of Fish Biology 81:456–478. 1188
Dall, S. R. X., A. I. Houston, and J. M. McNamara. 2004. The behavioral ecology of personality: 1189
Consistent individual differences from an adaptive perspective. Ecology Letters 7:734–739. 1190
Del Re, A. C. (2013). compute.es: Compute Effect Sizes. R package version 0.2-2. 1191
http://CRAN.R-project.org/package=compute.es 1192
Dingle, H. 2006. Animal migration: Is there a common migratory syndrome? Journal of Ornithology 1193
147:212–220. 1194
Dingle, H., and V. A. Drake. 2007. What Is Migration? BioScience 57:113–121. 1195
Edwards, J. R., and S. P. Lailvaux. 2013. Do interspecific interactions between females drive shifts 1196
in habitat use? A test using the lizards Anolis carolinensis and A.sagrei. Biological Journal of the 1197
Linnean Society 110:843–851. 1198
Ellenberg, U., T. Mattern, and P. J. Seddon. 2009. Habituation potential of yellow-eyed penguins 1199
depends on sex, character and previous experience with humans. Animal Behavior 77:289–296. 1200
Found, R. B., and C. C. St. Clair. 2016. Behavioral syndromes predict loss of migration in wild elk. 1201
Animal Behavior 115:35–46. 1202
Greenberg, R., D. K. Niven, S. Hopp, and C. Boone. 1993. Frugivory and Coexistence in a Resident 1203
and a Migratory Vireo on the Yucatan Peninsula. The Condor 95:990–999. 1204
Harwood, A. J., J. D. Armstrong, S. W. Griffiths, and N. B. Metcalfe. 2002. Sympatric association 1205
influences within-species dominance relations among juvenile Atlantic salmon and brown trout. 1206
Animal Behavior 64:85–95. 1207
Hendry, A. P., T. J. Farrugia, and M. T. Kinnison. 2008. Human influences on rates of phenotypic 1208
change in wild animal populations. Molecular Ecology 17:20–29. 1209
Hutchison, M. J., and M. Iwata. 1997. A comparative analysis of aggression in migratory and non-1210
migratory salmonids. Environmental Biology of Fishes 50:209–215. 1211
Kirby, J. S., A. J. Stattersfield, S. H. M. Butchart, M. I. Evans, R. F. A. Grimmett, V. R. Jones, J. 1212
O’sullivan, G. M. Tucker, and I. Newton. 2008. Key conservation issues for migratory land- and 1213
waterbird species on the world’s major flyways. Bird Conservation International 18:S49–S73. 1214
Kotrschal, A., E. J. Lievens, J. Dahlbom, A. Bundsen, S. Semenova, M. Sundvik, A. A. Maklakov, S. 1215
Winberg, P. Panula, and N. Kolm. 2014. Artificial selection on relative brain size reveals a positive 1216
genetic correlation between brain size and proactive personality in the guppy. Evolution 68:1139–1217
1149. 1218
Kristensen, E. A., and G. P. Closs. 2008. Variation in growth and aggression of juvenile brown trout 1219
(Salmo trutta) from upstream and downstream reaches of the same river. Ecology of Freshwater 1220
Fish 17:130–135. 1221
52
Mettke-Hofmann, C., C. Ebert, T. Schmidt, S. Steiger, and S. Stieb. 2005. Personality traits in resident 1222
and migratory warbler species. Behavior 142:1357–1375. 1223
Mettke-Hofmann, C., S. Lorentzen, E. Schlicht, J. Schneider, and F. Werner. 2009. Spatial neophilia 1224
and spatial neophobia in resident and migratory warblers (Sylvia). Ethology 115:482–492. 1225
Mettke-Hofmann, C., H. Winkler, P. B. Hamel, and R. Greenberg. 2013. Migratory New World 1226
Blackbirds (Icterids) Are More Neophobic than Closely Related Resident Icterids. PLoS ONE 8. 1227
Møller, A. P., T. Grim, J. D. Ibáñez-Álamo, G. Markó, and P. Tryjanowski. 2013. Change in flight 1228
initiation distance between urban and rural habitats following a cold winter. Behavioral Ecology 1229
24:1211–1217. 1230
Moore, F. R., and D. A. Aborn. 2000. Mechanisms of en route habitat selection: how do migrants 1231
make habitat decisions during stopover? Studies in Avian Biology 20:34–42. 1232
Moore, F. R., M. S. Woodrey, J. J. Buler, S. Woltmann, and T. R. Simons. 2005. Understanding the 1233
Stopover of Migratory Birds : A Scale Dependent Approach. Bird Conservation Implementation 1234
and Integration in the Americas: Proceedings of the Third International Partners in Flight 1235
Conference:684–689. 1236
Newsome, T. M., J. A. Dellinger, C. R. Pavey, W. J. Ripple, C. R. Shores, A. J. Wirsing, and C. R. 1237
Dickman. 2015. The ecological effects of providing resource subsidies to predators. Global 1238
Ecology and Biogeography 24:1–11. 1239
Nilsson, A. L. K., J.-åke Nilsson, T. Alerstam, and J. Bäckman. 2010. Migratory and resident blue tits 1240
Cyanistes caeruleus differ in their reaction to a novel object. Naturwissenschaften 97:981–985. 1241
Nilsson, J. Å., Brönmark, C., Hansson, L-A., B. B. Chapman. 2014. Animal movement. Chapter 1242
6:90–109 in L-A. Hansson and S. Åkesson. Animal Movement Across Scales. Oxford University 1243
Press, Oxford. 1244
Partecke, J., and E. Gwinner. 2007. Increased sedentariness in European blackbirds following 1245
urbanization: A consequence of local adaptation? Ecology 88:882–890. 1246
Réale, D., S. M. Reader, D. Sol, P. T. McDougall, and N. J. Dingemanse. 2007. Integrating animal 1247
temperament within ecology and evolution. Biological Reviews 82:291–318. 1248
Riechert, S. E., and R. F. Hall. 2000. Local population success in heterogeneous habitats: Reciprocal 1249
transplant experiments completed on a desert spider. Journal of Evolutionary Biology 13:541–550. 1250
Samia, D. S. M., S. Nakagawa, F. Nomura, T. F. Rangel, and D. T. Blumstein. 2015. Increased 1251
tolerance to humans among disturbed wildlife. Nature Communications 6:8877. 1252
Sih, A., J. Cote, M. Evans, S. Fogarty, and J. Pruitt. 2012. Ecological implications of behavioral 1253
syndromes. Ecology Letters 15:278–289. 1254
Sih, A., L. B. Kats, and E. F. Maurer. 2003. Behavioral correlations across situations and the evolution 1255
of antipredator behavior in a sunfish-salamander system. Animal Behavior 65:29–44. 1256
Skov, C., H. Baktoft, J. Brodersen, C. Bronmark, B. B. Chapman, L.-A. Hansson, and P. A. Nilsson. 1257
2011. Sizing up your enemy: individual predation vulnerability predicts migratory probability. 1258
Proceedings of the Royal Society B: Biological Sciences 278:1414–1418. 1259
Sol, D., L. Lefebvre, and J. D. Rodriguez-Teijeiro. 2005. Brain size, innovative propensity and 1260
migratory behavior in temperate Palaearctic birds. Proceedings of the Royal Society B: Biological 1261
Sciences 272:1433–1441. 1262
Sol, D., S. Timmermans, and L. Lefebvre. 2002. Behavioral flexibility and invasion success in birds. 1263
Animal Behavior 63:495–502. 1264
Soulsbury, C. D., and P. C. L. White. 2015. Human–wildlife interactions in urban areas: a review of 1265
conflicts, benefits and opportunities. Wildlife Research 42:541. 1266
Vincze, O. 2016. Light enough to travel or wise enough to stay? Brain size evolution and migratory 1267
behavior in birds. Evolution; international journal of organic evolution 70:2123–2133. 1268
Wallace, B. C., K. Small, C. E. Brodley, J. Lau, and T. A. Trikalinos. 2012. Deploying an Interactive 1269
Machine Learning System in an Evidence-Based Practice Center : abstrackr. Proc. of the ACM 1270
International Health Informatics Symposium (IHI):819–824. 1271
53
Wan, X., W. Wang, J. Liu, and T. Tong. 2014. Estimating the sample mean and standard deviation 1272
from the sample size, median, range and/or interquartile range. BMC Medical Research 1273
Methodology 14:1–13. 1274
Warnock, W. G., and J. B. Rasmussen. 2014. Comparing competitive ability and associated metabolic 1275
traits between a resident and migratory population of bull trout against a non-native species. 1276
Environmental Biology of Fishes 97:415–423. 1277
White, K. S., N. L. Barten, S. Crouse, and J. Crouse. 2014. Benefits of migration in relation to 1278
nutritional condition and predation risk in a partially migratory moose population. Ecology 1279
95:225–237. 1280
Wolf, M., and F. J. Weissing. 2012. Animal personalities: Consequences for ecology and evolution. 1281
Trends in Ecology and Evolution 27:452–461. 1282
1283
54
APPENDIX A. Details on literature search 1284
1285
Web of Science 1286
1287
I searched in Web of Science database for studies published before 15 June 2016 and written in 1288
English. Due to a wide terminology in animal personality research, I used an extensive list of terms 1289
attempting to detect most of the relevant studies: 1290
((personalit* OR temperament OR "behavi?ral type*" OR "individual differences" OR 1291
"individual variation" OR "intraspecific variation" OR "behavi?ral phenotype" OR "behavi?ral 1292
strategies" OR "behavi?ral syndromes" OR "behavi?ral differences" OR "behavi?ral trait*" OR 1293
"behavi?ral flexibility" OR "behavi?ral polymorphism") OR (bold* OR "risk taking" OR fear*) OR 1294
(aggress*) OR (explorat* OR neoph*) OR (socia* AND behav*) OR (activ* AND behav*)) AND 1295
(animal* OR species OR fish* OR amphibian* OR reptil* OR bird* OR mammal* OR insect*) 1296
AND (dispers* OR invasi* OR migrat* OR "range expansion" OR introduction OR departure OR 1297
transience OR establish* OR settle*) 1298
Since some terms may be used interchangeably between different research areas (e.g. activity can 1299
be used as foraging activity or as geothermal activity), I narrowed the scope of some terms (e.g 1300
(activ* AND behav*)). I also added a set of terms limiting the search to just those studies that refer 1301
to animals or species. 1302
The search returned over 90000 records, from a multitude of research areas. To reduce this 1303
number to a workable quantity I used Web of Science refining procedures. I examined known 1304
studies, which assess animal personalities’ effects on species distributions, for their registered 1305
research areas. As a result, I refined records to include the following research areas: 1306
Environmental Sciences Ecology OR Zoology OR Behavioral Sciences OR Marine Freshwater 1307
Biology OR Science Technology Other Topics OR Life Sciences Biomedicine Other Topics OR 1308
55
Entomology OR Evolutionary Biology OR Oceanography OR Biodiversity Conservation OR 1309
Endocrinology Metabolism. 1310
The refined search turned up 14090 studies. I considered the search accurate after searched for and 1311
confirmed the presence of the following studies: Duckworth and Badyaev 2007, Pintor et al. 2008, 1312
Mettke-Hofmann et al. 2009, Cote et al. 2010b, Chapman et al. 2011b, Chapple et al. 2011, Liebl and 1313
Martin 2012, Brodin et al. 2013, Hudina et al. 2015, Myles-Gonzalez et al. 2015. 1314
Although restricting the search might have excluded some relevant studies, I argue that my 1315
extensive search not limited by Web of Science records, will have the capacity to retrieve almost all 1316
relevant studies conducted so far. 1317
1318
Google Scholar 1319
Google Scholar database is a good source to look for grey literature, journals not available on 1320
Web of Science, and more recent studies not updated in other databases. 1321
I conducted the Google Scholar search between 15 and 17 June 2016, using nine sets of terms: 1322
1) personality migrat* animal OR species 1323
2) personality invasi* animal OR species 1324
3) personality dispers* animal OR species 1325
4) temperament migrat* animal OR species 1326
5) temperament invasi* animal OR species 1327
6) temperament dispers* animal OR species 1328
7) behavior migrat* animal OR species 1329
8) behavior invasi* animal OR species 1330
9) behavior dispers* animal OR species 1331
1332
Each set of terms was searched twice, once for all years and once for studies published after 1333

56
2015. The latter allowed me to retrieve recent literature absent in Web of Science database. 1334
I ordered search results by relevance and collected the first 100 records in each search. All 1335
Google Scholar searches summed up to 1800 studies. A visual inspection on these studies 1336
confirmed that this method allowed me to incorporate some grey literature (e.g. thesis) and recent 1337
literature absent from Web of Science search. 1338
1339
Combining Web of Science and Google Scholar records 1340
I combined the records from Web of Science and Google scholar databases (total of 15890 1341
studies) and removed 377 duplicates with EndNote software. The remaining 15513 studies were 1342
imported to abstrackr to be screened by title and abstract. 1343
1344
1345
1346
1347
1348
1349
1350
1351
1352

57
APPENDIX B. PRISMA Diagram 1353
1354
1355 1356 1357 1358 1359 1360 1361 1362 1363 1364 1365 1366 1367 1368 1369 1370 1371 1372 1373 1374 1375 1376 1377 1378 1379 1380 1381 1382 1383 1384 1385 1386 1387 1388 1389 Met criteria but excluded means a study passed the inclusion criteria, however it lacked some features needed 1390 to conduct meta-analysis (e.g. no species-specific data; or study design allowing for residency effects in 1391 behavioral assessments). Waiting data means contact was made with the author in order to obtain missing data 1392 needed to calculate the effect size, but no response was yet obtained. 1393 1394
1395
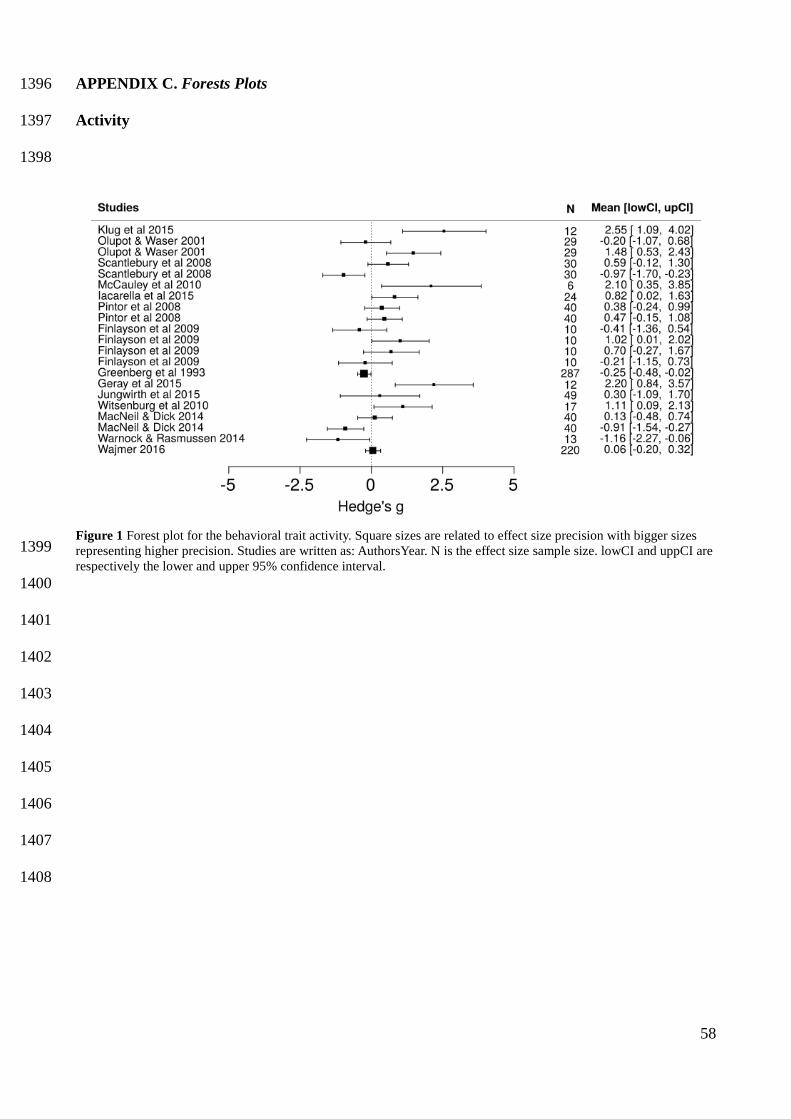
58
APPENDIX C. Forests Plots 1396
Activity 1397
1398
1399
1400
1401
1402
1403
1404
1405
1406
1407
1408
Figure 1 Forest plot for the behavioral trait activity. Square sizes are related to effect size precision with bigger sizes
representing higher precision. Studies are written as: AuthorsYear. N is the effect size sample size. lowCI and uppCI are
respectively the lower and upper 95% confidence interval.
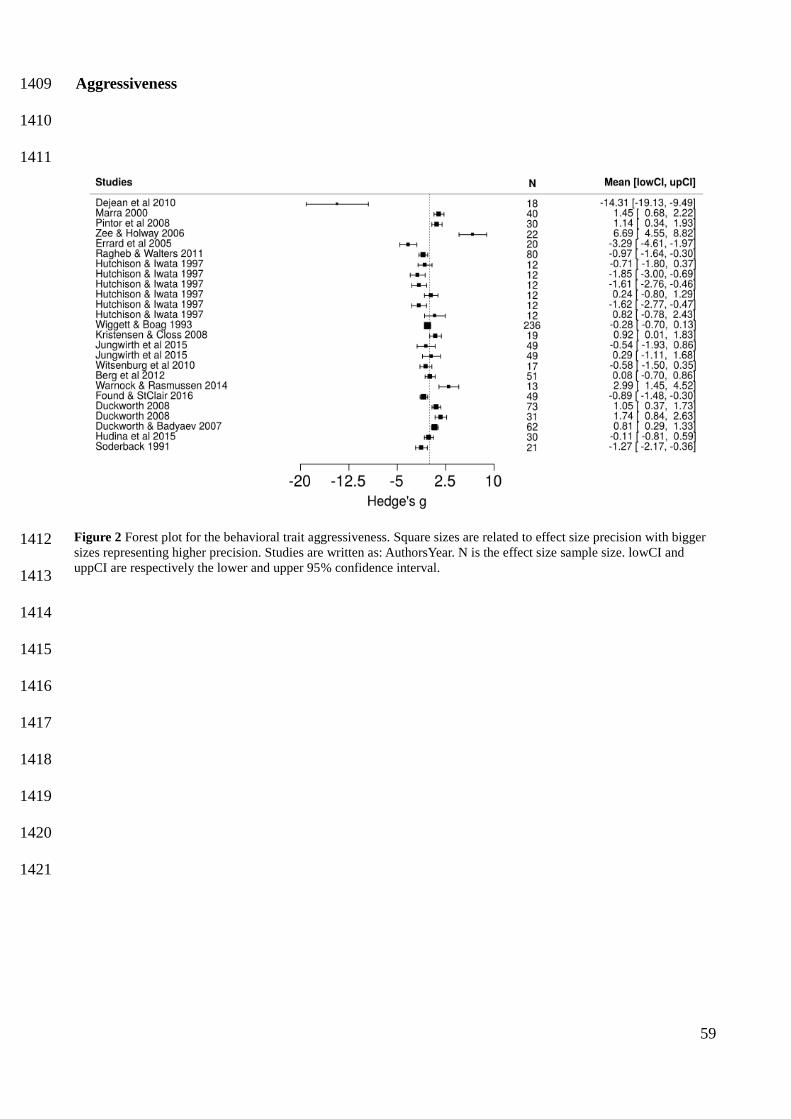
59
Aggressiveness 1409
1410
1411
1412
1413
1414
1415
1416
1417
1418
1419
1420
1421
Figure 2 Forest plot for the behavioral trait aggressiveness. Square sizes are related to effect size precision with bigger
sizes representing higher precision. Studies are written as: AuthorsYear. N is the effect size sample size. lowCI and
uppCI are respectively the lower and upper 95% confidence interval.

60
Boldness 1422
1423
1424
1425
1426
1427
1428
1429
1430
1431
1432
1433
1434
Figure 3 Forest plot for the behavioral trait boldness. Square sizes are related to effect size precision with bigger sizes
representing higher precision. Studies are written as: AuthorsYear. N is the effect size sample size. lowCI and uppCI are
respectively the lower and upper 95% confidence interval.
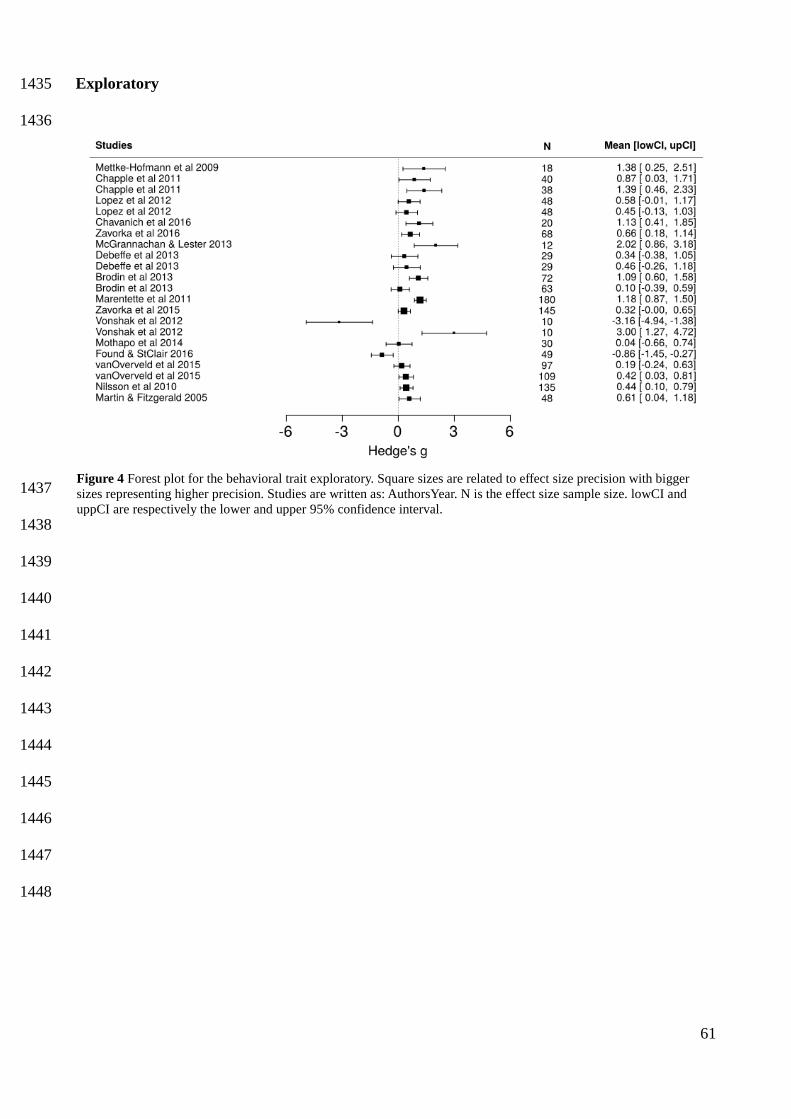
61
Exploratory 1435
1436
1437
1438
1439
1440
1441
1442
1443
1444
1445
1446
1447
1448
Figure 4 Forest plot for the behavioral trait exploratory. Square sizes are related to effect size precision with bigger
sizes representing higher precision. Studies are written as: AuthorsYear. N is the effect size sample size. lowCI and
uppCI are respectively the lower and upper 95% confidence interval.
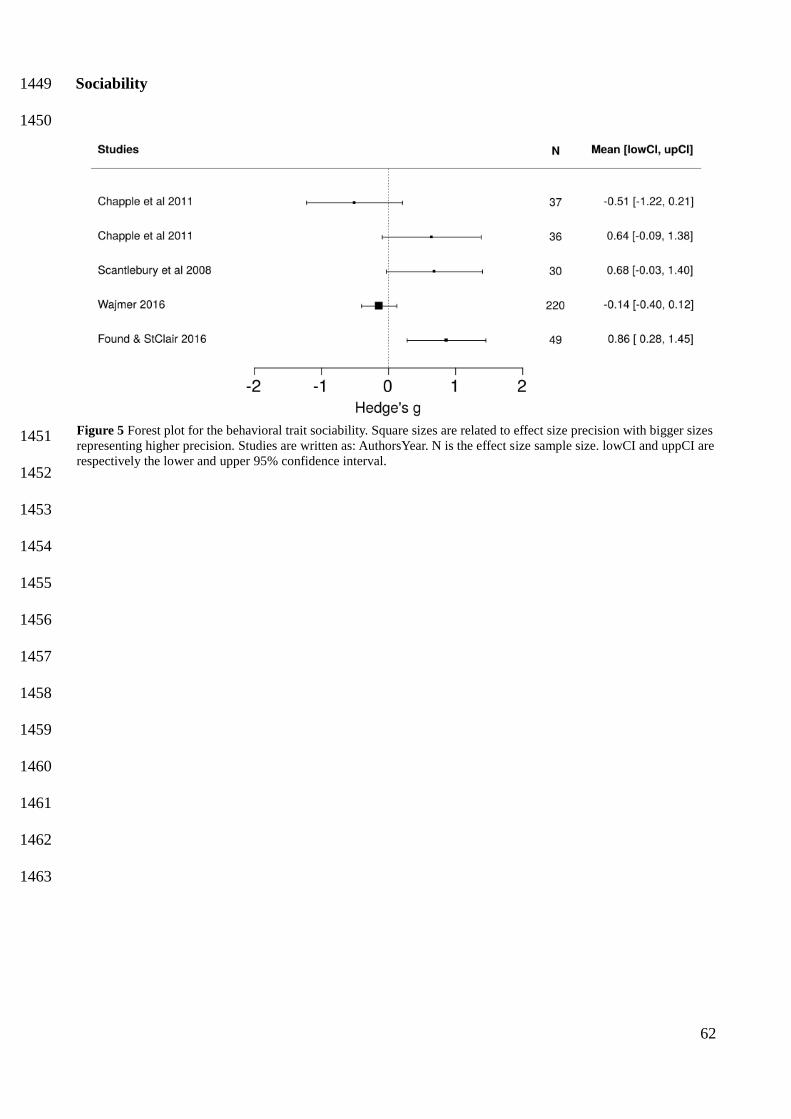
62
Sociability 1449
1450
1451
1452
1453
1454
1455
1456
1457
1458
1459
1460
1461
1462
1463
Figure 5 Forest plot for the behavioral trait sociability. Square sizes are related to effect size precision with bigger sizes
representing higher precision. Studies are written as: AuthorsYear. N is the effect size sample size. lowCI and uppCI are
respectively the lower and upper 95% confidence interval.
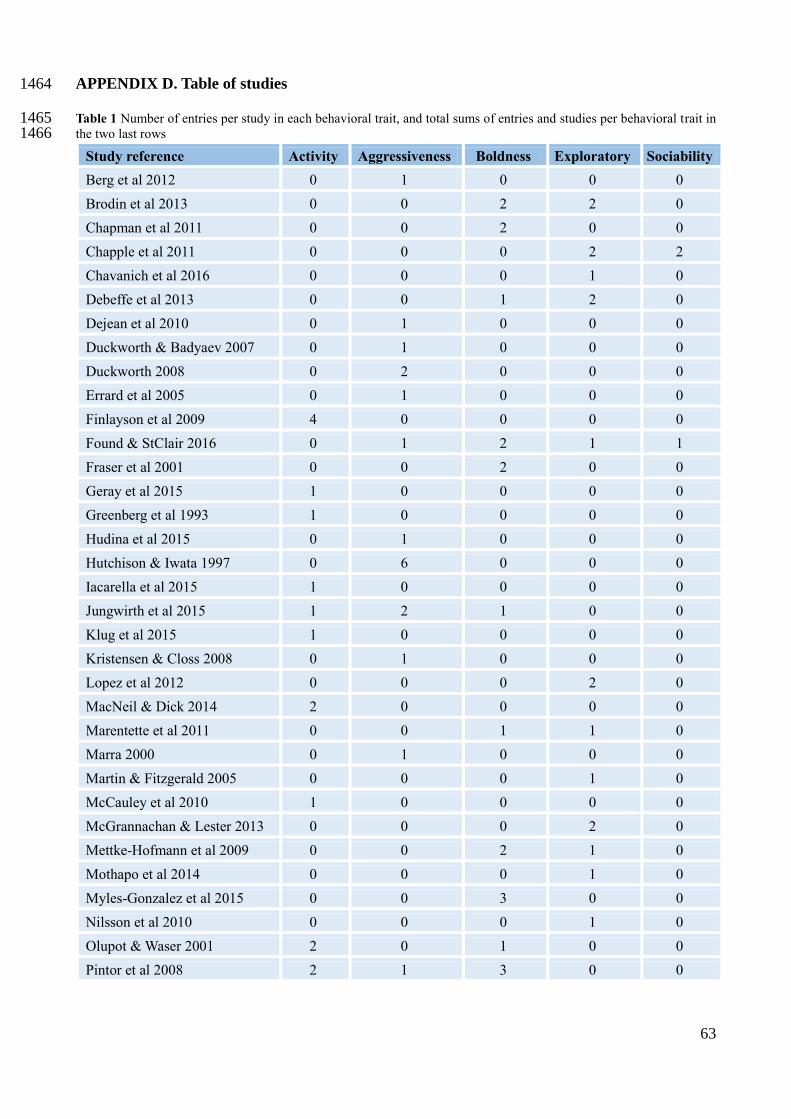
63
APPENDIX D. Table of studies 1464
Table 1 Number of entries per study in each behavioral trait, and total sums of entries and studies per behavioral trait in 1465 the two last rows 1466
Study reference Activity Aggressiveness Boldness Exploratory Sociability
Berg et al 2012 0 1 0 0 0
Brodin et al 2013 0 0 2 2 0
Chapman et al 2011 0 0 2 0 0
Chapple et al 2011 0 0 0 2 2
Chavanich et al 2016 0 0 0 1 0
Debeffe et al 2013 0 0 1 2 0
Dejean et al 2010 0 1 0 0 0
Duckworth & Badyaev 2007 0 1 0 0 0
Duckworth 2008 0 2 0 0 0
Errard et al 2005 0 1 0 0 0
Finlayson et al 2009 4 0 0 0 0
Found & StClair 2016 0 1 2 1 1
Fraser et al 2001 0 0 2 0 0
Geray et al 2015 1 0 0 0 0
Greenberg et al 1993 1 0 0 0 0
Hudina et al 2015 0 1 0 0 0
Hutchison & Iwata 1997 0 6 0 0 0
Iacarella et al 2015 1 0 0 0 0
Jungwirth et al 2015 1 2 1 0 0
Klug et al 2015 1 0 0 0 0
Kristensen & Closs 2008 0 1 0 0 0
Lopez et al 2012 0 0 0 2 0
MacNeil & Dick 2014 2 0 0 0 0
Marentette et al 2011 0 0 1 1 0
Marra 2000 0 1 0 0 0
Martin & Fitzgerald 2005 0 0 0 1 0
McCauley et al 2010 1 0 0 0 0
McGrannachan & Lester 2013 0 0 0 2 0
Mettke-Hofmann et al 2009 0 0 2 1 0
Mothapo et al 2014 0 0 0 1 0
Myles-Gonzalez et al 2015 0 0 3 0 0
Nilsson et al 2010 0 0 0 1 0
Olupot & Waser 2001 2 0 1 0 0
Pintor et al 2008 2 1 3 0 0
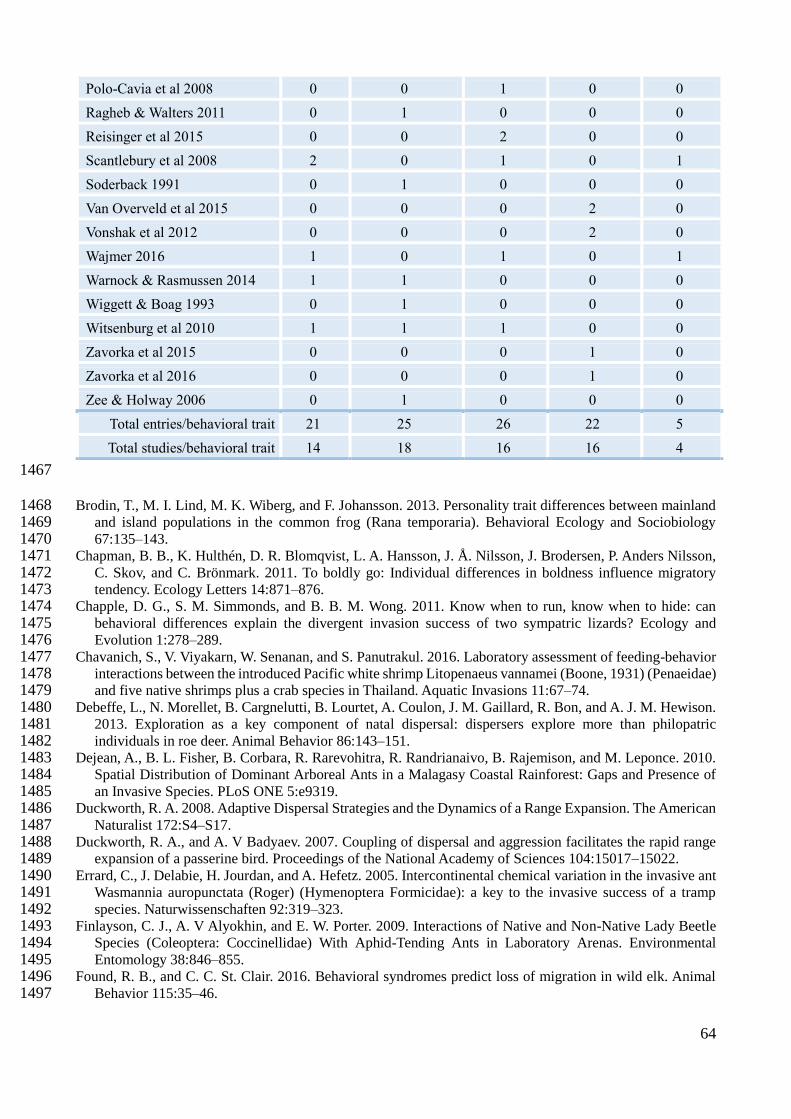
64
Polo-Cavia et al 2008 0 0 1 0 0
Ragheb & Walters 2011 0 1 0 0 0
Reisinger et al 2015 0 0 2 0 0
Scantlebury et al 2008 2 0 1 0 1
Soderback 1991 0 1 0 0 0
Van Overveld et al 2015 0 0 0 2 0
Vonshak et al 2012 0 0 0 2 0
Wajmer 2016 1 0 1 0 1
Warnock & Rasmussen 2014 1 1 0 0 0
Wiggett & Boag 1993 0 1 0 0 0
Witsenburg et al 2010 1 1 1 0 0
Zavorka et al 2015 0 0 0 1 0
Zavorka et al 2016 0 0 0 1 0
Zee & Holway 2006 0 1 0 0 0
Total entries/behavioral trait 21 25 26 22 5
Total studies/behavioral trait 14 18 16 16 4
1467
Brodin, T., M. I. Lind, M. K. Wiberg, and F. Johansson. 2013. Personality trait differences between mainland 1468 and island populations in the common frog (Rana temporaria). Behavioral Ecology and Sociobiology 1469 67:135–143. 1470
Chapman, B. B., K. Hulthén, D. R. Blomqvist, L. A. Hansson, J. Å. Nilsson, J. Brodersen, P. Anders Nilsson, 1471 C. Skov, and C. Brönmark. 2011. To boldly go: Individual differences in boldness influence migratory 1472 tendency. Ecology Letters 14:871–876. 1473
Chapple, D. G., S. M. Simmonds, and B. B. M. Wong. 2011. Know when to run, know when to hide: can 1474 behavioral differences explain the divergent invasion success of two sympatric lizards? Ecology and 1475 Evolution 1:278–289. 1476
Chavanich, S., V. Viyakarn, W. Senanan, and S. Panutrakul. 2016. Laboratory assessment of feeding-behavior 1477 interactions between the introduced Pacific white shrimp Litopenaeus vannamei (Boone, 1931) (Penaeidae) 1478 and five native shrimps plus a crab species in Thailand. Aquatic Invasions 11:67–74. 1479
Debeffe, L., N. Morellet, B. Cargnelutti, B. Lourtet, A. Coulon, J. M. Gaillard, R. Bon, and A. J. M. Hewison. 1480 2013. Exploration as a key component of natal dispersal: dispersers explore more than philopatric 1481 individuals in roe deer. Animal Behavior 86:143–151. 1482
Dejean, A., B. L. Fisher, B. Corbara, R. Rarevohitra, R. Randrianaivo, B. Rajemison, and M. Leponce. 2010. 1483 Spatial Distribution of Dominant Arboreal Ants in a Malagasy Coastal Rainforest: Gaps and Presence of 1484 an Invasive Species. PLoS ONE 5:e9319. 1485
Duckworth, R. A. 2008. Adaptive Dispersal Strategies and the Dynamics of a Range Expansion. The American 1486 Naturalist 172:S4–S17. 1487
Duckworth, R. A., and A. V Badyaev. 2007. Coupling of dispersal and aggression facilitates the rapid range 1488 expansion of a passerine bird. Proceedings of the National Academy of Sciences 104:15017–15022. 1489
Errard, C., J. Delabie, H. Jourdan, and A. Hefetz. 2005. Intercontinental chemical variation in the invasive ant 1490 Wasmannia auropunctata (Roger) (Hymenoptera Formicidae): a key to the invasive success of a tramp 1491 species. Naturwissenschaften 92:319–323. 1492
Finlayson, C. J., A. V Alyokhin, and E. W. Porter. 2009. Interactions of Native and Non-Native Lady Beetle 1493 Species (Coleoptera: Coccinellidae) With Aphid-Tending Ants in Laboratory Arenas. Environmental 1494 Entomology 38:846–855. 1495
Found, R. B., and C. C. St. Clair. 2016. Behavioral syndromes predict loss of migration in wild elk. Animal 1496 Behavior 115:35–46. 1497
65
Fraser, D. F., J. F. Gilliam, M. J. Daley, A. N. Le, and G. T. Skalski. 2001. Explaining Leptokurtic Movement 1498 Distributions: Intrapopulation Variation in Boldness and Exploration. The American Naturalist 158:124–1499 135. 1500
Geray, D., R. Albariño, and D. Milano. 2015. Experimental assessment of predation by native and exotic fish 1501 on stream invertebrates in Northern Patagonia. Limnologica 51:24–31. 1502
Greenberg, R., D. K. Niven, S. Hopp, and C. Boone. 1993. Frugivory and Coexistence in a Resident and a 1503 Migratory Vireo on the Yucatan Peninsula. The Condor 95:990–999. 1504
Hewett Ragheb, E. L., and J. R. Walters. 2011. Favouritism or intrabrood competition? Access to food and the 1505 benefits of philopatry for red-cockaded woodpeckers. Animal Behavior 82:329–338. 1506
Hudina, S., K. Žganec, and K. Hock. 2015. Differences in aggressive behavior along the expanding range of 1507 an invasive crayfish: an important component of invasion dynamics. Biological Invasions 17:3101–3112. 1508
Hutchison, M. J., and M. Iwata. 1997. A comparative analysis of aggression in migratory and non-migratory 1509 salmonids. Environmental Biology of Fishes 50:209–215. 1510
Iacarella, J. C., J. T. A. Dick, and A. Ricciardi. 2015. A spatio-temporal contrast of the predatory impact of an 1511 invasive freshwater crustacean. Diversity and Distributions 21:803–812. 1512
Jungwirth, A., J. Walker, and M. Taborsky. 2015. Prospecting precedes dispersal and increases survival 1513 chances in cooperatively breeding cichlids. Animal Behavior 106:107–114. 1514
Klug, P. E., R. N. Reed, F. J. Mazzotti, M. A. McEachern, J. J. Vinci, K. K. Craven, and A. A. Yackel Adams. 1515 2015. The influence of disturbed habitat on the spatial ecology of Argentine black and white tegu 1516 (Tupinambis merianae), a recent invader in the Everglades ecosystem (Florida, USA). Biological Invasions 1517 17:1785–1797. 1518
Kristensen, E. A., and G. P. Closs. 2008. Variation in growth and aggression of juvenile brown trout (Salmo 1519 trutta) from upstream and downstream reaches of the same river. Ecology of Freshwater Fish 17:130–135. 1520
Lopez, D. P., A. A. Jungman, and J. S. Rehage. 2012. Nonnative African jewelfish are more fit but not bolder 1521 at the invasion front: a trait comparison across an Everglades range expansion. Biological Invasions 1522 14:2159–2174. 1523
Macneil, C., and J. T. A. Dick. 2014. Physicochemical tolerance, habitat use and predation are drivers of 1524 patterns of coexistence and exclusion among invasive and resident amphipods. Freshwater Biology 1525 59:1956–1969. 1526
Marentette, J. R., G. Wang, S. Tong, N. M. Sopinka, M. D. Taves, M. A. Koops, and S. Balshine. 2011. 1527 Laboratory and field evidence of sex-biased movement in the invasive round goby. Behavioral Ecology and 1528 Sociobiology 65:2239–2249. 1529
Marra, P. P. 2000. The role of behavioral dominance in structuring patterns of habitat occupancy in a migrant 1530 bird during the nonbreeding season. Behavioral Ecology 11:299–308. 1531
Martin, L. B., and L. Fitzgerald. 2005. A taste for novelty in invading house sparrows, Passer domesticus. 1532 Behavioral Ecology 16:702–707. 1533
McCauley, S. J., T. Brodin, and J. Hammond. 2010. Foraging Rates of Larval Dragonfly Colonists Are 1534 Positively Related to Habitat Isolation: Results from a Landscape‐Level Experiment. The American 1535 Naturalist 175:E66–E73. 1536
Mcgrannachan, C. M., and P. J. Lester. 2013. Temperature and starvation effects on food exploitation by 1537 Argentine ants and native ants in New Zealand. Journal of Applied Entomology 137:550–559. 1538
Mettke-Hofmann, C., S. Lorentzen, E. Schlicht, J. Schneider, and F. Werner. 2009. Spatial neophilia and spatial 1539 neophobia in resident and migratory warblers (Sylvia). Ethology 115:482–492. 1540
Mothapo, N. P., and T. C. Wossler. 2014. Resource competition assays between the African big-headed ant, 1541 Pheidole megacephala (Fabricius) and the invasive Argentine ant, Linepithema humile (Mayr): 1542 Mechanisms of inter-specific displacement. Ecological Entomology 39:501–510. 1543
Myles-Gonzalez, E., G. Burness, S. Yavno, A. Rooke, and M. G. Fox. 2015. To boldly go where no goby has 1544 gone before: Boldness, dispersal tendency, and metabolism at the invasion front. Behavioral Ecology 1545 26:1083–1090. 1546
Nilsson, A. L. K., J.-åke Nilsson, T. Alerstam, and J. Bäckman. 2010. Migratory and resident blue tits 1547 Cyanistes caeruleus differ in their reaction to a novel object. Naturwissenschaften 97:981–985. 1548
Olupot, W., and P. M. Waser. 2001. Activity patterns, habitat use and mortality risks of mangabey males living 1549 outside social groups. Animal Behavior 61:1227–1235. 1550
van Overveld, T., F. Adriaensen, and E. Matthysen. 2015. No evidence for correlational selection on 1551 exploratory behavior and natal dispersal in the great tit. Evolutionary Ecology 29:137–156. 1552
66
Pintor, L. M., A. Sih, and M. L. Bauer. 2008. Differences in aggression, activity and boldness between native 1553 and introduced populations of an invasive crayfish. Oikos 117:1629–1636. 1554
Polo-Cavia, N., P. López, and J. Martín. 2008. Interspecific differences in responses to predation risk may 1555 confer competitive advantages to invasive freshwater turtle species. Ethology 114:115–123. 1556
Raak-van den Berg, C. L., H. J. de Lange, and J. C. van Lenteren. 2012. Intraguild predation behavior of 1557 ladybirds in semi-field experiments explains invasion success of Harmonia axyridis. PLoS ONE 7:1–11. 1558
Reisinger, L. S., I. Petersen, J. S. Hing, R. L. Davila, and D. M. Lodge. 2015. Infection with a trematode 1559 parasite differentially alters competitive interactions and antipredator behavior in native and invasive 1560 crayfish. Freshwater Biology 60:1581–1595. 1561
Scantlebury, M., J. M. Waterman, and N. C. Bennett. 2008. Alternative reproductive tactics in male Cape 1562 ground squirrels Xerus inauris. Physiology and Behavior 94:359–367. 1563
Söderbäck, B. 1991. Interspecific dominance relationship and aggressive interactions in the freshwater 1564 crayfishes Astacus astacus (L.) and Pacifastacus leniusculus (Dana). Canadian Journal of Zoology 1565 69:1321–1325. 1566
Vonshak, M., T. Dayan, and A. Hefetz. 2012. Interspecific displacement mechanisms by the invasive little fire 1567 ant Wasmannia auropunctata. Biological Invasions 14:851–861. 1568
Wajmer, N. 2016. Understanding phenotypic and genetic variation in behaviors linked to migration in Lake 1569 Superior Brook Trout. Master Thesis. University of Guelph. 1570
Warnock, W. G., and J. B. Rasmussen. 2014. Comparing competitive ability and associated metabolic traits 1571 between a resident and migratory population of bull trout against a non-native species. Environmental 1572 Biology of Fishes 97:415–423. 1573
Wiggett, D. R., and D. A. Boag. 1993. The proximate causes of male-biased natal emigration in Columbian 1574 ground squirrels. Can. J. Zool 71:204–218. 1575
Witsenburg, F., R. Schürch, O. Otti, and D. Heg. 2010. Behavioral types and ecological effects in a natural 1576 population of the cooperative cichlid Neolamprologus pulcher. Animal Behavior 80:757–767. 1577
Závorka, L., D. Aldvén, J. Näslund, J. Höjesjö, and J. I. Johnsson. 2015. Linking lab activity with growth and 1578 movement in the wild: Explaining pace-of-life in a trout stream. Behavioral Ecology 26:877–884. 1579
Závorka, L., D. Aldvén, J. Näslund, J. Höjesjö, and J. I. Johnsson. 2016. Inactive trout come out at night: 1580 Behavioral variation, circadian activity, and fitness in the wild. Ecology 97:2223–2231. 1581
Zee, J., and D. Holway. 2006. Nest raiding by the invasive Argentine ant on colonies of the harvester ant, 1582 Pogonomyrmex subnitidus. Insectes Sociaux 53:161–167. 1583
1584
1585
1586
1587
1588
1589
1590
1591
1592
1593
1594
1595
67
APPENDIX E. Results from models 1596
Hierarchical model with study random effects (no moderators) 1597
Table 1 Statistics obtained from the posterior distribution of the summary effect size in a hierarchical model with effect 1598 sizes nested within studies. SD is the standard deviation and 95% CI are the 95% credible intervals. Prob > 0 is the 1599 probability that a behavioral trait had an effect size value higher than zero over all MCMC iterations. DIC is the 1600 Deviance Information Criterion. N relates to the number of studies or entries. 1601
1602
Hierarchical model with biogeographical processes as moderator 1603
Activity 1604
Table 2 Statistics obtained for activity from the posterior distribution of the summary effect size in a hierarchical model 1605 with effect sizes nested within studies and biogeographical process as moderator. SD is the standard deviation and 95% 1606 CI are the 95% credible intervals. Prob > 0 is the probability that a behavioral trait had an effect size value higher tan 1607 zero over all MCMC iterations. DIC is the Deviance Information Criterion. N relates to the number of studies or entries. 1608
1609
Behavioral Trait Mean SD 95% CI Prob > 0 DIC N (Studies/Entries)
Activity 0.4332 0.2685 [-0.0560 , 1.0100] 0.9603 80.9 14 / 21
Aggressiveness -0.1290 1.0208 [-1.694 , 1.335] 0.4352 85.7 18 / 25
Boldness 0.3867 0.1570 [0.0720 , 0.6967] 0.9901 30.1 16 / 26
Exploratory 0.5822 0.1563 [0.2745 , 0.8975] 0.9993 69.2 16 / 22
Sociability 0.3188 0.8168 [-0.8769 , 1.5990] 0.8062 9.5 4 / 5
Activity Mean SD 95% CI Prob > 0 N
(Studies / Entries)
Dispersal 0.4993 0.4436 [-0.3485 , 1.4170] 0.8854 6 / 8
Invasion 0.6316 0.4209 [-0.1348 , 1.5440] 0.9495 6 / 11
Migration - - - - 2 / 2
68
Aggressiveness 1610
Table 3 Statistics obtained for aggressiveness from the posterior distribution of the summary effect size in a hierarchical 1611 model with effect sizes nested within studies and biogeographical process as moderator. SD is the standard deviation and 1612 95% CI are the 95% credible intervals. Prob > 0 is the probability that a behavioral trait had an effect size value higher 1613 than zero over all MCMC iterations. DIC is the Deviance Information Criterion. N relates to the number of studies or 1614 entries. 1615
Boldness 1616
Table 4 Statistics obtained for boldness from the posterior distribution of the summary effect size in a hierarchical model 1617 with effect sizes nested within studies and biogeographical process as moderator. SD is the standard deviation and 95% 1618 CI are the 95% credible intervals. Prob > 0 is the probability that a behavioral trait had an effect size value higher than 1619 zero over all MCMC iterations. DIC is the Deviance Information Criterion. N relates to the number of studies or entries. 1620
Exploratory 1621
Table 5 Statistics obtained for exploratory from the posterior distribution of the summary effect size in a hierarchical 1622 model with effect sizes nested within studies and biogeographical process as moderator. SD is the standard deviation and 1623 95% CI are the 95% credible intervals. Prob > 0 is the probability that a behavioral trait had an effect size value higher 1624 than zero over all MCMC iterations. DIC is the Deviance Information Criterion. N relates to the number of studies or 1625 entries. 1626
Aggressiveness Mean SD 95% CI Prob > 0 N
(Studies / Entries)
Dispersal 0.0134 1.3380 [-2.694 , 2.687] 0.5068 7 / 9
Invasion -1.1455 1.5180 [-4.275 , 1.773] 0.2128 6 / 6
Migration 0.6515 1.5671 [-2.457 , 3.822] 0.6725 5 / 10
Boldness Mean SD 95% CI Prob > 0 N
(Studies / Entries)
Dispersal 0.4228 0.2353 [-0.0544 , 0.8846] 0.9620 9 / 11
Invasion 0.4811 0.3237 [-0.1660 , 1.1270] 0.9354 4 / 9
Migration 0.1950 0.3743 [-0.5484 , 0.9478] 0.7117 3 / 6
Exploratory Mean SD 95% CI Prob > 0 N
(Studies / Entries)
Dispersal 0.5446 0.2546 [0.0253 , 1.0560] 0.9789 6 / 9
Invasion 0.7332 0.2701 [0.1972, 1.2760] 0.9933 7 / 10
Migration - - - - 3 / 3
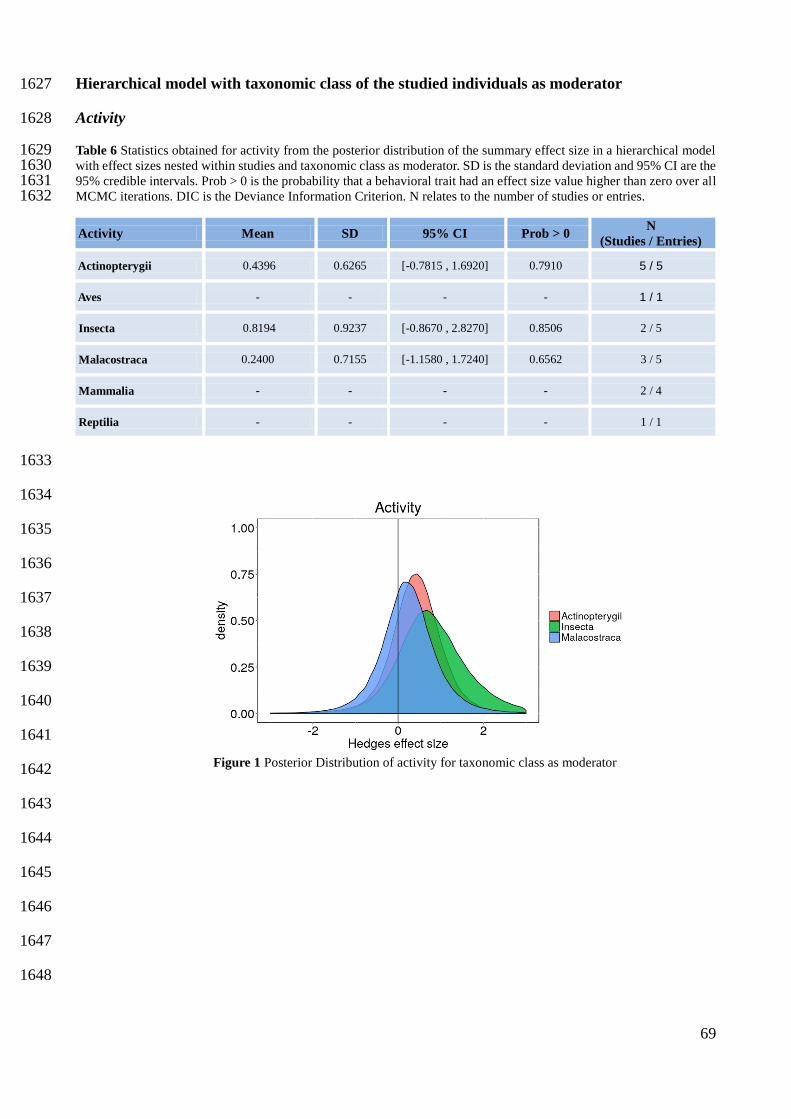
69
Hierarchical model with taxonomic class of the studied individuals as moderator 1627
Activity 1628
Table 6 Statistics obtained for activity from the posterior distribution of the summary effect size in a hierarchical model 1629 with effect sizes nested within studies and taxonomic class as moderator. SD is the standard deviation and 95% CI are the 1630 95% credible intervals. Prob > 0 is the probability that a behavioral trait had an effect size value higher than zero over all 1631 MCMC iterations. DIC is the Deviance Information Criterion. N relates to the number of studies or entries. 1632
1633
1634
1635
1636
1637
1638
1639
1640
1641
1642
1643
1644
1645
1646
1647
1648
Figure 1 Posterior Distribution of activity for taxonomic class as moderator
Activity Mean SD 95% CI Prob > 0 N
(Studies / Entries)
Actinopterygii 0.4396 0.6265 [-0.7815 , 1.6920] 0.7910 5 / 5
Aves - - - - 1 / 1
Insecta 0.8194 0.9237 [-0.8670 , 2.8270] 0.8506 2 / 5
Malacostraca 0.2400 0.7155 [-1.1580 , 1.7240] 0.6562 3 / 5
Mammalia - - - - 2 / 4
Reptilia - - - - 1 / 1
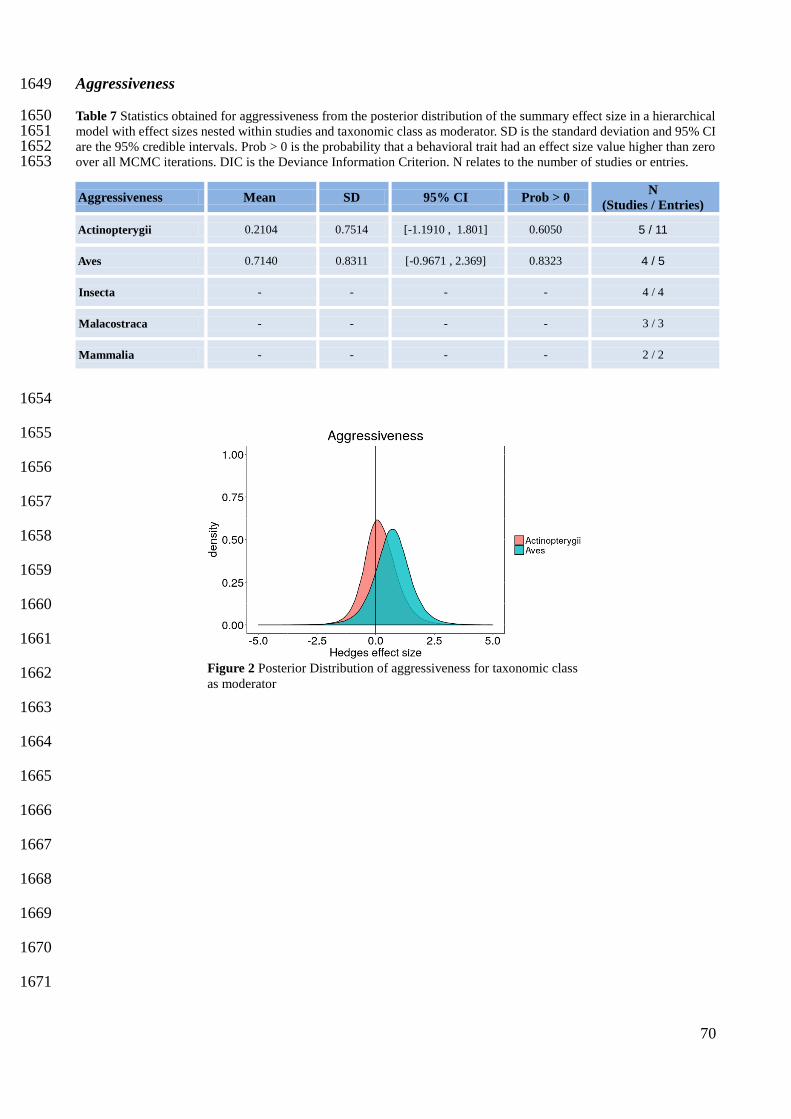
70
Aggressiveness 1649
Table 7 Statistics obtained for aggressiveness from the posterior distribution of the summary effect size in a hierarchical 1650 model with effect sizes nested within studies and taxonomic class as moderator. SD is the standard deviation and 95% CI 1651 are the 95% credible intervals. Prob > 0 is the probability that a behavioral trait had an effect size value higher than zero 1652 over all MCMC iterations. DIC is the Deviance Information Criterion. N relates to the number of studies or entries. 1653
1654
1655
1656
1657
1658
1659
1660
1661
1662
1663
1664
1665
1666
1667
1668
1669
1670
1671
Aggressiveness Mean SD 95% CI Prob > 0 N
(Studies / Entries)
Actinopterygii 0.2104 0.7514 [-1.1910 , 1.801] 0.6050 5 / 11
Aves 0.7140 0.8311 [-0.9671 , 2.369] 0.8323 4 / 5
Insecta - - - - 4 / 4
Malacostraca - - - - 3 / 3
Mammalia - - - - 2 / 2
Figure 2 Posterior Distribution of aggressiveness for taxonomic class
as moderator
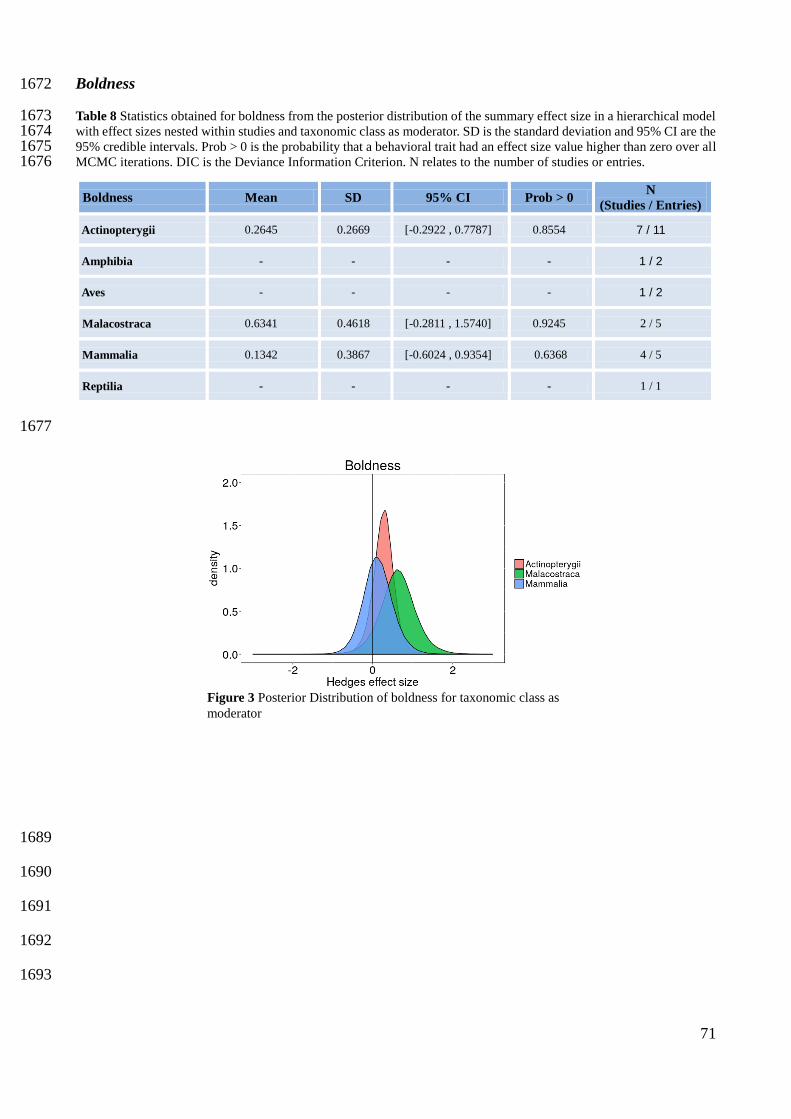
71
Boldness 1672
Table 8 Statistics obtained for boldness from the posterior distribution of the summary effect size in a hierarchical model 1673 with effect sizes nested within studies and taxonomic class as moderator. SD is the standard deviation and 95% CI are the 1674 95% credible intervals. Prob > 0 is the probability that a behavioral trait had an effect size value higher than zero over all 1675 MCMC iterations. DIC is the Deviance Information Criterion. N relates to the number of studies or entries. 1676
1677
1678
1679
1680
1681
1682
1683
1684
1685
1686
1687
1688
1689
1690
1691
1692
1693
Figure 3 Posterior Distribution of boldness for taxonomic class as
moderator
Boldness Mean SD 95% CI Prob > 0 N
(Studies / Entries)
Actinopterygii 0.2645 0.2669 [-0.2922 , 0.7787] 0.8554 7 / 11
Amphibia - - - - 1 / 2
Aves - - - - 1 / 2
Malacostraca 0.6341 0.4618 [-0.2811 , 1.5740] 0.9245 2 / 5
Mammalia 0.1342 0.3867 [-0.6024 , 0.9354] 0.6368 4 / 5
Reptilia - - - - 1 / 1
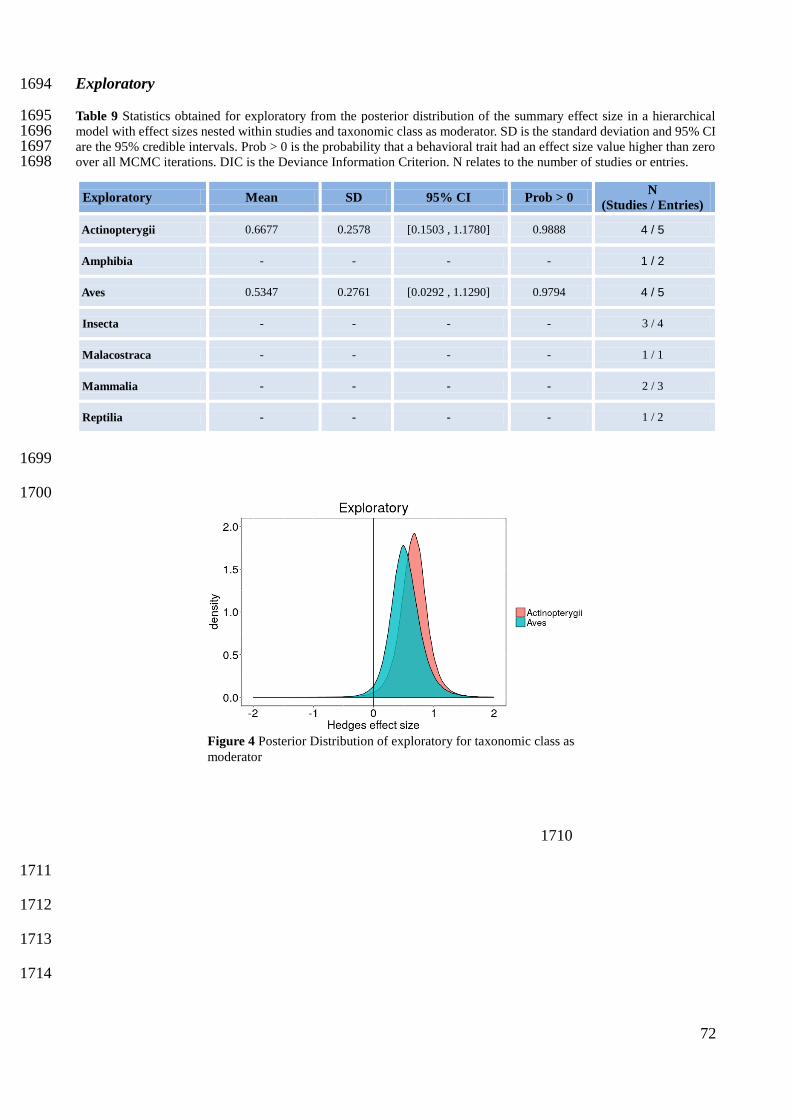
72
Exploratory 1694
Table 9 Statistics obtained for exploratory from the posterior distribution of the summary effect size in a hierarchical 1695 model with effect sizes nested within studies and taxonomic class as moderator. SD is the standard deviation and 95% CI 1696 are the 95% credible intervals. Prob > 0 is the probability that a behavioral trait had an effect size value higher than zero 1697 over all MCMC iterations. DIC is the Deviance Information Criterion. N relates to the number of studies or entries. 1698
1699
1700
1701
1702
1703
1704
1705
1706
1707
1708
1709
1710
1711
1712
1713
1714
Exploratory Mean SD 95% CI Prob > 0 N
(Studies / Entries)
Actinopterygii 0.6677 0.2578 [0.1503 , 1.1780] 0.9888 4 / 5
Amphibia - - - - 1 / 2
Aves 0.5347 0.2761 [0.0292 , 1.1290] 0.9794 4 / 5
Insecta - - - - 3 / 4
Malacostraca - - - - 1 / 1
Mammalia - - - - 2 / 3
Reptilia - - - - 1 / 2
Figure 4 Posterior Distribution of exploratory for taxonomic class as
moderator
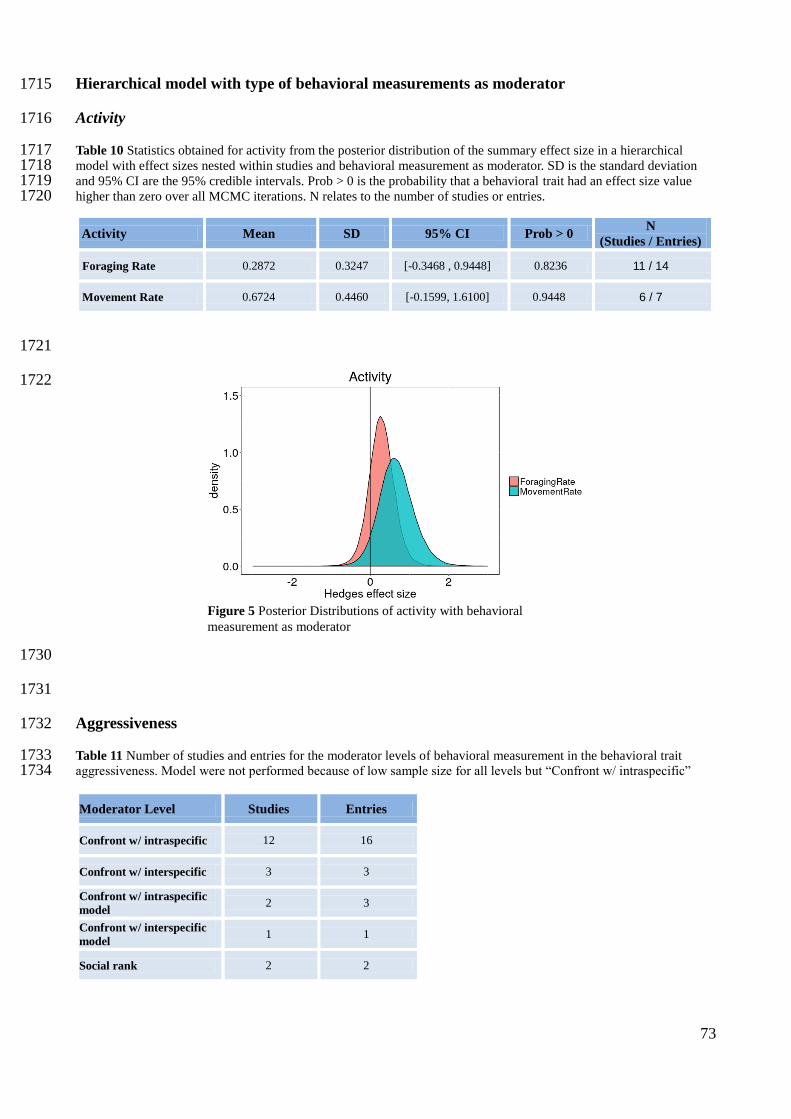
73
Hierarchical model with type of behavioral measurements as moderator 1715
Activity 1716
Table 10 Statistics obtained for activity from the posterior distribution of the summary effect size in a hierarchical 1717 model with effect sizes nested within studies and behavioral measurement as moderator. SD is the standard deviation 1718 and 95% CI are the 95% credible intervals. Prob > 0 is the probability that a behavioral trait had an effect size value 1719 higher than zero over all MCMC iterations. N relates to the number of studies or entries. 1720
1721
1722
1723
1724
1725
1726
1727
1728
1729
1730
1731
Aggressiveness 1732
Table 11 Number of studies and entries for the moderator levels of behavioral measurement in the behavioral trait 1733 aggressiveness. Model were not performed because of low sample size for all levels but “Confront w/ intraspecific” 1734
1735
Figure 5 Posterior Distributions of activity with behavioral
measurement as moderator
Activity Mean SD 95% CI Prob > 0 N
(Studies / Entries)
Foraging Rate 0.2872 0.3247 [-0.3468 , 0.9448] 0.8236 11 / 14
Movement Rate 0.6724 0.4460 [-0.1599, 1.6100] 0.9448 6 / 7
Moderator Level Studies Entries
Confront w/ intraspecific 12 16
Confront w/ interspecific 3 3
Confront w/ intraspecific
model 2 3
Confront w/ interspecific
model 1 1
Social rank 2 2
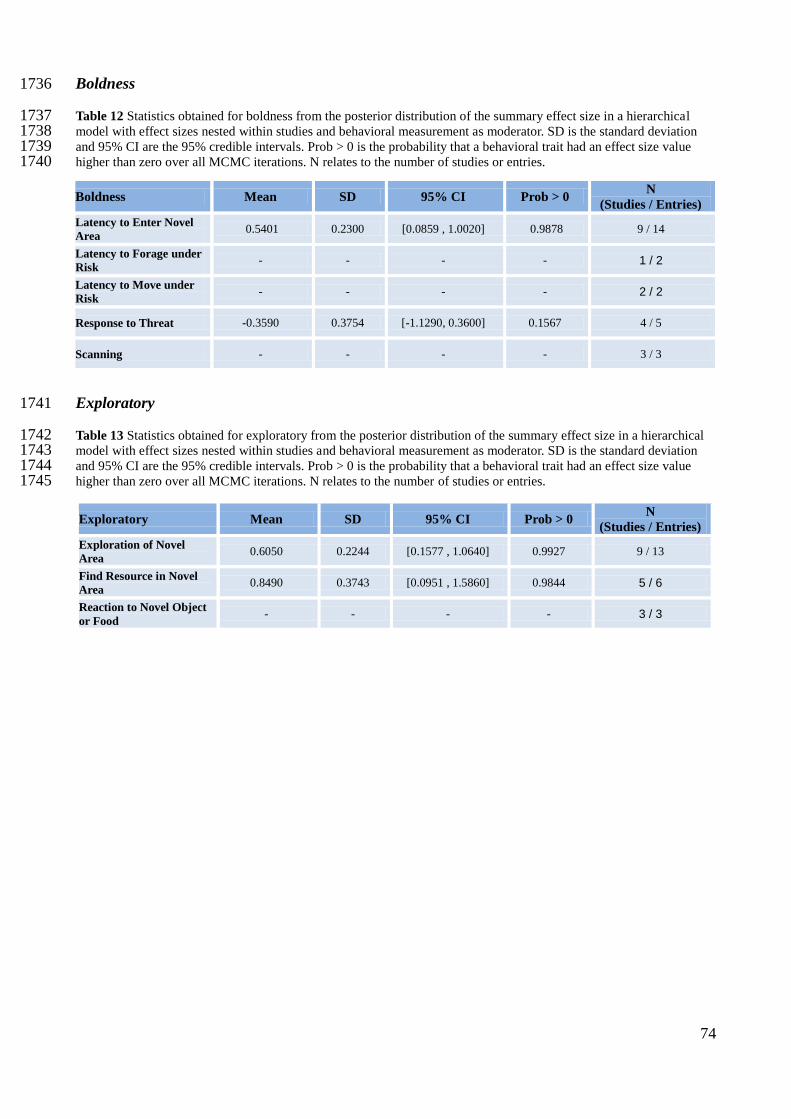
74
Boldness 1736
Table 12 Statistics obtained for boldness from the posterior distribution of the summary effect size in a hierarchical 1737 model with effect sizes nested within studies and behavioral measurement as moderator. SD is the standard deviation 1738 and 95% CI are the 95% credible intervals. Prob > 0 is the probability that a behavioral trait had an effect size value 1739 higher than zero over all MCMC iterations. N relates to the number of studies or entries. 1740
Exploratory 1741
Table 13 Statistics obtained for exploratory from the posterior distribution of the summary effect size in a hierarchical 1742 model with effect sizes nested within studies and behavioral measurement as moderator. SD is the standard deviation 1743 and 95% CI are the 95% credible intervals. Prob > 0 is the probability that a behavioral trait had an effect size value 1744 higher than zero over all MCMC iterations. N relates to the number of studies or entries. 1745
Boldness Mean SD 95% CI Prob > 0 N
(Studies / Entries) Latency to Enter Novel
Area 0.5401 0.2300 [0.0859 , 1.0020] 0.9878 9 / 14
Latency to Forage under
Risk - - - - 1 / 2
Latency to Move under
Risk - - - - 2 / 2
Response to Threat -0.3590 0.3754 [-1.1290, 0.3600] 0.1567 4 / 5
Scanning - - - - 3 / 3
Exploratory Mean SD 95% CI Prob > 0 N
(Studies / Entries) Exploration of Novel
Area 0.6050 0.2244 [0.1577 , 1.0640] 0.9927 9 / 13
Find Resource in Novel
Area 0.8490 0.3743 [0.0951 , 1.5860] 0.9844 5 / 6
Reaction to Novel Object
or Food - - - - 3 / 3
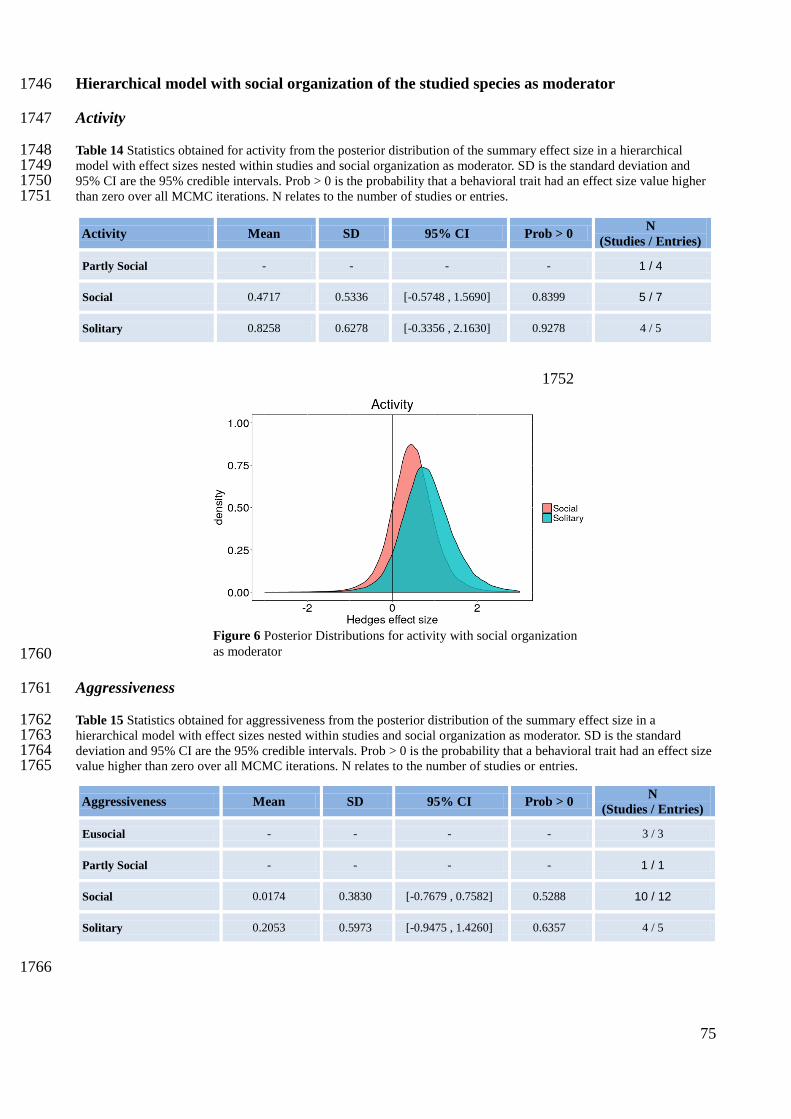
75
Hierarchical model with social organization of the studied species as moderator 1746
Activity 1747
Table 14 Statistics obtained for activity from the posterior distribution of the summary effect size in a hierarchical 1748 model with effect sizes nested within studies and social organization as moderator. SD is the standard deviation and 1749 95% CI are the 95% credible intervals. Prob > 0 is the probability that a behavioral trait had an effect size value higher 1750 than zero over all MCMC iterations. N relates to the number of studies or entries. 1751
1752
1753
1754
1755
1756
1757
1758
1759
1760
Aggressiveness 1761
Table 15 Statistics obtained for aggressiveness from the posterior distribution of the summary effect size in a 1762 hierarchical model with effect sizes nested within studies and social organization as moderator. SD is the standard 1763 deviation and 95% CI are the 95% credible intervals. Prob > 0 is the probability that a behavioral trait had an effect size 1764 value higher than zero over all MCMC iterations. N relates to the number of studies or entries. 1765
1766
Figure 6 Posterior Distributions for activity with social organization
as moderator
Aggressiveness Mean SD 95% CI Prob > 0 N
(Studies / Entries)
Eusocial - - - - 3 / 3
Partly Social - - - - 1 / 1
Social 0.0174 0.3830 [-0.7679 , 0.7582] 0.5288 10 / 12
Solitary 0.2053 0.5973 [-0.9475 , 1.4260] 0.6357 4 / 5
Activity Mean SD 95% CI Prob > 0 N
(Studies / Entries)
Partly Social - - - - 1 / 4
Social 0.4717 0.5336 [-0.5748 , 1.5690] 0.8399 5 / 7
Solitary 0.8258 0.6278 [-0.3356 , 2.1630] 0.9278 4 / 5
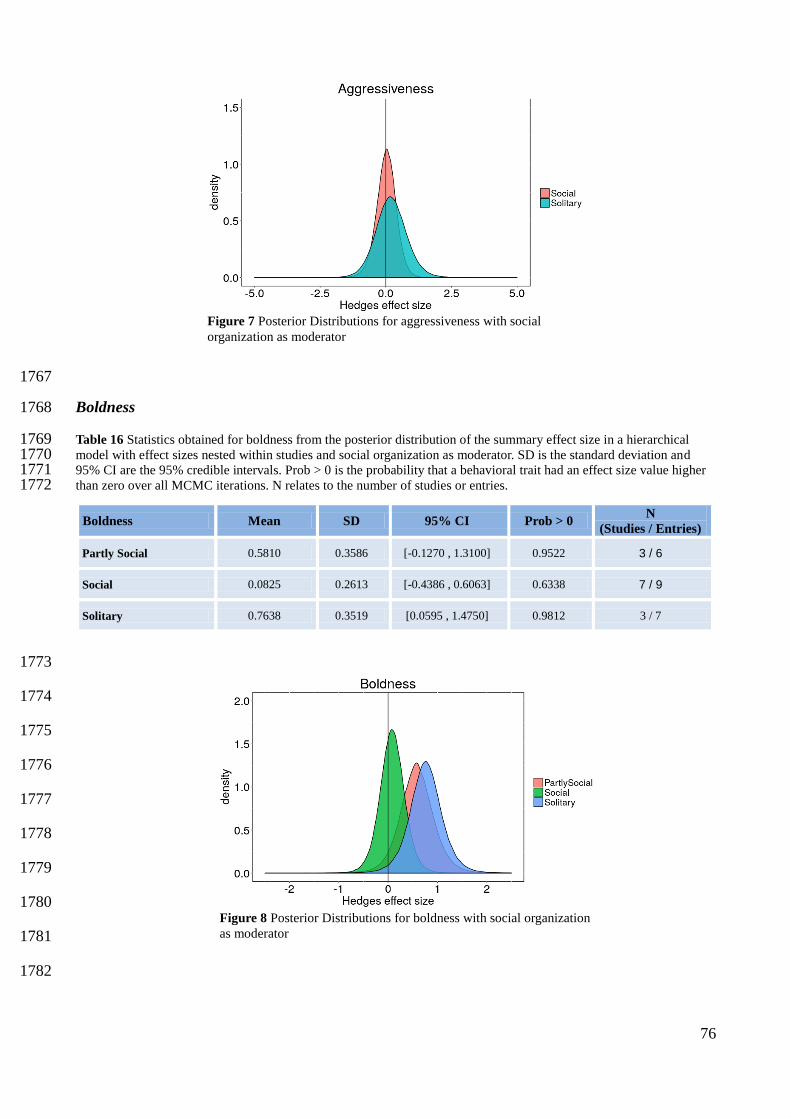
76
1767
Boldness 1768
Table 16 Statistics obtained for boldness from the posterior distribution of the summary effect size in a hierarchical 1769 model with effect sizes nested within studies and social organization as moderator. SD is the standard deviation and 1770 95% CI are the 95% credible intervals. Prob > 0 is the probability that a behavioral trait had an effect size value higher 1771 than zero over all MCMC iterations. N relates to the number of studies or entries. 1772
1773
1774
1775
1776
1777
1778
1779
1780
1781
1782
Figure 7 Posterior Distributions for aggressiveness with social
organization as moderator
Figure 8 Posterior Distributions for boldness with social organization
as moderator
Boldness Mean SD 95% CI Prob > 0 N
(Studies / Entries)
Partly Social 0.5810 0.3586 [-0.1270 , 1.3100] 0.9522 3 / 6
Social 0.0825 0.2613 [-0.4386 , 0.6063] 0.6338 7 / 9
Solitary 0.7638 0.3519 [0.0595 , 1.4750] 0.9812 3 / 7
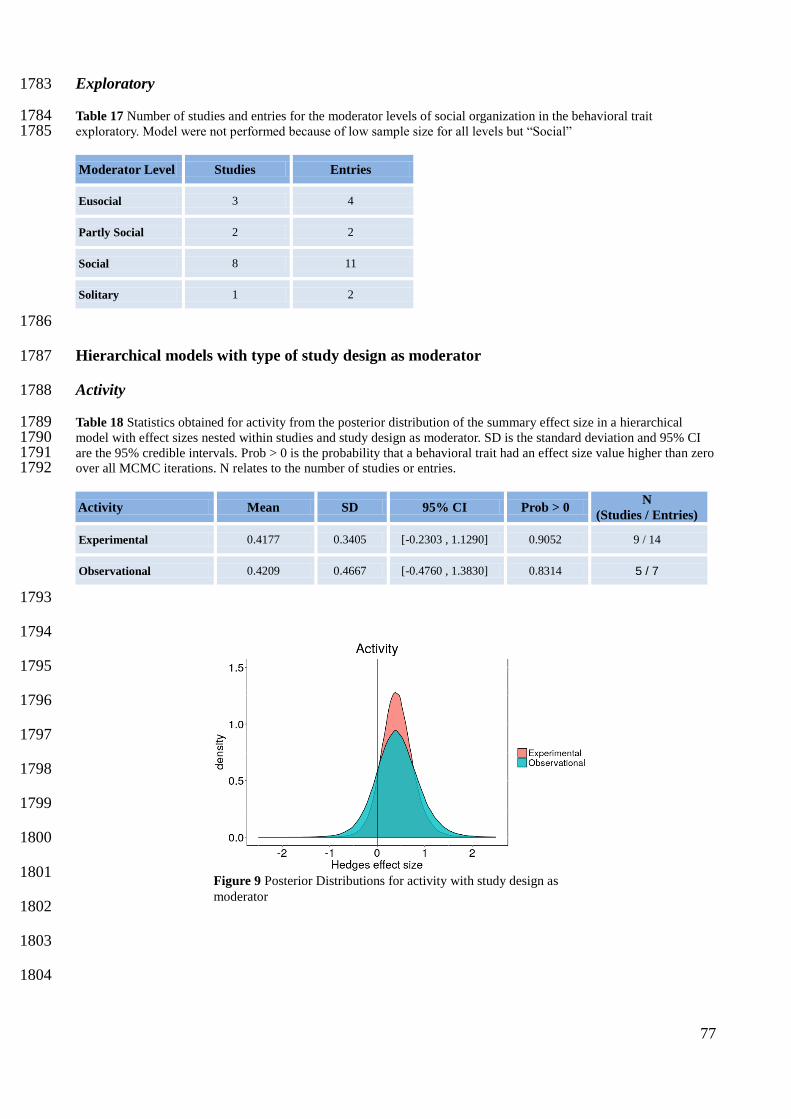
77
Exploratory 1783
Table 17 Number of studies and entries for the moderator levels of social organization in the behavioral trait 1784 exploratory. Model were not performed because of low sample size for all levels but “Social” 1785
Moderator Level Studies Entries
Eusocial 3 4
Partly Social 2 2
Social 8 11
Solitary 1 2
1786
Hierarchical models with type of study design as moderator 1787
Activity 1788
Table 18 Statistics obtained for activity from the posterior distribution of the summary effect size in a hierarchical 1789 model with effect sizes nested within studies and study design as moderator. SD is the standard deviation and 95% CI 1790 are the 95% credible intervals. Prob > 0 is the probability that a behavioral trait had an effect size value higher than zero 1791 over all MCMC iterations. N relates to the number of studies or entries. 1792
Activity Mean SD 95% CI Prob > 0 N
(Studies / Entries)
Experimental 0.4177 0.3405 [-0.2303 , 1.1290] 0.9052 9 / 14
Observational 0.4209 0.4667 [-0.4760 , 1.3830] 0.8314 5 / 7
1793
1794
1795
1796
1797
1798
1799
1800
1801
1802
1803
1804
Figure 9 Posterior Distributions for activity with study design as
moderator
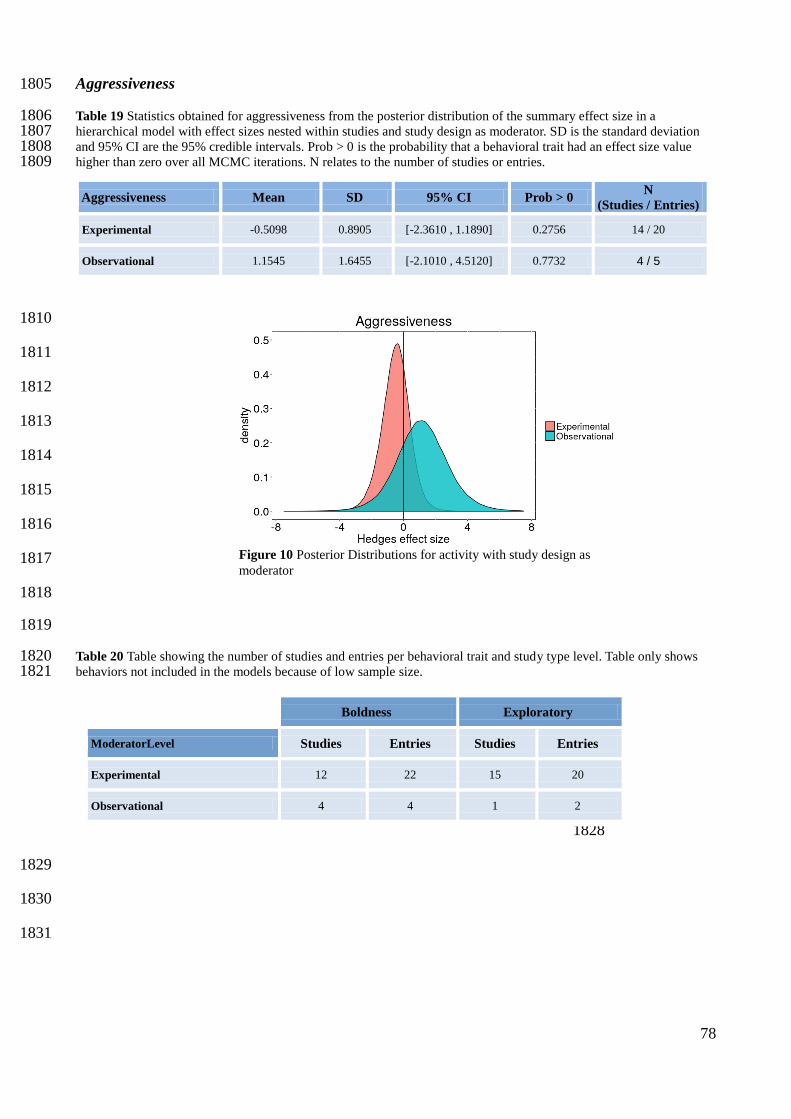
78
Aggressiveness 1805
Table 19 Statistics obtained for aggressiveness from the posterior distribution of the summary effect size in a 1806 hierarchical model with effect sizes nested within studies and study design as moderator. SD is the standard deviation 1807 and 95% CI are the 95% credible intervals. Prob > 0 is the probability that a behavioral trait had an effect size value 1808 higher than zero over all MCMC iterations. N relates to the number of studies or entries. 1809
1810
1811
1812
1813
1814
1815
1816
1817
1818
1819
Table 20 Table showing the number of studies and entries per behavioral trait and study type level. Table only shows 1820 behaviors not included in the models because of low sample size. 1821
1822
1823
1824
1825
1826
1827
1828
1829
1830
1831
Figure 10 Posterior Distributions for activity with study design as
moderator
Aggressiveness Mean SD 95% CI Prob > 0 N
(Studies / Entries)
Experimental -0.5098 0.8905 [-2.3610 , 1.1890] 0.2756 14 / 20
Observational 1.1545 1.6455 [-2.1010 , 4.5120] 0.7732 4 / 5
Boldness Exploratory
ModeratorLevel Studies Entries Studies Entries
Experimental 12 22 15 20
Observational 4 4 1 2
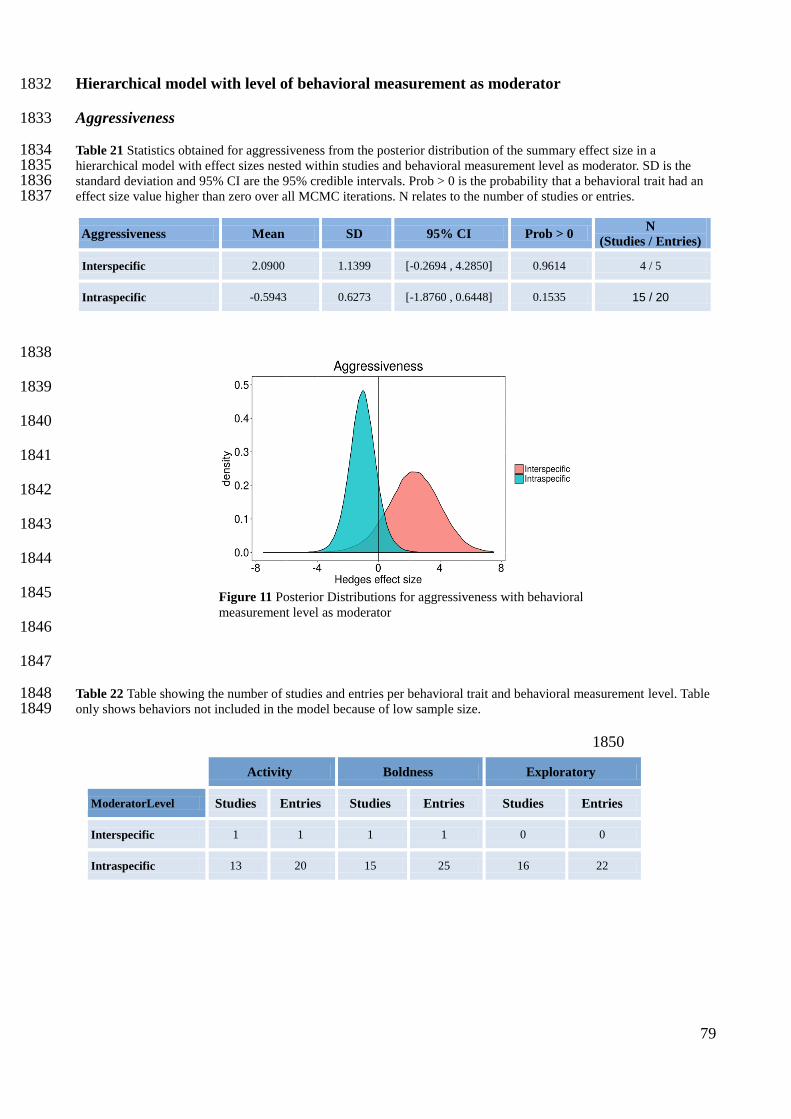
79
Hierarchical model with level of behavioral measurement as moderator 1832
Aggressiveness 1833
Table 21 Statistics obtained for aggressiveness from the posterior distribution of the summary effect size in a 1834 hierarchical model with effect sizes nested within studies and behavioral measurement level as moderator. SD is the 1835 standard deviation and 95% CI are the 95% credible intervals. Prob > 0 is the probability that a behavioral trait had an 1836 effect size value higher than zero over all MCMC iterations. N relates to the number of studies or entries. 1837
1838
1839
1840
1841
1842
1843
1844
1845
1846
1847
Table 22 Table showing the number of studies and entries per behavioral trait and behavioral measurement level. Table 1848 only shows behaviors not included in the model because of low sample size. 1849
1850
1851
1852
1853
1854
Figure 11 Posterior Distributions for aggressiveness with behavioral
measurement level as moderator
Aggressiveness Mean SD 95% CI Prob > 0 N
(Studies / Entries)
Interspecific 2.0900 1.1399 [-0.2694 , 4.2850] 0.9614 4 / 5
Intraspecific -0.5943 0.6273 [-1.8760 , 0.6448] 0.1535 15 / 20
Activity Boldness Exploratory
ModeratorLevel Studies Entries Studies Entries Studies Entries
Interspecific 1 1 1 1 0 0
Intraspecific 13 20 15 25 16 22
80
Sample sizes for trait correlations moderators 1855
1856 Table 22 Table showing the sample size of each correlation moderator for all behavioral traits. Correlations are between 1857 a behavioral traits or between a behavioral trait and body mass 1858
Correlations Activity Aggressiveness Boldness Exploratory Sociability Body Mass
Behavioral Trait Stud Entr Stud Entr Stud Entr Stud Entr Stud Entr Stud Entr
Activity - - 3 3 3 3 0 0 1 1 1 1
Aggressiveness 3 4 - - 2 2 0 0 0 0 3 3
Boldness 3 3 2 2 - - 2 3 1 1 1 1
Exploratory 0 0 0 0 2 3 - - 0 0 2 2
Sociability 1 1 0 0 1 1 0 0 - - 0 0
1859
1860
1861
1862
1863
1864
1865
1866
1867
1868
1869
1870
1871
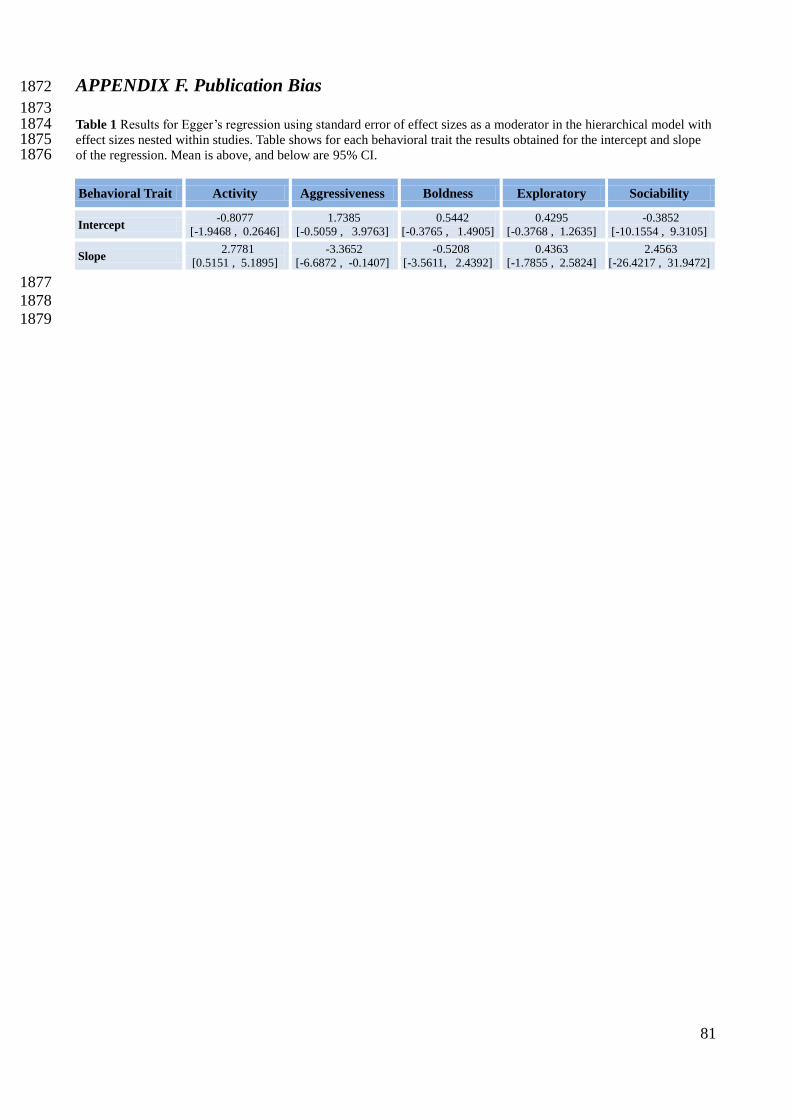
81
APPENDIX F. Publication Bias 1872
1873 Table 1 Results for Egger’s regression using standard error of effect sizes as a moderator in the hierarchical model with 1874 effect sizes nested within studies. Table shows for each behavioral trait the results obtained for the intercept and slope 1875 of the regression. Mean is above, and below are 95% CI. 1876
Behavioral Trait Activity Aggressiveness Boldness Exploratory Sociability
Intercept -0.8077 [-1.9468 , 0.2646]
1.7385 [-0.5059 , 3.9763]
0.5442 [-0.3765 , 1.4905]
0.4295 [-0.3768 , 1.2635]
-0.3852 [-10.1554 , 9.3105]
Slope 2.7781 [0.5151 , 5.1895]
-3.3652 [-6.6872 , -0.1407]
-0.5208 [-3.5611, 2.4392]
0.4363 [-1.7855 , 2.5824]
2.4563 [-26.4217 , 31.9472]
1877
1878
1879