UNIVERSIDADE DE SÃO PAULO INSTITUTO DE FÍSICA DE SÃO ... · A pneumonia é uma das principais...
95
UNIVERSIDADE DE SÃO PAULO INSTITUTO DE FÍSICA DE SÃO CARLOS GIULIA KASSAB Nebulization as a tool for the delivery of photosensitizers in the photodynamic inactivation of respiratory diseases São Carlos 2018
Transcript of UNIVERSIDADE DE SÃO PAULO INSTITUTO DE FÍSICA DE SÃO ... · A pneumonia é uma das principais...
UNIVERSIDADE DE SÃO PAULO
INSTITUTO DE FÍSICA DE SÃO CARLOS
GIULIA KASSAB
Nebulization as a tool for the delivery of photosensitizers in the photodynamic inactivation of
respiratory diseases
São Carlos
2018

GIULIA KASSAB
Nebulization as a tool for the delivery of photosensitizers in the photodynamic inactivation of
respiratory diseases
Dissertation presented to the Graduate
Program in Physics at the Instituto de
Física de São Carlos, Universidade de São
Paulo to obtain the degree of Master of
Science.
Concentration area: Applied Physics
Option: Biomolecular Physics
Advisor: Prof. Dr. Vanderlei Salvador
Bagnato
Corrected Version
(Original version available on the Program Unit)
São Carlos
2018

I AUTHORIZE THE REPRODUCTION AND DISSEMINATION OF TOTAL ORPARTIAL COPIES OF THIS DOCUMENT, BY CONVENCIONAL OR ELECTRONICMEDIA FOR STUDY OR RESEARCH PURPOSE, SINCE IT IS REFERENCED.
Kassab, Giulia Nebulization as a tool for the delivery ofphotosensitizers in the photodynamic inactivation ofrespiratory diseases / Giulia Kassab; advisor VanderleiSalvador Bagnato - revised version -- São Carlos 2018. 93 p.
Dissertation (Master's degree - Graduate Program inFísica Aplicada Biomolecular) -- Instituto de Física de SãoCarlos, Universidade de São Paulo - Brasil , 2018.
1. Nebulization. 2. Photosensitizers. 3. Pulmonarydelivery. 4. Extracorporeal activation. I. Bagnato,Vanderlei Salvador, advisor. II. Title.

to my mom,
who always saw a scientist in me


ACKNOWLEDGEMENTS
I would like to express my gratitude to those that were part of this journey and were
there for me over the past two years. To my advisor, Professor Vanderlei, who trusted me and
allowed me to walk on my own two feet. To the funding agencies CAPES and FAPESP
process #2017/12937-8), and the International Photodynamic Association (IPA), for the
financial support. To Dr. Natalia and Dr. Mariana, who taught me so much, and in a certain
way were my advisors, too. To the forty-five mice that were part of this study.
To the scientific contributions of: Professor Moacir, Dr. Eveline and the student
Alana, from the DQ-UFSCar; Professor Vádila and her student Ana Elisa, from the DEQ-
UFSCar; Professor Alexandra, from UNESP at Araraquara; Professor Cristina, Dr. Didi and
Dr. Lilian, from CEPOF.
To all the support from the CEPOF office, the IFSC graduate service, the IFSC library,
and the labs LAT and LIEPO. To Professor Ricardo, from the DGE-UFSCar, for providing
the equipment. To the support from the colleagues at the Biophotonics lab, especially the ones
in microbiology. To CEPOF, and IFSC as a whole.
To the everlasting room number five: Ila, Pan, Clara and Geisi. You were there when
I was lost around the labs, and now you are my true friends. To other friendships that grew
inside IFSC: Laís, Paula, Shirly and Eva. To Samara, who chose to take her first career steps
beside me.
To all my family, in special: my mother Lucy and my father Francisco, who always
encouraged me to dream big and work hard, and always pushed me into finding my own
answers in a society where so many are taught to obey without question. To my brother Vitor,
who I am so proud of. To my aunts Bruna and Angélica, who taught me what it means to be
an independent, determined woman. To my Godmother Lydia, that never needed a blood
bond to help me pursue my dreams.
To Lis, Mari and Mathias: you are my family in São Carlos and getting here would not
have been possible without our talks, shared coffees and late-night sweets. To Luca, who did
everything he could to help me. To my friends in São Paulo, especially Gui, Cesar and Rod,
who never let the distance drive our friendship apart. Thank you!


“I believe in intuition and inspiration. (…) Imagination is more important than knowledge.
For knowledge is limited, whereas imagination embraces the entire world, stimulating
progress, giving birth to evolution. It is, strictly speaking, a real factor in scientific research.”
Albert Einstein,
in “Cosmic Religion: With Other Opinions and Aphorisms” (1931)


ABSTRACT
KASSAB, G. Nebulization as a tool for the delivery of photosensitizers in the
photodynamic inactivation of respiratory diseases. 2018. 93 p. Dissertation (Master in
Science) - Instituto de Física de São Carlos, Universidade de São Paulo, São Carlos, 2018.
Pneumonia is one of the main causes of death worldwide, specially of the elderly and the
children under 5 years old. The traditional antibiotic-based therapy faces a crisis due to the
increase in resistance and a lack of new molecules approved. Recently, our research group
demonstrated the photodynamic inactivation of streptococcal pneumonia in vivo, a technique
to which the development of resistance is described to be unlikely. This study proposed to
investigate the applicability of nebulization as a delivery method for photosensitizers, in the
hope to advance the research of the photodynamic inactivation of bacterial pneumonia. First,
the critical attributes for nebulization (droplet size and delivery rate), the extent of
nebulization, and the stability of three photosensitizers were stablished, and they were all
found to be compatible with the technique. Then, the delivery was validated in an animal
model using the most promising compound. It was possible to activate it using extracorporeal
infrared light without causing acute lung or liver damage. In conclusion, nebulization
presented itself as a promising tool for the delivery of photosensitizers to the respiratory tract.
Keywords: Nebulization. Photosensitizers. Pulmonary delivery. Extracorporeal activation.


RESUMO
KASSAB, G. Nebulização como uma ferramenta para a entrega de fotossensibilizadores
na inativação fotodinâmica de doenças respiratórias. 2018. 93 p. Dissertação (Mestrado
em Ciências) - Instituto de Física de São Carlos, Universidade de São Paulo, São Carlos,
2018.
A pneumonia é uma das principais causas de morte no mundo, sobretudo de idosos e crianças
menores de cinco anos. A terapia tradicional, baseada em antibióticos, enfrenta uma crise
diante do aumento da resistência e do número reduzido de novas moléculas que são
aprovadas. Recentemente, este grupo de pesquisa demonstrou a inativação fotodinâmica da
pneumonia pneumocócica in vivo, uma técnica para a qual o surgimento de resistência é
descrito como pouco provável. Este estudo se propôs a investigar a aplicabilidade da
nebulização como método de entrega de fotossensibilizadores, na esperança de avançar a
pesquisa da inativação fotodinâmica da pneumonia bacteriana. Inicialmente, os atributos
críticos da nebulização (tamanho de gotícula e taxa de entrega), a extensão da dose
nebulizada, e a estabilidade de três fotossensibilizadores foram estabelecidas. Todos eles se
mostraram compatíveis com a técnica. Então, a entrega foi validada em um modelo animal,
utilizando o composto mais promissor. Foi possível ativá-lo usando luz infravermelha
extracorpórea sem que houvesse dano agudo pulmonar ou hepático. Em conclusão, a
nebulização se mostrou uma ferramenta promissora na entrega de fotossensibilizadores ao
trato respiratório.
Palavras-chave: Nebulização. Fotossensibilizadores. Entrega pulmonar. Ativação
extracorpórea.


LIST OF FIGURES
Figure 1 - Simplified Jablonski diagram. ........................................................................ 29
Figure 2 - Chemical structure of Indocyanine Green (ICG). .......................................... 30
Figure 3 - Chemical Structure of Photodithazine® (PDZ). ............................................. 31
Figure 4 - Basic monomeric structure of Photogem® (PTG). ........................................ 31
Figure 5 - The tissue optical window. Hb: hemoglobin; HbO2: oxygenated
hemoglobin. Note how the relative absorbance varies logarithmically.......... 32
Figure 6 - Normalized absorbance of the three photosensitizers in water. .................... 33
Figure 7 - Deposition of microdroplets into the respiratory system according to
their median diameter. For this model, the author considered the
geometric standard distribution to be 2.2…………. ...................................... 35
Figure 8 - Hypothetical curve of the cumulative frequency for a measurement of
particle size distribution from a nebulizer. The Volume Median
Diameter (VMD) corresponds to a cumulative frequency of 50% of the
droplets. D10 and D90 are the diameters for which the cumulative
frequency is 10% and 90%, respectively. ....................................................... 38
Figure 9 - Nebulizer chamber in jet nebulization. The air flow (blue arrows)
comes from the pump through a tube (in green) and is pushed through
the liquid creating droplets of various sizes. Larger droplets are retained
and smaller droplets are carried out of the chamber towards the
mouthpiece (orange arrow). ............................................................................ 39
Figure 10 - Extent of nebulization for each solution of photosensitizer, being: ICG
50: Indocyanine green 50 μg/mL; ICG 500: Indocyanine green 500
μg/mL; PDZ 50: Photodithazine® 50 μg/mL; PDZ 500: Photodithazine
500 μg/mL; PTG 50: Photogem® 50 μg/mL; PTG 500: Photogem 500
μg/mL. ............................................................................................................ 42
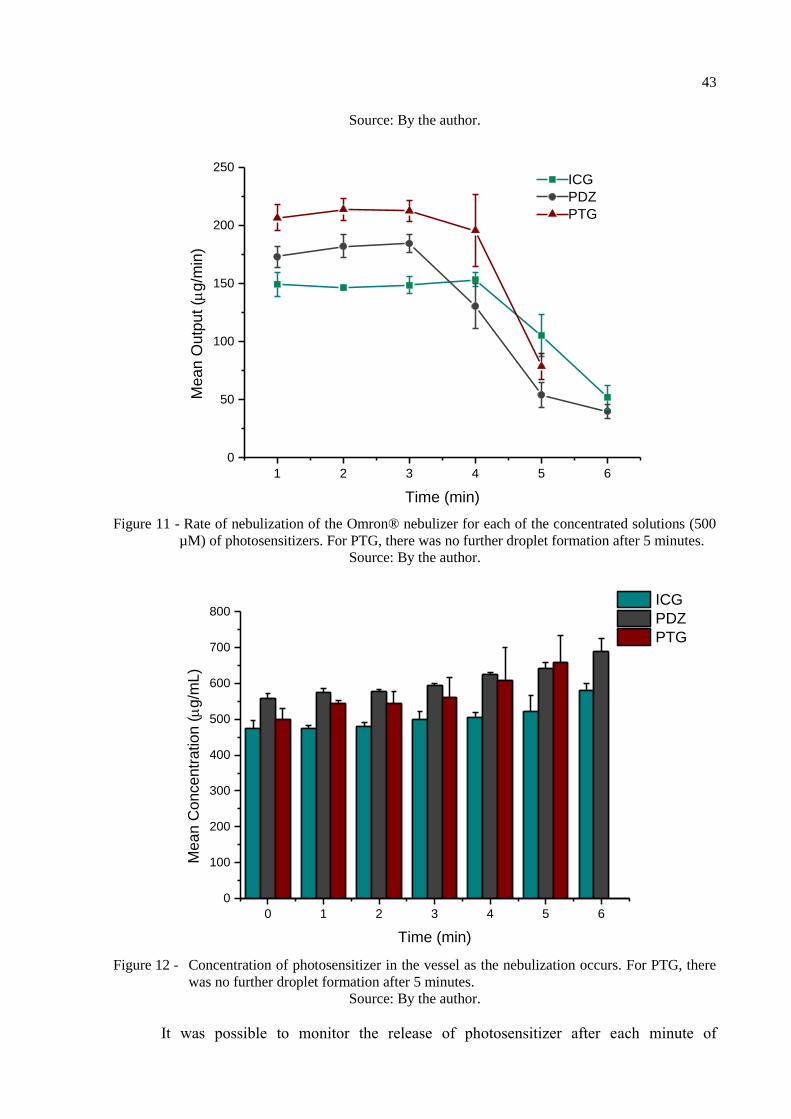
Figure 11 - Rate of nebulization of the Omron® nebulizer for each of the
concentrated solutions (500 µM) of photosensitizers. For PTG, there
was no further droplet formation after 5 minutes. .......................................... 43
Figure 12 - Concentration of photosensitizer in the vessel as the nebulization
occurs. For PTG, there was no further droplet formation after 5 minutes. .... 43
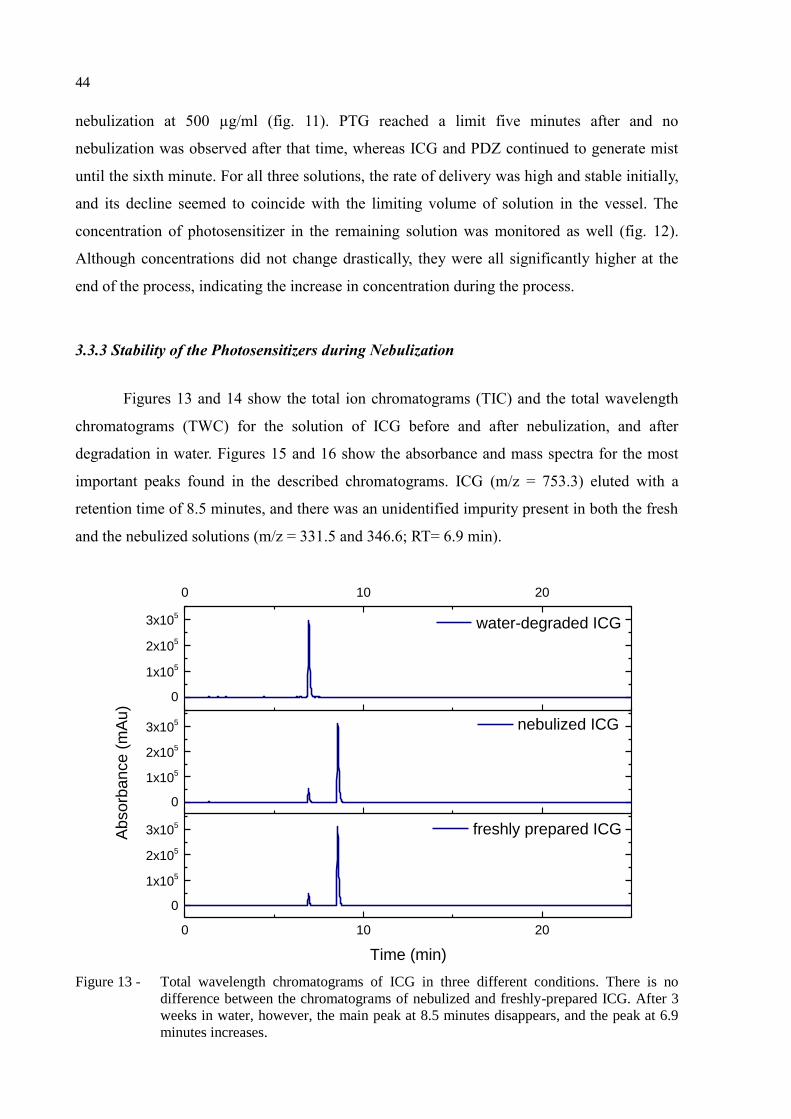
Figure 13 - Total wavelength chromatograms of ICG in three different conditions.
There is no difference between the chromatograms of nebulized and
freshly-prepared ICG. After 3 weeks in water, however, the main peak
at 8.5 minutes disappears, and the peak at 6.9 minutes increases……. ......... 44
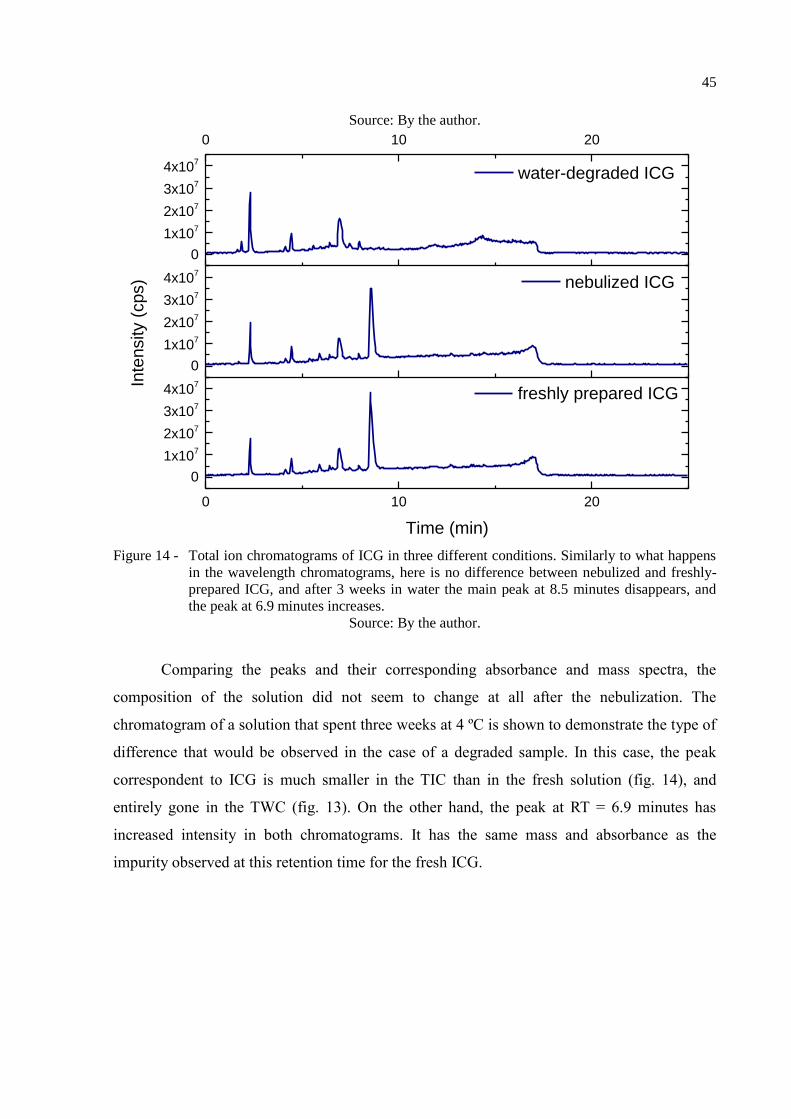
Figure 14 - Total ion chromatograms of ICG in three different conditions. Similarly
to what happens in the wavelength chromatograms, here is no

difference between nebulized and freshly-prepared ICG, and after 3
weeks in water the main peak at 8.5 minutes disappears, and the peak at
6.9 minutes increases. ..................................................................................... 45
Figure 15 - Overlap of the absorbance spectra obtained from the two interest peaks
in the wavelength chromatogram of ICG. The two spectra are quite
similar, with the highest absorbance at around 780 nm. RT: retention
time.................................................................................................................. 46
Figure 16 - Comparison between the mass spectra obtained from the two interest
peaks in the wavelength chromatogram of ICG. The peak with the
retention time (RT) of 8.5 minutes has a predominant m/z value of
753.3, and the peak at 6.9 min has predominant m/z values of 331.5 and
346.6…… ........................................................................................................ 46
Figure 17 - Custom-made illumination device for the photodynamic treatment of
mice. It is composed of 18 laser diodes with maximum emission at 780
nm. The arrows indicate the laser beam propagation. ..................................... 52
Figure 18 - Extracorporeal detection of fluorescence with the fiber optics setup. The
red exes mark the spots where the measurements were taken. ....................... 53
Figure 19 - Isolation of the lung lobes for analysis. A knot was tied on the location
indicated by the black line, so that the bronchoalveolar lavage would
reach only the left lobe. The lobes on the right side (superior, middle,
inferior and post-caval) were collected for histology. .................................... 56
Figure 20 - Fluorescence signal detected with the experimental setup of a solution
of ICG 1.3 mM soon after its preparation, and after complete
degradation of its main compound. ................................................................. 58
Figure 21 - Infrared images of the animals after receiving each of the treatments in
experiment 1. The first row shows the left side, the second to the back,
and the third the right side. The arrows indicate the spots where the
fluorescence of ICG was observed. ................................................................. 59
Figure 22 - Infrared images of the animals that received each of the treatments from
experiment 1, exposing the organs after the euthanasia. Organs in which
fluorescence was evident are indicated with the black arrows. ...................... 60
Figure 23 - Relative fluorescence detected externally over time on a single animal
that received nebulization of ICG 800 µM in experiment 2. There was
no significant difference between the three sites, so the averages are
shown. ............................................................................................................. 60
Figure 24 - Relative fluorescence detected externally over time on animals that
received nebulization with the increased concentration of ICG with
(PDI) and without (ICG) exposure to infrared light (experiment 4). The
horizontal bars indicate the duration of each of the treatments. The
difference between treatments is statistically significant at 20 and 40
minutes. ........................................................................................................... 61

Figure 25 - Relative fluorescence detected externally over time on each of the three
positions for animals that received nebulization with the increased
concentration of ICG with (PDI) and without (ICG) exposure to
infrared light (experiment 4). There is no significant difference between
positions for a given time and treatment combination. The difference
between treatments is significant at 20 and 40 minutes for all positions. ...... 61
Figure 26 - Relative fluorescence detected externally at different times after the
treatments from experiment 5: ICG 800 μM with (PDI) and without
(ICG) exposure to 72 J/cm² of infrared light. There was no significant
difference between the three sites, so the averages are shown. ...................... 62
Figure 27 - Relative fluorescence detected directly at the exposed organs of interest
at different times after the treatments from experiment 5: ICG 800 μM
with (PDI) and without (ICG) exposure to 72 J/cm² of infrared light. ........... 64
Figure 28 - Relative fluorescence detected directly in the bladder, spleen and heart
at different times after the treatments from experiment 5: ICG 800 μM
with (PDI) and without (ICG) exposure to 72 J/cm² of infrared light. ........... 65
Figure 29 - Summary of the relative fluorescence detected directly in the organs
over time after each treatment from experiment 5: ICG 800 μM with
(PDI) and without (ICG) exposure to 72 J/cm² of infrared light. ................... 66
Figure 30 - Correlation between the fluorescence detected externally on each side,
and the fluorescence detected directly in the corresponding lung of the
same animal. Data from the control, ICG and PDI groups from
experiment 5: ICG 800 μM with (PDI) and without (ICG) exposure to
72 J/cm² of infrared light. ............................................................................... 67
Figure 31 - Representative histological slides of the lungs from control and treated
animals from experiment 3, with increasing magnification. Both groups
showed healthy tissue, and there was no difference between them. The
scale bars correspond to 2000 μm (10x), 200 μm (100x) and 50 μm
(400x). ............................................................................................................ 68
Figure 32 - Representative histological slides of the lungs of each group in
experiment 4, with increasing magnification. All animals had some
level of lung injury, but the sick positive controls (C+) had higher
scores than any other group. Note the patches of alveolar thickening in
the 10-fold magnification pictures. The 100-fold magnification shows
the contrast between the healthy tissue, with ample air pockets, and the
dense injured tissue. The vascular congestion is more evident in the
400-fold magnification. The scale bars correspond to 2000 μm (10x),
200 μm (100x) and 50 μm (400x). .................................................................. 69
Figure 33 - Representative histological slides of the lungs from each group in
experiment 5, with increasing magnification. All animals had some
level of lung injury, and the groups were indistinguishable from one
another. Note the patches of alveolar thickening in the 10-fold
magnification pictures. The degree of vascular congestion varied from
animal to animal (see the 400-fold magnification), but there was no
difference between the groups. The scale bars correspond to 2000 μm
(10x), 200 μm (100x) and 50 μm (400x). ....................................................... 70
Figure 34 - Representative histological slides from the livers of the groups in
experiment 5, with increasing magnification. There was no difference
between the groups. The scale bars correspond to 200 μm (100x) and 50
μm (400x). ....................................................................................................... 71
Figure 35 - Percentage of macrophages in the bronchoalveolar lavage fluid from the
animals at different times after either ICG alone or PDI. There was no
significant difference between groups……… ................................................ 72
Figure 36 - Comparison of selected models of acute lung injury. A and B: normal
mouse lungs. The alveolar walls are very thin, and the majority of the
alveoli contain no cells (magnification in A, 100x; B, 400x). C and D:
lungs from a mouse euthanized 18 h after intratracheal instillation of 5
ng/g lipopolysaccharide. Note the patchy nature of the injury (C, 100x)
and the presence of inflammatory infiltrates and vascular congestion (D,
400x). E and F: lungs from a mouse euthanized 21 days after the
administration of intratracheal bleomycin. Note the presence of fibrotic
areas (arrows) (E, 200x; F, 400x). G and H: lungs from a mouse
euthanized 12 h after aerosolization of Escherichia coli, 1 x 10⁸
CFU/mL. Note diffuse thickening of the alveolar spaces and intra-
alveolar neutrophilic infiltrates (G, 200x; H, 400x). HE stain. ....................... 78
Figure 37 - Histopathology of mice treated with 5 mg/kg of talaporfin sodium
(Laserphyrin®) and 50 J/cm² of light (664 nm laser) including the
tumor and adjacent normal liver tissue. The regional boundary line
between the laser radiation area and the outside was clear (a). The
bottom row of pictures shows: the tumor (b); ischemic necrosis and
focally living hepatocytes around Glisson in the peripheral area of the
irradiation (c); and the slight denatured hepatocytes around the
irradiation area (d). HE stain. .......................................................................... 79

LIST OF TABLES
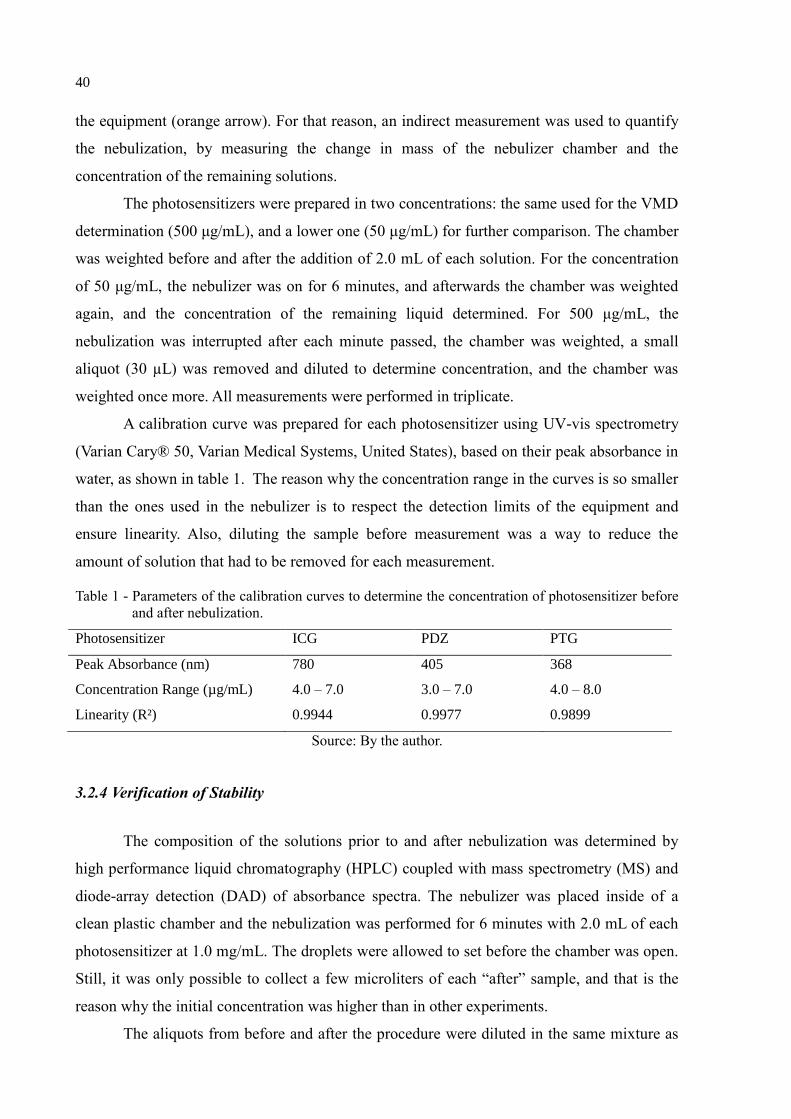
Table 1 - Parameters of the calibration curves to determine the concentration of
photosensitizer before and after nebulization. ....................................................... 40
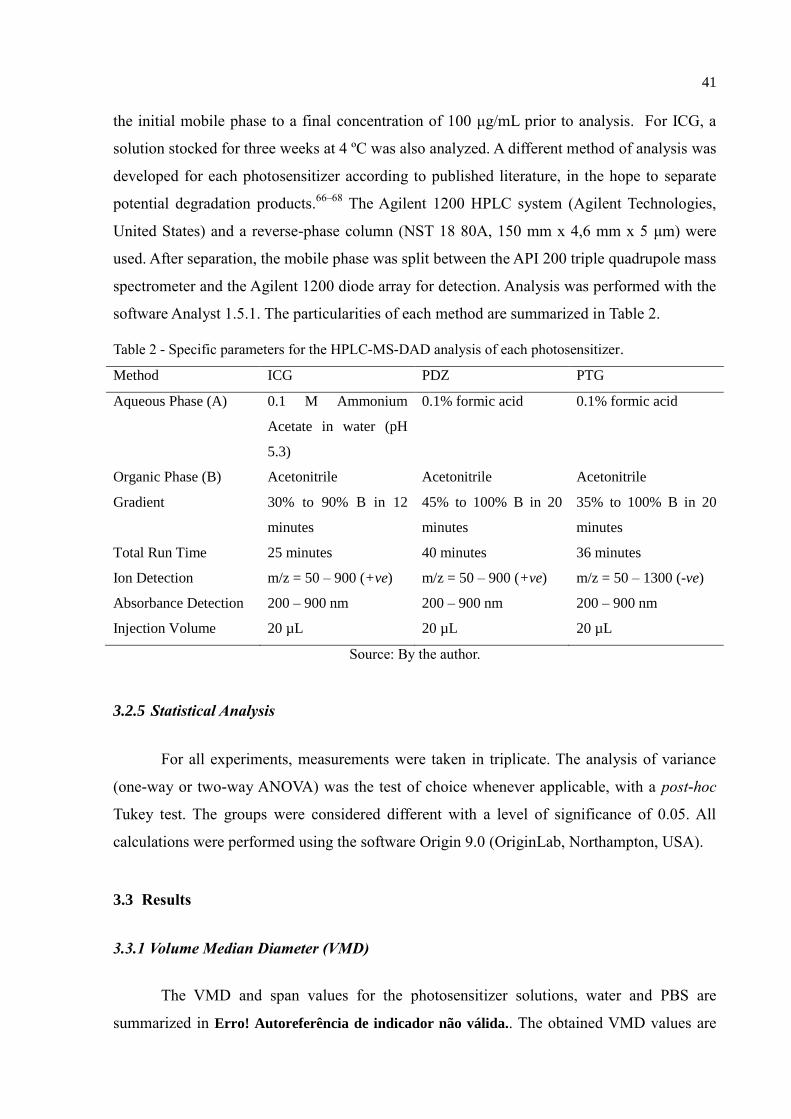
Table 2 - Specific parameters for the HPLC-MS-DAD analysis of each
photosensitizer. ...................................................................................................... 41
Table 3 - VMD and span of the droplets formed by the Omron NE-C801 jet nebulizer
for each of the tested solutions. ............................................................................. 41
Table 4 – Groups of experiment 4. The exes mark the treatments received by each
group. ..................................................................................................................... 54

LIST OF ABREVIATIONS AND ACRONYMS
ANOVA Analysis of Variance
APC Allophycocyanin
A.u. Absorbance units
BALF Bronchoalveolar lavage
C- Negative control
C+ Positive control
CAP Community acquired pneumonia
CD16 Cluster of differentiation 16
CD32 Cluster of differentiation 32
CD45 Cluster of differentiation 45
CFU Colony-forming units
cps Counts per second
CQAs Critical quality attributes
D10 Diameter value for a cumulative frequency of 10%
D90 Diameter value for a cumulative frequency of 90%
DAD Diode-array detection
FSC Forward scattering
HAP Hospital acquired pneumonia
Hb Hemoglobin
HbO2 Oxygenated hemoglobin
HE Hematoxylin and eosin
HPLC High performance liquid chromatography
ICG Indocyanine green
LED Light-emitting diode
MMAD Mass median aerodynamic diameter
MRSA Methicillin-resistant Staphylococcus aureus
MS Mass spectrometry
PBS Phosphate buffer solution
PCVs Pneumococcal conjugate vaccines
PDI Photodynamic inactivation
PDT Photodynamic therapy
PDZ Photodithazine®
PPV Pneumococcal polysaccharide vaccine
PTG Photogem®
RI Refractive index
ROS Reactive oxygen species
rpm Rotations per minute
RT Retention time
SSC Side scattering
TIC Total ion chromatogram
TWC Total wavelength chromatogram
UV-Vis Ultraviolet and visible light
VAP Ventilator-associated pneumonia
VMD Volume median diameter

LIST OF SYMBOLS
¹O2 Singlet oxygen
³O2 Triplet oxygen
ℎ𝜈 Light
𝜙𝑇 Triplet state quantum yield
𝜙𝐹 Fluorescence quantum yield
𝜆𝑚𝑎𝑥 Wavelength of maximum absorbance
𝑚/𝑧 Mass-to-charge ratio
+𝑣𝑒 Positive
−𝑣𝑒 Negative
− Absent
+ Mildly present
+ + Moderately present
+ + + Extensively present


CONTENTS
1 INTRODUCTION ......................................................................................................................... 25
1.1 Objectives .......................................................................................................................... 26
2 LITERATURE REVIEW ............................................................................................................ 27
2.1 Current challenges in the treatment of bacterial pneumonia ...................................... 27
2.2 Photodynamic inactivation of microorganisms ............................................................. 28
2 .2.1 Mechanism................................................................................................................................. 29
2.2.2 Photosensitizers ......................................................................................................................... 30
2.2.3 Light sources and light penetration ....................................................................................... 32
2.2.4 Photodynamic Inactivation of S. pneumoniae using indocyanine green and infrared
light……………………………………………………………………………………..33
2.3 Respiratory delivery via nebulization ............................................................................. 33
2.3.1 Types of Nebulizers ................................................................................................................... 34
2.3.2 Characteristics of an ideal drug for nebulization ............................................................... 34
3 EFFICACY OF THE NEBULIZATION OF DIFFERENT PHOTOSENSITIZERS .... 37
3.1 Purpose .............................................................................................................................. 37
3.2 Methodology ...................................................................................................................... 37
3.2.1 Materials ..................................................................................................................................... 37
3.2.2 Determination of the volume median diameter (VMD) ..................................................... 38
3.2.3 Rate and extent of nebulization .............................................................................................. 39
3.2.4 Verification of Stability ............................................................................................................ 40
3.2.5 Statistical Analysis .................................................................................................................... 41
3.3 Results ................................................................................................................................ 41
3.3.1 Volume Median Diameter (VMD) .......................................................................................... 41
3.3.2 Rate and Extent of Nebulization ............................................................................................ 42
3.3.3 Stability of the Photosensitizers during Nebulization......................................................... 44
3.4 Discussion .......................................................................................................................... 47
3.5 Conclusion ......................................................................................................................... 49
4 NEBULIZATION AND EXTRACORPOREAL ACTIVATION OF INDOCYANINE
GREEN IN VIVO ........................................................................................................................... 51
4.2 Purpose .............................................................................................................................. 51
4.2 Methodology ...................................................................................................................... 51
4.2.1 Animal Model ............................................................................................................................ 51
4.2.2 Materials and Devices .............................................................................................................. 52
4.2.3 Experimental Procedures and Data Collection .................................................................. 53
4.2.3.1 Experiment 1: Infrared imaging detection of nebulized vs instilled ICG ...................... 53
4.2.3.2 Experiment 2: Extracorporeal monitoring of photosensitizer delivery over time......... 53
4.2.3.3 Experiment 3: Tissue damage and immune response to the treatment .......................... 54
4.2.3.4 Experiment 4: Tissue damage and treatment monitoring with an increased dose of
ICG……. .................................................................................................................................... 54
4.2.3.5 Experiment 5: Body distribution of lung-delivered ICG with and without exposure to
light and time-dependency of the tissue and immune response .......................................... 55
4.2.4 Fluorescence Data Processing ............................................................................................... 56
4.2.5 Flow Cytometry ......................................................................................................................... 56
4.2.6 Histological Analysis ............................................................................................................... 57
4.3 Results ............................................................................................................................... 58
4.3.1 Selective Fluorescence of ICG with excitation at 780 nm ................................................ 58
4.3.2 Delivery of ICG via Nebulization versus Instillation ........................................................ 58
4.3.3 Extracorporeal Detection and Activation of the Nebulized ICG in the Lungs .............. 60
4.3.4 Body Distribution of the Photosensitizer ............................................................................. 62
4.3.5 Tissue Damage and Immune Response ............................................................................... 68
4.4 Discussion .......................................................................................................................... 72
4.5 Conclusion......................................................................................................................... 80
5 CONCLUSIONS............................................................................................................................. 81
REFERENCES ............................................................................................................................... 83
APPENDIX A – Chromatograms of the photosensitizer solutions before and after
nebulization ..................................................................................................................................... 91
ANNEX A – Certificate of Approval from the Ethics Committee ...................................... 93

25
1 INTRODUCTION
Pneumonia is one of the main causes of death worldwide, specially of the elderly and
the children under 5 years of age.1-2
Since it is mainly caused by bacteria, the treatment
usually includes antibiotics.2 However, the antibiotic-based therapy faces a crisis due to the
increase in resistance and a lack of new molecules.3 A promising alternative to this approach
is photodynamic inactivation (PDI), the microbiological application of photodynamic therapy
(PDT), to which the development of resistance is described to be unlikely.4 PDI is based on
the combination of a photosensitizer, light at a certain wavelength, and molecular oxygen, to
generate reactive oxygen species (ROS) that cause cell death.4
Since 2013, our research group studies the applicability of PDI in the treatment of
streptococcal pneumonia, using the photosensitizer indocyanine green (ICG) and
extracorporeal activation with infrared light. The initial in vitro studies showed that it was
possible to eliminate S. pneumoniae using doses of ICG and light that were unharmful to
macrophages.5 Moreover, there was evidence that the PDI could potentialize the antimicrobial
activity of such macrophages during the infection.5
In the in vivo studies, a single session of PDI was enough to reduce the bacterial
burden and increase the survival rate of previously infected mice.6 However, ICG was
delivered to the mice using instillation, which has the benefits of being local, but is
uncomfortable and not well accepted in the clinical practice.6 Within our program of lung
decontamination, efficient photosensitizer delivery to the airways is a key point, so this study
proposed to investigate the applicability of nebulization as a method of delivering
photosensitizers to the respiratory tract for the PDI of respiratory pathogens.
Nebulization is widely used in the medical practice, since it allows the drug to reach
the target site directly, reducing the required dose and limiting the side effects.7 Nebulized
antibiotics have been part of a successful regimen for the management of cystic fibrosis, and
have shown promising results in the treatment of ventilator-associated pneumonia.8 Plus, the
equipment is available at hospitals, and already part of the usual management of pneumonia in
children.9 However, the only publication that we were able to find so far that investigates
nebulization for the photodynamic inactivation of pathogens is a pilot study from 2011, in
which the properties of a nebulized methylene blue solution were assessed in an ex vivo
model.10
This motivated the study of the compatibility between nebulization and other
photosensitizers, in particular those that had potential to be activated externally. Three

26
photosensitizers were chosen based on their absorbance spectra and activity against
microorganisms: ICG, the chlorin derivative Photodithazine® (PDZ), and the porphyrin
derivative Photogem® (PTG).
1.1 Objectives
The primary objective of this study was to determine the efficacy of nebulization as a
delivery method for photosensitizers. For that, it proposed to:
Assess the critical attributes for nebulization (droplet size and delivery rate),
the extent of nebulization, and the stability of the photosensitizers ICG, PDZ
and PTG during the process;
Validate the nebulization delivery of ICG to the lungs, measure its body
distribution, and evaluate the toxicity and the immune response to a simulated
PDI treatment in a murine model.
27
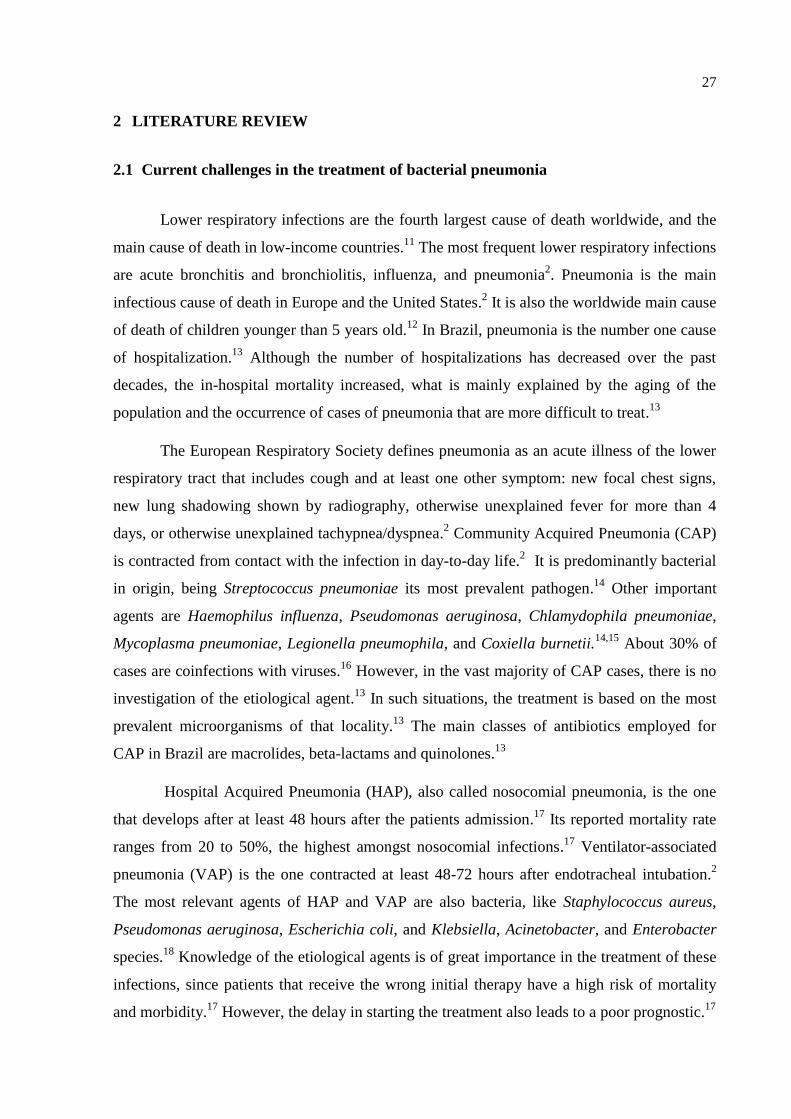
2 LITERATURE REVIEW
2.1 Current challenges in the treatment of bacterial pneumonia
Lower respiratory infections are the fourth largest cause of death worldwide, and the
main cause of death in low-income countries.11
The most frequent lower respiratory infections
are acute bronchitis and bronchiolitis, influenza, and pneumonia2. Pneumonia is the main
infectious cause of death in Europe and the United States.2 It is also the worldwide main cause
of death of children younger than 5 years old.12
In Brazil, pneumonia is the number one cause
of hospitalization.13
Although the number of hospitalizations has decreased over the past
decades, the in-hospital mortality increased, what is mainly explained by the aging of the
population and the occurrence of cases of pneumonia that are more difficult to treat.13
The European Respiratory Society defines pneumonia as an acute illness of the lower
respiratory tract that includes cough and at least one other symptom: new focal chest signs,
new lung shadowing shown by radiography, otherwise unexplained fever for more than 4
days, or otherwise unexplained tachypnea/dyspnea.2 Community Acquired Pneumonia (CAP)
is contracted from contact with the infection in day-to-day life.2 It is predominantly bacterial
in origin, being Streptococcus pneumoniae its most prevalent pathogen.14
Other important
agents are Haemophilus influenza, Pseudomonas aeruginosa, Chlamydophila pneumoniae,
Mycoplasma pneumoniae, Legionella pneumophila, and Coxiella burnetii.14,15
About 30% of
cases are coinfections with viruses.16
However, in the vast majority of CAP cases, there is no
investigation of the etiological agent.13
In such situations, the treatment is based on the most
prevalent microorganisms of that locality.13
The main classes of antibiotics employed for
CAP in Brazil are macrolides, beta-lactams and quinolones.13
Hospital Acquired Pneumonia (HAP), also called nosocomial pneumonia, is the one
that develops after at least 48 hours after the patients admission.17
Its reported mortality rate
ranges from 20 to 50%, the highest amongst nosocomial infections.17
Ventilator-associated
pneumonia (VAP) is the one contracted at least 48-72 hours after endotracheal intubation.2
The most relevant agents of HAP and VAP are also bacteria, like Staphylococcus aureus,
Pseudomonas aeruginosa, Escherichia coli, and Klebsiella, Acinetobacter, and Enterobacter
species.18
Knowledge of the etiological agents is of great importance in the treatment of these
infections, since patients that receive the wrong initial therapy have a high risk of mortality
and morbidity.17
However, the delay in starting the treatment also leads to a poor prognostic.17

28
A great concern in HAP and VAP cases is the present of methicillin-resistant
Staphylococcus aureus (MRSA), which is associated with elevated mortality rates and
treatment costs.19
Traditionally, the first-choice drug for MRSA infections is vancomycin, that
due to its low penetration in the lungs and high renal toxicity, leads to a failure rate the can
reach 70%.19
Even with new drugs like linezolid, tigecycline and ceftaroline, persists the difficulty
in increasing the success rate of treatments, and the worry with the development of
resistance.19-20
Linezolid, for example, was approved for clinical use in 2000, and cases of
resistance in patients were reported as early as 2002.21
In a study from 2014, the occurrence of
non-susceptibility to this antibiotic remained relatively low, but a number of different
resistance mechanisms had already been observed by then.21
Another approach to hinder the burden of pneumonia is vaccination. Two types of
vaccines are currently available for S. pneumoniae, the main agent in CAP: the pneumococcal
polysaccharide vaccine (PPV) has been recommended for adults since the mid-1980’s, but it
lacks efficacy in neonates and infants;22
the pneumococcal conjugate vaccines (PCVs),
designed to overcome that, were first approved in 2000.23
However, pneumococcal
vaccination faces two main challenges: first, each vaccine is only effective against the
serotypes contained in it; second, the reduction of the said serotypes increases the
colonization of other serotypes that are not covered by the vaccines, and of other pathogen
species like S. aureus and H. influenza.22
Thus, new vaccines need to be developed
continuously, similarly to what happens to antibiotics.22
2.2 Photodynamic inactivation of microorganisms
The photodynamic inactivation (PDI) of microorganisms was first described in 1900 by
Oscar Raab.24
It is based in the use of a photosensitizer that accumulates preferably in the
pathogens, and that is activated by light at a specific wavelength, and in the presence of
molecular oxygen generates reactive species that are toxic to the target.3 PDI is particularly
interesting for fighting infections because there is no evidence of cross-resistance with
antibiotics, and the restriction of the light exposure offers a further degree of selectivity.24-25
More than that, since PDI can damage a variety of molecules, unlike the target-specific

29
antibiotics, the development of resistance of previously-susceptible strains to this treatment is
described as highly unlikely.4
2.2.1 Mechanism
The photodynamic process starts with an electron transfer to a higher energy orbital
after the absorption of the light.27
The excited molecule may dissipate this energy emitting
fluorescence, or go through an intersystem crossing and go to a triplet state.27
From there, the
energy can be dissipated non-radioactively, or generate toxicity through either of two
mechanisms: in the type I reaction, the photosensitizer reacts with adjacent organic molecules
and forms reactive oxygen species (ROS); in the type II reaction, there is an energy transfer to
the molecular oxygen, which is a triplet in its basal state (3O2), and it goes to a singlet state
(¹O2).27
Both reactions contribute to the phototoxic effect, and both singlet oxygen and the
ROS have short half-life times, limiting their diffusion and therefore the effect of the PDI to
the site of light exposure.28,29
The Jablonski diagram illustrates this mechanism (fig.1.).
Figure 1 - Simplified Jablonski diagram.
Source: By the author.

30
2.2.2 Photosensitizers
Figure 2 - Chemical structure of Indocyanine Green (ICG).
Source: By the author.
Indocyanine Green (fig. 2) is a water-soluble dye that emits fluorescence when exposed to
infrared light.30
Its absorption peak in human plasma is 805 nm.31
The fluorescence quantum
yield of ICG is 𝜙𝐹 = 0,027 ± 0,005, and its triplet state quantum yield is 𝜙𝑇 > 0,01.31
ICG
is used in the diagnosis of cancers, the determination of the cardiac debt and liver function,
and in ophthalmic angiography.31-32
It is not ideal for the photodynamic therapy of cancers
because of its short half-life time in the blood.32
However, studies employing ICG for the
elimination of microorganisms through PDI have had promising results in vitro and in vivo.33–
35
Photodithazine® (fig. 3) is the N-methyl glucosamine salt of chlorin e6 and therefore is a
chlorophyll derivative.36
The glucosamine moiety provides better water solubility to the
chlorin e6, and it is eliminated in acid pH.37-38
PDZ absorbs greatly in the red region, with
𝜆𝑚𝑎𝑥 = 662 𝑛𝑚, and penetrates well into biological tissue.36
It also has a greater
photodynamic efficiency than well-established photosensitizers like Photofrin®.39
Clinical
trials of this drug for the treatment of tumors showed low dark toxicity, high selectivity and
phototoxicity, and fast clearance.38
PDZ was shown to be effective against a multispecies
biofilm containing Candida albicans, Candida glabrata and Streptococcus mutans in vitro
after irradiation with LED light at 660 nm.40
31
Figure 3 - Chemical Structure of Photodithazine® (PDZ).
Source: By the author.
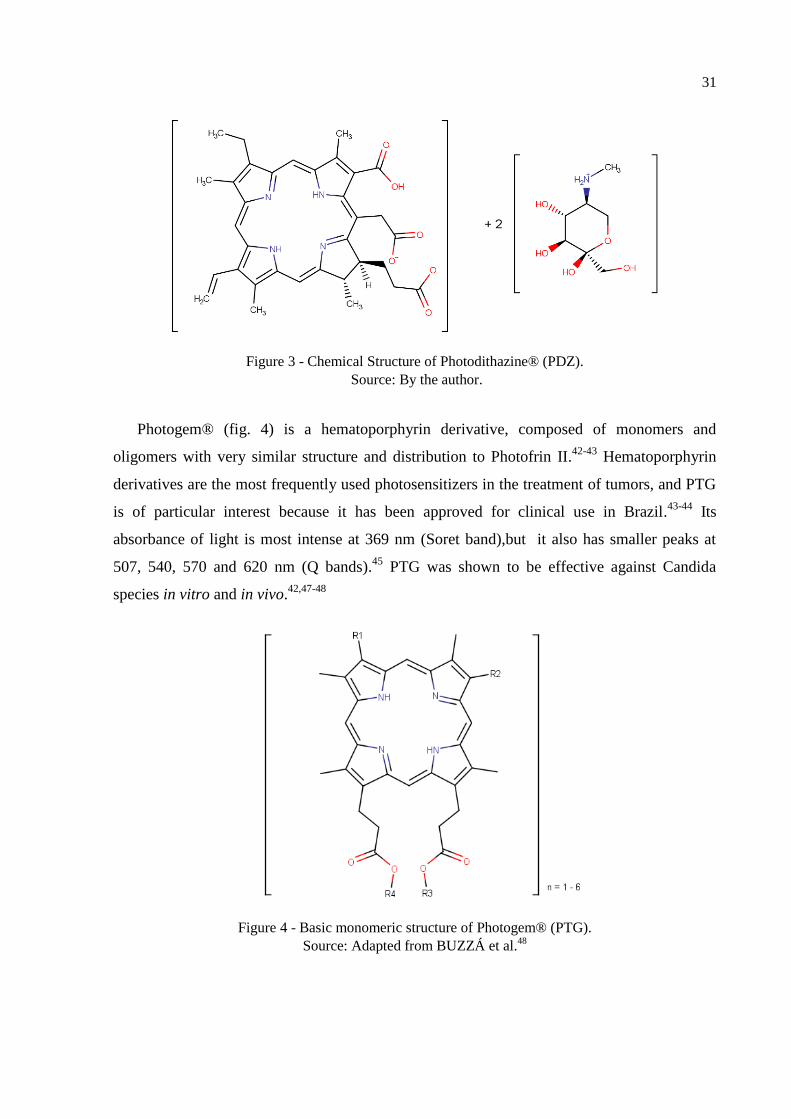
Photogem® (fig. 4) is a hematoporphyrin derivative, composed of monomers and
oligomers with very similar structure and distribution to Photofrin II.42-43
Hematoporphyrin
derivatives are the most frequently used photosensitizers in the treatment of tumors, and PTG
is of particular interest because it has been approved for clinical use in Brazil.43-44
Its
absorbance of light is most intense at 369 nm (Soret band),but it also has smaller peaks at
507, 540, 570 and 620 nm (Q bands).45
PTG was shown to be effective against Candida
species in vitro and in vivo.42,47-48
Figure 4 - Basic monomeric structure of Photogem® (PTG).
Source: Adapted from BUZZÁ et al.48
32
2.2.3 Light sources and light penetration
For PDI to be effective, light needs to be able to reach the pathogens in sufficient dose,
despite the dispersion and absorption of the adjacent layers of tissue.3 Therefore, the choice of
wavelength should take into account the depth of light penetration, the absorbance spectrum
of the photosensitizer, and the location of the infectious agents.3
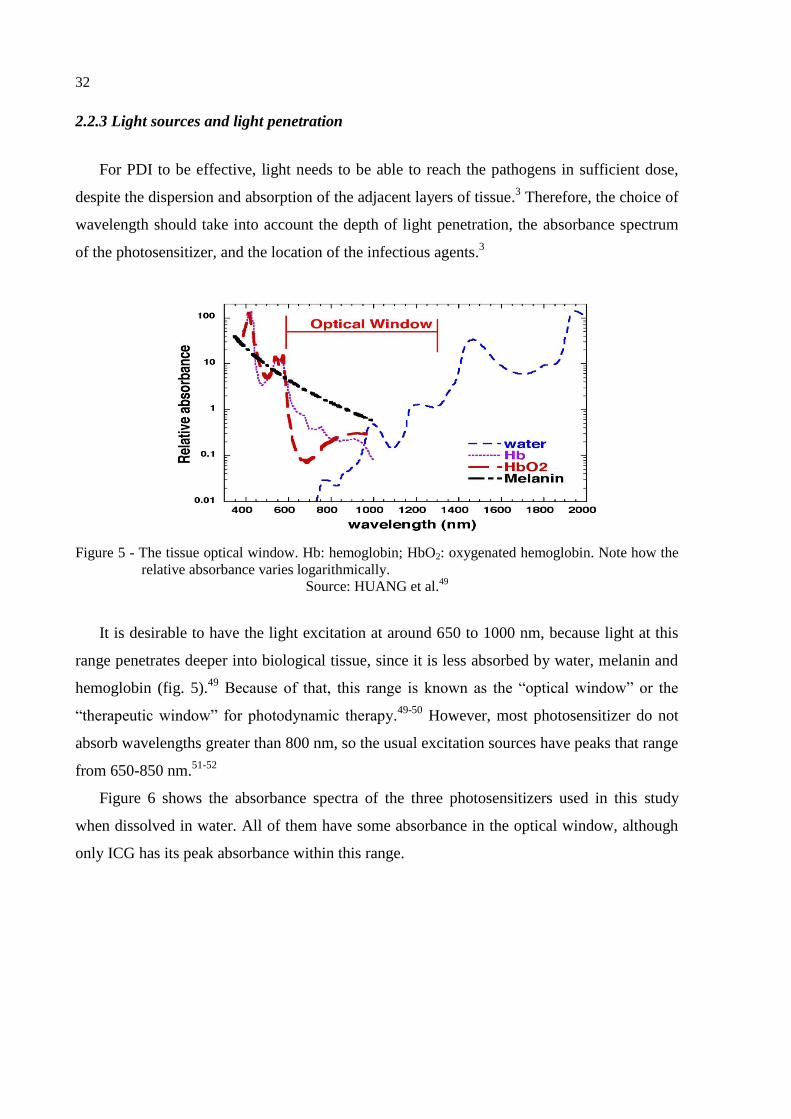
Figure 5 - The tissue optical window. Hb: hemoglobin; HbO2: oxygenated hemoglobin. Note how the
relative absorbance varies logarithmically.
Source: HUANG et al.49
It is desirable to have the light excitation at around 650 to 1000 nm, because light at this
range penetrates deeper into biological tissue, since it is less absorbed by water, melanin and
hemoglobin (fig. 5).49
Because of that, this range is known as the “optical window” or the
“therapeutic window” for photodynamic therapy.49-50
However, most photosensitizer do not
absorb wavelengths greater than 800 nm, so the usual excitation sources have peaks that range
from 650-850 nm.51-52
Figure 6 shows the absorbance spectra of the three photosensitizers used in this study
when dissolved in water. All of them have some absorbance in the optical window, although
only ICG has its peak absorbance within this range.

33
300 400 500 600 700 800 900
0,0
0,2
0,4
0,6
0,8
1,0
Norm
aliz
ed A
bsorb
ance
Wavelength (nm)
PTG
ICG
PDZ
Figure 6 - Normalized absorbance of the three photosensitizers in water.
Source: By the author.
2.2.4 Photodynamic Inactivation of S. pneumoniae using indocyanine green and infrared
light
The application of ICG and extracorporeal infrared light to the treatment of
bacterial pneumonia has been studied by our research group since 2013. In a study published
in the Journal of Biophotonics in 2017, the in vitro inactivation of S. pneumoniae was found
to be effective using concentrations of ICG as low as 5 μM when combined with a 780 nm
laser device or 10 μM when using an 850 nm LED. In these conditions, the treatment was safe
for RAW 264.7 macrophages, and seemed to enhance their ability to fight the bacteria.5
The in vivo investigation found a reduction in the bacterial burden and an increase
in the survival rate of SKH-1 hairless mice infected with S. pneumoniae after a single PDI
session using ICG 100 μM and 120 J/cm² of light at 780 nm.6 In this study, the light exposure
did not seem to be harmful to the animals. Additionally, the ICG alone was no different form
the control, suggesting that the activation with light was essential to the observed effects.
Therefore, both the in vitro and in vivo findings suggested that the combination of ICG and
infrared light has a great potential to treat pneumococcal pneumonia.
2.3 Respiratory delivery via nebulization
Although vapors and aerosols have been employed in the treatment of respiratory
diseases for many centuries, the term “nebulizer” only appeared in the end of the 19th
century,

34
when the first mechanical pumps for air flow generation were created.53
The technology kept
developing throughout the decades, and modern nebulizers are capable of delivering more
than 60% of the nominal dose to the respiratory system.54-55
Nowadays, nebulization is used
in the medical practice to deliver bronchodilators, antibiotics, mucolytic drugs and local
anesthetics.7 It allows the drug to reach the target site directly, reducing the required dose and
limiting the side effects.7
2.3.1 Types of Nebulizers
Three types of equipment are currently available in the clinical practice: jet, ultrasonic,
and vibrating-mesh nebulizers.55
Jet nebulizers are the most commonly used type.56
They
contain Venturi orifices and deflectors, that combined with a high air flux, create a negative
pressure on the liquid surface.53,55
Then, because of the superficial tension, microdroplets are
created.55
Ultrasonic nebulizers are based on a piezoelectric transductor that vibrates at a high
frequency in the base of the recipient, creating the microdroplets of liquid.55
In the case of
vibrating-mesh nebulization, the liquid is pushed through micrometric opening, creating the
aerosol.55
The choice between nebulization method depends on the stability of the active
compounds and the formulations to each of these processes.55
Although ultrasonic nebulizers
are less noisy than the jet ones, they are more expensive and there is an increase in
temperature inside the nebulization chamber that makes them incompatible with thermolabile
formulations.57
Ideally, prescriptions for nebulization should include both the drug and the
equipment.58
2.3.2 Characteristics of an ideal drug for nebulization
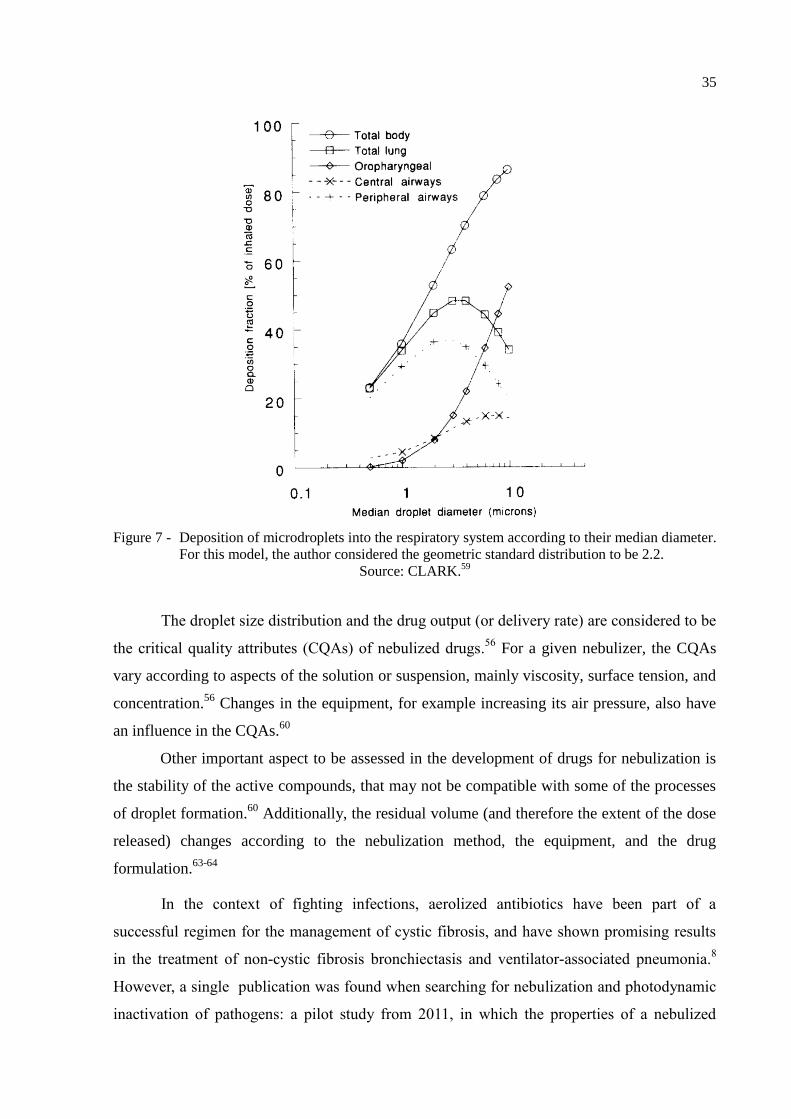
The deposition of the droplets in the respiratory tract is dependent on their diameter,
so this must be taken into account in the development of a nebulization method.8,53
Lung
deposition seems to be optimal when droplet diameter is between 2-5 µm, whereas larger
particles will have a larger deposition in the oropharynx (fig.7).59
35
Figure 7 - Deposition of microdroplets into the respiratory system according to their median diameter.
For this model, the author considered the geometric standard distribution to be 2.2.
Source: CLARK.59
The droplet size distribution and the drug output (or delivery rate) are considered to be
the critical quality attributes (CQAs) of nebulized drugs.56
For a given nebulizer, the CQAs
vary according to aspects of the solution or suspension, mainly viscosity, surface tension, and
concentration.56
Changes in the equipment, for example increasing its air pressure, also have
an influence in the CQAs.60
Other important aspect to be assessed in the development of drugs for nebulization is
the stability of the active compounds, that may not be compatible with some of the processes
of droplet formation.60
Additionally, the residual volume (and therefore the extent of the dose
released) changes according to the nebulization method, the equipment, and the drug
formulation.63-64
In the context of fighting infections, aerolized antibiotics have been part of a
successful regimen for the management of cystic fibrosis, and have shown promising results
in the treatment of non-cystic fibrosis bronchiectasis and ventilator-associated pneumonia.8
However, a single publication was found when searching for nebulization and photodynamic
inactivation of pathogens: a pilot study from 2011, in which the properties of a nebulized

36
methylene blue solution were assessed.10
The first photodynamic treatment of a respiratory
infection was focused on papillomatosis and went through clinical trials on the late 1980s.63
Surprisingly, although the larynx was the target tissue in this and other similar studies, the
photosensitizers were administered intravenously.63-64

37
3 EFFICACY OF THE NEBULIZATION OF DIFFERENT PHOTOSENSITIZERS
3.1 Purpose
Recently, our research group demonstrated the photodynamic inactivation of
streptococcal pneumonia in vivo, using instillation to deliver the drug, which is uncomfortable
and not well accepted in the clinical practice.6 Within our program of lung decontamination,
efficient photosensitizer delivery to the airways is a key point. Since nebulization has clear
advantages when compared to instillation and intravenous delivery, this study proposed to
investigate the applicability of the jet nebulization as a method of delivering photosensitizers
to the respiratory tract for the PDI of respiratory pathogens.
Three photosensitizers were chosen based on their activity against microorganisms:
indocyanine green is a fluorescent dye used in diagnostics, and it is active against S.
pneumoniae both in vitro and in vivo,5-6,30
Photodithazine® is a chlorin e6 derivative that
successfully reduced the viability of a multispecies biofilm,40
and Photogem® is a
hematoporphyrin derivative with activity against Candida species.47-48,67
The critical
attributes (droplet size and delivery rate), the extent of nebulization, and the stability of the
photosensitizers to the process were assessed to ensure that they were compatible with the jet
nebulization.
3.2 Methodology
3.2.1 Materials
All solutions of ICG (Indocyanine Green, Ophtalmos, Brazil), PDZ (Photodithazine®,
Fotoditazin, Russia) and PTG (Photogem®, Photogem, Russia) were freshly prepared in
distilled water at the concentrations of each experiment. The stock solution of
Photodithazine® has 5 mg/mL, while the Indocyanine Green and the Photogem® are
provided in powder. Exceptionally for the in vivo experiments, the chosen solvent was sterile
water for injection, to avoid contamination. The commercially available Omron NE-C801 jet
nebulizer (Omron, Kyoto, Japan) was used for all experiments, with different nebulizing
chambers for each photosensitizer, and for the controls phosphate buffered saline (PBS) and
distilled water.

38
3.2.2 Determination of the volume median diameter (VMD)
0%
20%
40%
60%
80%
100%
D90
Cu
mula
tive
Fre
qu
en
cy
Diameter
D10
VMD
Figure 8 - Hypothetical curve of the cumulative frequency for a measurement of particle size
distribution from a nebulizer. The Volume Median Diameter (VMD) corresponds to a
cumulative frequency of 50% of the droplets. D10 and D90 are the diameters for which
the cumulative frequency is 10% and 90%, respectively.
Source: By the author.
The size of the particles released by a nebulizer usually follows a normal distribution.
The volume median diameter (VMD) represents the diameter correspondent to a cumulative
frequency of 50% of the particles, or in other words, half of the droplets are smaller or equal
to the VMD, and half of them are larger. The measure of spread for the distribution of
diameters is the Span, and it is calculated by the RT Sizer software as 𝑆𝑝𝑎𝑛 = (𝐷90 −
𝐷10)/𝑉𝑀𝐷, where D90 and D10 and the diameters for which 90% and 10% of the particles are
smaller or equal to, respectively. Figure 8 shows a cumulative frequency curve for a
hypothetical measure of particle size distribution, in which the VMD, D90 and D10 are
indicated.
The droplet size was determined using an optical measurement, with the Spraytec
system (Malvern Instruments model RTS5134) and the software RT Sizer. In this equipment,
a 3mW Helio-Neon laser generator produces laser light at a wavelength of 632.8 nm. The
laser beam is expanded by a lens and passes through the spray where a part of the light energy
is diffracted at different angles depending on the size distribution of the droplets in the spray.
The diffraction angle is inversely proportional to the size of the droplet. The lens used in the
experimental tests was a 100 mm focal length lens that provided a particle size range, based
on volume median diameter of the particle size distribution, from 2.5 to 125 µm. It is worth
39
mentioning that actual range of the instrument is wider than listed to accurately measure
droplets both above and below the volume median diameter.
The nebulizer was placed in the middle of the optical path, and around 100
measurements were collected for each sample. For the solutions of ICG, PDZ and PTG at 500
μg/mL, the “opaque” configuration was selected, with a refraction index (RI) of 1.5. For
water and PBS, the “water” configuration was chosen, with RI = 1.33. Water and PBS were
chosen as controls to help explain whether the VMD results found were intrinsic to the
equipment, or variable according to the characteristics of each solution.
3.2.3 Rate and extent of nebulization
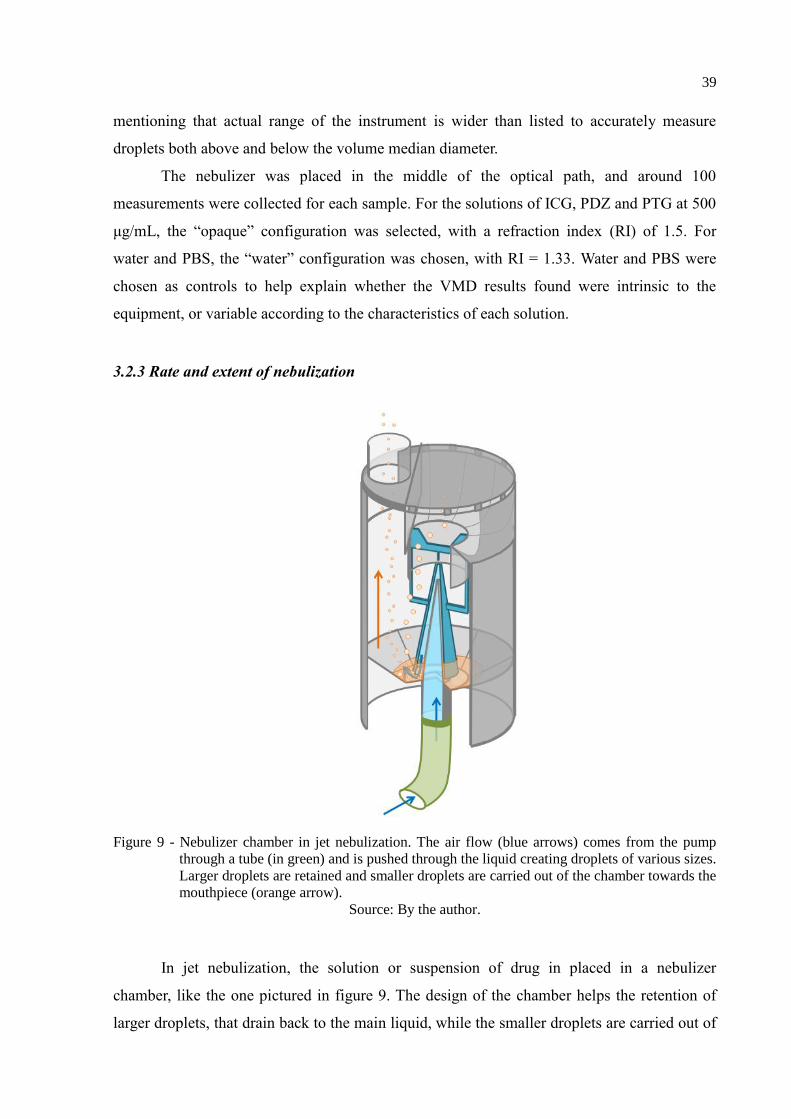
Figure 9 - Nebulizer chamber in jet nebulization. The air flow (blue arrows) comes from the pump
through a tube (in green) and is pushed through the liquid creating droplets of various sizes.
Larger droplets are retained and smaller droplets are carried out of the chamber towards the
mouthpiece (orange arrow).
Source: By the author.
In jet nebulization, the solution or suspension of drug in placed in a nebulizer
chamber, like the one pictured in figure 9. The design of the chamber helps the retention of
larger droplets, that drain back to the main liquid, while the smaller droplets are carried out of
40
the equipment (orange arrow). For that reason, an indirect measurement was used to quantify
the nebulization, by measuring the change in mass of the nebulizer chamber and the
concentration of the remaining solutions.
The photosensitizers were prepared in two concentrations: the same used for the VMD
determination (500 μg/mL), and a lower one (50 μg/mL) for further comparison. The chamber
was weighted before and after the addition of 2.0 mL of each solution. For the concentration
of 50 μg/mL, the nebulizer was on for 6 minutes, and afterwards the chamber was weighted
again, and the concentration of the remaining liquid determined. For 500 μg/mL, the
nebulization was interrupted after each minute passed, the chamber was weighted, a small
aliquot (30 µL) was removed and diluted to determine concentration, and the chamber was
weighted once more. All measurements were performed in triplicate.
A calibration curve was prepared for each photosensitizer using UV-vis spectrometry
(Varian Cary® 50, Varian Medical Systems, United States), based on their peak absorbance in
water, as shown in table 1. The reason why the concentration range in the curves is so smaller
than the ones used in the nebulizer is to respect the detection limits of the equipment and
ensure linearity. Also, diluting the sample before measurement was a way to reduce the
amount of solution that had to be removed for each measurement.
Table 1 - Parameters of the calibration curves to determine the concentration of photosensitizer before
and after nebulization.
Photosensitizer ICG PDZ PTG
Peak Absorbance (nm) 780 405 368
Concentration Range (µg/mL) 4.0 – 7.0 3.0 – 7.0 4.0 – 8.0
Linearity (R²) 0.9944 0.9977 0.9899
Source: By the author.
3.2.4 Verification of Stability
The composition of the solutions prior to and after nebulization was determined by
high performance liquid chromatography (HPLC) coupled with mass spectrometry (MS) and
diode-array detection (DAD) of absorbance spectra. The nebulizer was placed inside of a
clean plastic chamber and the nebulization was performed for 6 minutes with 2.0 mL of each
photosensitizer at 1.0 mg/mL. The droplets were allowed to set before the chamber was open.
Still, it was only possible to collect a few microliters of each “after” sample, and that is the
reason why the initial concentration was higher than in other experiments.
The aliquots from before and after the procedure were diluted in the same mixture as
41
the initial mobile phase to a final concentration of 100 μg/mL prior to analysis. For ICG, a
solution stocked for three weeks at 4 ºC was also analyzed. A different method of analysis was
developed for each photosensitizer according to published literature, in the hope to separate
potential degradation products.66–68
The Agilent 1200 HPLC system (Agilent Technologies,
United States) and a reverse-phase column (NST 18 80A, 150 mm x 4,6 mm x 5 μm) were
used. After separation, the mobile phase was split between the API 200 triple quadrupole mass
spectrometer and the Agilent 1200 diode array for detection. Analysis was performed with the
software Analyst 1.5.1. The particularities of each method are summarized in Table 2.
Table 2 - Specific parameters for the HPLC-MS-DAD analysis of each photosensitizer.
Method ICG PDZ PTG
Aqueous Phase (A) 0.1 M Ammonium
Acetate in water (pH
5.3)
0.1% formic acid 0.1% formic acid
Organic Phase (B) Acetonitrile Acetonitrile Acetonitrile
Gradient 30% to 90% B in 12
minutes
45% to 100% B in 20
minutes
35% to 100% B in 20
minutes
Total Run Time 25 minutes 40 minutes 36 minutes
Ion Detection m/z = 50 – 900 (+ve) m/z = 50 – 900 (+ve) m/z = 50 – 1300 (-ve)
Absorbance Detection 200 – 900 nm 200 – 900 nm 200 – 900 nm
Injection Volume 20 µL 20 µL 20 µL
Source: By the author.
3.2.5 Statistical Analysis
For all experiments, measurements were taken in triplicate. The analysis of variance
(one-way or two-way ANOVA) was the test of choice whenever applicable, with a post-hoc
Tukey test. The groups were considered different with a level of significance of 0.05. All
calculations were performed using the software Origin 9.0 (OriginLab, Northampton, USA).
3.3 Results
3.3.1 Volume Median Diameter (VMD)
The VMD and span values for the photosensitizer solutions, water and PBS are
summarized in Erro! Autoreferência de indicador não válida.. The obtained VMD values are

42
close to 9 µm and do not seem to vary greatly depending on the composition of the solution.
The obtained span values are all smaller than 0.3, indicating a small dispersion of particle
diameters.
Table 3 - VMD and span of the droplets formed by the Omron NE-C801 jet nebulizer for each of the
tested solutions.
Solution VMD (µm) Span
Distilled Water 8.90 0.28
PBS 9.60 0.17
ICG 500 9.34 0.24
PDZ 500 9.00 0.28
PTG 500 9.19 0.25
Source: By the author.
3.3.2 Rate and Extent of Nebulization
Figure 10 shows the percentage of photosensitizers released six minutes after
nebulization. In all cases, at least 65% of the dose was carried out of the equipment in the
form of droplets. The 2-way ANOVA showed that the dose released was significantly larger
for the higher concentrations of photosensitizers, and that less PDZ was nebulized compared
to ICG and PTG.
ICG 50 ICG 500 PDZ 50 PDZ 500 PTG 50 PTG 500
0
10
20
30
40
50
60
70
80
90
100
Dose N
ebuliz
ed (
%)
Figure 10 - Extent of nebulization for each solution of photosensitizer, being: ICG 50: Indocyanine
green 50 μg/mL; ICG 500: Indocyanine green 500 μg/mL; PDZ 50: Photodithazine® 50
μg/mL; PDZ 500: Photodithazine 500 μg/mL; PTG 50: Photogem® 50 μg/mL; PTG 500:
Photogem 500 μg/mL.
43
Source: By the author.
1 2 3 4 5 6
0
50
100
150
200
250ICG
PDZ
PTG
Mea
n O
utp
ut
(g
/min
)
Time (min)
Figure 11 - Rate of nebulization of the Omron® nebulizer for each of the concentrated solutions (500
µM) of photosensitizers. For PTG, there was no further droplet formation after 5 minutes.
Source: By the author.
0 1 2 3 4 5 6
0
100
200
300
400
500
600
700
800
Mean C
oncentr
ation (
g/m
L)
Time (min)
ICG
PDZ
PTG
Figure 12 - Concentration of photosensitizer in the vessel as the nebulization occurs. For PTG, there
was no further droplet formation after 5 minutes.
Source: By the author.
It was possible to monitor the release of photosensitizer after each minute of
44
nebulization at 500 µg/ml (fig. 11). PTG reached a limit five minutes after and no
nebulization was observed after that time, whereas ICG and PDZ continued to generate mist
until the sixth minute. For all three solutions, the rate of delivery was high and stable initially,
and its decline seemed to coincide with the limiting volume of solution in the vessel. The
concentration of photosensitizer in the remaining solution was monitored as well (fig. 12).
Although concentrations did not change drastically, they were all significantly higher at the
end of the process, indicating the increase in concentration during the process.
3.3.3 Stability of the Photosensitizers during Nebulization
Figures 13 and 14 show the total ion chromatograms (TIC) and the total wavelength
chromatograms (TWC) for the solution of ICG before and after nebulization, and after
degradation in water. Figures 15 and 16 show the absorbance and mass spectra for the most
important peaks found in the described chromatograms. ICG (m/z = 753.3) eluted with a
retention time of 8.5 minutes, and there was an unidentified impurity present in both the fresh
and the nebulized solutions (m/z = 331.5 and 346.6; RT= 6.9 min).
0 10 20
0
1x10⁵
2x10⁵
3x10⁵
0
1x10⁵
2x10⁵
3x10⁵
0
1x10⁵
2x10⁵
3x10⁵
0 10 20
Time (min)
freshly prepared ICG
Absorb
ance (
mA
u)
nebulized ICG
water-degraded ICG
Figure 13 - Total wavelength chromatograms of ICG in three different conditions. There is no
difference between the chromatograms of nebulized and freshly-prepared ICG. After 3
weeks in water, however, the main peak at 8.5 minutes disappears, and the peak at 6.9
minutes increases.
45
Source: By the author.
0 10 20
0
1x10⁷
2x10⁷
3x10⁷
4x10⁷
0
1x10⁷
2x10⁷
3x10⁷
4x10⁷
0
1x10⁷
2x10⁷
3x10⁷
4x10⁷
0 10 20
Time (min)
freshly prepared ICG
Inte
nsity (
cps) nebulized ICG
water-degraded ICG
Figure 14 - Total ion chromatograms of ICG in three different conditions. Similarly to what happens
in the wavelength chromatograms, here is no difference between nebulized and freshly-
prepared ICG, and after 3 weeks in water the main peak at 8.5 minutes disappears, and
the peak at 6.9 minutes increases.
Source: By the author.
Comparing the peaks and their corresponding absorbance and mass spectra, the
composition of the solution did not seem to change at all after the nebulization. The
chromatogram of a solution that spent three weeks at 4 ºC is shown to demonstrate the type of
difference that would be observed in the case of a degraded sample. In this case, the peak
correspondent to ICG is much smaller in the TIC than in the fresh solution (fig. 14), and
entirely gone in the TWC (fig. 13). On the other hand, the peak at RT = 6.9 minutes has
increased intensity in both chromatograms. It has the same mass and absorbance as the
impurity observed at this retention time for the fresh ICG.

46
200 300 400 500 600 700 800 900
0,0
0,2
0,4
0,6
0,8
1,0N
orm
aliz
ed A
bsorb
ance
Wavelength (nm)
RT = 6.9 min
RT = 8.5 min
Figure 15 - Overlap of the absorbance spectra obtained from the two interest peaks in the wavelength
chromatogram of ICG. The two spectra are quite similar, with the highest absorbance at
around 780 nm. RT: retention time.
Source: By the author.
0,0
5,0x10⁴
1,0x10⁵
1,5x10⁵
2,0x10⁵
250 500 750
250 500 7500,0
5,0x10⁵
1,0x10⁶
1,5x10⁶
2,0x10⁶
Inte
nsity (
cps) RT = 6.9 min331.5
346.6
753.3
Inte
nsity (
cps)
m/z (Da)
RT = 8.5 min
Figure 16 - Comparison between the mass spectra obtained from the two interest peaks in the
wavelength chromatogram of ICG. The peak with the retention time (RT) of 8.5
minutes has a predominant m/z value of 753.3, and the peak at 6.9 min has predominant
m/z values of 331.5 and 346.6.
Source: By the author.

47
No evidence of degradation was found for neither of the other photosensitizers (see
Appendix A). PDZ eluted at 11.5 minutes (m/z = 597) and was the only compound detected in
the TWC. Photogem® is a mixture of oligomers and it was not possible to correlate the
observed peaks with specific molecular entities, but still the three main peaks in the TWC (at
6.1, 11.9 and 12.8 min) are present before and after the process of nebulization. The
absorbance and mass spectra of all peaks remained unchanged.
3.4 Discussion
Measuring the size and distribution of droplet diameters helps to understand the
dynamics and predict the lung deposition profile of nebulized drugs.53
The VMD is the
dimension obtained by laser diffraction techniques, and was created in the attempt to be a
more reliable measurement than the traditional mass median aerodynamic diameter (MMAD),
obtained from other methods.59
In 1990, Rudolf and co-workers developed a semi-empirical
model to describe de deposition of aerosols in the human respiratory system.69
This model
was further studied by Clark in 1995, that was able to demonstrate a strong correlation
between the model and in vivo findings of other published results.59
According to this model,
nebulizer clouds with VMD results of around 9 µm, like the ones in table 3, would have an
average deposition fraction of over 80% of the inhaled dose, half of which would be deposited
in the lungs. Although model suggests that an even greater deposition into the peripheral
airways would be achieved with droplets of 2-5 µm, this would be very hard to achieve with a
cheap and ubiquitous jet nebulizer.70
The high concentration of the photosensitizer solutions
does not seem to affect greatly the size of the droplets, given that the obtained VMD results
are between the ones for distilled water and PBS. Therefore, the droplets generated by the jet
nebulizer are adequate for the delivery of photosensitizers to the lungs.
As for the delivered concentration, figure 10 shows that over 65% of the dose is
nebulized for all three photosensitizers at 50 and 500 µg/mL. Total mass output in jet
nebulization is dependent on equipment model and drug formulation, and it is incredibly
variable, with efficiencies reported in the literature that range from 11% to 97%.71–73
However, it tends to be less dependent on the properties of the solution than for vibrating
mesh or ultrasonic nebulizers.74
At the same concentration, we found no significant difference
between photosensitizers. Yet, there seems to be a slight increase in the percentage of dose
released for PDZ and PTG in the higher concentration compared to the lower.

48
The drug output is approximately constant for the first four minutes of nebulization,
and it decreases over time, regardless of the photosensitizer (fig. 11). As it occurs for most jet
nebulizers, the generation of droplets seems to be limited by the lowering volume of solution
as the time goes by. As the initial output is higher for PTG, the volume limit is reached more
quickly and nebulization stops after 5 minutes. For PDZ and ICG, the initial output is a little
lower, and there is still mist formation for another minute. There does not seem to be any
correlation between the VMD and the output rate.
During the experiment, we observed that the concentration of the compound in the
remaining solution increased as the nebulization progressed (fig. 12). We proposed that the
droplets formed carried less photosensitizer than the concentration of the solution, as it had
been previously proposed by Diederik and co-workers in 2003.62
According to this model, as
the concentration increased the droplets would have to have more compound in then,
increasing the delivery over time. However, that was not observed in this experiment, since
the volume limitation counteracts the rise in concentration, leading to the observed decrease
in output from figure 11.
The output rate and the changes in concentration are important to determine the dose
and nebulization time in the treatment design. Thus, it is important to notice that the results
are given in terms of mass (µg/min and µg/mL) and not molarity. The outputs for PDZ
(983.08 g/mol) and ICG (774.97 g/mol) are still comparable in terms of moles, but because
PTG is a mixture of oligomers with high (however unpublished) molecular weight, it is
unlikely that the increased mass output would reflect an increased molar output.
The concern about stability in the nebulization of many pharmaceuticals and the
known degradation of ICG in water motivated a deep investigation of stability.76-77
To make
sure that the process of droplet formation would not increase the degradation kinetics in any
way, we studied the chemical composition of the three photosensitizer solutions with HPLC-
MS-UV. The similarity between chromatograms was quite evident, but still the ionic mass and
UV-Vis absorbance spectra of each of the peaks was compared to make sure that the
composition was the same. All peaks had comparable intensities and corresponding spectra,
so we concluded that the composition of the solutions had not changed because of the
nebulization. The comparison of chromatograms and spectra of ICG is shown as an example,
in figures 13 to 16.
Figures 13 and 14 also include a reference scenario in which such a change in
composition occurs. The degradation of ICG in water is well described in the literature,77
which is why it is commercialized in powder form, to be dissolved immediately before use.
49
According to the manufacturer, solutions should be used within 10 hours of preparation.
Therefore, after three weeks, we expected that the solution would no longer contain any
photosensitizer. Surprisingly, the characteristic green color was sustained after this time, and it
was found to be from the main degradation product detected (RT = 6.9 min). This compound
and ICG itself have very similar absorbance spectra (fig. 15), what could mislead the analysis
of stability through UV-Vis absorbance alone. A corresponding peak was also present in the
freshly-prepared ICG solution. We could not determine if it was an impurity from the
synthesis or a degradation product formed within the minutes before the analysis, and its
absorbance and mass spectra did not correspond to any of the known products of ICG’s light-
induced decomposition.78
Still, we found no evidence of an increase of such compound or
decrease in ICG concentration after the nebulization process.
3.5 Conclusion
In summary, the findings of this chapter suggest that jet nebulization is an adequate
method for the delivery of indocyanine green, Photodithazine® and Photogem® to the lungs.
All three solutions are effectively carried out of the nebulizer, the microdroplets formed are of
adequate size, and the compounds remain stable throughout the process. This is particularly
promising considering the broad availability and reduced price of jet nebulization. Therefore,
nebulization is a potential tool for the photodynamic treatment of not only pneumonia but
other pulmonary disorders.

50
51
4 NEBULIZATION AND EXTRACORPOREAL ACTIVATION OF INDOCYANINE
GREEN IN VIVO
4.2 Purpose
The nebulization of the three photosensitizers was equally successful, so indocyanine
green was chosen as a model to demonstrate the delivery in vivo due to its prominent results
in the treatment of bacterial pneumonia.5-6
Also, before studying the efficacy of the treatment,
there was an interest in studying its effects in healthy organisms. Thus, this study aimed to
assess the lung damage caused by the photodynamic action of nebulized ICG and infrared
light in healthy mice.
Additionally, there was no published information about how the photosensitizer would be
cleared from the lungs and distributed throughout the body. In this study, fluorescence
imaging and spectroscopy were used to infer about the distribution of the photosensitizer
delivered by nebulization within the lungs and to other internal organs in a murine model.
Benefiting from the deep penetration of the infrared light in biological tissue, we observed the
fluorescence of ICG extracorporeally and evaluated the applicability of its use as a monitoring
tool for the proposed PDI treatment.
4.2 Methodology
4.2.1 Animal Model
Forty-five female BALB/c mice, from 8 to 10 weeks old, were obtained from CEMIB
(Multidisciplinary Center for Biological Investigation on Laboratory Animal Science -
Campinas, Brazil). They were anesthetized with a peritoneal injection of 5-10 mg/kg weight
of xylazine (Anasedan, Ceva Santé Animale, Paulínia, Brazil) and 75-150 mg/kg weight of
ketamine (Dopalen, Ceva Santé Animale, Paulínia, Brazil). The hair from the dorsal and
lateral areas of the animals was removed using a depilatory cream (Veet®, Reckitt Benckiser,
Cali, Colombia). Euthanasia was performed with an overdose of the same anesthetics. All
animal experiments were approved by the Animal Ethics Committee of the São Carlos
Institute of Physics, IFSC/USP – University of São Paulo (number 12/2016, approved on
October 17th
, 2016).

52
4.2.2 Materials and Devices
Indocyanine Green (Ophtalmos, Sao Paulo, Brazil) was diluted in water for injection
to the desired concentration immediately before use. The phosphate buffer saline (PBS) was
prepared and sterilized to serve as the nebulization control. The Omron NE-C801 jet nebulizer
was used, and a silicone tube was adapted to the mouthpiece of the nebulizer so that the
aerosol would reach only the nose and mouth of the animals. The eyes were protected with
damp gauze to prevent dryness. An illumination device was specially built for the treatment of
mice, emitting monochromatic light at 780 nm with an irradiance of 60 mW/cm², and
positioned in a way that the animal would be facing down and the light would reach the
thorax from the back and the sides (fig. 17).
Figure 17 - Custom-made illumination device for the photodynamic treatment of mice. It is composed
of 18 laser diodes with maximum emission at 780 nm. The arrows indicate the laser beam
propagation.
Source: GERALDE et al.6
The fluorescence widefield images were taken using an infrared camera with
excitation at 780 nm was used for imaging (more information about this camera can be found
in the Master’s dissertation of Govone79
). The spectral detection of the fluorescence was
performed with a fiber optics setup, under excitation at 780 nm and the collection of the
spectra between 300 and 1000 nm. A filter (850 ± 40 nm bandpass) was included to reduce
the signal from the excitation, while allowing the fluorescence of ICG to pass. This same
setup was used to compare the fluorescence of a solution of ICG (1.3 mM) right after
preparation, and after 3 weeks stored at 4ºC.
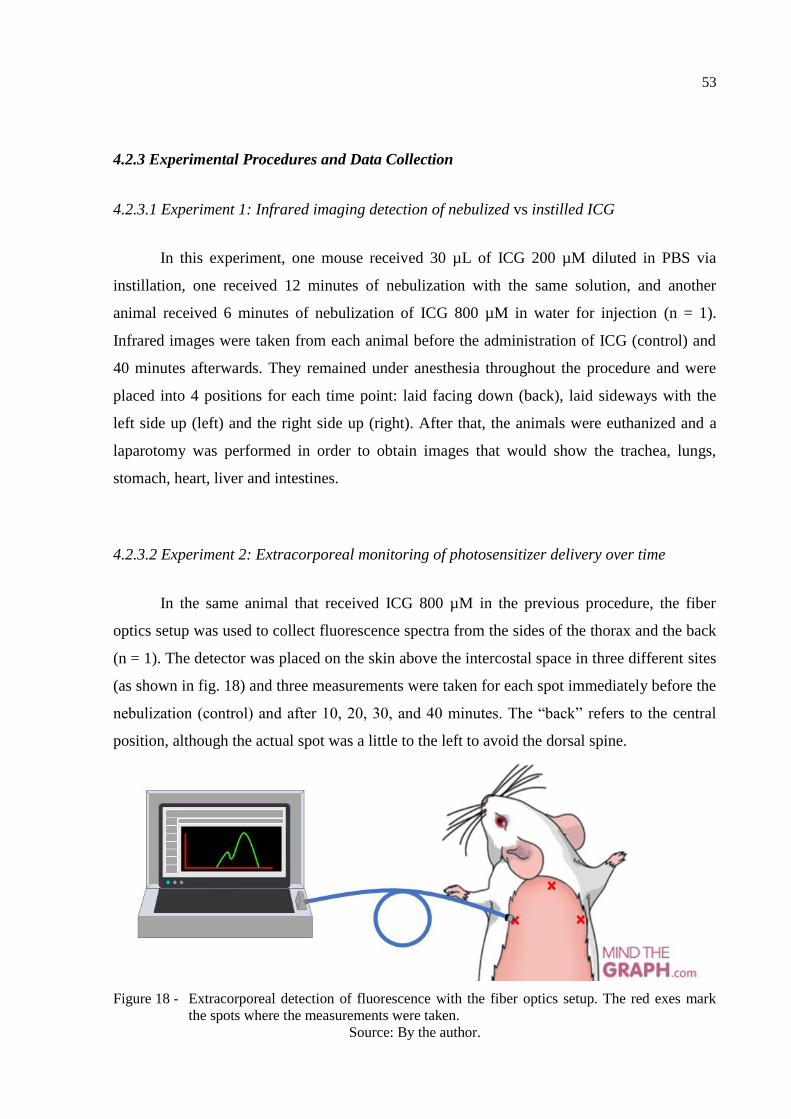
53
4.2.3 Experimental Procedures and Data Collection
4.2.3.1 Experiment 1: Infrared imaging detection of nebulized vs instilled ICG
In this experiment, one mouse received 30 µL of ICG 200 µM diluted in PBS via
instillation, one received 12 minutes of nebulization with the same solution, and another
animal received 6 minutes of nebulization of ICG 800 µM in water for injection (n = 1).
Infrared images were taken from each animal before the administration of ICG (control) and
40 minutes afterwards. They remained under anesthesia throughout the procedure and were
placed into 4 positions for each time point: laid facing down (back), laid sideways with the
left side up (left) and the right side up (right). After that, the animals were euthanized and a
laparotomy was performed in order to obtain images that would show the trachea, lungs,
stomach, heart, liver and intestines.
4.2.3.2 Experiment 2: Extracorporeal monitoring of photosensitizer delivery over time
In the same animal that received ICG 800 µM in the previous procedure, the fiber
optics setup was used to collect fluorescence spectra from the sides of the thorax and the back
(n = 1). The detector was placed on the skin above the intercostal space in three different sites
(as shown in fig. 18) and three measurements were taken for each spot immediately before the
nebulization (control) and after 10, 20, 30, and 40 minutes. The “back” refers to the central
position, although the actual spot was a little to the left to avoid the dorsal spine.
Figure 18 - Extracorporeal detection of fluorescence with the fiber optics setup. The red exes mark
the spots where the measurements were taken.
Source: By the author.

54
4.2.3.3 Experiment 3: Tissue damage and immune response to the treatment
Six animals were divided into either control or treated groups (n = 3). Treated animals
received 6 minutes of nebulization ICG 800 µM in water for injection and 33 minutes and 11
seconds of light exposure at 60 mW/cm², that resulted in a fluence of 120 J/cm². Control
animals received 6 minutes of nebulization with PBS and no light exposure. After 48 h, the
animals were euthanized. Then, the lungs were collected and kept in 4% formaldehyde for the
histological analysis.
4.2.3.4 Experiment 4: Tissue damage and treatment monitoring with an increased dose of
ICG
In this experiment, 15 animals were divided into the five groups (n = 3): the negative
controls (C-) did not receive any treatment or infection; the positive controls (C+) were
infected with S. pneumoniae (as described in Geralde, 2017); one group received only the
nebulized photosensitizer (ICG); one received the ICG and the light exposure, simulating the
treatment (PDI); and finally, one group received the light exposure, and nebulized PBS
instead of the photosensitizer (Light). The nebulization lasted for 10 minutes and had either
ICG at a concentration of 1.30 mM in water for injection or PBS. For the PDI and Light
groups, light exposure began halfway through the nebulization (5’) and lasted 33’11’’,
resulting in a dose of 120 J/cm². The total treatment time was of about 38 minutes.
Table 4 – Groups of experiment 4. The exes mark the treatments received by each group.
Nebulization
Group ICG PBS Light exposure Infection Fluorescence detection Histology
C- X
ICG X X X
PDI X X X X
Light X X X
C+ X X
Source: By the author.
In the treatment of the ICG and PDI groups, the extracorporeal detection of
fluorescence (shown in fig. 18) was performed before the procedure (0 min), during and after
the nebulization (5; 10 min), and then during and after the irradiation (20, 40 min).
Measurements were taken in triplicate as previously described (fig. 1). After 48 hours,
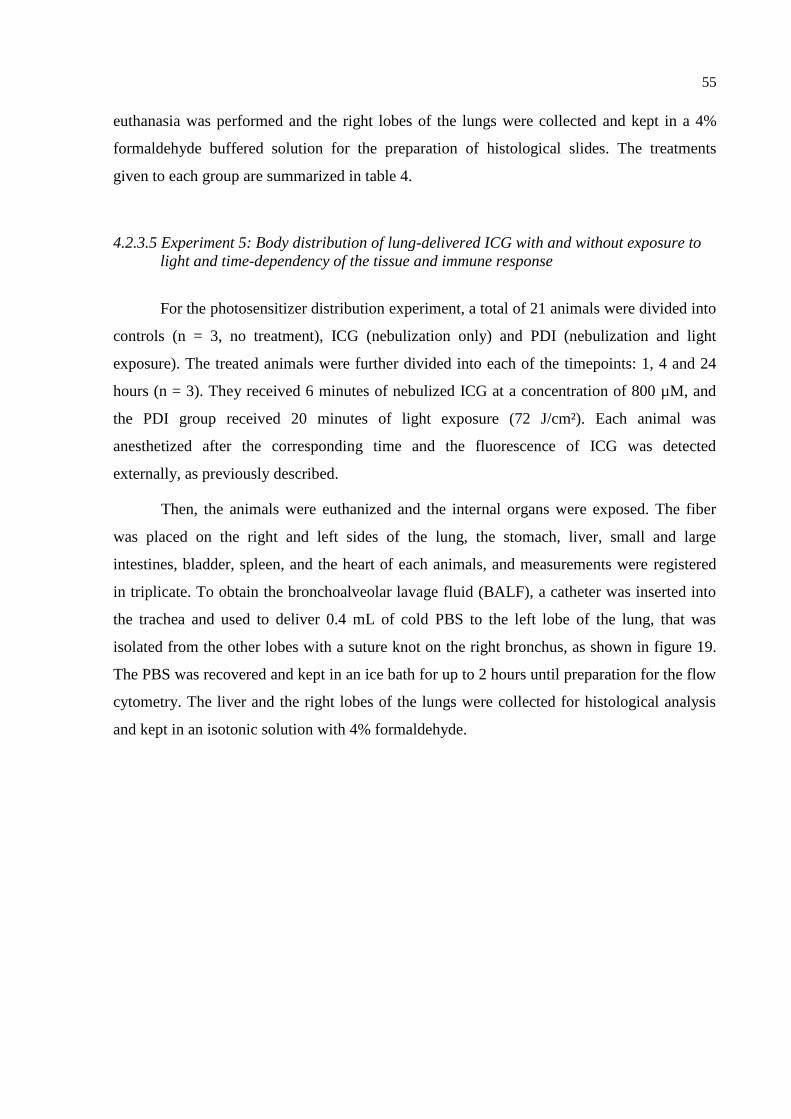
55
euthanasia was performed and the right lobes of the lungs were collected and kept in a 4%
formaldehyde buffered solution for the preparation of histological slides. The treatments
given to each group are summarized in table 4.
4.2.3.5 Experiment 5: Body distribution of lung-delivered ICG with and without exposure to
light and time-dependency of the tissue and immune response
For the photosensitizer distribution experiment, a total of 21 animals were divided into
controls (n = 3, no treatment), ICG (nebulization only) and PDI (nebulization and light
exposure). The treated animals were further divided into each of the timepoints: 1, 4 and 24
hours (n = 3). They received 6 minutes of nebulized ICG at a concentration of 800 µM, and
the PDI group received 20 minutes of light exposure (72 J/cm²). Each animal was
anesthetized after the corresponding time and the fluorescence of ICG was detected
externally, as previously described.
Then, the animals were euthanized and the internal organs were exposed. The fiber
was placed on the right and left sides of the lung, the stomach, liver, small and large
intestines, bladder, spleen, and the heart of each animals, and measurements were registered
in triplicate. To obtain the bronchoalveolar lavage fluid (BALF), a catheter was inserted into
the trachea and used to deliver 0.4 mL of cold PBS to the left lobe of the lung, that was
isolated from the other lobes with a suture knot on the right bronchus, as shown in figure 19.
The PBS was recovered and kept in an ice bath for up to 2 hours until preparation for the flow
cytometry. The liver and the right lobes of the lungs were collected for histological analysis
and kept in an isotonic solution with 4% formaldehyde.

56
Figure 19 - Isolation of the lung lobes for analysis. A knot was tied on the location indicated by the
black line, so that the bronchoalveolar lavage would reach only the left lobe. The lobes on
the right side (superior, middle, inferior and post-caval) were collected for histology.
Source: By the author.
4.2.4 Fluorescence Data Processing
Using a custom-made C program, the fluorescence spectra obtained were pre-
processed using spectral smoothing, with each point resulted from the average of its
neighboring 25 points. The interval corresponding to the ICG fluorescence band (795-890
nm) was normalized by the amplitude of the excitation wavelength (780 nm) to account for
changes in optical coupling, and then integrated to generate a single output. Then, using the
software Origin 9.0 (OriginLab, Northampton, USA), all obtained values were divided by the
median baseline for that location, that was either the measurement from the control group, or
the “t = 0 min” timepoint. As a consequence, the results are shown in terms of relative
fluorescence. They are represented by the mean and standard deviation obtained for each site
and time point. The one-way ANOVA and a post-hoc Tukey test were used to compare the
data sets, with a level of significance of 0.05.
4.2.5 Flow Cytometry
The BALF was centrifuged for 5 minutes at 1500 rpm, using the Centrifuge 5702
(Eppendorf, Hamburg, Germany). The supernatant was removed and the recovered cells were
resuspended in 300 μL of PBS. Then, they were stained with a fluorescence-tagged anti-CD45

57
monoclonal antibody (APC Rat Anti-Mouse CD45, BD Biosciences, New Jersey, USA),
using the protocol recommended by the seller. CD45 is a surface marker of all immune cells,
so this staining procedure allows for their identification in flow cytometry. Non-specific
binding sites were protected using the untagged CD16/CD32 monoclonal antibody.
Flow cytometry was carried out using the BD Accuri C6 Plus cytometer (Becton
Dickinson, Franklin Lakes, United States) and the software BD Accuri C6 Plus 1.0.23.1
(Becton Dickinson, Franklin Lakes, United States) was used for data analysis. CD45-negative
events were disregarded, and the classification of cell types was based on forward scattering
(FSC, that correlates to size), side scattering (SSC, correlates to granularity), and
autofluorescence.
4.2.6 Histological Analysis
The lung and liver samples were blocked into paraffin, sliced, stained with
hematoxylin and eosin (HE) and mounted onto microscopy slides. Two slides were prepared
from each sample. Each slide received a code and was analyzed using the Axio Observer Z1
microscope (Zeiss, Oberkochen, Germany), in search for signs of inflammation and tissue
damage. In the lungs, such signs were: inflammatory infiltrates, hyaline membrane deposits,
fibrosis, bronchiolar epithelial damage, hyperplasia, alveolar thickening and vascular
congestion. Liver slices were searched for necrosis, inflammatory infiltrates, vascular
congestion, microvacuolization and changes in color. Since the injuries were patchy, the
extent of damaged tissue was compared semi-quantitatively (by assigning a symbol: -, +, ++
or +++). Only after that, the codes were matched with the corresponding experimental groups
and the results were compared. Representative images of each group were obtained with the
Pannoramic Desk digital slide scanner and the Pannoramic Viewer software (3DHISTECH
Limited, Hungary).
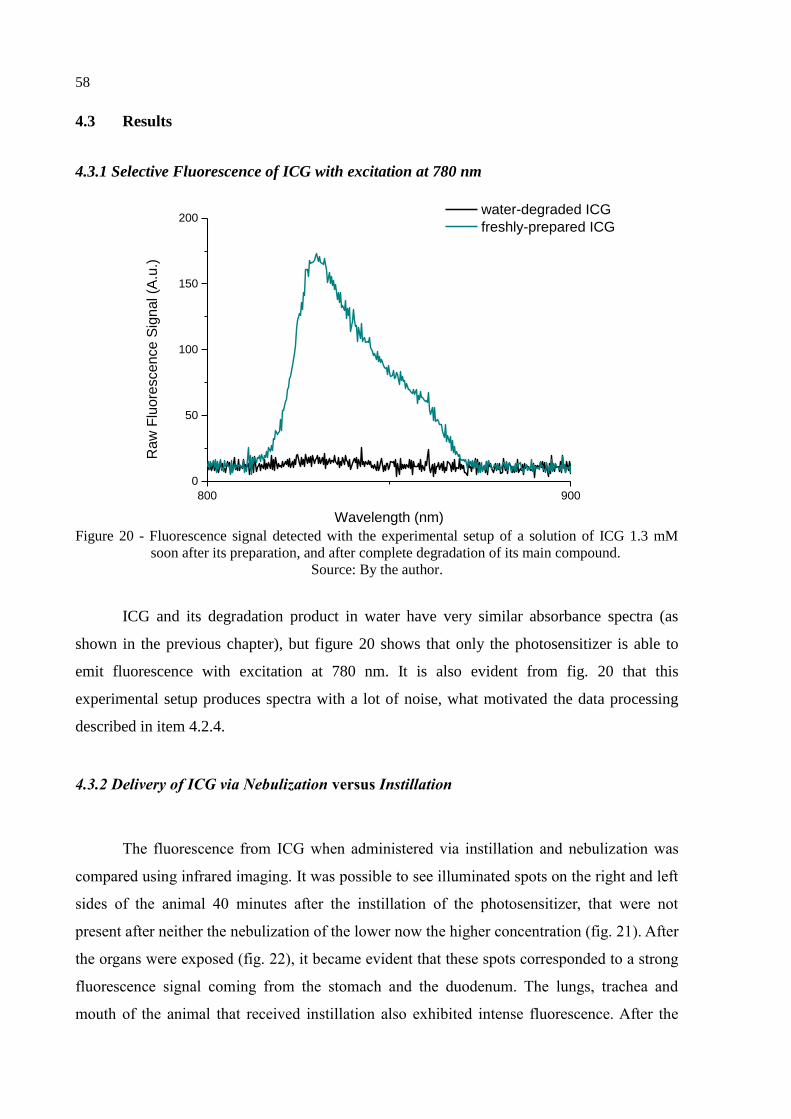
58
4.3 Results
4.3.1 Selective Fluorescence of ICG with excitation at 780 nm
800 900
0
50
100
150
200
Ra
w F
luo
rescen
ce S
ign
al (A
.u.)
Wavelength (nm)
water-degraded ICG
freshly-prepared ICG
Figure 20 - Fluorescence signal detected with the experimental setup of a solution of ICG 1.3 mM
soon after its preparation, and after complete degradation of its main compound.
Source: By the author.
ICG and its degradation product in water have very similar absorbance spectra (as
shown in the previous chapter), but figure 20 shows that only the photosensitizer is able to
emit fluorescence with excitation at 780 nm. It is also evident from fig. 20 that this
experimental setup produces spectra with a lot of noise, what motivated the data processing
described in item 4.2.4.
4.3.2 Delivery of ICG via Nebulization versus Instillation
The fluorescence from ICG when administered via instillation and nebulization was
compared using infrared imaging. It was possible to see illuminated spots on the right and left
sides of the animal 40 minutes after the instillation of the photosensitizer, that were not
present after neither the nebulization of the lower now the higher concentration (fig. 21). After
the organs were exposed (fig. 22), it became evident that these spots corresponded to a strong
fluorescence signal coming from the stomach and the duodenum. The lungs, trachea and
mouth of the animal that received instillation also exhibited intense fluorescence. After the
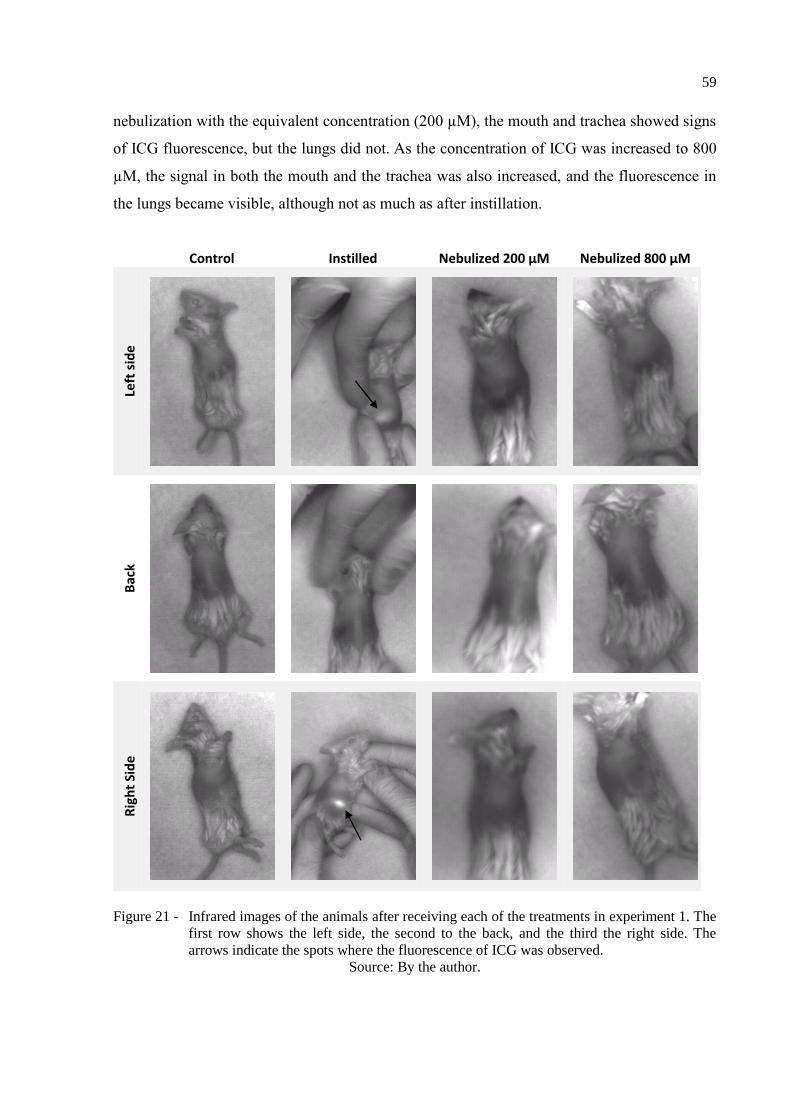
59
nebulization with the equivalent concentration (200 µM), the mouth and trachea showed signs
of ICG fluorescence, but the lungs did not. As the concentration of ICG was increased to 800
µM, the signal in both the mouth and the trachea was also increased, and the fluorescence in
the lungs became visible, although not as much as after instillation.
Figure 21 - Infrared images of the animals after receiving each of the treatments in experiment 1. The
first row shows the left side, the second to the back, and the third the right side. The
arrows indicate the spots where the fluorescence of ICG was observed.
Source: By the author.
Control Instilled Nebulized 200 µM Nebulized 800 µM
Left
sid
e
Bac
k
Rig
ht
Sid
e
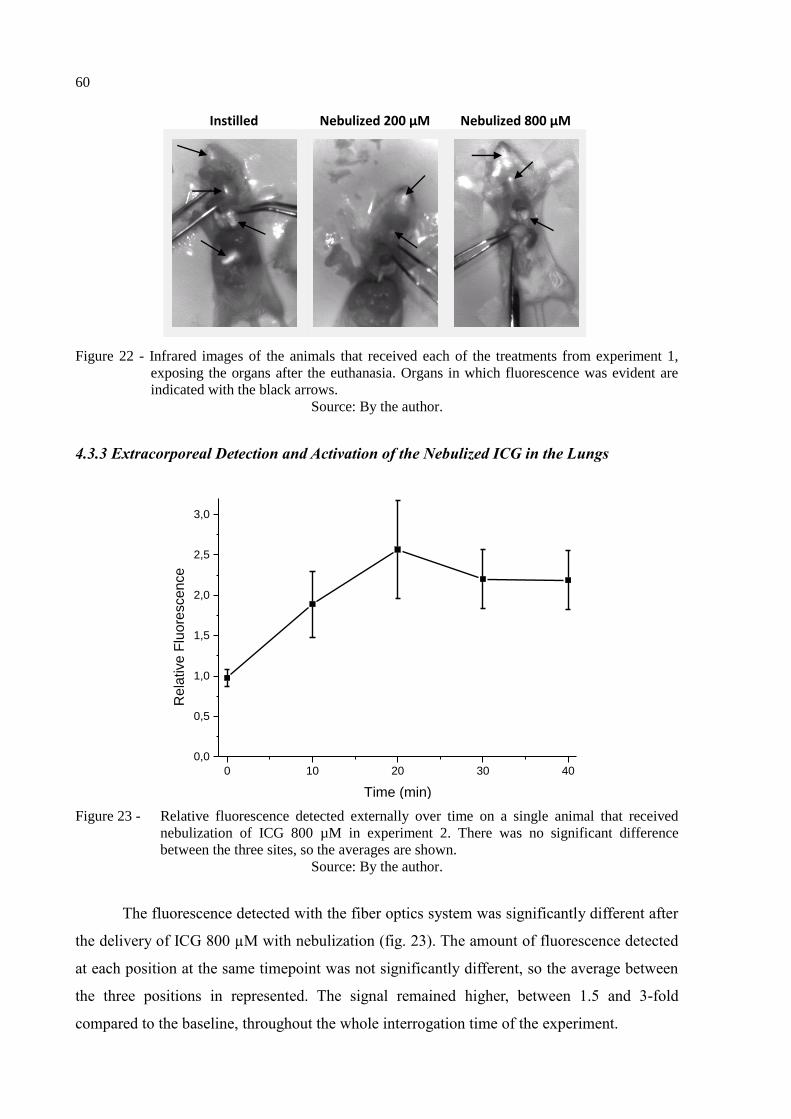
60
Figure 22 - Infrared images of the animals that received each of the treatments from experiment 1,
exposing the organs after the euthanasia. Organs in which fluorescence was evident are
indicated with the black arrows.
Source: By the author.
4.3.3 Extracorporeal Detection and Activation of the Nebulized ICG in the Lungs
0 10 20 30 40
0,0
0,5
1,0
1,5
2,0
2,5
3,0
Re
lative F
luo
rescen
ce
Time (min)
Figure 23 - Relative fluorescence detected externally over time on a single animal that received
nebulization of ICG 800 µM in experiment 2. There was no significant difference
between the three sites, so the averages are shown.
Source: By the author.
The fluorescence detected with the fiber optics system was significantly different after
the delivery of ICG 800 µM with nebulization (fig. 23). The amount of fluorescence detected
at each position at the same timepoint was not significantly different, so the average between
the three positions in represented. The signal remained higher, between 1.5 and 3-fold
compared to the baseline, throughout the whole interrogation time of the experiment.
Instilled Nebulized 200 µM Nebulized 800 µM
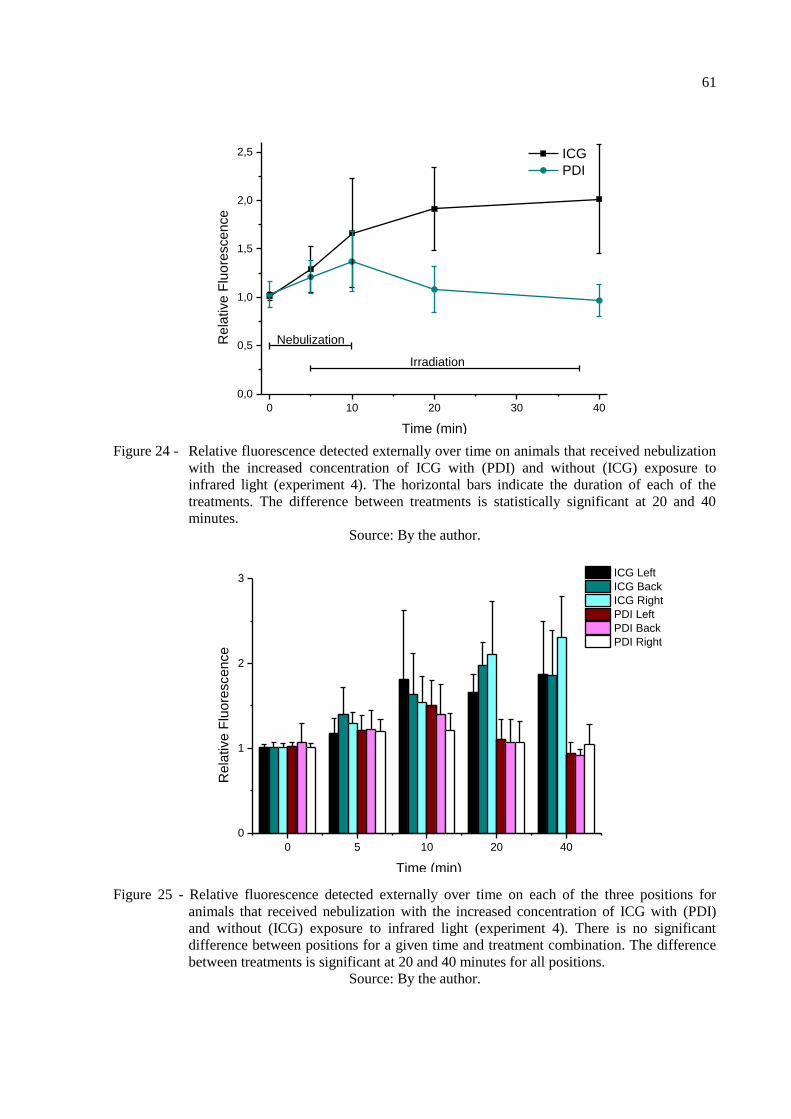
61
0 10 20 30 40
0,0
0,5
1,0
1,5
2,0
2,5
Re
lative F
luo
rescen
ce
Time (min)
ICG
PDI
Nebulization
Irradiation
Figure 24 - Relative fluorescence detected externally over time on animals that received nebulization
with the increased concentration of ICG with (PDI) and without (ICG) exposure to
infrared light (experiment 4). The horizontal bars indicate the duration of each of the
treatments. The difference between treatments is statistically significant at 20 and 40
minutes.
Source: By the author.
0 5 10 20 40
0
1
2
3
Time (min)
Re
lative F
luo
rescen
ce
ICG Left
ICG Back
ICG Right
PDI Left
PDI Back
PDI Right
Figure 25 - Relative fluorescence detected externally over time on each of the three positions for
animals that received nebulization with the increased concentration of ICG with (PDI)
and without (ICG) exposure to infrared light (experiment 4). There is no significant
difference between positions for a given time and treatment combination. The difference
between treatments is significant at 20 and 40 minutes for all positions.
Source: By the author.
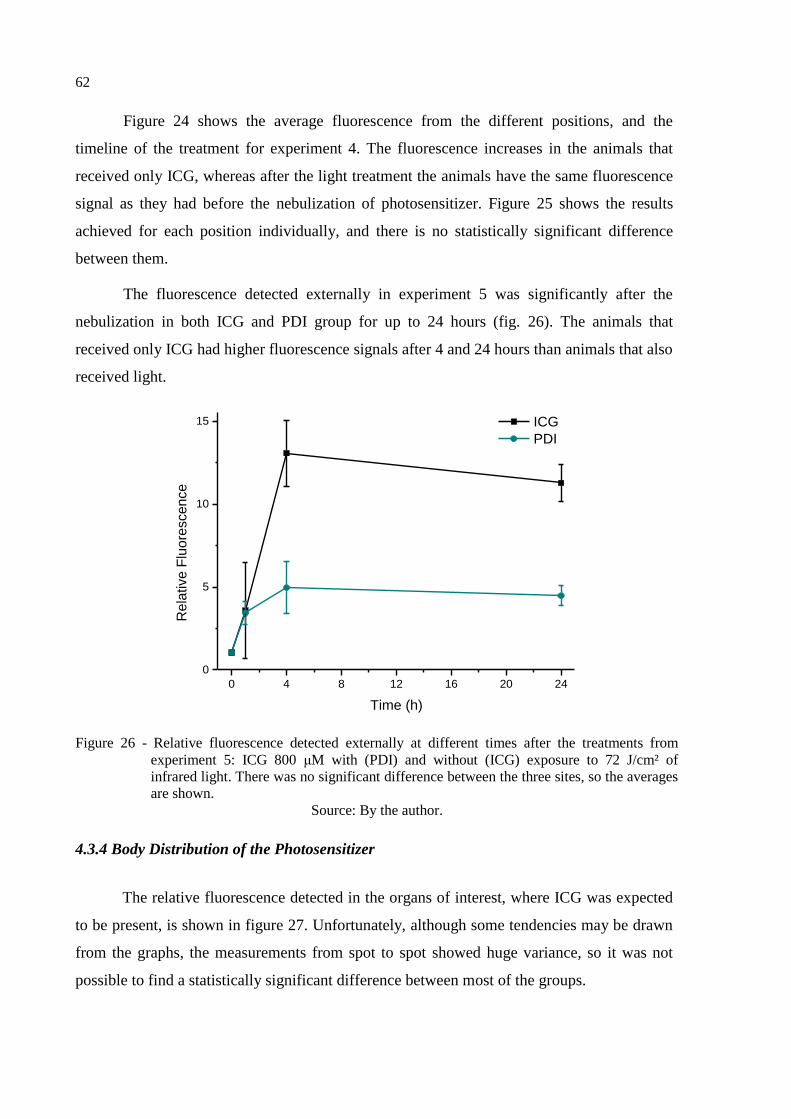
62
Figure 24 shows the average fluorescence from the different positions, and the
timeline of the treatment for experiment 4. The fluorescence increases in the animals that
received only ICG, whereas after the light treatment the animals have the same fluorescence
signal as they had before the nebulization of photosensitizer. Figure 25 shows the results
achieved for each position individually, and there is no statistically significant difference
between them.
The fluorescence detected externally in experiment 5 was significantly after the
nebulization in both ICG and PDI group for up to 24 hours (fig. 26). The animals that
received only ICG had higher fluorescence signals after 4 and 24 hours than animals that also
received light.
0 4 8 12 16 20 24
0
5
10
15
Rela
tive F
luore
scence
Time (h)
ICG
PDI
Figure 26 - Relative fluorescence detected externally at different times after the treatments from
experiment 5: ICG 800 μM with (PDI) and without (ICG) exposure to 72 J/cm² of
infrared light. There was no significant difference between the three sites, so the averages
are shown.
Source: By the author.
4.3.4 Body Distribution of the Photosensitizer
The relative fluorescence detected in the organs of interest, where ICG was expected
to be present, is shown in figure 27. Unfortunately, although some tendencies may be drawn
from the graphs, the measurements from spot to spot showed huge variance, so it was not
possible to find a statistically significant difference between most of the groups.

63
In the lungs, the signal increased after the nebulization, and remained higher than the
one for the control throughout the 24 hours, even for the groups that were treated with light.
In some cases, the fluorescence detected showed an increase of over 100-fold the baseline
value. In both lungs, only at 24 hours the fluorescence from the ICG group is significantly
higher than the one of PDI. In the stomach, the fluorescence signal peaks 4 hours after the
nebulization, for both treatments, and reaches over a hundred times the baseline for the ICG
group. At this time, the fluorescence signal for ICG is significantly higher than for PDI. At
24 hours, although some of the measurements were quite high, both ICG and PDI groups are
indistinguishable from the control.
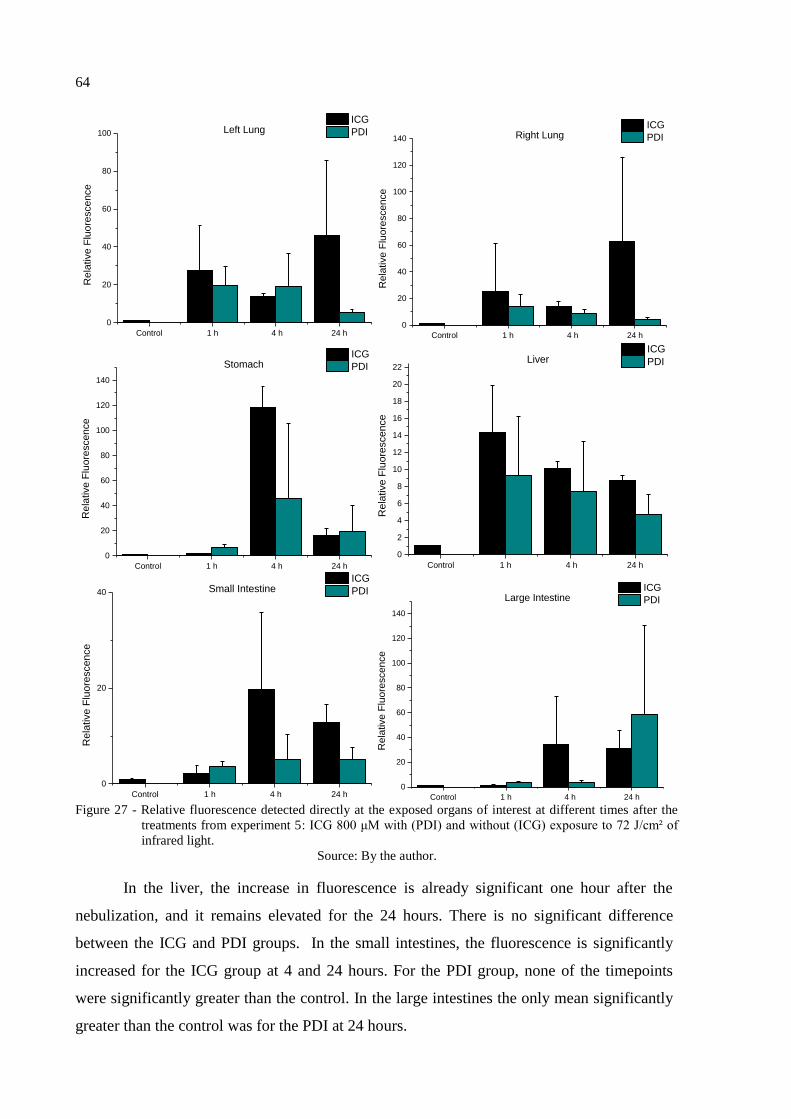
64
Control 1 h 4 h 24 h
0
20
40
60
80
100
Re
lative F
luo
rescen
ce
ICG
PDILeft Lung
Control 1 h 4 h 24 h
0
20
40
60
80
100
120
140
Rela
tive F
luore
scence
ICG
PDIRight Lung
Control 1 h 4 h 24 h
0
20
40
60
80
100
120
140
Rela
tive F
luore
scence
ICG
PDIStomach
Control 1 h 4 h 24 h
0
2
4
6
8
10
12
14
16
18
20
22
Re
lative F
luo
rescen
ce
ICG
PDILiver
Control 1 h 4 h 24 h
0
20
40
Re
lative F
luo
rescen
ce
ICG
PDISmall Intestine
Control 1 h 4 h 24 h
0
20
40
60
80
100
120
140
Rela
tive F
luore
scence
ICG
PDILarge Intestine
Figure 27 - Relative fluorescence detected directly at the exposed organs of interest at different times after the
treatments from experiment 5: ICG 800 μM with (PDI) and without (ICG) exposure to 72 J/cm² of
infrared light.
Source: By the author.
In the liver, the increase in fluorescence is already significant one hour after the
nebulization, and it remains elevated for the 24 hours. There is no significant difference
between the ICG and PDI groups. In the small intestines, the fluorescence is significantly
increased for the ICG group at 4 and 24 hours. For the PDI group, none of the timepoints
were significantly greater than the control. In the large intestines the only mean significantly
greater than the control was for the PDI at 24 hours.

65
Control 1 h 4 h 24 h
0
2
4
6
8
10
12
14R
ela
tive F
luo
rescen
ce
ICG
PDIBladder
Control 1 h 4 h 24 h
0
1
2
3
4
5
6
7
8
Re
lative F
luo
rescen
ce
ICG
PDISpleen
Control 1 h 4 h 24 h
0
2
4
6
8
10
12
Re
lative F
luo
rescen
ce
ICG
PDIHeart
Figure 28 - Relative fluorescence detected directly in the bladder, spleen and heart at different times
after the treatments from experiment 5: ICG 800 μM with (PDI) and without (ICG)
exposure to 72 J/cm² of infrared light.
Source: By the author.
The relative fluorescence detected in the other organs, where ICG was not expected
to be found, is shown in figure 28. In these organs, the increase in fluorescence was not as
high as in the organs of interest, reaching an increase of only about 10-fold the baseline
measurements. However, the results were much more consistent (note the smaller deviation
bars compared to the graphs in fig. 27). In the bladder, the increase in fluorescence is
significant for both ICG and PDI at 4 and 24 hours, and the results for the ICG group are
significantly larger then PDI at both timepoints. The same behavior is observed in the
measurements of the spleen and the heart, but in these organs the increase in the PDI group is
already noticeable at 1 hour.
Figure 29 presents a summary of the same data shown in figures 27 and 28. It makes it
possible to observe which organs showed the largest increase in fluorescence for each
treatment and time. After one hour, the highest fluorescence was measured in the lungs and

66
liver, for both treatments. After 4 hours, the stomach shows the largest relative fluorescence,
and after 24 hours, the highest increases in fluorescence were measured in the lungs (ICG)
and the large intestine (PDI). However, the high variance between measurements in each
organ limit the conclusions that can be drawn from it.
ICG 1 h ICG 4 h ICG 24 h
0
20
40
60
80
100
120
140
Re
lative F
luo
rescen
ce
Stomach
Left Lung
Right Lung
Liver
Small Intestine
Large Intestine
Bladder
Spleen
Heart
PDT 1 h PDT 4 h PDT 24 h
0
20
40
60
80
100
120
140
Re
lative F
luo
rescen
ce Stomach
Left Lung
Right Lung
Liver
Small Intestine
Large Intestine
Bladder
Spleen
Heart
PDI PDI PDI
Figure 29 - Summary of the relative fluorescence detected directly in the organs over time after each
treatment from experiment 5: ICG 800 μM with (PDI) and without (ICG) exposure to 72
J/cm² of infrared light.
Source: By the author.
An attempt to correlate the fluorescence detected in the lungs to the fluorescence
detected externally is shown in figure 30. This graph combines all the data collected from
controls, ICG and PDI groups. However, there was no linear correlation observed for neither
the right or the left side.
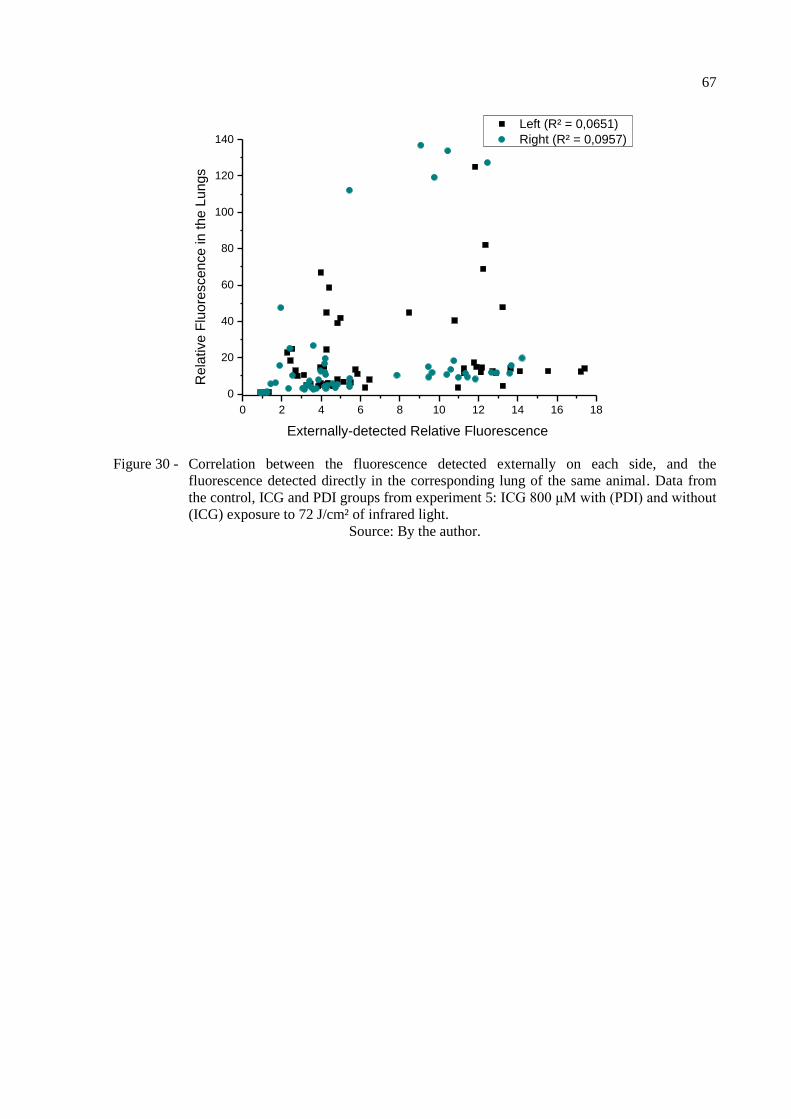
67
0 2 4 6 8 10 12 14 16 18
0
20
40
60
80
100
120
140
Left (R² = 0,0651)
Right (R² = 0,0957)
Re
lative F
luo
rescen
ce in
th
e L
un
gs
Externally-detected Relative Fluorescence
Figure 30 - Correlation between the fluorescence detected externally on each side, and the
fluorescence detected directly in the corresponding lung of the same animal. Data from
the control, ICG and PDI groups from experiment 5: ICG 800 μM with (PDI) and without
(ICG) exposure to 72 J/cm² of infrared light.
Source: By the author.

68
4.3.5 Tissue Damage and Immune Response
The histological analysis of experiment 3 showed that, 48 hours after the treatment,
the animals from both the control and treated groups had no sign of lung damage (fig. 31).
However, in experiments 4 and 5, all animals showed some level of alveolar thickening,
vascular congestion and inflammatory infiltration in the lungs (figs. 32 and 33). Comparing
the 10-fold magnification images, it is possible to see that only the latter two show patches of
thickened alveolar tissue. Still, in the semi-quantitative comparison, the positive controls
were distinguishably more injured than all the other groups. The lungs of the animals that
received ICG or the simulated PDI treatment showed no difference from the untreated or the
Light controls in neither experiment. There was no difference between the livers of the
animals from experiment 5 either (fig. 34).
Figure 31 - Representative histological slides of the lungs from control and treated animals from
experiment 3, with increasing magnification. Both groups showed healthy tissue, and
there was no difference between them. The scale bars correspond to 2000 μm (10x), 200
μm (100x) and 50 μm (400x).
Source: By the author.
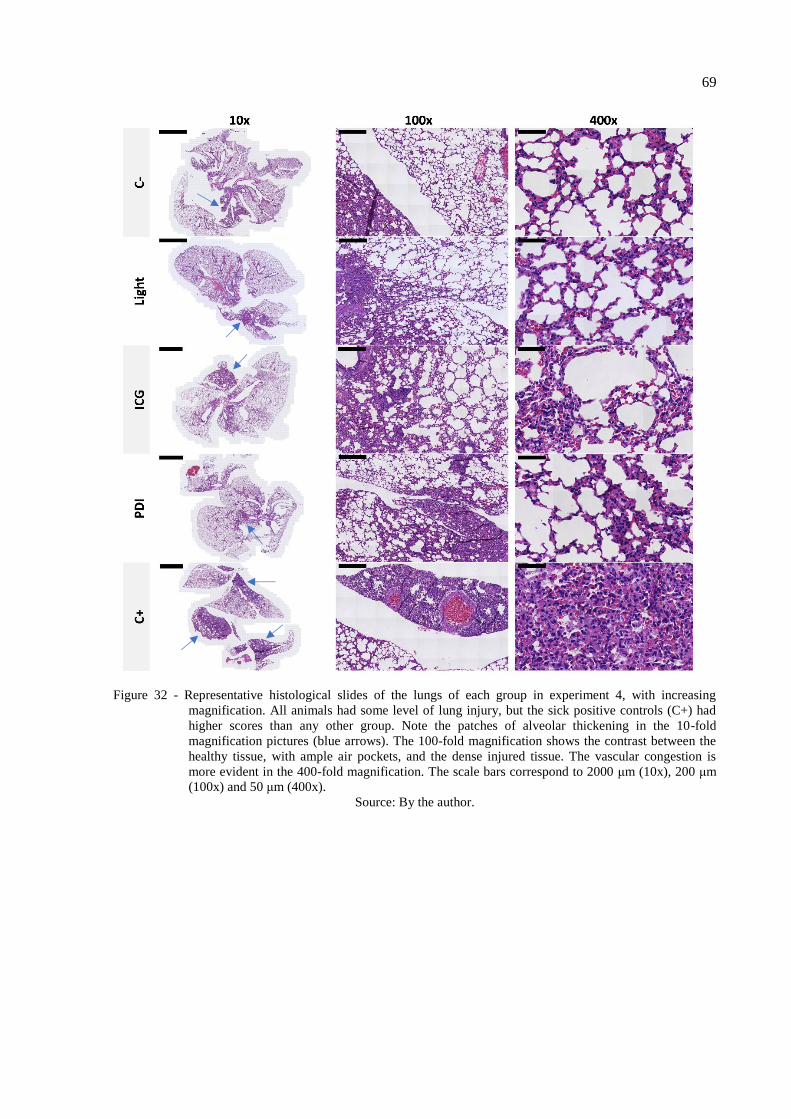
69
Figure 32 - Representative histological slides of the lungs of each group in experiment 4, with increasing
magnification. All animals had some level of lung injury, but the sick positive controls (C+) had
higher scores than any other group. Note the patches of alveolar thickening in the 10-fold
magnification pictures (blue arrows). The 100-fold magnification shows the contrast between the
healthy tissue, with ample air pockets, and the dense injured tissue. The vascular congestion is
more evident in the 400-fold magnification. The scale bars correspond to 2000 μm (10x), 200 μm
(100x) and 50 μm (400x).
Source: By the author.
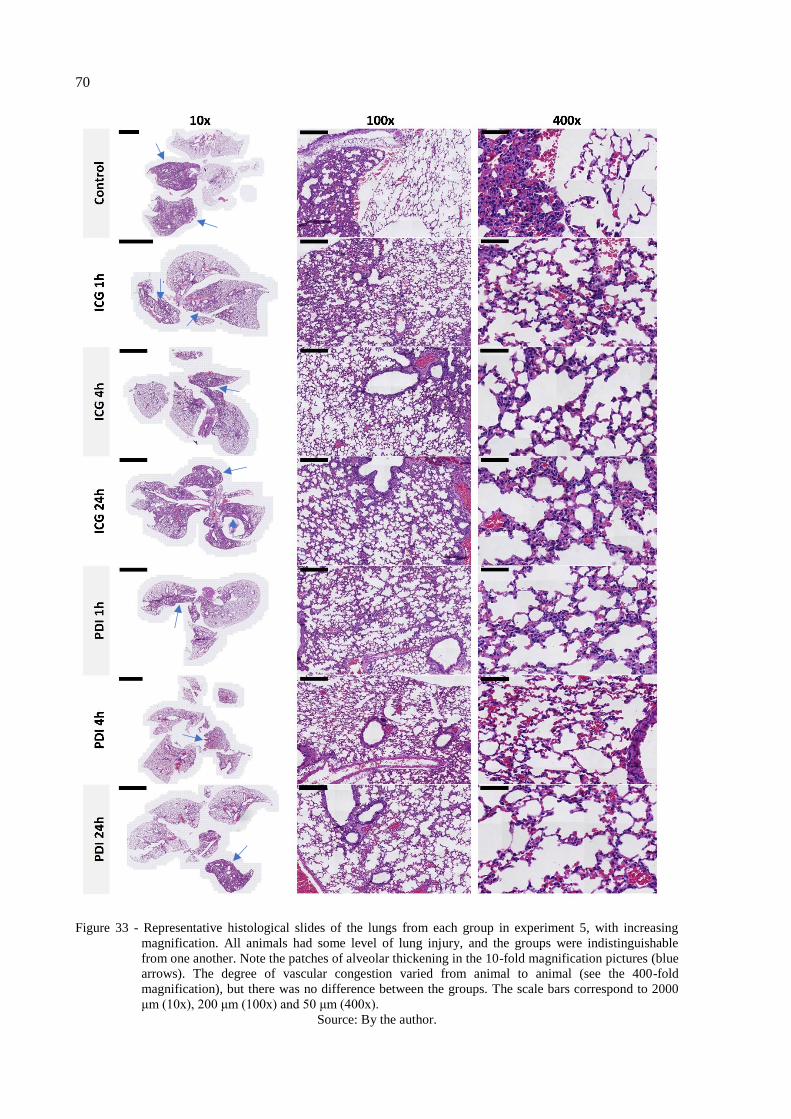
70
Figure 33 - Representative histological slides of the lungs from each group in experiment 5, with increasing
magnification. All animals had some level of lung injury, and the groups were indistinguishable
from one another. Note the patches of alveolar thickening in the 10-fold magnification pictures (blue
arrows). The degree of vascular congestion varied from animal to animal (see the 400-fold
magnification), but there was no difference between the groups. The scale bars correspond to 2000
μm (10x), 200 μm (100x) and 50 μm (400x).
Source: By the author.
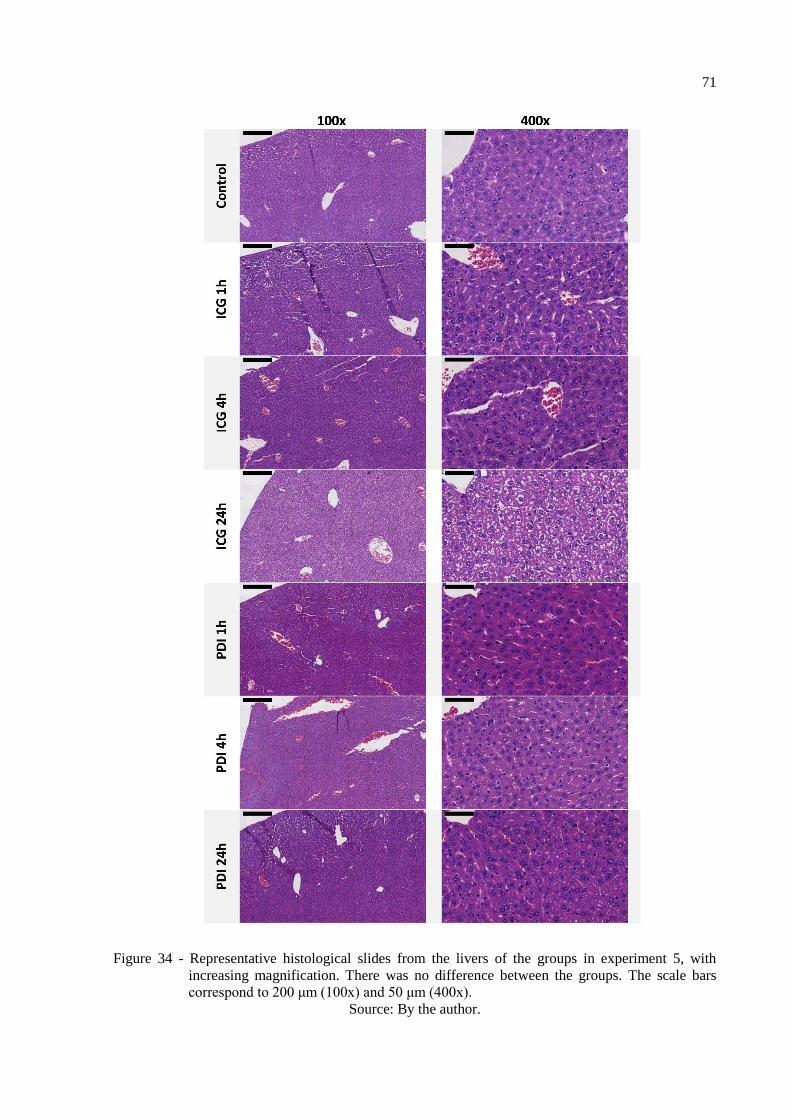
71
Figure 34 - Representative histological slides from the livers of the groups in experiment 5, with
increasing magnification. There was no difference between the groups. The scale bars
correspond to 200 μm (100x) and 50 μm (400x).
Source: By the author.

72
Finally, to further inquire about the immune response in the lungs, the composition of
the BALF of the animals from experiment 5 was investigated using flow cytometry. The
percentage of alveolar macrophages in the BALF after 1, 4 and 24 hours from
nebulization with ICG 800 µM with (PDI) and without (ICG) 72 J/cm² of infrared light
was compared against the controls (fig. 35). Although some of the animals had very
different percentages of macrophages than others, there was no significant different
between the averages of each group.
Control 1h 4h 24h
0
20
40
60
80
100
Macro
pha
ge
s (
%)
ICG
PDI
Figure 35 - Percentage of macrophages in the bronchoalveolar lavage fluid from the animals at
different times after either ICG alone or PDI. There was no significant difference
between groups.
Source: By the author.
4.4 Discussion
Since indocyanine green is a fluorescent dye, researchers have used its fluorescence signal
to infer about its distribution in the body. In 2013, Zhang and co-workers used a fiber-based
system to validate the development of a fluorescence molecular tomography method to study
the pharmacokinetics of intravenously given ICG.80
This study proposed the use of a similar
system to infer about the distribution of the photosensitizer delivered by nebulization within
the lungs and to other organs of mice. However, in light of the findings of the previous
chapter, that the main degradation product of ICG in water has a similar absorbance spectrum
than ICG itself (see fig. 15), there was an interest in making sure that the fluorescence
detection method would be selective to the active photosensitizer. Figure 20 shows the
fluorescence signal detected for a fresh ICG solution and a completely degraded ICG solution
73
using the experimental setup that was proposed for the animal studies. Although both
solutions absorb greatly at 780 nm, only the fresh ICG emits fluorescence in the selected
wavelength range. The degradation of ICG due to light exposure generates different
compounds than the degradation in water, and no longer absorbs light at 780 nm, so there was
no reason to assume such compounds would interfere with the readings. Thus, we proposed
that the only corrections to be made were regarding the autofluorescence of the tissues and
organs in which the measurements were made. For that, all the comparisons were made in
terms of relative fluorescence (of the obtained values by the average baseline fluorescence of
that given location).
The qualitative comparison using the infrared camera suggested that the distribution of
ICG in the body is different when delivered via instillation and nebulization. The fluorescence
detected externally in the animal that received instillation in figure 21 seems to come from the
stomach, where the fluorescence is strongest for this animal in figure 22. The lack of that
externally observable fluorescence in both the animals that received nebulization suggests that
the amount of photosensitizer that initially goes to the stomach is much smaller using this
method. This is important to notice because the ICG in the stomach could be activated by the
light in the PDI treatment and cause unwanted effects.
However, for the same concentration, the nebulization was not able to generate the same
fluorescence in the lungs as the instillation. The delivery of substances to the lungs of mice
using aerosols can be quite challenging because of their small tidal volume, and specially
using equipment that was designed for humans, the deposit in the upper respiratory tract
seems inevitable.73
Still, by increasing the concentration of ICG in the nebulized solution, it
was possible to see the fluorescence in the lungs. Moreover, ICG seems to be deposited in the
mouth and throat after instillation as well as nebulization.
The main difference between the two methods, besides the accumulation in the stomach,
is that much of the ICG is wasted in the nebulization, so the initial dose needs to be much
higher in the latter. The instillation delivered about 6 nmol of ICG, while 1.6 μmol had to be
put in the nebulizer in order to produce similar results. However, in humans, the efficiency of
the nebulization is expected to be much higher (as discussed in the previous chapter).
Although it was not possible to see the difference in external fluorescence using the
camera, the fiber optics setup showed that it significantly increased over time after
nebulization with the higher concentration of ICG (fig. 23). This result was already expected,
since the external fluorescence imaging presents a much lower signal. Using fluorescence
imaging, the influence of the scattering and absorption is significantly higher when compared

74
to the one observed using the fluorescence spectroscopy. The main advantage on using an
external measurement is the possibility to monitor the kinetics of the photosensitizer
distribution without the interference of a surgical procedure to allow the fiberoptic probe
positioning at the organ surface.
This motivated another experiment that compared the relative fluorescence after
nebulization with and without exposure to the light, simulating what would happen in the PDI
treatment (figs. 24 and 25). This time, the concentration of ICG was increased even more, in
the hope that the difference in fluorescence would be even more evident.
The first thing to notice from this experiment is that, if it is possible to detect such a
difference, it is also possible to activate the photosensitizer deep into the tissue with that
wavelength. This is a confirmation of what was predicted by our previous studies with animal
models.6,81
Secondly, the fluorescence continues to increase for some time after the end of the
nebulization, and the peak in relative fluorescence was not higher for the increased
concentration of ICG. More research is needed to explain this effect, but it is possibly related
to the high concentration of the photosensitizer (0.8 and 1.3 mM), in which it is known to
aggregate and self-quench.77
Perhaps due to the distribution of ICG within the respiratory
system, the aggregates become undone and there are more molecules emitting fluorescence.
This is relevant because light should reach the lungs while the photosensitizer is around the
bacteria, to enhance effectiveness, and hopefully before it reaches the deeper tissue, to prevent
collateral effects. However, aggregated ICG may not be effective in the PDI treatment, so the
timeline of the treatment should be studied carefully.
Figure 25 compared the three different parts of the thorax to choose the best location for a
future monitoring of the treatment. However, they all had similar profiles and standard
deviations, so none of them was clearly better than the others. Also, in the group that was
exposed to light the fluorescence returned to baseline after 20 minutes, which probably
indicates the photobleaching of ICG as it goes through the photodynamic process. This helped
confirm that the activation of ICG was in fact occurring and led to the assumption that the
light dose delivered after this time was perhaps unnecessary.
To see if that was in fact the case, the light dose was reduced to 72 J/cm² in experiment 5.
This time, the external fluorescence of the animals was monitored for up to 24 hours, as figure
26 shows. However, the relative fluorescence is significantly higher after the animals received
the simulated treatment, which means that this light dose was not sufficient to bleach all of
the ICG. The external fluorescence continues to increase until 4 hours after the nebulization
and remains elevated after 24h. This corroborates with the proposal that ICG is initially
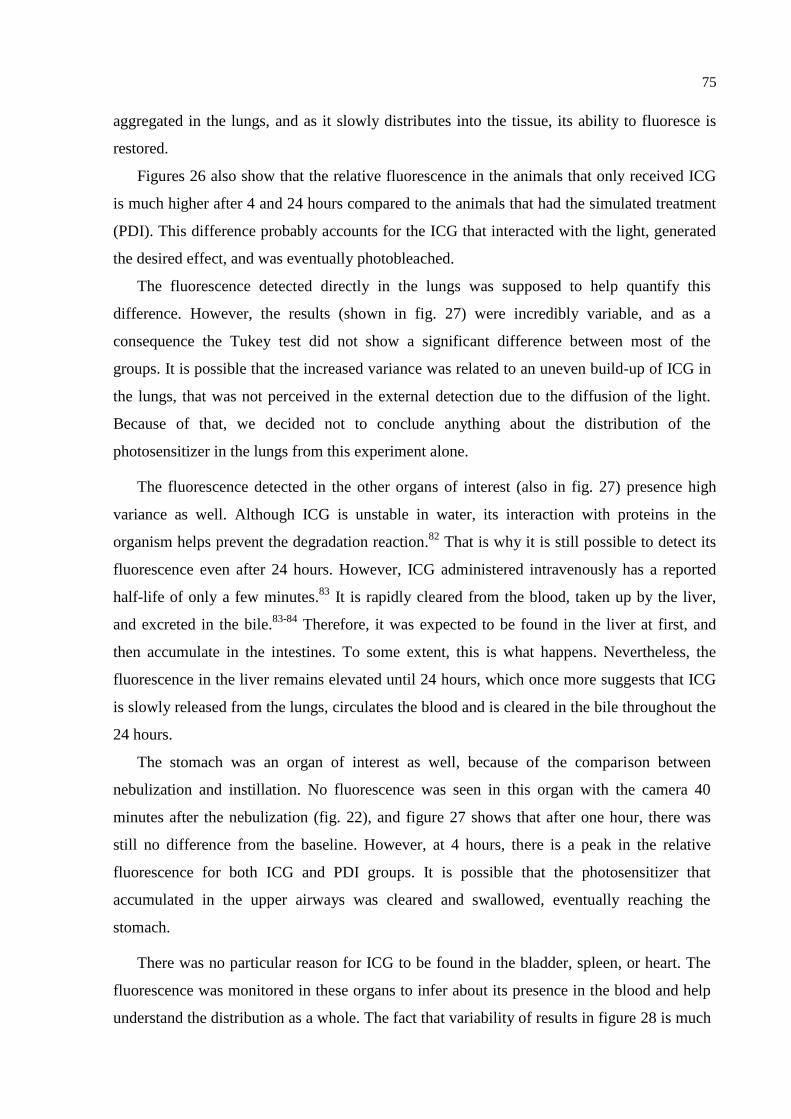
75
aggregated in the lungs, and as it slowly distributes into the tissue, its ability to fluoresce is
restored.
Figures 26 also show that the relative fluorescence in the animals that only received ICG
is much higher after 4 and 24 hours compared to the animals that had the simulated treatment
(PDI). This difference probably accounts for the ICG that interacted with the light, generated
the desired effect, and was eventually photobleached.
The fluorescence detected directly in the lungs was supposed to help quantify this
difference. However, the results (shown in fig. 27) were incredibly variable, and as a
consequence the Tukey test did not show a significant difference between most of the
groups. It is possible that the increased variance was related to an uneven build-up of ICG in
the lungs, that was not perceived in the external detection due to the diffusion of the light.
Because of that, we decided not to conclude anything about the distribution of the
photosensitizer in the lungs from this experiment alone.
The fluorescence detected in the other organs of interest (also in fig. 27) presence high
variance as well. Although ICG is unstable in water, its interaction with proteins in the
organism helps prevent the degradation reaction.82
That is why it is still possible to detect its
fluorescence even after 24 hours. However, ICG administered intravenously has a reported
half-life of only a few minutes.83
It is rapidly cleared from the blood, taken up by the liver,
and excreted in the bile.83-84
Therefore, it was expected to be found in the liver at first, and
then accumulate in the intestines. To some extent, this is what happens. Nevertheless, the
fluorescence in the liver remains elevated until 24 hours, which once more suggests that ICG
is slowly released from the lungs, circulates the blood and is cleared in the bile throughout the
24 hours.
The stomach was an organ of interest as well, because of the comparison between
nebulization and instillation. No fluorescence was seen in this organ with the camera 40
minutes after the nebulization (fig. 22), and figure 27 shows that after one hour, there was
still no difference from the baseline. However, at 4 hours, there is a peak in the relative
fluorescence for both ICG and PDI groups. It is possible that the photosensitizer that
accumulated in the upper airways was cleared and swallowed, eventually reaching the
stomach.
There was no particular reason for ICG to be found in the bladder, spleen, or heart. The
fluorescence was monitored in these organs to infer about its presence in the blood and help
understand the distribution as a whole. The fact that variability of results in figure 28 is much

76
smaller in these organs than the organs of interest suggests that the latter could be a
consequence of how ICG distributes in the healthy organs, and not necessarily because of an
animal-to-animal variability. These results also support the belief that part of the ICG
delivered was degraded by the light exposure in the PDI groups, and that the photosensitizer
is gradually released from the lungs to the rest of the body.
Figure 29 allows for the comparison of the relative fluorescence changes over time
throughout the body. In the first hour, the highest values of relative fluorescence were found
in the lungs and the liver. Since the extracorporeal activation covers the entire thorax, it
could unintentionally activate ICG in the stomach, liver and heart. If the timeline of the
treatment is similar to the ones presented in experiments 3 to 5, in which the illumination
starts during or right after the nebulization and goes on for 20-33 minutes, the liver would be
the organ most susceptible to collateral effects. On the other hand, treatment schedules with a
longer waiting period could potentially harm the stomach.
Unfortunately, the high variance between the results limits a further discussion of the
topic. Thus, detecting the fluorescence directly into the surface of the organs showed to be a
limited technique to study the biodistribution of ICG. The difference in fluorescence from
spot to spot suggest that the distribution, especially in the lungs, is not homogenous.
Therefore, the presented results do not necessarily represent the organs as a whole. This
method was initially proposed because of its simplicity. However, better results would
probably be obtained from extracting the photosensitizer from the organs, which is complex
in itself, and using more sophisticated techniques, like HPLC-MS.
This high variance also translated into a lack of correlation between the fluorescence
detected in the lungs, and externally through the sides of the thorax (fig. 30). The external
detection was much more consistent than the direct one, probably because the light diffused
through the tissue and the uneven distribution of ICG from spot to spot did not matter as
much. It was not possible to validate a real-time treatment monitoring proposal with this
technique, but it does not mean that the external fluorescence does not correlate to the
average ICG concentration in the lungs. The combination of extraction from the tissues and
HPLC analysis is a possible method to overcome this problem, too.
Regarding the tissue damage of the treatment, experiment 3 provided the initial
comparison between the simulated treatment and the controls (fig. 31). In experiment 4, the
concentration of ICG and the nebulization time were increased to simulate a more intense
treatment, and light-only, ICG-only and positive controls were included (fig. 32). In
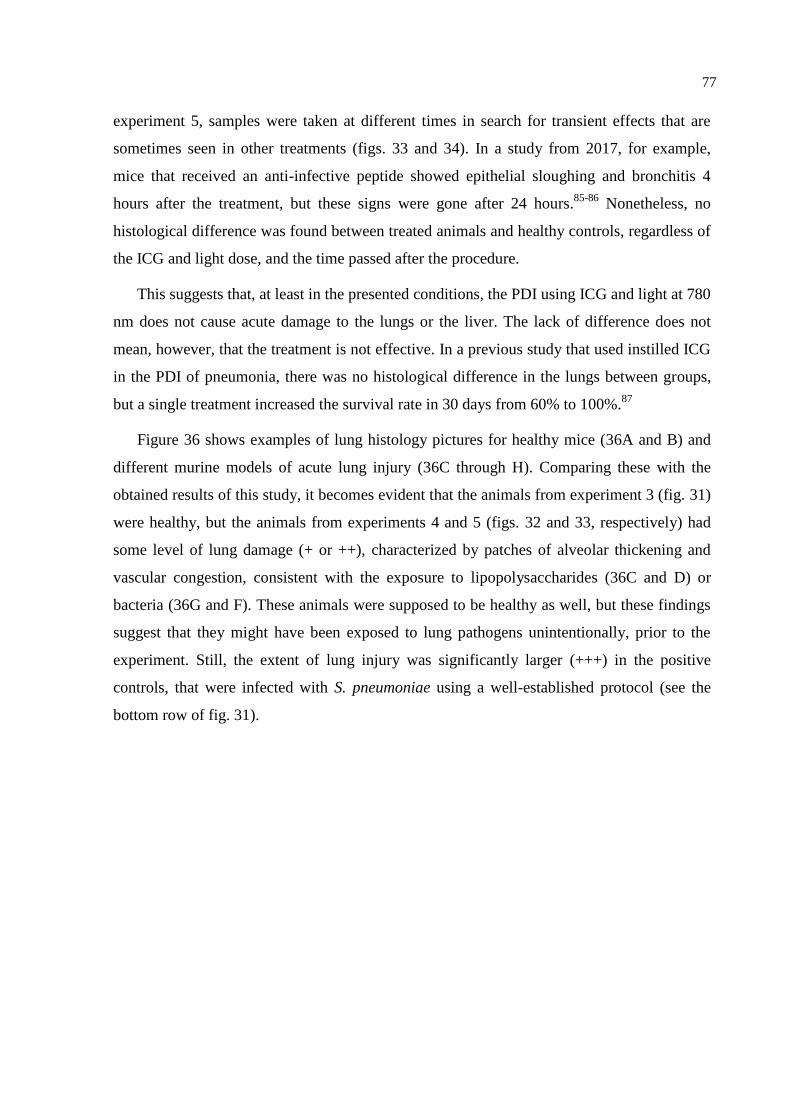
77
experiment 5, samples were taken at different times in search for transient effects that are
sometimes seen in other treatments (figs. 33 and 34). In a study from 2017, for example,
mice that received an anti-infective peptide showed epithelial sloughing and bronchitis 4
hours after the treatment, but these signs were gone after 24 hours.85-86
Nonetheless, no
histological difference was found between treated animals and healthy controls, regardless of
the ICG and light dose, and the time passed after the procedure.
This suggests that, at least in the presented conditions, the PDI using ICG and light at 780
nm does not cause acute damage to the lungs or the liver. The lack of difference does not
mean, however, that the treatment is not effective. In a previous study that used instilled ICG
in the PDI of pneumonia, there was no histological difference in the lungs between groups,
but a single treatment increased the survival rate in 30 days from 60% to 100%.87
Figure 36 shows examples of lung histology pictures for healthy mice (36A and B) and
different murine models of acute lung injury (36C through H). Comparing these with the
obtained results of this study, it becomes evident that the animals from experiment 3 (fig. 31)
were healthy, but the animals from experiments 4 and 5 (figs. 32 and 33, respectively) had
some level of lung damage (+ or ++), characterized by patches of alveolar thickening and
vascular congestion, consistent with the exposure to lipopolysaccharides (36C and D) or
bacteria (36G and F). These animals were supposed to be healthy as well, but these findings
suggest that they might have been exposed to lung pathogens unintentionally, prior to the
experiment. Still, the extent of lung injury was significantly larger (+++) in the positive
controls, that were infected with S. pneumoniae using a well-established protocol (see the
bottom row of fig. 31).
78
Figure 36 - Comparison of selected models of acute lung injury. A and B: normal mouse lungs. The
alveolar walls are very thin, and the majority of the alveoli contain no cells
(magnification in A, 100x; B, 400x). C and D: lungs from a mouse euthanized 18 h after
intratracheal instillation of 5 ng/g lipopolysaccharide. Note the patchy nature of the injury
(C, 100x) and the presence of inflammatory infiltrates and vascular congestion (D, 400x).
E and F: lungs from a mouse euthanized 21 days after the administration of intratracheal
bleomycin. Note the presence of fibrotic areas (arrows) (E, 200x; F, 400x). G and H:
lungs from a mouse euthanized 12 h after aerosolization of Escherichia coli, 1 x 10⁸
CFU/mL. Note diffuse thickening of the alveolar spaces and intra-alveolar neutrophilic
infiltrates (G, 200x; H, 400x). HE stain.
Source: Adapted from MATUTE-BELLO et al. 88
79
Figure 37 - Histopathology of mice treated with 5 mg/kg of talaporfin sodium (Laserphyrin®) and 50
J/cm² of light (664 nm laser) including the tumor and adjacent normal liver tissue. The
regional boundary line between the laser radiation area and the outside was clear (a). The
bottom row of pictures shows: the tumor (b); ischemic necrosis and focally living
hepatocytes around Glisson in the peripheral area of the irradiation (c); and the slight
denatured hepatocytes around the irradiation area (d). HE stain.
Source: KASUYA et al.89
There was also no difference between the livers of the animals from experiment 5 (fig.
34). An example of liver damage caused by PDT is shown in figure 37. Because there was
evidence of ICG in the liver 1 hour after the treatment (from fig. 27), there was a chance that
there would already be some photosensitizer in this organ during the illumination, causing
ischemic necrosis (like the one on fig. 37C). The absence of signs of necrosis suggests that
the proposed treatment is safe for the liver.
The findings from the flow cytometry analysis of experiment 5 support the argument that
there was no difference between treated and control animals (fig. 35). However, the high
variability between subjects limits the drawing of conclusions from this experiment. The
number of cells that were properly stained and detected by the equipment was small and
varied greatly between samples (not shown). Thus, the BALF recovery and staining
protocols should be improved for future experiments.
Furthermore, the study was overall limited by the small number of subjects in each
group. The experiments 1 and 2 were proof-of-concept pilots, so a single animal was used for
each group. However, for experiment 3 to 5, three animals in each group were probably not
sufficient to overcome the high variability that is intrinsic to living creatures. Ethics plays a
huge role in deciding how many animals should be used in an experiment, but future
discussions of these findings would benefit from replicating the presented experiments.
80
4.5 Conclusion
The findings of this study suggest that nebulization is a viable method for the delivery of
the photosensitizer indocyanine green to the respiratory tract in the photodynamic inactivation
of pneumonia. In the murine model, both instilled and nebulized ICG are deposited in the
upper and lower respiratory tract, but only instillation creates an immediate build-up of this
photosensitizer in the lungs. However, the dose of ICG required using nebulization needs to
be much higher than using instillation in order to yield similar results.
It is possible to verify the activation of nebulized ICG with extracorporeal light using
fluorescence. The characteristic emission of this photosensitizer increases over time after
delivery by nebulization and is reduced after illumination with infrared light. However, the
return of the fluorescence signal to baseline does not seem to correspond to the complete
consumption of the photosensitizer. ICG is slowly released from the lungs and is present in
many organs for at least 24 hours after the nebulization, even if the animal goes through the
illumination. This combination of nebulized ICG and extracorporeal light does not seem to be
harmful to the lungs or livers of mice.
Although it is possible to infer about the presence of ICG in the body by detecting its
fluorescence, this method was not considered ideal for the detection of ICG directly in the
exposed organs, since the variation of results from spot to spot was impressively high. More
research is required to fully understand the distribution and the effects of the photosensitizer
in the lungs and other organs after the pulmonary administration.
81
5 CONCLUSIONS
This study proposed to investigate the applicability of nebulization as a delivery method
for photosensitizers, in the hope to advance the research of the photodynamic inactivation of
bacterial pneumonia. It showed that the photosensitizers indocyanine green, Photodithazine®
and Photogem® are all compatible with the Omron NE C-801 jet nebulizer, and present
attributes that suggest that the delivery to the lungs of patients will be efficient. It also showed
conditions in which it was possible to: deliver indocyanine green using jet nebulization to a
murine model; activate it using extracorporeal infrared light; and not cause acute lung or liver
damage. However, questions remain to be answered regarding the body distribution of the
photosensitizer in the organism after the pulmonary delivery, and the immune infiltration after
the treatment. Still, nebulization presented itself as a promising tool for the delivery of
photosensitizers to the respiratory tract.

82

83
REFERENCES
1 LOZANO, R. et al. Global and regional mortality from 235 causes of death for 20 age
groups in 1990 and 2010: a systematic analysis for the Global Burden of Disease Study 2010.
Lancet, v. 380, n. 9859, p. 2095–2128, 2012.
2 ACUTE Lower Respiratory Infections. In: GIBSON, G. J. et al. (Ed.) European lung white
book: European Respiratory Society. 2013. p. 210–223. Available from:
<https://www.erswhitebook.org/files/public/Chapters/18_ALRIs.pdf>. Accessible at: 23 Jan.
2017.
3 MAISCH, T. Anti-microbial photodynamic therapy: useful in the future? Lasers in
Medical Science, v. 22, n. 2, p. 83–91, 2007.
4 KASHEF, N.; HAMBLIN, M.R. Can microbial cells develop resistance to oxidative stress
in antimicrobial photodynamic inactivation? Drug Resistance Updates, v. 31, p. 31–42,
2017. doi.org/10.1016/j.drup.2017.07.003.
5 LEITE, I. S. et al. Near-infrared photodynamic inactivation of S. pneumoniae and its
interaction with RAW 264.7 macrophages. Journal of Biophotonics, v. 11, n. 1, 2017. doi:
10.1002/jbio.201600283.
6 GERALDE, M. C. et al. Pneumonia treatment by photodynamic therapy with extracorporeal
illumination: an experimental model. Physiological Reports, v. 5, n. 5, p. e13190, 2017.
7 STENTON, C. et al. Jet and ultrasonic nebuliser output: use of a new method for direct
measurement of aerosol output. Thorax, v. 45, n. 10, p. 728–732, 1990.
8 RESTREPO, et al. Aerosolized antibiotics. Respiratory Care, v. 60, n. 6, p. 762–773,
2015.
9 NUNES, S. E. A. et al. Hospitalization costs of severe bacterial pneumonia in children:
comparative analysis considering different costing methods. Einstein (São Paulo), v. 15, n. 2,
p. 212–219, 2017.
10 CASSIDY, C. M. et al. Drug and light delivery strategies for photodynamic antimicrobial
chemotherapy (PACT) of pulmonary pathogens: a pilot study. Photodiagnosis and
Photodynamic Therapy, v. 8, n. 1, p. 1–6, 2011.
11 WORLD HEALTH ORGANIZATION. The top 10 causes of death. 2016. Available
from: <http://www.who.int/en/news-room/fact-sheets/detail/the-top-10-causes-of-death#>.
Accessible at: 13 Jun. 2018.
12 WALLIHAN, R.; RAMILO, O. Community-acquired pneumonia in children: current
challenges and future directions. Journal of Infection, v. 69, n. S1, p. S87–S90, 2014.
13 CORRÊA, R. D. A. et al. Brazilian guidelines for community-acquired pneumonia in
immunocompetent adults - 2009. Jornal Brasileiro de Pneumologia: publicacao oficial da
sociedade brasileira de pneumologia e tisilogia, v. 35, n. 6, p. 574–601, 2009.
84
14 CILLÓNIZ, C. et al. Microbial aetiology of community-acquired pneumonia and its
relation to severity. Thorax, v. 66, n. 4, p. 340–346, 2011.
15 ISTURIZ, R.E. et al. Clinical and economic burden of pneumonia among adults in Latin
America. International Journal of Infectious Diseases, v. 14, n. 10, p. e852–e856, 2010.
16 GUPTA, R.K. et al. Bacterial pneumonia and pandemic influenza planning. Emerging
Infectious Diseases, v. 14, n. 8, p. 1187–1192, 2008.
17 NAIR, G.B.; NIEDERMAN, M. S. Nosocomial Pneumonia. Lessons Learned. Critical
Care Clinics, v. 29, n. 3, p. 521–546, 2013.
18 JONES, R. N. Microbial etiologies of hospital‐acquired bacterial pneumonia and
ventilator‐associated bacterial pneumonia. Clinical Infectious Diseases, v. 51, n. S1, p. S81–
S87, 2010.
19 TORRES, A. Antibiotic treatment against methicillin-resistant staphylococcus aureus
hospital-and ventilator-acquired pneumonia: a step forward but the battle continues. Clinical
Infectious Diseases, v. 54, n. 5, p. 630–632, 2012.
20 GOULD, I. M. et al. New insights into meticillin-resistant Staphylococcus aureus (MRSA)
pathogenesis, treatment and resistance. International Journal of Antimicrobial Agents, v.
39, n. 2, p. 96–104, 2012.
21 MENDES, R. E. et al. Linezolid update: stable in vitro activity following more than a
decade of clinical use and summary of associated resistance mechanisms. Drug Resistance
Updates, v. 17, n. 1-2, p. 1–12, 2014.
22 FELDMAN, C.; ANDERSON, R. Review: current and new generation pneumococcal
vaccines. Journal of Infection, v. 69, n. 4, p. 309–325, 2014.
23 IMMUNISATION against respiratory diseases. In: GIBSON, G. J. et al. (Ed.). European
lung white book: European Cystic Fibrosis Society. 2013, p. 306–315. Available from:
<https://www.erswhitebook.org/files/public/Chapters/26_immunisation.pdf>. Accessible at:
23 Jan. 2017.
24 RAAB, O. Über die Wirkung fluorescirender Stoffe auf Infusorien. Zeitschrift für
Biologie, v. 1, n. 39, p. 524, 1900.
25 KHARKWAL, G. B. et al. Photodynamic therapy for infections: clinical applications.
Lasers in Surgery and Medicine, v. 43, n. 7, p. 755–767, 2012.
26 WAINWRIGHT, M.; BAPTISTA, M. S. The application of photosensitisers to tropical
pathogens in the blood supply. Photodiagnosis and Photodynamic Therapy, v. 8, n. 3, p.
240–248, 2011.
27 AGOSTINIS, P. et al. Photodynamic therapy of cancer: an update. CA: a cancer journal
for clinicians, v. 61, n. 4, p. 250–281, 2011.

85
28 BALDEA, I.; FILIP, A. Photodynamic therapy in melanoma-an update. Journal of
Physiology and Pharmacology, v. 63, n. 2, p. 109–118, 2012.
29 GORMAN, A. et al. In vitro demonstration of the heavy-atom effect for photodynamic
therapy. Journal of the American Chemical Society, v. 126, n. 34, p. 10619–10631, 2004.
30 LIM, C. et al. Indocyanine green fluorescence imaging in the surgical management of liver
cancers: current facts and future implications. Journal of Visceral Surgery, v. 151, n. 2, p.
117–124, 2014.
31 FICKWEILER, S. et al. Indocyanine green: intracellular uptake and phototherapeutic
effects in vitro. Journal of Photochemistry and Photobiology B: biology, v. 38, p. 178–183,
1997.
32 SHEMESH, C.S. et al. Indocyanine green loaded liposome nanocarriers for photodynamic
therapy using human triple negative breast cancer cells. Photodiagnosis and Photodynamic
Therapy, v. 11, n. 2, p. 193–203, 2014.
33 BOEHM, T. K.; CIANCIO, S. G. Diode laser activated indocyanine green selectively kills
bacteria. Journal of the International Academy of Periodontology, v. 13, n. 2, p. 58–63,
2011.
34 MONZAVI, A. et al. Antimicrobial photodynamic therapy using diode laser activated
indocyanine green as an adjunct in the treatment of chronic periodontitis: a randomized
clinical trial. Photodiagnosis and Photodynamic Therapy, v. 14, p. 93–97, 2016. doi:
10.1016/j.pdpdt.2016.02.007.
35 TOPALOGLU, N. et al. The role of reactive oxygen species in the antibacterial
photodynamic treatment: Photoinactivation vs proliferation. Letters in Applied
Microbiology, v. 62, n. 3, p. 230–236, 2016.
36 ROMANKO, Y. S. et al. Effect of photodynamic therapy with photodithazine on
morphofunctional parameters of M-1 sarcoma. Bulletin of Experimental Biology and
Medicine, v. 138, n. 6, p. 584–589, 2004.
37 FERREIRA, J. et al. Photostability of different chlorine photosensitizers. Laser Physics
Letters, v. 5, n. 2, p. 156–161, 2008.
38 JUZENIENE, A. Chlorin e6-based photosensitizers for photodynamic therapy and
photodiagnosis. Photodiagnosis and Photodynamic Therapy, v. 6, n. 2, p. 94–96, 2009.
39 SILVA, R. C. Avaliação da eficiência fotodinâmica de fotossensibilizadores com
aplicação em terapia fotodinâmica. 2007. 71 p. Dissertação (Mestrado em Ciências) -
Instituto de Química de São Carlos, Universidade de São Paulo, São Carlos, 2007.
40 QUISHIDA, C. et al. Susceptibility of multispecies biofilm to photodynamic therapy using
Photodithazine® Lasers in Medical Science, v. 30, n. 2, p. 685–694, 2015.
41 DOVIGO, L. N. et al. Photodynamic inactivation of four Candida species induced by
Photogem®. Brazilian Journal of Microbiology, v. 41, n. 1, p. 42–49, 2010.

86
42 MELO, C. A. S. et al. Pharmacokinetics of Photogem using fluorescence monitoring in
wistar rats. Journal of Photochemistry and Photobiology B: biology, v. 73, n. 3, p. 183–
188, 2004.
43 ALLISON, R. R.; SIBATA, C. H. Oncologic photodynamic therapy photosensitizers: a
clinical review. Photodiagnosis and Photodynamic Therapy, v. 7, n. 2, p. 61–75, 2010.
44 ORMOND, A. B.; FREEMAN, H. S. Dye sensitizers for photodynamic therapy.
Materials, v. 6, n. 3, p. 817–840, 2013.
45 MENEZES, P. F. C. et al. Influence of pH on the phototransformation process of
Photogem®. Laser Physics, v. 19, n. 7, p. 1457–1462, 2009.
46 MIMA, E. G. O. et al. Susceptibility of Candida albicans to photodynamic therapy in a
murine model of oral candidosis. Oral Surgery, Oral Medicine, Oral Pathology, Oral
Radiology and Endodontology, v. 109, n. 3, p. 392–401, 2010.
47 MIMA, E. G. et al. Comparison of photodynamic therapy versus conventional antifungal
therapy for the treatment of denture stomatitis: a randomized clinical trial. Clinical
Microbiology and Infection, v. 18, n. 10, p. E380–E388, 2012.
48 BUZZÁ, H. H. et al. Evaluation of vascular effect of photodynamic therapy in
chorioallantoic membrane using different photosensitizers. Journal of Photochemistry and
Photobiology B: biology, v. 138, p. 1–7, 2014. doi: 10.1016/j.jphotobiol.2014.04.023.
49 HUANG, Y. et al. Low-level laser therapy: an emerging clinical paradigm. SPIE
Newsroom, n. 9, p. 1–3, 2009. doi: 10.1117/2.1200906.1669.
50 LIM, H. J.; OH, C. H. Indocyanine green-based photodynamic therapy with 785nm light
emitting diode for oral squamous cancer cells. Photodiagnosis and Photodynamic Therapy,
v. 8, n. 4, p. 337–342, 2011.
51 CHATTERJEE, D. K. et al. Nanoparticles in photodynamic therapy: an emerging
paradigm. Advanced Drug Delivery Reviews, v. 60, n. 15, p. 1627–1637, 2008.
52 MONTAZERABADI, A. R. et al. The effects of combined treatment with ionizing
radiation and indocyanine green-mediated photodynamic therapy on breast cancer cells.
Journal of Photochemistry and Photobiology B: biology, v. 109, p. 42–49, 2012.
53 MUERS, M. F. Overview of nebuliser treatment. Thorax, v. 52, Suppl. 2, p. S25–S30,
1997.
54 REYCHLER, G. et al. Effect of drug targeting nebulization on lung deposition: a
randomized crossover scintigraphic comparison between central and peripheral delivery.
Respiratory Care, v. 59, n. 10, p. 1501–1507, 2014.
55 ELHISSI, A. M. A. et al. Nebulization of ultradeformable liposomes: the influence of
aerosolization mechanism and formulation excipients. International Journal of
Pharmaceutics, v. 436, n. 1-2, p. 519–526, 2012.

87
56 HOU, S. et al. Practical, regulatory and clinical considerations for development of
inhalation drug products. Asian Journal of Pharmaceutical Sciences, v. 10, n. 6, p. 490–
500, 2015.
57 IBRAHIM, M. et al. Inhalation drug delivery devices: technology update. Medical
Devices, v. 8, p. 131–9, 2015. doi: 10.2147/MDER.S48888.
58 ARZHAVITINA, A.; STECKEL, H. Surface active drugs significantly alter the drug
output rate from medical nebulizers. International Journal of Pharmaceutics, v. 384, n. 1-2,
p. 128–136, 2010.
59 CLARK, A. R. The use of laser diffraction for the evaluation of the aerosol clouds
generated by medical nebulizers. International Journal of Pharmaceutics, v. 115, n. 1, p.
69–78, 1995.
60 NIVEN, R. W.; BRAIN, J. D. Some functional aspects of air-jet nebulizers. International
Journal of Pharmaceutics, v. 104, n. 1, p. 73–85, 1994.
61 ARI, A. Jet, ultrasonic, and mesh nebulizers: an evaluation of nebulizers for Better clinical
outcomes. Eurasian Journal of Pulmonology, v. 16, p. 1–7, 2014. doi:
10.5152/ejp.2014.00087.
62 DIEDERIK, H. et al. Drug output of unvented jet nebulizers as a function of time.
International Journal of Pharmaceutics, v. 257, n. 1-2, p. 33–39, 2003.
63 SHIKOWITZ, M. J. et al. Efficacy of DHE photodynamic therapy for respiratory
papillomatosis: immediate and long-term results. Laryngoscope, v. 108, n. 7, p. 962–967,
1998.
64 SHIKOWITZ, M. J. et al. Clinical trial of photodynamic therapy with meso-tetra
(Hydroxyphenyl) chlorin for respiratory papillomatosis. Archives of Otolaryngology–Head
& Neck Surgery, v. 131, n. 2, p. 99, 2005.
65 DOVIGO, L. N. et al. Photodynamic inactivation of clinical isolates of Candida
using Photodithazine®. Biofouling, v. 29, n. 9, p. 1057–1067, 2013.
66 RAPPAPORT, P. L.; THIESSEN, J. J. High-pressure liquid chromatographic analysis of
indocyanine green. Journal of Pharmaceutical Sciences, v. 71, n. 2, p. 157–161, 1982.
67 STOEV, G. et al. Identification of porphyrin modified photosensitizer porfimer sodium
and its precursors by high performance liquid chromatography and mass spectrometry.
Journal of Chromatography A, v. 1145, n. 1-2, p. 141–148, 2007.
68 ISAKAU, H. A. et al. HPLC study of chlorin e6 and its molecular complex with
polyvinylpyrrolidone. Biomedical Chromatography, v. 21, n. 3, p. 318–325, 2007.
69 RUDOLF, G. et al. Modelling and algebraic formulation of regional aerosol deposition in
man. Journal of Aerosol Science, v. 21, SUPPL. 1, p. 403–406, 1990.

88
70 KOLLEF, M. H. et al. Aerosolized antibiotics: do they add to the treatment of pneumonia?
Current Opinion in Infectious Diseases, v. 26, n. 6, p. 538–544, 2013.
71 NEWMAN, S. P. Lung deposition from nebulizers. European Respiratory Review, v. 10,
n. 72, p. 224–227, 2000.
72 DUBUS, J. C. et al. Aerosol deposition in neonatal ventilation. Pediatric Research, v. 58,
n. 1, p. 10–14, 2005.
73 NADITHE, V. et al. Evaluation of nose-only aerosol inhalation chamber and comparison
of experimental results with mathematical simulation of aerosol deposition in mouse lungs.
Journal of Pharmaceutical Sciences, v. 92, n. 5, p. 1066–1076, 2003.
74 NAJLAH, M. et al. The effects of suspension particle size on the performance of air-jet,
ultrasonic and vibrating-mesh nebulisers. International Journal of Pharmaceutics, v. 461,
n. 1-2, p. 234–241, 2014.
75 HERTEL, S. P. et al. Protein stability in pulmonary drug delivery via nebulization.
Advanced Drug Delivery Reviews, v. 93, p. 79–94, 2015.
doi.org/10.1016/j.addr.2014.10.003.
76 LEE, W. H. et al. Inhalation of nanoparticle-based drug for lung cancer treatment:
advantages and challenges. Asian Journal of Pharmaceutical Sciences, v. 10, n. 6, p. 481–
489, 2015.
77 SAXENA, V. et al. Degradation kinetics of indocyanine green in aqueous solution.
Journal of Pharmaceutical Sciences, v. 92, n. 10, p. 2090–2097, 2003.
78 ENGEL, E. et al. Light-induced decomposition of indocyanine green. Investigative
Ophthalmology and Visual Science, v. 49, n. 5, p. 1777–1783, 2008.
79 GOVONE, A. B. Desenvolvimento de um sistema de imagem de campo amplo de
fluorescência para localização de linfonodo sentinela empregando indocianina verde. 2016. 88p. Dissertação (Mestrado em Ciências) - Instituto de Física de São Carlos,
Universidade de São Paulo, São Carlos, 2016.
80 ZHANG, G. et al. Imaging of pharmacokinetic rates of indocyanine green in mouse liver
with a hybrid fluorescence molecular tomography/x-ray computed tomography system.
Journal of Biomedical Optics, v. 18, n. 4, p. 040505, 2013.
81 GERALDE, M. C. et al. Pulmonary decontamination for photodynamic inactivation with
extracorporeal illumination. Proceedings of SPIE, v. 8927, 2014.
doi.org/10.1117/12.2039366.
82 CRULL, J.; SCHAFER, S. A. Indocyanine green degradation during high-intensity laser
radiation. Proceedings of SPIE, v. 2671, p. 243–250, 1996. doi.org/10.1117/12.240014.
83 YASEEN, M. A. et al. Biodistribution of encapsulated indocyanine green in healthy mice.
Molecular Pharmaceutics, v. 6, n. 5, p. 1321–1332, 2009.
89
84 CHEN, C. Y. et al. A liquid chromatography tandem mass spectrometry method for the
quantification of indocyanine green in dog plasma and bile. Journal of Pharmaceutical and
Biomedical Analysis, v. 47, n. 2, p. 351–359, 2008.
85 KWON, E. J. et al. Supporting information - porous silicon nanoparticle delivery of
tandem peptide anti-infectives for the treatment of pseudomonas aeruginosa lung infections.
Advanced Materials, v. 29, n. 35, 2017. Available from:
<https://onlinelibrary.wiley.com/action/downloadSupplement?doi=10.1002%2Fadma.201701
527&attachmentId=207790740>. Accessible at: 23 Jan. 2018.
86 KWON, E. J. et al. Porous silicon nanoparticle delivery of tandem peptide anti-infectives
for the treatment of Pseudomonas aeruginosa lung infections. Advanced Materials, v. 29, n.
35, p. 1701527, 2017.
87 GERALDE, M. C. Avaliação in vivo da inativação fotodinâmica para tratamento de
pneumonia. 2017. 110 p. Tese (Doutorado em Biotecnologia ) - Centro de Ciências Exatas e
Tecnológicas, Universidade Federal de São Carlos, São Carlos, 2017.
88 MATUTE-BELLO, G. et al. Animal models of acute lung injury. American Journal of
Physiology, v. 295, n. 3, p. L379–L399, 2008.
89 KASUYA, K. et al. Novel photodynamic therapy against biliary tract carcinoma using
mono-L-aspartyl chlorine e6: basic evaluation for its feasibility and efficacy. Journal of
Hepato-Biliary-Pancreatic Sciences, v. 17, n. 3, p. 313–321, 2010.

90

91
APPENDIX A – Chromatograms of the photosensitizer solutions before and after
nebulization
Total Mass Chromatogram: freshly prepared PDZ
Total Mass Chromatogram: nebulized PDZ
Total Wavelength Chromatogram: freshly prepared PDZ
Total Wavelength Chromatogram: nebulized PDZ
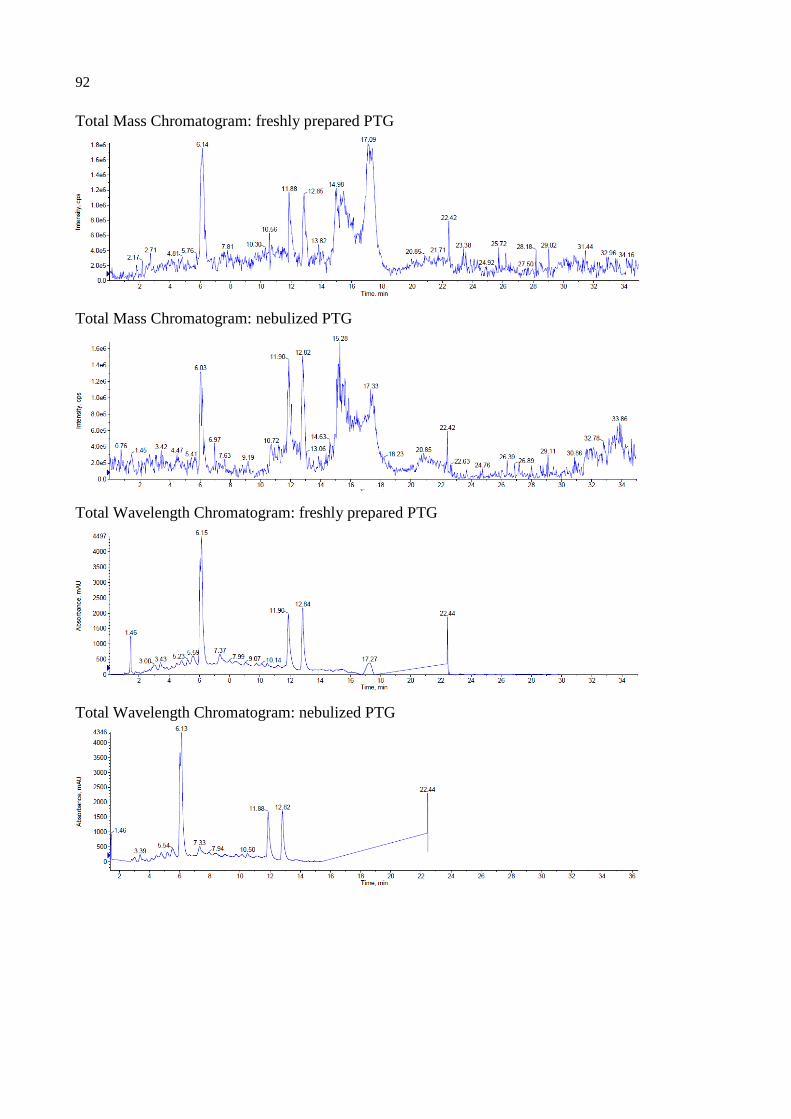
92
Total Mass Chromatogram: freshly prepared PTG
Total Mass Chromatogram: nebulized PTG
Total Wavelength Chromatogram: freshly prepared PTG
Total Wavelength Chromatogram: nebulized PTG
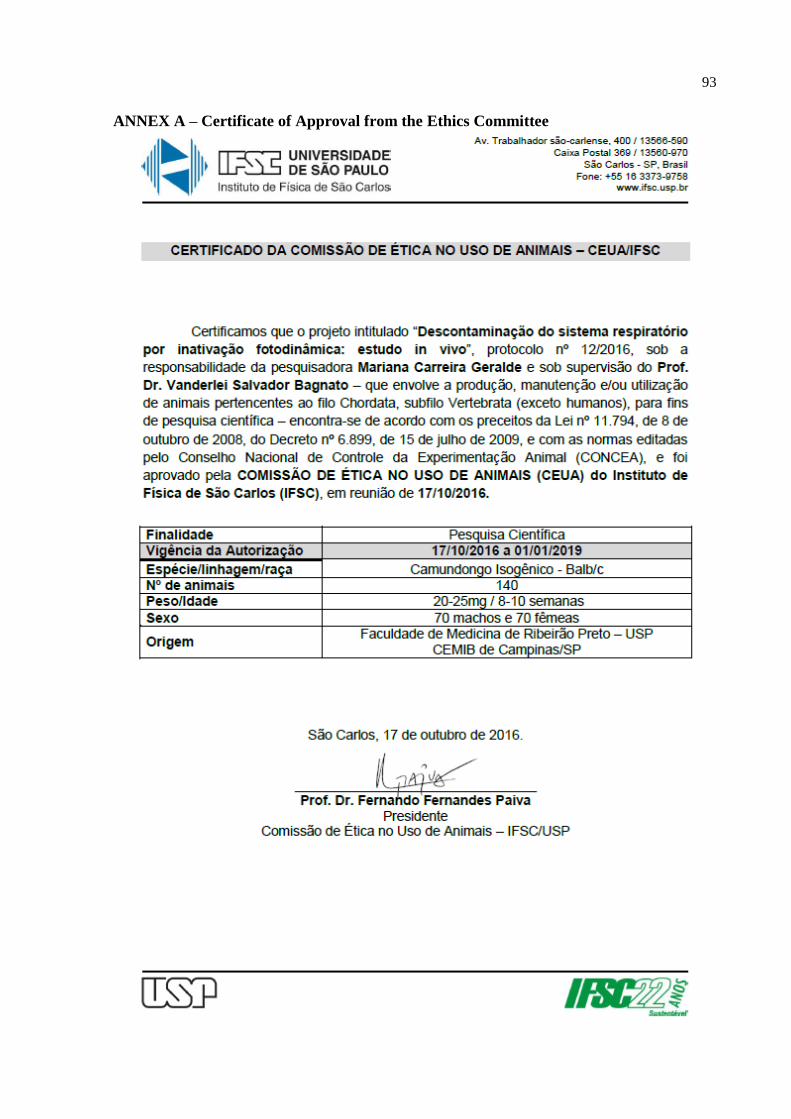
93
ANNEX A – Certificate of Approval from the Ethics Committee