UNIVERSIDAD DE GRANADAhera.ugr.es/tesisugr/26414090.pdf · 2017-03-07 · Agradecer al Prof. Em....
289
UNIVERSIDAD DE GRANADA PROGRAMA DE DOCTORADO EN QUÍMICA FACULTAD DE CIENCIAS Departamento de Química Inorgánica TESIS DOCTORAL Desarrollo de filtros basados en materiales de carbón nanoestructurados para la separación o purificación de gases Development of filters based on nanostructured carbon materials for gas separation and purification Jose Francisco Vivo Vilches Granada, Febrero 2017
Transcript of UNIVERSIDAD DE GRANADAhera.ugr.es/tesisugr/26414090.pdf · 2017-03-07 · Agradecer al Prof. Em....

UNIVERSIDAD DE GRANADA
PROGRAMA DE DOCTORADO EN QUÍMICA
FACULTAD DE CIENCIAS
Departamento de Química Inorgánica
TESIS DOCTORAL
Desarrollo de filtros basados en materiales de carbón nanoestructurados para la separación o
purificación de gases
Development of filters based on nanostructured carbon materials for gas separation and purification
Jose Francisco Vivo Vilches
Granada, Febrero 2017

Editor: Universidad de Granada. Tesis DoctoralesAutor: José Francisco Vivo VílchesISBN: 978-84-9163-129-3URI: http://hdl.handle.net/10481/45129

Desarrollo de filtros basados en materiales de carbón
nanoestructurados para la separación o purificación de gases
Por
JOSE FRANCISCO VIVO VILCHES
Memoria presentada para aspirar al grado de Doctor por la Universidad de Granada
Fdo.: Jose Francisco Vivo Vilches Licenciado en Química
Los Directores de la Tesis
Prof. Dr. Francisco J. Maldonado Hódar Catedrático del Departamento de Química Inorgánica, Universidad de Granada
Prof. Dr. Francisco Carrasco Marín Catedrático del Departamento de Química Inorgánica, Universidad de Granada


DESARROLLO DE FILTROS BASADOS EN MATERIALES DE CARBÓN NANOESTRUCTURADOS PARA LA SEPARACIÓN O PURIFICACIÓN DE GASES
Tesis presentada para aspirar al grado de Doctor en Química por
JOSE FRANCISCO VIVO VILCHES
Realizada bajo la dirección del Catedrático de Química Inorgánica Prof. Dr. Francisco José Maldonado Hódar y del Catedrático de Química Inorgánica Prof. Dr. Francisco Carrasco Marín, en la Facultad de Ciencias de la Universidad de Granada, y juzgada el día 24 de Febrero de 2017, en dicha Facultad, por el siguiente Tribunal: PRESIDENTE:
Prof. Dr. Carlos Moreno Castilla, Catedrático de Química Inorgánica, Universidad de Granada.
VOCALES:
Prof. Dr. Isabel Suelves Laiglesia, Investigadora Científica, Instituto de Carboquímica, CSIC, Zaragoza. Prof. Dra. Vanessa Fierro Pastor, Research Director, Centre National de la Recherche Scientifique, Université de Lorraine, Francia. Prof. Dr. Miguel Ángel Álvarez Merino, Profesor titular de Química Inorgánica, Universidad de Jaen.
SECRETARIO:
Prof. Dra. María Angeles Ferro García, Catedrática de Química Inorgánica, Universidad de Granada.

Francisco José Maldonado Hódar y Francisco Carrasco Marín como directores de la presente Tesis Doctoral y el doctorando Jose Francisco Vivo Vilches GARANTIZAN QUE el trabajo ha sido realizado por el doctorando respetando los derechos de otros autores a ser citados cuando se han utilizado sus resultados o publicaciones. Y para que conste a los efectos oportunos, en el cumplimiento de la legislación vigente, firmamos el presente certificado en Granada a 2 de Febrero del 2017.
Fdo.: Francisco J. Maldonado Hódar Catedrático de Química Inorgánica de
la Universidad de Granada
Fdo.: Francisco Carrasco Marín
Catedrático de Química Inorgánica de la Universidad de Granada
Fdo.: Doctorando Jose F. Vivo Vilches Licenciado en Química


“Caminante, son tus huellas el camino y nada más;
caminante, no hay camino, se hace camino al andar.
(…) Caminante no hay camino sino estelas en la mar…”
Antonio Machado, Cantares
“God made the bulk; surfaces were invented by the devil.”
Wolfgang Pauli


Agradecimientos: No puedo comenzar de otra forma, sino agradeciendo a mis Directores de Tesis, Prof.
Dr. Francisco José Maldonado Hódar y Prof. Dr. Francisco Carrasco Marín, por su
dirección durante este arduo y laborioso camino que supone la realización de una tesis
doctoral. Gracias por vuestros sabios consejos, por vuestra ayuda y por todo lo que he
aprendido y disfrutado compartiendo momentos inolvidables con vosotros.
Agradecer también al Prof. Dr. Agustín Francisco Pérez Cadenas por su incondicional
ayuda siempre que la he necesitado. Gracias también por darme la oportunidad de asistir
a diversos cursos, congresos y reuniones científicas a nivel tanto nacional como
internacional, que me han permitido conocer a algunos de los grandes científicos en el
campo de la adsorción y de los materiales de carbón.
Al Prof. Dr. Carlos Moreno Castilla por darme la oportunidad de realizar esta Tesis en
el Grupo de Investigación en Materiales de Carbón de la Universidad de Granada y por
la formación adquirida al compartir con él docencia en la asignatura Química Inorgánica
III del Grado en Química. También a los profesores José Rivera, Isidora Bautista y
María Ángeles Ferro por su cariño, aprecio e inestimable ayuda.
Han sido muchos años en el laboratorio, en los que ha pasado mucha gente por el
mismo, a la que quiero agradecer su amistad y apoyo en momentos difíciles. A los que
se fueron Zula, Esther, David, Hakim, María Helena, Carmen, Fran y Abdallah, y a los
que se quedan Jesica, Hesham muchas gracias y mucha suerte en vuestro futuro.
También a los que, aunque en otros laboratorios, han compartido grupo y grandes
momentos como Mahmoud, Raúl, Valente, Jacob, Iván, Ricardo, Ana e Inma. Y por
supuesto, a todos los que pasaron por aquí en algún momento: Adrián, Camilo, Amra,
Damarys, Luis, Adriana, Estefania, Karol, Amra y Tatiana.
Agradecer al Prof. Em. Alirio Rodrigues por permitirme trabajar en el LSRE de la
Facultad de Ingeniería de la Universidad de Oporto, ciudad en la que pasé tres meses
inolvidables de la mano de los compañeros de laboratorio de allí Mariana, Rui, Maria
João, Patricia, Christoph, Miguel y de los que no fueron compañeros pero con los que
pasé muy buenos momentos, María, Marina, Raquel y, en especial, Sergio y Luisa que

hicieron las veces de padres adoptivos. Por supuesto, no me puedo olvidar de Alexandre
y Ana Mafalda, que estuvieron desde el minuto uno ayudándome en todo lo que
necesité y dirigiendo mi trabajo durante mi estancia allí.
Quiero agradecer también al Grupo de Carbones de la Universidad de Jaén: Vicky,
Miguel Ángel, María, y Paco, por sus consejos y amistad.
A los miembros del Centro de Investigación Científica de la Universidad de Granada,
especialmente a Alicia e Isabel Sánchez (Técnicos especialistas en SEM) y a Miguel
Ángel Salas (Técnico especialista en Análisis Termogravimétrico).
A mis padres y a mi hermano en particular y a mi familia en general, por apoyarme en
todo momento y ser mi sustento en los momentos difíciles. A mis amigos y compañeros
de piso durante estos años, por todo lo que han hecho por mí. Y por supuesto, a Rocío,
mi compañera en los buenos y malos momentos, mi guía y mi ánimo para seguir
caminando juntos.
Este trabajo no habría sido posible sin todos vosotros, por ello, otra vez GRACIAS.
Este Trabajo de Investigación ha sido financiado por el Ministerio de Educación,
Cultura y Deportes, dentro del programa de Formación del Profesorado Universitario.
El doctorando y los directores también quieren agradecer la financiación recibida por
parte de distintas entidades: Ministerio de Ciencia e Innovación, proyecto CTM2010-
18889; Junta de Andalucía, proyecto P12-RNM-2892; y Ministerio de Economía y
Competitividad, proyecto CTQ2013-44789-R.

a Inmaculada y Jose Francisco, mis padres
a Carlos, mi hermano
a Rocío, mi compañera en este viaje


Contenidos y
estructura de la Tesis


CONTENIDOS Y ESTRUCTURA DE LA TESIS
En la presente Tesis se describe el uso de materiales de carbón para la
adsorción de compuestos orgánicos volátiles presentes en biocombustibles, la
separación de isómeros de octano y la adsorción selectiva de dióxido de carbono
presente en el biogás. Para ello, se han sintetizado carbones activados a partir de
residuos lignocelulósicos (hueso de aceituna y pelets de madera) y geles de
carbón obtenidos a partir de aerogeles y xerogeles de resorcinol y formaldehído.
Los materiales han sido caracterizados tanto a nivel textural como químico y la
adsorción de los distintos contaminantes se ha ensayado en régimen dinámico y
estático.
El capítulo I trata sobre la obtención de materiales de carbón y su uso en
el tratamiento de emisiones contaminantes procedentes de biocombustibles, así
como en el refinado de dichos biocombustibles y de biogás. Comienza con un
resumen de la situación energética global y del papel de los materiales de carbón
en lo referente al uso de biocombustibles y biogás. Posteriormente se describe la
obtención de carbones activados a partir de diversas materias primas, diferentes
métodos de activación y de funcionalización de la superficie. También se trata
en profundidad la versatilidad que ofrece el proceso sol-gel para obtener
materiales nanoestructurados con diferentes propiedades texturales y químicas a
partir de geles derivados de la polimerización del resorcinol y el formaldehído.
Por último se concretan las razones para usar este tipo de materiales tanto en la
prevención de emisiones contaminantes durante el repostaje en dispositivos tipo
canister de vehículos a motor, como en el refinado de biocombustibles y biogás.
En el capítulo II se describen la síntesis de los distintos materiales de
carbón obtenidos, las técnicas empleadas para su caracterización a nivel textural
y químico y los distintos métodos usados para probar los adsorción de los
distintos contaminantes en régimen estático y dinámico. Además, se muestran
las ecuaciones y modelos matemáticos aplicados para analizar los resultados.

El capítulo III versa sobre la preparación y caracterización de carbones
activados con hidróxido potásico a partir de hueso de aceituna con distinto
contenido en oxígeno. La caracterización química y textural de las muestras se
llevó a cabo mediante diversas técnicas, con las que se pudo obtener información
acerca de la naturaleza y distribución de los distintos grupos oxigenados
generados.
En el capítulo IV se emplean los materiales obtenidos en el capítulo
anterior en la adsorción monocomponente tanto en régimen estático como
dinámico de n-octano y etanol, ambos componentes mayoritarios de
biocombustibles y elegidos por su distinta naturaleza química. La capacidad de
adsorción de las distintas muestras para los dos compuestos se relaciona con sus
propiedades físico-químicas.
En el capítulo V se analizan la adsorción competitiva de etanol y n-
octano en los carbones activados con distinto grado de oxidación y la influencia
de la humedad. Los cambios producidos en las curvas de rotura respecto a la
adsorción monocomponente se relacionan con el carácter hidrofóbico/hidrofílico
de la superficie del adsorbente y con la naturaleza del compuesto a adsorber.
Finalmente, se ajusta la composición del lecho adsorbente para optimizar la
adsorción simultánea de ambos compuestos.
Estos tres capítulos demuestran la versatilidad del carbón activado
derivada de la posibilidad de modificar la química superficial presente en la
estructura carbonosa. De esta forma, mediante tratamientos de oxidación y
eliminación selectiva de grupos oxigenados podemos modular el
comportamiento adsorbente de los materiales en función de la naturaleza del
compuesto que quiere ser adsorbido.
El capítulo VI recoge los resultados para la separación de n-octano y
2,2',4-trimetilpentano (TMP) mediante aerogeles y xerogeles de carbón
obtenidos por catálisis ácida. También se analizan los cambios en la
microporosidad del xerogel al ser activado físicamente con dióxido de carbono a

distintos grados de activación. Finalmente, se analiza la influencia del tipo de
secado y del grado de activación de la serie de xerogeles en la adsorción y
separación de ambos isómeros. El capítulo pone de manifiesto la utilidad del
proceso sol-gel para obtener materiales de carbón nanoestructurados en los
cuales podemos ajustar el tamaño de la porosidad para obtener tamices
moleculares de carbón que son capaces de separar moléculas pequeñas.
En el capítulo VII se estudia el uso de carbón activado obtenido por
activación física con dióxido de carbono de pelets de madera de pino como
adsorbente selectivo de CO2 en biogás. Para ello el material es caracterizado y se
obtienen y analizan tanto las isotermas a alta presión de dióxido de carbono y
metano, como la adsorción en dinámico de ambos compuestos
(monocomponente y binaria). Los resultados obtenidos se relacionan con las
propiedades texturales de la muestra.
Por último, en el capítulo VIII se desarrolla la síntesis y caracterización
de un xerogel de carbón obtenido mediante catálisis básica y su empleo en la
adsorción selectiva de CO2 frente a CH4. El comportamiento adsorbente se
investiga mediante el análisis de las isotermas a alta presión y las curvas de
rotura a distintas concentraciones para ambos gases. Al igual que en el caso del
carbón activado obtenido a partir de madera de pino el comportamiento
adsorbente del xerogel se relaciona con sus propiedades texturales.
Estos dos últimos capítulos ponen de manifiesto la utilidad de los
materiales de carbón tanto tradicionales (obtenidos a partir de residuos
lignocelulósicos) como más novedosos (geles de carbón nanoestructurados) en
procesos de adsorción y separación de gases y, concretamente, en el refinado de
biogás por adsorción selectiva de dióxido de carbono.
La mayor parte de los resultados de esta Tesis Doctoral han sido
publicados en revistas científicas especializadas de alto índice de impacto y
difusión internacional:

J.F. Vivo-Vilches, E. Bailón-García, A.F. Pérez-Cadenas, F. Carrasco-
Marín, and F.J. Maldonado-Hódar, Tailoring the surface chemistry and
porosity of activated carbons: Evidence of reorganization and mobility of
oxygenated surface groups, Carbon, 68 (2014) 520-530.
J.F. Vivo-Vilches, E. Bailón-García, A.F. Pérez-Cadenas, F. Carrasco-
Marín, and F.J. Maldonado-Hódar, Tailoring activated carbons for the
development of specific adsorbents of gasoline vapors, Journal of
Hazardous Materials, 263, Part 2 (2013) 533-540.
J.F. Vivo-Vilches, A.F. Pérez-Cadenas, F. Carrasco-Marín, and F.J.
Maldonado-Hódar, About the control of VOCs emissions from blended
fuels by developing specific adsorbents using agricultural residues,
Journal of Environmental Chemical Engineering, 3 (2015) 2662-2669.
J.F. Vivo-Vilches, F. Carrasco-Marín, A.F. Pérez-Cadenas, and F.J.
Maldonado-Hódar, Fitting the porosity of carbon xerogel by CO2
activation to improve the TMP/n-octane separation, Microporous and
Mesoporous Materials, 209 (2015) 10-17.
J.F. Vivo-Vilches, A.F. Pérez-Cadenas, F.J. Maldonado-Hódar, F.
Carrasco-Marín, R.P.V. Faria, A.M. Ribeiro, A.F.P. Ferreira, and A.E.
Rodrigues, Biogas upgrading by selective adsorption onto CO2 activated
carbon from wood pellets, Submitted to Journal of Environmental
Chemical Engineering.
J.F. Vivo-Vilches, A.F. Pérez-Cadenas, F.J. Maldonado-Hódar, F.
Carrasco-Marín, M.J. Regufe, A.M. Ribeiro, A.F.P. Ferreira, and A.E.
Rodrigues, Resorcinol-formaldehyde carbon xerogel as selective
adsorbent of carbon dioxide present on biogas. In progress.
J.F. Vivo-Vilches, A.F. Pérez-Cadenas, F.J. Maldonado-Hódar, F.
Carrasco-Marín, C. Siquet, A.M. Ribeiro, A.F.P. Ferreira, and A.E.

Rodrigues, Hexane isomers adsorption and separation onto carbon gels.
In progress.
J.F. Vivo-Vilches, A.F. Pérez-Cadenas, F. Carrasco-Marín, and F.J.
Maldonado-Hódar, Carbon materials for VOCs adsorption, biofuel and
biogas refining. In progress.
Los resultados obtenidos en el transcurso de la tesis han sido presentados
en congresos tanto nacionales como internacionales:
XXXIV Reunión Bienal Real Sociedad Española de Química (RSEQ).
Santander, España, Septiembre 2013.
XII Reunión del Grupo Español del Carbón (GEC). Madrid, España,
Octubre 2013.
10th International Symposium on the Characterization of Porous Solids
(COPS-X). Granada, Spain, May 2014.
XXXIX Reunión Ibérica de Adsorción (39RIA). Baeza, España,
Septiembre 2014.
XIII Reunión del Grupo Español del Carbón (GEC). Alicante, España,
Octubre 2015.
7th International Symposium on Carbon for Catalysis (Carbocat-VII).
Strasbourg, France, June 2016.
The Annual World Conference on Carbon (CARBON). State Collegue,
Pennsylvania, United States, July 2016.
XXXX Reunión Ibérica de Adsorción (40RIA). Évora, Portugal,
Septiembre 2016.


Índice


Índice i
CAPÍTULO I: INTRODUCCIÓN .............................................................................. 31
1.1. CARBONES ACTIVADOS .................................................................................. 36
1.1.1. Carbones activados a partir de residuos lignocelulósicos .......................... 37
1.1.2. Carbones activados a partir de carbones minerales ................................... 39
1.1.3. Carbones activados a partir de otros desechos........................................... 40
1.1.4. Métodos de activación: activación física frente a activación química ....... 41
1.1.4.1. Activación física ................................................................................. 41
1.1.4.2. Activación química ............................................................................. 43
1.1.5. Modificación química superficial ................................................................ 46
1.1.5.1. Oxidación ........................................................................................... 46
1.1.5.2. Nitrógeno ............................................................................................ 49
1.1.5.3. Azufre .................................................................................................. 50
1.1.5.4. Halogenación ..................................................................................... 51
1.1.5.5. Otros heteroátomos ............................................................................ 52
1.2. GELES DE CARBÓN ........................................................................................... 52
1.2.1. Síntesis y gelificación .................................................................................. 54
1.2.1.1. Disolvente y el grado de dilución ....................................................... 55
1.2.1.2. Catalizador ......................................................................................... 56
1.2.1.3. Otras variables ................................................................................... 58
1.2.2. Secado ......................................................................................................... 58
1.2.3. Carbonización ............................................................................................. 60
1.2.4. Post-tratamientos ........................................................................................ 60
1.3. ADSORCIÓN DE COMPUESTOS ORGÁNICOS VOLÁTILES
(COVs) PRESENTES EN BIOCOMBUSTIBLES Y REFINADO ................... 61
1.4. OBTENCIÓN Y REFINADO DE BIOGÁS ....................................................... 65
1.5. OBJETIVOS .......................................................................................................... 69
1.6. BIBLIOGRAFÍA ................................................................................................... 71

ii Índice
CAPÍTULO II: MATERIALES Y MÉTODOS ...................................................... 107
2.1. PREPARACIÓN DE MUESTRAS .................................................................... 109
2.1.1. Carbones activados obtenidos a partir de residuos de biomasa ............... 109
2.1.1.1. Activación química de hueso de aceituna......................................... 109
2.1.1.2. Oxidación y descomposición selectiva de grupos oxigenados ......... 110
2.1.1.3. Activación física de pellets de madera de pino ................................ 111
2.1.2. Aerogeles y xerogeles de carbón ............................................................... 115
2.1.2.1. Aerogel y xerogel de carbón obtenidos por catálisis ácida ............. 112
2.1.2.2. Activación física con CO2 del xerogel de carbón AC16X ................ 113
2.1.2.3. Xerogel de carbón obtenido por catálisis básica ............................. 114
2.2. CARACTERIZACIÓN TEXTURAL ................................................................ 115
2.2.1. Adsorción física de gases .......................................................................... 115
2.2.1.1. Ecuación de B.E.T. ........................................................................... 116
2.2.1.2. Ecuación de Dubinin-Radushkevich y ecuación de Stoeckli ............ 116
2.2.1.3. Método de B.J.H. .............................................................................. 117
2.2.2. Porosimetría de intrusión de mercurio ..................................................... 118
2.2.3. Microscopía electrónica de barrido (SEM)............................................... 118
2.3. CARACTERIZACIÓN QUÍMICA ................................................................... 119
2.3.1. Análisis termogravimétrico (TGA) ............................................................ 119
2.3.2. Calorimetría diferencial de barrido (DSC) ............................................... 119
2.3.3. Desorción térmica programada (TPD) ..................................................... 120
2.3.4. Espectroscopía de fotoemisión de Rayos-X (XPS) .................................... 121
2.3.5. pH del punto cero de carga (pHZPC) .......................................................... 122
2.4. ADSORCIÓN Y SEPARACIÓN DE COMPUESTOS ORGÁNICOS
VOLÁTILES PRESENTES EN BIOCOMBUSTIBLES ............................... 122
2.4.1. Adsorción en estático de vapor saturado .................................................. 122
2.4.2. Adsorción en régimen dinámico. Curvas de rotura .................................. 123
Índice iii
2.5. ADSORCIÓN SELECTIVA DE CO2 EN REFINADO DE BIOGÁS ............ 126
2.5.1. Isotermas de adsorción a alta presión ...................................................... 127
2.5.2. Adsorción en régimen dinámico CO2 y CH4 ............................................. 128
2.6. BIBIOGRAFÍA .................................................................................................... 129
CAPÍTULO III: TAILORING THE SURFACE CHEMISTRY AND
POROSITY OF ACTIVATED CARBONS: EVIDENCE OF
REORGANIZATION AND MOBILITY OF OXYGENATED SURFACE
GROUPS ..................................................................................................................... 133
3.1. INTRODUCTION ............................................................................................... 137
3.2. MATERIALS AND METHODS ........................................................................ 139
3.2.1. Preparation of carbon materials ............................................................... 139
3.2.2. Chemical surface modifications ................................................................ 139
3.2.3. Textural characterization .......................................................................... 140
3.2.4. Chemical characterization ........................................................................ 140
3.3. RESULTS AND DISCUSSION .......................................................................... 142
3.3.1. Textural characterization .......................................................................... 142
3.3.2. Chemical characterization ........................................................................ 146
3.4. CONCLUSIONS .................................................................................................. 158
3.5. REFERENCES .................................................................................................... 158
CAPÍTULO IV: TAILORING ACTIVATED CARBONS FOR THE
DEVELOPMENT OF SPECIFIC ADSORBENTS OF GASOLINE
VAPORS ...................................................................................................................... 165
4.1. INTRODUCTION ............................................................................................... 169
4.2. MATERIALS AND METHODS ........................................................................ 170
4.2.1. Activated carbon synthesis by KOH activation ......................................... 170
4.2.2. Chemical surface modifications ................................................................ 171
4.2.3. Textural characterization .......................................................................... 171

iv Índice
4.2.4. Chemical characterization ........................................................................ 172
4.2.5. VOCs adsorption ....................................................................................... 172
4.2.5.1. Static adsorption ............................................................................... 172
4.2.5.2. Dynamic adsorption ......................................................................... 173
4.3. RESULTS AND DISCUSSION .......................................................................... 174
4.3.1. Textural characterization .......................................................................... 174
4.3.2. Chemical characterization ........................................................................ 176
4.3.3. Adsorption of n-octane and ethanol .......................................................... 179
4.3.3.1. Static adsorption ............................................................................... 179
4.3.3.2. Dynamic adsorption ......................................................................... 183
4.4. CONCLUSIONS .................................................................................................. 187
4.5. REFERENCES .................................................................................................... 188
CAPÍTULO V: ABOUT THE CONTROL OF VOC’S EMISSIONS FROM
BLENDED FUELS BY DEVELOPING SPECIFIC ADSORBENTS USING
AGRICULTURAL RESIDUES ................................................................................ 193
Nomenclature .............................................................................................................. 197
5.1. INTRODUCTION ............................................................................................... 198
5.2. MATERIALS AND METHODS ........................................................................ 199
5.2.1. Synthesis and characterization of adsorbents ........................................... 199
5.2.2. Dynamic adsorption experiments .............................................................. 200
5.3. RESULTS AND DISCUSSION .......................................................................... 202
5.3.1. Textural characterization .......................................................................... 203
5.3.2. Performance of the adsorbents in dynamic adsorption experiments ........ 205
5.3.2.1. Influence of the humidity in the adsorption of individual VOCs ...... 205
5.3.2.2. Competitive dynamic adsorption of ethanol and n-octane ............... 210
5.3.2.3. Fitting the columns content for simultaneous ethanol and n-
octane adsorption ............................................................................. 212
5.3.3. Wheeler-Jonas analysis ............................................................................. 213

Índice v
5.4. CONCLUSIONS .................................................................................................. 215
5.5. REFERENCES .................................................................................................... 216
CAPÍTULO VI: FITTING THE POROSITY OF CARBON XEROGEL BY
CO2 ACTIVATION TO IMPROVE THE TMP/n-OCTANE SEPARATION .... 221
6.1. INTRODUCTION ............................................................................................... 225
6.2. EXPERIMENTAL .............................................................................................. 227
6.2.1. Synthesis of RF carbon gels ...................................................................... 227
6.2.2. CO2 activation of carbon xerogel .............................................................. 227
6.2.3. Textural characterization .......................................................................... 228
6.2.4. Dynamic adsorption experiments .............................................................. 228
6.3. RESULTS AND DISCUSSION .......................................................................... 229
6.3.1. Textural characterization. Isotherms and SEM ......................................... 229
6.3.2. Dynamic adsorption. TMP and n-octane single component ..................... 233
6.3.3. TMP and n-octane competitive adsorption ............................................... 237
6.4. CONCLUSIONS .................................................................................................. 241
6.5. REFERENCES .................................................................................................... 243
CAPÍTULO VII: BIOGAS UPGRADING BY SELECTIVE ADSORPTION
ONTO CO2 ACTIVATED CARBON FROM WOOD PELLETS ........................ 247
7.1. INTRODUCTION ............................................................................................... 251
7.2. MATERIALS AND METHODS ........................................................................ 252
7.2.1. Synthesis of samples .................................................................................. 252
7.2.2. Textural characterization of samples ........................................................ 253
7.2.3. Equilibrium isotherms of CO2 and CH4 at high pressures ........................ 253
7.2.4. Breakthrough experiments ......................................................................... 254
7.3. RESULTS AND DISCUSSION .......................................................................... 255
7.3.1. Textural characterization .......................................................................... 255
7.3.2. CO2 and CH4 isotherms at different temperatures .................................... 258

vi Índice
7.3.3. Breakthrough experiments ......................................................................... 261
7.4. CONCLUSIONS .................................................................................................. 264
7.5. REFERENCES .................................................................................................... 264
CAPÍTULO VIII: RESORCINOL-FORMALDEHYDE CARBON
XEROGEL AS SELECTIVE ADSORBENT OF CARBON DIOXIDE
PRESENT ON BIOGAS ............................................................................................ 269
8.1. INTRODUCTION ............................................................................................... 273
8.2. MATERIALS AND METHODS ........................................................................ 274
8.2.1. Synthesis of XCs300 .................................................................................. 274
8.2.2. Textural characterization .......................................................................... 275
8.2.3. Equilibrium CO2 and CH4 isotherms at high pressures ............................ 276
8.2.4. Breakthrough experiments ......................................................................... 277
8.3. RESULTS AND DISCUSSION .......................................................................... 277
8.3.1. Textural characterization .......................................................................... 277
8.3.2. CO2 and CH4 isotherms at different temperatures .................................... 279
8.3.3. Dynamic adsorption experiments .............................................................. 281
8.4. CONCLUSIONS .................................................................................................. 284
8.5. REFERENCES .................................................................................................... 285

Capítulo I INTRODUCCIÓN


Capítulo I 33
El carbón ha sido utilizado a lo largo de la historia principalmente en dos tipos
de aplicaciones: la obtención de energía y los procesos descontaminación. En cuanto a
la primera, el carbón es todavía una de las fuentes de energía más utilizadas, por lo que
se siguen investigando nuevas formas de llevar a cabo su combustión reduciendo el
impacto medioambiental1-4. Sin embargo, es en los procesos medioambientales5-17
(tratamiento de efluentes tanto en fase líquida como en fase gaseosa) y en otras
aplicaciones relacionadas con la textura porosa del carbón, por ejemplo, como soporte
de catalizadores18-20 o como dispositivos para almacenamiento de energía eléctrica21-23,
donde el desarrollo de los materiales de carbón resulta más marcado en las últimas
décadas.
De esta forma, junto a los tradicionales carbones activados obtenidos a partir de
carbones minerales o de desechos agrícolas, ha surgido una nueva serie de
nanoestructuras de carbono, entre las cuales son más conocidas los nanotubos, grafenos
y fullerenos, pero en las que también cabe destacar los materiales de carbono
nanoestructurados, es decir, aquellos materiales de carbono que, obtenidos por diversas
rutas sintéticas, dan lugar a un retículo poroso en el que podemos controlar a escala
nanométrica la composición y la distribución de tamaños de dicha porosidad24-33. Entre
estas técnicas, unas de las más utilizadas son las basadas en el proceso sol-gel, en el que
el precursor del material de carbón es sintetizado bajo condiciones controladas, dando
lugar a una estructura ordenada que luego es preservada durante la carbonización. La
principal ventaja de esta técnica es su alta reproducibilidad, que unida a su gran
versatilidad, hace que se puedan obtener materiales basados en carbono con una
porosidad a medida, salvando así uno de los mayores inconvenientes que han tenido los
carbones activados respecto a otros materiales porosos como los óxidos inorgánicos o
las zeolitas (materiales que, al ser cristalinos, llevan intrínseca esta propiedad en su
naturaleza).
Dentro de estos materiales de carbono nanoestructurados, unos de los más
desarrollados han sido los que provienen de geles obtenidos por polimerización de
compuestos fenólicos con aldehídos, y concretamente, los sintetizados a partir de la
condensación resorcinol-formaldehido29-33. Entre finales de los años 80 y principios de
los 90, el profesor Richard W. Pekala desarrolló y patentó la síntesis de estos geles de
34 Capítulo I
carbón29,30. A partir de estos primeros trabajos se ha realizado un gran esfuerzo para
entender, desarrollar y controlar las variables del proceso en sus distintas etapas, con
objeto de estudiar su influencia en el mismo y poder obtener materiales con distintas
propiedades texturales y químicas31-40. Se trata, por tanto, de un tipo de materiales en el
que se pueden modificar las condiciones de síntesis: el catalizador, la composición de la
mezcla, el uso o no de surfactantes, la temperatura de gelificación, el tipo de curado, el
secado o las condiciones de carbonización obteniéndose materiales totalmente
diferentes, pero de forma que si la síntesis se repite reproduciendo estrictamente todo el
proceso, se llegará al mismo material. Los geles de carbón están formados por un
retículo tridimensional de partículas primarias de tamaño nanométrico interconectadas
entre sí. La microporosidad se desarrolla en el interior de las partículas primarias y los
meso y macroporosidad se forma en los espacios entre las partículas primarias
inicialmente ocupados por el disolvente. Por tanto, se puede controlar
independientemente la concentración de micro y mesoporos, lo que es una ventaja de
los geles de carbón como materiales porosos. Además de estas grandes ventajas, los
geles de carbón son susceptibles, al igual que los materiales de carbón tradicionales, de
ser modificados por post-tratamientos como la activación o funcionalización36-44.
Puesto que en el desarrollo de esta Tesis Doctoral se han preparado dos tipos de
materiales, a saber, carbones activados a partir de residuos agrícolas y geles de carbón,
éstos serán analizados en mayor medida.
La demanda energética crece en todo el mundo, especialmente en países en
pleno desarrollo y muy poblados como China e India, pero también en Europa45,46.
Aunque lo ideal sería que la humanidad fuera capaz de generar toda la energía para
cubrir dicha demanda por medio de energías renovables, la realidad es que,
probablemente durante muchos años, estas fuentes de energía tengan que seguir
conviviendo con las tradicionales (Figura 1.1). No obstante, se deben adoptar medidas
para que el uso de combustibles fósiles no traiga consigo un impacto medioambiental a
nivel de contaminación y de calentamiento global. Aunque en la reducción de
emisiones contaminantes y peligrosas derivado del uso de vehículos se ha avanzado
mucho, reduciéndose la emisión de óxidos de azufre y de nitrógeno, la gran
preocupación en la actualidad la constituyen los gases de efecto invernadero, en
particular el dióxido de carbono47-50.

Capítulo I 35
Figura 1.1. Previsión de consumo energético mundial hasta 203045,46.
Especial interés se ha mostrado por parte de la comunidad científica y de la
sociedad en general en solucionar el problema del calentamiento global1,3,4,47-52. Una de
las principales causas del mismo lo constituyen las emisiones de dióxido de carbono, ya
que aunque es cierto que otros gases contribuyen en mayor medida a dicho efecto, sus
emisiones han sido más controladas que las de CO2, que sólo han empezado a
considerarse un problema en años recientes47-49. Esta creciente preocupación por el
incremento de la temperatura global del planeta producido por la elevada concentración
de dióxido de carbono en la atmósfera ha llevado a invertir dinero y esfuerzo en el
desarrollo de metodologías para captura de CO21-4,50-59. Uno de los problemas que se
plantea es que en los procesos de combustión junto con el CO2 se generan otros gases, y
por tanto, para conseguir tratar las emisiones, se están desarrollando dos tipos de
tecnologías: las llamadas de pre-combustión1-4,57-59, que consisten en tratar el
combustible previo a ser quemado para que su combustión sea más limpia y genere
bien sólo agua o agua y dióxido de carbono y las de post-combustión51-56,60,61 en las
cuales los gases resultantes de la combustión son tratados para evitar que el CO2 y otros
contaminantes se emitan a la atmósfera.
0
2000
4000
6000
8000
10000
12000
14000
16000
18000
1980 1990 2000 2010 2020 2030
Año
Otras renovables
Biomasa
Hidraúlica
Nuclear
Gas
Petróleo
Carbón

36 Capítulo I
Otro de los campos de investigación relacionados con la obtención de energía
lo constituye el desarrollo de los biocombustibles, combustibles obtenidos a partir de
desechos de la industria agroalimentaria o de biomasa62-68. Dentro de ellos, destacan los
biocombustibles basados en etanol62-64 y el biometano obtenido a partir de biogás65-68.
Tanto el refinado como el control de las emisiones asociadas a estos dos últimos son
objeto del trabajo de esta Tesis Doctoral y serán tratados en mayor profundidad en otras
secciones. No obstante, cabe señalar que los materiales de carbono pueden y deben
tener un papel fundamental en aplicaciones relacionadas con el uso de biocombustibles,
ya sea en la adsorción de compuestos orgánicos volátiles (COVs) para prevenir las
emisiones de los mismos y mejorar el aprovechamiento de los hidrocarburos presentes
en el combustible a través de dispositivos tipo canister11,17,69-72, como en los
tratamientos previos al uso de estos combustibles para mejorar su rendimiento
(refinamiento)43,73-80.
Por ello, se plantea el uso de materiales basados en carbono como adsorbentes
específicos de COVs presentes en biocombustibles y como adsorbentes selectivos de
CO2 en mezclas CH4/CO2. Para llevarlo a cabo, se han obtenido tanto carbones
activados a partir de desechos agrícolas, como geles de carbón cuyas propiedades
químicas y texturales han sido ajustadas mediante procesos de activación y oxidación,
con objeto de mejorar su comportamiento en el tratamiento de mezclas de gases
contenidos en biocombustibles o en biogás.
1.1. CARBONES ACTIVADOS
El carbón activado es uno de los materiales más usados para el tratamiento de
efluentes tanto en fase gaseosa como en fase líquida5,6,12,16,71,81-83. Aunque su principal
inconveniente resulte la baja reproducibilidad en el ajuste del tamaño del poro del
material, debido a la gran dependencia de la materia prima, la investigación de los
procesos de activación de carbones de fuentes muy diversas ha hecho posible la
modelización de estos procesos, teniendo cada vez más conocimiento a priori del
procedimiento sintético necesario para obtener un carbón activado con las propiedades
deseadas, eligiéndose el proceso de activación en función de la aplicación, de la materia
prima y de la bibliografía disponible sobre ella. Este hecho, sumado a su competitivo
Capítulo I 37
precio, así como la versatilidad derivada de la posibilidad de llevar a cabo tratamientos
de funcionalización química de la superficie del carbón activado, hace que estos
materiales sigan siendo hoy en día fundamentales en el desarrollo de adsorbentes
específicos tanto de metales y compuestos orgánicos en aguas, como de compuestos
orgánicos volátiles (COVs) en aire5,6,12,16,71,81-83.
Las posibilidades son, por tanto, muy diversas, pudiéndose preparar materiales
con propiedades muy diferentes, incluso partiendo de la misma materia prima,
simplemente modificando el proceso de activación84-87. Las principales materias primas
de las que se obtienen carbones activados son: desechos agrícolas77,84,85,88-94, carbones
minerales13,87,95-99 y derivados de la industria petroquímica (desechos de petróleo,
plásticos o neumáticos)100-111. En cuanto a los métodos de activación se pueden dividir
principalmente en dos: la activación física, que consiste en la gasificación del carbón a
alta temperatura y la activación química, en la que el precursor se mezcla con un agente
químico y se somete a un proceso de activación a alta temperatura6,81-86. Las dos vías
implican reacciones químicas del agente activante con el material de carbón para
desarrollar su porosidad, sin embargo se suele utilizar esta distinción histórica. Por
último, el carbón activado puede ser tratado con distintos compuestos para introducir
heteroátomos en su estructura (oxígeno, nitrógeno, azufre, boro, fósforo y
halógenos)88,112-114.
En esta sección se resumirán algunos de los resultados obtenidos con carbones
activados, llevándose a cabo una clasificación de los mismos en función de los tres
aspectos mencionados anteriormente, a saber: la materia de partida, el proceso de
activación y los procesos de funcionalización química de la superficie.
1.1.1. Carbones activados a partir de residuos lignocelulósicos
Los carbones activados obtenidos usando como materia prima distintos
desechos agrícolas, como huesos y cascaras de distintas frutas o restos de poda,
constituyen uno de los grupos más importantes. De hecho, se calcula que en torno a un
50% de los carbones activados comerciales se obtienen a partir de ellos6,81,82. El
principal inconveniente de este tipo de materiales es su bajo rendimiento en carbón,

38 Capítulo I
debido a que alrededor del 75% del material de partida lo constituye materia volátil que
se pierde durante la carbonización. Sin embargo, el precio de las materias primas
usadas para obtenerlos es muy bajo, con lo que este inconveniente no supone un gran
problema para la comercialización de carbones activados a partir de este tipo de
residuos. En esta Tesis Doctoral se han obtenido carbones activados a partir de hueso
de aceituna y de pellets de madera de pino usados en calefacción doméstica, por lo que
éstos serán analizados en mayor profundidad.
En la región mediterránea, la industria del aceite de oliva tiene especial
importancia. Esta industria genera desechos en forma de hueso de aceituna o en
residuos sólidos contenidos en un subproducto resultante de la molienda de aceituna, el
alperujo. Tanto el hueso de aceituna17,88,115-120, como este residuo sólido (compuesto por
hueso, pulpa, piel y restos grasos)84,113,121 resultan excelentes candidatos para obtener
carbones activados con un alto desarrollo de la porosidad, debido a su estructura
natural, constituida por una red de canales que actúan como matriz del material de
carbono. Así, existen numerosos trabajos en las que se analizan las distintas variables
del proceso de activación de estos materiales para la obtención de carbones activados
tanto en forma granular, como en polvo y con un retículo poroso que puede ir desde un
gran desarrollo de la microporosidad, hasta materiales micro-mesoporosos,
dependiendo del agente activante, de la cantidad usada del mismo en relación a la
cantidad de materia prima o precarbonizado a tratar, o de la temperatura a la que se
lleve a cabo la activación5,84,85,116-121.
Otro residuo muy utilizado en la obtención de carbones activados lo
constituyen las maderas77,85,91-94,122-124. En los últimos años, existe una creciente
preocupación por la cantidad de biomasa generada derivada de procesos de poda y tala,
ya que muchas veces estos restos son quemados al no poder ser usados, con el
consiguiente riesgo de incendio. Por ello, y con el objetivo de poder aprovechar sus
propiedades, se han investigado en los últimos años numerosos usos para esta biomasa.
Cabe destacar su posible uso en la obtención de biocombustibles, ya sea por su
conversión en biooil o bioetanol mediante distintos procesos63,64,125-127, o por
consolidación de astillados de madera (principalmente de pino) para la obtención de
pellets que pueden sustituir, y de hecho ya lo están haciendo, a otros combustibles

Capítulo I 39
tradicionales menos eficientes (cascara de almendra o hueso de aceituna) en calderas y
estufas domésticas128,129. Estos materiales, los pellets de madera, constituyen un
precursor válido y económico para la obtención de carbones activados, con la ventaja
de que ya se encuentran peletizados, con lo que no es necesario llevar a cabo un
proceso de consolidación del material que conlleva una reducción de su área
superficial, siempre y cuando la estructura del material no sea destruida durante el
proceso de activación.
1.1.2. Carbones activados a partir de carbones minerales
Los carbones minerales han sido ampliamente utilizados desde la Revolución
Industrial, principalmente para su combustión y para la obtención de energía eléctrica
en centrales térmicas2,4,130,131. En el norte de España, existió durante muchos años una
gran tradición minera, siendo una de las industrias más importantes de esta
zona58,87,96,97,130,131. Sin embargo, la tendencia a obtener la energía eléctrica por otras
vías más limpias debido a los compromisos en lo que se refiere a reducción de
emisiones de CO2, junto con la baja competitividad del sector, ha llevado a la Unión
Europea a tomar medidas drásticas, exigiendo el cierre en los próximos años de los
pocos yacimientos que aún quedan en explotación en la zona septentrional de la
península130,131.
No obstante, todavía quedan grandes reservorios de carbón mineral, por lo que
resulta necesario darle un uso. A este efecto, desde hace años, existe un gran desarrollo
científico en cuanto a la producción de carbones activados a partir de este tipo de
materiales13,87,95-99. La gran ventaja de este tipo de carbón es que tienen una estructura
más consolidada que los materiales lignocelulósicos, puesto que ya están constituidos
por una matriz carbonosa, con bajo contenido en materia volátil. Esto hace que se
puedan obtener materiales de carbón con una porosidad muy desarrollada, sin que el
rendimiento del proceso resulte bajo. Como inconveniente de este tipo de materiales
cabe destacar el alto contenido en cenizas, que puede suponer un problema para algunas
de las aplicaciones, por lo que muchas veces es necesario llevar a cabo un proceso de
desmineralización13,87,95-99. Entre estos materiales, cabe destacar los carbones activados

40 Capítulo I
obtenidos a partir de antracita, un carbón mineral muy usado debido principalmente a
su alto contenido en carbono, su abundancia y su bajo coste13,87,96,97.
1.1.3. Carbones activados a partir de otros desechos
Aunque tradicionalmente los dos principales grupos de materias primas
utilizadas en la obtención de carbones activados han sido los anteriormente descritos,
existen otros desechos que, cada vez con más frecuencia, se usan a este fin. Así, en los
últimos años se pueden encontrar numerosos trabajos en bibliografía en el que se
preparan carbones activados a partir de neumáticos usados102-104,109, plásticos100,101,109-111
o fracciones pesadas del petróleo105-107.
Los neumáticos usados y su acumulación constituyen un problema
medioambiental de primera magnitud, conllevando un riesgo de accidente en forma de
incendio, como el ocurrido recientemente en el municipio toledano de Seseña132.
Sumado al impacto medioambiental, la combustión del neumático produce una serie de
compuestos tóxicos por inhalación, con lo que a los costes medioambientales, en caso
de incendio de un vertedero de neumáticos, hay que sumar el posible impacto sobre la
salud de las personas que habitan en zonas cercanas. Por tanto, buscar nuevas
aplicaciones para la utilización de estos desechos, puede ser una buena vía, no sólo
desde el punto de vista medioambiental, sino también de prevención ante estos posibles
accidentes. Algunos grupos de investigación están trabajando en esta rama102-104,109, con
algunos resultados destacables, si bien uno de los principales inconvenientes es que los
neumáticos contienen una gran cantidad de azufre, lo que puede resultar un problema a
la hora de llevar a cabo los tratamientos necesarios para obtener el material de carbón.
Otra de las grandes preocupaciones ambientales que existe a nivel global está
relacionada con el consumo creciente de materiales plásticos. Muchos de estos
materiales son reciclables, pero no son biodegradables, por lo que aunque la
concienciación sobre el reciclado y la recogida selectiva de basuras es cada vez mayor,
la gran cantidad de desechos generados, especialmente de plásticos utilizados en la
industria alimentaria (como el polietilenterftalato, PET), es inasumible en su totalidad
por las plantas de reciclaje que sólo pueden tratar una parte de los mismos100,101. Por

Capítulo I 41
tanto, resulta necesario dar otros usos a estos residuos, y la obtención de carbón
activado a partir de ellos está demostrando ser una buena alternativa para evitar que
estos desechos sean almacenados o incinerados. Existen también otros polímeros a
partir de los cuales se puede obtener carbón activado como el polietileno (PE) y el
polipropileno (PP). Resultan interesantes los trabajos en los que estos plásticos son
sometidos a un proceso de descomposición para, añadiendo un catalizador metálico,
utilizarlos como precursores en la obtención de nanofibras de carbono (CNF)108,110,111.
Por último, una de las industrias en la que más se ha hecho por valorizar todos y
cada uno de los subproductos generados seguramente es la industria del petróleo.
Gracias a ello, se ha producido un gran crecimiento en el uso de polímeros en las
últimas décadas. Sin embargo aunque de las distintas fracciones del petróleo casi todas
se pueden utilizar para generar combustibles, asfaltos o monómeros para la industria
petroquímica, sigue habiendo fracciones muy pesadas que generalmente constituyen un
desecho. Así, las breas de petróleo, ricas en hidrocarburos aromáticos policíclicos, son
utilizadas como precursores de grafito o nanofibras de carbono (cuando son
grafitizables) o de carbón activado (cuando no pueden ser grafitizadas)105-107.
1.1.4. Métodos de activación: activación física frente a activación química
El desarrollo de la porosidad de los carbones activados se puede llevar a cabo
mediante dos vías, activación física o activación química, como se ha comentado
anteriormente. El que se elija llevar a cabo una u otra dependerá principalmente de la
aplicación en la que se quieren emplear los materiales y del tipo de precursor84-86.
1.1.4.1. Activación física
En lo que se refiere a la activación física, ésta consiste en llevar a cabo la
oxidación del material mediante un gas para que, tras descomponer los grupos
oxigenados generados, se produzca un incremento de la porosidad por lo que se conoce
como gasificación81-83,98,101,115,116,121,133-136. Este proceso suele constar de dos etapas: una
carbonización del material en atmósfera inerte y un posterior tratamiento a alta
temperatura en presencia del agente activante. Sin embargo, ambas etapas pueden

42 Capítulo I
llevarse a cabo de forma simultánea, especialmente en materiales con bajo contenido en
materia volátil, llevándose a cabo un calentamiento en atmósfera inerte, manteniendo
una temperatura durante un tiempo, cambiando el gas inerte por el agente activante y
cambiando otra vez al inerte durante el enfriamiento. Son las partes más reactivas del
carbón, los bordes de grano y zonas más desordenadas, las primeras en reaccionar en los
procesos de gasificación, y, por tanto, las más afectadas por los mismos. El grado de
gasificación del material se conoce normalmente como grado de activación o de
quemado y se suele expresar en porcentaje. Los gases más usados para la activación de
carbones son el vapor de agua98,121,133 y el dióxido de carbono, aunque algunas veces se
lleva a cabo la combustión parcial del material de carbón mediante aire115,134-136.
La activación con vapor de agua se produce mediante las reacciones descritas
en las ecuaciones 1.1 y 1.2, mientras que las 1.3 y 1.4 corresponden a la activación con
dióxido de carbono6,81-83,85.
Ecuación 1.1
Ecuación 1.2
Ecuación 1.3
Ecuación 1.4
Según las ecuaciones anteriormente expuestas, el dióxido de carbono reacciona
con la superficie del carbón para dar lugar a complejos oxigenados que descomponen
dando CO a alta temperatura. El vapor de agua, sin embargo, reacciona dando lugar a
hidrógeno que se quimisorbe en la matriz carbonosa estabilizando los electrones que
quedan no enlazados al salir átomos de C como CO2 de la estructura del carbón. Este
CO2 generado puede reaccionar con la superficie del carbón por las ecuaciones 1.3 y 1.4
dando lugar al desarrollo de la microporosidad6,81-83,85.
Cuando los resultados de usar cada uno de los gases son comparados se observa
que para el caso del CO2 se incrementa en mayor medida el volumen de microporos, a
través de la creación de nueva microporosidad o del ensanchamiento de la ya existente
en el material a activar, mientras que con el H2O se produce un mayor volumen de

Capítulo I 43
mesoporos y un ensanchamiento de la macroporosidad83-86,98,116. En cualquiera de los
casos se produce un alto desarrollo de la microporosidad, que aumenta a medida que
aumenta el grado de quemado, hasta que el ensanchamiento de estos microporos resulta
tan grande que comienza a aumentar significativamente la mesoporosidad. Sea cual sea
el agente activante, los procesos de activación física suelen generar distribuciones del
tamaño de poro muy anchas cuando se intenta desarrollar mucho la porosidad. Por ello,
si se quiere obtener un carbón activado con un alto volumen de poros y una distribución
de tamaños estrecha, se debe recurrir a la activación química6,84-87,96,137. No obstante, la
activación física con dióxido de carbono a bajos grados de activación puede ser un buen
método para aplicaciones relacionadas con la separación de gases, ya que consigue
desarrollar un alto volumen de microporos estrechos en los que se pueden adsorber
selectivamente moléculas más pequeñas frente a otras más voluminosas (como es el
caso de la separación de isómeros lineales y ramificados). También se puede utilizar
para el desarrollo de adsorbentes selectivos de CO2 en biogás, ya que la interacción del
CH4 con la superficie del carbón es mucho más débil en estos microporos estrechos que
la correspondiente al CO2.
1.1.4.2. Activación química
Otro método para desarrollar la porosidad de un carbón activado es el conocido
como activación química6,21,81,82,84-89,96,97,113,118-120,124,137,138. En este proceso se lleva a
cabo la impregnación del material de partida con el agente químico activante y se trata a
temperaturas moderadas en atmósfera inerte. Si el agente activante presenta carácter
ácido o básico, se lleva a cabo finalmente una etapa de neutralización. En cualquier
caso, es necesario un lavado y, generalmente, una desmineralización del carbón
activado resultante para eliminar subproductos de la reacción y el agente activante que
quede sin reaccionar21,84-86,88,113. Los reactivos más utilizados en la activación química
de carbones son el ácido fosfórico120,124,139, el cloruro de cinc119,138,140 y los hidróxidos
alcalinos17,21,87,88,96,97,100,103,113,117,118,137,141,142.
En cuanto a las ventajas con respecto a la activación física se suelen destacar las
cinéticas más favorables (lo que conlleva menores tiempos y temperaturas de
tratamiento), rendimientos más altos para el mismo desarrollo de porosidad, un mayor

44 Capítulo I
control del tipo de porosidad generada y el hecho de que se realice en una única etapa84-
86. Sin embargo, esta última no es del todo cierta para todos los materiales de carbón, ya
que es necesario que la estructura del material sea ya una estructura carbonosa estable
para llevar a cabo el proceso de activación, como es el caso de los carbones
minerales87,96,97. Por tanto, para llevar a cabo la activación química de un material
lignocelulósico preservando su estructura intrínseca, es necesario realizar un
precarbonizado a temperatura relativamente baja (entre 300 y 400°C) para obtener una
estructura carbonosa estable que no se desmorone con el tratamiento, lo que permite un
mayor desarrollo del volumen de poros17,21,88,113. En cuanto a los inconvenientes, los
principales son la necesidad de la etapa de lavado y/o neutralización y que se trata de un
proceso que emplea reactivos corrosivos. El que se opte por un agente activante u otro
dependerá principalmente de la aplicación y del tipo de material usado como
precursor6,81,82,84-86.
El ácido fosfórico (H3PO4)120,124,139 y el cloruro de cinc (ZnCl2)119,138,140 fueron
los primeros en usarse a tal efecto. Ambos suelen utilizarse con materiales
lignocelulósicos, ya que actúan deshidratando la celulosa, la hemicelulosa y la lignina.
En cuanto al primero, se suele utilizar en materiales lignocelulósicos cuando se requiere
un adsorbente con porosidad ancha (mesoporos anchos y macroporos), bien para
tratamiento de aguas o bien para adsorción de compuestos grandes como pueden ser los
hidrocarburos aromáticos policíclicos (PAHs) presentes en combustibles120,124,139. El
cloruro de zinc cada vez se usa menos debido al impacto medioambiental del Zn, pero
su principal ventaja es que desarrolla un gran volumen de microporos con una
distribución de tamaños estrecha a bajas proporciones de agente activante. Cuando se
incrementa la proporción de ZnCl2 respecto al material a activar, se producen también
mesoporos, dando lugar a materiales micro-mesoporosos119,138,140.
Los hidróxidos alcalinos, principalmente el de sodio y el de potasio, permiten
preparar carbones activados con un tamaño de microporos homogéneo y con alto
volumen de microporos17,21,87,88,96,97,102,103,113,142,143. El mecanismo por el cual transcurre
la activación de los hidróxidos ha sido ampliamente estudiado, demostrándose que estos
hidróxidos reaccionan con la superficie del carbón dando lugar a carbonatos. Estos
carbonatos descomponen a alta temperatura, formándose dióxido de carbono

Capítulo I 45
responsable del desarrollo de la microporosidad, mientras que la intercalación del óxido
del metal entre las capas grafíticas y, a temperaturas más altas, del propio metal, da
lugar a un aumento de la distancia interlaminar, aumentando así la
mesoporosidad87,90,96,97,141. El hidróxido de sodio precisa de temperaturas más altas de
tratamiento que el de potasio, por lo que generalmente se opta por este último87. Ubago-
Pérez y col.118 estudiaron diversos factores que afectan a las propiedades texturales del
material resultante, destacando la proporción de agente activante y la temperatura. En
cuanto a la primera, para diversos materiales se ha demostrado que a bajas proporciones
KOH:C los materiales que se obtienen son principalmente microporosos, mientras que a
proporciones mayores de agente activante (KOH:C por encima de 4:1) se comienzan a
generar también mesoporos (Tabla 1.1). En lo que respecta a la temperatura, a mayores
temperaturas se produce una mayor cantidad de K metálico que queda intercalado entre
las capas grafénicas, aumentando por tanto la distancia entre ellas y el volumen de
mesoporos90,142,143.
Tabla 1.1. Propiedades texturales de carbones activados con KOH.
Precursor Muestra KOH/C T
°C
SBET
m2·g-1
W0 (N2)
cm3·g-1
VT
cm3·g-1
Ref.
Hueso de
aceituna
carbonizado
A1
A2
A4
A5
1
2
4
5
800
460
957
1059
1062
0.19
0.38
0.40
0.41
0.21
0.38
0.42
0.44
118
Hueso de
jobo
CAK5
CAK7 1
500
700
1384
2290
0.50
0.92
0.63
1.19 90
Paja de arroz
Precarbonizada
a 700 °C
SK4T50
SK4T60
SK4T70
SK4T80
C7K4T60
C7K4T70
C7K4T80
C7K4T90
4
500
600
700
800
600
700
800
900
370
760
770
900
490
1250
2200
2410
0.12
0.24
0.25
0.30
0.19
0.44
0.54
0.48
0.25
0.39
0.41
0.46
0.28
0.65
1.15
1.39
143

46 Capítulo I
1.1.5. Modificación química superficial
Además de los tratamientos de activación existentes para el desarrollo de la
porosidad, existen diversos procesos aplicables a materiales de carbono para la
modificación de su química superficial. Estos procesos, desarrollados para carbones
activados, se pueden también llevar a cabo sobre otros materiales como nanoestructuras
o geles de carbón. Entre los heteroátomos que se pueden introducir en la superficie del
carbón activado destacan el oxígeno112,144-149 y el nitrógeno114,122,150,151, por ser los más
utilizados, aunque también está creciendo el interés en la funcionalización con otros
grupos superficiales que contienen azufre113,152,153, fosforo154,155, halógenos156-159 o
boro28,160 para diversas aplicaciones. Puesto que en esta Tesis Doctoral se ha llevado a
cabo la oxidación de un carbón activado, este proceso será descrito en mayor
profundidad.
1.1.5.1. Oxidación
Los tratamientos de oxidación constituyen uno de los procesos más usados para
modificar la superficie de los materiales carbonosos. Son usados, entre otras
aplicaciones, para mejorar la dispersión de un catalizador161, para crear centros ácidos
que pueden convertir al material de carbón en catalizador para distintas reacciones145-149
o para generar grupos que dan lugar a procesos redox produciendo un incremento de la
capacidad de un dispositivo de almacenamiento de energía eléctrica por
pseudocapacitancia162. En lo que se refiere a la adsorción, se utilizan sobre todo para
crear interacciones específicas con moléculas polares o con metales pesados en
disolución y para modular el balance hidrofílico/hidrofóbico del adsorbente16,17,88,163-165.
La introducción de grupos oxigenados destaca sobre el resto debido a la multitud de
posibilidades derivadas de las diferentes vías para llevarla a cabo, la accesibilidad de los
reactivos empleados y la posibilidad de llevar a cabo los procesos en disolución a
temperatura ambiente16,112,145.
En cuanto a los métodos para la oxidación de materiales de carbono, se dividen
principalmente en dos tipos: la oxidación por vía seca, en la que el carbón se somete a

Capítulo I 47
temperaturas moderadas en presencia de un gas oxidante (aire, oxígeno u ozono) y por
vía húmeda, que es un proceso en disolución en el que el material de carbón se pone en
contacto con una disolución acuosa del oxidante16,112,145.
Para la oxidación por vía seca, los gases más utilizados son aire y ozono, ambos
generan principalmente grupos de carácter básico (carbonílicos) o ligeramente ácido
(fenólicos), aunque también se pueden generar algunos grupos carboxílicos y
anhídridos144,145,166-169. Debido a que la estabilidad de los grupos oxigenados depende de
la temperatura, el tipo de grupos va a depender también de la que se utilice para llevar a
cabo el tratamiento147,168-170. En este sentido, las oxidaciones con ozono tienen la ventaja
de ser llevadas a cabo a menor temperatura166,167.
No obstante, los métodos de oxidación en vía seca son cada vez menos
comunes y se están sustituyendo por procesos en disolución. Entre los oxidantes usados
para la reacción por vía húmeda destacan tres: el ácido nítrico (HNO3)7,112,145-
147,168,171,172, el peróxido de hidrógeno (H2O2)7,112,145,146,148,173 y el peroxidisulfato
amónico ((NH4)2S2O8)7,17,88,112,146,161,163. Cada uno tiene una serie de ventajas e
inconvenientes y existen diversos trabajos en los que se comparan las consecuencias de
utilizar uno u otro7,16,112,145,146,148,163. Al igual que en los procesos de activación, las
características del material final dependerán no sólo del oxidante elegido, sino también
de la estructura del material (porosidad, tamaño de partícula, contenido en cenizas).
Los mayores contenidos en oxígeno se consiguen con la oxidación mediante el
uso de ácido nítrico. Esto se debe a que el HNO3 reacciona tanto con la superficie más
externa del carbón como dentro del retículo poroso del mismo7,112,145,147,168,171,172.
Además, es el oxidante que más grupos de tipo ácido carboxílico genera, aunque
también da lugar a la formación de grupos carbonílicos y fenólicos en menor medida.
Su principal inconveniente es que, al reaccionar también en el interior de la porosidad
del carbón, el tratamiento con ácido nítrico suele reducir notablemente el área
superficial del material, reduciendo su capacidad adsorbente7,112,145,147,168. Este oxidante
también se ha usado en procesos de funcionalización hidrotermal, generándose una
mayor proporción de grupos de tipo fenólico que en la oxidación convencional a presión
atmosférica171,172.
48 Capítulo I
El peróxido de hidrógeno es otro oxidante usado en la oxidación de carbones
activados7,112,145,146,148,173. Éste se puede utilizar a diversos pH (los nitratos no presentan
carácter oxidante en medio básico) aunque su potencial es menor a pH básico, por lo
que el tipo de grupos generados y la cantidad de los mismos va a depender de que este
parámetro se ajuste o no173. Dadas las características ácidas del peróxido de hidrógeno
se suele emplear directamente, generando principalmente grupos de tipo fenólico y
carbónilico siendo el oxidante que más proporción de grupos estables que desorben
como CO a altas temperaturas genera7,112,145,146,148,173. Sin embargo, si el pH se modifica
aumentando la acidez de la mezcla, se suelen obtener mayores proporciones de grupos
carboxílicos, en detrimento de los fenólicos, mientras que a pH básico se generan
mayores cantidades de grupos carbonílicos y éteres, reduciéndose también la proporción
de grupos fenólicos173. El peróxido de hidrógeno reacciona principalmente con la
superficie más externa del carbón, con lo que no afecta significativamente a las
propiedades texturales del mismo7,112,145,146.
Por último, el peróxidisulfato amónico es un oxidante muy particular, cuya
característica es la creación de centros ácidos muy fuertes, a pesar de fijar un menor
número de grupos carboxílico que la oxidación con HNO37,17,88,112,146,161,163. Esto se debe
a que el (NH4)2S2O8 genera grupos carboxílicos de los cuales muchos se hallan en
posiciones contiguas o adyacentes de la superficie carbonosa161. Es conocido que la
presencia de grupos electrón-atrayentes en posición respecto al carboxilo aumenta la
fortaleza ácida del mismo por efecto inductivo, mientras que los grupos electrón-
donantes la disminuyen. Por ello, aunque la proporción de grupos ácidos es menor en
carbones tratados con este oxidante que en el caso del ácido nítrico, el pH del punto
cero de carga (pHZPC) de los mismos suele ser menor146,161. Aunque en general no afecta
significativamente a las propiedades texturales del carbón activado, para carbones con
un alto volumen de mesoporos y conformados por partículas muy finas, puede destruir
parte de esta porosidad, reduciendo considerablemente la mesoporosidad17,88.
En todos los casos, los carbones oxidados por los distintos métodos pueden ser
tratados a distintas temperaturas, para eliminar parte de los grupos oxigenados
generados o producir una reestructuración de los mismos17,43,95,147,168-170. Para llevar a

Capítulo I 49
cabo este proceso tenemos que tener en cuenta el tipo de grupos que pueden existir en la
superficie del carbón y su estabilidad térmica relativa (Tabla 1.2)95,145,147,168,170.
Tabla 1.2. Grupos superficiales oxigenados y estabilidad térmica.
1.1.5.2. Nitrógeno
El nitrógeno es otro de los heteroátomos que se usa en mayor medida, sobre
todo en aplicaciones relacionadas con el almacenamiento de energía (por dar también
lugar a especies con actividad redox)23,114,174,175 y en la electrorreducción tanto de O2 en
pilas de combustible, como de CO2 para su conversión en hidrocarburos de bajo peso
molecular176-178. Especial importancia tienen también los tratamientos de inmovilización
con poliaminas o poliiminas para crear estructuras dendríticas que dotan al adsorbente
de una capacidad de captura de CO2 muy alta, debido a la interacción química de los
grupos nitrogenados con el dióxido de carbono122,150,151,179. La adsorción de algunos
metales también se puede ver favorecida por la presencia de grupos nitrogenados
capaces de dar lugar a interacciones específicas con el ion metálico a adsorber16.
También cabe destacar que la introducción de funcionalidades de nitrógeno se
puede llevar a cabo no durante un post-tratamiento del carbón, sino directamente en la
síntesis del precursor polimérico. Así la carbonización de polímeros de monómeros
nitrogenados (melamina-formaldehido o hidroxipiridina-formaldehido) da lugar a
# Grupo CO/CO2 T (°C)
1 Ác. Carboxílico CO2 200-300
2 Lactona CO2 350-400
3 Pirona CO
4 Anhídrido CO2 + CO 400-600
5 Fenol CO 600-700
6 Éter CO
7 Carbonilo CO 800-900
8 Cromeno CO

50 Capítulo I
estructuras carbonosas con un contenido en nitrógeno que dependerá de la temperatura
de carbonización y las condiciones de síntesis del polímero precursor23,162,174,176,179,180.
En la funcionalización con agentes químicos posterior a la carbonización
destacan los tratamientos con amoniaco, cianuro de hidrógeno, urea o la propia
melamina122,123,175,177,181. En este caso, es necesario aplicar temperaturas relativamente
altas, ya sea para facilitar la reacción gas-sólido (en el caso del amoniaco y el cianuro) o
para producir la descomposición del reactivo usado para introducir el nitrógeno (urea y
melamina). Esto limita las posibles funcionalidades que pueden ser introducidas en el
carbón por esta vía, en función de la estabilidad térmica de los mismos.
1.1.5.3. Azufre
Una de las aplicaciones más importantes del azufre en estos momentos la
constituye su incorporación a las baterías de ión litio para incrementar su capacidad182.
También se han utilizado carbones azufrados en la electrorreducción de O2113,183, a
veces combinado con funcionalidades de nitrógeno178. La generación de centros de una
acidez muy fuerte, puede ser utilizada con fines catalíticos. En lo que respecta a la
adsorción, destaca el uso de carbones funcionalizados con azufre para la adsorción de
mercurio tanto en disolución como en fase gas152,184 y para la adsorción en disolución de
otros metales pesados con afinidad por el azufre como el cadmio o el plomo16,153,185.
Tradicionalmente, para introducir grupos azufrados en la matriz carbonosa se
utilizaban gases como el sulfuro de hidrógeno (H2S), de carbono (CS2) o el dióxido de
azufre (SO2)152,153,184,185. Estas reacciones requieren altas temperaturas, que pueden ser
menores si se lleva a cabo una oxidación previa del material de carbono, lo que muchas
veces modifica significativamente la estructura carbonosa obtenida. Sin embargo, en los
últimos años se vienen desarrollando métodos en disolución ya sea a presión
atmosférica o en reactores a presión (solvotermal o hidrotermal), en los que pequeñas
moléculas que contienen azufre (tiourea, mercaptoetanol o ácido tioglicólico, por
ejemplo) se hacen reaccionar con el carbón, lo que permite una funcionalización en
condiciones menos severas de temperatura y que da lugar a carbones activados con una
química superficial más controlada, en la que se generan funcionalidades concretas

Capítulo I 51
según el reactivo utilizado y la química superficial ya existente en el material de
partida113,178,183.
1.1.5.4. Halogenación
Cuando se realiza un análisis bibliográfico sobre la funcionalización de
materiales de carbono con halógenos, se observa que el cloro es, con diferencia, el más
utilizado156,157. Esto se debe a que el carácter oxidante de los halógenos disminuye al
bajar en el grupo, por lo que mientras que el bromo y el yodo tienen una reactividad
muy baja y es difícil que reaccionen con la superficie del carbón, el flúor presenta el
inconveniente contrario, es decir, una reactividad excesivamente alta que hace difícil el
control del proceso. No obstante, el flúor se ha utilizado principalmente para modular la
selectividad de membranas en separación CO2/CH4 ya que da lugar a interacciones
específicas con el dióxido de carbono, siendo capaz de retenerlo158,159. El bromo se
utiliza comúnmente en disolución, siendo este proceso un ensayo clásico usado en la
determinación del grado de insaturación de un carbón. La reacción del yodo con el
carbón genera grupos funcionales muy lábiles y con un alto grado de reversibilidad, por
lo que prácticamente no se usa.
Como se ha mencionado en el párrafo anterior, el elemento del grupo de los
halógenos más usado en funcionalización de materiales de carbono es el cloro. La
inserción de cloro en la matriz carbonosa se produce a partir de los 200°C y aumenta
con la temperatura156,157. En nuestro grupo, carbones clorados han sido utilizados para
crear carbones con grupos superficiales de carácter ácido de Lewis que, al usarse como
soportes de catalizadores, influyen en la dispersión del metal y en su comportamiento
catalítico156. Sin embargo, la acidez de Brönsted de los carbones resultantes tiende a
disminuir, y en mayor medida cuanto mayor es la temperatura de tratamiento, ya que los
grupos clorados sustituyen a los grupos carboxílicos que se eliminan a temperaturas
relativamente bajas (Tabla 1.2)156.

52 Capítulo I
1.1.5.5. Otros heteroátomos
Además de los heteroátomos descritos, se pueden introducir en la superficie del
carbón otros, como son el fósforo y el boro. En cuanto al primero, la activación con
fosfórico es la principal vía para generar grupos de P, que suelen usarse como
retardantes de la combustión o para preservar electrodos de grafito de la oxidación154,155.
En cuanto al boro, se suele introducir por deposición química en fase vapor (CVD)
generando defectos en las láminas grafénicas, lo que da lugar a la curvatura de las
mismas. Además, se utiliza para dopar con carácter p los materiales de carbono, ya que
tiene un electrón menos que el C160 y para prevenir la oxidación del carbón.
1.2. GELES DE CARBÓN
La aplicación de las técnicas sol-gel a la obtención de materiales de carbono ha
sido una de las grandes aportaciones de las últimas décadas a este campo. El control en
la forma del polímero precursor asociado a esta técnica ha llevado a poder crear
estructuras de todo tipo23-33. La utilización de surfactantes y moléculas plantilla permite
también modificar las propiedades texturales del gel y, como consecuencia, del material
de carbono resultante186-188. Esta técnica permite además la inclusión de precursores de
óxidos metálicos para los que también se aplica, pudiéndose obtener materiales
compuestos con silica, titania, óxido de manganeso o de zinc, y cualquier óxido
metálico que también pueda sintetizarse vía sol-gel189-191.
La técnica consiste en la formación de un polímero en un disolvente,
generalmente acuoso, de manera que las partículas primarias coloidales se van uniendo
unas con otras, en lo que se conoce como gelificación, dejando huecos en los que el
disolvente (y las micelas del surfactante en los casos en los que se use) queda
atrapado31-33,35. De esta manera se forma un hidrogel que posteriormente deberá ser
secado, pudiendo realizarse esta etapa mediante el empleo de fluidos supercríticos,
obteniéndose un aerogel; con un secado térmico, con lo que se llegaría a un xerogel; o
por congelación del disolvente, lo que se conoce como criogel31-33,35. Una vez secado el

Capítulo I 53
gel se procede, en el caso de los geles de carbón, a un proceso de carbonización a alta
temperatura.
La principal ventaja de esta técnica es que los materiales a los que da lugar son
nanoestructurados, es decir, tienen un retículo poroso ordenado que viene determinado
por las condiciones de síntesis. Además, la cantidad de variables en juego hace que sea
posible modificar muchos parámetros para llegar a tener un material con una
distribución de tamaño de poros prácticamente a medida, pudiendo fijar las condiciones
de síntesis en función de las propiedades deseadas31-33. Al ser obtenidos de forma
sintética este proceso da lugar a materiales de carbono de alta pureza. Los geles de
carbón obtenidos a partir de la polimerización de resorcinol y formaldehido29,30,32,33,43
son unos de los más estudiados y, al constituir uno de los materiales empleados en esta
Tesis Doctoral, serán descritos en mayor profundidad.
Existen numerosos trabajos en los que se pone de manifiesto la versatilidad del
proceso sol-gel en la obtención de geles de carbón a partir de mezclas resorcinol-
formaldehido29,30,32,33. El estudio de las diversas variables que intervienen en el proceso
es fundamental para poder optimizar la síntesis, sabiendo a priori que se debe hacer y
que no para llegar al material que se busca para una determinada aplicación. Entre las
condiciones estudiadas destacan las relativas a la síntesis y el gelificado34,35,38-41,162,188,
el tipo de secado36,37,43,192,193, la carbonización y los posibles post-tratamientos,
principalmente de activación43,194-198.
Las opciones son tan amplias que los geles de carbón han sido utilizados para
un sin fin de aplicaciones relacionadas con la adsorción14,43,197,199,200,
catálisis15,18,42,191,201, separación de gases43,202, almacenamiento de energía44,162,195,196,203,
liberación de fármacos204, y prácticamente cualquier aplicación para la que se han
desarrollado materiales inorgánicos porosos. Además, el hecho de que el proceso
(Figura 1.2) transcurra a partir de una disolución precursora, permite obtener el material
de carbón en multitud de formas que van desde membranas, a polvo o pelets37.

54 Capítulo I
Figura 1.2. Etapas para obtener un gel de carbón Resorcinol-Formaldehído.
1.2.1. Síntesis y gelificación
Es, probablemente, en la etapa de síntesis donde más variables intervienen en el
proceso de obtención de un gel de carbón. Por ello, es en esta etapa donde las
posibilidades se multiplican, ya que podemos variar desde el disolvente, la proporción
entre reactivos, el grado de dilución, el catalizador, la inclusión o no de surfactantes y
moléculas plantillas32,33,192. Una vez mezclados los reactivos, la disolución precursora se
introduce en moldes sellados, que pueden ser de distinta forma, y se someten a un
tratamiento térmico para que tenga lugar el gelificado y curado del gel, pudiendo
también variarse la temperatura y condiciones de la misma. Las reacciones que rigen el
proceso (Figura 1.3) son dos: la adición del formaldehido al resorcinol en posiciones 2 y
4 (la 6 es equivalente a la 4) y la posterior condensación entre las especies formadas en
la primera, dando lugar a moléculas cada vez más grandes29,30,32,33. Estas moléculas a su
vez siguen reaccionando entre ellas para dar lugar a clusters que siguen reaccionando y
uniéndose unos con otros formando una estructura de collar típica del gel (Figura 1.4).
Figura 1.3. Mecanismo de la polimerización del Resorcinol y el Formaldehído.
OH
OH
O
H HOH-
OH2
OH2
OH2
OH2
MEZCLA DEREACTIVOS
GELIFICACIÓN
SECADO
CARBONIZACIÓN
OH
OH
OH-
OH
O-
+ 2O
H H OH
OH
OH
OH
OH
OH
OH
OH H+,
OH
OH
CH2+
CH2+
+OH
OH
OH
OH
OH
OH
OH
OH
O
O
OH
OH
O
OH
OH
O
OH
OH
OH
OH
OH
OH
OH

Capítulo I 55
Figura 1.4. Condensación de clusters para formar el gel.
1.2.1.1. Disolvente y grado de dilución.
Puesto que el disolvente juega un papel activo en el ensamblaje de unas
moléculas con otras, determinando gran parte del proceso de gelificación, es uno de los
factores más importantes32,33,205-207. Generalmente se utiliza agua, aunque se han
utilizado otros, principalmente alcoholes, por distintos motivos: por ejemplo, para
obtener criogeles resulta conveniente el uso de tertbutanol u otro disolvente que no
presente cambios de densidad (y por tanto de volumen) tan bruscos al pasar a estado
sólido205,207; en el caso de aerogeles, la utilización de disolventes orgánicos evita la
necesidad de realizar una etapa de intercambio con acetona del mismo, ya que éstos son
solubles en CO2. No obstante, las velocidades de polimerización en disolventes
alcohólicos son menores, por lo que suelen usarse solamente cuando resulta necesario,
esto es, cuando el resorcinol se sustituye por otros monómeros con una menor
solubilidad en agua206.
En cuanto al grado de dilución, este puede definirse como la cantidad de
disolvente por cantidad total de resorcinol y de formaldehido presentes en la mezcla. No
obstante, puesto que la proporción estequiométrica resorcinol:formaldehido suele ser
1:2 (la 1:1 da lugar a bajo grado de entrecruzamiento, mientras que la 1:3 produce un
efecto de dilución debido a que gran parte del formaldehido no reacciona), la proporción
de disolvente se suele dar como relación molar entre el resorcinol y el agua o cualquier
otro disolvente empleado (R/W)32,33. Su influencia depende del pH al que se ajusta la
mezcla para obtener el gel32,33,40,192,208,209: a pH ácido y grados de dilución intermedios,
se obtienen geles con partículas muy interconectadas entre sí, dando lugar a geles
OH
OH
OH
OH
O
O
OH
OH
O
OH
OH
O
OH
OH
OH
OH
OH
OH
OH
56 Capítulo I
macroporosos, cuyo tamaño aumenta al aumentar el grado de dilución, mientras que a
grados de dilución bajos se obtienen materiales eminentemente microporosos33,40,208,209;
a pH ligeramente básico, se obtienen geles poliméricos con un gran volumen de
microporos y mesoporos a altas concentraciones de reactivos, mientras que a medida
que crece el grado de dilución se pasa de un gel polimérico a un gel coloidal formado
por partículas grandes interconectadas por cuellos estrechos, lo que produce materiales
con baja resistencia mecánica y un volumen de poros reducido33,40,208,209. No obstante,
hay que tener en cuenta también la forma en la que se va a obtener el gel, ya que, por
ejemplo, a la hora de obtener un gel en polvo en un reactor batch con agitación se deben
usar mayores proporciones de disolvente que en el caso de los geles en forma de pellets
obtenidos en moldes cilíndricos de vidrio sellados18.
1.2.1.2. Catalizador
Como hemos visto anteriormente, las distintas reacciones de adición y
condensación están catalizadas por iones hidroxilo o por protones respectivamente. Esto
provoca, en consecuencia, que el hecho de que se opte por usar un catalizador de
naturaleza básica o de naturaleza ácida va a modificar significativamente las
propiedades del gel final (Tabla 1.3)38-40,43,194,208,209. En general, para proporciones de
solvente comúnmente usadas en la síntesis de estos geles, los catalizadores ácidos dan
lugar a la formación de partículas pequeñas con un alto grado de entrecruzamiento, de
forma que se forman redes de macroporos en una estructura tipo nido43,194; cuando se
usa un catalizador básico, se forman materiales micro-mesoporosos con una porosidad
más desarrollada y formado por partículas esféricas más grandes que se unen unas con
otras pero sin dar lugar a la formación de estos canales (Figura 1.5)38-40.
No obstante, la naturaleza ácido-base del catalizador no es el único parámetro
que influye en el proceso. Morales-Torres y col.38 analizaron las variaciones
morfológicas y en propiedades texturales de los geles de carbón cuando la
polimerización es catalizada por distintos carbonatos alcalinos. Los autores concluyeron
que a medida que aumenta el tamaño del catión alcalino, las partículas primarias que se
obtienen son de tamaños similares, pero la aglomeración de éstas para formar partículas
más grandes va creciendo. Esto hace también que tanto el tamaño de los mesoporos

Capítulo I 57
como el volumen de los mismos vaya aumentando en este sentido, hasta el punto que
cuando se usa carbonato de cesio, se obtiene un gel macroporoso (Tabla 1.3).
Tabla 1.3. Propiedades texturales de aerogeles en función del catalizador de
polimerización utilizado.
Catalizador Muestra R:C SBET
m2·g-1
W0 (N2)
cm3·g-1
Vmeso
cm3·g-1
VHg
cm3·g-1
Ref.
Ácido acético CA 16 463 0.19 0.00 - 194
Ác. p-toluensulfónico
Ác. oxálico
E
I
8000
800
751
740
0.28
0.30
0.00
0.00
0.33
0.70 39
Li2CO3
Na2CO3
K2CO3
Rb2CO3
Cs2CO3
ALi900
ANa900
AK900
ARb900
ACs900
300
902
1071
1345
859
758
0.37
0.44
0.55
0.35
0.30
1.06
1.23
1.32
1.29
0.00
1.06
1.23
1.31
1.67
1.27
38
Figura 1.5. Microfotografías de SEM de aerogeles. a) Catalizador ácido acético43; b)
Catalizador Li2CO338.
En cuanto a los geles de carbón obtenidos mediante catálisis ácida, estos poseen
una microporosidad muy estrecha, que disminuye a medida que aumenta la proporción
de catalizador32,33,40,208,209. Esto hace que estos materiales sean excelentes candidatos
para ser utilizados como tamices moleculares de carbón, especialmente en la separación
de isómeros lineales y ramificados, ya que por una parte la microporosidad es accesible
1 m
a)
200 nm
b)

58 Capítulo I
al isómero lineal y no al ramificado y, por otro, la red de macroporos que se forma en
estas estructuras, presente siempre que se mantenga durante el secado y la
carbonización (que no colapse), facilitará la difusión del compuesto no adsorbido43.
1.2.1.3. Otras variables
Además de la proporción de reactivos, el grado de dilución y el catalizador,
existen otra serie de factores que pueden condicionar las propiedades del material final.
Uno de los más utilizados es el uso de surfactantes o moléculas plantilla31-33,187,188,192,210-
212, que permite mediante la formación de micelas, tener un control de la morfología de
las partículas y del tamaño de las mismas en función del surfactante empleado y de su
concentración, de manera que, por ejemplo, se pueden obtener microesferas aisladas
homogéneas en tamaños que pueden ser muy útiles en diversas aplicaciones210-212.
Otra de las variaciones posibles es la forma en la que se lleva a cabo el
gelificado y curado. El proceso de gelificación típico para los geles resorcinol-
formaldehido consta de un programa térmico en el cual la mezcla contenida en moldes
sellados se mantiene a 25°C durante 24 horas, se calienta a 50°C durante 24 horas más
para alcanzar el punto de gel (a partir del cual la disolución pierde su capacidad de fluir)
y luego a 80°C durante varios días para producir el curado (aumentando el
entrecruzamiento de las partículas formadas)29,30,32,33,37,43. Se puede también añadir
medio ácido para acelerar esta última etapa. En los últimos años se está desarrollando el
empleo de microondas en el proceso de gelificación, cuya principal ventaja está en el
menor tiempo necesario para llevar a cabo esta etapa (pasamos de varios días a unas
horas para obtener el gel)203,213. También se ha estudiado el empleo de monómeros
presentes en la naturaleza (como taninos o el ácido gálico), lo que podría abaratar los
costes de producción de este tipo de materiales199,213-215.
1.2.2. Secado
La forma en la que se seca un gel de carbón es tan importante, que es este
proceso el que condiciona el nombre que se le da al tipo de material obtenido. De esta
manera podemos distinguir tres tipos de geles en función del tipo de secado: aerogeles,

Capítulo I 59
cuando el secado lleva a cabo mediante el empleo de fluidos
supercríticos14,29,30,35,36,38,39; xerogeles, en los que el secado se lleva a cabo en
condiciones por debajo del punto crítico18,34,36,37,43,180,208,211; y criogeles en los que se
evita el paso de líquido a gas pasando el disolvente a estado sólido y sublimando el
mismo193,205,207. Los xerogeles y aerogeles son lo que se han aplicado en mayor medida
en procesos de adsorción, por lo que en esta Tesis Doctoral se han preparado materiales
de estos dos tipos y serán los que se describan en mayor medida.
El secado supercrítico, en el que normalmente se emplea CO2 (punto crítico Tc
= 31°C y Pc = 75atm), es el que da lugar a materiales con mayor porosidad32,33,36-39. Esto
se debe a la ausencia de tensiones superficiales entre las paredes del sólido y el fluido en
condiciones supercríticas, lo que hace que cuando se produce el paso de líquido a fluido
supercrítico no haya un colapso de la porosidad. Por ello los aerogeles son réplicas del
hidrogel o liogel correspondiente, en el que al final lo único que se ha hecho es eliminar
el disolvente del interior de los poros, pero sin que esto produzca un encogimiento de la
estructura, lo que daría lugar a poros de menor tamaño y con un volumen total menor.
Los principales inconvenientes de los aerogeles son: la necesidad, en el caso de
hidrogeles, de llevar a cabo un paso intermedio en el que el agua (no soluble en CO2 por
ser este apolar) debe ser sustituida por un disolvente orgánico (soluble); las altas
presiones requeridas para alcanzar el punto crítico hacen difícil implementar el secado
supercrítico a nivel industrial, además el CO2 debe ser introducido a temperaturas bajas
para que se mantenga en fase líquida antes de aumentar la presión y la temperatura
necesarias para alcanzar el punto crítico32,33.
En el caso de los xerogeles, su principal inconveniente lo constituye el colapso
de la porosidad, resultante del paso de estado líquido a gaseoso del disolvente32-34,36,37,43.
Este efecto es mayor cuanto mayor es la tensión superficial del líquido a secar. Es por
ello que en los últimos años se han desarrollado técnicas de secado que, sin ser tan
difíciles de implementar como el secado supercrítico, sean capaces de mantener la
estructura porosa del gel en el mayor grado posible. Así, Gallegos-Suárez y col.36
demostraron que un intercambio del agua por un disolvente con una menor tensión
superficial, como puede ser la acetona, reduce el fenómeno del colapso, siendo el
volumen y tamaño de mesoporos del xerogel intercambiado con acetona intermedio

60 Capítulo I
entre el del aerogel y el xerogel obtenido por secado directo. Además estos autores
demostraron que los tiempos de secado se pueden disminuir mediante el uso de
microondas o plasma sin que ello afecte a las propiedades texturales del xerogel
resultante.
1.1.3. Carbonización
Una vez secos, los geles deben ser sometidos a un tratamiento en atmosfera
inerte para dar lugar a geles de carbón33,35,40,216. El tratamiento térmico ha sido estudiado
por algunos investigadores mediante ensayos termogravimétricos en atmósfera
inerte35,40,216 en los que se observan las pérdidas de peso a medida que aumenta la
temperatura, determinándose que, independientemente de la morfología del gel, hasta
250°C descomponen subproductos de la reacción, a partir de los 300°C los grupos
oxigenados comienzan a descomponer, y cuando se aumenta la temperatura hasta 550°C
se comienzan a romper también enlaces C-H, produciéndose una reestructuración de los
enlaces C-C. Los rendimientos de carbonización de los geles de carbón suelen ser de un
50% aproximadamente, liberándose H2, H2O, CO, CO2 e hidrocarburos de bajo peso
molecular durante el proceso. El calentamiento se debe hacer con rampas bajas (1-2
°C·min-1) para que la descomposición de los grupos oxigenados y puentes metileno no
se produzca de forma abrupta y los gases producto de dicha descomposición puedan
salir lentamente32,33. La carbonización produce una contracción de la estructura que
reduce el tamaño y el volumen de los mesoporos y macroporos, mientras que es durante
este proceso cuando se forma la microporosidad, debido a la perdida de los grupos
lábiles descrita anteriormente.
1.1.4. Post-tratamientos
Al igual que los materiales obtenidos a partir de desechos o de minerales, los
geles de carbón son susceptibles de ser modificados tanto a nivel textural como
químico. No obstante, la introducción de heteroátomos se suele llevar a cabo durante el
proceso de síntesis, por ejemplo, sustituyendo el resorcinol por monómeros
nitrogenados23,162,180,200. Sin embargo, es relativamente común que geles con porosidad
no muy desarrollada, sean sometidos a procesos de activación para modificar,
Capítulo I 61
principalmente su microporosidad, ya que carece de sentido emplear un método que
permita el ajuste de los poros más grandes, para luego modificar esta estructura por un
proceso de activación43,44,172,195-198,203,211.
Para desarrollar la microporosidad de los geles de carbón, se han utilizado
principalmente la activación física, tanto con vapor de agua como con dióxido de
carbono43,172,195-198,211, y la activación química con hidróxido de potasio44,172,197,198,203.
Estos métodos permiten aumentar el volumen de microporos de los geles de carbón, que
suele ser reducido, bien por la creación de nuevos microporos o por el ensanchamiento
de los microporos ya existentes. En el capítulo VI de esta Tesis, se demuestra como la
activación con CO2 puede servir para ajustar la microporosidad de un xerogel, pasando
de un material poco poroso, a uno con propiedades de tamiz molecular para grados de
activación bajos, hasta a un filtro de hidrocarburos totales al aumentar el grado de
activación.
1.3. ADSORCIÓN DE COMPUESTOS ORGÁNICOS VOLÁTILES (COVs)
PRESENTES EN BIOCOMBUSTIBLES Y REFINADO
Como ya se ha comentado, una de las principales aplicaciones de los materiales
de carbono en general y del carbón activado en particular es su uso en el control de
emisiones contaminantes12,15,201,217,218. Esto implica optimizar tanto la textura porosa del
carbón como su química superficial, para adaptar sus propiedades al adsorbato concreto,
mejorando la interacción con el mismo9,10,16,17,219-221. Mediante los procedimientos
anteriormente descritos (activación, funcionalización y control sobre el tipo de
porosidad) podremos obtener materiales con una serie de propiedades específicas que
nos permitan adsorber selectivamente algunos de los compuestos presentes en la
mezcla17,43,73,74,163,220,221.
Una de estas aplicaciones la constituyen los dispositivos tipo canister17,69,70,222.
Los vehículos a motor llevan instalado entre el depósito y el motor un dispositivo que
contiene un adsorbente, generalmente carbón activado (Figura 1.6). El canister retiene
los gases resultantes de la evaporación del combustible almacenado en el depósito
cuando el motor está parado y al arrancar, se produce el arrastre de estos gases al motor

62 Capítulo I
donde son quemados69-71,222. Esto permite prevenir la emisión de contaminantes desde el
depósito del coche al aire y, al mismo tiempo, un mejor aprovechamiento del
combustible, con el consecuente beneficio medioambiental. Aunque los canister están
implantados en los vehículos comerciales desde hace años, sus propiedades no han sido
modificadas significativamente ante la aparición de los nuevos biocombustibles222-227.
Figura 1.6. Funcionamiento de un canister de vehículos a motor.
Los biocombustibles basados en etanol son atractivos para países que no tienen
reservas de combustibles fósiles y que no quieren depender energéticamente de otros. El
etanol se comenzó a usar como antidenonante en combustibles, al igual que otros
compuestos oxigenados (MTBE, ETBE o TAME) cuando se prohibió el uso del
tetraetilplomo125,226-230. La introducción de etanol en combustibles para automóviles ha
crecido hasta el punto que ya hay muchos biocombustibles cuyo contenido en etanol
supera el 50% de la mezcla. El bioetanol de hecho se usa propiamente como un
biocombustible125,228-232.
Sin embargo, aunque el uso de etanol en biocombustibles tiene una serie de
ventajas228,229, como el no depender de los países productores de petróleo, muchos de
ellos con un contexto sociopolítico inestable, también plantea una serie de
inconvenientes a los que hay que hacer frente. Uno de ellos ha sido estudiado por varios
autores, que han llegado a la conclusión de que la adición de etanol a combustibles
provoca mayores pérdidas por evaporación, generándose concentraciones de
hidrocarburos, tanto alifáticos como aromáticos, mayores72,225-227,231. Esto, sumado a
que los vapores generados contendrán compuestos polares, hace que las propiedades de
los lechos de carbón activado que van a ser usados en los canister deban ser ajustadas
EVAPORATIVEEMISSIONS
Combustibleevaporado
OFF AdsorciónON Desorción
Combustibledesorbido

Capítulo I 63
tanto a nivel textural como químico, para que éstos sean capaces de retener tanto los
compuestos polares como los apolares17,71,72,233.
El estudio del comportamiento de un sistema canister es complicado, debido a
que la mezcla de sustancias que deben ser adsorbidas es compleja, con lo que son
muchos factores los que deben ser analizados. No obstante, existen algunos trabajos que
mediante modelos empíricos tratan de estimar las pérdidas por evaporación en vehículos
equipados con este tipo de sistemas69-72,222-225. En función del diseño del vehículo el
canister puede localizarse en la parte trasera junto al depósito o en la parte delantera
junto al motor. El propio diseño del coche, la temperatura o el combustible empleado,
son algunos de los factores que afectan a las emisiones del vehículo cuando se encuentra
parado71,72,225.
Para mejorar la adsorción de compuestos polares como el etanol, debemos
introducir funcionalidades en la superficie del carbón mediante los protocolos de
oxidación descritos previamente17,164,234,235. Sin embargo, hay que tener en cuenta que,
mientras que para la adsorción de etanol a concentraciones bajas la variable crítica va a
ser el contenido y la forma de los grupos superficiales oxigenados, a altas
concentraciones (próximas a condiciones de saturación) la porosidad total del
adsorbente va a ser fundamental para la adsorción de este compuesto17,164,234. Además,
en los casos en los que el vapor de agua también está presente, la presencia de algunos
de estos grupos puede ser contraproducente, ya que puede ser que el agua presente una
mayor interacción con estas funcionalidades que el propio contaminante233,235-237. Por
ello, será necesario ajustar la química superficial del material, pero teniendo en cuenta
que una reducción significativa de las propiedades texturales viene acompañada por una
menor adsorción de hidrocarburos y de una menor adsorción de etanol si éste se halla a
altas concentraciones.
El índice de octanos de un combustible es una propiedad que se determina
experimentalmente y que está relacionada con la capacidad de compresión de esa
mezcla en un cilindro del motor antes de producirse la detonación de la
misma43,73,74,78,228,229. Este índice está basado en una escala arbitraria en el que el 0 está
asignado al n-heptano (comúnmente empleado como disolvente de la mezcla) y el 100

64 Capítulo I
al 2,2',4-trimetilpentano (TMP). A partir de ellos, se determinan el resto de índices
(Tabla 1.4) basándose en la capacidad de cada compuesto para ser comprimido en el
cilindro sin llegar a producirse su detonación, y para determinar el número de octanos
de una mezcla, se comparará la capacidad antidenonante de la misma con la del TMP
puro y la del n-heptano puro.
Tabla 1.4. Índice de octanos de hidrocarburos presentes en biocombustibles74.
Compuesto Índice de octanos
n-heptano 0
2,2',4-trimetilpentano 100
n-octano -17
2-metilheptano 22
n-hexano 25
2-metilpentano 44
2,2-dimetilbutano 93
Los antidetonantes oxigenados anteriormente mencionados (alcoholes y éteres)
tienen un índice de octanos que en muchos de ellos supera el valor 100 del TMP228,229.
No obstante, conllevan otra serie de problemas medioambientales como es su alta
solubilidad en agua, que los convierte en un contaminante importante de
acuíferos72,220,221,232. Pero la adición de antidetonantes no es la única forma de mejorar el
comportamiento de los combustibles. El índice de octanos también puede ser elevado
mediante diversos procesos de refinamiento del combustible43,73,74,78,238. Hay que tener
en cuenta que los combustibles tal y como se obtienen del petróleo no cumplen las
especificaciones necesarias para ningún tipo de combustible comercial. Por ello, para
evitar los problemas asociados al uso de combustibles de bajo octanaje en motores de
alto régimen de compresión (deterioro de los pistones y las bielas por la detonación
prematura de la mezcla) los combustibles deben ser sometidos a diferentes procesos.
Por ejemplo, los hidrocarburos de entre 6 y 8 átomos de carbono son
parcialmente convertidos en Benceno, Tolueno y Xilenos (BTX) que tienen índices de

Capítulo I 65
octano muy alto mediante un proceso de aromatización llevado a cabo por un lecho
catalítico que a la vez produce la deshidrogenación y la ciclación de estos
compuestos238. Los hidrocarburos ligeros que son gases a condiciones ambientales se
transforman en hidrocarburos más grandes239 y los más pesados se someten a un
proceso de crackeo (generalmente mediante zeolitas) para dar lugar a hidrocarburos de
menor peso molecular240.
Una tendencia que se observa cuando se analizan los índices de octano de
distintos hidrocarburos saturados es que este es mayor en el caso de las parafinas
ramificadas que en el de las lineales (Tabla 1.4). Por ello, los combustibles suelen ser
tratados mediante un tamiz molecular para llevar a cabo una separación de los
productos, pudiendo obtenerse un mayor contenido en compuestos ramificados, con lo
que el índice de octanos de la mezcla combustible aumentará43,73,74,78.
La adsorción selectiva de hidrocarburos lineales frente a ramificados ha sido
estudiada en distintos adsorbentes como tamices moleculares de carbón43,73,74,78,
zeolitas241-245 y MOFs246,247. Aunque las zeolitas han sido las más usadas debido a que
se puede controlar fácilmente el tamaño de sus poros241-245, en los últimos años, gracias
al avance en los procesos para controlar la porosidad de los materiales de carbono, se
han desarrollado una serie de tamices moleculares de carbón que son capaces de llevar a
cabo este tipo de procesos43,73,74,78.
1.4. OBTENCIÓN Y REFINADO DE BIOGÁS
El biogás se obtiene mediante digestión anaeróbica de biomasa de distintos
orígenes como abonos, restos de la industria alimentaria o cereales65-68,126,248-250. Ya
existen en algunas ciudades proyectos que pretenden implementar un sistema de
transporte público movido por biogás generado a partir de residuos urbanos, por
ejemplo, Londres251. La composición del biogás (Tabla 1.5) varía dependiendo del
origen y del proceso de digestión, pero está compuesto normalmente por metano
(alrededor de un 60%), dióxido de carbono (cerca de un 40%) y el resto de componentes

66 Capítulo I
son minoritarios, pero algunos de ellos muy perjudiciales como el sulfuro de hidrógeno
o los siloxanos66,67,126,250,252.
Tabla 1.5. Composición típica del biogás.
Gas %
CH4 40-75
CO2 15-60
H2O 5-10
N2 0-2
H2S 0.005-2
Siloxanos 0-0.02
CO 0-0.6
Para que el biogás pueda ser usado en cualquier aplicación es necesario
eliminar tanto los siloxanos (ya que pueden dar lugar a SiO2 que daña las turbinas de los
motores)252,253 como el sulfuro de hidrógeno (corrosivo)252,254. Una vez eliminados estos
compuestos, se obtiene un biogás que puede ser utilizado, por ejemplo, para obtener la
energía eléctrica necesaria para mantener la refinería de biogás en funcionamiento
(Figura 1.7)249,252. Sin embargo, si el biogás necesita ser licuado para su transporte o va
a ser utilizado como combustible, necesita ser convertido en lo que se conoce como
biometano, que no es más que metano obtenido a partir de biogás. Para ello es necesario
llevar a cabo una etapa en la que el CO2 presente en la mezcla es separado del
CH475,76,255-261.

Capítulo I 67
Figura 1.7. Producción y refinamiento de biogás.
En aras de separar el CO2 presente en el biogás del CH4 existen diversas
tecnologías como la destilación criogénica262,263, la separación en membranas264-266 o la
absorción en aminas líquidas60,61,259. La última es la que se utiliza a nivel industrial
(Figura 1.8), sin embargo, plantea una serie de problemas como son la perdida de
absorbente por evaporación y, sobre todo, la gran cantidad de energía necesaria para
regenerar la amina77,80,260,267,268. Con objeto de salvar este inconveniente, se han
estudiado tecnologías basadas en la adsorción, de manera que la mezcla se hace pasar
por un lecho adsorbente que retiene selectivamente el dióxido de carbono, dejando pasar
metano limpio79,80,255,257,258,260,261,267-275. Este adsorbente luego es regenerado para ser
utilizado nuevamente y en función de cómo se lleva a cabo esta regeneración tenemos
diversas técnicas: Temperature Swing-Adsorption (TSA)274,275, en la que el adsorbente
se regenera mediante calentamiento; Pressure Swing-Adsorption (PSA)79,255,267, en la
que se varía la presión para producir la desorción del gas; o Vacuum Pressure Swing-
Adsorption (VPSA)261,275 en la que el compuesto adsorbido se desorbe al hacer vacío en
el lecho adsorbente. Las últimas son las más utilizadas ya que requieren de un menor
gasto energético y variar la temperatura puede repercutir en las propiedades del
material.
Biogas
Cereales
Residuos alimentarios
Abonos
BIOMETANO
Eliminación de H2S y siloxanos
Separación CO2

68 Capítulo I
Figura 1.8. Planta de refinamiento de biogás por aminas líquidas en Könnern
(Alemania).
En cuanto a los adsorbentes utilizados, se han probado MOFs con un alto
contenido en nitrógeno269-271, zeolitas y materiales zeolíticos de tipo red de imidazol
(ZIFs)79,256,257,261,273,276 y carbones activados77,79,80,93,165,260,267,272. Los tres primeros son
adsorbentes de un precio elevado, lo que limita su aplicabilidad debido a que su precio
no es competitivo con el que supone la absorción con aminas líquidas. Sin embargo, el
uso de carbones activados que sean capaces de llevar a cabo el proceso, que puedan ser
obtenidos a partir de materiales de desecho y por procedimientos sintéticos
relativamente sencillos y baratos, puede ser una buena alternativa.
En este sentido, se han preparado materiales de carbón de distintos orígenes,
pero principalmente a partir de materiales lignocelulósicos y, concretamente, de madera,
para llevar a cabo el refinamiento de biogás, obteniéndose resultados que igualan o
incluso mejoran a los obtenidos mediante zeolitas77,79,80,93,165,260,272,276. Las propiedades
del carbón pueden ser modificadas mediante procesos de activación, para ajustar la
porosidad del adsorbente y por introducción de heteroátomos, principalmente nitrógeno,
para aumentar la capacidad de adsorción de CO275,76,272. No obstante, a la hora de llevar
a cabo dichos procedimientos hay que tener en cuenta que: el coste final del material no
ha de ser elevado para que pueda ser competitivo; la modulación de la selectividad a
partir de la introducción de funcionalidades químicas debe ser controlada, de manera
que la interacción del adsorbente con la molécula de CO2 no sea tan fuerte que dificulte

Capítulo I 69
significativamente luego la desorción del gas, lo que llevaría a problemas similares en
cuanto a la regeneración de la fase activa a los que encontramos cuando se usan
directamente aminas en fase líquida.
1.5. OBJETIVOS
El objetivo principal de la presente Tesis Doctoral es el desarrollo de
adsorbentes específicos de COVs presentes en biocombustibles basados en carbono,
tanto carbones activados como geles de carbón. También se plantea el refinamiento de
biogás mediante separación de mezclas CO2 y CH4 por procesos de adsorción selectiva.
De este modo, para la preparación de los adsorbentes se han tenido en cuenta
tanto las propiedades del adsorbato concreto (polaridad, tamaño, forma) como las
características del proceso de adsorción (concentración, régimen estático o dinámico),
con el fin de obtener materiales que sean capaces de adsorber selectiva o
específicamente uno o varios gases de una mezcla concreta.
En los primeros capítulos de esta Tesis se detalla el desarrollo de carbones
activados a partir de hueso de aceituna para la adsorción específica de etanol y n-octano,
ambos COVs presentes en biocombustibles. La porosidad del material se incrementó
mediante un proceso de activación química para generar un alto volumen de microporos
(para favorecer la adsorción) y de mesoporos (que actúan como alimentadores y
mejoran la desorción de los compuestos). El carbón activado fue sometido a un proceso
de oxidación para crear una serie de grupos superficiales oxigenados, y luego a
tratamientos térmicos a distintas temperaturas para eliminar parte de estos grupos. De
esta forma, se pudo estudiar la influencia de los distintos grupos oxigenados en el
proceso de adsorción de etanol a bajas concentraciones. Además, puesto que el
tratamiento generó modificaciones en la textura porosa de los distintos carbones
activados, se pudo estudiar la influencia de la microporosidad en la adsorción de n-
octano. Los estudios fueron llevados a cabo en régimen tanto dinámico como estático,
se estudió la influencia del vapor de agua en los procesos de adsorción de ambos COVs
y la adsorción competitiva de etanol y n-octano. También se intentaron optimizar las
70 Capítulo I
propiedades del lecho mediante la mezcla física de dos de los adsorbentes, para así
poder llevar a cabo la adsorción simultánea de ambos contaminantes.
En el capítulo VI de esta Tesis, se plantea el diseño de adsorbentes específicos
de hidrocarburos lineales de ramificados. Para ello se sintetizó un aerogel y un xerogel
de carbón mediante catálisis ácida, de manera que se obtuvieron materiales con un
tamaño medio de microporos por debajo de los 0.7 nm (tamaño menor que el de la
molécula de 2,2',4-trimetilpentano, TMP). La porosidad del xerogel fue modificada
mediante activación física con CO2 para estudiar la relación entre la microporosidad del
adsorbente y la capacidad para adsorber tanto n-octano (lineal) como TMP (ramificado).
Los estudios se llevaron a cabo en régimen dinámico, tanto para la adsorción de cada
hidrocarburo individualmente, como para la adsorción competitiva.
Los dos últimos capítulos se refieren a la preparación de carbones para la
adsorción selectiva de CO2 en el refinado de biogás. Este proceso está gobernado
principalmente por el tamaño de los microporos y por la presencia de funcionalidades
químicas (principalmente grupos de tipo amina) en la superficie del carbón. En este
trabajo se han empleado dos materiales: un carbón activado obtenido por activación
física con CO2 de pellets de madera de pino y un xerogel de carbón. En ambos casos se
procuró que los materiales tuvieran un volumen de microporos elevado pero cuya
anchura fuera pequeña, ya que es en los microporos estrechos donde las diferencias
entre la interacción de la superficie del carbón con la molécula de dióxido de carbono y
con la de metano son más acentuadas. También se optó por materiales mesoporosos que
facilitaran la desorción del CO2 para regenerar el lecho adsorbente. Ambos materiales
fueron caracterizados y utilizados como adsorbentes de ambos gases en condiciones de
equilibrio (isotermas a alta presión de cada gas) y en régimen dinámico (tanto de un
componente como competitiva), analizándose su comportamiento como adsorbentes
selectivos de CO2.

Capítulo I 71
1.6. BIBLIOGRAFÍA
[1] W.L. Theo, J.S. Lim, H. Hashim, A.A. Mustaffa, and W.S. Ho, Review of pre-
combustion capture and ionic liquid in carbon capture and storage, Applied
Energy, 183 (2016) 1633-1663.
[2] X. Jiang, D. Chen, Z. Ma, and J. Yan, Models for the combustion of single solid
fuel particles in fluidized beds: A review, Renewable and Sustainable Energy
Reviews, 68, Part 1 (2017) 410-431.
[3] P. Babu, P. Linga, R. Kumar, and P. Englezos, A review of the hydrate based
gas separation (HBGS) process for carbon dioxide pre-combustion capture,
Energy, 85 (2015) 261-279.
[4] A. Nandy, C. Loha, S. Gu, P. Sarkar, M.K. Karmakar, and P.K. Chatterjee,
Present status and overview of Chemical Looping Combustion technology,
Renewable and Sustainable Energy Reviews, 59 (2016) 597-619.
[5] A. Baçaoui, A. Dahbi, A. Yaacoubi, C. Bennouna, F.J. Maldonado-Hódar, J.
Rivera-Utrilla, F. Carrasco-Marín, and C. Moreno-Castilla, Experimental
Design To Optimize Preparation of Activated Carbons for Use in Water
Treatment, Environ. Sci. Technol., 36 (2002) 3844-3849.
[6] R.G. Bansal, J.B. Donnet, and F. Stoeckli, Activated Carbon, Marcel Dekker,
New York and Basel, 1988.
[7] M.I. Bautista-Toledo, J. Rivera-Utrilla, J.D. Méndez-Díaz, M. Sánchez-Polo,
and F. Carrasco-Marín, Removal of the surfactant sodium
dodecylbenzenesulfonate from water by processes based on
adsorption/bioadsorption and biodegradation, Journal of Colloid and Interface
Science, 418 (2014) 113-119.
[8] A. Derylo-Marczewska, M. Blachnio, A.W. Marczewski, A. Swiatkowski, and
B. Buczek, Adsorption of chlorophenoxy pesticides on activated carbon with

72 Capítulo I
gradually removed external particle layers, Chemical Engineering Journal, 308
(2017) 408-418.
[9] R.R. Gil, B. Ruiz, M.S. Lozano, M.J. Martín, and E. Fuente, VOCs removal by
adsorption onto activated carbons from biocollagenic wastes of vegetable
tanning, Chemical Engineering Journal, 245 (2014) 80-88.
[10] F. Gironi and V. Piemonte, VOCs removal from dilute vapour streams by
adsorption onto activated carbon, Chemical Engineering Journal, 172 (2011)
671-677.
[11] C. Ji, P. Xu, S. Wang, Y. Feng, T. Su, M. Yu, and X. Cong, Reducing HC
emissions from a gasoline engine at the starting conditions through activated
carbon adsorption, Applied Thermal Engineering, 112 (2017) 124-132.
[12] F.I. Khan and A. Ghoshal, Removal of Volatile Organic Compounds from
polluted air, Journal of Loss Prevention in the Process Industries, 13 (2000)
527-545.
[13] J. Lladó, M. Solé-Sardans, C. Lao-Luque, E. Fuente, and B. Ruiz, Removal of
pharmaceutical industry pollutants by coal-based activated carbons, Process
Safety and Environmental Protection, 104, Part A (2016) 294-303.
[14] F.J. Maldonado-Hódar, C. Moreno-Castilla, F. Carrasco-Marín, and A.F. Pérez-
Cadenas, Reversible toluene adsorption on monolithic carbon aerogels, Journal
of Hazardous Materials, 148 (2007) 548-552.
[15] F.J. Maldonado-Hódar, Removing aromatic and oxygenated VOCs from
polluted air stream using Pt carbon aerogels: Assessment of their performance
as adsorbents and combustion catalysts, Journal of Hazardous Materials, 194
(2011) 216-222.
[16] J. Rivera-Utrilla, M. Sánchez-Polo, V. Gómez-Serrano, P.M. Álvarez, M.C.M.
Alvim-Ferraz, and J.M. Dias, Activated carbon modifications to enhance its
Capítulo I 73
water treatment applications. An overview, Journal of Hazardous Materials,
187 (2011) 1-23.
[17] J.F. Vivo-Vilches, E. Bailón-García, A.F. Pérez-Cadenas, F. Carrasco-Marín,
and F.J. Maldonado-Hódar, Tailoring activated carbons for the development of
specific adsorbents of gasoline vapors, Journal of Hazardous Materials, 263,
Part 2 (2013) 533-540.
[18] E. Bailón-García, F. Carrasco-Marín, A.F. Pérez-Cadenas, and F.J. Maldonado-
Hódar, Development of carbon xerogels as alternative Pt-supports for the
selective hydrogenation of citral, Catalysis Communications, 58 (2015) 64-69.
[19] B. Meryemoglu, S. Irmak, and A. Hasanoglu, Production of activated carbon
materials from kenaf biomass to be used as catalyst support in aqueous-phase
reforming process, Fuel Processing Technology, 151 (2016) 59-63.
[20] R.M. Mironenko, O.B. Belskaya, T.I. Gulyaeva, M.V. Trenikhin, A.I.
Nizovskii, A.V. Kalinkin, V.I. Bukhtiyarov, A.V. Lavrenov, and V.A.
Likholobov, Liquid-phase hydrogenation of benzaldehyde over Pd-Ru/C
catalysts: Synergistic effect between supported metals, Catalysis Today, 279,
Part 1 (2017) 2-9.
[21] A. Elmouwahidi, Z. Zapata-Benabithe, F. Carrasco-Marín, and C. Moreno-
Castilla, Activated carbons from KOH-activation of argan (Argania spinosa)
seed shells as supercapacitor electrodes, Bioresource Technology, 111 (2012)
185-190.
[22] M. Olivares-Marín, J.A. Fernández, M.J. Lázaro, C. Fernández-González, A.
Macías-García, V. Gómez-Serrano, F. Stoeckli, and T.A. Centeno, Cherry
stones as precursor of activated carbons for supercapacitors, Materials
Chemistry and Physics, 114 (2009) 323-327.
[23] M.J. Mostazo-López, R. Ruiz-Rosas, E. Morallón, and D. Cazorla-Amorós,
Nitrogen doped superporous carbon prepared by a mild method. Enhancement

74 Capítulo I
of supercapacitor performance, International Journal of Hydrogen Energy, 41
(2016) 19691-19701.
[24] X. Ren, M. Xia, Q. Yan, and C. Ge, Controllable modification of nanostructured
carbon with hollow macroporous core/mesoporous shell and its application as
templates in aqueous solution, Chemical Physics Letters, 662 (2016) 286-290.
[25] P. Jana, V. Fierro, and A. Celzard, Sucrose-based carbon foams with enhanced
thermal conductivity, Industrial Crops and Products, 89 (2016) 498-506.
[26] X. He, Z. Liu, H. Ma, N. Zhang, M. Yu, and M. Wu, Shell-like hierarchical
porous carbons for high-rate performance supercapacitors, Microporous and
Mesoporous Materials, 236 (2016) 134-140.
[27] Y. Kido, K. Nakanishi, N. Okumura, and K. Kanamori, Hierarchically porous
nickel/carbon composite monoliths prepared by sol gel method from an ionic
precursor, Microporous and Mesoporous Materials, 176 (2013) 64-70.
[28] J. Gao, X. Wang, Y. Zhang, J. Liu, Q. Lu, and M. Liu, Boron-doped ordered
mesoporous carbons for the application of supercapacitors, Electrochimica Acta,
207 (2016) 266-274.
[29] R.W. Pekala, Low density, resorcinol-formaldehyde aerogels, US Patent,
US4873218 A, 1989.
[30] R.W. Pekala, Organic aerogels from the polycondensation of resorcinol with
formaldehyde, Journal of Materials Science, 24 (1989) 3221-3227.
[31] M. Enterría and J.L. Figueiredo, Nanostructured mesoporous carbons: Tuning
texture and surface chemistry, Carbon, 108 (2016) 79-102.
[32] F.J. Maldonado-Hódar, Advances in the development of nanostructured
catalysts based on carbon gels, Catalysis Today, 218 219 (2013) 43-50.

Capítulo I 75
[33] S.A. Al-Muhtaseb and J.A. Ritter, Preparation and Properties of
Resorcinol Formaldehyde Organic and Carbon Gels, Advanced Materials, 15
(2003) 101-114.
[34] E.G. Calvo, J.A. Menéndez, and A. Arenillas, Influence of alkaline compounds
on the porosity of resorcinol-formaldehyde xerogels, Journal of Non-Crystalline
Solids, 452 (2016) 286-290.
[35] F.J. Maldonado-Hódar, M.A. Ferro-García, J. Rivera-Utrilla, and C. Moreno-
Castilla, Synthesis and textural characteristics of organic aerogels, transition-
metal-containing organic aerogels and their carbonized derivatives, Carbon, 37
(1999) 1199-1205.
[36] E. Gallegos-Suárez, A.F. Pérez-Cadenas, F.J. Maldonado-Hódar, and F.
Carrasco-Marín, On the micro- and mesoporosity of carbon aerogels and
xerogels. The role of the drying conditions during the synthesis processes,
Chemical Engineering Journal, 181 182 (2012) 851-855.
[37] S. Morales-Torres, F.J. Maldonado-Hódar, A.F. Pérez-Cadenas, and F.
Carrasco-Marín, Structural characterization of carbon xerogels: From film to
monolith, Microporous and Mesoporous Materials, 153 (2012) 24-29.
[38] S. Morales-Torres, F.J. Maldonado-Hódar, A.F. Pérez-Cadenas, and F.
Carrasco-Marín, Textural and mechanical characteristics of carbon aerogels
synthesized by polymerization of resorcinol and formaldehyde using alkali
carbonates as basification agents, Phys. Chem. Chem. Phys., 12 (2010) 10365-
10372.
[39] D. Fairén-Jiménez, F. Carrasco-Marín, and C. Moreno-Castilla, Porosity and
surface area of monolithic carbon aerogels prepared using alkaline carbonates
and organic acids as polymerization catalysts, Carbon, 44 (2006) 2301-2307.
[40] C. Lin and J.A. Ritter, Effect of synthesis pH on the structure of carbon
xerogels, Carbon, 35 (1997) 1271-1278.

76 Capítulo I
[41] L. Zhang, W. Dong, and W.C. Li, Nitrogen-doped porous carbon with a 3D
network structure produced from resorcinol-gelatin-formaldehyde co-polymers
and its use as an electrode material for supercapacitors, Carbon, 110 (2016)
521.
[42] C. Alegre, D. Sebastián, M.E. Gálvez, R. Moliner, and M.J. Lázaro, Sulfurized
carbon xerogels as Pt support with enhanced activity for fuel cell applications,
Applied Catalysis B: Environmental, 192 (2016) 260-267.
[43] J.F. Vivo-Vilches, F. Carrasco-Marín, A.F. Pérez-Cadenas, and F.J. Maldonado-
Hódar, Fitting the porosity of carbon xerogel by CO2 activation to improve the
TMP/n-octane separation, Microporous and Mesoporous Materials, 209 (2015)
10-17.
[44] G. Wang, Z. Ling, C. Li, Q. Dong, B. Qian, and J. Qiu, Ionic liquid as template
to synthesize carbon xerogels by coupling with KOH activation for
supercapacitors, Electrochemistry Communications, 31 (2013) 31-34.
[45] X. Cao, X. Dai, and J. Liu, Building energy-consumption status worldwide and
the state-of-the-art technologies for zero-energy buildings during the past
decade, Energy and Buildings, 128 (2016) 198-213.
[46] E. Panos, M. Densing, and K. Volkart, Access to electricity in the World Energy
Council's global energy scenarios: An outlook for developing regions until
2030, Energy Strategy Reviews, 9 (2016) 28-49.
[47] E. Dace and D. Blumberga, How do 28 European Union Member States
perform in agricultural greenhouse gas emissions? It depends on what we look
at: Application of the multi-criteria analysis, Ecological Indicators, 71 (2016)
352-358.
[48] A.C. Christiansen and J. Wettestad, The EU as a frontrunner on greenhouse gas
emissions trading: how did it happen and will the EU succeed?, Climate Policy,
3 (2003) 3-18.

Capítulo I 77
[49] M. Meinshausen, N. Meinshausen, W. Hare, S.C.B. Raper, K. Frieler, R. Knutti,
D.J. Frame, and M.R. Allen, Greenhouse-gas emission targets for limiting
global warming to 2 °C, Nature, 458 (2009) 1158-1162.
[50] A. Burnham, J. Han, C.E. Clark, M. Wang, J.B. Dunn, and I. Palou-Rivera,
Life-Cycle Greenhouse Gas Emissions of Shale Gas, Natural Gas, Coal, and
Petroleum, Environmental Science & Technology, 46 (2012) 619-627.
[51] D. Moreira and J.C.M. Pires, Atmospheric CO2 capture by algae: Negative
carbon dioxide emission path, Bioresource Technology, 215 (2016) 371-379.
[52] D. Archer, M. Eby, V. Brovkin, A. Ridgwell, L. Cao, U. Mikolajewicz, K.
Caldeira, K. Matsumoto, G. Munhoven, A. Montenegro, and K. Tokos,
Atmospheric Lifetime of Fossil Fuel Carbon Dioxide, Annual Review of Earth
and Planetary Sciences, 37 (2009) 117-134.
[53] H. Chen, F. Wang, C. Zhao, and N. Khalili, The effect of fly ash on reactivity of
calcium based sorbents for CO2 capture, Chemical Engineering Journal, 309
(2017) 725-737.
[54] Y. Du, Y. Wang, and G.T. Rochelle, Piperazine/4-hydroxy-1-methylpiperidine
for CO2 capture, Chemical Engineering Journal, 307 (2017) 258-263.
[55] Y. Hu, G. Xu, C. Xu, and Y. Yang, Thermodynamic analysis and techno-
economic evaluation of an integrated natural gas combined cycle (NGCC)
power plant with post-combustion CO2 capture, Applied Thermal Engineering,
111 (2017) 308-316.
[56] P. Luis, T. Van Gerven, and B. Van der Bruggen, Recent developments in
membrane-based technologies for CO2 capture, Progress in Energy and
Combustion Science, 38 (2012) 419-448.
[57] D. Schweitzer, M. Beirow, A. Gredinger, N. Armbrust, G. Waizmann, H.
Dieter, and G. Scheffknecht, Pilot-Scale Demonstration of Oxy-SER steam

78 Capítulo I
Gasification: Production of Syngas with Pre-Combustion CO2 Capture, Energy
Procedia, 86 (2016) 56-68.
[58] R. Pérez-Vega, A. Abad, F. García-Labiano, P. Gayán, L.F. de Diego, and J.
Adánez, Coal combustion in a 50 kWth Chemical Looping Combustion unit:
Seeking operating conditions to maximize CO2 capture and combustion
efficiency, International Journal of Greenhouse Gas Control, 50 (2016) 80-92.
[59] S. Mukherjee, P. Kumar, A. Yang, and P. Fennell, Energy and exergy analysis
of chemical looping combustion technology and comparison with pre-
combustion and oxy-fuel combustion technologies for CO2 capture, Journal of
Environmental Chemical Engineering, 3 (2015) 2104-2114.
[60] J. Kim, D.A. Pham, and Y.I. Lim, Gas liquid multiphase computational fluid
dynamics (CFD) of amine absorption column with structured-packing for CO2
capture, Computers & Chemical Engineering, 88 (2016) 39-49.
[61] J. Zhang, D.W. Agar, X. Zhang, and F. Geuzebroek, CO2 absorption in biphasic
solvents with enhanced low temperature solvent regeneration, Energy Procedia,
4 (2011) 67-74.
[62] L.Y. Batan, G.D. Graff, and T.H. Bradley, Techno-economic and Monte Carlo
probabilistic analysis of microalgae biofuel production system, Bioresource
Technology, 219 (2016) 45-52.
[63] R.A. Voloshin, M.V. Rodionova, S.K. Zharmukhamedov, T. Nejat Veziroglu,
and S.I. Allakhverdiev, Review: Biofuel production from plant and algal
biomass, International Journal of Hydrogen Energy, 41 (2016) 17257-17273.
[64] H.B. Aditiya, T.M.I. Mahlia, W.T. Chong, H. Nur, and A.H. Sebayang, Second
generation bioethanol production: A critical review, Renewable and Sustainable
Energy Reviews, 66 (2016) 631-653.

Capítulo I 79
[65] C. Chen, W. Guo, H.H. Ngo, D.J. Lee, K.L. Tung, P. Jin, J. Wang, and Y. Wu,
Challenges in biogas production from anaerobic membrane bioreactors,
Renewable Energy, 98 (2016) 120-134.
[66] H. Chen, J. Wan, K. Chen, G. Luo, J. Fan, J. Clark, and S. Zhang, Biogas
production from hydrothermal liquefaction wastewater (HTLWW): Focusing on
the microbial communities as revealed by high-throughput sequencing of full-
length 16S rRNA genes, Water Research, 106 (2016) 98-107.
[67] F.A. Lattieff, A study of biogas production from date palm fruit wastes, Journal
of Cleaner Production, 139 (2016) 1191-1195.
[68] C. Liu, H. Li, Y. Zhang, and C. Liu, Improve biogas production from low-
organic-content sludge through high-solids anaerobic co-digestion with food
waste, Bioresource Technology, 219 (2016) 252-260.
[69] U. Mohr, Activated carbon canisters for automobiles, Filtration & Separation,
34 (1997) 1016-1018.
[70] K. Sato and N. Kobayashi, Adsorption and Desorption Simulation of Carbon
Canister Using n-Butane as Model Compound of Gasoline, Journal of the Japan
Petroleum Institute, 54 (2011) 136-145.
[71] W.M.T.M. Reimerink, J.D. MacDowall, and D. Kleut, New developments of
activated carbons for evaporative loss control devices (ELCD), in: Studies in
Surface Science and Catalysis Adsorption and its Applications in Industry and
Environmental ProtectionVol II: Applications in Environmental Protection,
Elsevier, 1999, pp. 821-831.
[72] M. De Gennaro, E. Paffumi, and G. Martini, Data-driven analysis of the
effectiveness of evaporative emissions control systems of passenger cars in real
world use condition: Time and spatial mapping, Atmospheric Environment, 129
(2016) 277-293.

80 Capítulo I
[73] G.C. Laredo, J. Castillo, and J.O. Marroquin, Gas-phase diffusion of linear and
multi-branched alkanes on a carbon molecular sieve by the ZLC method,
Separation and Purification Technology, 103 (2013) 36-42.
[74] G.C. Laredo, J.L. Cano, J. Castillo, J.A. Hernandez, and J.O. Marroquin, Octane
enhancement by the selective separation of branched and linear paraffins in
naphthas using a PVDC-PVC carbon molecular sieve, Fuel, 117, Part A (2014)
660-666.
[75] D.J. Seo, Z. Gou, H. Fujita, T. Fujii, and A. Sakoda, Simple fabrication of
molecular sieving carbon for biogas upgrading via a temperature controlled
carbonization of Phyllostachys pubescens, Renewable Energy, 86 (2016) 693-
702.
[76] L. Pino, C. Italiano, A. Vita, C. Fabiano, and V. Recupero, Sorbents with high
efficiency for CO2 capture based on amines-supported carbon for biogas
upgrading, Journal of Environmental Sciences, 48 (2016) 138-150.
[77] N. Álvarez-Gutiérrez, M.V. Gil, F. Rubiera, and C. Pevida, Adsorption
performance indicators for the CO2/CH4 separation: Application to biomass-
based activated carbons, Fuel Processing Technology, 142 (2016) 361-369.
[78] A. Bassam, R.A. Conde-Gutierrez, J. Castillo, G. Laredo, and J.A. Hernandez,
Direct neural network modeling for separation of linear and branched paraffins
by adsorption process for gasoline octane number improvement, Fuel, 124
(2014) 158-167.
[79] M. Kacem, M. Pellerano, and A. Delebarre, Pressure swing adsorption for
CO2/N2 and CO2/CH4 separation: Comparison between activated carbons and
zeolites performances, Fuel Processing Technology, 138 (2015) 271-283.
[80] C.A. Grande, R. Blom, A. Möller, and J. Möllmer, High-pressure separation of
CH4/CO2 using activated carbon, Chemical Engineering Science, 89 (2013) 10-
20.
Capítulo I 81
[81] F. Rodríguez-Reinoso, Activated Carbon and Adsorption A2 - Buschow, K.H.
Jürgen, in: Encyclopedia of Materials: Science and Technology (Second
Edition), Elsevier, Oxford, 2001, pp. 22-34.
[82] F. Rodriguez-Reinoso and J. Silvestre-Albero, Activated Carbon and
Adsorption, Reference Module in Materials Science and Materials Engineering,
Elsevier, 2016.
[83] H. Marsh and F. Rodríguez-Reinoso, CHAPTER 5 - Activation Processes
(Thermal or Physical), in: Activated Carbon, Elsevier, Oxford, 2006, pp. 243-
321.
[84] C. Moreno-Castilla, F. Carrasco-Marín, M.V. López-Ramón, and M.A. Alvarez-
Merino, Chemical and physical activation of olive-mill waste water to produce
activated carbons, Carbon, 39 (2001) 1415-1420.
[85] F. Rodríguez-Reinoso and M. Molina-Sabio, Activated carbons from
lignocellulosic materials by chemical and/or physical activation: an overview,
Carbon, 30 (1992) 1111-1118.
[86] P. Nowicki, J. Kazmierczak, and R. Pietrzak, Comparison of physicochemical
and sorption properties of activated carbons prepared by physical and chemical
activation of cherry stones, Powder Technology, 269 (2015) 312-319.
[87] M.A. Lillo-Ródenas, D. Cazorla-Amorós, and A. Linares-Solano,
Understanding chemical reactions between carbons and NaOH and KOH: An
insight into the chemical activation mechanism, Carbon, 41 (2003) 267-275.
[88] J.F. Vivo-Vilches, E. Bailón-García, A.F. Pérez-Cadenas, F. Carrasco-Marín,
and F.J. Maldonado-Hódar, Tailoring the surface chemistry and porosity of
activated carbons: Evidence of reorganization and mobility of oxygenated
surface groups, Carbon, 68 (2014) 520-530.
82 Capítulo I
[89] A. Ahmadpour and D.D. Do, The preparation of activated carbon from
macadamia nutshell by chemical activation, Carbon, 35 (1997) 1723-1732.
[90] G.H. Oh and C.R. Park, Preparation and characteristics of rice-straw-based
porous carbons with high adsorption capacity, Fuel, 81 (2002) 327-336.
[91] P.S. Thue, M.A. Adebayo, E.C. Lima, J.M. Sieliechi, F.M. Machado, G.L.
Dotto, J.C.P. Vaghetti, and S.L.P. Dias, Preparation, characterization and
application of microwave-assisted activated carbons from wood chips for
removal of phenol from aqueous solution, Journal of Molecular Liquids, 223
(2016) 1067-1080.
[92] A.R. Mohamed, M. Mohammadi, and G.N. Darzi, Preparation of carbon
molecular sieve from lignocellulosic biomass: A review, Renewable and
Sustainable Energy Reviews, 14 (2010) 1591-1599.
[93] M.G. Plaza, I. Durán, F. Rubiera, and C. Pevida, CO2 adsorbent pellets
produced from pine sawdust: Effect of coal tar pitch addition, Applied Energy,
144 (2015) 182-192.
[94] A. Amaya, N. Medero, N. Tancredi, H. Silva, and C. Deiana, Activated carbon
briquettes from biomass materials, Bioresource Technology, 98 (2007) 1635-
1641.
[95] F. Carrasco-Marin, J. Rivera-Utrilla, J.P. Joly, and C. Moreno-Castilla, Effects
of ageing on the oxygen surface complexes of an oxidized activated carbon,
Journal of the Chemical Society, Faraday Transactions, 92 (1996) 2779-2782.
[96] D. Lozano-Castelló, M.A. Lillo-Ródenas, D. Cazorla-Amorós, and A. Linares-
Solano, Preparation of activated carbons from Spanish anthracite: I. Activation
by KOH, Carbon, 39 (2001) 741-749.

Capítulo I 83
[97] M.A. Lillo-Ródenas, D. Lozano-Castelló, D. Cazorla-Amorós, and A. Linares-
Solano, Preparation of activated carbons from Spanish anthracite: II. Activation
by NaOH, Carbon, 39 (2001) 751-759.
[98] J. McCarthy, An investigation of the design variables for producing activated
carbons from victorian brown coals by reaction with steam, Carbon, 15 (1977)
95-101.
[99] A. Khelifi, M.C. Almazán-Almazán, M. Pérez-Mendoza, M. Domingo-García,
F.J. López-Domingo, L. Temdrara, F.J. López-Garzón, and A. Addoun,
Influence of nitric acid concentration on the characteristics of active carbons
obtained from a mineral coal, Fuel Processing Technology, 91 (2010) 1338-
1344.
[100] R. Mendoza-Carrasco, E.M. Cuerda-Correa, M.F. Alexandre-Franco, C.
Fernández-González, and V. Gómez-Serrano, Preparation of high-quality
activated carbon from polyethyleneterephthalate (PET) bottle waste. Its use in
the removal of pollutants in aqueous solution, Journal of Environmental
Management, 181 (2016) 522-535.
[101] A. Esfandiari, T. Kaghazchi, and M. Soleimani, Preparation and evaluation of
activated carbons obtained by physical activation of polyethyleneterephthalate
(PET) wastes, Journal of the Taiwan Institute of Chemical Engineers, 43 (2012)
631-637.
[102] A.S. Al-Rahbi and P.T. Williams, Production of activated carbons from waste
tyres for low temperature NOx control, Waste Management, 49 (2016) 188-195.
[103] R. Acosta, V. Fierro, A. Martinez de Yuso, D. Nabarlatz, and A. Celzard,
Tetracycline adsorption onto activated carbons produced by KOH activation of
tyre pyrolysis char, Chemosphere, 149 (2016) 168-176.
[104] Y. Li, M.P. Paranthaman, K. Akato, A.K. Naskar, A.M. Levine, R.J. Lee, S.O.
Kim, J. Zhang, S. Dai, and A. Manthiram, Tire-derived carbon composite

84 Capítulo I
anodes for sodium-ion batteries, Journal of Power Sources, 316 (2016) 232-
238.
[105] X. He, N. Zhang, X. Shao, M. Wu, M. Yu, and J. Qiu, A layered-template-
nanospace-confinement strategy for production of corrugated graphene
nanosheets from petroleum pitch for supercapacitors, Chemical Engineering
Journal, 297 (2016) 121-127.
[106] N.G. Asenjo, C. Botas, C. Blanco, R. Santamaría, M. Granda, R. Menéndez, and
P. Alvarez, Synthesis of activated carbons by chemical activation of new
anthracene oil-based pitches and their optimization by response surface
methodology, Fuel Processing Technology, 92 (2011) 1987-1992.
[107] N. Díez, P. Álvarez, R. Santamaría, C. Blanco, R. Menéndez, and M. Granda,
Optimisation of the melt-spinning of anthracene oil-based pitch for isotropic
carbon fibre preparation, Fuel Processing Technology, 93 (2012) 99-104.
[108] M.H. Al-Saleh and U. Sundararaj, A review of vapor grown carbon
nanofiber/polymer conductive composites, Carbon, 47 (2009) 2-22.
[109] F. Paradela, F. Pinto, A.M. Ramos, I. Gulyurtlu, and I. Cabrita, Study of the
slow batch pyrolysis of mixtures of plastics, tyres and forestry biomass wastes,
Journal of Analytical and Applied Pyrolysis, 85 (2009) 392-398.
[110] A. Bazargan and G. McKay, A review Synthesis of carbon nanotubes from
plastic wastes, Chemical Engineering Journal, 195 196 (2012) 377-391.
[111] N.A. Kiselev, J. Sloan, D.N. Zakharov, E.F. Kukovitskii, J.L. Hutchison, J.
Hammer, and A.S. Kotosonov, Carbon nanotubes from polyethylene precursors:
Structure and structural changes caused by thermal and chemical treatment
revealed by HREM, Carbon, 36 (1998) 1149-1157.
[112] C. Moreno-Castilla, M.A. Ferro-García, J.P. Joly, I. Bautista-Toledo, F.
Carrasco-Marín, and J. Rivera-Utrilla, Activated Carbon Surface Modifications

Capítulo I 85
by Nitric Acid, Hydrogen Peroxide, and Ammonium Peroxydisulfate
Treatments, Langmuir, 11 (1995) 4386-4392.
[113] A. Elmouwahidi, J.F. Vivo-Vilches, A.F. Pérez-Cadenas, F.J. Maldonado-
Hódar, and F. Carrasco-Marín, Free metal oxygen-reduction electro-catalysts
obtained from biomass residue of the olive oil industry, Chemical Engineering
Journal, 306 (2016) 1109-1115.
[114] F. Gao, J. Qu, Z. Zhao, Z. Wang, and J. Qiu, Nitrogen-doped activated carbon
derived from prawn shells for high-performance supercapacitors,
Electrochimica Acta, 190 (2016) 1134-1141.
[115] I. Ghouma, M. Jeguirim, S. Dorge, L. Limousy, C. Matei Ghimbeu, and A.
Ouederni, Activated carbon prepared by physical activation of olive stones for
the removal of NO2 at ambient temperature, Comptes Rendus Chimie, 18 (2015)
63-74.
[116] S. Román, J.F. González, C.M. González-García, and F. Zamora, Control of
pore development during CO2 and steam activation of olive stones, Fuel
Processing Technology, 89 (2008) 715-720.
[117] G.G. Stavropoulos and A.A. Zabaniotou, Production and characterization of
activated carbons from olive-seed waste residue, Microporous and Mesoporous
Materials, 82 (2005) 79-85.
[118] R. Ubago-Pérez, F. Carrasco-Marín, D. Fairén-Jiménez, and C. Moreno-
Castilla, Granular and monolithic activated carbons from KOH-activation of
olive stones, Microporous and Mesoporous Materials, 92 (2006) 64-70.
[119] M. Ugurlu, A. Gürses, and M. Açikyildiz, Comparison of textile dyeing effluent
adsorption on commercial activated carbon and activated carbon prepared from
olive stone by ZnCl2 activation, Microporous and Mesoporous Materials, 111
(2008) 228-235.

86 Capítulo I
[120] R. Yavuz, H. Akyildiz, N. Karatepe, and E. Çetinkaya, Influence of preparation
conditions on porous structures of olive stone activated by H3PO4, Fuel
Processing Technology, 91 (2010) 80-87.
[121] H. Demiral, Î. Demiral, B. Karabacakoglu, and F. Tümsek, Production of
activated carbon from olive bagasse by physical activation, Chemical
Engineering Research and Design, 89 (2011) 206-213.
[122] A. Heidari, H. Younesi, A. Rashidi, and A.A. Ghoreyshi, Evaluation of CO2
adsorption with eucalyptus wood based activated carbon modified by ammonia
solution through heat treatment, Chemical Engineering Journal, 254 (2014)
503-513.
[123] S. Bashkova and T.J. Bandosz, The effects of urea modification and heat
treatment on the process of NO2 removal by wood-based activated carbon,
Journal of Colloid and Interface Science, 333 (2009) 97-103.
[124] A.J. Romero-Anaya, M.A. Lillo-Ródenas, C. Salinas-Martínez de Lecea, and A.
Linares-Solano, Hydrothermal and conventional H3PO4 activation of two
natural bio-fibers, Carbon, 50 (2012) 3158-3169.
[125] C.A. Cardona and Ó.J. Sánchez, Fuel ethanol production: Process design trends
and integration opportunities, Bioresource Technology, 98 (2007) 2415-2457.
[126] R. Borja, 2.55 - Biogas Production, in: Comprehensive Biotechnology (Second
Edition), Academic Press, Burlington, 2011, pp. 785-798.
[127] A.J. Ward, P.J. Hobbs, P.J. Holliman, and D.L. Jones, Optimisation of the
anaerobic digestion of agricultural resources, Bioresource Technology, 99
(2008) 7928-7940.
[128] I. García-Maroto, A. García-Maraver, F. Muñoz-Leiva, and M. Zamorano,
Consumer knowledge, information sources used and predisposition towards the

Capítulo I 87
adoption of wood pellets in domestic heating systems, Renewable and
Sustainable Energy Reviews, 43 (2015) 207-215.
[129] H. Thomson and C. Liddell, The suitability of wood pellet heating for domestic
households: A review of literature, Renewable and Sustainable Energy Reviews,
42 (2015) 1362-1369.
[130] European Council, Council Decision of 10 December 2010 on State aid to
facilitate the closure of uncompetitive coal mines, Official Journal of the
European Union, 336 (2010) 24-29.
[131] J.E. Zafrilla, The mining industry under the thumb of politicians: the
environmental consequences of the Spanish Coal Decree, Journal of Cleaner
Production, 84 (2014) 715-722.
[132] M. Nadal, J. Rovira, J. Díaz-Ferrero, M. Schuhmacher, and J.L. Domingo,
Human exposure to environmental pollutants after a tire landfill fire in Spain:
Health risks, Environment International, 97 (2016) 37-44.
[133] T. Shim, J. Yoo, C. Ryu, Y.K. Park, and J. Jung, Effect of steam activation of
biochar produced from a giant Miscanthus on copper sorption and toxicity,
Bioresource Technology, 197 (2015) 85-90.
[134] J. Alvarez, G. Lopez, M. Amutio, J. Bilbao, and M. Olazar, Preparation of
adsorbents from sewage sludge pyrolytic char by carbon dioxide activation,
Process Safety and Environmental Protection, 103, Part A (2016) 76-86.
[135] X. Gao, Y. Zhang, B. Li, Y. Zhao, and B. Jiang, Determination of the intrinsic
reactivities for carbon dioxide gasification of rice husk chars through using
random pore model, Bioresource Technology, 218 (2016) 1073-1081.
[136] M.L. Sekirifa, M. Hadj-Mahammed, S. Pallier, L. Baameur, D. Richard, and
A.H. Al-Dujaili, Preparation and characterization of an activated carbon from a

88 Capítulo I
date stones variety by physical activation with carbon dioxide, Journal of
Analytical and Applied Pyrolysis, 99 (2013) 155-160.
[137] M. Molina-Sabio and F. Rodríguez-Reinoso, Role of chemical activation in the
development of carbon porosity, Colloids and Surfaces A: Physicochemical and
Engineering Aspects, 241 (2004) 15-25.
[138] F. Caturla, M. Molina-Sabio, and F. Rodríguez-Reinoso, Preparation of
activated carbon by chemical activation with ZnCl2, Carbon, 29 (1991) 999-
1007.
[139] G.O. El-Sayed, M.M. Yehia, and A.A. Asaad, Assessment of activated carbon
prepared from corncob by chemical activation with phosphoric acid, Water
Resources and Industry, 7 8 (2014) 66-75.
[140] A. Kumar and H. Mohan Jena, High surface area microporous activated carbons
prepared from Fox nut (Euryale ferox) shell by zinc chloride activation, Applied
Surface Science, 356 (2015) 753-761.
[141] J. Laine and A. Calafat, Factors affecting the preparation of activated carbons
from coconut shell catalized by potassium, Carbon, 29 (1991) 949-953.
[142] R.A. Fiuza-Jr, R.C. Andrade, and H.M.C. Andrade, CO2 capture on KOH-
activated carbons derived from yellow mombin fruit stones, Journal of
Environmental Chemical Engineering, 4 (2016) 4229-4236.
[143] J. Fiuza, R. Medeiros de Jesus Neto, L.B. Correia, and H.M. Carvalho Andrade,
Preparation of granular activated carbons from yellow mombin fruit stones for
CO2 adsorption, Journal of Environmental Management, 161 (2015) 198-205.
[144] P.E. Fanning and M.A. Vannice, A DRIFTS study of the formation of surface
groups on carbon by oxidation, Carbon, 31 (1993) 721-730.

Capítulo I 89
[145] J.L. Figueiredo, M.F.R. Pereira, M.M.A. Freitas, and J.J.M. Órfão, Modification
of the surface chemistry of activated carbons, Carbon, 37 (1999) 1379-1389.
[146] C. Moreno-Castilla, M.V. López-Ramón, and F. Carrasco-Marín, Changes in
surface chemistry of activated carbons by wet oxidation, Carbon, 38 (2000)
1995-2001.
[147] G. de la Puente, J.J. Pis, J.A. Menéndez, and P. Grange, Thermal stability of
oxygenated functions in activated carbons, Journal of Analytical and Applied
Pyrolysis, 43 (1997) 125-138.
[148] A.B. Dongil, B. Bachiller-Baeza, A. Guerrero-Ruiz, I. Rodríguez-Ramos, A.
Martínez-Alonso, and J.M.D. Tascón, Surface chemical modifications induced
on high surface area graphite and carbon nanofibers using different oxidation
and functionalization treatments, Journal of Colloid and Interface Science, 355
(2011) 179-189.
[149] E. Papirer, R. Lacroix, and J.B. Donnet, Chemical modifications and surface
properties of carbon blacks, Carbon, 34 (1996) 1521-1529.
[150] M. Keramati and A.A. Ghoreyshi, Improving CO2 adsorption onto activated
carbon through functionalization by chitosan and triethylenetetramine, Physica
E: Low-dimensional Systems and Nanostructures, 57 (2014) 161-168.
[151] A. Kongnoo, P. Intharapat, P. Worathanakul, and C. Phalakornkule,
Diethanolamine impregnated palm shell activated carbon for CO2 adsorption at
elevated temperatures, Journal of Environmental Chemical Engineering, 4
(2016) 73-81.
[152] W. Feng, E. Borguet, and R.D. Vidic, Sulfurization of carbon surface for vapor
phase mercury removal I: Effect of temperature and sulfurization protocol,
Carbon, 44 (2006) 2990-2997.

90 Capítulo I
[153] A. Fouladi Tajar, T. Kaghazchi, and M. Soleimani, Adsorption of cadmium
from aqueous solutions on sulfurized activated carbon prepared from nut shells,
Journal of Hazardous Materials, 165 (2009) 1159-1164.
[154] J.M. Rosas, R. Ruiz-Rosas, J. Rodríguez-Mirasol, and T. Cordero, Kinetic study
of the oxidation resistance of phosphorus-containing activated carbons, Carbon,
50 (2012) 1523-1537.
[155] R. Berenguer, R. Ruiz-Rosas, A. Gallardo, D. Cazorla-Amorós, E. Morallón, H.
Nishihara, T. Kyotani, J. Rodríguez-Mirasol, and T. Cordero, Enhanced electro-
oxidation resistance of carbon electrodes induced by phosphorus surface groups,
Carbon, 95 (2015) 681-689.
[156] A.F. Pérez-Cadenas, F.J. Maldonado-Hódar, and C. Moreno-Castilla, On the
nature of surface acid sites of chlorinated activated carbons, Carbon, 41 (2003)
473-478.
[157] J.A.F. MacDonald, M.J.B. Evans, S. Liang, S.E. Meech, P.R. Norman, and L.
Pears, Chlorine and oxygen on the carbon surface, Carbon, 38 (2000) 1825-
1830.
[158] S. Cho, H.R. Yu, K.D. Kim, K.B. Yi, and Y.S. Lee, Surface characteristics and
carbon dioxide capture characteristics of oxyfluorinated carbon molecular
sieves, Chemical Engineering Journal, 211 212 (2012) 89-96.
[159] H.R. Yu, S. Cho, B.C. Bai, K.B. Yi, and Y.S. Lee, Effects of fluorination on
carbon molecular sieves for CH4/CO2 gas separation behavior, International
Journal of Greenhouse Gas Control, 10 (2012) 278-284.
[160] A. Jafari, M. Ghoranneviss, and A. Salar Elahi, Growth and characterization of
boron doped graphene by Hot Filament Chemical Vapor Deposition Technique
(HFCVD), Journal of Crystal Growth, 438 (2016) 70-75.

Capítulo I 91
[161] C. Moreno-Castilla, A.F. Pérez-Cadenas, F.J. Maldonado-Hódar, F. Carrasco-
Marín, and J.L. Fierro, Influence of carbon oxygen surface complexes on the
surface acidity of tungsten oxide catalysts supported on activated carbons,
Carbon, 41 (2003) 1157-1167.
[162] Z. Zapata-Benabithe, F. Carrasco-Marín, and C. Moreno-Castilla, Preparation,
surface characteristics, and electrochemical double-layer capacitance of KOH-
activated carbon aerogels and their O- and N-doped derivatives, Journal of
Power Sources, 219 (2012) 80-88.
[163] F. Carrasco-Marín, A. Mueden, A. Centeno, F. Stoeckli, and C. Moreno-
Castilla, Water adsorption on activated carbons with different degrees of
oxidation, Journal of the Chemical Society, Faraday Transactions, 93 (1997)
2211-2215.
[164] A.J. Romero-Anaya, M.A. Lillo-Ródenas, and A. Linares-Solano, Factors
governing the adsorption of ethanol on spherical activated carbons, Carbon, 83
(2015) 240-249.
[165] S. Furmaniak, P. Kowalczyk, A.P. Terzyk, P.A. Gauden, and P.J.F. Harris,
Synergetic effect of carbon nanopore size and surface oxidation on CO2 capture
from CO2/CH4 mixtures, Journal of Colloid and Interface Science, 397 (2013)
144-153.
[166] D.B. Mawhinney and J.T. Yates Jr, FTIR study of the oxidation of amorphous
carbon by ozone at 300 K - Direct COOH formation, Carbon, 39 (2001) 1167-
1173.
[167] Z.B. Wang, G.P. Yin, and P.F. Shi, Effects of ozone treatment of carbon support
on Pt Ru/C catalysts performance for direct methanol fuel cell, Carbon, 44
(2006) 133-140.

92 Capítulo I
[168] Y. Otake and R.G. Jenkins, Characterization of oxygen-containing surface
complexes created on a microporous carbon by air and nitric acid treatment,
Carbon, 31 (1993) 109-121.
[169] J.H. Zhou, Z.J. Sui, J. Zhu, P. Li, D. Chen, Y.C. Dai, and W.K. Yuan,
Characterization of surface oxygen complexes on carbon nanofibers by TPD,
XPS and FT-IR, Carbon, 45 (2007) 785-796.
[170] B. Marchon, J. Carrazza, H. Heinemann, and G.A. Somorjai, TPD and XPS
studies of O2, CO2, and H2O adsorption on clean polycrystalline graphite,
Carbon, 26 (1988) 507-514.
[171] A.M.T. Silva, B.F. Machado, J.L. Figueiredo, and J.L. Faria, Controlling the
surface chemistry of carbon xerogels using HNO3-hydrothermal oxidation,
Carbon, 47 (2009) 1670-1679.
[172] N. Mahata, M.F.R. Pereira, F. Suárez-García, A. Martínez-Alonso, J.M.D.
Tascón, and J.L. Figueiredo, Tuning of texture and surface chemistry of carbon
xerogels, Journal of Colloid and Interface Science, 324 (2008) 150-155.
[173] V. Gómez-Serrano, M. Acedo-Ramos, A.J. López-Peinado, and C. Valenzuela-
Calahorro, Oxidation of activated carbon by hydrogen peroxide. Study of
surface functional groups by FT-i.r, Fuel, 73 (1994) 387-395.
[174] G. Sun, L. Ma, J. Ran, B. Li, X. Shen, and H. Tong, Templated synthesis and
activation of highly nitrogen-doped worm-like carbon composites based on
melamine-urea-formaldehyde resins for high performance supercapacitors,
Electrochimica Acta, 194 (2016) 168-178.
[175] H. Peng, G. Ma, K. Sun, Z. Zhang, Q. Yang, and Z. Lei, Nitrogen-doped
interconnected carbon nanosheets from pomelo mesocarps for high performance
supercapacitors, Electrochimica Acta, 190 (2016) 862-871.

Capítulo I 93
[176] J. Liu, B.V. Cunning, T. Daio, A. Mufundirwa, K. Sasaki, and S.M. Lyth,
Nitrogen-Doped Carbon Foam as a Highly Durable Metal-Free Electrocatalyst
for the Oxygen Reduction Reaction in Alkaline Solution, Electrochimica Acta,
220 (2016) 554-561.
[177] H. Huang, X. Wei, and S. Gao, Nitrogen-Doped Porous Carbon Derived from
Malachium Aquaticum Biomass as a Highly Efficient Electrocatalyst for
Oxygen Reduction Reaction, Electrochimica Acta, 220 (2016) 427-435.
[178] R. Nie, X. Bo, C. Luhana, A. Nsabimana, and L. Guo, Simultaneous formation
of nitrogen and sulfur-doped carbon nanotubes-mesoporous carbon and its
electrocatalytic activity for oxygen reduction reaction, International Journal of
Hydrogen Energy, 39 (2014) 12597-12603.
[179] R.L. Tseng, F.C. Wu, and R.S. Juang, Adsorption of CO2 at atmospheric
pressure on activated carbons prepared from melamine-modified
phenol formaldehyde resins, Separation and Purification Technology, 140
(2015) 53-60.
[180] M. Pérez-Cadenas, C. Moreno-Castilla, F. Carrasco-Marín, and A.F. Pérez-
Cadenas, Surface Chemistry, Porous Texture, and Morphology of N-Doped
Carbon Xerogels, Langmuir, 25 (2009) 466-470.
[181] Y. El-Sayed and T.J. Bandosz, Acetaldehyde Adsorption on Nitrogen-
Containing Activated Carbons, Langmuir, 18 (2002) 3213-3218.
[182] A. Swiderska-Mocek and E. Rudnicka, Lithium sulphur battery with activated
carbon cloth-sulphur cathode and ionic liquid as electrolyte, Journal of Power
Sources, 273 (2015) 162-167.
[183] Z. Yang, Z. Yao, G. Li, G. Fang, H. Nie, Z. Liu, X. Zhou, X. Chen, and S.
Huang, Sulfur-Doped Graphene as an Efficient Metal-free Cathode Catalyst for
Oxygen Reduction, ACS Nano, 6 (2012) 205-211.

94 Capítulo I
[184] P. Hadi, M.H. To, C.W. Hui, C.S.K. Lin, and G. McKay, Aqueous mercury
adsorption by activated carbons, Water Research, 73 (2015) 37-55.
[185] A. Macías-García, C. Valenzuela-Calahorro, A. Espinosa-Mansilla, A. Bernalte-
García, and V. Gómez-Serrano, Adsorption of Pb2+ in aqueous solution by
SO2-treated activated carbon, Carbon, 42 (2004) 1755-1764.
[186] M.M. Bruno, N.G. Cotella, M.C. Miras, T. Koch, S. Seidler, and C. Barbero,
Characterization of monolithic porous carbon prepared from
resorcinol/formaldehyde gels with cationic surfactant, Colloids and Surfaces A:
Physicochemical and Engineering Aspects, 358 (2010) 13-20.
[187] J. Xu, A. Wang, and T. Zhang, A two-step synthesis of ordered mesoporous
resorcinol formaldehyde polymer and carbon, Carbon, 50 (2012) 1807-1816.
[188] N. Rey-Raap, S. Rodríguez-Sánchez, I.D. Alonso-Buenaposada, E.G. Calvo,
J.A. Menéndez, and A. Arenillas, The enhancement of porosity of carbon
xerogels by using additives, Microporous and Mesoporous Materials, 217
(2015) 39-45.
[189] V.M. Gun'ko, V.M. Bogatyrov, O.I. Oranska, I.V. Urubkov, R. Leboda, B.
Charmas, and J. Skubiszewska-Zieba, Synthesis and characterization of
resorcinol formaldehyde resin chars doped by zinc oxide, Applied Surface
Science, 303 (2014) 263-271.
[190] Y. Kong, Y. Zhong, X. Shen, S. Cui, M. Yang, K. Teng, and J. Zhang, Facile
synthesis of resorcinol formaldehyde/silica composite aerogels and their
transformation to monolithic carbon/silica and carbon/silicon carbide composite
aerogels, Journal of Non-Crystalline Solids, 358 (2012) 3150-3155.
[191] E. Bailón-García, A. Elmouwahidi, M.A. Álvarez, F. Carrasco-Marín, A.F.
Pérez-Cadenas, and F.J. Maldonado-Hódar, New carbon xerogel-TiO2
composites with high performance as visible-light photocatalysts for dye
mineralization, Applied Catalysis B: Environmental, 201 (2017) 29-40.

Capítulo I 95
[192] J. Lee, J. Kim, and T. Hyeon, Recent Progress in the Synthesis of Porous
Carbon Materials, Advanced Materials, 18 (2006) 2073-2094.
[193] H. Tamon, H. Ishizaka, T. Yamamoto, and T. Suzuki, Influence of freeze-drying
conditions on the mesoporosity of organic gels as carbon precursors, Carbon, 38
(2000) 1099-1105.
[194] T.F. Baumann, M.A. Worsley, T.Y.-J. Han, and J. Satcher, High surface area
carbon aerogel monoliths with hierarchical porosity, Journal of Non-Crystalline
Solids, 354 (2008) 3513-3515.
[195] Y.M. Chang, C.Y. Wu, and P.W. Wu, Synthesis of large surface area carbon
xerogels for electrochemical double layer capacitors, Journal of Power Sources,
223 (2013) 147-154.
[196] T. Tsuchiya, T. Mori, S. Iwamura, I. Ogino, and S.R. Mukai, Binderfree
synthesis of high-surface-area carbon electrodes via CO2 activation of
resorcinol formaldehyde carbon xerogel disks: Analysis of activation process,
Carbon, 76 (2014) 240-249.
[197] R.S. Ribeiro, N.A. Fathy, A.A. Attia, A.M.T. Silva, J.L. Faria, and H.T. Gomes,
Activated carbon xerogels for the removal of the anionic azo dyes Orange II and
Chromotrope 2R by adsorption and catalytic wet peroxide oxidation, Chemical
Engineering Journal, 195 Çô196 (2012) 112-121.
[198] M.S. Contreras, C.A. Páez, L. Zubizarreta, A. Léonard, S. Blacher, C.G.
Olivera-Fuentes, A. Arenillas, J.P. Pirard, and N. Job, A comparison of physical
activation of carbon xerogels with carbon dioxide with chemical activation
using hydroxides, Carbon, 48 (2010) 3157-3168.
[199] N.A. Fathy, M.S. Rizk, and R.M.S. Awad, Pore structure and adsorption
properties of carbon xerogels derived from carbonization of tannic acid-
resorcinol-formaldehyde resin, Journal of Analytical and Applied Pyrolysis, 119
(2016) 60-68.

96 Capítulo I
[200] P. Veselá, V. Slovák, T. Zelenka, M. Kostejn, and M. Mucha, The influence of
pyrolytic temperature on sorption ability of carbon xerogel based on 3-
aminophenol-formaldehyde polymer for Cu(II) ions and phenol, Journal of
Analytical and Applied Pyrolysis, 121 (2016) 29-40.
[201] R.A. Catalao, F.J. Maldonado-Hódar, A. Fernandes, C. Henriques, and M.F.
Ribeiro, Reduction of NO with metal-doped carbon aerogels, Applied Catalysis
B: Environmental, 88 (2009) 135-141.
[202] S.C. Rodrigues, R. Whitley, and A. Mendes, Preparation and characterization of
carbon molecular sieve membranes based on resorcinol formaldehyde resin,
Journal of Membrane Science, 459 (2014) 207-216.
[203] E.G. Calvo, N. Ferrera-Lorenzo, J.A. Menéndez, and A. Arenillas, Microwave
synthesis of micro-mesoporous activated carbon xerogels for high performance
supercapacitors, Microporous and Mesoporous Materials, 168 (2013) 206-212.
[204] G.K. Eleftheriadis, M. Filippousi, V. Tsachouridou, M.A. Darda, L. Sygellou, I.
Kontopoulou, N. Bouropoulos, T. Steriotis, G. Charalambopoulou, I.S.
Vizirianakis, G. Van Tendeloo, and D.G. Fatouros, Evaluation of mesoporous
carbon aerogels as carriers of the non-steroidal anti-inflammatory drug
ibuprofen, International Journal of Pharmaceutics, 515 (2016) 262-270.
[205] A. Feaver and G. Cao, Activated carbon cryogels for low pressure methane
storage, Carbon, 44 (2006) 590-593.
[206] H. Jirglová, A.F. Pérez-Cadenas, and F.J. Maldonado-Hódar, Synthesis and
Properties of Phloroglucinol Phenol Formaldehyde Carbon Aerogels and
Xerogels, Langmuir, 25 (2009) 2461-2466.
[207] B.B. García, D. Liu, S. Sepehri, S. Candelaria, D.M. Beckham, L.W. Savage,
and G. Cao, Hexamethylenetetramine multiple catalysis as a porosity and pore
size modifier in carbon cryogels, Journal of Non-Crystalline Solids, 356 (2010)
1620-1625.

Capítulo I 97
[208] N. Rey-Raap, J. Angel Menéndez, and A. Arenillas, RF xerogels with tailored
porosity over the entire nanoscale, Microporous and Mesoporous Materials,
195 (2014) 266-275.
[209] N. Rey-Raap, J. Angel Menéndez, and A. Arenillas, Simultaneous adjustment of
the main chemical variables to fine-tune the porosity of carbon xerogels,
Carbon, 78 (2014) 490-499.
[210] F. Awadallah and S.A. Al-Muhtaseb, Nanofeatures of resorcinol formaldehyde
carbon microspheres, Materials Letters, 87 (2012) 31-34.
[211] Z. Zapata-Benabithe, J. de Vicente, F. Carrasco-Marín, and C. Moreno-Castilla,
Synthesis, surface characteristics, and electrochemical capacitance of Cu-doped
carbon xerogel microspheres, Carbon, 55 (2013) 260-268.
[212] C. Moreno-Castilla, Colloidal and micro-carbon spheres derived from low-
temperature polymerization reactions, Advances in Colloid and Interface
Science, 236 (2016) 113-141.
[213] N. Rey-Raap, A. Szczurek, V. Fierro, J.A. Menéndez, A. Arenillas, and A.
Celzard, Towards a feasible and scalable production of bio-xerogels, Journal of
Colloid and Interface Science, 456 (2015) 138-144.
[214] N. Rey-Raap, A. Szczurek, V. Fierro, A. Celzard, J.A. Menéndez, and A.
Arenillas, Advances in tailoring the porosity of tannin-based carbon xerogels,
Industrial Crops and Products, 82 (2016) 100-106.
[215] F. Carrasco-Marín, D. Fairén-Jiménez, and C. Moreno-Castilla, Carbon aerogels
from gallic acid resorcinol mixtures as adsorbents of benzene, toluene and
xylenes from dry and wet air under dynamic conditions, Carbon, 47 (2009) 463-
469.
[216] D.W. Schaefer, R. Pekala, and G. Beaucage, Origin of porosity in resorcinol-
formaldehyde aerogels, Journal of Non-Crystalline Solids, 186 (1995) 159-167.

98 Capítulo I
[217] A. Martínez de Yuso, M.T. Izquierdo, R. Valenciano, and B. Rubio, Toluene
and n-hexane adsorption and recovery behavior on activated carbons derived
from almond shell wastes, Fuel Processing Technology, 110 (2013) 1-7.
[218] S. Morales-Torres, A.F. Pérez-Cadenas, F. Kapteijn, F. Carrasco-Marín, F.J.
Maldonado-Hódar, and J.A. Moulijn, Palladium and platinum catalysts
supported on carbon nanofiber coated monoliths for low-temperature
combustion of BTX, Applied Catalysis B: Environmental, 89 (2009) 411-419.
[219] M.M. Abdel daiem, J. Rivera-Utrilla, M. Sánchez-Polo, and R. Ocampo-Pérez,
Single, competitive, and dynamic adsorption on activated carbon of compounds
used as plasticizers and herbicides, Science of The Total Environment, 537
(2015) 335-342.
[220] I. Levchuk, A. Bhatnagar, and M. Sillanpää, Overview of technologies for
removal of methyl tert-butyl ether (MTBE) from water, Science of The Total
Environment, 476 477 (2014) 415-433.
[221] A.M. Redding and F.S. Cannon, The role of mesopores in MTBE removal with
granular activated carbon, Water Research, 56 (2014) 214-224.
[222] G. Mellios and Z. Samaras, An empirical model for estimating evaporative
hydrocarbon emissions from canister-equipped vehicles, Fuel, 86 (2007) 2254-
2261.
[223] J. Wang, L. Jin, J. Gao, J. Shi, Y. Zhao, S. Liu, T. Jin, Z. Bai, and C.Y. Wu,
Investigation of speciated VOC in gasoline vehicular exhaust under ECE and
EUDC test cycles, Science of The Total Environment, 445 446 (2013) 110-116.
[224] H. Yamada, Contribution of evaporative emissions from gasoline vehicles
toward total VOC emissions in Japan, Science of The Total Environment, 449
(2013) 143-149.

Capítulo I 99
[225] J.Y. Chin and S.A. Batterman, VOC composition of current motor vehicle fuels
and vapors, and collinearity analyses for receptor modeling, Chemosphere, 86
(2012) 951-958.
[226] R.K. Niven, Ethanol in gasoline: environmental impacts and sustainability
review article, Renewable and Sustainable Energy Reviews, 9 (2005) 535-555.
[227] M. Winther, F. Müller, and T.C. Jensen, Emission consequences of introducing
bio ethanol as a fuel for gasoline cars, Atmospheric Environment, 55 (2012)
144-153.
[228] J.E. Anderson, D.M. DiCicco, J.M. Ginder, U. Kramer, T.G. Leone, H.E.
Raney-Pablo, and T.J. Wallington, High octane number ethanol gasoline
blends: Quantifying the potential benefits in the United States, Fuel, 97 (2012)
585-594.
[229] T.M. Foong, K.J. Morganti, M.J. Brear, G. da Silva, Y. Yang, and F.L. Dryer,
The octane numbers of ethanol blended with gasoline and its surrogates, Fuel,
115 (2014) 727-739.
[230] L.A. Graham, S.L. Belisle, and C.L. Baas, Emissions from light duty gasoline
vehicles operating on low blend ethanol gasoline and E85, Atmospheric
Environment, 42 (2008) 4498-4516.
[231] R. Magnusson and C. Nilsson, The influence of oxygenated fuels on emissions
of aldehydes and ketones from a two-stroke spark ignition engine, Fuel, 90
(2011) 1145-1154.
[232] M.B. Gramajo de Doz, C.M. Bonatti, and H.N. Sólimo, Water Tolerance and
Ethanol Concentration in Ethanol-Gasoline Fuels at Three Temperatures,
Energy Fuels, 18 (2003) 334-337.
[233] J.F. Vivo-Vilches, A.F. Pérez-Cadenas, F. Carrasco-Marín, and F.J. Maldonado-
Hódar, About the control of VOCs emissions from blended fuels by developing

100 Capítulo I
specific adsorbents using agricultural residues, Journal of Environmental
Chemical Engineering, 3 (2015) 2662-2669.
[234] K. Uddin, I.I. El-Sharkawy, T. Miyazaki, B.B. Saha, S. Koyama, H.S. Kil, J.
Miyawaki, and S.H. Yoon, Adsorption characteristics of ethanol onto functional
activated carbons with controlled oxygen content, Applied Thermal
Engineering, 72 (2014) 211-218.
[235] L.M. Vane, Separation technologies for the recovery and dehydration of
alcohols from fermentation broths, Biofuels, Bioproducts & Biorefining, 2
(2008) 553-588.
[236] A. Khazraei Vizhemehr, F. Haghighat, and C.S. Lee, Gas-phase filters
breakthrough models at low concentration - Effect of relative humidity,
Building and Environment, 75 (2014) 1-10.
[237] A.M. Slasli, M. Jorge, F. Stoeckli, and N.A. Seaton, Modelling of water
adsorption by activated carbons: effects of microporous structure and oxygen
content, Carbon, 42 (2004) 1947-1952.
[238] X. Su, G. Wang, X. Bai, W. Wu, L. Xiao, Y. Fang, and J. Zhang, Synthesis of
nanosized HZSM-5 zeolites isomorphously substituted by gallium and their
catalytic performance in the aromatization, Chemical Engineering Journal, 293
(2016) 365-375.
[239] A.G. Popov, V.S. Pavlov, and I.I. Ivanova, Effect of crystal size on butenes
oligomerization over MFI catalysts, Journal of Catalysis, 335 (2016) 155-164.
[240] Y. Jiao, S. Li, B. Liu, Y. Du, J. Wang, J. Lu, and Y. Chen, Catalytic cracking of
RP-3 jet fuel over wall-coated Pt/ZrxTi0.9 xAl0.1O2 mixed oxides catalysts,
Applied Thermal Engineering, 91 (2015) 417-425.
Capítulo I 101
[241] J.A.C. Silva and A.E. Rodrigues, Separation of n/iso-paraffins mixtures by
pressure swing adsorption, Separation and Purification Technology, 13 (1998)
195-208.
[242] L.I. Devriese, J.A. Martens, J.W. Thybaut, G.B. Marin, G.V. Baron, and J.F.M.
Denayer, A new methodology to probe Shape Selectivity in Porous Adsorbents,
Microporous and Mesoporous Materials, 116 (2008) 607-613.
[243] J.F. Denayer, W. Souverijns, P.A. Jacobs, J.A. Martens, and G.V. Baron, High-
Temperature Low-Pressure Adsorption of Branched C5 C8 Alkanes on Zeolite
Beta, ZSM-5, ZSM-22, Zeolite Y, and Mordenite, Journal of Physical
Chemistry B, 102 (1998) 4588-4597.
[244] A.F.P. Ferreira, M.C. Mittelmeijer-Hazeleger, M.A. Granato, V.F.D. Martins,
A.E. Rodrigues, and G. Rothenberg, Sieving di-branched from mono-branched
and linear alkanes using ZIF-8: experimental proof and theoretical explanation,
Physical Chemistry Chemical Physics, 15 (2013) 8795-8804.
[245] A.F.P. Ferreira, M.C. Mittelmeijer-Hazeleger, J. Bergh, S. Aguado, J.C. Jansen,
G. Rothenberg, A.E. Rodrigues, and F. Kapteijn, Adsorption of hexane isomers
on MFI type zeolites at ambient temperature: Understanding the aluminium
content effect, Microporous and Mesoporous Materials, 170 (2013) 26-35.
[246] J.H. Cavka, S. Jakobsen, U. Olsbye, N. Guillou, C. Lamberti, S. Bordiga, and
K.P. Lillerud, A New Zirconium Inorganic Building Brick Forming Metal
Organic Frameworks with Exceptional Stability, Journal of the American
Chemical Society, 130 (2008) 13850-13851.
[247] P.A.P. Mendes, F. Ragon, A.E. Rodrigues, P. Horcajada, C. Serre, and J.A.C.
Silva, Hexane isomers sorption on a functionalized metal organic framework,
Microporous and Mesoporous Materials, 170 (2013) 251-258.
[248] K. Bernat, A. Cydzik-Kwiatkowska, I. Wojnowska-Bary+éa, and M.
Karczewska, Physicochemical properties and biogas productivity of aerobic
102 Capítulo I
granular sludge and activated sludge, Biochemical Engineering Journal, 117,
Part B (2017) 43-51.
[249] S.E. Hosseini and M.A. Wahid, Utilization of biogas released from palm oil mill
effluent for power generation using self-preheated reactor, Energy Conversion
and Management, 105 (2015) 957-966.
[250] M. Balat and H. Balat, Biogas as a Renewable Energy Source A Review,
Energy Sources, Part A: Recovery, Utilization, and Environmental Effects, 31
(2009) 1280-1293.
[251] A. Velazquez Abad, T. Cherrett, and P. Holdsworth, Waste-to-fuel opportunities
for British quick service restaurants: A case study, Resources, Conservation and
Recycling, 104, Part A (2015) 239-253.
[252] F. Bauer, T. Persson, C. Hulteberg, and D. Tamm, Biogas upgrading
technology overview, comparison and perspectives for the future, Biofuels,
Bioproducts & Biorefining, 7 (2013) 499-511.
[253] A. Cabrera-Codony, A. Georgi, R. Gonzalez-Olmos, H. Valdés, and M.J.
Martín, Zeolites as recyclable adsorbents/catalysts for biogas upgrading:
Removal of octamethylcyclotetrasiloxane, Chemical Engineering Journal, 307
(2017) 820-827.
[254] L. Sigot, M. Fontseré Obis, H. Benbelkacem, P. Germain, and G. Ducom,
Comparing the performance of a 13X zeolite and an impregnated activated
carbon for H2S removal from biogas to fuel an SOFC: Influence of water,
International Journal of Hydrogen Energy, 41 (2016) 18533-18541.
[255] R. Augelletti, M. Conti, and M.C. Annesini, Pressure swing adsorption for
biogas upgrading. A new process configuration for the separation of biomethane
and carbon dioxide, Journal of Cleaner Production, 140, Part 3 (2017) 1390-
1398.

Capítulo I 103
[256] S. Cavenati, C.A. Grande, and A.E. Rodrigues, Adsorption Equilibrium of
Methane, Carbon Dioxide, and Nitrogen on Zeolite 13X at High Pressures,
Journal of Chemical Engineering Data, 49 (2004) 1095-1101.
[257] Z. Bacsik, O. Cheung, P. Vasiliev, and N. Hedin, Selective separation of CO2
and CH4 for biogas upgrading on zeolite NaKA and SAPO-56, Applied Energy,
162 (2016) 613-621.
[258] M.J. Regufe, J. Tamajon, A.M. Ribeiro, A. Ferreira, U.H. Lee, Y.K. Hwang,
J.S. Chang, C. Serre, J.M. Loureiro, and A.E. Rodrigues, Syngas Purification by
Porous Amino-Functionalized Titanium Terephthalate MIL-125, Energy Fuels,
29 (2015) 4654-4664.
[259] Y. Liu, H. Li, G. Wei, H. Zhang, X. Li, and Y. Jia, Mass transfer performance
of CO2 absorption by alkanolamine aqueous solution for biogas purification,
Separation and Purification Technology, 133 (2014) 476-483.
[260] M.V. Gil, N. Álvarez-Gutiérrez, M. Martínez, F. Rubiera, C. Pevida, and A.
Morán, Carbon adsorbents for CO2 capture from bio-hydrogen and biogas
streams: Breakthrough adsorption study, Chemical Engineering Journal, 269
(2015) 148-158.
[261] M.C. Campo, A.M. Ribeiro, A.F.P. Ferreira, J.C. Santos, C. Lutz, J.M.
Loureiro, and A.E. Rodrigues, Carbon dioxide removal for methane upgrade by
a VSA process using an improved 13X zeolite, Fuel Processing Technology,
143 (2016) 185-194.
[262] A.M.I. Yousef, Y.A. Eldrainy, W.M. El-Maghlany, and A. Attia, Upgrading
biogas by a low-temperature CO2 removal technique, Alexandria Engineering
Journal, 55 (2016) 1143-1150.
[263] G. De Guido, S. Langè, and L.A. Pellegrini, Refrigeration cycles in low-
temperature distillation processes for the purification of natural gas, Journal of
Natural Gas Science and Engineering, 27, Part 2 (2015) 887-900.

104 Capítulo I
[264] E. Favre, R. Bounaceur, and D. Roizard, Biogas, membranes and carbon dioxide
capture, Journal of Membrane Science, 328 (2009) 11-14.
[265] A. Molino, M. Migliori, Y. Ding, B. Bikson, G. Giordano, and G. Braccio,
Biogas upgrading via membrane process: Modelling of pilot plant scale and the
end uses for the grid injection, Fuel, 107 (2013) 585-592.
[266] A. Makaruk, M. Miltner, and M. Harasek, Membrane biogas upgrading
processes for the production of natural gas substitute, Separation and
Purification Technology, 74 (2010) 83-92.
[267] Y.J. Kim, Y.S. Nam, and Y.T. Kang, Study on a numerical model and PSA
(pressure swing adsorption) process experiment for CH4/CO2 separation from
biogas, Energy, 91 (2015) 732-741.
[268] L. Yang, X. Ge, C. Wan, F. Yu, and Y. Li, Progress and perspectives in
converting biogas to transportation fuels, Renewable and Sustainable Energy
Reviews, 40 (2014) 1133-1152.
[269] P. Serra-Crespo, R. Berger, W. Yang, J. Gascon, and F. Kapteijn, Separation of
CO2/CH4 mixtures over NH2-MIL-53 An experimental and modelling study,
Chemical Engineering Science, 124 (2015) 96-108.
[270] A.F.P. Ferreira, A.M. Ribeiro, S. Kulaç, and A.E. Rodrigues, Methane
purification by adsorptive processes on MIL-53(Al), Chemical Engineering
Science, 124 (2015) 79-95.
[271] Z.H. Rada, H.R. Abid, J. Shang, Y. He, P. Webley, S. Liu, H. Sun, and S.
Wang, Effects of amino functionality on uptake of CO2, CH4 and selectivity of
CO2/CH4 on titanium based MOFs, Fuel, 160 (2015) 318-327.
[272] T. Dasgupta, S.N. Punnathanam, and K.G. Ayappa, Effect of functional groups
on separating carbon dioxide from CO2/N2 gas mixtures using edge

Capítulo I 105
functionalized graphene nanoribbons, Chemical Engineering Science, 121
(2015) 279-291.
[273] X. Wu, M. Niknam Shahrak, B. Yuan, and S. Deng, Synthesis and
characterization of zeolitic imidazolate framework ZIF-7 for CO2 and CH4
separation, Microporous and Mesoporous Materials, 190 (2014) 189-196.
[274] M. Clausse, J. Bonjour, and F. Meunier, Adsorption of gas mixtures in TSA
adsorbers under various heat removal conditions, Chemical Engineering
Science, 59 (2004) 3657-3670.
[275] N. Tlili, G. Grévillot, and C. Vallières, Carbon dioxide capture and recovery by
means of TSA and/or VSA, International Journal of Greenhouse Gas Control,
3 (2009) 519-527.
[276] J. McEwen, J.D. Hayman, and A. Ozgur Yazaydin, A comparative study of
CO2, CH4 and N2 adsorption in ZIF-8, Zeolite-13X and BPL activated carbon,
Chemical Physics, 412 (2013) 72-76.


Capítulo II MATERIALES Y MÉTODOS


Capítulo II 109
En este capítulo se detallan los procedimientos experimentales que se usaron
para obtener los distintos materiales y las distintas técnicas utilizadas para caracterizar
los adsorbentes tanto a nivel textural como químico. También se describe el diseño de
las instalaciones en las que se han llevado a cabo las distintas experiencias que nos
permiten testar los materiales como adsorbentes específicos de compuestos orgánicos
volátiles (COVs) y de gases. Finalmente, se detallan las ecuaciones y modelos que
permiten analizar los resultados obtenidos, incluyendo los fundamentos teóricos en los
que se basan cada una de las técnicas usadas.
2.1. PREPARACIÓN DE MUESTRAS
2.1.1. Carbones activados obtenidos a partir de residuos de biomasa
2.1.1.1.Activación química de hueso de aceituna
La preparación de carbones activados a partir de hueso de aceituna tuvo como
primera etapa la preparación del material de partida, el cual fue molturado y tamizado a
tamaños de partícula entre 1.0 y 2.0 mm. Posteriormente, fue tratado con H2SO4 1M
para eliminar restos de materia inorgánica presentes en el hueso y se lavó con agua
destilada hasta ausencia de sulfatos.
Para llevar a cabo la activación química con hidróxido de potasio (KOH), se
procedió a una etapa previa de carbonización en atmósfera inerte a baja temperatura (10
°C·min-1, 400°C 2h, N2 300 cm3·min-1) con objeto de tener una estructura carbonosa
estable previa a la activación. Este carbonizado de hueso de aceituna se mezcló con
KOH en una proporción másica 1:7 (C:KOH), sometiéndose la mezcla a un proceso de
activación a alta temperatura en nitrógeno (10 °C·min-1, 350 °C 2h, 850 °C 3h, N2 300
cm3·min-1).
Una vez enfriado, el material se retiró del horno y se llevó a cabo un
tratamiento con ácido clorhídrico HCl 0.1M para neutralizar el exceso de KOH. Con
objeto de reducir el contenido en materia inorgánica se llevó a cabo un proceso de

110 Capítulo II
desmineralización siguiendo el método desarrollado por Bishop-Ward1. Este proceso
consiste en tratar el material de carbón con distintas cantidades de HCl y HF de manera
que se puedan solubilizar los compuestos inorgánicos presentes en el carbón activado.
Una vez realizados dichos tratamientos ácidos, el material de carbón ya
desmineralizado es lavado con agua destilada hasta ausencia de cloruros. El material así
obtenido se denominó CA y el rendimiento global del proceso fue de un 15%. En la
Fig. 2.1 se representa el proceso de síntesis en forma de esquema.
Figura 2.1. Síntesis de la muestra CA obtenida por activación química de hueso de
aceituna.
2.1.1.2. Oxidación y descomposición selectiva de grupos oxigenados
La muestra CA fue dividida en porciones, una de las cuales fue sometida a un
proceso de oxidación con una disolución saturada de peroxidisulfatoamónico2
(((NH4)2S2O8) en H2SO4 1M (600 g·L-1)y a temperatura ambiente. Para ello, la
disolución se mezcló con el carbón activado en una proporción de 20 mL·g-1y se dejó
reaccionar durante 24 h en agitación. Una vez transcurrida la reacción, el carbón
activado se filtró y se lavó repetidamente con agua destilada hasta ausencia de sulfatos,
secándose en una estufa a 110 °C. El material obtenido se denominó CAOX.
DESMINERALIZACIÓNCARBONIZACIÓN
HUESO ACEITUNA
ACTIVACIÓN
CON KOHCA
KOH:carbón = 7:1 (masa)
N2, 300 cm3 min-1
1) 350ºC, 2 horas, 10 ºC min-1
2) 850ºC, 3 horas, 10 ºC min -1
Neutralización KOH en exceso mediante HCl y HF.
Eliminación materia mineral.
Lavado con agua hasta ausencia Cl-.
N2, 300 cm3 min-1
400ºC, 2 horas, 10 ºC min-1

Capítulo II 111
Como ya se vio en el Capítulo I, los distintos grupos oxigenados presentes en
una estructura carbonosa presentan diferencias en cuanto su estabilidad térmica3,4
(Tabla 1.2). Basándose en esto, el carbón activado CAOX fue también dividido en
distintas porciones que, con objeto de eliminar selectivamente los distintos tipos de
grupos superficiales oxigenados, se sometieron a tratamientos térmicos en atmósfera
inerte y a temperatura creciente: 300 °C, 500 °C y 700 °C (10 min, 20 °C·min-1, N2 150
cm3·min-1). Los materiales así obtenidos fueron denominados CAOX300, CAOX500 y
CAOX700 respectivamente, en función de la temperatura a la que fueron tratados. La
obtención de muestras por oxidación y la eliminación térmica selectiva de grupos
superficiales se resumen en la Fig. 2.2.
Figura 2.2. Oxidación del CA y tratamientos térmicos para descomposición selectiva
de grupos superficiales oxigenados.
2.1.1.3. Activación física de pellets de madera de pino
Para la preparación de carbón activado a partir de pellets de madera se partió de
un producto comercial suministrado por Los Reyes del Pellets C.B.. Este material,
usado en calefacción doméstica, se obtiene por extrusión en caliente de astillas de
madera provenientes principalmente de desechos de la industria maderera. La
normativa europea prohíbe el uso de aditivos para la fabricación de pellets en este tipo
de aplicaciones, por lo que la humedad tiene que ser controlada durante el proceso.
OXIDACIÓN
(NH4)S2O8
CA
CAOX
Disolución saturada peroxidisulfato amónico en H2SO4 1M. 24 h, rt.
Lavado hasta ausencia de SO42-
O
OHO
O
OH
OO
O
O
O
ELIMINACIÓN
SELECTIVA
CAOX300
CAOX500
CAOX700
N2, 150 cm3 min-1
300ºC, 10 min, 20 ºC min-1
500ºC, 10 min, 20 ºC min-1
700ºC, 10 min, 20 ºC min-1
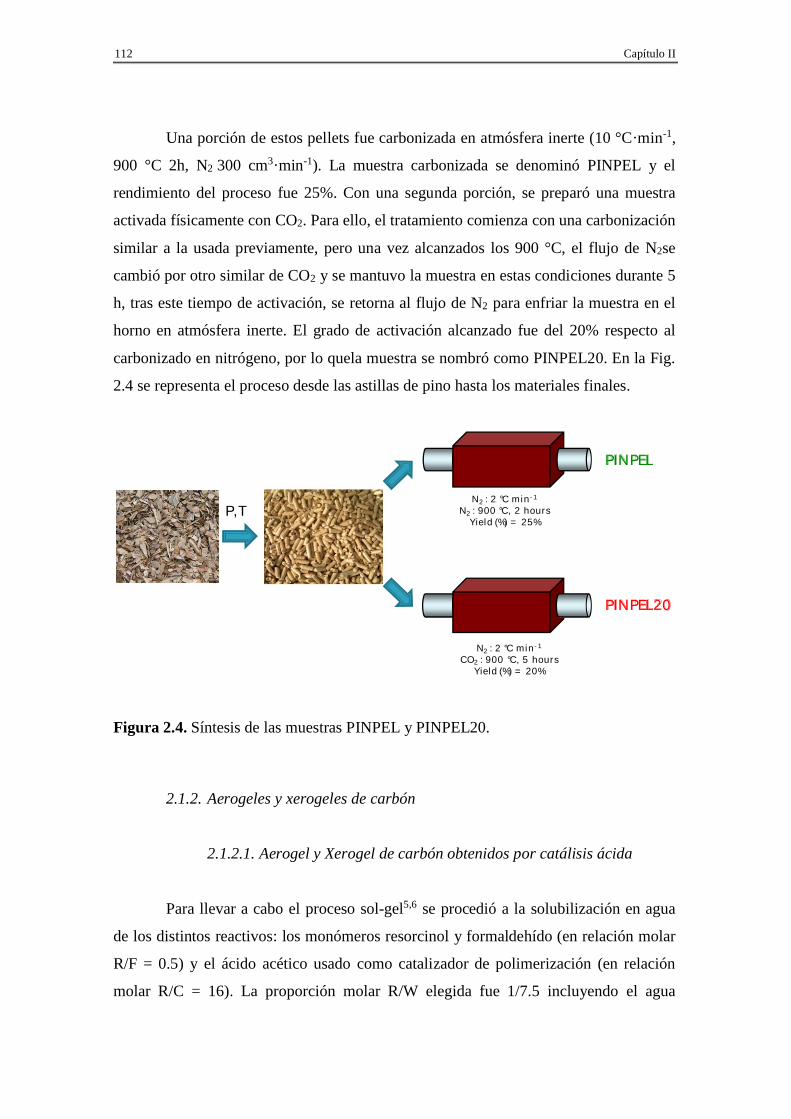
112 Capítulo II
Una porción de estos pellets fue carbonizada en atmósfera inerte (10 °C·min-1,
900 °C 2h, N2 300 cm3·min-1). La muestra carbonizada se denominó PINPEL y el
rendimiento del proceso fue 25%. Con una segunda porción, se preparó una muestra
activada físicamente con CO2. Para ello, el tratamiento comienza con una carbonización
similar a la usada previamente, pero una vez alcanzados los 900 °C, el flujo de N2se
cambió por otro similar de CO2 y se mantuvo la muestra en estas condiciones durante 5
h, tras este tiempo de activación, se retorna al flujo de N2 para enfriar la muestra en el
horno en atmósfera inerte. El grado de activación alcanzado fue del 20% respecto al
carbonizado en nitrógeno, por lo quela muestra se nombró como PINPEL20. En la Fig.
2.4 se representa el proceso desde las astillas de pino hasta los materiales finales.
Figura 2.4. Síntesis de las muestras PINPEL y PINPEL20.
2.1.2. Aerogeles y xerogeles de carbón
2.1.2.1. Aerogel y Xerogel de carbón obtenidos por catálisis ácida
Para llevar a cabo el proceso sol-gel5,6 se procedió a la solubilización en agua
de los distintos reactivos: los monómeros resorcinol y formaldehído (en relación molar
R/F = 0.5) y el ácido acético usado como catalizador de polimerización (en relación
molar R/C = 16). La proporción molar R/W elegida fue 1/7.5 incluyendo el agua
N2 : 2 °C min-1
CO2 : 900 °C, 5 hoursYield (%) = 20%
PINPEL20
P,T
PINPEL
N2 : 2 °C min-1
N2 : 900 °C, 2 hoursYield (%) = 25%

Capítulo II 113
presente en el formaldehido. Estas proporciones fueron ajustadas, acorde a la
bibliografía disponible, para obtener un material con las propiedades texturales
deseadas7. Los reactivos empleados fueron: resorcinol, 99% (Sigma-Aldrich);
formaldehido, 37% (Sigma-Aldrich); y ácido acético glacial (Panreac).
La disolución preparada fue introducida en moldes cilíndricos de vidrio
(diámetro interno 6 mm) que se sellaron por ambos extremos. El proceso de
gelificación se llevó a cabo en el interior de una estufa mediante un programa de
temperatura (25 °C 1 día, 50 °C 1 día, 80 °C 5 días). Transcurrido este tiempo el
hidrogel fue sacado de los moldes, cortado en pellets de 2-3 cm y sumergidos en
acetona durante tres días, cambiando el disolvente cada día, para intercambiar el agua
por el disolvente orgánico. Esta etapa, como ya se comentó en el Capítulo I, es
necesaria en el caso del secado supercrítico con CO2, ya que el agua no es soluble en
este; sin embargo, también es recomendable llevarla a cabo cuando se opta por un
secado térmico, ya que presenta una menor tensión superficial, con lo que se reduce el
colapso de la porosidad en esta etapa del proceso8.
En aras de obtener el aerogel, parte del material se sometió a un proceso de
secado con CO2 supercrítico (41°C, 100 bar, 6h). El resto se secó en una estufa a vacío
(50 °C, 65 mbar, 3 h) para obtener el xerogel. Una vez secas ambas muestras se
carbonizaron en un horno tubular con flujo de nitrógeno (2 °C·min-1, 900 °C 2 h,
N2 300 cm3·min-1). El aerogel se denominó AC16 y el xerogel AC16X.
2.1.2.2. Activación física con CO2 del xerogel de carbón AC16X
Para ajustar la microporosidad del xerogel de carbón AC16X, la muestra se
dividió en varias porciones que fueron activadas a 870 °C con mezclas de CO2 y N2
hasta distintos porcentajes: 5, 10, 20 y 40 %. Estos procesos generan nuevos
microporos a bajos grados de activación y ensanchan los microporos ya generados a
grados más altos. Las muestras se denominaron AC16X5, AC16X10, AC16X20 y
AC16X40, de acuerdo con su grado de activación. En la Fig.2.3 se representa tanto la
síntesis del aerogel y el xerogel, como la etapa de activación de este último.
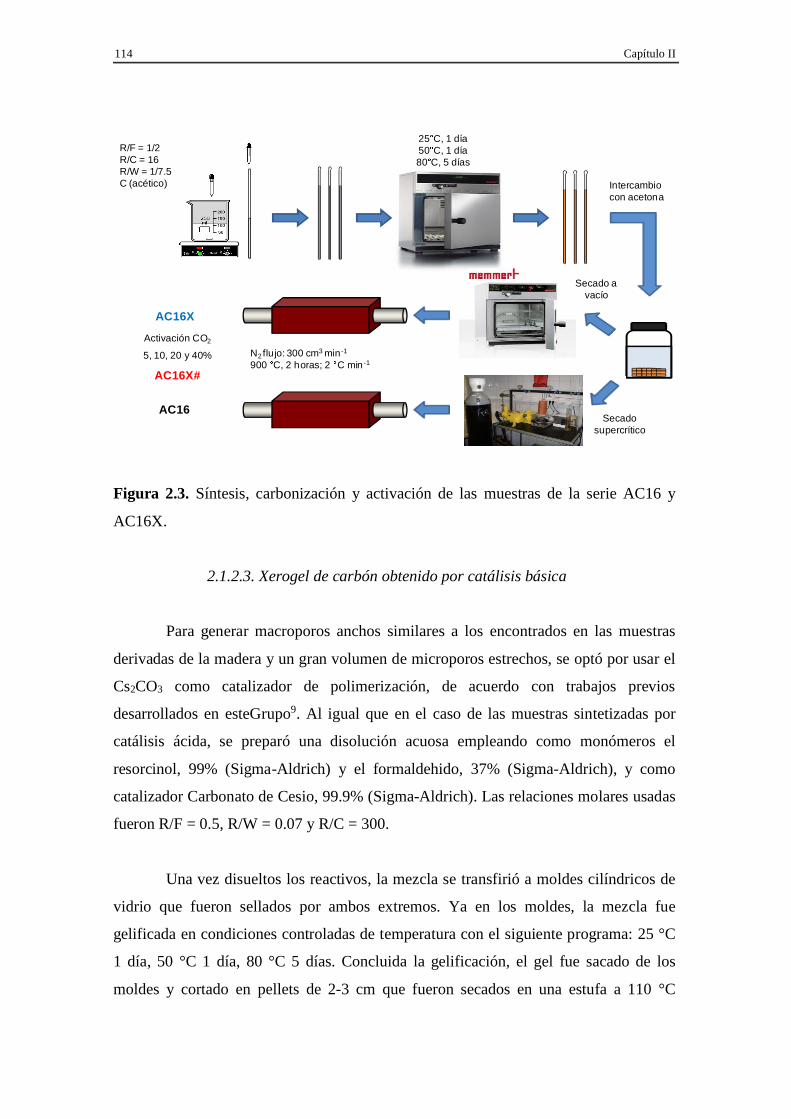
114 Capítulo II
Figura 2.3. Síntesis, carbonización y activación de las muestras de la serie AC16 y
AC16X.
2.1.2.3. Xerogel de carbón obtenido por catálisis básica
Para generar macroporos anchos similares a los encontrados en las muestras
derivadas de la madera y un gran volumen de microporos estrechos, se optó por usar el
Cs2CO3 como catalizador de polimerización, de acuerdo con trabajos previos
desarrollados en esteGrupo9. Al igual que en el caso de las muestras sintetizadas por
catálisis ácida, se preparó una disolución acuosa empleando como monómeros el
resorcinol, 99% (Sigma-Aldrich) y el formaldehido, 37% (Sigma-Aldrich), y como
catalizador Carbonato de Cesio, 99.9% (Sigma-Aldrich). Las relaciones molares usadas
fueron R/F = 0.5, R/W = 0.07 y R/C = 300.
Una vez disueltos los reactivos, la mezcla se transfirió a moldes cilíndricos de
vidrio que fueron sellados por ambos extremos. Ya en los moldes, la mezcla fue
gelificada en condiciones controladas de temperatura con el siguiente programa: 25 °C
1 día, 50 °C 1 día, 80 °C 5 días. Concluida la gelificación, el gel fue sacado de los
moldes y cortado en pellets de 2-3 cm que fueron secados en una estufa a 110 °C
R/F = 1/2R/C = 16R/W = 1/7.5C (acético)
25 C, 1 día50 C, 1 día80 C, 5 días
Intercambio con acetona
Secado a vacío
Secadosupercrítico
N2 flujo: 300 cm3 min -1
900 C, 2 horas; 2 C min -1
AC16X
AC16
Activación CO2
5, 10, 20 y 40%
AC16X#

Capítulo II 115
durante 12 h. El xerogel orgánico ya seco fue carbonizado en atmósfera inerte (1.5
°C·min-1, 900 °C 2 h, N2 300 cm3·min-1). La muestra se denominó XCs300 y en la Fig.
2.5 se puede encontrar un resumen del proceso de preparación en forma de esquema.
Figura 2.5. Síntesis de la muestra XCs300.
2.2. CARACTERIZACIÓN TEXTURAL
2.2.1. Adsorción física de gases
Las isotermas de adsorción de N2 a -196 °C y de CO2 a 0 °C fueron obtenidas
en un equipo QUADRASORB-SI y en un AUTOSORB-1C ambos de la casa comercial
Quantachrome Ins.. Para ello aproximadamente 0.1 g de muestra se introducen en un
bulbo de 9 mm y se desgasifican a alto vacío (10-6 bar) a 110 °C durante 12 h. Los
adsorbatos fueron nitrógeno (99.999 %) y dióxido de carbono (99.999 %) suministrados
por Air Liquide.
XCs300
R/F = 0.5R/C = 300R/W = 0.07C (Cs2CO3)
1 day, 25 C1 day, 50 C5 days, 80 C
N2, 300 cm3·min-1
900 C, 2 hours
24 h, 110 C
GELIFICATION
DRYING
CARBONIZATION

116 Capítulo II
A partir de las isotermas de N2 se calcularon los siguientes parámetros: la
superficie específica (SBET) mediante el modelo propuesto por Brünauer, Emmett y
Teller10 (B.E.T.), el volumen de microporos (W0) por el método de Dubinin-
Radushkevich11, la anchura media de microporos (L0) a partir de la ecuación de
Stoeckli12 y el volumen de mesoporos (Vmeso) aplicando el método de Barrett, Joyner y
Halenda13 (B.J.H.). En el caso de la isoterma de adsorción de CO2 se obtuvieron
también el volumen y la anchura media de los microporos más estrechos de la misma
forma. Las ecuaciones y los distintos modelos empleados se describen a continuación.
2.2.1.1. Ecuación de B.E.T.
El modelo de Brünauer-Emmett-Teller10 se basa en la formación de una
monocapa a bajas presiones, de manera que sabiendo la cantidad de moléculas
adsorbida y la superficie que ocupa cada una de estas moléculas, podemos calcular la
superficie total del adsorbente. El cálculo de la SBET se lleva a cabo aplicando las
Ecuaciones 2.1 y 2.2.
Ecuación 2.1
Ecuación2.2
2.2.1.2. Ecuación de Dubinin-Radushkevich y ecuación de Stoeckli
El modelo de Dubinin-Radushkevich11 es posterior y tiene en cuenta que la
adsorción depende en gran medida del tamaño de poro, ya que para poros más
pequeños la interacción adsorbato-adsorbente será más grande y, por lo tanto, a bajas
presiones la adsorción se dará sólo en los microporos. Por ello en lugar de suponer la
formación de monocapa y a partir de la misma, calcular la superficie, el modelo
propuesto por Dubinin-Radushkevich (ecuaciones 2.3 y 2.4) se utiliza para calcular el
volumen de microporos teniendo en cuenta que una vez adsorbido, el adsorbato va a
pasar de estado gaseoso a líquido en el interior del poro.
0mm0ads PP
CV1C
CV1
PPVP

Capítulo II 117
Ecuación 2.3
Ecuación 2.4
Para linealizar la ecuación se toman logaritmos de manera que a partir de la
ordenada en el origen se obtiene el volumen de microporos (W0) y de la pendiente se
obtiene la energía de adsorción (E0).La ecuación se aplica tanto a las isotermas de
adsorción de nitrógeno a -196 °C como a las de dióxido de carbono a 0 °C, de manera
que obtenemos dos valores W0(N2) y W0(CO2). Hay que tener en cuenta que a presión
atmosférica el CO2 sólo se puede adsorber en poros menores de 0.7 nm, por lo que el
W0(CO2) puede ser menor que el W0(N2) para carbones con altos grados de activación
en los que haya microporos más anchos. Por el contrario, cuando existen constricciones
a la entrada de los microporos la adsorción de nitrógeno se ve impedida y en este caso
W0(CO2) será mayor que W0(N2), lo que suele ocurrir en carbones con bajos grados de
activación. La anchura media de los microporos se puede obtener a partir de la
Ecuación de Stoeckli12 (Ecuación 2.5) o de Dubinin14 (Ecuación 2.6) cuando E0 es
menor de 20 kJ·mol-1.
Ecuación 2.5
Ecuación 2.6
2.2.1.3. Método de B. J. H.
Cuando se analizan muestras mesoporosas mediante adsorción de nitrógeno, las
isotermas generalmente presentan ciclos de histéresis, es decir, la rama de adsorción y
la de desorción no son coincidentes. Esto se debe a la forma en la que se produce
adsorción y la desorción en poros cilíndricos abiertos, lo que hace que para una presión
relativa dada haya una cantidad de gas adsorbida, mientras que la presión relativa
2
00
AexpWW
11,4kJ/molE10,8(nm)L
00
kJ/mol)(E24(nm)L
00

118 Capítulo II
necesaria para desorber esta misma cantidad de gas será menor. El fenómeno de
histéresis puede explicarse mediante la ecuación de Kelvin15, que relaciona el radio de
un poro con la presión relativa a la que es llenado en función de las características del
sistema adsorbente-adsorbato. Basándose en esto se puede aplicar el modelo propuesto
por Barrett, Joyner y Halenda13 para calcular, generalmente a partir de la rama de
desorción, tanto la distribución del tamaño de poros en la región correspondiente al
llenado de mesoporos como el volumen total de mesoporos.
2.2.2. Porosimetría de Intrusión de Mercurio
La porosimetría de intrusión de mercurio permite obtener la curva de
distribución de tamaño de poros para los macroporos y mesoporos más anchos,
complementando así los resultados obtenidos por adsorción de gases. Esta técnica
permite también calcular la densidad aparente del sólido. Puesto que el mercurio tiene
una tensión superficial muy alta, no moja la superficie del sólido y debe ser introducido
en los poros a presión. De esta forma, a presiones más bajas se llenaran los poros más
anchos y a presiones más altas los más estrechos. La relación entre el radio de un poro
y la presión a la que hay que introducir el Hg para que penetre en el mismo viene dada
por la Ecuación de Washburn16 (ecuación 2.7).
Ecuación 2.7
De esta forma se puede saber a una presión dada que poros se están llenando y
midiendo la cantidad de Hg que penetra en el sólido a cada presión podemos construir
la curva de distribución de tamaño de poros (PSD). Las porosimetrías se llevaron a
cabo en el Instituto Pedro Nunes de Coimbra (Portugal) con un equipo AUTOPORE IV
9500 (Micromeritics).
2.2.3. Microscopia Electrónica de Barrido (SEM)
Con objeto de visualizar la morfología de la superficie de los adsorbentes se
tomaron microfotografías de la superficie por Microscopía Electrónica de Barrido
Pcos2-r

Capítulo II 119
(SEM). Estas fueron realizadas en el Centro de Instrumentación Científica de la
Universidad de Granada, con un microscopio electrónico de alta resolución modelo
GEMINI-1430-VP de la casa comercial LEO Carl Zeiss.
2.3. CARACTERIZACIÓN QUIMICA
2.3.1. Análisis termogravimétrico (TGA)
El estudio termogravimétrico de los adsorbentes nos permite medir la
estabilidad térmica de los mismos en diversas atmósferas. En el caso de carbones
oxidados tratados térmicamente nos permite simular los procesos que se dan en el
horno y dilucidar a que temperaturas se produce la eliminación de grupos superficiales
de la muestra. Estos análisis son necesarios también cuando se lleva a cabo la adsorción
en régimen estático de COVs ya que hay que tener en cuenta los procesos de
descomposición de grupos superficiales de la superficie del carbón a la hora de analizar
la desorción de los contaminantes.
En nuestro caso, los análisis termogravimétricos se llevaron a cabo en el Centro
de Instrumentación de la Universidad de Granada con un instrumento TGA-50H de la
casa Shimadzu. Los análisis se realizaron en flujo de nitrógeno hasta 950 °C y con una
velocidad de calentamiento de 10 °C·min-1.
2.3.2. Calorimetría diferencial de barrido (DSC)
Además de las pérdidas de masa, en los procesos de descomposición y
reoxidación por parte de los grupos superficiales de oxígeno y en los procesos de
desorción de COVs, los intercambios de energía son importantes, ya que podemos
calcular la energía de interacción adsorbato-adsorbente, así como analizar posibles
procesos que pueden darse en la superficie del carbón. Los procesos de descomposición
de grupos y de desorción de COVs serán ambos endotérmicos, por lo que a la hora de

120 Capítulo II
analizar el proceso de desorción habrá que tener en cuenta que en la muestra también
tienen lugar cambios químicos que pueden influir en la medida.
Los experimentos de DSC fueron llevados a cabo en el Centro de
Instrumentación Científica de la Universidad de Granada, usando para ello un
TGA/DSC1 de la casa Mettler-Toledo. En este caso el equipo sólo puede alcanzar los
500 °C por lo que los análisis se llevaron a cabo hasta esta temperatura, con una
velocidad de calentamiento de 10 °C·min-1 y en flujo de nitrógeno.
2.3.3. Desorción térmica programada (TPD)
La técnica de desorción térmica programada (TPD) nos permite analizar la
química superficial de los adsorbentes basándonos en la estabilidad térmica relativa de
los grupos superficiales y en el compuesto químico que se genera al producirse su
descomposición. En el caso de los grupos oxigenados, como ya se vio en el Capítulo I
(Tabla 1.2) son bien conocidas las temperaturas a la que cada uno de ellos es eliminado,
así como las especies químicas (CO o CO2) a las que dan lugar3,4. Esta técnica permite
caracterizar los grupos oxigenados presentes en toda la muestra, por lo que el %O
obtenido por TPD (%OTPD) corresponde al de todo el sólido.
Las curvas de TPD se obtuvieron colocando aproximadamente 0.15 g de la
muestra en un reactor de cuarzo en el que se coloca un termopar para medir la
temperatura. La muestra se calienta hasta 1000 °C con una velocidad de calentamiento
de 50 °C·min-1, y los gases generados son arrastrados por un flujo de Helio (60
cm3·min-1) que pasa a través de la muestra y los lleva hasta el sistema de detección, un
Espectrómetro de Masas PRISMA (Pfeiffer).
Las señales que se analizan son las de los fragmentos iónicos(m/z)
correspondiente a los gases H2, He, H2O, CO y CO2: 2, 4, 12, 14, 16, 17, 18, 22, 28 y
44. Previamente, los gases a analizar (CO, CO2, H2) fueron calibrados utilizando los
gases diluidos en Helio (10 vol%) y el H2O registrándose un TPD de sulfato de cobre
pentahidratado (CuSO4·5H2O).
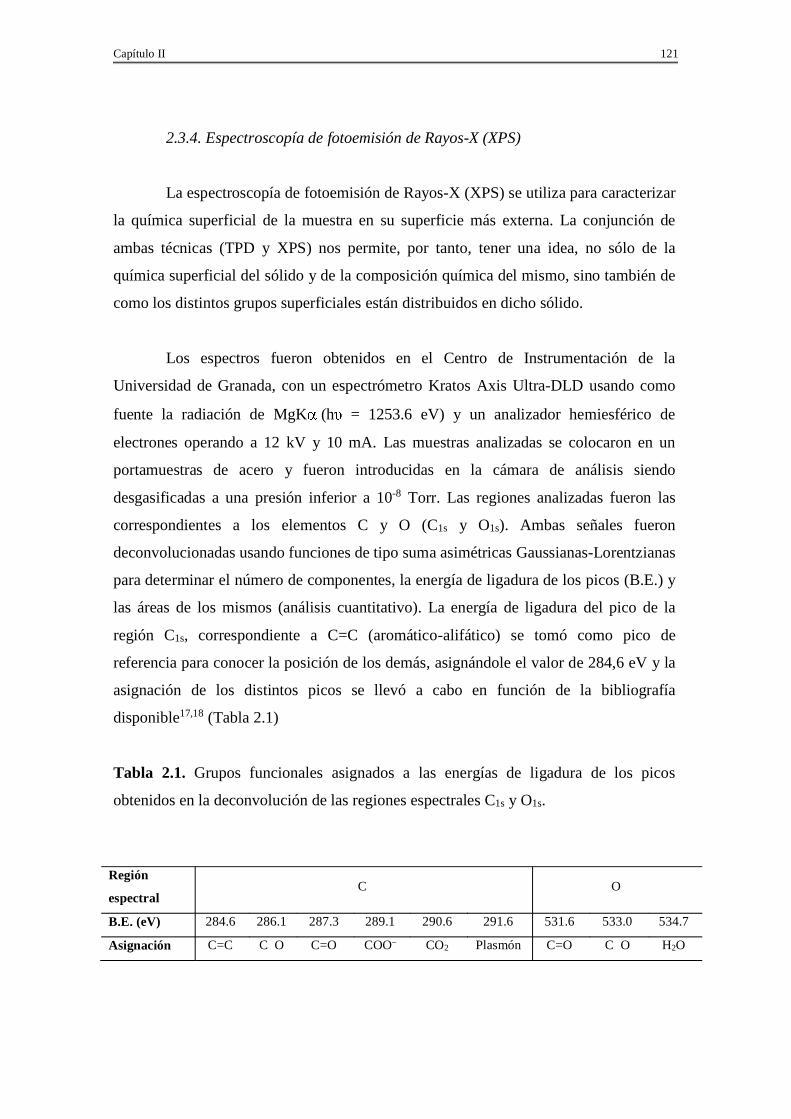
Capítulo II 121
2.3.4. Espectroscopía de fotoemisión de Rayos-X (XPS)
La espectroscopía de fotoemisión de Rayos-X (XPS) se utiliza para caracterizar
la química superficial de la muestra en su superficie más externa. La conjunción de
ambas técnicas (TPD y XPS) nos permite, por tanto, tener una idea, no sólo de la
química superficial del sólido y de la composición química del mismo, sino también de
como los distintos grupos superficiales están distribuidos en dicho sólido.
Los espectros fueron obtenidos en el Centro de Instrumentación de la
Universidad de Granada, con un espectrómetro Kratos Axis Ultra-DLD usando como
fuente la radiación de MgK (h = 1253.6 eV) y un analizador hemiesférico de
electrones operando a 12 kV y 10 mA. Las muestras analizadas se colocaron en un
portamuestras de acero y fueron introducidas en la cámara de análisis siendo
desgasificadas a una presión inferior a 10-8 Torr. Las regiones analizadas fueron las
correspondientes a los elementos C y O (C1s y O1s). Ambas señales fueron
deconvolucionadas usando funciones de tipo suma asimétricas Gaussianas-Lorentzianas
para determinar el número de componentes, la energía de ligadura de los picos (B.E.) y
las áreas de los mismos (análisis cuantitativo). La energía de ligadura del pico de la
región C1s, correspondiente a C=C (aromático-alifático) se tomó como pico de
referencia para conocer la posición de los demás, asignándole el valor de 284,6 eV y la
asignación de los distintos picos se llevó a cabo en función de la bibliografía
disponible17,18 (Tabla 2.1)
Tabla 2.1. Grupos funcionales asignados a las energías de ligadura de los picos
obtenidos en la deconvolución de las regiones espectrales C1s y O1s.
Región
espectral C O
B.E. (eV) 284.6 286.1 287.3 289.1 290.6 291.6 531.6 533.0 534.7
Asignación C=C C O C=O COO CO2 Plasmón C=O C O H2O

122 Capítulo II
2.3.5. pH del punto cero de carga (pHZPC)
El pH del punto cero de carga (pHZPC) da una idea del carácter ácido-base de la
superficie del material. Resulta muy útil en el caso de adsorción de especies iónicas
(por ejemplo, iones metálicos en agua) ya que nos indica a que pH la superficie de
nuestro adsorbente estará cargada (positiva o negativamente) o no. No obstante, puede
ser utilizada como una herramienta más de caracterización en otro tipo de aplicaciones,
corroborando, por ejemplo, que se han generado centros ácidos en un carbón activado
por oxidación del mismo.
Para determinar este parámetro se ha empleado el método propuesto por Leon y
col.19 que es una variante del método de Schwarz y col.. Unos 0.250 g de muestra son
suspendidos en 4 mL de agua destilada previamente desgasificada con objeto de
eliminar el dióxido de carbono disuelto. La suspensión se mantiene en agitación a
temperatura ambiente y se mide su pH periódicamente hasta un valor constante que es
considerado como el pHZPC de la muestra.
2.4. ADSORCIÓN Y SEPARACIÓN DE COMPUESTOS ORGÁNICOS
VOLÁTILES PRESENTES EN BIOCOMBUSTIBLES
Una vez caracterizados los materiales fueron utilizados en adsorción de
compuestos orgánicos volátiles presentes en biocombustibles. Para estudiar los
procesos de adsorción se llevaron a cabo experimentos en régimen estático y dinámico
en el caso de adsorción de n-octano y etanol en carbones activados obtenidos a partir de
hueso de aceituna y con distinto contenido en oxígeno. La adsorción de isómeros de n-
octano y su separación en la serie de aerogel y xerogeles (AC16 y AC16X) sólo fue
testeada en régimen dinámico.
2.4.1. Adsorción en estático de vapor saturado
Para llevar a cabo las experiencias de adsorción de COVs en régimen estático,
las muestras se saturaron a T ambiente en un desecador que contenía etanol (absoluto,
Capítulo II 123
Panreac), n-octano (>99% GC, Sigma-Aldrich) o agua. Se usaron aproximadamente
0.050 g de cada adsorbente seco que se introdujeron en el desecador. La muestra se
pesó periódicamente hasta pesada constante, considerándose entonces el adsorbente
saturado, con lo que la cantidad adsorbida se calculó por diferencia con el peso de
muestra seca. La desorción se estudió entonces por TGA y DSC, calculando tanto la
cantidad desorbida como la energía de desorción.
2.4.2. Adsorción en régimen dinámico. Curvas de rotura
Las curvas de rotura para la adsorción en dinámico de COVs presentes en
biocombustibles (etanol, n-octano -trimetilpentano) fueron obtenidas en el
sistema experimental de la Fig. 2.6. Este sistema presentó ligeras variaciones en
función del tipo de adsorbente, usándose cargas más grandes de adsorbente y por tanto
reactores más grandes en el caso de muestras en pellets. Las peculiaridades del sistema
para cada grupo de adsorbentes se especifican en cada uno de los siguientes capítulos,
pero en general el sistema consta de un reactor de vidrio termostatizado que contiene el
lecho del adsorbente y por el que se hace pasar el flujo de gases (He o aire (60 cm3·min-
1)).Estos flujos se controlan mediante sus correspondientes controladores de flujo
másico (MFC). Una de las líneas de gas de arrastre se hace burbujear en una ampolla
que contiene el COVs líquido a 0 °C, obteniendo así un flujo saturado en el mismo. La
concentración de contaminante en el flujo entrante en la columna se ajusta, pues,
mediante dilución con la línea de gas puro. Dos válvulas de cuatro vías nos permiten
seleccionar cual de las corrientes de gas entra en el reactor, a la salida del mismo, si
esta pasa por el sistema de detección o va directamente al de purga (lo que permite
hacer bypass para medir la concentración sin pasar por la columna). La concentración
de contaminantes se determina mediante un cromatógrafo de gases VARIANT CP-
3800 equipado con una columna Carbowax-20M y un detector de llama FID.

124 Capítulo II
Figura 2.6. Sistema para obtención de curvas de rotura: a) MFCs, b) ampolla COV
líquido, c) criostato, d) columna con lecho adsorbente, e) GC-FID, f) Trampa.
En cuanto al análisis de las curvas de rotura, este fue llevado a cabo mediante
el concepto de la Zona de Transferencia de Masas (MTZ) descrito por Webber20 y
Luckchis21. Así, se considera la resistencia global al proceso de adsorción de un flujo
continuo de efluente contaminado, de forma que existe un frente que avanza por la
columna y se encuentra justo delante de la zona donde la columna se encuentra ya
saturada. Este frente es conocido como la Zona de transferencia de masas (MTZ), y
corresponde a la zona del lecho donde el contaminante está siendo adsorbido. En estas
curvas se representa la relación entre la concentración del contaminante a la salida de la
columna (C) y a la entrada (C0) en función del tiempo, pudiéndose obtener, además de
la altura y velocidad de avance de la MTZ, otros datos como los volúmenes, tiempos y
cantidad de contaminante adsorbido tanto a rotura como a saturación. El cálculo de
cada uno de ellos se lleva a cabo de la siguiente forma22:
Volumen a rotura (VB) y volumen a saturación (VS): Son los volúmenes de
aire contaminado que pasan por el reactor hasta alcanzar una concentración
relativa del contaminante a la salida, respecto a la entrada, de 0.02 y 0.90
para rotura y saturación respectivamente. Se obtuvieron multiplicando los
tiempos a los que se alcanzaron dichas concentraciones por el caudal del
efluente.
25º
a
b
c
d
e
f
a

Capítulo II 125
Cantidad adsorbida a rotura (XB) y cantidad adsorbida a saturación (XS): Se
obtuvieron mediante la diferencia entre la concentración de entrada y la
concentración a la salida del reactor (C0 C), teniendo en cuenta el volumen
de elución, realizando la sumatoria hasta rotura y hasta saturación,
respectivamente. Ambas se expresaron en mg de contaminante por g de
carbón.
Altura de la Zona de Transferencia de Masa (HMTZ): El cálculo de este
parámetro se llevó a cabo mediante las Ecuaciones 2.8 y 2.9 descritas en
bibliografía.
02.090.002.0
02.090.0ZTM VVV
VVhH Ecuación 2.8
)VV(C
dVCC
02.090.00
V
V 090.0
02.0 Ecuación 2.9
Donde h es la altura del lecho, V0.90 y V0.02 son los volúmenes a rotura y a
saturación tal y como se han definido anteriormente y es un parámetro
que se conoce como la capacidad fraccional de la columna. La capacidad
fraccional ( ) es la relación entre la cantidad de contaminante adsorbida por
el lecho entre los volúmenes de rotura y saturación y la cantidad que ha
entrado en la columna entre estos volúmenes y, por tanto, debe variar entre 0
y 1.
Velocidad de avance de la ZTM (RZTM):Se calcula multiplicando la HZTM
por el caudal y dividiendo el producto por la diferencia entre el volumen a
rotura y el volumen a saturación.
Grado de utilidad de la columna (Du(%)):Es la relación, en porcentaje, entre
la cantidad adsorbida hasta el punto de rotura y la cantidad adsorbida hasta

126 Capítulo II
el punto de saturación, de manera que cuanto más alto sea el Du(%) mayor
es el tiempo que la columna está adsorbiendo todo el contaminante que pasa
por ella con respecto al tiempo total del experimento. Se calcula mediante la
Ecuación 2.10 como una relación de áreas sobre la curva de rotura, según la
fórmula mostrada en la Fig. 2.7.
9.0
02.0
V
V0
02.0
02.0
dVCC9.0V02.090.0
V02.090.0(%)Du Ecuación 2.10
Figura 2.7. Cálculo del Du(%) a partir de una curva de rotura.
2.5. ADSORCIÓN SELECTIVA DE CO2 EN REFINADO DE BIOGÁS
Las experiencias para el estudio de los adsorbente en refinado de biogás fueron
realizadas durante la estancia pre-doctoral en el Laboratory of Separation and Reaction
Engineering (LSRE) perteneciente a la Facultad de Ingeniería de la Universidad de
Oporto. Las isotermas de alta presión fueron obtenidas en un equipo gravimétrico
mientras que los estudios de adsorción en dinámico se llevaron a cabo con un
equipamiento ligeramente diferente en diseño y de un tamaño mayor que el que
utilizamos en el Laboratorio de Adsorción y Catálisis de la Universidad de Granada.

Capítulo II 127
2.5.1. Isotermas de adsorción a alta presión.
Las isotermas de adsorción y desorción de CO2 y CH4 a altas presiones fueron
obtenidas en una microbalanza de suspensión magnética Rubotherm. La principal
ventaja de este equipo con respecto a equipos gravimétricos convencionales es que el
compartimento de la muestra está separado físicamente de la parte electrónica de la
balanza, lo que permite tener una mayor precisión y emplear condiciones de medida
más drásticas. Además contiene un material de referencia que permite llevar a cabo
medidas de densidad (Fig. 2.8).
Figura 2.8. Esquema de la microbalanza de suspensión magnética (RUBOTHERM).
Para llevar a cabo la medida, lo primero que hubo que hacer fue desgasificar la
muestra a vacío (P < 0.01 bar, T = 150 °C) durante 24 h. Es necesario llevar a cabo una
picnometría de Helio del sistema vacío previamente y, una vez desgasificada la
muestra, del sistema con la muestra dentro ya que se necesitan los valores de volumen
muerto, volumen de muestra y densidad real para poder hacer corrección del efecto de
empuje, fenómeno que será importante especialmente a altas presiones. Una vez
realizada la picnometría se procedió a la obtención de las isotermas a 30, 50 y 70 °C y
en un rango de presiones de 0 a 10 bar. Para ello, el gas se va introduciendo en dosis,
fijando la presión a la que se requiere cada uno de los puntos y midiendo el cambio de
masa producido a cada una de las presiones. Después el gas se va retirando haciendo
vacío para registrar la desorción.

128 Capítulo II
Una vez obtenidas, las isotermas fueron ajustadas al modelo de Langmuir/Toth
(Ecuaciones 2.11 y 2.12), usándose el mismo ajuste para las tres isotermas (30, 50 y 70
°C). Finalmente, con objeto de determinar la curva característica del sistema adsorbato-
adsorbente, se calculó la variación del calor isostérico de adsorción con la cantidad
adsorbida. Para ello, fue necesario representar el mejor ajuste posible para cada una de
las isotermas a 30 °C y a 50 °C de manera que se pudieran obtener por interpolación los
valores de presión a los que la cantidad adsorbida coincidía con la de los puntos
experimentales de la isoterma a 70 °C. Estos puntos se usaron para obtener las rectas de
regresión (ln P vs. 1/T) de cuya pendiente podemos obtener el calor isostérico de
adsorción (Ecuación 2.13).
Ecuación 2.11
Ecuación 2.12
Ecuación 2.13
Donde q, cantidad adsorbida y, qsat, cantidad adsorbida a saturación (mol kg-1); b,
constante Langmuir/Toth (bar-1); n, parámetro de heterogeneidad (n=1 para modelo
Langmuir); P and T, presión y temperatura (bar, K); and Hads, calor de adsorción (kJ
mol-1).
2.5.2. Adsorción en régimen dinámico CO2 y CH4
Las curvas de rotura de CO2 y CH4 se obtuvieron en equipos distintos para el
caso del xerogel (XCs300) y el carbón activado obtenido a partir de pellets de madera
(PINPEL20). Los detalles experimentales en cuanto a carga de adsorbente, presión,
temperatura y concentraciones de gases se recogen en los capítulos correspondientes a
cada uno de los trabajos. En ambos casos el sistema es parecido, una serie de
controladores de flujo másico (MFC) para regular la entrada de los gases, una columna
termostatizada en la que se coloca el adsorbente con termopares para medir los cambios

Capítulo II 129
de temperatura, un medidor de flujo másico (MFM) a la salida y un equipo para
cuantificar de los gases.
Las principales diferencias entre una equipo y otro son que por un lado, la
columna para la muestra PINPEL20 era mucho más alta (aproximadamente 80 cm) que
la que se usó para la muestra XCs300 (de unos 10 cm), con lo que en este caso había
tres termopares a distinta alturas para seguir la variación de temperatura en distintos
puntos de la columna; por otro lado, el sistema de detección que en el caso de la
muestra PINPEL20 fue un cromatógrafo de gases GC (DANI) con detectores FID y
TCD y una columna capilar (HPPLOT U), mientras que en el caso de la muestra
XCs300 se empleó un analizador de gases por infrarrojo GasDataLMSxiTypeG4.18
(GasDataLtd,UK).
En este caso no se utilizó el concepto de Zona de Transferencia de Masas para
analizar las curvas de rotura y en lugar de trabajar con concentraciones de gas, se
calcularon los flujos molares de cada uno de ellos a la salida, lo que permite la
integración directa de las curvas de rotura. También se registró la desorción sin
aumentar la temperatura, simplemente cambiando la corriente de entrada por He de
manera que este arrastra a la fase adsorbida y comprobando que las cantidades
desorbidas y adsorbidas, calculadas por integración de las curvas fueran similares.
2.6. BIBLIOGRAFÍA
[1] M. Bishop and D.L. Ward, The direct determination of mineral matter in coal,
Fuel,37 (1958) 191-199.
[2] C. Moreno-Castilla, M.A. Ferro-García, J.P. Joly, I. Bautista-Toledo, F.
Carrasco-Marín, and J. Rivera-Utrilla, Activated Carbon Surface Modifications
by Nitric Acid, Hydrogen Peroxide, and Ammonium Peroxydisulfate
Treatments, Langmuir, 11 (1995) 4386-4392.
[3] J.L. Figueiredo, M.F.R. Pereira, M.M.A. Freitas, and J.J.M. Órfão, Modification
of the surface chemistry of activated carbons, Carbon, 37 (1999) 1379-1389.

130 Capítulo II
[4] G. de la Puente, J.J. Pis, J.A. Menéndez, and P. Grange, Thermal stability of
oxygenated functions in activated carbons, Journal of Analytical and Applied
Pyrolysis, 43 (1997) 125-138.
[5] R.W. Pekala, Low density, resorcinol-formaldehyde aerogels, US Patent,
US4873218 A, 1989.
[6] R.W. Pekala, Organic aerogels from the polycondensation of resorcinol with
formaldehyde, Journal of Materials Science, 24 (1989) 3221-3227.
[7] T.F. Baumann, M.A. Worsley, T.Y.-J. Han, and J. Satcher, High surface area
carbon aerogel monoliths with hierarchical porosity, Journal of Non-Crystalline
Solids, 354 (2008) 3513-3515.
[8] E. Gallegos-Suárez, A.F. Pérez-Cadenas, F.J. Maldonado-Hódar, and F.
Carrasco-Marín, On the micro- and mesoporosity of carbon aerogels and
xerogels. The role of the drying conditions during the synthesis processes,
Chemical Engineering Journal, 181 182 (2012) 851-855.
[9] S. Morales-Torres, F.J. Maldonado-Hódar, A.F. Pérez-Cadenas, and F.
Carrasco-Marín, Structural characterization of carbon xerogels: From film to
monolith, Microporous and Mesoporous Materials, 153 (2012) 24-29.
[10] S. Brunauer, P.H. Emmett, and E. Teller, Adsorption of gases in multimolecular
layers, Journal of the American Chemical Society, 60 (1938) 309-319.
[11] M.M. Dubinin, Inhomogeneous microporous structures of carbonaceous
adsorbents, Carbon, 19 (1981) 321-324.
[12] F. Stoeckli, Porosity in carbon. Characterization and applications, Eds. Patrick
J. Arnold, London, 1995.
[13] E.P. Barrett, L.G. Joyner, and P.P. Halenda, The Determination of Pore Volume
and Area Distributions in Porous Substances. I. Computations from Nitrogen
Isotherms, Journal of the American Chemical Society, 73 (1951) 373-380.
[14] M.M. Dubinin, Generalization of the theory of volume filling of micropores to
nonhomogeneous microporous structures, Carbon, 23 (1985) 373-380.
Capítulo II 131
[15] S.J. Gregg and K.S.W. Sing, Adsorption, Surface Area & Porosity, Academic
Press, London, 1982.
[16] E.W. Washburn, Note on a method of determining the distribution of pore sizes
in a porous material, Proceedings of the National Academy of Sciences, 7 (1921)
115-116.
[17] A.F. Pérez-Cadenas, F.J. Maldonado-Hódar, and C. Moreno-Castilla, On the
nature of surface acid sites of chlorinated activated carbons, Carbon, 41 (2003)
473-478.
[18] E. Desimoni, G.I. Casella, and A.M. Salvi. XPS/XAES study of carbon fibres
during thermal annealing under UHV conditions,Carbon,30(1992) 521-526.
[19] C.A. Leon, J.M. Solar, V. Calemma, and L.R. Radovic, Evidence for the
protonation of basal plane sites on carbon,Carbon,30(1992)797-811.
[20] W.J.J. Webber, Physiochemical Processes for Water Quality Control, Wiley-
Interscience ed., New Cork, 1972.
[21] G.M. Luckchis, Adsorption systems 1. Design by mass-transfer-zone concept,
Chemical Engineering,80 (1973) 111-116.
[22] P.N. Cheremisinoff and F. Ellerbusch, Carbon Adsorption Handbook, Ann
Arbor Science Pub. ed., Michigan, 1978.


Capítulo III TAILORING THE SURFACE CHEMISTRY
AND POROSITY OF ACTIVATED CARBONS:
EVIDENCE OF REORGANIZATION AND
MOBILITY OF OXYGENATED SURFACE
GROUPS
(NH4)S2O8
0
4
8
12
16
20
0 200 400 600 800 1000T (ºC)
(a)
0
4
8
12
16
20
0 200 400 600 800 1000T (ºC)
(b)


TAILORING THE SURFACE CHEMISTRY AND
POROSITY OF ACTIVATED CARBONS: EVIDENCE OF
REORGANIZATION AND MOBILITY OF OXYGENATED
SURFACE GROUPS Article published in Carbon, 68 (2014) 520-530, doi: 10.1016/j.carbon.2013.11.030
Highlights
Activated carbon was prepared by chemical activation with KOH of olive stones.
Oxidation lead to an activated carbon with different oxygenated surface groups.
Thermal treatments at 300 °C and 500 °C produced a reorganization of OSGs.
At 700°C almost all of the oxygen is eliminated from carbon surface.
Abstract
An activated carbon with developed porosity and surface area (SBET = 2387 m2g-1) was prepared by chemical activation and then oxidized with ammonium peroxydisulfate. The oxidation treatment destroyed mesopore walls leading to a severe surface area reduction. Specific thermal treatments were carried out in different portions of the oxidized sample to selectively remove the oxygenated surface complexes. The combination of different techniques revealed that thermal treatment between 300 and 500 ºC produces a strong reorganization of oxygenated groups on the chemical structure of carbons. CO2-evolving groups (around 75 wt.%) are selectively transformed into CO-evolving groups. These processes only occur inside the pores, and involve CO2 desorption and re-adsorption in this temperature range. At a higher treatment temperature (700 ºC), re-oxidation is prevented and the surface chemistry becomes quite similar to the original activated carbon. Keywords: Activated carbons, porosity, surface chemistry, mobile oxygenated complexes.


Capítulo III 137
3.1. INTRODUCTION
The performance of carbon materials as adsorbents, catalysts or catalyst
supports depends on the combination of porous and chemical surface properties, which
in turn, control the nature and strength of the interactions between the carbon material
and the corresponding target molecule. One of the main advantages of carbon materials
is their versatility, in that their physicochemical properties can be easily adapted to one
specific application.
Different types of new carbon materials can be prepared today with controlled
porosity using techniques such as nanocasting1, sol-gel and controlled drying to obtain
aerogels, xerogels or cryogels2,3, etc. However, most of activated carbons are prepared
using cheap raw materials like coal4 or different types of residues such as old tires5,
sludge from waste water treatment6, agricultural by-products, available in abundance
around the world and which vary depending on the geographic area (olive stones,
almond shells, coconut, etc) and even pruning off-cuts7,8. Pore size distribution and
surface area depend on the nature of the raw material, the activation procedure
(physical activation or chemical activation, activating agent, temperature and activation
time) and the activation (burn-off) degree9. All these aspects should be optimized in
each case to obtain the desired porosity, and a balance must be struck between the
characteristics of the product (porosity, mechanical properties, etc) and the cost (yield)
of the process. Many previous researchers have tried to analyze and predict the
influence of experimental conditions in an attempt to optimize the product while
keeping the cost of the process as low as possible9,10.
We observed that an extensive textural study was performed in most of the
manuscripts using porous materials. Less attention, however, is paid in general to the
influence of chemical properties, although surface groups based on different
heteroatoms (O, N, S, halogens, etc) are specifically generated by the treatment of
carbon materials both in gas and liquid phase11. The control of surface chemistry is a
powerful tool for developing specific adsorbents and catalysts. It is well known that
surface chemistry strongly influences the behavior of carbon materials in the adsorption
of organic molecules from solutions, controlling electrostatic/non-electrostatic

138 Capítulo III
interactions12. Specific chemical groups, like sulfur surface groups, were introduced to
increase the mercury adsorption13,14, and oxygenated surface groups (OSG) were used
to favor the separation/capture of CO2 from mixtures of gases15.
OSG are the most extensively studied of the various types of surface chemical
groups16-18. In the activation process, OSG are the intermediate species before they are
evolved as gaseous CO or CO29. In catalytic applications, acid carbons were produced
by oxidation processes for fine chemistry applications16. OSG influence the metal
dispersion of supported catalysts17 and have been used to anchor active metal-
complexes18. Some OSG are acidic (carboxylic, lactones, anhydrides, phenol) while
other such as chromene or pyrone groups are classified as basic centers11,19. Parameters
such as hydrophobicity or the acid/base nature of the carbon surface can therefore be
modified by the oxidation process and a controlled removal of the groups generated20.
All these processes involving the generation and removal of OSG imply the mobility
and transformation of these chemical species. Theoretical studies of this question have
been made using different approaches (density functional theories or computational
chemistry calculations)21,22, but in general, there is a lack of information and
experimental proof. In previous studies20, we observed that oxygenated surface groups
can be removed selectively by heating oxidized samples in an inert atmosphere: the
oxygen content decreases linearly as the treatment temperature increases. After these
thermal treatments, both CO-evolving groups and to a lesser extent CO2-evolving
groups show some degree of mobility on the carbon surface, and a significant amount
of CO is evolved below the treatment temperature, when the sample is heated again
from room temperature without air exposure. This shows that the thermal stability of
some of these groups decreases because they move to previously generated free sites.
In this work, a highly porous activated carbon was obtained by chemical
activation of carbonized olive stones and deeply oxidized by treatment with
(NH4)2S2O8. Textural and chemical transformations induced by the
formation/elimination of OSG after oxidation, thermal treatments and storage in air
were analyzed using different techniques. We present experimental evidence of the
mobility of oxygenated surface groups and the transformation of acidic CO2-evolving
groups into CO-evolving groups.

Capítulo III 139
3.2. MATERIALS AND METHODS
3.2.1. Preparation of carbon materials
Olive stones were milled and sieved to 1.0 2.0 mm, treated with sulfuric acid
(1N) to remove the rest of pulp and washed until all sulfates had been removed. An
initial carbonization was carried out by heating at 10 ºC min-1 to 400 ºC and a soak time
of two hours under a nitrogen flow of 300 cm3 min-1 using a tubular furnace (from
Heraeus) equipped with a stainless steel tube (180 cm long x 8 cm diameter x 0.8 cm
wall) with reduction made by steel welding and graphite joints between the taps.
The purity of the N2 flow was 99.999 % (H2O, CO and O2 contents below 3
ppm), and air leaks were prevented by placing a Gas Purifier MDL III from Supelco
(Ref. 23800-U) at the entry to the furnace, which removed the possible residues of H2O,
O2, CO and CO2. The composition of the N2 flow was identical at the entry and the exit
of the furnace tube (analyzed by MS), the leak absence was carefully checked before
any sample preparation and the system was purged for 1 h before heating. After thermal
treatments, samples were cooled in the same N2 flow to room temperature and finally
stored in a desiccator.
The carbon yield was 30%. Chemical activation was carried out using a
mixture of this carbonized material and KOH in a 1:7 mass ratio. This mixture was
treated under nitrogen flow (300 cm3 min-1) for two hours at 350 ºC followed by three
hours at 850 ºC (heating rate of 10 ºC min-1). Cooling to ambient temperature was
performed by keeping the sample under nitrogen atmosphere. Finally, the sample was
demineralized with HCl and HF, which also removed the excess base (KOH), washed
with distilled water until chlorides had been removed and dried in an oven at 110 ºC for
24 hours before storage. This sample was labeled as CA.
3.2.2. Chemical Surface Modifications
Ammonium peroxydisulfate ((NH4)2S2O8) was chosen as an oxidizing agent.
CA was mixed with a saturated solution of this salt on H2SO4 1 M. After 24 hours

140 Capítulo III
under stirring at room temperature, oxidized carbon was filtered and washed with
distilled water until sulfates had been removed17,23,24. This material was dried at 110 ºC
and labeled as CAOX. Thermal treatments under nitrogen atmosphere (150 cm3 min-1)
at 300 ºC, 500 ºC and 700 ºC (10 min, 20 ºC min-1) were carried out on different
portions of CAOX, following the same experimental procedure described previously, in
order to remove some of the oxygenated surface groups (OSG) selectively, thus
obtaining three samples CAOX300, CAOX500 and CAOX700.
3.2.3. Textural Characterization
The morphology of carbons was analyzed using a scanning electron
microscope (Leo, Carl Zeiss, Geminy-153). Images were obtained at excitation energy
of 20 kV. Textural properties of ACs were determined by adsorption isotherms of N2 (-
196 °C) and CO2 (0 °C) using an Autosorb 1 from Quantachrome after outgassing
samples overnight at 110 °C under high vacuum (10 mbar). Parameters such as BET
surface area, micropore volume (W0) and micropore mean width (L0) were calculated
by applying BET, Dubinin-Radushkevich and Stoeckli equations respectively to the
corresponding isotherms25,26. The pore size distributions (PSD) were determined by
applying Quenched Solid Density Functional Theory (QSDFT), assuming slit-shaped
pores and BJH derived methods27,28 to the N2 adsorption isotherms. Mesopore volume
(Vmeso) was estimated according to Gurvitch's rule, therefore considering the total pore
volume as the volume of adsorbed nitrogen at a relative pressure of P/P0 = 0.95 (V0.95).
Mesopore volume, Vmeso, was obtained consequently from the difference29 between
V0.95 and W0 (N2).
3.2.4. Chemical Characterization
Thermal treatments of samples were simulated by thermogravimetric analysis
using a SHIMADZU mod. TGA-50H and a METTLER-TOLEDO mod. TGA/DSC1
for TG-DTG and DSC experiments respectively. The weight loss (W.L.) and the
associated heat flow (TG DSC) were recorded. Experiments were carried out in N2
flow and a heating ramp of 10 ºC min-1 up to 950 ºC (TG-DTG experiments) or 500 ºC
(DSC-experiments).
Capítulo III 141
Thermal Programmed Desorption (TPD) curves of carbon monoxide, carbon
dioxide, water and hydrogen were recorded. The integration of CO and CO2-TPD
profiles enabled us to determine quantitatively the total oxygen content and the
different oxygenated groups. The identification and quantification of these groups were
based on assignments in the bibliography20,30. Experiments were carried out by heating
150 mg of sample at 50 ºC min-1 up to 1000 °C using He as the carrier gas (60 cm3 min-
1). The analysis of desorbed gases was performed with a Mass Spectometer model
Prisma (Pfeiffer). The calibrations for CO and CO2 were carried out by analyzing these
gases diluted in He (10 vol%) and the calibration for H2O was performed by means of a
TPD of CuSO4·5H2O. The masses (uma) analyzed for these gases were: H2O - 16, 17,
18; CO -12, 16, 28; and CO2, 12, 16, 28, 44. Consecutive TPD experiments were
carried out in order to check that samples had not been oxidized by He impurities and
the reproducibility of the results. The estimated error in the determination of these
gases was less than 5%, and this was obtained by repeating the TPD runs on each
sample at least twice.
X-ray photo emission spectra (XPS) were recorded using a Kratos Axis Ultra-
= 1253.6 eV) as the radiation
source and a hemispheric electron analyzer operating at 12 kV and 10 mA. Survey and
multi-region spectra were recorded at C1s and O1s photoelectron peaks. Each spectral
region of interest was scanned several times to obtain good signal-to-noise ratios. The
spectra obtained after background signal correction were fitted to Lorentzian and
Gaussian curves in order to obtain the number of components, the position of each peak
and peak areas. Peak assignments were carried out according to the bibliography31,32.
Zero-point charge pH (pHZPC) of samples was determined according to the
method proposed by Leon et al.33. Approximately 250 mg of each sample were
suspended on 4 mL of previously degasified distilled water. Suspensions were stirred
and thermostated at 25 ºC measuring the pH periodically until the reading was constant.
The final pH obtained this way was considered as the pHZPC for each sample.
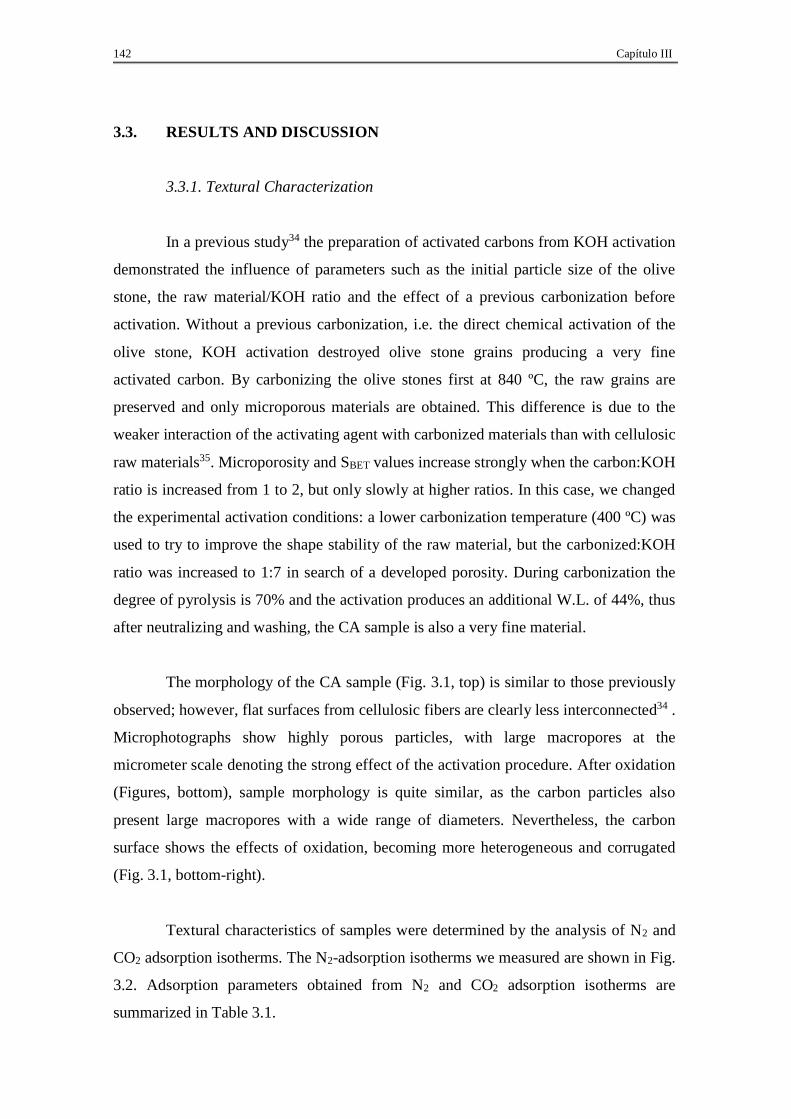
142 Capítulo III
3.3. RESULTS AND DISCUSSION
3.3.1. Textural Characterization
In a previous study34 the preparation of activated carbons from KOH activation
demonstrated the influence of parameters such as the initial particle size of the olive
stone, the raw material/KOH ratio and the effect of a previous carbonization before
activation. Without a previous carbonization, i.e. the direct chemical activation of the
olive stone, KOH activation destroyed olive stone grains producing a very fine
activated carbon. By carbonizing the olive stones first at 840 ºC, the raw grains are
preserved and only microporous materials are obtained. This difference is due to the
weaker interaction of the activating agent with carbonized materials than with cellulosic
raw materials35. Microporosity and SBET values increase strongly when the carbon:KOH
ratio is increased from 1 to 2, but only slowly at higher ratios. In this case, we changed
the experimental activation conditions: a lower carbonization temperature (400 ºC) was
used to try to improve the shape stability of the raw material, but the carbonized:KOH
ratio was increased to 1:7 in search of a developed porosity. During carbonization the
degree of pyrolysis is 70% and the activation produces an additional W.L. of 44%, thus
after neutralizing and washing, the CA sample is also a very fine material.
The morphology of the CA sample (Fig. 3.1, top) is similar to those previously
observed; however, flat surfaces from cellulosic fibers are clearly less interconnected34 .
Microphotographs show highly porous particles, with large macropores at the
micrometer scale denoting the strong effect of the activation procedure. After oxidation
(Figures, bottom), sample morphology is quite similar, as the carbon particles also
present large macropores with a wide range of diameters. Nevertheless, the carbon
surface shows the effects of oxidation, becoming more heterogeneous and corrugated
(Fig. 3.1, bottom-right).
Textural characteristics of samples were determined by the analysis of N2 and
CO2 adsorption isotherms. The N2-adsorption isotherms we measured are shown in Fig.
3.2. Adsorption parameters obtained from N2 and CO2 adsorption isotherms are
summarized in Table 3.1.

Capítulo III 143
N2 adsorption isotherms are mixtures of Type I and Type IV. Thus an
important amount of N2 is adsorbed at low relative pressure but the slope of the
isotherms at intermediate P/P0 values and the formation of the hysteresis loop in the CA
sample denotes a strong influence of mesoporosity on the isotherm profile. As regards
the microporosity (Table 3.1), it is noteworthy that in all cases W0(N2) > W0(CO2),
which also indicates the contribution of large micropores and mesopores to the N2-
adsorption capacity. The presence of large micropores is also corroborated by the L0
(CO2) values, because although CO2 adsorption is used to determine the porosity below
0.7 nm36, in this case L0 values are, in general, greater than 1.0 nm.
Figure 3.1. Morphology (SEM pictures) of CA (top) and CAOX (bottom).

144 Capítulo III
Figure 3.2. N2 adsorption-desorption isotherms. CA ( ), CAOX ( ), CAOX300 ( ),
CAOX500 ( ), CAOX700 (×).
Table 3.1. Textural properties of samples
Sample SBET
m2·g-1
W0 (N2)
cm3·g-1
W0 (CO2)
cm3·g-1
L0 (CO2)
nm
V0.95
cm3·g-1
Vmeso
cm3·g-1
CA 2387 0.92 0.39 1.1 2.23 1.31
CAOX 1661 0.63 0.43 0.9 1.07 0.44
CAOX300 1686 0.63 0.44 1.0 1.10 0.47
CAOX500 1696 0.68 0.48 1.1 1.18 0.50
CAOX700 1972 0.78 0.48 1.2 1.34 0.56
When we analyzed the textural transformation produced by the oxidation we
observed that the shape of the N2 adsorption isotherm changes dramatically, denoting
transformations mainly at the mesopore range: the hysteresis loop disappears and the
slope of isotherms decreases significantly, as does the total amount of N2 adsorbed.
Thus, W0 (N2) decreases 32% and Vmeso 60% while the volume of the narrowest
micropores determined by CO2 adsorption36, W0 (CO2), increases by only about 10%.
These transformations lead to a drastic reduction of SBET from 2387 to 1661 m2·g-1 due
to a destruction of pore walls of activated carbon CA during oxidation treatments that
0200400600800
1000120014001600
0.0 0.2 0.4 0.6 0.8 1.0P/P0

Capítulo III 145
affect the mesopores and the largest micropores and/or due to pore blockage by the
oxygenated surface groups formed. Two mechanisms, acting at the same time, have
been proposed to explain the breaking of pore walls20,37 after treatments with strong
oxidants: the first is gasification, i.e. the release of oxygenated terminal groups
generated by the oxidation treatment and the second is the mechanical destruction of
pores by the surface tension of the oxidizing solution.
Figure 3.3. Pore size distributions of activated carbons by application of QSDFT, a,
and BJH, b, methods to N2 adsorption isother (Blue (CA), red (CAOX),
green (CAOX300), black (CAOX500) and brown (CAOX700).
0.0
2.0
4.0
6.0
0 2 4D (nm)
a
0.0
2.0
4.0
6.0
0 2 4D (nm)
b

146 Capítulo III
After progressive thermal treatments at 300, 500, 700 ºC the main increases
were in Vmeso and W0 (N2), and consequently SBET values also increase. These
transformations showed that oxidation mainly produces the gasification of original
mesopore walls and that oxygenated surface groups are blocking micropores that when
gasified produce a pore widening, leading to large micropores and mesopores, as
summarized in Table 3.1.
Fig. 3.3 depicts the pore size distribution obtained by applying the QSDFT and
BJH methods to the N2 adsorption. Similar mesopore PSD profiles were obtained with
both methods. The PSD of the original CA sample presents a maximum for mesopores
with diameters between 2.8-3.0 nm. PSD determined by QSDFT method shows a
bimodal distribution around pores with widths of 0.8 nm and 2.0 nm. Original
mesopores are destroyed and partially blocked by OSG with the oxidation process in
such a way that the mesopore volume of CAOX and their derivative samples is always
smaller than the original volume in CA. Their PSD shifted to small mesopores
compared to CA, which are progressively favored by the micropore widening after
subsequent thermal treatments. However, the mesoporosity in the original pore range
was never recovered.
4.3.2. Chemical characterization
The interest in the study and tailoring of the surface chemistry of ACs by
introduction and/or elimination of different kinds of surface groups is clear from the
large number of research papers on these subjects11-22. Nevertheless this is a matter
under continuous discussion due to their inherent complexity. Results are influenced by
a large number of factors (porosity, activating agent, heating rate, secondary reactions,
energetic heterogeneity of the surface, etc)38. It is therefore always desirable to use
different experimental techniques that can provide complementary information about
the samples and the processes that take place in the different experimental conditions.
In our case, the surface chemistry of the ACs was extensively analyzed by XPS, TPD
and pHZPC experiments. The results we obtained are summarized in Table 3.2. The
sharp increase in the oxygen content of CA after oxidation to CAOX is particularly
noteworthy. This also causes a strong acidification of the carbon surface as denoted by

Capítulo III 147
the variation in the pHZPC values. This is the typical behavior previously observed for
other oxidized carbon materials17,20,23. The nature and distribution of OSG generated on
carbon materials depend on the physical and chemical characteristics of ACs and the
oxidizing agent. As an example, treatment with (NH4)2S2O8 produces stronger acid sites
than those generated after treatment with H2O2 or HNO323. In a previous manuscript17
we oxidized meso and macroporous carbon aerogels with H2O2 and (NH4)2S2O8. The
oxidation treatment with (NH4)2S2O8 is stronger than that with H2O2 in both support
series and the nature of OSG depends on the textural properties, thus, the formation of
anhydrides from neighboring carboxylic acid groups is favored in the case of
macroporous samples. These OSG had a strong influence on Pt-dispersion when
oxidized materials were used as catalysts supports. Similarly, experimental conditions
for the synthesis and characteristics of carbon xerogels strongly influence their behavior
during activation with O239,40. Highly oxidized samples (14 and 16 % wt of oxygen
content) were obtained after activation at 400 ºC in a 5% O2 (in N2) flow (B.O. 14 and
18% wt, respectively)40. The CO/CO2 ratio determined by TPD increases from 3.3 for
untreated samples to 6.6 for the sample with 14% of B.O. and then decreases to 5.9 for
the sample with 18% wt B.O.
Gomez-Serrano et al.41 showed that the amount and nature of OSG generated
during activation with air strongly depends on the activation temperature. At low
activation temperature (250 ºC) the formation of lactonic structures are favored, while
at 750 or 900 ºC activation takes place without the formation of permanent OSG on the
carbon surface40. On this question, Otake and Jenkins42 described four types of OSG for
air and HNO3 oxidized microporous carbons studied by TPD: lower- and higher-
temperature CO or CO2-yielding surface complexes. They concluded that the oxidation
temperature is a very important factor in determining the type of CO2-evolving
complexes that will be formed on a carbon surface. The highest temperature CO2
surface complexes found in chars that had been air-oxidized above 325 ºC are in the
form of carboxyl anhydrides, although a small amount of carboxylic acid is measurable.
As in the case of Samant et al.40, they found a high CO/CO2 ratio (around 6) for all
samples.
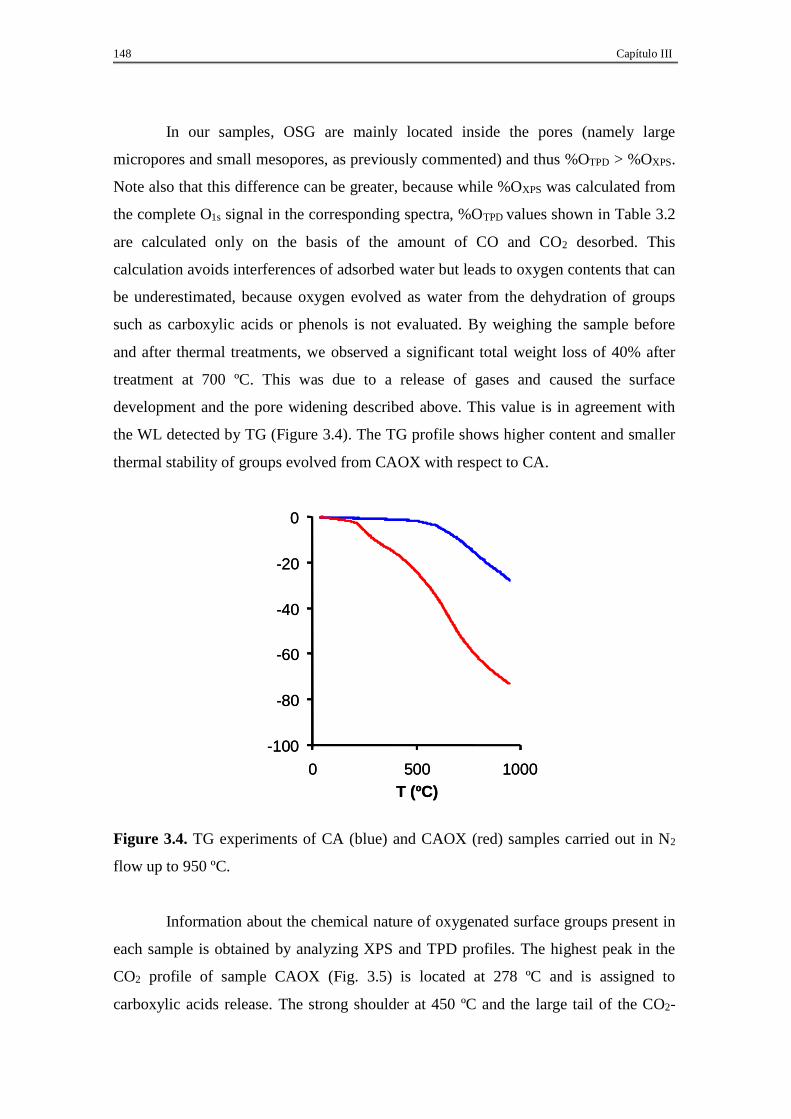
148 Capítulo III
In our samples, OSG are mainly located inside the pores (namely large
micropores and small mesopores, as previously commented) and thus %OTPD > %OXPS.
Note also that this difference can be greater, because while %OXPS was calculated from
the complete O1s signal in the corresponding spectra, %OTPD values shown in Table 3.2
are calculated only on the basis of the amount of CO and CO2 desorbed. This
calculation avoids interferences of adsorbed water but leads to oxygen contents that can
be underestimated, because oxygen evolved as water from the dehydration of groups
such as carboxylic acids or phenols is not evaluated. By weighing the sample before
and after thermal treatments, we observed a significant total weight loss of 40% after
treatment at 700 ºC. This was due to a release of gases and caused the surface
development and the pore widening described above. This value is in agreement with
the WL detected by TG (Figure 3.4). The TG profile shows higher content and smaller
thermal stability of groups evolved from CAOX with respect to CA.
Figure 3.4. TG experiments of CA (blue) and CAOX (red) samples carried out in N2
flow up to 950 ºC.
Information about the chemical nature of oxygenated surface groups present in
each sample is obtained by analyzing XPS and TPD profiles. The highest peak in the
CO2 profile of sample CAOX (Fig. 3.5) is located at 278 ºC and is assigned to
carboxylic acids release. The strong shoulder at 450 ºC and the large tail of the CO2-
-100
-80
-60
-40
-20
0
0 500 1000T (ºC)
-100
-80
-60
-40
-20
0
0 500 1000T (ºC)
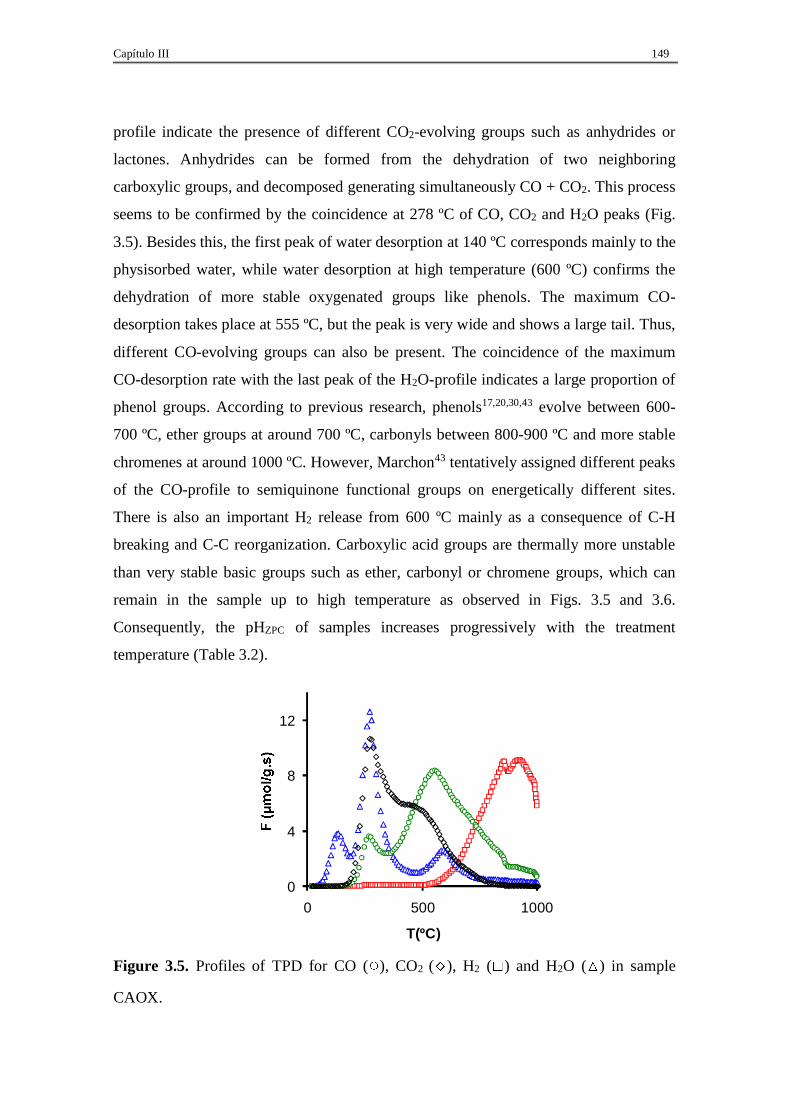
Capítulo III 149
profile indicate the presence of different CO2-evolving groups such as anhydrides or
lactones. Anhydrides can be formed from the dehydration of two neighboring
carboxylic groups, and decomposed generating simultaneously CO + CO2. This process
seems to be confirmed by the coincidence at 278 ºC of CO, CO2 and H2O peaks (Fig.
3.5). Besides this, the first peak of water desorption at 140 ºC corresponds mainly to the
physisorbed water, while water desorption at high temperature (600 ºC) confirms the
dehydration of more stable oxygenated groups like phenols. The maximum CO-
desorption takes place at 555 ºC, but the peak is very wide and shows a large tail. Thus,
different CO-evolving groups can also be present. The coincidence of the maximum
CO-desorption rate with the last peak of the H2O-profile indicates a large proportion of
phenol groups. According to previous research, phenols17,20,30,43 evolve between 600-
700 ºC, ether groups at around 700 ºC, carbonyls between 800-900 ºC and more stable
chromenes at around 1000 ºC. However, Marchon43 tentatively assigned different peaks
of the CO-profile to semiquinone functional groups on energetically different sites.
There is also an important H2 release from 600 ºC mainly as a consequence of C-H
breaking and C-C reorganization. Carboxylic acid groups are thermally more unstable
than very stable basic groups such as ether, carbonyl or chromene groups, which can
remain in the sample up to high temperature as observed in Figs. 3.5 and 3.6.
Consequently, the pHZPC of samples increases progressively with the treatment
temperature (Table 3.2).
Figure 3.5. Profiles of TPD for CO ( ), CO2 ( ), H2 ( ) and H2O ( ) in sample
CAOX.
0
4
8
12
0 500 1000
T(ºC)

150 Capítulo III
Table 3.2. Chemical characteristics of samples from TPD, XPS and pHZPC
determinations.
Sample WL
%
CO
mol g-1
CO2
mol g-1
OTPD
%
OXPS
% pHZPC
CA - 1160 150 2.3 1.8 7.5
CAOX - 3680 3010 15.5 10.0 2.4
CAOX300 20 5070 2110 14.9 7.6 2.9
CAOX500 24 6030 1370 14.0 6.0 3.0
CAOX700 40 680 110 1.4 1.6 7.8
The selective removal of OSG from the oxidized sample (CAOX) was carried
out by thermal treatments in an inert atmosphere, according to their thermal stability
previously determined by TPD. These thermal treatments, including the treatment at
lower temperature (300 ºC), are strong enough to completely eliminate carboxylic acid
groups present in the CAOX sample (Fig. 3.6). Nevertheless, CO2-desorption starts in
all heat-treated samples at around 230 ºC (Fig. 3.6a), i.e. some CO2-evolving groups
occupy the free sites again after the corresponding heat treatment, as previously
described20. This process seems to be favored at 500 ºC compared with treatments
carried out at 300 ºC (Fig. 3.6a). The main peak in the CO2-profile appears at 500 ºC
and 570 ºC for CAOX300 and CAOX500 respectively, i.e. this profile is also shifted
towards higher temperatures in line with increases in the treatment temperature. Thus
after treatments, thermally weaker and stronger CO2-evolving groups are generated by
the reorganization of oxygenated surface groups. In the case of the CO-profile (Fig.
3.6b), the CO-peak also shifted to higher temperatures but, simultaneously, strongly
increases with increasing treatment temperature from 300 to 500 ºC. During the
preparation of both CAOX-300 and CAOX-500 around 75% of the oxygen released as
CO2 is again reincorporated into the sample as CO-evolving groups (Table 3.2).

Capítulo III 151
Figure 3.6. TPD curves for CO2 (a) and CO (b). CA ( ), CAOX ( ), CAOX300 ( ),
CAOX500 ( ), CAOX700 (×).
XPS patterns of C1s and O1s regions for the sample series are depicted in Fig.
3.7, which also shows their different components. Fitting the C1s spectrum, different
functions were considered and assigned according to the bibliography31,32: aromatic and
aliphatic carbon (284.6 eV), single C-O bonds (286.0 eV), double C=O bonds (287.5
eV), carboxyl -COO- groups (289.1 eV), carbonate groups (290.6 eV) and plasmon
0
4
8
12
16
20
0 200 400 600 800 1000T (ºC)
(a)
0
4
8
12
16
20
0 200 400 600 800 1000T (ºC)
(b)
×
×

152 Capítulo III
(291.3 eV). The O1s spectra was fitted using two components, assigned as C=O at 531.3
eV and C-O at 533.2 eV.
Figure 3.7. Curve-fitted C1s (left), O1s (right) core-level spectra for samples series
(from top to bottom: CA, CAOX, CAOX300, CAOX500, CAOX700).
The formation of OSG after oxidation is observed by the appearance of clear
maxima on the large tail of the C1s peak of the CAOX spectrum. Thus, the contribution
of the peak at 284.6 eV decreases, while also showing an increase in the FWHM and
mainly favoring the increase of the peak at 287 eV (C=O bonds). These relative
maxima on the tail disappear progressively from the C1s spectra (the FWHM of the
peak at 284.6 eV decreases) with increasing treatment temperature and according to the

Capítulo III 153
decrease in %OXPS (Table 3.2). Thus, finally, CA and CAOX700 show similar C1s
spectra. If we analyze the O1s region, the same conclusion is obtained by comparing the
CA and CAOX spectra, i.e. oxidation favors the formation of C=O bonds. In spite of
the fact that C=O bonds are present in different types of OSG, such as quinone or
lactone groups, according to the TPD results they are due mainly to carboxylic groups
and their anhydride derivatives. After heat treatment, the expected decrease due to the
release of carboxylic acid of the O1s peak at 531.6 eV with respect to that at 533.0 eV
does not occur (Fig. 3.7). On the contrary, the proportion of C=O/C-O seems to bear no
relation to treatment temperature.
Sample CAOX therefore behaves in a very particular manner during treatments
between 300-500 ºC. As observed in Table 3.2, the %OXPS progressively decreases as
expected, however, %OTPD remains practically unmodified in this temperature range.
Moreover, TPD showed that the formation of CO-evolving groups is favored, whereas
XPS showed that CO2-evolving groups are formed. The external and internal carbon
surfaces therefore behave differently. There is a strong reorganization of oxygenated
surface groups inside the pores according to TPD results, in such a way that CO2-
evolving groups decrease as treatment temperature increases, although this results
simultaneously in a spectacular increase in CO-evolving groups, which maintain the
oxygen content practically constant. By contrast, on the external carbon surface, the
oxygen content decreases and the C=O bonds seem to be favored compared to the C-O
bonds, according to XPS results.
Different hypotheses must be examined in order to explain the behavior
described. The first option is that new OSG (basically CO-desorbing groups) were
generated during heat treatments by the presence of residual O2 in the N2 flow.
However, as explained in the experimental section, we used a high purity N2 flow and
air leaks were successfully prevented in such a way that no difference was observed
between the flow composition at the entry and exit of the tube oven. Therefore, the only
oxygen source inside the oven during the thermal treatment of CAOX sample must be
COx evolved from the corresponding OSG.
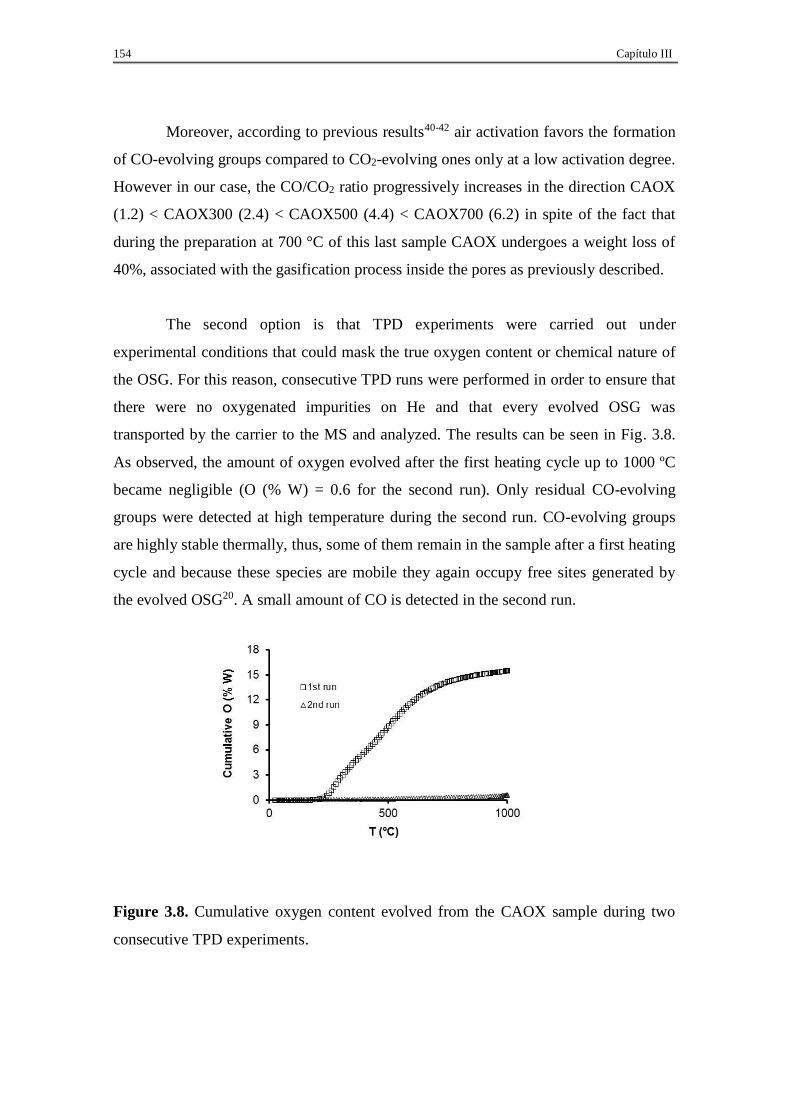
154 Capítulo III
Moreover, according to previous results40-42 air activation favors the formation
of CO-evolving groups compared to CO2-evolving ones only at a low activation degree.
However in our case, the CO/CO2 ratio progressively increases in the direction CAOX
(1.2) < CAOX300 (2.4) < CAOX500 (4.4) < CAOX700 (6.2) in spite of the fact that
during the preparation at 700 °C of this last sample CAOX undergoes a weight loss of
40%, associated with the gasification process inside the pores as previously described.
The second option is that TPD experiments were carried out under
experimental conditions that could mask the true oxygen content or chemical nature of
the OSG. For this reason, consecutive TPD runs were performed in order to ensure that
there were no oxygenated impurities on He and that every evolved OSG was
transported by the carrier to the MS and analyzed. The results can be seen in Fig. 3.8.
As observed, the amount of oxygen evolved after the first heating cycle up to 1000 ºC
became negligible (O (% W) = 0.6 for the second run). Only residual CO-evolving
groups were detected at high temperature during the second run. CO-evolving groups
are highly stable thermally, thus, some of them remain in the sample after a first heating
cycle and because these species are mobile they again occupy free sites generated by
the evolved OSG20. A small amount of CO is detected in the second run.
Figure 3.8. Cumulative oxygen content evolved from the CAOX sample during two
consecutive TPD experiments.

Capítulo III 155
These results showed that there was no reoxidation of the carbon surface by He
impurities or even by the OSG evolved in the first run, in the experimental conditions
used for TPD experiments. The reproducibility of the TPD results was also checked,
and we found that the difference of COx desorbed in duplicate experiments was always
less than 5%, which is within the experimental error limits. Therefore, sample
contamination does not occur and OSG are properly evolved, transported and analyzed
under the TPD experimental conditions used.
Alternatively, these new groups could be generated after the exposure and
storage of heat treated samples in air. Nevertheless it is also well known that the higher
the previous outgassing temperature the higher the extent of the regeneration of the
OSG by air oxidation during storage44. However, after treatments at 700 ºC, the oxygen
content and the pHZPC of CAOX700 and CA become quite similar, i.e. the re-oxidation
of this sample is negligible, even taking into account the higher concentration of free
sites, highly reactive and susceptible to being reoxidized either during the longer
cooling period needed (once again demonstrating the absence of air leaks) or during air
storage. Because all the samples were manipulated in a similar way, the oxidation by
air during transfer or storage of samples CAOX300 and CAOX500 should be even
smaller, and this cannot therefore be the reason for the high oxygen content of these
samples. According to XPS results, oxidation by air can be favored on the external
surface of heat treated samples.
Thus, the most plausible option to explain the results described above seems to
be the re-oxidation of the surface by CO2 desorbed at low treatment temperature or the
reorganization of OSG on the chemical structure by atomic diffusion during the heat
treatment. The thermally weaker carboxylic groups are certainly desorbed as CO2 even
with the treatment at 300 ºC. This CO2 should therefore be re-adsorbed, oxidizing the
carbon surface with the formation of new CO groups inside the pores in such a way that
the total oxygen content remains practically unchanged in sample CAOX300 compared
to sample CAOX (Table 3.2). This is observed even for treatment at 500 ºC. In the case
of CAOX700 it is very likely that readsorption and oxidation occur as previous steps
within the gasification process9, but then many of these complexes are decomposed as
they are not stable at 700 ºC (Figs. 3.4, 3.5 and 3.8), leading to a widening of porosity

156 Capítulo III
in this sample (Table 3.1). These new CO-evolving groups are stable inside the pores
after exposure to the air and storage of samples. However, at the most external surface,
free sites generated by the heat treatment seem to be reoxidized by air to CO2-evolving
groups, although the total amount of these groups is low (Table 3.2).
DSC experiments (Figure 3.9) confirm the re-adsorption (re-oxidation) of the
carbon surface during the thermal treatment of sample CAOX in N2. In the case of the
original CA sample, the DSC profile practically matched the base line up to around 350
ºC. Above this temperature, endothermic processes occur, related with the C-O bond
breakage and CO release according to the TPD results (Fig. 3.5). The bond breakage
and desorption processes are clearly endothermic. The small deviations observed are
due to the small amount of oxygen desorbed up to 500 ºC.
However, when we analyzed the DSC of the CAOX sample, we initially
observed a strong endothermic peak, associated with a dehydration process.
Physisorbed water and probably water formed from neighboring carboxylic acid groups
forming anhydrides were evolved at low temperature. However, between 200 350 ºC,
the temperature range within which the carboxylic groups are evolved as CO2, there is a
clear and significant exothermic peak. The bond breakage and the CO2 relay are
endothermic processes; therefore, the exothermic peak corresponds to the
chemisorption of the CO2 on highly energetic free carbon sites (Cf) and the adsorption
energy is enough to favor the formation of CO-evolving groups. The reaction CO (g) +
C(O) (s) = CO2 (g) + Cf is exothermic9, but is improbable in this case taking into
account the low CO concentration in this temperature range and because, in fact, the
amount of CO2 detected decreases while that of CO increased (Table 3.2). At higher
temperature, the DSC profile again decreases with respect to the base line, indicating
the endothermic release of surface groups. The re-oxidation of the carbon surface is
associated only with the release of carboxylic groups, so, in the DSC of thermally
treated CAOX (even at 300 ºC), this exothermic peak disappears because a great
proportion of carboxylic groups were previously evolved (Fig. 3.6). The release of CO2
from more stable groups such as anhydrides or lactones does not provide this effect,
probably because they decompose at higher temperatures so preventing CO2
chemisorption. It is also noteworthy that this process only occurs inside micropores and

Capítulo III 157
is favored in this sample due to the high micropore volume. The influence of porosity
in these processes was noted by previous authors9
enhanced dispersion forces, creating quasi-high pressure effects and a quasi-lowering of
2 ratio (and
consequently the intermediate OSG formed), which decreases with increasing burn-off
(porosity) of PFA-carbons45. This fact can also favor the ratio of C=O bonds found on
the surface by XPS analysis.
Figure 3.9. DSC-profiles obtained by heating samples at 10 ºC.min-1 in N2 up to 500
ºC. CA (brown), CAOX (green) and CAOX300 (black).
These experimental results confirm the hypothesis in the theoretical study by
Montoya et al.21 who proposed that the formation of semiquinone (CO-evolving
groups) from chemisorbed CO2 is thermodynamically possible due to the energy (heat
of adsorption) liberated by the formation of the CO2 surface complex (intermediate
lactones). More recently, Radovic22 performed a computational chemistry study which
confirmed that dissociative CO2-chemisorption is favored, mainly on zigzag active sites
(which are abundant in the CAOX sample once contiguous carboxylic acid groups are
decomposed). In a classic paper46 Hall and Calo also advised about the influence of a
large number of variables on the TPD profiles due to secondary interactions upon
can be strongly chemisorbed on coal
-0.8
-0.4
0
0.4
0 250 500T (°C)
158 Capítulo III
chars and/or formed by secondary reaction of CO2
agreement with our results and with the discussion provided.
3.4. CONCLUSIONS
Highly porous activated carbons are produced by chemical activation of
carbonized olive stones. In this case, the high activation degree caused pore walls to
become weak and to be gasified during oxidation treatment carried out in order to
functionalize the carbon surface. Oxidation destroyed the mesoporosity of the sample
obtaining acid activated carbons. Oxygen surface groups (OSG) were removed by
thermal treatments. We observed a strong reorganization of OSG inside pores when
samples were heated up to 300 or 500 ºC, where 75% of the OSG evolved as CO2
(carboxylic acids) are fixed again as a CO-evolving group (semiquinone). The
exothermic chemisorption of CO2 previously released was detected by DSC. Treatment
at 700 ºC prevents re-oxidation of the surface and leads to a strong degree of
gasification (40% w), which favors pore widening, and the decrease of the oxygen
content, which in turn favors an increase in the pHpzc. However, XPS showed that at the
external carbon surface the oxygen content decreases as treatment temperature
increases and the formation of C=O bonds is favored by open porosity.
3.5. REFERENCES
[1] J. Lee, J. Kim, and T. Hyeon, Recent Progress in the Synthesis of Porous Carbon
Materials, Advanced Materials, 18 (2016) 2073-2094.
[2] R.W. Pekala, Low density, resorcinol-formaldehyde aerogels, US Patent,
US4997804 A, 1991.
[3] S.A. Al-Muhtaseb and J.A. Ritter, Preparation and Properties of
Resorcinol Formaldehyde Organic and Carbon Gels, Advanced Materials, 15
(2003) 101-114.

Capítulo III 159
[4] G. Gong, Q. Xie, Y. Zheng, S. Ye, and Y. Chen, Regulation of pore size
distribution in coal-based activated carbon, New Carbon Materials 24 (2009)
141-146.
[5] A. Aranda, R. Murillo, T. García, A.M. Mastral, Simulation and optimization of
tyre-based steam activated carbons production for gas-phase polycyclic aromatic
hydrocarbons abatement, Chemical Engineering Journal, 187 (2012) 123-132.
[6] V.M. Monsalvo, A.F. Mohedano, and J.J. Rodriguez, Activated carbons from
sewage sludge: Application to aqueous-phase adsorption of 4-chlorophenol,
Desalination, 277 (2011) 377-382.
[7] S. Morales-Torres, A.M.T. Silva, A.F. Pérez-Cadenas, J.L. Faria, F.J.
Maldonado-Hódar, J.L. Figueiredo, and F. Carrasco-Marín, Wet air oxidation of
trinitrophenol with activated carbon catalysts: Effect of textural properties on the
mechanism of degradation, Applied Catalysis B: Environmental, 100 (2010)
310-317.
[8] Y. Tang, Q. Liu, and F. Chen, Preparation and characterization of activated
carbon from waste ramulus mori, Chemical Engineering Journal, 203 (2012)
19-24.
[9] H. Marsh and F. Rodríguez-Reinoso, Activated Carbon, Elsevier, Oxford, 2006.
[10] A. Baçaoui, A. Dahbi, A. Yaacoubi, C. Bennouna, F.J. Maldonado-Hódar, J.
Rivera-Utrilla, F. Carrasco-Marín, and C. Moreno-Castilla, Experimental Design
To Optimize Preparation of Activated Carbons for Use in Water Treatment,
Environmental Science & Technology, 36 (2002) 3844-3849.
[11] T.J. Bandosz, Chapter 2: Surface Chemistry of Carbon Materials, in: Carbon
Materials for Catalysis, John Wiley & Sons, Inc. New Jersey, 2009, pp. 45-93.
[12] C. Moreno-Castilla, Adsorption of organic molecules from aqueous solutions on
carbon materials, Carbon, 42 (2004) 83-94.
[13] T. Wajima and K. Sugawara, Adsorption behaviors of mercury from aqueous
solution using sulfur-impregnated adsorbent developed from coal, Fuel
Processing Technology, 92 (2011) 1322-1327.

160 Capítulo III
[14] M. Mullett, P. Pendleton, and A. Badalyan, Removal of elemental mercury from
Bayer stack gases using sulfur-impregnated activated carbons, Chemical
Engineering Journal, 211-212 (2012) 133-142.
[15] S. Furmaniak, P. Kowalczyk, A.P. Terzyk, P.A. Gauden, and P.J.F. Harris,
Synergetic effect of carbon nanopore size and surface oxidation on CO2 capture
from CO2/CH4 mixtures, Journal of Colloid and Interface Science, 397 (2013)
144-153.
[16] I. Matos, P.D. Neves, J.E. Castanheiro, E. Perez-Mayoral, R. Martin-Aranda, C.
Duran-Valle, J. Vital, A.M. Botelho do Rego, and I.M. Fonseca, Mesoporous
carbon as an efficient catalyst for alcoholysis and aminolysis of epoxides,
Applied Catalysis A: General, 439-440 (2012) 24-30.
[17] S. Morales-Torres, F.J. Maldonado-Hódar, A.F. Pérez-Cadenas, and F. Carrasco-
Marín, Design of low-temperature Pt-carbon combustion catalysts for VOC's
treatments, Journal of Hazardous Materials, 183 (2010) 814-822.
[18] A.R. Silva, C. Freire, B. de Castro, M.M.A. Freitas, and J.L. Figueiredo,
Anchoring of a nickel(II) Schiff base complex onto activated carbon mediated
by cyanuric chloride, Microporous & Mesoporous Materials, 46 (2001) 211-
221.
[19] M.A. Montes-Morán, D. Suárez, J.A. Menéndez, and E. Fuente, On the nature of
basic sites on carbon surfaces: an overview, Carbon, 42 (2004) 1219-1225.
[20] C. Moreno-Castilla, F. Carrasco-Marín, F.J. Maldonado-Hódar, and J. Rivera-
Utrilla, Effects of non-oxidant and oxidant acid treatments on the surface
properties of an activated carbon with very low ash content, Carbon, 36 (1998)
145-151.
[21] A. Montoya, F. Mondragón, and T.N. Truong, Formation of CO precursors
during char gasification with O2, CO2 and H2O, Fuel Processing Technology,
77-78 (2002) 125-130.
[22] L.R. Radovic L R, The mechanism of CO2 chemisorption on zigzag carbon
active sites: A computational chemistry study, Carbon, 43 (2005) 907-915.

Capítulo III 161
[23] C. Moreno-Castilla, M.A. Ferro-Garcia, J.P. Joly, I. Bautista-Toledo, F.
Carrasco-Marin, and J. Rivera-Utrilla, Activated Carbon Surface Modifications
by Nitric Acid, Hydrogen Peroxide, and Ammonium Peroxydisulfate
Treatments, Langmuir, 11 (1995) 4386-4392.
[24] C. Moreno-Castilla, M.V. López-Ramón, and F. Carrasco-Marín, Changes in
surface chemistry of activated carbons by wet oxidation, Carbon, 38 (2000)
1995-2001.
[25] R.G. Bansal, J.B. Donnet, and F. Stoeckli, Activated Carbon, Marcel Dekker,
New York and Basel, 1988.
[26] F. Stoeckli, Porosity in carbon. Characterization and applications. Eds. Patrick
J. Arnold, London, 1995.
[27] E.P. Barrett, L.G. Joyner, and P.P. Halenda, The Determination of Pore Volume
and Area Distributions in Porous Substances. I. Computations from Nitrogen
Isotherms, Journal of the American Chemical Society, 73 (1951) 373-380.
[28] A.V. Neimark, Y. Lina, I. Peter, P.I. Ravikovitchb, and M. Thommes, Quenched
solid density functional theory and pore size analysis of micro-mesoporous
carbons, Carbon 47 (2009) 1617 1628.
[29] F. Duarte, F.J. Maldonado-Hodar, and L.M. Madeira, Influence of the
characteristics of carbon materials on their behaviour as heterogeneous Fenton
catalysts for the elimination of the azo dye Orange II from aqueous solutions,
Applied Catalysis B: Environmental, 103 (2011) 109 115.
[30] J.L. Figueiredo, M.F.R. Pereira, M.M.A. Freitas, and J.J.M. Órfão, Modification
of the surface chemistry of activated carbons, Carbon, 37 (1999) 1379-1389.
[31] A.F. Pérez-Cadenas, F.J. Maldonado-Hódar, and C. Moreno-Castilla, On the
nature of surface acid sites of chlorinated activated carbons, Carbon, 41 (2003)
473-478.
[32] E. Desimoni, G.I. Casella, and A.M. Salvi. XPS/XAES study of carbon fibres
during thermal annealing under UHV conditions, Carbon, 30 (1992) 521-526.
[33] C.A. Leon, J.M. Solar, V. Calemma, and L.R. Radovic, Evidence for the
protonation of basal plane sites on carbon, Carbon, 30 (1992) 797-811.

162 Capítulo III
[34] R. Ubago-Pérez, F. Carrasco-Marín, D. Fairén-Jiménez, and C. Moreno-Castilla,
Granular and monolithic activated carbons from KOH-activation of olive stones,
Microporous and Mesoporous Materials, 92 (2006) 64-70.
[35] M. Molina-Sabio and F. Rodríguez-Reinoso, Role of chemical activation in the
development of carbon porosity, Colloids and Surfaces A: Physicochemical and
Engineering Aspects, 241 (2004) 15-25.
[36] D. Cazorla-Amorós, J. Alcañiz-Monge, M.A. Casa-Lillo, and A. Linares-Solano,
CO2 as an Adsorptive To Characterize Carbon Molecular Sieves and Activated
Carbons, Langmuir, 14 (1998) 4589-4596.
[37] Y. Matsumura, Production of acidified active carbon by wet oxidation and its
carbon structure, Journal of Applied Chemistry & Biotechnology, 25 (1975) 39-
56.
[38] Z. Du, A.F. Sarofim, and J.P. Longwell, Activation energy distribution in
temperature-programmed desorption: modeling and application to the soot
oxygen system, Energy & Fuels, 4 (1990) 296-302.
[39] X. Xu, J. Zhu, J.L. Faria, J. Li, and J.L. Figueiredo, Tuning the textural and
surface properties of carbon xerogels to be used as supports for gold catalysts,
Central European Journal of Chemistry, 10 (2012) 1867-1874.
[40] P.V. Samant, F. Goncalves, M.M.A. Freitas, M.F.R. Pereira, and J.L.
Figueiredo, Surface activation of a polymer based carbon, Carbon, 42 (2004)
1321 1325
[41] V. Gómez-Serrano, F. Piriz-Almeida, C.J. Durán-Valle, and J. Pastor-Villegas,
Formation of oxygen structures by air activation. A study by FT-IR
spectroscopy, Carbon, 37 (1999) 1517 1528.
[42] Y. Otake and R.G. Jenkins, Characterization of oxygen-containing surface
complexes created on a microporous carbon by air and nitric acid treatment,
Carbon, 31 (1993) 109-121.
[43] B. Marchon, J. Carrazza, H. Heinemann, and G.A. Somorjai, TPD and XPS
studies of O2, CO2, and H2O adsorption on clean polycrystalline graphite,
Carbon, 26 (1988) 507-514.

Capítulo III 163
[44] F. Carrasco-Marin, J. Rivera-Utrilla, J.P. Joly, and C. Moreno-Castilla, Effects
of ageing on the oxygen surface complexes of an oxidized activated carbon,
Journal of the Chemical Society, Faraday Transactions, 92 (1996) 2779-2782.
[45] H. Marsh, D.A. Taylor, and J.R. Lander, Kinetic study of gasification by oxygen
and carbon dioxide of pure and doped graphitizable carbons of increasing heat
treatment temperatures, Carbon, 19 (1981) 375-381.
[46] P.J. Hall and J.M. Calo, Secondary Interactions upon Thermal Desorption of
Surface Oxides from Coal Chars, Energy & Fuels, 3 (1989) 370-376.


Capítulo IV TAILORING ACTIVATED CARBONS
FOR THE DEVELOPMENT OF SPECIFIC
ADSORBENTS OF GASOLINE VAPORS


TAILORING ACTIVATED CARBONS FOR THE
DEVELOPMENT OF SPECIFIC ADSORBENTS OF
GASOLINE VAPORS
Article published in J. of Hazardous Materials, 263, Part 2, (2013) 533-540, doi: 10.1016/j.jhazmat.2013.10.012
Highlights
High performance adsorbents of gasoline vapors as have been developed.
The influence of their surface chemistry and porosity was determined.
Ethanol adsorption is favored by specific interactions with carboxylic groups.
VOC’ diffusion is favored by mesopores and the adsorption capacity by micropores.
The VOC’ adsorbed is totally recovered by thermal regeneration.
Abstract
The specific adsorption of oxygenated and aliphatic gasoline components onto activated carbons (ACs) was studied under static and dynamic conditions. Ethanol and n-octane were selected as target molecules. A highly porous activated carbon (CA) was prepared by means of two processes: carbonization and chemical activation of olive stone residues. Different types of oxygenated groups, identified and quantified by TPD and XPS, were generated on the CA surface using an oxidation treatment with ammonium peroxydisulfate and then selectively removed by thermal treatments, as confirmed by TPD results. Chemical and porous transformations were carefully analyzed throughout these processes and related to their VOC removal performance. The analysis of the adsorption process under static conditions and the thermal desorption of VOCs enabled us to determine the total adsorption capacity and regeneration possibilities. Breakthrough curves obtained for the adsorption process carried out under dynamic conditions provided information about the mass transfer zone in each adsorption bed. While n-octane adsorption is mainly determined by the porosity of activated carbons, ethanol adsorption is related to their surface chemistry, and in particular is enhanced by the presence of carboxylic acid groups. Keywords: Activated carbons, surface chemistry, porosity, VOC adsorption, thermal desorption, breakthrough curves. complexes.


Capítulo IV 169
4.1. INTRODUCTION
The control of volatile organic compound (VOC) emissions is today one of the
most difficult environmental challenges. VOC emissions are produced in many
different industrial or domestic processes causing serious damage to health, materials
and the environment. Both destructive (oxidation) and recovery (adsorption,
condensation) techniques are described in the bibliography1-5 depending on the source
of the VOC and its concentration. Emissions associated with the use of fuels in vehicles
are of particular importance and there is a clear need to develop effective technologies
and strategies to improve the quality of the air we breathe. A lot of research has been
done for example on improvements to tailpipes for exhaust gas decontamination6,7.
Wang et al.8 identified a total of 57 individual VOCs in the exhaust gas of gasoline
vehicles.
Historically, less attention has been paid to evaporative emissions produced
during fuel storage and/or transfer. Nevertheless, a number of papers have been
published also on this topic9,10. For example, Yamada quantified evaporative emissions
as the sixth highest source of VOC in Japan, with 4.6 % of total VOC emissions9.
Specific devices (canisters) for adsorbing VOCs have been developed, which mainly
use activated carbons as the adsorbent11-13. Furthermore, the American Petroleum
Institute (API) has continuously pointed out the effects of these vapors on the
environment, health and safety14, analyzing tank and pipeline regulations to ensure the
safe transport, storage and disposal of gasoline.
In recent years there has also been increasing interest in ethanol-based fuels all
over the world. The addition of ethanol to gasoline is interesting from an environmental
and economic point of view since it can be produced from biomass. Moreover, ethanol
is added to gasoline as an anti-knock agent because it is less harmful than MTBE and
ETBE. However, the presence of ethanol in fuels is the subject of controversy, since
some studies have proved that ethanol-based fuels produce larger quantities of
evaporative emissions15,16.
170 Capítulo IV
Some empirical models have been developed in order to estimate evaporative
emissions from canister-equipped vehicles9-12. These models considered several factors
such as vehicle design (tanks), ambient temperature, driving conditions, or gasoline
volatility13 but there is a lack of experimental confirmation of the relationship between
canister performance, gasoline composition and the characteristics of the adsorbent, as
indicated by Yamada9. Activated carbons (ACs) are the most widely used adsorbent
due to the fact that both their porous and chemical nature can be easily tailored.
Moreover, cheap ACs can be produced from raw materials such as agricultural
residues2,5,17,18. In comparison, zeolites are about ten times more expensive19.
In this work, we prepared a series of ACs from olive stones. We developed the
porous texture by chemical activation and modified the surface chemistry by means of a
severe oxidation process. After that, a selective removal of oxygenated surface groups
was performed in order to find out more about specific VOC-AC interactions, which
may affect the adsorption and regeneration capacities. Ethanol and n-octane were
selected as target VOCs because they are the main components of gasoline and have
different chemical natures (ethanol is hydrophilic and n-octane is hydrophobic). Finally
we correlated the evolution of porosity and chemical surface characteristics for these
activated carbons with their ethanol and n-octane adsorption performance under static
and dynamic conditions.
4.2. MATERIALS AND METHODS
4.2.1. Activated carbon synthesis by KOH activation
Olive stones were milled and sieved to 1.0 – 2.0 mm, treated with sulfuric acid
(1 N) in order to remove any remains of the pulp and then washed until all sulfates had
been removed. A two-stage activation procedure was designed: initially, olive stones
were carbonized at 400 ºC for two hours under a nitrogen flow (300 cm3 min-1) and then
the char obtained was chemically activated using a mixture of char and KOH in a 1:7
mass ratio. This mixture was treated under nitrogen flow (300 cm3 min-1) for 2 h at 350

Capítulo IV 171
ºC followed by 3 h at 850 ºC (heating rate 10 ºC min-1). The sample was kept under
nitrogen atmosphere while it was cooled to room temperature. Finally, it was treated
with HCl and HF, which also removed the excess base (KOH), washed with distilled
water till all chlorides had been removed and dried in an oven at 110 ºC for 24 h before
storage. This sample was called CA.
4.2.2. Chemical surface modifications
Ammonium peroxydisulfate ((NH4)2S2O8) was chosen as the oxidizing agent20.
CA was mixed with a saturated solution of this salt on H2SO4 1 M. After 24 h under
stirring at room temperature, oxidized carbon was filtered and washed with distilled
water several times until all sulfates had been removed. This material was dried at 110
ºC and labeled as CAOX. Thermal treatments under nitrogen atmosphere (150 cm3 min-
1) at 300 ºC, 500 ºC and 700 ºC (10 min, 20 ºC min-1) were carried out on different
portions of CAOX in order to selectively remove oxygenated surface groups (OSG).
These samples were labeled as CAOX300, CAOX500 and CAOX700.
4.2.3. Textural Characterization
The corresponding N2 and CO2 adsorption isotherms at -196 ºC and 0 ºC were
obtained using an AUTOSORB 1 (QUANTACHROME Ins.) instrument. Parameters
such as BET surface area, micropore volume (W0) and micropore mean width (L0) were
calculated by applying BET, Dubinin-Radushkevich and Stoeckli equations to
isotherms21,22. Pore size distribution (PSD) curves were obtained by DFT or BJH
derived methods23,24. Mesopore volume (Vmeso) was estimated considering the total
pore volume as the volume of nitrogen adsorbed at a relative pressure P/P0 = 0.95
(V0.95). Therefore, Vmeso was obtained from the difference between V0.95 and W0 (N2).
Mercury pycnometry was carried out in order to determine the apparent density of
samples. In preparation for this procedure, samples were previously degasified at 110
ºC under dynamic vacuum (10-3 Torr).

172 Capítulo IV
4.2.4. Chemical Characterization
Thermal Programmed Desorption (TPD) curves of carbon monoxide and
carbon dioxide were recorded. The analysis of TPD profiles enabled us to quantitatively
determine the total oxygen content and the number of different oxygenated groups. The
assignment of these groups was based on the bibliography25-28. Experiments were
carried out by heating around 150 mg of sample at 50 K min-1 up to 1273 K using He as
the carrier gas (60 cm3 min-1). The analysis of desorbed gases was performed with a
Mass Spectrometer model Prisma (Pfeiffer).
X-ray photo emission spectra (XPS) were recorded using a Kratos Axis Ultra-
DLD spectrometer. As a radiation source this instrument uses MgKα (h = 1253.6 eV)
and a hemispheric electron analyzer operating at 12 kV and 10 mA. Since we wanted to
quantify total oxygen content, we analyzed regions for C1s and O1s. The deconvolution
of spectra and the assignment of bands were also performed according to the
bibliography28,29.
Zero-point charge pH (pHZPC) of samples was determined with the method
proposed by Leon et al.30. Approximately 250 mg of each sample were suspended on 4
mL of distilled water previously degasified. Suspensions were stirred and thermostated
at 25 ºC measuring the pH periodically until readings were constant. The final pH
obtained this way was considered as the pHZPC for each sample.
4.2.5. VOC adsorption
4.2.5.1. Static adsorption
Ethanol and n-octane static adsorption experiments were carried out by
exposing 0.050 g of each sample, previously dried at 110 ºC, in a desiccator containing
ethanol (absolute ethanol, Panreac) or n-octane (octane ≥99% GC, Sigma-Aldrich) at
room temperature (≈ 25 ºC) (P0 = 57 and 16 Torr respectively). In these experiments,
samples were placed in a saturated atmosphere of the organic vapor until equilibrium
was reached, and then the total adsorption capacity of the samples was determined3,4.

Capítulo IV 173
Samples were weighed daily till constant weight by using a Denver Instruments SI-234
balance with an accuracy of 0.1 mg. VOC desorption was studied by DSC and TG with
a METTLER-TOLEDO TGA/DSC1, heating VOC-saturated samples under N2 flow
(60 cm3 min-1) to 500 and 950 ºC respectively (10 ºC min-1). Desorbed amounts of
VOC and desorption energies were determined and correlated with the textural and
chemical characteristics of the samples.
4.2.5.2. Dynamic adsorption
Breakthrough curves were determined by using the instrumental set-up
described in Fig. 1. Breakthrough columns consist of a U-shaped reactor (0.4 cm inner
diameter) containing 0.1 g of adsorbent fixed bed. ACs were pretreated at 200 ºC under
He flow (60 cm3 min-1) for one hour, and then, breakthrough adsorption curves were
obtained at controlled temperature by changing from a He flow to an air/VOC flow (60
cm3 min-1, 480 ppm n-octane or 560 ppm ethanol). VOC concentration was fitted by
bubbling the air flow through liquid VOC at 0 ºC and diluting with pure air in the
appropriate proportion. VOC concentration was determined by a Gas Chromatograph
CP-3800 (VARIAN) equipped with a Carbowax-20M column and FID detection.
Figure 4.1. a) Mass flux controllers for He and air flows b) VOC reservoir c) Cryostat
d) AC column e) Gas chromatograph f) Waste trap.
The analysis of breakthrough curves was performed using the mass transfer
zone (MTZ) concept31,32. Different parameters may be determined from the analysis of
breakthrough curves: breakthrough (V0.02) and saturation (V0.90) points that are defined
25ºC
a
b
c
d
e
f
a

174 Capítulo IV
as eluted volumes when the VOC concentration at the column exit reached values of 2
and 90% of the initial VOC concentration (expressed as time on stream or volume
treated), the amount adsorbed at these points X0.02 and X0.90, the mass transfer zone
height (HMTZ) and the rate at which MTZ moved forward (RMTZ).
The mass transfer zone (MTZ) and the mass transfer zone height (HMTZ) are
defined as the region of the bed within which the adsorption process is taking place.
MTZ is therefore located between the saturated part of the bed and the clean part. This
means that there is a VOC concentration gradient which moves with the MTZ along the
adsorbent bed to the end column. Diffusion and adsorption are happening at the same
time. Therefore, values of HMTZ are smaller for rapid adsorption than for slow
adsorption. The calculation of this parameter was carried out by applying the following
equation described in the bibliography33:
Where V0.02 and V0.90 have been already defined, h is the height of the
adsorption bed and is the fractional capacity which is related to the efficiency of the
adsorption process within the MTZ and is calculated using the equation shown above
on the right.
As adsorption occurs, part of the adsorbent is saturated and the MTZ moves
forward, so enabling us to calculate the mass transfer zone displacement rate (RMTZ).
This is done by multiplying HMTZ by the flow rate and then dividing by the difference
between breakthrough and saturation volumes.
4.3. RESULTS AND DISCUSSION
4.3.1. Textural Characterization
The textural characteristics of the samples were determined by analyzing N2
and CO2 adsorption isotherms. The results are summarized in Table 4.1 and the PSD

Capítulo IV 175
obtained from N2 adsorption isotherms (QSDFT analysis) is shown in Fig. 4.2. The
high KOH:carbon ratio led to a high activation degree (44 % wt.). The original CA
therefore showed a high micro/mesopore volume and surface area values (Table 4.1).
CA oxidation led to the destruction of about 50 % of porosity (V 0.95). This explains the
big difference in apparent density between the two samples (CA, 0.20 g cm-3 and
CAOX, 0.41 g cm-3). After thermal treatments this parameter slowly decreased.
Textural transformations clearly took place above all within the mesopore
range (Fig. 4.2 and Table 4.1). The original PSD of the CA sample presents a maximum
for mesopores with diameters between 2.8 - 3.0 nm and a maximum for micropores of
around 0.8 nm in diameter, indicated in the latter case by the small peak of the PSD
curve.
0.0
2.0
4.0
6.0
0 2 4 6
w (nm)
dV
(dlo
gw
) (c
m3/n
mg
)
0.0
2.0
4.0
6.0
0 2 4 6
w (nm)
dV
(dlo
gw
) (c
m3/n
mg
)
Figure 4.2. Pore size distributions obtained by applying the QSDFT method to the
corresponding N2 adsorption isotherm. CA (blue), CAOX (red), CAOX300 (green),
CAOX500 (black), CAOX700 (brown).
Original mesopores were destroyed by the oxidation process and transformed
into macropores (not detected by N2 adsorption). The pore destruction becomes
progressively smaller as pore size decreases: Vmeso decreases by 52 % and, at the
micropore range, W0 (N2) decreases by 32 % while the narrowest micropores, W0
(CO2), determined by CO2 adsorption34, increase by around 10 %. This pore volume
reduction also leads to a drastic reduction of SBET from 2387 to 1661 m2 g-1.
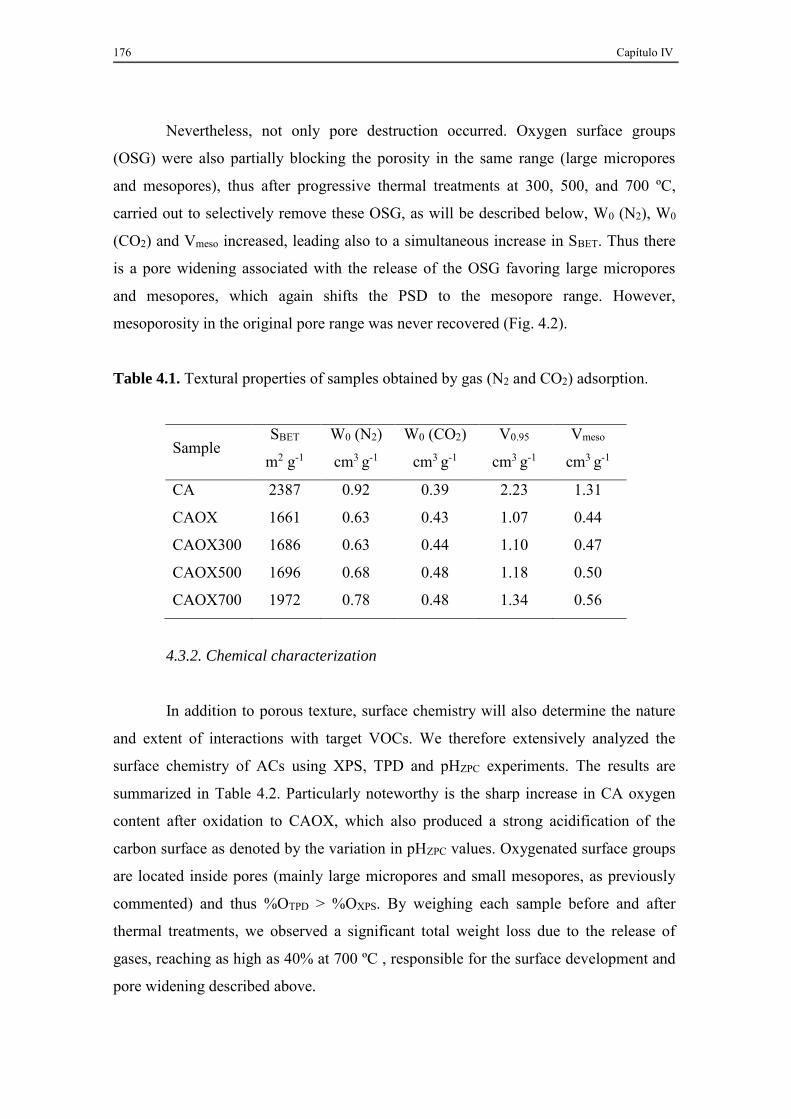
176 Capítulo IV
Nevertheless, not only pore destruction occurred. Oxygen surface groups
(OSG) were also partially blocking the porosity in the same range (large micropores
and mesopores), thus after progressive thermal treatments at 300, 500, and 700 ºC,
carried out to selectively remove these OSG, as will be described below, W0 (N2), W0
(CO2) and Vmeso increased, leading also to a simultaneous increase in SBET. Thus there
is a pore widening associated with the release of the OSG favoring large micropores
and mesopores, which again shifts the PSD to the mesopore range. However,
mesoporosity in the original pore range was never recovered (Fig. 4.2).
Table 4.1. Textural properties of samples obtained by gas (N2 and CO2) adsorption.
Sample SBET
m2 g-1
W0 (N2)
cm3 g-1
W0 (CO2)
cm3 g-1
V0.95
cm3 g-1
Vmeso
cm3 g-1
CA 2387 0.92 0.39 2.23 1.31
CAOX 1661 0.63 0.43 1.07 0.44
CAOX300 1686 0.63 0.44 1.10 0.47
CAOX500 1696 0.68 0.48 1.18 0.50
CAOX700 1972 0.78 0.48 1.34 0.56
4.3.2. Chemical characterization
In addition to porous texture, surface chemistry will also determine the nature
and extent of interactions with target VOCs. We therefore extensively analyzed the
surface chemistry of ACs using XPS, TPD and pHZPC experiments. The results are
summarized in Table 4.2. Particularly noteworthy is the sharp increase in CA oxygen
content after oxidation to CAOX, which also produced a strong acidification of the
carbon surface as denoted by the variation in pHZPC values. Oxygenated surface groups
are located inside pores (mainly large micropores and small mesopores, as previously
commented) and thus %OTPD > %OXPS. By weighing each sample before and after
thermal treatments, we observed a significant total weight loss due to the release of
gases, reaching as high as 40% at 700 ºC , responsible for the surface development and
pore widening described above.

Capítulo IV 177
Table 4.2. Chemical characteristics of samples from TPD, XPS and pHZPC analyses.
Sample WL
%
CO
μmol g-1
CO2
μmol g-1
OTPD
%
OXPS
% pHZPC
CA - 1160 150 2.3 1.7 7.5
CAOX - 3680 3010 15.5 9.3 2.4
CAOX300 20 5070 2110 14.9 7.0 2.9
CAOX500 24 6030 1370 14.0 5.6 3.0
CAOX700 40 680 110 1.4 1.4 7.8
Information about the chemical nature of the OSG present in each sample was
obtained by analyzing TPD profiles (Fig. 4.3). This is because OSG are evolved at
different temperature ranges and can therefore be identified and quantified (Table 4.2).
The highest peak in the CO2 profile of sample CAOX is located at 278 ºC and is
attributed to the release of carboxylic acid groups. The strong shoulder at 450 ºC and
the long tail of the CO2-profile indicate that other CO2-evolving groups, such as
anhydrides and lactones, are present. Anhydrides may be formed from the dehydration
of two neighboring carboxylic groups. Maximum CO-desorption takes place at 555 ºC,
but this peak is very wide and has a long tail. This means that different CO-evolving
groups may also be present. According to previous studies, phenols25-27 evolve between
600-700 ºC, ether groups at around 700 ºC, carbonyls between 800-900 ºC and more
stable chromenes at around 1000 ºC. However, Marchon35 tentatively assigned different
peaks and the CO-profile shoulder to semiquinone functional groups on energetically
different sites.

178 Capítulo IV
Figure 4.3. TPD curves for CO2 (a) and CO (b). CA (blue), CAOX (red), CAOX300
(green), CAOX500 (black), CAOX700 (brown).
As published in a previous paper27 oxygenated surface groups are selectively
removed at different temperature ranges, and the oxygen content decreases linearly as
the treatment temperature increases. Nevertheless, it is important to note the
exceptional behavior of CAOX after treatments between 300 ºC and 500 ºC. Thus, as
can be seen in Table 4.2, %OXPS progressively decreases in contrast to %OTPD, which
remains practically unchanged at this temperature range. After treatments at 700 ºC, the
oxygen content fell sharply and CAOX700 showed a similar surface chemistry to the
original CA. Therefore, there is a dramatic reorganization of OSG inside the pores in
the 300 – 500 ºC range. It is remarkable that even at the lower temperature (300 ºC), the
0
4
8
12
16
20
0 200 400 600 800 1000
T (ºC)
F (
µm
ol/g
ºC
)
(a)
0
4
8
12
16
20
0 200 400 600 800 1000T (ºC)
F (
µm
ol/g
ºC
)
(b)
Capítulo IV 179
treatment is strong enough to completely eliminate the carboxylic acid groups present
in the CAOX sample (Fig. 4.3). CO2 evolved in this process from both CAOX300 and
CAOX500 is mainly reincorporated forming CO-evolving groups (semiquinone) that
are also progressively more stable, as indicated by the CO-peak shifting to higher
temperatures.
4.3.3. Adsorption of n-octane and ethanol
4.3.3.1. Static adsorption
The objective of this study was to develop specific traps for VOCs. Adsorption
capacities determined under static conditions at 25 ºC are summarized in Table 4.3.
Results are expressed as liquid volume, considering n-octane and ethanol density values
as 0.703 and 0.791 g cm-3 respectively, to facilitate correlations with pore volumes. It is
interesting to note that these adsorption values are a very good match for the total pore
volume (V0.95) of the samples. It is also noteworthy that the adsorption values for our
samples are significantly higher than for other adsorbents36, including activated
carbons37. Thus, for example, BASF activated carbon with a micropore volume of 0.39
cm3 g-1 and a macropore volume of 0.31 cm3 g-1 has an ethanol adsorption capacity of
0.43 cm3 g-1 at a relative pressure of 0.9 and 25 ºC37. In our case, the ethanol adsorption
capacity of CA was enhanced by the presence of mesopores (instead of macroporosity
on BASF carbon), in agreement with previously observed results3 for toluene
adsorption. The developed porosity of the CA sample favors both the higher adsorption
capacities and the desorption energies (Ed), determined from DSC-experiments, of the
samples series (Table 4.3). n-octane adsorption seems to be favored compared to
ethanol adsorption by the mainly hydrophobic character of the carbon surface, which
means that Ed is smaller.
The adsorption capacity decreases for both ethanol and octane after oxidation
due to the huge porosity destruction mentioned earlier. The hydrophilic surface of
CAOX now favors ethanol adsorption relative to n-octane, Ed takes the maximum value
of the samples series for ethanol adsorption, and the minimum value for n-octane
adsorption. Curiously, sample CAOX presents a higher adsorption capacity (for both
180 Capítulo IV
ethanol and octane) than CAOX300. Given that they have similar textural properties
(Table 4.1), the decrease in adsorption capacity must therefore be associated with
chemical transformations (i.e. the release of carboxylic acid groups). Simultaneously,
there is a sharp fall in the ethanol desorption energy (Ed), while the contrary effect is
observed for octane. Thus carboxylic acids clearly favor interactions with ethanol and
make those with n-octane more difficult. The CAOX300 and CAOX500 samples
showed quite similar adsorption/desorption characteristics based on a similar total
oxygen content (%OTPD) and pHZPC. This means that despite the substantial
reorganization of OSG that takes place in these samples (decomposition of labile CO2-
evolving groups and formation of more stable CO-evolving groups, Table 4.2),
interactions between adsorbates and these new OSG are less specific than those
previously commented for carboxylic acid groups. When the treatment temperature is
increased to 700 ºC, the pore opening and the increase in surface area again enhance the
adsorption capacity of the samples.
There is also a good match between the adsorbed and desorbed amounts. This
shows that the thermal regeneration of samples is effective and consequently that they
can be reused in subsequent adsorption-desorption cycles. VOC desorption was carried
out by heating during TG-experiments, and as a result OSG were simultaneously
evolved, which could influence these results. In order to avoid these interferences, we
also analyzed fresh samples, and the VOCs desorbed in the temperature range in fresh
samples were shown to be thermally stable in terms of weight loss. Fig. 4.4 shows some
of the TG profiles for VOC desorption including the corresponding fresh samples.
As can be observed in Fig. 4.4, the CA samples saturated with ethanol (Fig.
4.4a) and with n-octane (Fig. 4.4e) both suffer a severe weight loss (WL) at low
temperature, followed by a large plateau. Fresh CA shows good thermal stability up to
around 550 ºC. The amount of CO2 released is low and the observed WL above this
temperature is due mainly to the release of CO-evolving groups (Fig. 4.3), with the two
curves more or less parallel. VOC desorption is therefore associated exclusively with
the first part of the TG profile, where the WL is not influenced by OSG release.
Consequently, the saturated sample can be regenerated at low temperature. It should
also be pointed out however that the CAOX sample has the weakest OSG and the

Capítulo IV 181
strongest interactions with ethanol. This sample is only stable up to around 200 ºC,
from which the WL observed for the fresh sample (Fig. 4.4) is primarily due to the
elimination of carboxylic groups (Fig. 4.3). Nevertheless, ethanol desorption clearly
finished before the carboxylic groups were eliminated (Fig. 4.4b), and the TG profile of
the saturated sample shows a small plateau between 150 – 200 ºC. The amount of
ethanol desorbed from the CAOX sample decreases compared to that from CA, as
mentioned above. Nevertheless, desorption occurs within a large temperature range, as
a consequence of interactions between EtOH-carboxylic acid groups. In this case, the
sample regeneration should be carried out carefully at temperatures of less than 200 ºC
in order to preserve carboxylic groups which, as previously described, enhance the
EtOH adsorption capacity. The small plateau detected for saturated CAOX becomes
progressively larger when the pretreatment temperature increases (Fig. 4.4 c and d), and
in all cases, the WL curves associated to the OSG run quite parallel to each other in
fresh and saturated samples. DSC profiles for the ethanol desorption from certain
selected samples are also included in Fig. 4. The desorption process is obviously
endothermic, the DSC-peak of CAOX saturated samples shows a long tail at higher
temperatures, due to the interaction of ethanol with carboxylic groups, which falls
significantly after the treatment at 300 ºC (CAOX300).
Table 4.3. Adsorbed amounts of ethanol and n-octane at saturation under static
conditions and the amounts desorbed by thermal treatments.
ethanol n-octane
Sample Adsorbed
(cm3g-1)
Desorbed
(cm3g-1)
Ed
(kJ mol-1)
Adsorbed
(cm3g-1)
Desorbed
(cm3g-1)
Ed
(kJ mol-1)
CA 2.35 2.04 61.1 2.60 1.99 23.5
CAOX 1.61 1.37 62.3 1.22 1.18 7.5
CAOX300 1.07 1.05 48.2 0.86 0.85 18.8
CAOX500 1.11 1.18 49.2 0.85 0.81 19.9
CAOX700 1.28 1.31 38.1 1.12 1.11 12.5

182 Capítulo IV
-2500
-2000
-1500
-1000
-500
0
0 500 1000
T (ºC)
TG
(m
g/g
C)
(a) CA
-2500
-2000
-1500
-1000
-500
0
0 500 1000
T (ºC)
TG
(m
g/g
C)
(b) CAOX
-2500
-2000
-1500
-1000
-500
0
0 500 1000
T (ºC)
TG
(m
g/g
C)
(c) CAOX300
-2500
-2000
-1500
-1000
-500
0
0 500 1000
T (ºC)
TG
(m
g/g
C)
(d) CAOX700
-4
-3
-2
-1
0
1
2
3
0 200 400T (ºC)
W (
mW
/mg
C)
(f)-2500
-2000
-1500
-1000
-500
0
0 500 1000
T (ºC)
TG
(m
g/g
C)
(e) CA
-2500
-2000
-1500
-1000
-500
0
0 500 1000
T (ºC)
TG
(m
g/g
C)
(a) CA
-2500
-2000
-1500
-1000
-500
0
0 500 1000
T (ºC)
TG
(m
g/g
C)
(b) CAOX
-2500
-2000
-1500
-1000
-500
0
0 500 1000
T (ºC)
TG
(m
g/g
C)
(c) CAOX300
-2500
-2000
-1500
-1000
-500
0
0 500 1000
T (ºC)
TG
(m
g/g
C)
(d) CAOX700
-4
-3
-2
-1
0
1
2
3
0 200 400T (ºC)
W (
mW
/mg
C)
(f)-2500
-2000
-1500
-1000
-500
0
0 500 1000
T (ºC)
TG
(m
g/g
C)
(e) CA
Figure 4.4. TG profiles of fresh (dash line) and VOC-saturated (a,b,c,d – ethanol, e -
octane) samples (solid line). (f) DSC curves for ethanol desorption.
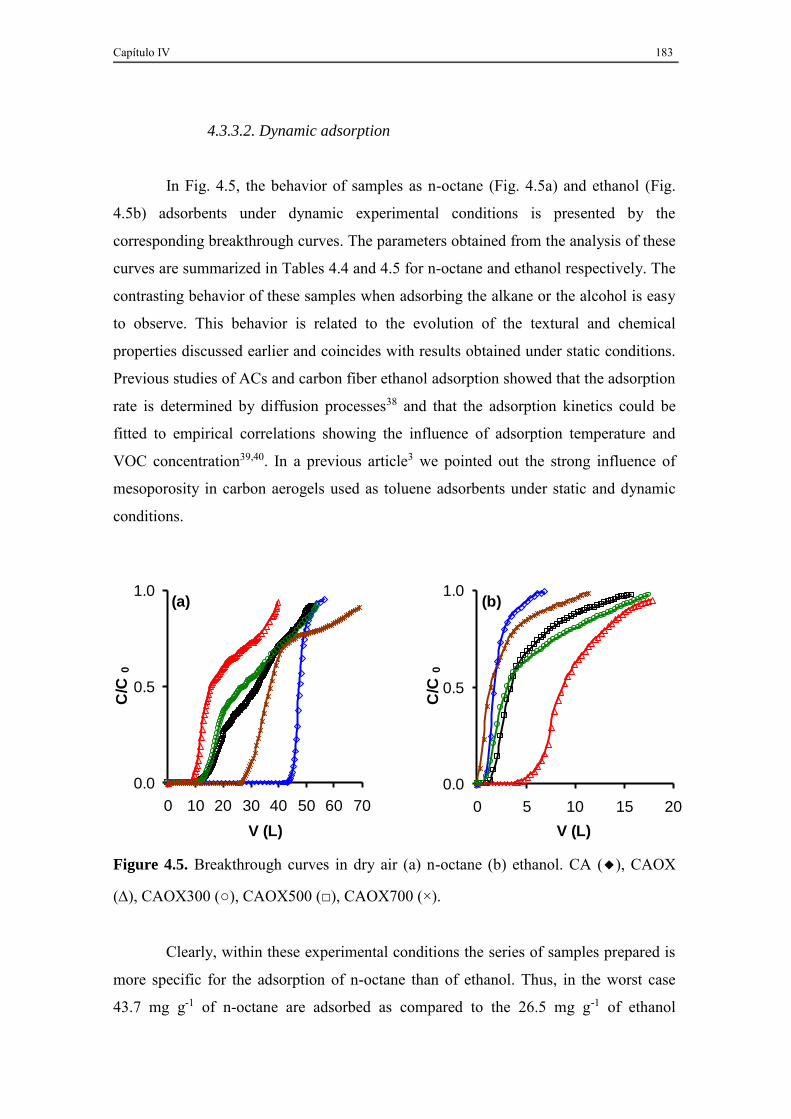
Capítulo IV 183
4.3.3.2. Dynamic adsorption
In Fig. 4.5, the behavior of samples as n-octane (Fig. 4.5a) and ethanol (Fig.
4.5b) adsorbents under dynamic experimental conditions is presented by the
corresponding breakthrough curves. The parameters obtained from the analysis of these
curves are summarized in Tables 4.4 and 4.5 for n-octane and ethanol respectively. The
contrasting behavior of these samples when adsorbing the alkane or the alcohol is easy
to observe. This behavior is related to the evolution of the textural and chemical
properties discussed earlier and coincides with results obtained under static conditions.
Previous studies of ACs and carbon fiber ethanol adsorption showed that the adsorption
rate is determined by diffusion processes38 and that the adsorption kinetics could be
fitted to empirical correlations showing the influence of adsorption temperature and
VOC concentration39,40. In a previous article3 we pointed out the strong influence of
mesoporosity in carbon aerogels used as toluene adsorbents under static and dynamic
conditions.
Figure 4.5. Breakthrough curves in dry air (a) n-octane (b) ethanol. CA (◆), CAOX
(), CAOX300 (○), CAOX500 (□), CAOX700 (×).
Clearly, within these experimental conditions the series of samples prepared is
more specific for the adsorption of n-octane than of ethanol. Thus, in the worst case
43.7 mg g-1 of n-octane are adsorbed as compared to the 26.5 mg g-1 of ethanol
0.0
0.5
1.0
0 10 20 30 40 50 60 70
V (L)
C/C
0
(a)
0.0
0.5
1.0
0 5 10 15 20
V (L)
C/C
0
(b)

184 Capítulo IV
adsorbed in the best case at the breakthrough point. Under these experimental
conditions, the porosity involved in the adsorption processes is different than under
static conditions, because of the smaller P/P0, thus the volume of n-octane adsorbed
approximately matches W0(CO2) for CA and CAOX700 samples. These results agree
with those observed by other authors2. The adsorption capacity strongly decreases for
CAOX and gradually recovers after thermal treatments (Table 4.4). In the case of
ethanol adsorption, the volume of ethanol adsorbed is significantly smaller than the
micropore volume in all cases. The fact that more ethanol was adsorbed in the CAOX
sample despite it having the smallest pore volume denotes that in this case adsorption is
enhanced by chemical interactions.
After oxidation, the hydrophilic character of the CAOX surface increases40,41,
which favors ethanol adsorption but makes n-octane adsorption more difficult. Thus,
the corresponding breakthrough curves appear before and after the original CA
adsorption curve for n-octane and ethanol respectively. There is also an important
change in terms of the curve shapes. For both pollutants the difference between
breakthrough and saturation points increased compared to CA, and the curves showed
important slope changes indicating changes in the accessibility of the pores and/or
interactions with the carbon surface. After removing the OSG, breakthrough curves
tended to return to the shape and position of the original CA curves.
The BET surface area drops by 32 % from CA to CAOX, however, n-octane
adsorption capacity decreases by about 78 % at the breakthrough point and 56% at the
saturation point, which shows the influence of surface chemistry. The smaller n-octane
- adsorbent interaction after oxidation is also indicated by an increase in the RMTZ,
which leads to an increase in the HMTZ of 500 % with regard to the CA sample.
Opposite effects are observed for ethanol adsorption: the increase of the adsorption
capacity by a factor of four and the six-fold decrease of the RMTZ are indicative of
stronger ethanol - adsorbent interactions. These results are also in line with those
previously obtained in static conditions and related with Ed variations (Table 4.3).

Capítulo IV 185
Table 4.4. Parameters obtained from the analysis of n-octane breakthrough curves.
Sample Bed Height
cm
V0.02
L
X0.02
mg g-1
V0.9
0 L
X0.90
mg g-1
HMTZ
cm
RMTZ
cm h-1
CA 6.7 43.9 206.3 52.0 223.8 0.34 0.15
CAOX 4.2 9.0 43.7 38.8 99.0 1.73 0.21
CAOX300 4.2 13.1 62.5 53.2 146.6 1.57 0.14
CAOX500 4.1 13.9 66.9 51.9 158.5 1.37 0.13
CAOX700 4.1 27.1 130.0 67.6 198.7 1.17 0.10
Table 4.5. Parameters obtained from the analysis of ethanol breakthrough curves.
Sample V0.02
L
X0.02
mg g-1
V0.90
L
X0.90
mg g-1
HMTZ
cm
RMTZ
cm h-1
CA 1.2 5.0 4.1 10.7 2.80 3.48
CAOX 4.6 26.5 15.6 53.4 1.72 0.56
CAOX300 0.9 5.2 14.0 28.4 3.02 0.83
CAOX500 1.5 8.0 11.1 25.5 2.53 0.95
CAOX700 0.2 1.2 7.0 12.0 3.80 3.80
After treatment at 300 ºC, the release of carboxylic groups strongly decreases
the adsorption of ethanol while enhancing that of n-octane. The specificity of these
groups for ethanol adsorption is pointed out by the variation of the breakthrough point,
X0.02, which decreases about fivefold (Table 4.5). It is also important to note that at this
point ethanol adsorption is favored in the case of CAOX500 compared to CAOX300.
This is probably due to the stronger regeneration capacity at this temperature of the
carboxylic acid groups evolving at 280 ºC (Fig. 4.3a). Smaller differences were
observed at the saturation point, X0.90 decreases by a half after treatment at 300 ºC, and
only drops slightly after treatment at 500 ºC, in spite of the OSG reorganization
mentioned earlier. This fact also highlights the unspecific character of CO-evolving

186 Capítulo IV
groups, in contrast to that of carboxylic groups. For CAOX700 both X0.02 and X0.90
decrease in spite of the higher SBET. The low affinity of the CAOX700 surface for
ethanol is highlighted by the sharp increase in RMTZ.
n-octane adsorption is progressively enhanced with the elimination of
oxygenated surface groups, although the n-octane adsorption capacity of CA is not
recovered. The adsorption of n-octane is mainly determined by textural characteristics
(Fig. 4.6) while ethanol adsorption is more influenced by surface chemistry (Fig. 4.7a),
namely, by the presence of carboxylic acid groups (Fig. 4.7b). The stronger the
interaction, the smaller the RMTZ and HMTZ in the corresponding fixed bed columns.
Therefore, because the performance of the trap will depend on the nature and
concentration of the VOCs and on the activated carbon porosity and surface chemistry,
the preparation of traps for gasoline vapors based on mixtures of adsorbents could be an
appropriate approach. We are currently studying this question in our laboratory, along
with those of competitive adsorption and the influence of humidity in the stream.
Figure 4.6. Variation of n-octane adsorption capacity, X0.02(•), X0.90(♦) and HMTZ (▲)
with the micropore volume of samples W0(N2).
0
50
100
150
200
250
0.5 0.7 0.9W0-N2- (cm
3/g)
X (
mg
/g)
0.0
0.5
1.0
1.5
2.0
HM
TZ
(cm
)

Capítulo IV 187
Figure 4.7. Variation of ethanol adsorption capacity. (a) Saturation point with oxygen
content and (b) Breakthrough point X0,02(•) and HMTZ (▲) with CO2 desorbed by samples
up to 300ºC.
4.4. CONCLUSIONS
A highly porous activated carbon (CA) was obtained by means of chemical
activation of carbonized olive stones. The surface chemistry was modified with an
oxidation treatment (CAOX) reaching an oxygen content of 16% wt. Different types of
oxygenated surface groups were identified by TPD and selectively removed by heating
CAOX sample proportions at different temperatures. Treatments up to 500 ºC did not
produce any significant changes in the oxygen content (determined by TPD) but OSG
varied from CO2 to CO-evolving groups. Treatment at 700 ºC prevented this OSG
reorganization, since these groups are no longer stable at this temperature, and as a
result the oxygen content fell sharply and pHZPC returned to basic values for CAOX700.
All samples performed well as ethanol and n-octane adsorbents, under both
static and dynamic conditions. Nevertheless, the two compounds have different
requirements. ACs working at a high relative pressure of VOCs under static conditions
(such as in a canister connected to the car tank) can be saturated at room temperature
using the complete porosity. Under these conditions, in spite of the fact that surface
chemistry (carboxylic groups) enhances the interactions with ethanol, the main factor is
0
5
10
15
20
25
30
0 200 400 600 800CO2 - 300 ºC (µmol/g)
X0.0
2 (
mg
/g)
1.5
2.0
2.5
3.0
3.5
4.0
HM
TZ
(cm
)
(b)
0
10
20
30
40
50
60
0 4 8 12 16%O
X0.9
0 (
mg
/g)
%OTPD
%OXPS
(a)

188 Capítulo IV
clearly its highly developed meso-microporosity. TG experiments showed that spent
adsorbents can be regenerated with oxygenated or aliphatic VOCs for these kind of
samples below 200 ºC.
The development of traps working in a stream of polluted VOCs at low
concentration (ppm) requires only highly microporous samples. The surface
functionalization favors ethanol adsorption, but makes octane adsorption more difficult.
Of the different OSG analyzed by TPD, carboxylic acid groups were shown to produce
a specific effect on ethanol adsorption, although adsorption capacity depends on the
total oxygen content (hydrophobicity) of the carbon surface. The stronger the
interaction, the smaller the RMTZ and HMTZ in the corresponding fixed bed columns.
4.5. REFERENCES
[1] F.I. Khan and A. Ghoshal, Removal of Volatile Organic Compounds from
polluted air, Journal of Loss Prevention in the Process Industries, 13 (2000)
527-545.
[2] J. Carratalá-Abril, M.A. Lillo-Ródenas, A. Linares-Solano, and D. Cazorla-
Amorós, Activated Carbons for the Removal of Low-Concentration Gaseous
Toluene at the Semipilot Scale, Industrial & Engineering Chemistry Research,
48 (2009) 2066-2075.
[3] F.J. Maldonado-Hódar, C. Moreno-Castilla, F. Carrasco-Marín, and A.F. Pérez-
Cadenas, Reversible toluene adsorption on monolithic carbon aerogels, Journal
of Hazardous Materials, 148 (2007) 548-552.
[4] F.J. Maldonado-Hódar, Removing aromatic and oxygenated VOCs from
polluted air stream using Pt-carbon aerogels: Assessment of their performance
as adsorbents and combustion catalysts, Journal of Hazardous Materials, 194
(2011) 216-222.
Capítulo IV 189
[5] A. Martínez de Yuso, M.T. Izquierdo, R. Valenciano, and B. Rubio, Toluene
and n-hexane adsorption and recovery behavior on activated carbons derived
from almond shell wastes, Fuel Processing Technology, 110 (2013) 1-7.
[6] S. Morales-Torres, A.F. Pérez-Cadenas, F. Kapteijn, F. Carrasco-Marín, F.J.
Maldonado-Hódar, and J.A. Moulijn, Palladium and platinum catalysts
supported on carbon nanofiber coated monoliths for low-temperature
combustion of BTX, Applied Catalysis B: Environmental, 89 (2009) 411-419.
[7] R.A. Catalao, F.J. Maldonado-Hódar, A. Fernandes, C. Henriques, and M.F.
Ribeiro, Reduction of NO with metal-doped carbon aerogels, Applied Catalysis
B: Environmental, 88 (2009) 135-141.
[8] J. Wang, L. Jin, J. Gao, J. Shi, Y. Zhao, S. Liu, T. Jin, Z. Bai, and C.Y. Wu,
Investigation of speciated VOC in gasoline vehicular exhaust under ECE and
EUDC test cycles, Science of The Total Environment, 445-446 (2013) 110-116.
[9] H. Yamada, Contribution of evaporative emissions from gasoline vehicles
toward total VOC emissions in Japan, Science of The Total Environment, 449
(2013) 143-149.
[10] W.Q. Huang, J. Bai, S.H. Zhao, and A.H. Lv, Investigation of oil vapor
emission and its evaluation methods, Journal of Loss Prevention in the Process
Industries, 24 (2011) 178-186.
[11] G. Mellios and Z. Samaras, An empirical model for estimating evaporative
hydrocarbon emissions from canister-equipped vehicles, Fuel, 86 (2007) 2254-
2261.
[12] K. Sato and N. Kobayashi, Adsorption and Desorption Simulation of Carbon
Canister Using n-Butane as Model Compound of Gasoline, Journal of the Japan
Petroleum Institute, 54 (2011) 136-145.
[13] J.Y. Chin and S.A. Batterman, VOC composition of current motor vehicle fuels
and vapors, and collinearity analyses for receptor modeling, Chemosphere, 86
(2012) 951-958.
[14] http://www.api.org/environment-health-and-safety/environmental-
performance/innovation/recovered-gas-vapors-add-value-cut-emissions.

190 Capítulo IV
http://www.api.org/environment-health-and-safety/health-safety/product-safety-
home/safe-storage-and-disposal-of-gasoline
[15] R.K. Niven, Ethanol in gasoline: environmental impacts and sustainability
review article, Renewable and Sustainable Energy Reviews, 9 (2005) 535-555.
[16] M. Winther, F. Müller, and T.C. Jensen, Emission consequences of introducing
bio ethanol as a fuel for gasoline cars, Atmospheric Environment, 55 (2012)
144-153.
[17] A. Baçaoui, A. Dahbi, A. Yaacoubi, C. Bennouna, F.J. Maldonado-Hódar, J.
Rivera-Utrilla, F. Carrasco-Marín, and C. Moreno-Castilla, Experimental
Design To Optimize Preparation of Activated Carbons for Use in Water
Treatment, Environmental Science & Technology, 36 (2002) 3844-3849.
[18] A.S. Mestre, A.S. Bexiga, M. Proença, M. Andrade, M.L. Pinto, I. Matos, I.M.
Fonseca, and A.P. Carvalho, Activated carbons from sisal waste by chemical
activation with K2CO3: Kinetics of paracetamol and ibuprofen removal from
aqueous solution, Bioresource Technology, 102 (2011) 8253-8260.
[19] H. Zaitan, D. Bianchi, O. Achak, and T. Chafik, A comparative study of the
adsorption and desorption of o-xylene onto bentonite clay and alumina, Journal
of Hazardous Materials, 153 (2008) 852-859.
[20] C. Moreno-Castilla, M.A. Ferro-Garcia, J.P. Joly, I. Bautista-Toledo, F.
Carrasco-Marin, and J. Rivera-Utrilla, Activated Carbon Surface Modifications
by Nitric Acid, Hydrogen Peroxide, and Ammonium Peroxydisulfate
Treatments, Langmuir, 11 (1995) 4386-4392.
[21] R.G. Bansal, J.B. Donnet, and F. Stoeckli, Activated Carbon, Marcel Dekker,
New York and Basel, 1988.
[22] F. Stoeckli, Porosity in carbon. Characterization and applications. Eds. Patrick
J. Arnold, London, 1995.
[23] E.P. Barrett, L.G. Joyner, and P.P. Halenda, The Determination of Pore Volume
and Area Distributions in Porous Substances. I. Computations from Nitrogen
Isotherms, Journal of the American Chemical Society, 73 (1951) 373-380.

Capítulo IV 191
[24] C. Lastoskie, K.E. Gubbins, and N. Quirke, Pore size distribution analysis of
microporous carbons: a density functional theory approach, The Journal of
Physical Chemistry, 97 (1993) 4786-4796.
[25] Y. Matsumura, Production of acidified active carbon by wet oxidation and its
carbon structure, Journal of Applied Chemistry and Biotechnology, 25 (1975)
39-56.
[26] J.L. Figueiredo, M.F.R. Pereira, M.M.A. Freitas, and J.J.M. Órfão, Modification
of the surface chemistry of activated carbons, Carbon, 37 (1999) 1379-1389.
[27] C. Moreno-Castilla, F. Carrasco-Marín, F.J. Maldonado-Hódar, and J. Rivera-
Utrilla, Effects of non-oxidant and oxidant acid treatments on the surface
properties of an activated carbon with very low ash content, Carbon, 36 (1998)
145-151.
[28] J.H. Zhou, Z.J. Sui, J. Zhu, P. Li, D. Chen, Y.C. Dai, and W.K. Yuan,
Characterization of surface oxygen complexes on carbon nanofibers by TPD,
XPS and FT-IR, Carbon, 45 (2007) 785-796.
[29] C. Moreno-Castilla, A.F. Pérez-Cadenas, F.J. Maldonado-Hódar, F. Carrasco-
Marín, and J.L. Fierro, Influence of carbon-oxygen surface complexes on the
surface acidity of tungsten oxide catalysts supported on activated carbons,
Carbon, 41 (2003) 1157-1167.
[30] C.A. Leon, J.M. Solar, V. Calemma, and L.R. Radovic, Evidence for the
protonation of basal plane sites on carbon, Carbon, 30 (1992) 797-811.
[31] G.M. Luckchis, Adsorption systems 1. Design by mass-transfer-zone concept,
Chemical Engineering, 80 (1973) 111-116.
[32] W.J.J. Webber, Physiochemical Processes for Water Quality Control, Wiley-
Interscience ed., New Cork, 1972.
[33] P.N. Cheremisinoff and F. Ellerbusch, Carbon Adsorption Handbook, Ann
Arbor Science Pub. ed., Michigan, 1978.
[34] D. Cazorla-Amorós, J. Alcañiz-Monge, M.A. Casa-Lillo, and A. Linares-
Solano, CO2 as an Adsorptive To Characterize Carbon Molecular Sieves and
Activated Carbons, Langmuir, 14 (1998) 4589-4596.

192 Capítulo IV
[35] B. Marchon, J. Carrazza, H. Heinemann, and G.A. Somorjai, TPD and XPS
studies of O2, CO2, and H2O adsorption on clean polycrystalline graphite,
Carbon, 26 (1988) 507-514.
[36] A. Cartón, G.G. Benito, J.A. Rey, and M. de la Fuente, Selection of adsorbents
to be used in an ethanol fermentation process. Adsorption isotherms and
kinetics, Bioresource Technology, 66 (1998) 75-78.
[37] L. Gales, A. Mendes, and C. Costa, Hysteresis in the cyclic adsorption of
acetone, ethanol and ethyl acetate on activated carbon, Carbon, 38 (2000) 1083-
1088.
[38] B.B. Saha, I.I. El-Sharkawy, A. Chakraborty, S. Koyama, S.H. Yoon, and K.
Choon Ng, Adsorption Rate of Ethanol on Activated Carbon Fiber, Journal of
Chemical Engineering Data, 51 (2006) 1587-1592.
[39] I.I. El-Sharkawy, B.B. Saha ,S. Koyama, and K. Srinivasan, Isosteric heats of
adsorption extracted from experiments of ethanol and HFC 134a on carbon
based adsorbent, International Journal of Heat and Mass Transfer, 50 (2007)
902–907
[40] I.I. El-Sharkawy, B.B. Saha, S. Koyama, and K. Choon Ng, A study on the
kinetics of ethanol-activated carbon fiber: Theory and experiments,
International Journal of Heat and Mass Transfer, 49 (2006) 3104–3110.
[41] F. Carrasco-Marín, A. Mueden, A. Centeno, F. Stoeckli, and C. Moreno-
Castilla, Water adsorption on activated carbons with different degrees of
oxidation, Journal of the Chemical Society, Faraday Transactions, 93 (1997)
2211-2215.

Capítulo V ABOUT THE CONTROL OF VOC´s
EMISSIONS FROM BLENDED FUELS BY
DEVELOPING SPECIFIC ADSORBENTS
USING AGRICULTURAL RESIDUES


ABOUT THE CONTROL OF VOC´S EMISSIONS FROM
BLENDED FUELS BY DEVELOPING SPECIFIC
ADSORBENTS USING AGRICULTURAL RESIDUES
Article published in J. of Environmental Chem. Eng., 3 (2015) 2662-2669, doi: 10.1016/j.jece.2015.09.027
Highlights
Specific adsorption sites for n-octane and ethanol are determined. n-octane is able to replace adsorbed ethanol from active sites. Water vapor hinders adsorption of compounds lowering the rate of
the process. Carboxylic acid groups present the strongest interaction with
water and ethanol. By mixing two adsorbents (with and without oxygen)
simultaneous adsorption improved.
Abstract
Olive stones, which are an abundant residue from the olive oil industry, were thermally and chemically treated to obtain a series of cheap activated carbons with fitted surface chemistry and porosity. These biomaterials were used as specific filters for gaseous emissions treatments. Ethanol and n-octane were chosen as target VOCs. The performance of these filters in competitive VOCs adsorption processes and the influence of humidity were studied by analyzing the corresponding breakthrough curves. Relationships between VOCs chemical nature, adsorbent characteristics and experimental conditions were discussed. Carboxylic acid groups play a specific role on the adsorption of polar molecules, because they determine the interaction strength. The adsorption rate for n-octane was significantly reduced when water or ethanol were present, while adsorption capacity was almost equivalent. The influence of humidity is stronger on ethanol adsorption process, specifically when more oxidized samples were tested. A new filter was developed by mixing hydrophobic and hydrophilic adsorbents in order to improve the simultaneous adsorption of ethanol and n-octane. In this case, the constant rate of competitive adsorption processes is favoured for both VOCs, regarding columns with a single adsorbent, because they are adsorbed on independent sites. Keywords: VOCs, air pollution, biofuels, filters, activated carbons, competitive adsorption.


Capítulo V 197
Nomenclature
SBET B.E.T. surface area
W0 micropore volume obtained by Dubinin-Radushkevich
L0 micropore mean width by Stoeckli equation
Vmeso mesopore volume obtained by B.J.H.
C0 inlet VOC concentration
C outlet VOC concentration
V0.02 breakthrough volume
V0.90 saturation volume
X0.02 amount adsorbed till breakthrough point
X0.90 amount adsorbed till saturation point
XR amount retained at the end of competitive adsorption
HMTZ mass transfer zone height
RMTZ mass transfer zone rate of displacement
fractional capacity
Du degree of utility
ρB bed density
We equilibrium adsorption capacity
kv adsorption rate constant, from the Wheeler-Jonas model

198 Capítulo V
5.1. INTRODUCTION
The production of blended gasoline in different formulations (E10 or E85, with
10 or 85% of ethanol respectively) is nowadays a sound alternative to typical fossil
fuel, especially in developing countries which are rich in biomass resources. Although
the use of this type of fuel becomes more and more common, several associated
problems need to be considered: (i) ethanol from biomass contains a high proportion of
water that has to be separated1-4 (ii) ethanol-based fuels produce larger evaporative
emissions than conventional fuels5-7.
Thus, along the last years, special attention was paid to the air pollution caused
by VOC emissions during refueling or when the engine is switched off. These
emissions are enhanced by the presence of ethanol and other hydrophilic components in
the fuel mixture, causing contamination and fuel loss6,7. The chemical degradation rate
of these compounds in the atmosphere depends on the experimental conditions but it
takes place mainly photocatalytically induced by OH and Cl radicals or other oxidants
like NO3 in the dark, likely contributing to the formation of ozone and other
components of photochemical smog8. In such a basis, together with the improvement of
tailpipes, devices such as canisters are now installed in cars to minimize evaporative
emissions of these potentially dangerous gasses.
While tailpipes focus on the catalytic destruction of pollutants, canisters and
filters are based on the performance of adsorbents which favours the recovery and reuse
of evaporated fuel components, reducing in this way their emissions. Since ethanol and
others hydrophilic components are emitted joint to other aromatic compounds in
atmospheric conditions (humidity), physicochemical properties of adsorbents need to
be fitted in order to achieve the best adsorptive behaviour depending on the gaseous
mixture composition9-12.
The separation of ethanol and water has been widely studied13,14. In wet
conditions, water might well be absorbed and can compete for active sites with
contaminants15-17. VOCs and water adsorption on carbon materials strongly depends on
both, textural properties and surface chemistry9-12. Oxygen surface groups, called
Capítulo V 199
primary centres, are able to interact with water molecules through the formation of
hydrogen bonds18.
In previous manuscripts, the preparation of carbon materials and their
application as adsorbents of individual VOCs were presented19,20. The objective of this
work is to evaluate the performance of some of these samples in more realistic working
conditions. For that purpose, different filters were prepared and studied in the
adsorption of VOCs mixtures in both dry and wet airflows. The obtained breakthrough
curves were analyzed by different methods and results were correlated to the textural
and chemical nature of adsorbents.
5.2. MATERIALS AND METHODS
5.2.1. Synthesis and characterization of adsorbents
Synthesis and characterization of adsorbents were detailed on previous
works19,20. Briefly, olive stones were milled, carbonized at 400°C and then,
impregnated with KOH and heated again up to 850 °C under nitrogen flux for chemical
activation. After neutralizing the base excess and washing, the sample was dried at
110°C overnight and labelled as CA. Due to the severe experimental conditions of
synthesis, this material is obtained as a fine powder with negligible inorganic matter
content20. In order to increase CA hydrophilic character, oxygenated surface groups
(OSG) were generated on the CA surface by oxidation with a saturated solution of
ammonium peroxydisulphate ((NH4)2S2O8) in H2SO4 1M, reacting for 24 hours21,22.
The excess of oxidizing agent and by-products were removed by washing with
deionized water till sulphates absence and then the sample was dried and named
CAOX. In order to fit the OSG nature, thermally labile carboxylic acid groups23,24 were
removed by heating a portion of CAOX sample up to 500 °C under inert atmosphere
(nitrogen). This sample was denominated as CAOX500.
Samples morphology was studied by scanning electron microscopy (SEM)
using a LEO (Carl Zeiss) GEMINI-1530 microscope20. Textural characterization was

200 Capítulo V
carried out by analysing N2 and CO2 adsorption at −196 °C and 0 °C, respectively,
using a Quantachrome Autosorb-1 equipment. BET, Dubinin–Radushkevich and
Stoeckli equations were applied to determine the apparent surface area (SBET), the
micropore volume (W0) and the mean micropore width (L0). The BJH method was used
to calculate the mesopore volume of the samples (Vmeso). Surface chemistry was
analyzed by quantifying oxygen content on the external surface (X-ray Photoemission
Spectroscopy -XPS-) and bulk samples (Thermal Programmed Desorption -TPD-).
Additional details can be found on published bibliography19,20.
Water adsorption experiments under static conditions were also performed until
saturation of the sample at room temperature. Water desorption from saturated samples
was studied by Thermogravimetric Analysis (TG) and Differential Scanning
Calorimetry (DSC) to determine water-adsorbent interactions with a METTLER-
TOLEDO TGA/DSC1.
5.2.2. Dynamic adsorption experiments
Dynamic adsorption experiments were carried out by using columns of each
adsorbent with a height of 6.7 cm, 4.2 cm and 4.1 cm for CA, CAOX and CAOX500,
respectively. Additional experiments were also performed by mixing CA – CAOX (50-
50 wt %), resulting in a column of 5.9 cm. The design of the adsorption system permits
the fitting of the polluted air composition and to obtain breakthrough curves for either
single component or mixtures, under dry or wet conditions. For this purpose, individual
airflows which bubbled through liquid n-octane or ethanol (Aldrich, analytical reagent,
purity >99.8%) at T = 0°C were diluted and mixed in the appropriate ratio to obtain a
concentration in the feed of 480 ppm and 560 ppm for n-octane and ethanol
respectively. When adsorption experiments were performed in wet airflows (3% of
water in the final flow), the diluting air flux passed through water at room temperature.
Gas chromatography with FID detection was used to quantify contaminants
concentration at the column exit, but water could not be analyzed by this method. Each
breakthrough curve was obtained three times for each adsorbent with a good
reproducibility (differences between 5 and 7% were observed). Thus, the exposed
results correspond to single experiments.

Capítulo V 201
The analysis of breakthrough curves was performed by applying the mass
transfer zone (MTZ) concept25,26. Different parameters were determined from the
analysis of breakthrough curves: breakthrough (V0.02) and saturation (V0.90) points
which are defined as the eluted volume (or time) till the VOC concentration at the
column exit reached values of 2 and 90% of the initial VOC concentration, adsorbed
amounts at these points X0.02 and X0.90, mass transfer zone height (HMTZ) and the MTZ
rate of displacement (RMTZ).
Along the adsorbent bed there is a concentration gradient which is moving. The
mass transfer zone (MTZ) is defined as the bed region where the adsorption process is
taking place and, therefore, it is located between the saturated part of the bed and the
clean one. Diffusion and adsorption happen at the same time and the mass transfer zone
height (HMTZ) is the parameter used to estimate the relative rate of both processes. So
that, when adsorption is faster than diffusion, values of HMTZ are small; however, when
diffusion prevails, HMTZ becomes larger. The calculation of this parameter was carried
out by applying Eqs. (5.1) and (5.2) as described in bibliography27:
)( 02.090.002.0
02.090.0
VVV
VVhHMTZ
Equation 5.1
)(
)(
02.090.00
090.0
02.0
VVC
dVCCV
V Equation 5.2
Where V0.02 and V0.90were already defined, h is the height of the adsorption bed
and is the fractional capacity which is related to the efficiency of the adsorption
process within the MTZ and is calculated by the Eq. (5.2).
As adsorption occurs, part of the adsorbent is saturated and MTZ moves
forward, so the MTZ displacement rate (RMTZ) can be defined. This parameter is
calculated by multiplying HMTZ by flow rate and dividing by the difference between
volumes at breakthrough and saturation points.

202 Capítulo V
The degree of utility (Du(%)) was also obtained28. This parameter provides
information about how much time over the total of the experiment the adsorptive bed is
retaining all of the VOC molecules passing through the column. It is calculated as a
ratio between the amount of VOC adsorbed at the breakthrough point (X0.02) and the
saturation point (X0.90).
Additional information may be obtained by applying several mathematical
models. One of the most employed is the model developed by Wheeler and Jonas (Eq.
(5.3)) which is commonly used to obtain the adsorbed amount at equilibrium (We,
mg·g-1) and the rate constant for the adsorption process (kv, min-1)29-32.
C
CC
Ck
W
QC
WWt
v
Bee 0
00
ln
Equation 5.3
Where C0 and C are the inlet and outlet VOCs concentration at the time t, W
the weight of sample, Q the volumetric flux, ρB the bed density, We and kv were defined
above. The rate constant kv was employed to compare dynamic adsorption behaviour of
the three activated carbons retaining each VOC under different experimental
conditions.
5.3. RESULTS AND DISCUSSION
As commented, in a previous paper a series of activated carbons were
developed20 and applied to the adsorption of n-octane and ethanol19 as representative
components of biofuels. Results pointed out the strong influence of microporosity on n-
octane adsorption capacity while ethanol adsorption is governed by surface chemistry19.
In such a case, some of these samples were now selected to study the competitive
adsorption process of both compounds as well as the influence of the presence of water
vapour in the feed. For a better understanding, a brief summary of physicochemical
properties of selected samples is included bellow.

Capítulo V 203
5.3.1. Textural and chemical characterization
CA, CAOX and CAOX500 samples were obtained as described in the
experimental section to fit their porosity and surface chemistry. The main
physicochemical properties of these samples are summarized in Table 5.1.
The original activated carbon (CA) is a micro-mesoporous adsorbent, with high
BET surface area (SBET) and huge micropore and mesopore volumes. Since it was
prepared at high temperature, its oxygen content is relatively low. Oxidation with
ammonium peroxydisulphate produced an increase on total oxygen content, as
determined by TPD (from 2.3% to 15.5%), but also a drastic reduction in porosity and
surface area (from 2387 to 1661 m2 g-1) for CAOX. After treatment at 500 °C, sample
CAOX500 does not present carboxylic acid groups20 as demonstrated by different
techniques. However, these groups evolved only from the external surface, as denoted
the OXPS decrease, while the total oxygen content was not reduced significantly because
carboxylic groups were transformed inside the pores in semiquinone species, which are
stable at temperatures higher than 500 °C19,20.
Table 5.1. Summary of the textural and chemical properties of adsorbents20.
Sample X(H2O)
gH2O/gC
SBET
m2·g -1
W0 (N2)
cm3·g -1
W0 (CO2)
cm3·g -1
Vmeso
cm3·g -1
OTPD
%
OXPS
%
CA 2.12 2387 0.92 0.39 1.31 2.3 1.8
CAOX 1.00 1661 0.63 0.43 0.44 15.5 9.3
CAOX500 0.74 1696 0.68 0.48 0.50 14.0 5.6
In this case, we paid special attention to the hydrophilicity of the samples.
Water adsorption on activated carbon strongly depends of both textural and surface
chemistry18. The oxygen surface complexes, called primary centers, are able to interact
with the water molecule forming hydrogen bonds. In general, water adsorption
isotherms correspond to the type IV, and can be decomposed into two contributions.
The first contribution, at low relative pressures, belongs to type I and the second is of
204 Capítulo V
type V. The former has been associated with the adsorption by acidic centres and the
micropore filling. The second one is related with the adsorption by weaker hydrophilic
centres mainly of carbonyl type33.
The amount of water adsorbed by each sample at saturation was quantified
(Table 5.1). In general, this amount (if expressed as volume) corresponds to the filling
of the micro and mesoporosity of samples. The largest water adsorption capacity was
obtained for CA (2.12 gH2O/gC), due to its highly developed porosity. After oxidation,
the water adsorption on CAOX (1.00 gH2O/gC) decreased according to the porosity
decrease. However, when results for CAOX and CAOX500 (0.74 gH2O/gC) are
compared, a new decrease in the amount of adsorbed water can be observed. In this
case, because porosity is slightly enhanced after thermal treatments (Table 5.1), this
decrease must be due to the elimination or transformation of carboxylic acid groups.
After saturation, water desorption was studied by TG/DSC experiments (Fig.
5.1). Results from TG (Fig. 5.1a) are in good agreement with those obtained by direct
weighing of samples. Fresh samples were used as reference materials. In these cases,
the weight loss started at lower temperatures as oxygen content of the samples becomes
higher, mainly in the case of CAOX sample where the removal of oxygenated groups
happened at around 200 ºC by desorption of less stable carboxylic acid groups. In spite
of the smaller amount desorbed observed from oxidized samples, their TG profiles
shifted to higher temperatures, which is also confirmed by DSC profiles (Fig. 5.1b)
where the minimum of the curve appears at 110°C (CA) < 114°C (CAOX500) <
120°C(CAOX). This fact is indicative of a stronger interaction between water and
oxygenated surface groups, mainly carboxylic acids.

Capítulo V 205
Figure 5.1. Desorption of water from saturated samples; dry samples shown as dashed
lines (a) TG and (b) DSC profiles.
5.3.2. Performance of adsorbents in dynamic adsorption experiments
5.3.2.1. Influence of the humidity on the adsorption of individual VOCs
In Fig. 5.2 breakthrough curves for n-octane dynamic adsorption under dry and
humid conditions are compared and the parameters obtained from them are summarized
in Table 5.2. Changes on curve shapes, breakthrough and saturation points are observed
at a glance and these changes differ as physicochemical properties of adsorbent do.
Independently of the used adsorbent, earlier breakthrough points were always obtained
for wet air experiments compared to dry air ones, showing the competition between
water and VOCs for adsorption sites. Because water is also adsorbed, n-octane
appeared faster at the exit of the column.
a
b

206 Capítulo V
0.0
0.5
1.0
0 20 40 60 80
C/C
0
V (L)
a
0.0
0.5
1.0
0 20 40 60
C/C
0
V (L)
b
0.0
0.5
1.0
0 20 40 60
C/C
0
V (L)
c
Figure 5.2. Comparisons of breakthrough curves obtained for the dynamic adsorption
of n-octane under wet air (dashed) and dry air (continuous, from Ref. 19) onto different
activated carbons: a) CA, b) CAOX500, c) CAOX.
The difference between breakthrough points when water vapour is present
becomes much larger in the case of CA than in the rest of samples, which is in
agreement with the greater water adsorption previously discussed. Moreover, in spite of
that initially n-octane concentration at the exit increases quickly under wet conditions,
the breakthrough curve shows a remarkable slope decrease at C/C0= 0.2 and this slope
is maintained constant until C/C0 = 0.8 when it increases again. This means that, after a
first situation where water seems to be preferably adsorbed leading to a fast advance of
n-octane along the column, CA surface reaches a stationary state where n-octane
adsorption becomes slower than in dry conditions, but faster than at the beginning and
it remains constant practically till the complete saturation of the column. This fact
provokes a great difference between breakthrough and saturations points, also shown
by the strong decrease on Du(%) values (Table 5.2). Nevertheless, adsorbed amounts at
saturation (X0.90) are quite similar for CA independently on the presence of humidity.
Because we previously pointed out that n-octane adsorption is related to the
micropore volume19, these results indicate that n-octane penetrated to a similar
micropore volume either in dry or wet conditions, but obviously, more slowly in the
case of wet ones. Taking into account physicochemical properties of this sample, it is
very likely that a fast water adsorption is produced initially in the big volume of macro-
mesopores present in this sample. Adsorbed water molecules hinder the accessibility of
n-octane to microporosity, inducing a strong decrease on the breakthrough point (Fig.
5.2, Table 5.2). However, after covering adsorption sites of the external surface by

Capítulo V 207
water, n-octane is progressively adsorbed into micropores, due to the stronger
interaction between the CA hydrophobic surface (low oxygen content) and the non-
polar molecule. This behaviour strongly influenced the Du(%) value, which largely
decreased under wet conditions leading to the smallest Du value of the sample series,
while HMTZ became about ten times larger when water was present demonstrating a
huge reduction on n-octane adsorption rate.
Table 5.2. Parameters obtained for the dynamic adsorption of n-octane under different
conditions.
Sample Air V0.02
L
X0.02
mg g-1
V0.9
0 L
X0.90
mg g-1
HMTZ
cm
Du
%
CA dry* 43.9 206.3 52.0 223.8 0.34 93
wet 5.8 27.0 82.9 200.2 3.65 16
CAOX500 dry* 12.9 61.9 50.9 153.7 1.37 44
wet 4.5 21.0 20.1 46.7 1.93 54
CAOX dry* 9.0 43.7 38.8 99.0 1.73 49
wet 4.1 20.4 9.5 32.8 2.77 62
*From 19.
Textural and chemical transformations undergone during oxidation also
influenced the shape and position of the breakthrough curves obtained for CAOX
sample. Mesoporosity was significantly destroyed and some of the OSG generated were
located at the micropore entrance increasing diffusional restrictions into the narrowest
porosity (as denoted by a larger W0(CO2) to W0(N2) ratio for CAOX). Both facts
produced the decrease of X0.02 and the slope change observed for the curve obtained in
dry conditions. The high oxygen content generated enhanced the hydrophilic character
of carbon surface and, consequently, water adsorption became more favourable. Thus,
in wet airflows, the amount of n-octane adsorbed at saturation decreased about three
times regarding dry conditions, with adsorbed water blocking porosity. This sample
presents, consequently, the worst adsorptive performance of the samples series, mainly
in wet conditions. Du values present the contrary behaviour previously described for

208 Capítulo V
CA sample. In this case, Du increases since the decrease of X0.02valueswas not so
significant as the one of X0.90.
After the thermal treatment at 500°C some of the oxygenated surface groups
blocking the micropore entrance were removed (W0(N2) increased) decreasing also
diffusional restrictions. Consequently, changes in the slope of the breakthrough curve
practically disappeared. In wet conditions, n-octane adsorption was hindered by water
in the feed as denoted by the greater slope of the breakthrough curve obtained under
wet conditions. Nevertheless, the absence of carboxylic acid groups on the external
surface (OXPS decreased) provoked a smaller water adsorption regarding CAOX, and a
certain slope change mainly at C/C0>0.5. The greater hydrophilicity of CAOX
regarding CAOX500, despite the similar oxygen content of both samples, resulted in a
deeper reduction of the adsorption capacity and higher HMTZ for the former adsorbent,
showing the importance of OSG nature and their distribution along the porous texture.
In the case of ethanol adsorption (Fig. 5.3), ethanol and water compete for the
same hydrophilic sites on carbon surface. Thus, in dry airflow, ethanol adsorption
capacity (X0.90) was strongly favoured by oxygenated groups present on the more
oxidized sample CAOX (Table 5.3), but the influence of humidity was also stronger.
0.0
0.5
1.0
0 10 20
C/C
0
V (L)
a
0.0
0.5
1.0
0 10 20 30
C/C
0
V (L)
b
0.0
0.5
1.0
0 10 20 30 40
C/C
0
V (L)
c
Figure 5.3. Comparisons of breakthrough curves obtained for the dynamic adsorption
of ethanol under wet air (dashed) and dry air (continuous, from ref.19) onto different
activated carbons: a) CA, b) CAOX500, c) CAOX.
The influence of adsorbent surface chemistry was also clearly proved by
analysing the shape of breakthrough curves. In the case of CAOX sample, ethanol

Capítulo V 209
relative concentration achieved values over 1 for the experiment carried out under wet
conditions. This is a typical phenomenon when competitive adsorption is performed,
since a more weakly adsorbed compound is replaced by a more strongly adsorbed
one34,35. Thus, clearly, oxygenated surface groups on CAOX sample interacted more
strongly with water than with ethanol, probably due to the larger dipole moment of the
former (1.82 vs 1.69 D). This sample contains a great proportion of carboxylic acid
groups. The specificity of these groups to water on ethanol/water competitive
adsorption was remarked by results showed in Table 5.3. Carboxylic acids strongly
favoured ethanol adsorption under dry conditions (Table 5.3), however, under wet
conditions X0.90 showed similar or even slightly higher values for CAOX500, because
the strong interaction of water molecules with carboxylic groups decreased ethanol
adsorption on CAOX. Moreover, ethanol was not replaced by water on CAOX500 (Fig.
5.3b). These results emphasize the need of controlling not only the hydrophilic
character of the carbon surface, denoted mainly by the oxygen content, but also the
nature of oxygenated surface groups present. Carboxylic acid groups have a deeper
effect on the adsorption of polar VOCs molecules present in dry gaseous flows than
other oxygenated surface groups; however, in wet conditions they may induce a
negative effect on the adsorption of hydrophilic VOCs if their interaction with water
was even stronger.
Table 5.3. Parameters obtained for the dynamic adsorption of ethanol under different
conditions.
Sample Air V0.02
L
X0.02
mg g-1
V0.9
0 L
X0.90
mg g-1
HMTZ
cm
Du
%
CA dry* 1.2 5.0 4.1 10.7 2.80 67
wet 0.2 1.4 4.8 11.0 4.88 13
CAOX500 dry* 1.5 8.0 11.1 25.5 2.53 41
wet 0.7 3.9 11.9 24.8 2.99 20
CAOX dry * 4.6 26.5 15.6 53.4 1.72 70
wet 0.7 4.2 10.1 23.3 4.51 21
*From 19.
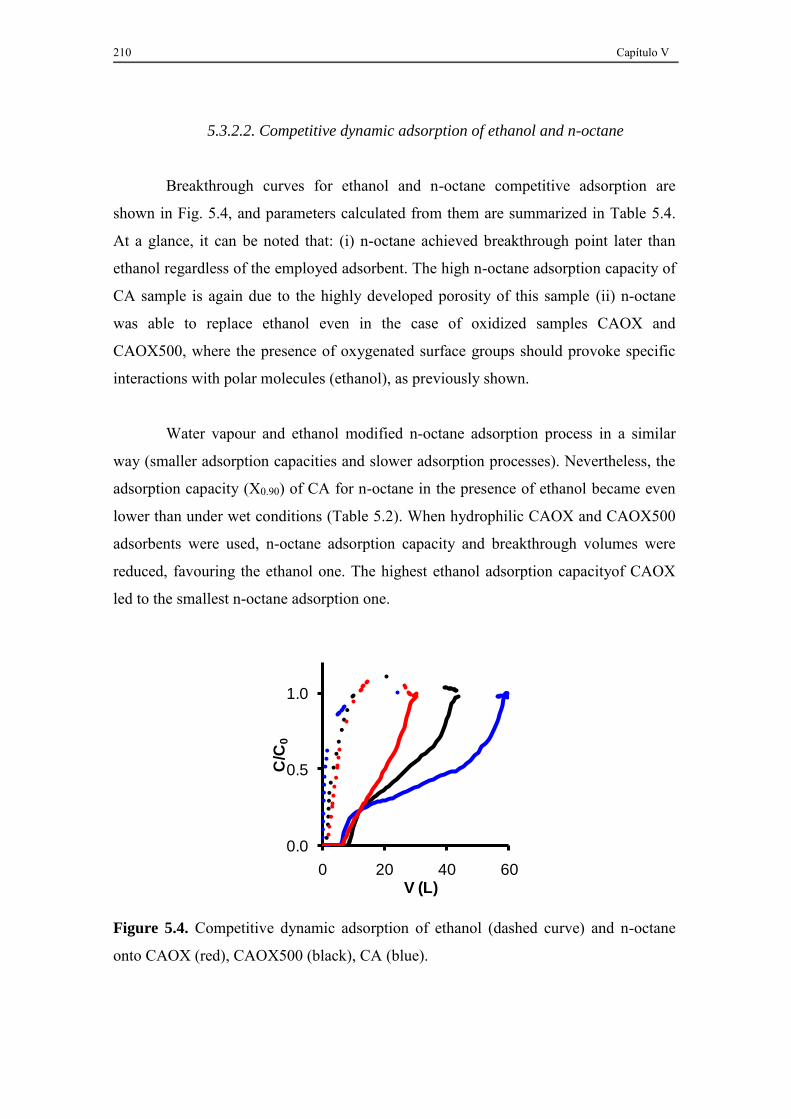
210 Capítulo V
5.3.2.2. Competitive dynamic adsorption of ethanol and n-octane
Breakthrough curves for ethanol and n-octane competitive adsorption are
shown in Fig. 5.4, and parameters calculated from them are summarized in Table 5.4.
At a glance, it can be noted that: (i) n-octane achieved breakthrough point later than
ethanol regardless of the employed adsorbent. The high n-octane adsorption capacity of
CA sample is again due to the highly developed porosity of this sample (ii) n-octane
was able to replace ethanol even in the case of oxidized samples CAOX and
CAOX500, where the presence of oxygenated surface groups should provoke specific
interactions with polar molecules (ethanol), as previously shown.
Water vapour and ethanol modified n-octane adsorption process in a similar
way (smaller adsorption capacities and slower adsorption processes). Nevertheless, the
adsorption capacity (X0.90) of CA for n-octane in the presence of ethanol became even
lower than under wet conditions (Table 5.2). When hydrophilic CAOX and CAOX500
adsorbents were used, n-octane adsorption capacity and breakthrough volumes were
reduced, favouring the ethanol one. The highest ethanol adsorption capacityof CAOX
led to the smallest n-octane adsorption one.
0.0
0.5
1.0
0 20 40 60
C/C
0
V (L)
Figure 5.4. Competitive dynamic adsorption of ethanol (dashed curve) and n-octane
onto CAOX (red), CAOX500 (black), CA (blue).
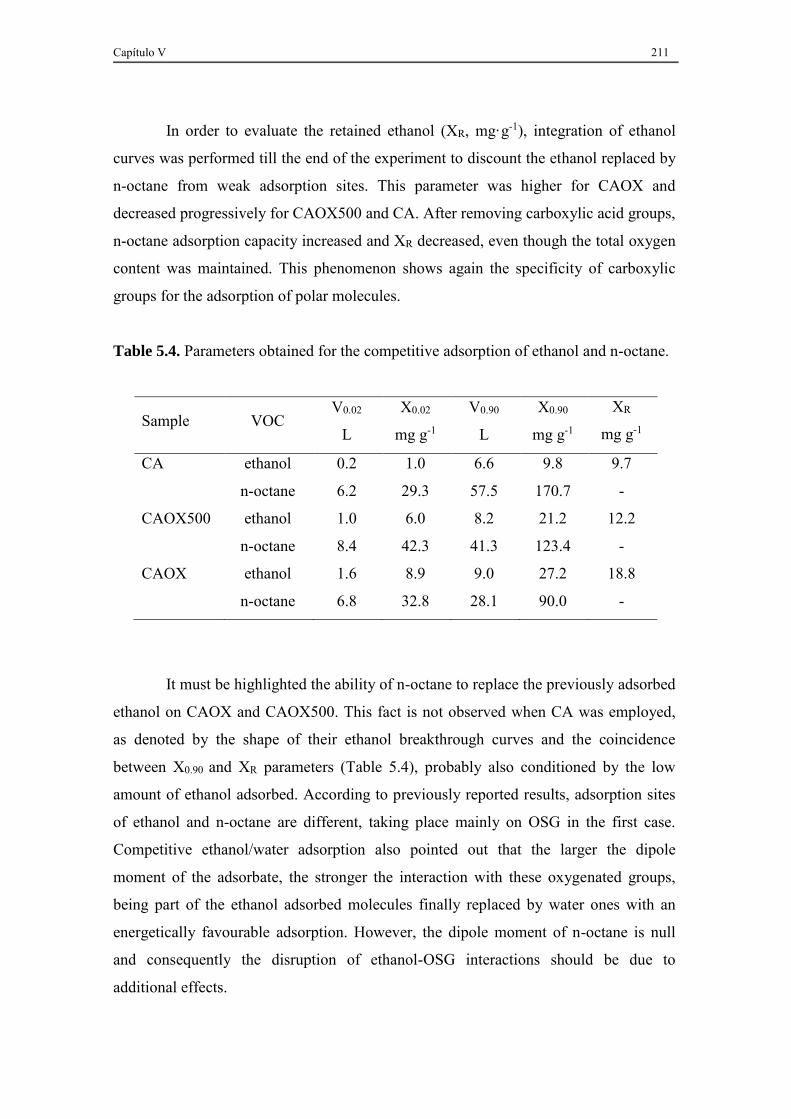
Capítulo V 211
In order to evaluate the retained ethanol (XR, mg·g-1), integration of ethanol
curves was performed till the end of the experiment to discount the ethanol replaced by
n-octane from weak adsorption sites. This parameter was higher for CAOX and
decreased progressively for CAOX500 and CA. After removing carboxylic acid groups,
n-octane adsorption capacity increased and XR decreased, even though the total oxygen
content was maintained. This phenomenon shows again the specificity of carboxylic
groups for the adsorption of polar molecules.
Table 5.4. Parameters obtained for the competitive adsorption of ethanol and n-octane.
Sample VOC V0.02
L
X0.02
mg g-1
V0.90
L
X0.90
mg g-1
XR
mg g-1
CA ethanol 0.2 1.0 6.6 9.8 9.7
n-octane 6.2 29.3 57.5 170.7 -
CAOX500 ethanol 1.0 6.0 8.2 21.2 12.2
n-octane 8.4 42.3 41.3 123.4 -
CAOX ethanol 1.6 8.9 9.0 27.2 18.8
n-octane 6.8 32.8 28.1 90.0 -
It must be highlighted the ability of n-octane to replace the previously adsorbed
ethanol on CAOX and CAOX500. This fact is not observed when CA was employed,
as denoted by the shape of their ethanol breakthrough curves and the coincidence
between X0.90 and XR parameters (Table 5.4), probably also conditioned by the low
amount of ethanol adsorbed. According to previously reported results, adsorption sites
of ethanol and n-octane are different, taking place mainly on OSG in the first case.
Competitive ethanol/water adsorption also pointed out that the larger the dipole
moment of the adsorbate, the stronger the interaction with these oxygenated groups,
being part of the ethanol adsorbed molecules finally replaced by water ones with an
energetically favourable adsorption. However, the dipole moment of n-octane is null
and consequently the disruption of ethanol-OSG interactions should be due to
additional effects.
212 Capítulo V
The strong interaction of acid sites with ethanol molecules could lead to a
chemical reaction between them. Two possibilities are given for such a process between
alcohols and oxygenated surface groups: dehydration or dehydrogenation21,36.
Dehydration is catalysed by acid groups while dehydrogenation needs the conjugated
effect of acid and basic sites. Thus, taking into account the acid character of CAOX
surface, dehydration seems to be the most plausible. Then, the produced water could
displace a fraction of the adsorbed ethanol.
5.3.2.3. Fitting the columns content for simultaneous ethanol and n-
octane adsorption
Looking for a better performance in the simultaneous adsorption of both
components, a 50% CA - 50% CAOX mixture was prepared. Breakthrough curves for
single component adsorption (n-octane, Fig. 5.5a and ethanol, Fig. 5.5b) and
ethanol/octane competitive adsorption (Figure 5.5c) were obtained with this column.
Adsorption parameters obtained from them are summarized in Table 5.5. Results
showed an intermediate behaviour of this column regarding those obtained with CA
and CAOX columns when adsorbing individual VOCs. A similar intermediate
behaviour was also expected for competitive n-octane/ethanol adsorption processes,
however, significant differences were observed regarding results previously exposed.
Thus, it is noteworthy that an increase in the breakthrough volume (X0.02) for n-
octane during competitive adsorption (Table 5.5) compared to CA sample (Table 5.4) is
produced. This result is related to the presence of specific active sites for ethanol
adsorption (CAOX component), thus avoiding or limiting the ethanol adsorption on CA
which, as previously shown, hinders and retards the n-octane adsorption on CA. It
should be noted also that the breakthrough point for n-octane is coincident with the
saturation point for ethanol (at around 8.2 L). These results suggest that both activated
carbons worked in the column separately, ethanol being adsorbed preferentially on
carboxylic acid groups of CAOX which permitted a larger n-octane adsorption on CA.
Thus, by fitting the ratio of hydrophobic/hidrophylic carbons on the column, it would
be possible to obtain an improved adsorption column to be used for mixtures of
pollutants with different polarity or concentrations.

Capítulo V 213
0.0
0.5
1.0
0 20 40 60 80
C/C
0
V (L)
a
0.0
0.5
1.0
0 10 20 30
C/C
0
V (L)
b
0.0
0.5
1.0
0 10 20 30 40 50
C/C
0
V (L)
c
Figure 5.5. Breakthrough curves for CA-CAOX mixture. n-octane (a), ethanol (b) and
competitive (c, ethanol · and n-octane -).
Table 5.5. Parameters obtained for single component and competitive dynamic
adsorption of ethanol and n-octane onto CA-CAOX mixture.
Experiment VOC V0.02
L
X0.02
mg g-1
V0.9
0 L
X0.90
mg g-1
Single
component
Ethanol 1.3 5.8 14.8 29.4
n-octane 12.0 57.6 58.1 156.6
Competitive Ethanol 1.0 5.6 6.2 16.6
n-octane 13.6 65.0 32.3 110.9
5.3.3. Wheeler-Jonas analysis
Wheeler-Jonas equation29-32 was used to determine the rate constant kv of the
dynamic adsorption processes using the three activated carbons under different
experimental conditions. Results are compiled in Table 5.6.

214 Capítulo V
Table 5.6. Values of kv (min-1) for the dynamic adsorption of ethanol or n-octane in
different experimental conditions.
In dry airflow, the maximum kv values were detected for the adsorption
processes of n-octane on CA and ethanol on CAOX, in agreement with the textural and
chemical influence previously described. In the case of n-octane adsorption onto CA,
the process became much slower when water or ethanol were present, and the decrease
in kv was very large compared to results from other authors30,32. This could be due to
the strong affinity of this highly porous and hydrophobic adsorbent for n-octane. The
value of kv became shorter after oxidation (CAOX), because both the porosity and the
hydrophobicity decreased being partially recovered after removing carboxylic acid
groups (CAOX500). The contrary tendency was observed for ethanol adsorption: the
high value of kv for ethanol adsorption onto CAOX under dry air denoted the
specificity of carboxylic groups. Results for ethanol adsorption onto CAOX showed a
strong reduction of adsorption rate when water vapour was present. It was observed in
previous sections that water was able to replace ethanol from CAOX surface.
Results obtained in competitive experiments are of special interest. In these
cases kv values either for n-octane or ethanol adsorption was always higher than under
wet airflow, which is related to the strong pore blockage that provoke the water
adsorption, as previously commented. Similarly, when a column is prepared by mixing
CA-CAOX, adsorption of n-octane occurred faster than in pure CA. By mixing both
adsorbents, we compromised adsorption capacity and adsorption rate.
n-octane ethanol
Sample Dry air Wet air Competitive Dry air Wet air Competitive
CA 5732 154 193 409 122 65
CAOX 222 136 710 714 245 651
CAOX500 746 380 487 151 155 420
CACAOX 292 - 1060 78 - 455

Capítulo V 215
5.4. CONCLUSIONS
Influence of the presence of water in the dynamic adsorption of n-octane and
ethanol onto several activated carbons was determined as well as competitive
adsorption between both VOCs. All experimental results showed a strong relationship
between the chemical surface functionality of the adsorbent and its behaviour in
different conditions.
The presence of humidity influenced both ethanol and n-octane dynamic
adsorption, reducing both rate of the process and adsorption capacity. Water adsorbed
blocks the porosity of the sample depending on the OSG nature and distribution. Thus
this effect was bigger on ethanol adsorption than in the case of octane, because both
water and ethanol compete by the same adsorption sites, mainly when the adsorbents
are functionalized with carboxylic acid groups (CAOX).These groups have a positive
effect on the ethanol adsorption from dry airflow, but a negative effect in the presence
of humidity due to the stronger interaction of water with carboxylic groups. In this case,
ethanol previously adsorbed was replaced by water from the carbon surface.
When studying the competitive ethanol/n-octane adsorption, it was observed
that ethanol hindered the access of n-octane to the internal porosity, as previously
described for water. In the case of the least hydrophilic sample, CA, it implied a slight
reduction in the n-octane adsorption capacity but a strong reduction in the adsorption
rate of the process, as denoted also by the Wheeler-Jonas model. In the case of more
hydrophilic samples CAOX and CAOX500, ethanol adsorption is favoured from the
mixture. It is, however, observed that n-octane was also able to replace adsorbed
ethanol from weak adsorption sites.
Finally, by mixing both extreme adsorbents, CA with a high surface area and a
very low oxygen content, and CAOX, with a large oxygen (carboxylic acid groups)
content but a shorter surface area, a larger rate for the simultaneous adsorption of both
VOCs was achieved. This result might well be related to the presence of specific active
sites for the adsorption of each molecule, ethanol being mainly adsorbed onto the

216 Capítulo V
oxygenated groups present on CAOX and n-octane being mainly adsorbed onto CA
surface.
5.5. REFERENCES
[1] A. Kyriakides, V. Dimas, E. Lymperopoulou, D. Karonis, and E. Lois,
Evaluation of gasoline-ethanol-water ternary mixtures used as a fuel for an Otto
engine, Fuel, 108 (2013) 208-215.
[2] M.B. Gramajo de Doz, C.M. Bonatti, and H.N. Sólimo, Water Tolerance and
Ethanol Concentration in Ethanol-Gasoline Fuels at Three Temperatures,
Energy & Fuels, 18 (2003) 334-337.
[3] C.A. Cardona and Ó.J. Sánchez, Fuel ethanol production: Process design trends
and integration opportunities, Bioresource Technology, 98 (2007) 2415-2457.
[4] H.J. Huang, S. Ramaswamy, U.W. Tschirner, and B.V. Ramarao, A review of
separation technologies in current and future biorefineries, Separation and
Purification Technology, 62 (2008) 1-21.
[5] R.K. Niven, Ethanol in gasoline: environmental impacts and sustainability
review article, Renewable and Sustainable Energy Reviews, 9 (2005) 535-555.
[6] M. Winther, F. Moller, and T.C. Jensen, Emission consequences of introducing
bio ethanol as a fuel for gasoline cars, Atmospheric Environment, 55 (2012)
144-153.
[7] L.A. Graham, S.L. Belisle, and C.L. Baas, Emissions from light duty gasoline
vehicles operating on low blend ethanol gasoline and E85, Atmospheric
Environment, 42 (2008) 4498-4516.
[8] A. Moreno, S. Salgado, R. Taccone, P. Martín, and B. Cabañas, Atmospheric
degradation of saturated alcohols: Room temperature rate coefficients for NO3
radical reactions, Atmospheric Environment, 96 (2014) 229-235.
[9] K. Uddin, I.I. El-Sharkawy, T. Miyazaki, B.B. Saha, S. Koyama, H.S. Kil, J.
Miyawaki, and S.H. Yoon, Adsorption characteristics of ethanol onto functional
Capítulo V 217
activated carbons with controlled oxygen content, Applied Thermal
Engineering, 72 (2014) 211-218.
[10] A. Martínez de Yuso, B. Rubio, and M.T. Izquierdo, Influence of activation
atmosphere used in the chemical activation of almond shell on the
characteristics and adsorption performance of activated carbons, Fuel
Processing Technology, 119 (2014) 74-80.
[11] Y. Bai, Z.H. Huang, and F. Kang, Surface oxidation of activated electrospun
carbon nanofibers and their adsorption performance for benzene, butanone and
ethanol, Colloids and Surfaces A: Physicochemical and Engineering Aspects,
443 (2014) 66-71.
[12] A.J. Romero-Anaya, M.A. Lillo-Ródenas, and A. Linares-Solano, Factors
governing the adsorption of ethanol on spherical activated carbons, Carbon, 83
(2015) 240-249.
[13] G. Liu, F. Xiangli, W. Wei, S. Liu, and W. Jin, Improved performance of
PDMS/ceramic composite pervaporation membranes by ZSM-5 homogeneously
dispersed in PDMS via a surface graft/coating approach, Chemical Engineering
Journal, 174 (2011) 495-503.
[14] N. Wang, J. Liu, J. Li, J. Gao, S. Ji, and J.R. Li, Tuning properties of silicalite-1
for enhanced ethanol/water pervaporation separation in its PDMS hybrid
membrane, Microporous and Mesoporous Materials, 201 (2015) 35-42.
[15] F. Carrasco-Marín, D. Fairén-Jiménez, and C. Moreno-Castilla, Carbon aerogels
from gallic acid-resorcinol mixtures as adsorbents of benzene, toluene and
xylenes from dry and wet air under dynamic conditions, Carbon, 47 (2009) 463-
469.
[16] A.W. Heinen, J.A. Peters, and H.v. Bekkum, Competitive adsorption of water
and toluene on modified activated carbon supports, Applied Catalysis A:
General, 194-195 (2000) 193-202.
[17] A. Martínez de Yuso, M.T. Izquierdo, B. Rubio, and P.J.M. Carrott, Adsorption
of toluene and toluene-water vapor mixture on almond shell based activated
carbons, Adsorption, 19 (2013) 1137-1148.
218 Capítulo V
[18] A.M. Slasli, M. Jorge, F. Stoeckli, and N.A. Seaton, Modelling of water
adsorption by activated carbons: effects of microporous structure and oxygen
content, Carbon, 42 (2004) 1947-1952.
[19] J.F. Vivo-Vilches, E. Bailón-García, A.F. Pérez-Cadenas, F. Carrasco-Marín,
and F.J. Maldonado-Hódar, Tailoring activated carbons for the development of
specific adsorbents of gasoline vapors, Journal of Hazardous Materials, 263,
Part 2 (2013) 533-540.
[20] J.F. Vivo-Vilches, E. Bailón-García, A.F. Pérez-Cadenas, F. Carrasco-Marín,
and F.J. Maldonado-Hódar, Tailoring the surface chemistry and porosity of
activated carbons: Evidence of reorganization and mobility of oxygenated
surface groups, Carbon, 68 (2014) 520-530.
[21] C. Moreno-Castilla, F. Carrasco-Marín, C. Parejo-Pérez, and M.V. López
Ramón, Dehydration of methanol to dimethyl ether catalyzed by oxidized
activated carbons with varying surface acidic character, Carbon, 39 (2001) 869-
875.
[22] C. Moreno-Castilla, A.F. Pérez-Cadenas, F.J. Maldonado-Hódar, F. Carrasco-
Marín, and J.L. Fierro, Influence of carbon-oxygen surface complexes on the
surface acidity of tungsten oxide catalysts supported on activated carbons,
Carbon, 41 (2003) 1157-1167.
[23] J.L. Figueiredo, M.F.R. Pereira, M.M.A. Freitas, and J.J.M. Órfao, Modification
of the surface chemistry of activated carbons, Carbon, 37 (1999) 1379-1389.
[24] S. Morales-Torres, F.J. Maldonado-Hódar, A.F. Pérez-Cadenas, and F.
Carrasco-Marín, Design of low-temperature Pt-carbon combustion catalysts for
VOC's treatments, Journal of Hazardous Materials, 183 (2010) 814-822.
[25] G.M. Luckchis, Adsorption systems 1. Design by mass-transfer-zone concept,
Chemical Engineering, 80 (1973) 111.
[26] W.J.J. Webber, Physiochemical Processes for Water Quality Control, Wiley-
Interscience ed., New Cork, 1972.
[27] P.N. Cheremisinoff and F. Ellerbusch, Carbon Adsorption Handbook, Ann
Arbor Science Pub. ed., Michigan, 1978.
Capítulo V 219
[28] J.D. Méndez-Díaz, M.M. Abdel daiem, J. Rivera-Utrilla, M. Sánchez-Polo, and
I. Bautista-Toledo, Adsorption/bioadsorption of phthalic acid, an organic
micropollutant present in landfill leachates, on activated carbons, Journal of
Colloid and Interface Science, 369 (2012) 358-365.
[29] G. Grévillot, S. Marsteau, and C. Vallières, A Comparison of the Wheeler-Jonas
Model and the Linear Driving Force at Constant-Pattern Model for the
Prediction of the Service Time of Activated Carbon Cartridges, Journal of
Occupational and Environmental Hygiene, 8 (2011) 279-288.
[30] A. KhazraeiVizhemehr, F. Haghighat, and C.S. Lee, Gas-phase filters
breakthrough models at low concentration - Effect of relative humidity,
Building and Environment, 75 (2014) 1-10.
[31] J. Wu, O. Claesson, I. Fangmark, and L.G. Hammarstrom, A systematic
investigation of the overall rate coefficient in the Wheeler-Jonas equation for
adsorption on dry activated carbons, Carbon, 43 (2005) 481-490.
[32] G.O. Wood, A review of the effects of covapors on adsorption rate coefficients
of organic vapors adsorbed onto activated carbon from flowing gases, Carbon,
40 (2002) 685-694.
[33] F. Kraehenbuehl, C. Quellet, B. Schmitter, and F. Stoeckli, The relationship
between immersion calorimetry and the parameters of the water adsorption
isotherm on active carbons, Journal of the Chemical Society, Faraday
Transactions, 82 (1986) 3439-3445.
[34] M.A. Lillo-Ródenas, A.J. Fletcher, K.M. Thomas, D. Cazorla-Amorós, and A.
Linares-Solano, Competitive adsorption of a benzene-toluene mixture on
activated carbons at low concentration, Carbon, 44 (2006) 1455-1463.
[35] J.H. Yun, D.K. Choi, and S.H. Kim, Equilibria and dynamics for mixed vapors
of BTX in an activated carbon bed, AIChE Journal, 45 (1999) 751-760.
[36] F.J. Maldonado-Hódar, A.F. Pérez-Cadenas, J.L.G. Fierro, and C. Moreno-
Castilla, Influence of Carbon-Chlorine Surface Complexes on the Properties of
Tungsten Oxide Supported on Activated Carbons. 2. Surface Acidity and

220 Capítulo V
Skeletal Isomerization of 1-Butene, The Journal of Physical Chemistry B, 107
(2003) 5003-5007.

Capítulo VI FITTING THE POROSITY OF CARBON
XEROGEL BY CO2 ACTIVATION TO
IMPROVE THE TMP/n-OCTANE
SEPARATION


FITTING THE POROSITY OF CARBON XEROGEL BY
CO2 ACTIVATION TO IMPROVE THE TMP/n-OCTANE
SEPARATION
Article published in Microporous and Mesoporous Mat., 209 (2015) 10-17, doi: 10.1016/ j.micromeso.2015.01.010
Highlights
Acid catalyzed synthesis of RF gels ends up into microporous carbon materials.
Adsorption capacity is related to wider micropore volume (W0 (N2)) for TMP.
In the case of n-octane to both micropore volumes (W0 (N2) and W0 (CO2).
Dynamic adsorption of n-octane is not influenced by the presence of TMP.
Abstract
Acid catalyzed synthesis of resorcinol-formaldehyde xerogels ends up (after carbonization) into microporous carbon materials with potential use as Carbon Molecular Sieves (CMS). CO2 activation was performed in order to modify the microporosity of the carbon xerogel. As separation of linear and branched paraffins presents an industrial relevance, 2,2′,4-trymethylpentane (TMP) and n-octane dynamic adsorption was tested in order to relate textural properties of different samples with their adsorptive behaviour. Since TMP (ramified) is bulkier than n-octane (linear), carbon xerogels with slim micropores (with low activation degree) were unable to retain this compound. Increasing the burn-off degree, adsorption of TMP is favoured by the pore width increase, but simultaneously, n-octane adsorption also increased by the development of the micropore volume. So that, competitive adsorption experiment were carried out in order to analyze the separation performance of our samples. As expected, the smaller the micropore size, the better the separation results. Therefore, a compromise is needed in order to optimize the CMS or adsorptive behaviour. Keywords: Carbon xerogel, dynamic adsorption, microporosity, hydrocarbon, gas separation.


Capítulo VI 225
6.1. INTRODUCTION
Carbon materials have been largely used in different applications related to
their textural properties1-5. Since many years, activated carbons obtained from different
raw materials such as seeds, woods and other agricultural residues have been, and still
are commercialized all over the world1-3. Nevertheless, in recent years, there is an
increasing interest on obtaining carbon materials with hierarchical porosity for
advanced applications. Even though carbon nanotubes or graphene are the most known
by general public, a lot of research has been made in the field of sol-gel polymerization
technology applied for synthesising carbon-based polymers which can be used as
precursors of nano-structured carbon materials6-11.
One of this kind of materials, which is synthesised by the addition of
formaldehyde to resorcinol (base catalyzed) and the later condensation of larger
molecules (acid catalyzed) formed during the reaction, has been widely used since
Pekala patented the first one11, because of the reproducibility and the easiness of its
synthesis. Furthermore, this process involves several steps with a lot of factors
influencing properties of the end material6,10-12. Therefore, many variables can be
modified and analyzed in order to get information about their influence. For example,
the type of catalyst, solvent or the resorcinol to catalyst ratio are related to porosity and
surface chemistry. Different moulds may be used if materials are needed in different
shapes (films, pellets, powder...). Moreover, carbonization conditions (inert gas, heating
ramp, soak temperature and time, etc.) and drying process (supercritical, vacuum,
microwaves assisted, cryogenic, etc.) can be modified leading to changes on
physicochemical properties of these carbon gels6,7,10.
As it was commented above, base catalysts accelerate the addition of
formaldehyde to resorcinol; but the second reaction to form larger particles which seize
solvent molecules leading to meso-macropores is acid catalyzed. Consequently, when
the process is catalyzed by a base, a lot of small particles are rapidly formed and after
that the condensation of them takes place slowly, while, if an acid catalyst is chosen,
condensation within particles becomes the fastest step. Therefore, acid catalyzed
variants of Pekala's method lead to carbon materials with larger particles and narrower
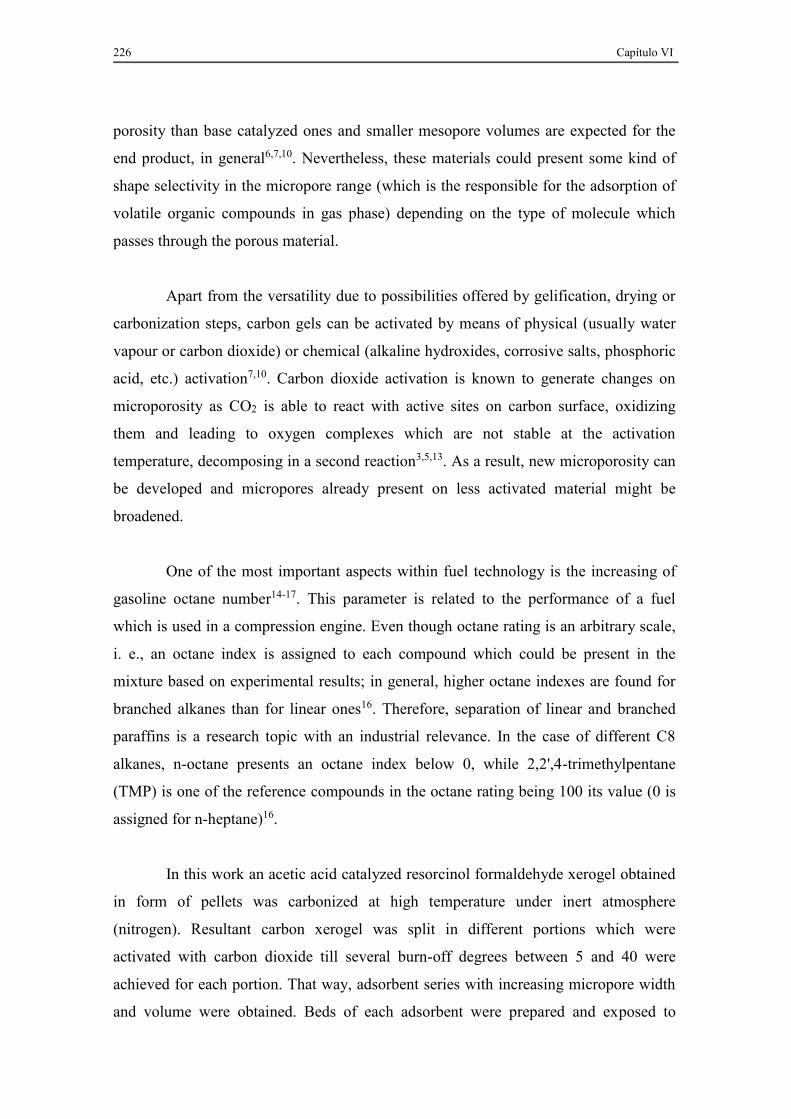
226 Capítulo VI
porosity than base catalyzed ones and smaller mesopore volumes are expected for the
end product, in general6,7,10. Nevertheless, these materials could present some kind of
shape selectivity in the micropore range (which is the responsible for the adsorption of
volatile organic compounds in gas phase) depending on the type of molecule which
passes through the porous material.
Apart from the versatility due to possibilities offered by gelification, drying or
carbonization steps, carbon gels can be activated by means of physical (usually water
vapour or carbon dioxide) or chemical (alkaline hydroxides, corrosive salts, phosphoric
acid, etc.) activation7,10. Carbon dioxide activation is known to generate changes on
microporosity as CO2 is able to react with active sites on carbon surface, oxidizing
them and leading to oxygen complexes which are not stable at the activation
temperature, decomposing in a second reaction3,5,13. As a result, new microporosity can
be developed and micropores already present on less activated material might be
broadened.
One of the most important aspects within fuel technology is the increasing of
gasoline octane number14-17. This parameter is related to the performance of a fuel
which is used in a compression engine. Even though octane rating is an arbitrary scale,
i. e., an octane index is assigned to each compound which could be present in the
mixture based on experimental results; in general, higher octane indexes are found for
branched alkanes than for linear ones16. Therefore, separation of linear and branched
paraffins is a research topic with an industrial relevance. In the case of different C8
alkanes, n-octane presents an octane index below 0, while 2,2',4-trimethylpentane
(TMP) is one of the reference compounds in the octane rating being 100 its value (0 is
assigned for n-heptane)16.
In this work an acetic acid catalyzed resorcinol formaldehyde xerogel obtained
in form of pellets was carbonized at high temperature under inert atmosphere
(nitrogen). Resultant carbon xerogel was split in different portions which were
activated with carbon dioxide till several burn-off degrees between 5 and 40 were
achieved for each portion. That way, adsorbent series with increasing micropore width
and volume were obtained. Beds of each adsorbent were prepared and exposed to

Capítulo VI 227
contaminated air fluxes with n-octane and/or TMP for obtaining breakthrough columns.
Parameters derived from single component and competitive dynamic adsorption
experiments can be related to material microporosity.
6.2. EXPERIMENTAL
6.2.1. Synthesis of RF carbon gels
Resorcinol – formaldehyde polymerization was carried out catalysed by acetic
acid. The hydrogel was prepared by following a protocol similar to the one described in
bibliography7. Same catalyst, solvent to resorcinol and resorcinol to catalyst ratios were
chosen, but modifying gelification conditions (25 °C, 24 h; 50 °C, 24 h; 80 °C, 5 days).
Cylindrical glass moulds with an inner diameter of 5 mm were used in order to obtain
the material in pellets. Water was exchanged by acetone, even though supercritical
drying was not performed, with the intention of reducing porosity collapse caused by
water-polymer surface tension10,12. Xerogel was obtained by drying on a furniture
working under vacuum conditions (65 mbar, 50 °C, 3 h). Aerogel was also synthesised
for comparison purposes.
Carbonization was performed in a tubular oven working under N2 atmosphere
(300 cm3 min-1). A relatively small heating ramp was employed (2 °C min-1) to avoid
cracks. Materials were heated up till 900 °C keeping this temperature for 2 h. Samples
were labelled as AC16 (aerogel) and AC16X (xerogel).
6.2.2. CO2 activation of carbon xerogel
After carbonization, several portions of carbon xerogel were taken and
activated with mixtures of carbon dioxide and nitrogen in different proportions at 870
°C till desired burn off percentages were achieved (5, 10, 20, 40). Carbon dioxide reacts
with carbon walls by a gasification reaction, therefore an increase on micropore volume
and/or width is expected as burn off degree becomes higher 3-5,7,13. Samples were

228 Capítulo VI
named as AC16X5, AC16X10, AC16X20 and AC16X40. Finally, we ended up with
five samples which mainly differ on their microporosity development.
6.2.3. Textural characterization
Sample microphotographs were taken with a Scanning electron microscope
(Leo, Carl Zeiss, Geminy-153). Excitation energy of 20 kV was employed. Textural
properties of samples were determined by adsorption isotherms of N2 (−196 °C) and
CO2 (0 °C) using a Quadrasorb from Quantachrome after outgassing samples overnight
at 110 °C under high vacuum (10−6 mbar). BET surface area, micropore volume (W0)
and micropore mean width (L0) were calculated by applying BET18, Dubinin-
Radushkevich19 and Stoeckli20 equations respectively to the corresponding isotherms.
6.2.4. Dynamic adsorption experiments
Dynamic adsorption experiments were performed with an experimental set-up
described in a previous work21. Gas chromatography with FID detection was also
chosen to quantify VOC concentrations. As samples were obtained in shape of pellets, a
greater weight (1.0 g) and a reactor with a larger inner diameter (0.8 cm) were
employed.
Breakthrough curves for n-octane and 2,2’,4-trimethylpentane (TMP) dynamic
adsorption were obtained and analyzed by using an approach described by
Cheremisinoff et al.22 based on the mass transfer zone concept23-25. Description of result
analysis and obtained parameters can be found in the paper mentioned above21. VOCs
concentration was adjusted at 700 ppm by bubbling air through liquid contaminant and
diluting it with another air flux.
With the purpose of evaluating the separation performance of different
samples, competitive adsorption was also tested. In that case, TMP which is more
weakly adsorbed raises relative concentrations higher than one, since n-octane
molecules displace TMP ones from active sites26,27. The objective is to be able to
separate both isomers since TMP is much bulkier than n-octane (Fig. 6.1).

Capítulo VI 229
Figure 6.1. Molecular structure of TMP (left) and n-octane (right).
6.3. RESULTS AND DISCUSSION
6.3.1. Textural characterization. Isotherms and SEM
Previous works have demonstrated the influence of several parameters on the
textural properties of carbon gels6,10,12. There are many factors within each step of the
process that can be varied and related to different characteristics of the end material. In
previous sections of this paper, we have enumerated some of them along the all
synthesis and some possible post-treatments in order to modify the porosity.
One of these factors, the type of drying process, is crucial in the case of this
kind of material, even more in the case of hydrogels (when water is chosen as solvent).
Depending on the way hydrogel is dried, surface tension between solvent and gel may
lead to a porosity collapse, because meso and macropores are formed during
gelification process, when water is entrapped inside polymer particles6,10,12.
Supercritical drying is known to be the most efficient technique to preserve porous
texture, and aerogels presents wider meso-macropores and larger meso-macropore
volumes in general than xerogels (dried by direct heat or vacuum) or cryogels
(cryogenic drying). If supercritical carbon dioxide is chosen to remove water from the
hydrogel, a previous solvent exchange (typically acetone) is needed since water is not
soluble in supercritical CO2. Previous works on our group have demonstrated that this
step is also desirable for other drying processes12. Therefore, we decided to introduce it
during the synthesis of carbon xerogel.
Bulky
Groups
Bulky
Groups
LinearLinear

230 Capítulo VI
N2 adsorption isotherms at -196 °C and CO2 ones at 0 °C are shown in Fig. 6.2.
Nitrogen isotherms (Fig. 6.2a) are typical for micro-mesoporous solids (a mixture of
Type I and Type IV according to IUPAC), apart from the aerogel AC16 which is
mainly microporous (Type I). The absence of mesopores on AC16 sample will be better
understood after comparing SEM Microphotographs for both samples (Fig. 6.3).
AC16 surface (Fig. 6.3, top) is conformed by a net-like structure were carbon
walls are interconnected forming large pores in form of canals, while in AC16X (Fig.
6.3, bottom) this macroporous network is not present. Drying process should be
responsible for that since both materials were prepared with the same protocol but
modifying this step. Probably a collapse of this macropore network happened, after
drying under vacuum and carbonizing AC16X sample. This collapse produced the
accumulation of spherical particles separated by mesopores that adsorbs nitrogen at
high relative pressure values.
(a) (b)
0
200
400
600
800
0.0 0.2 0.4 0.6 0.8 1.0
VS
TP(c
m3/g
)
P/P0
0
40
80
120
0 0.01 0.02 0.03
VS
TP(c
m3/g
)
P/P0
Figure 6.2. N2 (a) and CO2 (b) adsorption isotherms. AC16 (×), AC16X (○), AC16X5
(△), AC16X10 (□), AC16X20 (◊) and AC16X40 (◆).

Capítulo VI 231
Figure 6.3. SEM microphotographs of AC16 (top) and AC16X (bottom).
Curiously when SEM microphotographs of Baumann et al.7 and ours are
compared, it looks like their aerogel particles are not so interconnected between them.
The only difference between both aerogels is within the gelification process (3 days at
80 °C for Baumann et al.; 1 day 25 °C, 1 day 50 °C and 5 days 80 °C for AC16). It is
very likely that the longer gelification time and the fact that 2 day at lower temperature
were employed produced a greater cross-linkage and leaded to that structure on the
ended material.
It is well known that carbon dioxide isotherms (Fig. 2b) are very useful when
analyzing the slightest microporosity, as nitrogen at -196 °C can not penetrate into
micropores with a very small width smaller28,29. Therefore, we ought to analyze both
data all together in order to get more complete information about microporosity on our
samples. Table 6.1 summarizes textural parameters derived from the analysis of N2 and
CO2 isotherms as well as the actual burn-off degree for each material. We can see
differences in porosity between carbon xerogel and aerogel. Micropore volumes
1 μm
100 nm
1 μm
100 nm

232 Capítulo VI
obtained from both N2 and CO2 are lower in the case of carbon xerogel. Larger mean
micropore widths are also obtained.
Table 6.1. Textural properties of samples.
Sample B.O.
%
SBET
m2·g -1
W0 (N2)
cm3·g -1
W0 (CO2)
cm3·g -1
L0 (N2)
nm
L0 (CO2)
nm
AC16 - 657 0.26 0.29 0.68 0.60
AC16X 0.0 585 0.23 0.26 0.87 0.67
AC16X5 5.4 705 0.27 0.29 0.78 0.62
AC16X10 10.7 716 0.28 0.30 0.89 0.61
AC16X20 20.4 919 0.37 0.34 0.97 0.65
AC16X40 38.4 1381 0.49 0.37 1.18 0.68
As expected, gasification implies a micropore widening which is mainly
responsible for the increase on SBET. Furthermore, this porosity development is higher
on W0 (N2) than on W0 (CO2). Fig. 6.4 shows how micropore volumes obtained with
the two gases (W0(N2) and W0(CO2)) are changing with burn-off degree of the
samples: while W0 (N2) increases almost linearly, W0 (CO2) increases asymptotically.
Variations in W0 and L0 for both gases explain how carbon dioxide activation is acting
on our xerogel AC16X. On the one hand, for lowly activated samples (AC16X5 and
AC16X10) carbon dioxide is mainly generating new microporosity, therefore L0
obtained from both N2 and CO2 are even lower than for non activated sample and W0
(CO2) is still bigger than W0(N2). On the other hand, highly activated samples
(AC16X20 and AC16X40) present larger SBET, W0 (N2) and L0 (N2), which means there
is a pore widening on these samples. Changes on microporosity will be essential to
explain dynamic adsorption results.
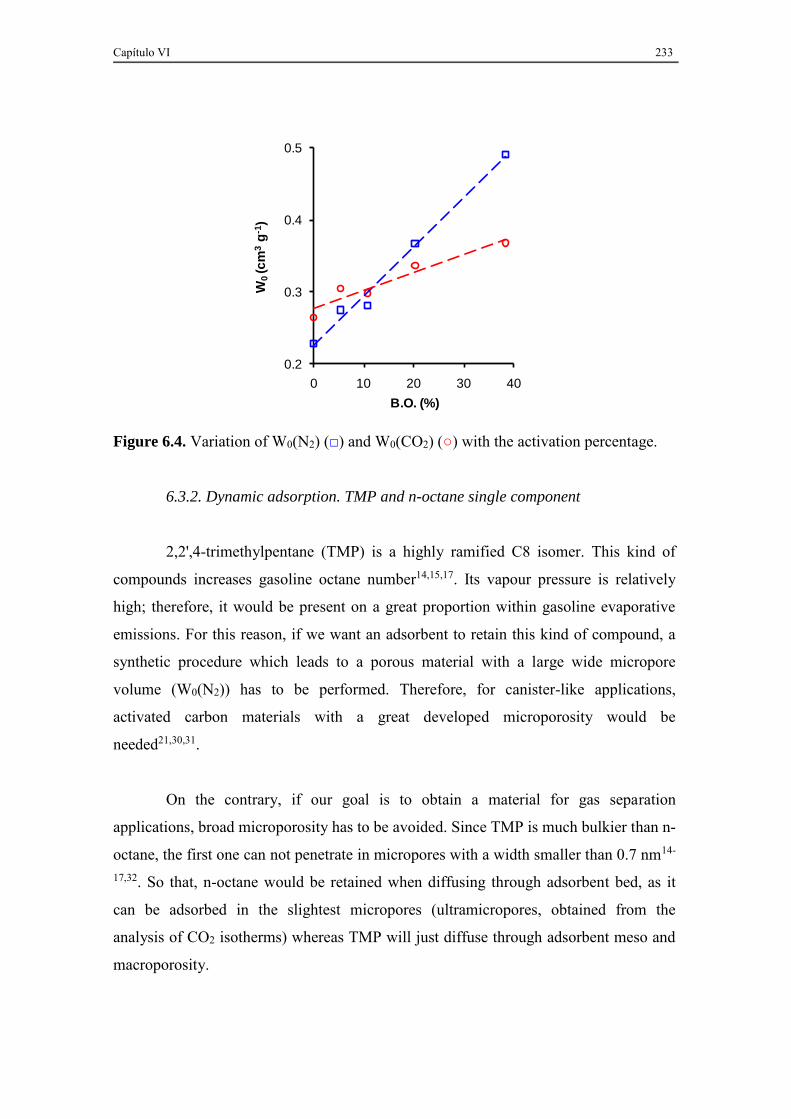
Capítulo VI 233
0.2
0.3
0.4
0.5
0 10 20 30 40
W0
(cm
3g
-1)
B.O. (%)
Figure 6.4. Variation of W0(N2) (□) and W0(CO2) (○) with the activation percentage.
6.3.2. Dynamic adsorption. TMP and n-octane single component
2,2',4-trimethylpentane (TMP) is a highly ramified C8 isomer. This kind of
compounds increases gasoline octane number14,15,17. Its vapour pressure is relatively
high; therefore, it would be present on a great proportion within gasoline evaporative
emissions. For this reason, if we want an adsorbent to retain this kind of compound, a
synthetic procedure which leads to a porous material with a large wide micropore
volume (W0(N2)) has to be performed. Therefore, for canister-like applications,
activated carbon materials with a great developed microporosity would be
needed21,30,31.
On the contrary, if our goal is to obtain a material for gas separation
applications, broad microporosity has to be avoided. Since TMP is much bulkier than n-
octane, the first one can not penetrate in micropores with a width smaller than 0.7 nm14-
17,32. So that, n-octane would be retained when diffusing through adsorbent bed, as it
can be adsorbed in the slightest micropores (ultramicropores, obtained from the
analysis of CO2 isotherms) whereas TMP will just diffuse through adsorbent meso and
macroporosity.

234 Capítulo VI
Breakthrough columns for both TMP (Fig. 6.5a) and n-octane (Fig. 6.5b)
dynamic adsorption show an increment on adsorption capacity and a delay on
breakthrough point as microporosity is developed by carbon dioxide activation (Tables
6.2 and 6.3). As commented before, an increase on the micropore volume improves
VOCs capture performance of the adsorbent. Nonetheless, since both adsorption
capacities are increased (n-octane and TMP), highly activated AC16X20 and AC16X40
are more suitable to be utilized as total adsorbents than as materials for gas separation.
(a) (b)
0.0
0.2
0.4
0.6
0.8
1.0
0 20 40 60 80
C /
C0
V (L)
0.0
0.2
0.4
0.6
0.8
1.0
0 20 40 60 80
C /
C0
V (L)
Figure 6.5. Breakthrough curves for dynamic adsorption of TMP (a) and n-octane (b).
AC16 (×), AC16X (○), AC16X5 (△), AC16X10(□), AC16X20(◊) and AC16X40(◆).
Table 6.2. Parameters obtained from the analysis of TMP breakthrough curves.
Sample Bed Height
cm
V0.02
L
X0.02
mg g-1
V0.90
L
X0.90
mg g-1
HMTZ
cm
RMTZ
cm h-1
AC16 4.4 0.0 0.0 1.9 0.3 - -
AC16X 2.8 1.0 0.6 16.9 6.1 4.97 1.13
AC16X5 3.0 12.6 8.7 23.0 12.7 1.72 0.60
AC16X10 3.2 16.6 11.6 35.8 19.5 2.21 0.41
AC16X20 3.5 44.0 30.7 53.5 35.0 0.66 0.25
AC16X40 4.0 45.5 31.8 60.0 37.9 1.07 0.27

Capítulo VI 235
Table 6.3. Parameters obtained from the analysis of n-octane breakthrough curves.
Sample V0.02
L
X0.02
mg g-1
V0.90
L
X0.90
mg g-1
HMTZ
cm
RMTZ
cm h-1
AC16 26.8 18.2 48.0 26.2 2.45 0.42
AC16X 17.2 12.1 47.8 22.1 2.66 0.37
AC16X5 33.1 23.2 53.8 31.4 1.35 0.23
AC16X10 36.1 25.1 52.0 31.8 1.10 0.25
AC16X20 40.2 28.2 63.8 36.6 1.56 0.24
AC16X40 43.0 30.6 70.8 41.8 1.83 0.24
When aerogel and xerogel are compared, it is observed that the first one retain
less TMP and more n-octane than the second one. In fact, breakthrough point for TMP
in the case of aerogel is so early, that it is hard to obtain any reasonable parameter from
its breakthrough curve. This behaviour is related to the narrower microporosity
commented before for aerogel (which avoids the entry of TMP to it) and to the larger
meso-macropore volume (which accelerates diffusion through pellets). In order to
increase the adsorption capacity and to stablish relationships between microporosity
and dynamic adsorption behaviour AC16X xerogel was activated.
Consequences of physical activation on textural properties were analyzed in the
previous section. CO2 activation generates new micropores for shortly activated
samples and broadens micropores for highly activated ones. Therefore a larger increase
on n-octane adsorption capacity than on TMP one was obtained for AC16X5 since this
adsorbent present a larger volume of narrow micropores, while AC16X10 presents a
similar increase on both adsorption capacities with respect to non activated AC16X
(similar L0 and larger W0) and there is a huge increase on TMP adsorption capacity for
AC16X20 and AC16X40 which have broader microporosity.
Once those results were analyzed, they were plotted versus textural properties,
finding relationships between them. Different type of microporosity is governing the
two adsorption processes. Breakthrough adsorption capacity (X0.02) and saturation

236 Capítulo VI
adsorption capacities (X0.90) obtained from TMP breakthrough curves can be related to
wide micropore volume (W0(N2)) as it is shown in Fig. 6.6. In the case of n-octane
dynamic adsorption, this process seems to be governed by both types of micropores
(W0(N2) and W0(CO2)), increasing the adsorption capacity as they increase (Fig. 6.7).
0
10
20
30
40
0.15 0.35 0.55
X (m
g g
-1)
W0 (N2) (cm3 g-1)
Figure 6.6. Variation of TMP adsorption capacity, X0.02 (♦) and X0.90 (•) with the wide
micropore volume of the samples W0(N2).
(a) (b)
0
10
20
30
40
50
0.15 0.35 0.55
X (m
g g
-1)
W0 (N2) (cm3 g-1)
0
10
20
30
40
50
0.25 0.30 0.35 0.40
X (m
g g
-1)
W0 (CO2) (cm3 g-1)
Figure 6.7. Variation of n-octane adsorption capacity, X0.02 (♦) and X0.90 (•) with the
wide micropore volume of the samples W0(N2) (a) and the narrow micropore volume
W0(CO2) (b).
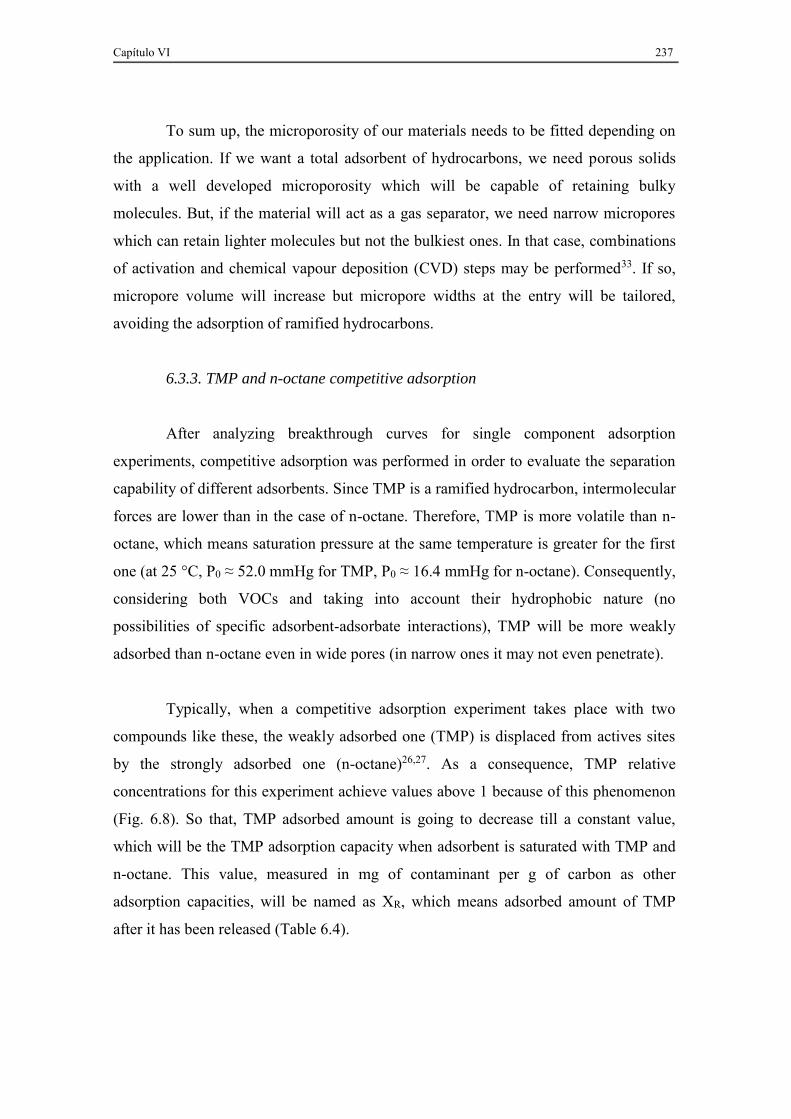
Capítulo VI 237
To sum up, the microporosity of our materials needs to be fitted depending on
the application. If we want a total adsorbent of hydrocarbons, we need porous solids
with a well developed microporosity which will be capable of retaining bulky
molecules. But, if the material will act as a gas separator, we need narrow micropores
which can retain lighter molecules but not the bulkiest ones. In that case, combinations
of activation and chemical vapour deposition (CVD) steps may be performed33. If so,
micropore volume will increase but micropore widths at the entry will be tailored,
avoiding the adsorption of ramified hydrocarbons.
6.3.3. TMP and n-octane competitive adsorption
After analyzing breakthrough curves for single component adsorption
experiments, competitive adsorption was performed in order to evaluate the separation
capability of different adsorbents. Since TMP is a ramified hydrocarbon, intermolecular
forces are lower than in the case of n-octane. Therefore, TMP is more volatile than n-
octane, which means saturation pressure at the same temperature is greater for the first
one (at 25 °C, P0 ≈ 52.0 mmHg for TMP, P0 ≈ 16.4 mmHg for n-octane). Consequently,
considering both VOCs and taking into account their hydrophobic nature (no
possibilities of specific adsorbent-adsorbate interactions), TMP will be more weakly
adsorbed than n-octane even in wide pores (in narrow ones it may not even penetrate).
Typically, when a competitive adsorption experiment takes place with two
compounds like these, the weakly adsorbed one (TMP) is displaced from actives sites
by the strongly adsorbed one (n-octane)26,27. As a consequence, TMP relative
concentrations for this experiment achieve values above 1 because of this phenomenon
(Fig. 6.8). So that, TMP adsorbed amount is going to decrease till a constant value,
which will be the TMP adsorption capacity when adsorbent is saturated with TMP and
n-octane. This value, measured in mg of contaminant per g of carbon as other
adsorption capacities, will be named as XR, which means adsorbed amount of TMP
after it has been released (Table 6.4).
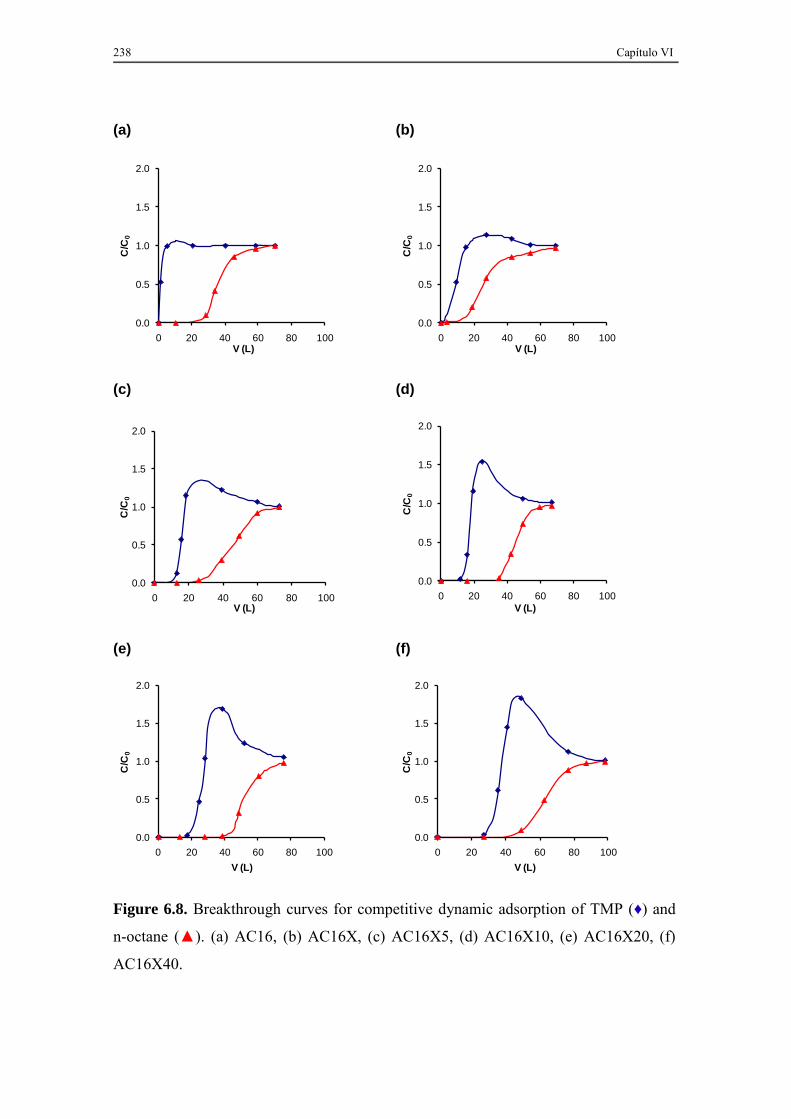
238 Capítulo VI
(a) (b)
0.0
0.5
1.0
1.5
2.0
0 20 40 60 80 100
C/C
0
V (L)
0.0
0.5
1.0
1.5
2.0
0 20 40 60 80 100
C/C
0
V (L)
(c) (d)
0.0
0.5
1.0
1.5
2.0
0 20 40 60 80 100
C/C
0
V (L)
0.0
0.5
1.0
1.5
2.0
0 20 40 60 80 100
C/C
0
V (L)
(e) (f)
0.0
0.5
1.0
1.5
2.0
0 20 40 60 80 100
C/C
0
V (L)
0.0
0.5
1.0
1.5
2.0
0 20 40 60 80 100
C/C
0
V (L)
Figure 6.8. Breakthrough curves for competitive dynamic adsorption of TMP (♦) and
n-octane (▲). (a) AC16, (b) AC16X, (c) AC16X5, (d) AC16X10, (e) AC16X20, (f)
AC16X40.
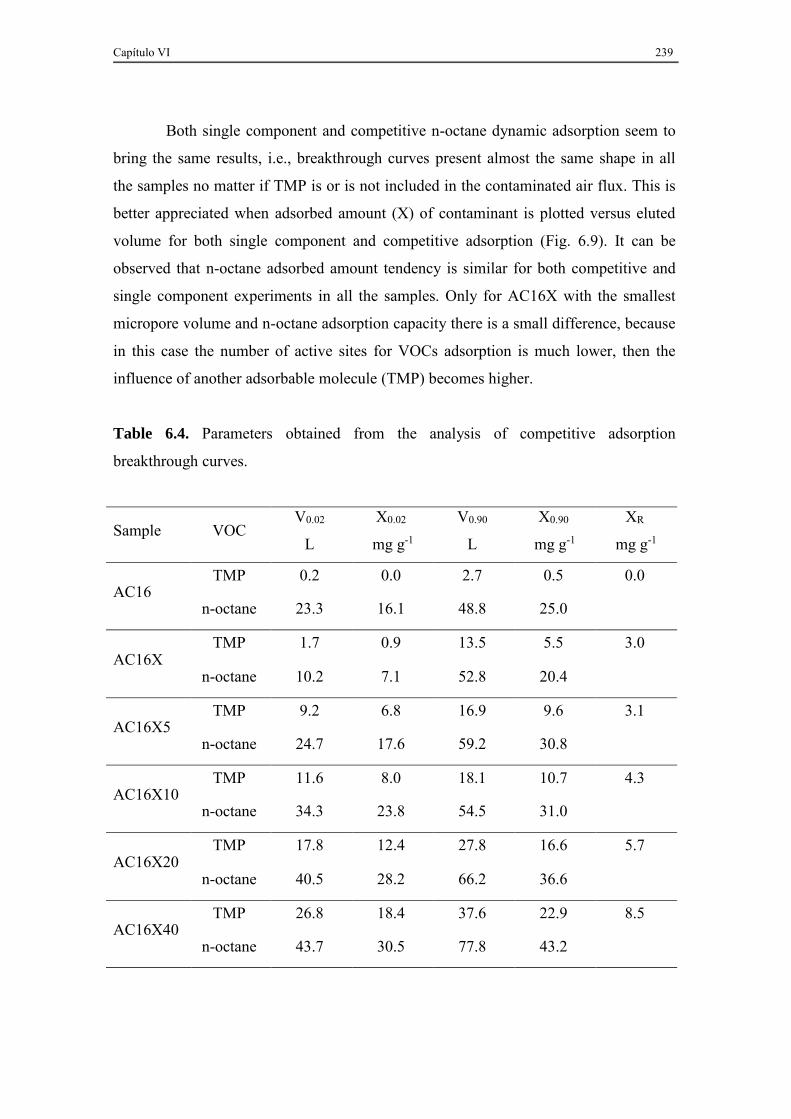
Capítulo VI 239
Both single component and competitive n-octane dynamic adsorption seem to
bring the same results, i.e., breakthrough curves present almost the same shape in all
the samples no matter if TMP is or is not included in the contaminated air flux. This is
better appreciated when adsorbed amount (X) of contaminant is plotted versus eluted
volume for both single component and competitive adsorption (Fig. 6.9). It can be
observed that n-octane adsorbed amount tendency is similar for both competitive and
single component experiments in all the samples. Only for AC16X with the smallest
micropore volume and n-octane adsorption capacity there is a small difference, because
in this case the number of active sites for VOCs adsorption is much lower, then the
influence of another adsorbable molecule (TMP) becomes higher.
Table 6.4. Parameters obtained from the analysis of competitive adsorption
breakthrough curves.
Sample VOC V0.02
L
X0.02
mg g-1
V0.90
L
X0.90
mg g-1
XR
mg g-1
AC16 TMP 0.2 0.0 2.7 0.5 0.0
n-octane 23.3 16.1 48.8 25.0
AC16X TMP 1.7 0.9 13.5 5.5 3.0
n-octane 10.2 7.1 52.8 20.4
AC16X5 TMP 9.2 6.8 16.9 9.6 3.1
n-octane 24.7 17.6 59.2 30.8
AC16X10 TMP 11.6 8.0 18.1 10.7 4.3
n-octane 34.3 23.8 54.5 31.0
AC16X20 TMP 17.8 12.4 27.8 16.6 5.7
n-octane 40.5 28.2 66.2 36.6
AC16X40 TMP 26.8 18.4 37.6 22.9 8.5
n-octane 43.7 30.5 77.8 43.2

240 Capítulo VI
(a) (b)
(c) (d)
(e) (f)
Figure 6.9. Variation of adsorbed amount (X) of TMP (red) and n-octane (blue) for
single component (♦) and competitive (×) dynamic adsorption. (a) AC16, (b) AC16X,
(c) AC16X5, (d) AC16X10, (e) AC16X20, (f) AC16X40.
0
8
16
24
0 20 40 60 80
V (L)
X (
mg
/g)
0
8
16
24
32
0 20 40 60 80
V (L)
X (
mg
/g)
0
8
16
24
32
0 20 40 60 80
V (L)
X (
mg
/g)
0
8
16
24
32
0 20 40 60 80
V (L)
X (
mg
/g)
0
8
16
24
32
40
0 20 40 60 80
V (L)
X (
mg
/g)
0
8
16
24
32
40
48
0 20 40 60 80 100
V (L)
X (
mg
/g)
Capítulo VI 241
There are two reasons that make n-octane adsorption not to be dependent on
the presence of TMP in our experiments: the first one is that there are a lot of active
sites within the narrow microporosity where TMP can not enter and n-octane can. The
second is based on the same idea that the first paragraph of this section 3.3.; since our
carbon gels present a hydrophobic nature, adsorbate-adsorbent interactions will be
much greater for n-octane than for TMP, because methyl groups act as steric hindrance
and intermolecular interactions are restricted. Based on those two premises, we can
now easily explain what is happening in our competitive adsorption experiments. TMP
is not even entering in the narrow microporosity and, in the case of wide one, n-octane
is able to replace TMP so fast (due to its much larger affinity for the adsorbent) that we
can not even see differences in results between both dynamic adsorption experiments.
Nevertheless, if a better separation performance is needed, wide microporosity
(high burn-off degrees) should be avoided, because XR values increase for further
activated samples (Table 6.4). It is also important to consider that time with no one of
the contaminant leaving the adsorption bed is being wasted (the earlier the
breakthrough point for TMP, the better). Beds with late TMP breakthrough points
(AC16X20, AC16X40) would not be useful as separator, but as total adsorbents. As it
was previously pointed out, samples with a large narrow micropore volume (W0 (CO2))
and small micropore width (under 0.7 nm) are desirable at this purpose (samples AC16,
AC16X5, AC16X10). Early n-octane breakthroughs (AC16X) are reducing the useful
time of the separator and are not convenient.
6.4. CONCLUSIONS
Materials were prepared by acetic acid catalyzed polycondensation of
resorcinol and formaldehyde. Both supercritical (aerogel) and vacuum (xerogel) drying
were performed and, after carbonization, xerogel sample was split in several portions
which were physically activated with CO2. Finally, we ended up with six samples
(AC16, AC16X, AC16X5, AC16X10, AC16X20 and AC16X40).
Samples were characterized by gas physical adsorption (N2 and CO2 isotherms)
and Scanning Electron Microscopy (SEM) in order to analyze how both drying process

242 Capítulo VI
and activation were influencing the textural properties and the morphology of our
material. Textural characterization data showed great differences between aerogel
AC16 and xerogel AC16X. Micropore volume is larger for AC16, and changes on
morphology can also be appreciated within the macroporosity range. SEM
microphotographs of AC16 show a macropore network formed by interconnection of
smaller spherical particles. However, in AC16X this structure is not present anymore,
probably because it collapsed during the drying process.
Regarding to activation process and its consequences on textural properties,
those are different depending on the activation percentage. For low activated samples
(till 5-10%) new micropores are generated within the carbon material, therefore, there
is an increase on micropore volume but the mean micropore width is equal or even
smaller. When samples are further activated (above 20%) micropores are broadened,
since most of the active sites for gasification reaction with carbon dioxide are inside
already formed micropores. Because of that micropore volume keeps increasing, not
due to new micropores, but mainly due to the micropore width enlargement.
After analyzing the influence of the drying and the physical activation
processes on the textural properties of our samples, dynamic adsorption experiment
with n-octane and/or TMP contaminated air fluxes were performed. For single gases
experiment, relationships with both narrower and wider microporosity were obtained
for n-octane adsorption capacities and only with broader microporosity for TMP ones.
It is suitable to remember at this point that TMP is bulkier than n-octane and can not
enter in the slightest micropores (below 0.7 nm), which is explaining these results.
When competitive adsorption results are examined and compared with those
for n-octane dynamic adsorption on its own, the conclusion is clear: n-octane
adsorption on our samples is not very influenced by the presence of TMP. Steric
hindrance of TMP is leading to this behaviour in two different ways: avoiding the
entering into the narrowest microporosity and attenuating adsorbate-adsorbent
interactions with carbon surface active sites on wide micropores.

Capítulo VI 243
To sum up, by means of carbon dioxide activation, microporosity can be
tailored depending on the application that we want for our carbon material (gas
separation or VOCs filter). If we want to adsorb every hydrocarbons present on
contaminated air (canister) it is needed a well developed microporosity to retain also
the bulkiest compounds21,30,31. When our material will be utilised to separate branched
from linear hydrocarbons, only narrow micropores are useful, so that large activation
percentages should be avoided or other procedures to block micropore entries (as
chemical vapour deposition) must be performed33.
6.5. REFERENCES
[1] R.G. Bansal, J.B. Donnet, and F. Stoeckli, Activated Carbon, Marcel Dekker,
New York and Basel, 1988.
[2] T.D. Burchel, Carbon materials for advanced technologies, Elsevier Science,
Amsterdam, 1999.
[3] H. Marsh and F. Rodríguez-Reinoso, Activated Carbon, Elsevier, Oxford, 2006.
[4] C. Moreno-Castilla, F. Carrasco-Marín, M.V. López-Ramón, and M.A. Alvarez-
Merino, Chemical and physical activation of olive-mill waste water to produce
activated carbons, Carbon, 39 (2001) 1415-1420.
[5] F. Rodríguez-Reinoso and M. Molina-Sabio, Activated carbons from
lignocellulosic materials by chemical and/or physical activation: an overview,
Carbon, 30 (1992) 1111-1118.
[6] S.A. Al-Muhtaseb and J.A. Ritter, Preparation and Properties of
ResorcinolFormaldehyde Organic and Carbon Gels, Advanced Materials, 15
(2003) 101-114.
[7] T.F. Baumann, M.A. Worsley, T.Y.-J. Han, and J. Satcher, High surface area
carbon aerogel monoliths with hierarchical porosity, Journal of Non-Crystalline
Solids, 354 (2008) 3513-3515.
[8] M. Inagaki, Pores in carbon materials-importance of their control, New Carbon
Materials, 24 (2009) 193-232.
244 Capítulo VI
[9] J. Lee, J. Kim, and T. Hyeon, Recent Progress in the Synthesis of Porous
Carbon Materials, Advanced Materials, 18 (2006) 2073-2094.
[10] F.J. Maldonado-Hódar, Advances in the development of nanostructured
catalysts based on carbon gels, Catalysis Today, 218219 (2013) 43-50.
[11] R.W. Pekala, Low density, resorcinol-formaldehyde aerogels, US Patent,
US4997804 A, 1991.
[12] E. Gallegos-Suárez, A.F. Pérez-Cadenas, F.J. Maldonado-Hódar, and F.
Carrasco-Marín, On the micro- and mesoporosity of carbon aerogels and
xerogels. The role of the drying conditions during the synthesis processes,
Chemical Engineering Journal, 181182 (2012) 851-855.
[13] S. Román, J.F. González, C.M. González-García, and F. Zamora, Control of
pore development during CO2 and steam activation of olive stones, Fuel
Processing Technology, 89 (2008) 715-720.
[14] J.F. Denayer, W. Souverijns, P.A. Jacobs, J.A. Martens, and G.V. Baron, High-
Temperature Low-Pressure Adsorption of Branched C5C8 Alkanes on Zeolite
Beta, ZSM-5, ZSM-22, Zeolite Y, and Mordenite, Journal of Physical
Chemistry B, 102 (1998) 4588-4597.
[15] L.I. Devriese, J.A. Martens, J.W. Thybaut, G.B. Marin, G.V. Baron, and J.F.M.
Denayer, A new methodology to probe Shape Selectivity in Porous Adsorbents,
Microporous and Mesoporous Materials, 116 (2008) 607-613.
[16] G.C. Laredo, J. Castillo, and J.O. Marroquin, Gas-phase diffusion of linear and
multi-branched alkanes on a carbon molecular sieve by the ZLC method,
Separation and Purification Technology, 103 (2013) 36-42.
[17] J.A.C. Silva and A.E. Rodrigues, Separation of n/iso-paraffins mixtures by
pressure swing adsorption, Separation and Purification Technology, 13 (1998)
195-208.
[18] S. Brunauer, P.H. Emmett, and E. Teller, Adsorption of gases in multimolecular
layers, Journal of the American Chemical Society, 60 (1938) 309-319.
[19] M.M. Dubinin, Inhomogeneous microporous structures of carbonaceous
adsorbents, Carbon, 19 (1981) 321-324.

Capítulo VI 245
[20] F. Stoeckli, Porosity in carbon. Characterization and applications. Eds. Patrick
J. Arnold, London, 1995.
[21] J.F. Vivo-Vilches, E. Bailón-García, A.F. Pérez-Cadenas, F. Carrasco-Marín,
and F.J. Maldonado-Hódar, Tailoring activated carbons for the development of
specific adsorbents of gasoline vapors, Journal of Hazardous Materials, 263,
Part 2 (2013) 533-540.
[22] P.N. Cheremisinoff and F. Ellerbusch, Carbon Adsorption Handbook, Ann
Arbor Science Pub. ed., Michigan, 1978.
[23] G.M. Luckchis, Adsorption systems 1. Design by mass-transfer-zone concept,
Chemical Engineering, 80 (1973) 111.
[24] A.J. Michaels, Industrial Chemistry, Vol. 44, Washington D.C., 1952.
[25] W.J.J. Webber, Physiochemical Processes for Water Quality Control, Wiley-
Interscience ed., New Cork, 1972.
[26] G.O. Wood, A review of the effects of covapors on adsorption rate coefficients
of organic vapors adsorbed onto activated carbon from flowing gases, Carbon,
40 (2002) 685-694.
[27] L. Yanxu, C. Jiangyao, and S. Yinghuang, Adsorption of multicomponent
volatile organic compounds on semi-coke, Carbon, 46 (2008) 858-863.
[28] D. Cazorla-Amorós, J. Alcañiz-Monge, M.A. Casa-Lillo, and A. Linares-
Solano, CO2 as an Adsorptive To Characterize Carbon Molecular Sieves and
Activated Carbons, Langmuir, 14 (1998) 4589-4596.
[29] D. Lozano-Castelló, D. Cazorla-Amorós, and A. Linares-Solano, Usefulness of
CO2 adsorption at 273 K for the characterization of porous carbons, Carbon, 42
(2004) 1233-1242.
[30] U. Mohr, Activated carbon canisters for automobiles, Filtration & Separation,
34 (1997) 1016-1018.
[31] K. Sato and N. Kobayashi, Adsorption and Desorption Simulation of Carbon
Canister Using n-Butane as Model Compound of Gasoline, Journal of the Japan
Petroleum Institute, 54 (2011) 136-145.

246 Capítulo VI
[32] S. Lagorsse, F.D. Magalhaes, and A. Mendes, Carbon molecular sieve
membranes: Sorption, kinetic and structural characterization, Journal of
Membrane Science, 241 (2004) 275-287.
[33] D. Lozano-Castello, J. Alcaniz-Monge, D. Cazorla-Amorós, A. Linares-Solano,
W. Zhu, F. Kapteijn, and J.A. Moulijn, Adsorption properties of carbon
molecular sieves prepared from an activated carbon by pitch pyrolisis, Carbon,
43 (2005) 1643-1651.

Capítulo VII BIOGAS UPGRADING BY SELECTIVE
ADSORPTION ONTO CO2 ACTIVATED
CARBON FROM WOOD PELLETS


BIOGAS UPGRADING BY SELECTIVE ADSORPTION
ONTO CO2 ACTIVATED CARBON FROM WOOD
PELLETS
Article sent to Journal of Environmental Chemical Engineering
Highlights
Activated carbon from commercial pine wood pellets was prepared.
Physical activation increased micropore volume and the accessibility to macropores.
Changes in porosity lead to a very selective CO2 adsorbent for biogas upgrading.
The material is an excellent candidate for CO2/CH4 separation in dynamic conditions.
Abstract
An activated carbon from commercial pine wood pellets was obtained by means of physical activation with carbon dioxide. Carbonized sample was also prepared in order to compare both samples. Carbonization lead to a material with very low micropore volume, which was increased when physical activation was performed (W0(N2) from 0.00 to 0.22 cm3·g -1 and W0(CO2) from 0.21 to 0.31 cm3·g -1). After characterizing their porous texture, samples were tested as CO2 selective adsorbent in a mixture of CH4 and CO2; at first high pressure isotherms of both compounds were obtained at different temperatures to calculate the adsorbed amount of each compound at given pressure and temperature (for PINPEL20: CO2, qsat = 6.66 mol·kg -1 and Hads= 28.4 kJ·mol -1; CH4, qsat = 3.36 mol·kg -1 and Hads= 19.0 kJ·mol -1). Variations on isosteric heat of adsorption with uptake were also analysed (it was increased with uptake in the case of CO2 and the opposite tendency was found for CH4). Selectivity resulted larger for the activated sample (2.9 versus 1.9 at 1 bar and 30 °C), so this one was chosen to perform dynamic adsorption experiments. Breakthrough curves demonstrated the outstanding performance of sample as CO2 selective adsorbent in both single component experiments (Breakthrough time 995 s for CH4 and 1545 s for CO2) and competitive adsorption (950 s for CH4 and 1373 s for CO2). Activated sample showed an excellent behaviour as CO2 selective adsorbent for biogas upgrading. Keywords: Activated carbon; biogas upgrading; carbon dioxide; selective adsorption.


Capítulo VII 251
7.1. INTRODUCTION
There is an increasing interest on finding alternatives to fossil fuels, especially
in countries which are energetically dependent on others. Nowadays, it is more and
more frequent to find processes in which biomass is used to obtain biofuels such as
bioethanol or biodiesel, and also biogas (produced by anaerobic digestion of organic
waste). Biogas and natural gas in general (methane) is a cleaner energy source than
other heavier hydrocarbons, since it produces the highest amount of energy regarding
the quantity of CO2 generated during its combustion1-5. Nevertheless, in the case of
biogas, the main drawback is its high content on carbon dioxide (it might be as high as
40% or more) which significantly reduces its heating capacity. Therefore, for biogas to
be used, a previous separation step in order to reduce the CO2 content is needed6-12.
There are several methodologies for biogas upgrading such as amine
absorption13,14, membrane separation15, cryogenic distillation or adsorption-based
technologies6-9,12,16,17. Nowadays, the most used is the CO2 absorption by liquid amines;
however, the interaction between amines and CO2 is very strong, so a high energy
supply is needed in order to regenerate the absorptive system7. Adsorption-based
technologies present as main advantage the lower energetic demand for regeneration,
and also they are easier to scale-down than the others3,7-12,16,17. Regeneration can be
performed by several methods as changing pressure (Pressure Swing Adsorption, PSA),
temperature (Temperature Swing Adsorption, TSA; Electric Swing Adsorption, ESA)
or applying vacuum (vacuum pressure swing adsorption, VPSA).
Regarding the adsorbent, typically zeolites10,12,17,18 or activated
carbons1,6,9,11,12,16-25 are used, but there are also several works where metal-organic
frameworks (MOFs) serve at this purpose7,8,17,21,26. Each of them present advantages
and drawbacks, but activated carbons are the ones with lower price, since they can be
obtained from agricultural waste materials. Activated carbons from very different
origins have been tested, sometimes functionalized with different heteroatoms1,19,20,24,27.
When choosing the activation method, it needs to be considered that a preferential
adsorption for CO2 regarding CH4 is required. In this sense, physical activation with
252 Capítulo VII
CO2 is preferable to steam or chemical activation, since these methods produce a larger
micropore widening9.
As it was previously mentioned, activated carbons can be obtained from a wide
variety of natural sources, being common choices agricultural wastes. From them,
wood-based materials are frequently used as raw materials9,25,28-30. In Spain, but also in
other countries, wood pellets obtained from hot extrusion of pine wood residues in the
shape of chips from logging or pruning waste are replacing almond shells or olive
stones on house-heating systems. This cheap raw material is a good candidate to obtain
activated carbon, since it is already pelletized, and it can be activated without
destroying its structure. In some published research works people make their own
pellets from wood sawdust and ashes with binders30, but the use of already
commercialized materials with no binder will lower the cost of final material.
In our work, an activated carbon obtained by physical activation of pine wood
pellets used in domestic heating applications was selected to be tested on the selective
adsorption of CO2 from a CH4/CO2 mixture. After characterizing its porous texture,
equilibrium isotherms of target molecules were obtained at different temperatures in
order to calculate maximum adsorbed amounts and specific heats of adsorption. Finally,
adsorptive beds were packed into a column in order to perform breakthrough
experiments for single component and binary mixtures of CH4 and CO2.
7.2. MATERIALS AND METHODS
7.2.1. Synthesis of samples
Pine wood pellets supplied by Los Reyes del Pellet C.B. were used as raw
material. These pellets are prepared by hot extrusion of pine chips with pressure and
temperature. The humidity must be controlled, since there is no binder as lignin will
serve this purpose, and proper water proportion is required. These pellets were used to
obtain two samples: one by carbonization under N2 atmosphere and another by
carbonization/activation with CO2. The pellets were weighed and thermal treatments
were applied with a heating ramp of 10°C min-1 up to 900°C. Carbonization was

Capítulo VII 253
performed on N2 (300 cm3min-1) and once at 900°C the samples were either kept at this
temperature for two hours (PINPEL); or the inlet gas was switched to CO2 and the
temperature maintained for five hours in the case of physically activated sample
(PINPEL20). Final yield of the carbonization/activation process was 25% in the case of
PINPEL and 20% in the case of PINPEL20, so the burn off degree of sample
PINPEL20 resulted on 20% (regarding the one carbonized under nitrogen, activated
sample weighed 20% less).
7.2.2. Textural characterization of samples
N2 adsorption-desorption isotherms at -196 °C and CO2 adsorption at 0 °C
were obtained in a QUADRASORB SI (Quantachrome Inc.) and analysed in order to
determine textural properties of material. Specific surface area (SBET) from BET
equation applied to N2 isotherm and micropore volumes (W0) calculated from Dubinin-
Raduskevich model for the two gases were obtained, as well as micropore mean width
(L0) from Stoeckli equation. BJH model was applied to desorption branch of N2
isotherms in order to obtain the Pore Size Distribution (PSD) in the mesopore range.
QSDFT was also applied in order to obtain PSD for microporosity. Scanning electron
microscopy was also used to take microphotographs of sample surface. The instrument
used was a Leo, Carl Zeiss, Geminy-153.
Mercury Intrusion Porosimetry was performed at Pedro Nunes Institute,
Coimbra using an AUTOPORE IV 9500 (Micromeritics). This technique was applied
to obtain PSD for wider mesopores and macropores and to calculate bulk densities of
samples, in order to estimate the amount adsorbed of different gases per volume unit
(which could be more important than the mass based amount in some cases).
7.2.3. Equilibrium isotherms of CH4 and CO2 at high pressures
The CH4 and the CO2 adsorption isotherms at 30, 50 and 70°C were obtained in
a pressure range from 0 to 10 bar by using a magnetic suspension balance (Rubotherm,
Germany). This instrument presents as its main advantage, comparing to conventional
gravimetric apparatus, the fact that the measuring module is physically separated from

254 Capítulo VII
the sample container and the rest of the instrument so more drastic measurement
conditions can be used. This system is also more accurate than conventional
equipments and density measurements can be assessed since it contains a reference
volume (sinker) inside.
Before measuring the adsorption isotherms, samples were activated under
vacuum (P<0.01bar) at 150°C for 24 hours and Helium pycnometry was performed in
order to calculate skeletal density and sample volume, so correction of buoyancy effect
could be made. Then gases were introduced at different pressures and variations on
weight were followed till equilibrium was achieved. The amount adsorbed at several
pressures were obtained in order to calculate and analyse the adsorption/desorption
isotherms. Isotherms were fitted to Langmuir or Toth model (Equation 7.1 and 7.2),
using the same fitting for the three isotherms at different temperatures. After that,
individual fittings were applied to 30 and 50°C isotherms and isosteric pressures were
obtained from 70°C isotherm experimental data and from the individual fittings at 50°C
and 30°C. Isosteric heats of adsorption where then calculated by applying Equation 7.3:
Equation 7.1
Equation 7.2
Equation 7.3
Where q, adsorbed amount, and, qsat, saturation capacity (mol kg-1); b,
Langmuir/Toth constant (bar-1); n, the heterogeneity parameter (n=1 for the Langmuir
model); P and T, pressure and temperature (bar, K); and Hads, heat of adsorption (kJ
mol-1).
7.2.4. Breakthrough experiments
A bed with 113.5g of PINPEL20 was packed into a column of 90.1 cm (Fig.
7.1). Glass wool was placed at both ends of the column, so final height of the bed was

Capítulo VII 255
88.1 cm. Once packed, column was pressurized at 2 bar with He and activation was
performed by heating the system up to 150 °C (2 °C min-1, 24 hours) under a
continuous flow of He. After cooling, the bed was weighed again, resulting in 111.4 g
of dry PINPEL20 (around 2% of mass loss). A Gas Chromatograph Master GC (DANI)
with FID and TCD detection and a capillary column (HPPLOT U) was used to quantify
CH4 and CO2 at the exit (T injector, 180 °C; T oven, 50 °C; T TCD, 180 °C). Three
mass flow controllers (MFC) were used to set the amount of each gas that would enter
inside the column and a mass flow meter (MFM) was placed at the exit. Three
thermocouples were placed at different heights of the system to record the temperature
histories of both adsorption and desorption processes (one of the sensors was placed
touching the wall of the stainless steel column to measure changes on its temperature).
Figure 7.1. Length of column for PINPEL20 and other important distances.
Conditions for breakthrough experiments were P = 1.5 bar; T = 30 °C; Q = 0.3
L min-1 (STP); x = 0.6 for CO2 and 0.4 for CH4. When single component adsorption
was tested, gases were diluted with He to get the total flux. In the case of desorption,
He passed through the column in the same conditions (P, T and Q).
7.3. RESULTS AND DISCUSSION
7.3.1. Textural Characterization
N2 isotherm (Fig. 7.2a) corresponds to a micro-mesoporous material in the case
of PINPEL20. Almost no N2 adsorption was observed for the sample PINPEL. CO2

256 Capítulo VII
isotherms (Fig. 7.2b) were also obtained in order to get narrow micropore volume. PSD
was determined by QSDFT, BJH and Mercury Intrusion Porosimetry in order to cover
the range of porosity between wider micropores (> 0.7 nm) and macropores (Fig. 7.2c).
When PINPEL and PINPEL20 are compared, two remarkable things are observed: the
first consists on a huge increment on micropore volume, which is common for carbon
materials activated with CO2; but also, there is an increment on the mesopore volume
obtained by BJH and macropore one obtained by Mercury Intrusion Porosimetry. Since
these pores are similar in size to those present on PINPEL sample, it could be
concluded that CO2 is reacting also within the inter-particle voids (wood pellets are
formed by extrusion of small particles which link one to another by means of humidity,
heat and pressure due to the lignin and wood resins) improving the accessibility to the
porosity of the sample. In terms of bulk density, the increase of porosity for sample
PINPEL20 results in a remarkable reduction of this parameter compared to the one of
PINPEL (Table 7.1). Micropore widening is also denoted by the increment on W0(N2)
and L0(CO2).
Table 7.1. Textural properties obtained from N2 and CO2 isotherms and Hg
porosimetry.
Sample SBET
m2·g -1
W0(N2)
cm3·g -1
W0(CO2)
cm3·g -1
L0(CO2)
Nm
VBJH
cm3·g -1
Hg
g·cm-3
PINPEL 0 0.00 0.21 0.61 0.03 0.83
PINPEL20 561 0.22 0.31 0.84 0.10 0.52

Capítulo VII 257
Figure 7.2. a) Adsorption (continuous) and desorption (dashed) N2 isotherms at -
196°C. b) Adsorption CO2 isotherms at 0°C. c) PSD obtained from different techniques
QSDFT (continuous); BJH (dots); Hg porosimetry (symbol). PINPEL20 (□), PINPEL
(△).
SEM microphotographs of carbon surface were obtained in order to analyse the
morphology of carbonized wood pellets and the consequences of CO2 activation on it
(Fig. 7.3). They reveal that CO2 activation affected not only the microporosity of the
sample, but also the external surface, since carbon dioxide reacted with wood walls.
This is in good agreement with the fact that mesopore and macropore volume increased
after activation, as it was previously pointed out.

258 Capítulo VII
50 mm 5 mm
100 mm 2 mm
Figure 7.3. SEM microphotographs of samples PINPEL (top) and PINPEL20 (bottom).
7.3.2. CO2 and CH4 isotherms at different temperatures
Once porous texture of samples was characterized, they were introduced in a
gravimetric equipment in order to obtain adsorption-desorption isotherms for the target
gases, CO2 and CH4 (Fig. 7.4). Variation of the isosteric heat of adsorption with
adsorbed amount was calculated by analyzing the isotherms at different temperatures.
Desorption was also performed to observe if isotherms presented hysteresis loops. As
commented, experimental data were fitted to Langmuir or Toth model depending on the
suitability of each one. From them, different parameters were obtained by minimizing
the fitting error regarding experimental points (Table 7.2).
PINPEL was only used in order to compare its behaviour with the one of
PINPEL20, and, due to its poorer selectivity and its lower CO2 adsorption capacity this
sample was not tested in CO2/CH4 separation under dynamic conditions. By using
Langmuir/Toth fittings (for CO2 and CH4) variation of ideal selectivity with total

Capítulo VII 259
pressure for a 50%/50% mixture of both gases was obtained (Fig. 7.5), showing that
PINPEL20 presented the largest selectivity in the all range of pressure tested.
0.0
2.0
4.0
0.0 2.0 4.0 6.0 8.0 10.0
q (m
ol
kg
-1)
P (bar)
303 K
323K
343 K
a
0.0
2.0
4.0
0.0 2.0 4.0 6.0 8.0 10.0
q (m
ol
kg
-1)
P (bar)
303 K
323K
343 K
b
0.0
2.0
4.0
0.0 2.0 4.0 6.0 8.0 10.0
q (m
ol
kg
-1)
P (bar)
303 K
323K
343 K
c
0.0
2.0
4.0
0.0 2.0 4.0 6.0 8.0 10.0
q (m
ol
kg
-1)
P (bar)
303 K
323K
343 K
d
Figure 7.4. Adsorption (close) and desorption (open) isotherms of CH4 (a, c) and CO2
(b, d). PINPEL (top), PINPEL20 (bottom).
Table 7.2. Parameters obtained from CO2 and CH4 isotherms by applying Langmuir or
Toth model.
Sample Compound Model qsat
mol kg-1
b0
bar-1
Hads|
kJ mol-1 n
PINPEL CH4 Toth 4.05 3.12·10-4 19.9 0.52
CO2 Toth 4.49 1.60·10-5 30.0 0.53
PINPEL20 CH4 Langmuir 3.36 1.72·10-4 19.0 -
CO2 Toth 6.66 1.79·10-5 28.4 0.49

260 Capítulo VII
0
2
4
6
8
0 10 20
S C
O2/C
H4
PT (bar)
a
0
2
4
6
8
0 1 2
S C
O2/C
H4
PT (bar)
b
1
2
5 10 15 20
S C
O2/C
H4
PT (bar)
c
Figure 7.5. Variation of CO2/CH4 ideal selectivity for a 50%/50% mixture with total
pressure for PINPEL20 (■) and PINPEL (▲). a) All the range of P; b) Low pressures;
c) High pressures.
10.0
15.0
20.0
25.0
30.0
0.0 1.0 2.0
Q (
kJ
mo
l-1)
q (mol kg-1)
a
25.0
27.5
30.0
32.5
0.0 1.0 2.0 3.0
Q (
kJ
mo
l-1)
q (mol kg-1)
b
10.0
15.0
20.0
25.0
30.0
0.0 1.0 2.0
Q (
kJ
mo
l-1)
q (mol kg-1)
c
22.5
25.0
27.5
30.0
32.5
0.0 1.0 2.0 3.0
Q (
kJ
mo
l-1)
q (mol kg-1)
d
Figure 7.6. Variation of isosteric heat of adsorption (Q) with adsorbed amount (q) for
CH4 (a, c) and CO2 (b, d). PINPEL (top), PINPEL20 (bottom).

Capítulo VII 261
From the analysis of the isotherms, variation of isosteric heat of adsorption with
adsorbed amount can be also studied. In this case, similar conclusions were obtained for
the two samples: the isosteric heat of adsorption decreased with uptake in the case of
CH4 and increased when CO2 was used as adsorbate (Fig. 7.6). Heat of adsorption
calculated from Langmuir or Toth fitting are included on the plots as a reference.
7.3.3. Breakthrough experiments
Breakthrough experiments were performed only with the activated sample
PINPEL20 since it was the one with the highest CO2/CH4 selectivity. Instrument and
conditions were described on the previous section. After measuring the concentration of
each gas and the volumetric flow rate (STP) at the exit at different times, these values
were converted to molar fluxes in order to represent its variation with time. To
represent breakthrough curves by using molar fluxes presents as main advantage that its
integration to obtain adsorbed amounts is direct. When breakthrough curves of CO2 and
CH4 were compared (Fig. 7.7 and 7.8), it was observed an earlier breakthrough time for
the methane (995s versus 1545s) even though concentration of carbon dioxide on the
stream was larger than the one of methane (60% for CO2 and 40% for CH4). The
adsorbent was totally regenerated after the experiment by switching inlet gas to pure
He. Regarding temperature profiles, it is observed that temperature increased more
when CO2 was adsorbed. This is related to the difference between heat of adsorptions
for both compounds (Table 7.2).
When binary adsorption breakthrough curves (Fig. 7.9a) were analyzed and
compared with single component experiments, several differences were observed. For
instance, the breakthrough point for methane remained more or less the same (Table
7.3) while the adsorbed amount became smaller. The opposite tendency was observed
for CO2, where the adsorption front is more dispersed, so breakthrough time was
shortened, but after displacing the methane, adsorbed amount at the end resulted very
similar to the one for single component experiment. In fact, this dispersion was clearly
observed in temperature profiles (Fig. 7.9b and 7.9c), and was due to the displacment of
methane by the carbon dioxide front. When the adsorption front reached the
thermocouple located at the middle of the column, the adsorption peaks for CH4 and

262 Capítulo VII
CO2 were already distinguishable, and the second one (corresponding to CO2
adsorption) became wider than the peak observed for single component adsorption.
0.00
0.05
0.10
0.15
0.20
0.25
0.30
0.35
0 5000 10000 15000 20000
FC
O2
(mm
ol
s-1
)
t (s)
a
25
30
35
40
45
0 5000 10000 15000
T ( C
)
t (s)
Top
Middle
Bottom
b
25
30
35
40
45
0 2500 5000
T ( C
)
t (s)
Top
Middle
Bottom
c
Figure 7.7. a) Breakthrough curve for dynamic adsorption of CO2 (60%) onto
PINPEL20. b) Temperature profiles for the three sections of the column. c)
Temperature profiles detailed for adsorption.
Table 7.3. Parameters obtained from the analysis of PINPEL20 breakthrough curves.
Experiment Inl. Conc.
%
qads
mol kg-1
tb
s
qads (V)
mol dm-3
Single CO2 60% CO2 (in He) 2.14 1545 1.11
Single CH4 40% CH4 (in He) 0.99 995 0.52
Binary 40% CH4 0.43 1373 0.22
60% CO2 2.14 950 1.11

Capítulo VII 263
0.00
0.05
0.10
0.15
0.20
0 2000 4000 6000 8000 10000 12000
FC
H4
(mm
ol
s-1
)
t (s)
a
25
30
35
40
0 5000 10000 15000
T ( C
)
t (s)
Top
Middle
Bottom
b
25
30
35
40
0 1000 2000
T ( C
)
t (s)
Top
Middle
Bottom
c
Figure 7.8. a) Breakthrough curve for dynamic adsorption of CH4 (40%) onto
PINPEL20. b) Temperature profiles for the three sections of the column. c)
Temperature profiles detailed for adsorption.
0.00
0.05
0.10
0.15
0.20
0.25
0.30
0 5000 10000 15000
Fi(m
mo
l s
-1)
t (s)
aa
25
30
35
40
45
0 5000 10000 15000
T ( C
)
t (s)
Top
Middle
Bottom
b
25
30
35
40
45
0 1000 2000 3000
T ( C
)
t (s)
Top
Middle
Bottom
c
Figure 7.9. a) Breakthrough curve for dynamic adsorption of a gas mixture (60% CO2
(▲)and 40% CH4 (■)) onto PINPEL20. b) Temperature profiles for the three sections
of the column. c) Temperature profiles detailed for adsorption.

264 Capítulo VII
7.4. CONCLUSIONS
An activated carbon with excellent CO2 to CH4 selectivity was prepared from
commercial wood pellets used on domestic heating applications by physical activation
with carbon dioxide at high temperature. The treatment generated a considerable
volume of micropores which mean width was around 0.84 nm. These micropores are
responsible for the difference between CO2 adsorbed amount for PINPEL20 sample and
the one for PINPEL. This increment on CO2 adsorbed amount was much larger than on
CH4 one, so there was a great increment on CO2/CH4 selectivity in the all range of
pressures.
Equilibrium adsorption results are in good agreement with breakthrough ones,
since breakthrough time and adsorbed amount for CO2 are larger than for CH4.
Furthermore, when both compounds were introduced inside the reactor, the
breakthrough for CH4 occurred much earlier than for CO2 and there was a part of the
experiment where only methane was detected at the exit of the column, moreover, for
several seconds with concentrations of 100%. Therefore, under these conditions,
PINPEL20 was able to separate CH4 and CO2, obtaining pure CH4 from a 60% CO2 and
40% CH4 mixture.
To sum up, PINPEL20 is a sample obtained from a cheap commercial product
constituted by biomass waste (wood pellets), activated with CO2 at high temperature,
which is a simple and relatively fast process, and with excellent properties as CO2/CH4
selective adsorbent. Therefore, it would be a really good candidate to be applied on
biogas upgrading by adsorption-based technologies.
7.5. REFERENCES
[1] W. Djeridi, N. Ben Mansour, A. Ouederni, P.L. Llewellyn, and L. El Mir,
Influence of the raw material and nickel oxide on the CH4 capture capacity
behaviors of microporous carbon, International Journal of Hydrogen Energy,
40 (2015) 13690-13701.

Capítulo VII 265
[2] J. Alcañiz-Monge, D. Lozano-Castelló, D. Cazorla-Amorós, and A. Linares-
Solano, Fundamentals of methane adsorption in microporous carbons,
Microporous and Mesoporous Materials, 124 (2009) 110-116.
[3] M. Gu, B. Zhang, Z. Qi, Z. Liu, S. Duan, X. Du, and X. Xian, Effects of pore
structure of granular activated carbons on CH4 enrichment from CH4/N2 by
vacuum pressure swing adsorption, Separation and Purification Technology,
146 (2015) 213-218.
[4] S. Biloé, V. Goetz, and A. Guillot, Optimal design of an activated carbon for an
adsorbed natural gas storage system, Carbon, 40 (2002) 1295-1308.
[5] J. Alcañiz-Monge, M.A. Casa-Lillo, D. Cazorla-Amorós, and A. Linares-
Solano, Methane storage in activated carbon fibres, Carbon, 35 (1997) 291-297.
[6] Y.J. Wu, Y. Yang, X.M. Kong, P. Li, J.G. Yu, A.M. Ribeiro, and A.E.
Rodrigues, Adsorption of Pure and Binary CO2, CH4, and N2 Gas Components
on Activated Carbon Beads, Journal of Chemical Engineering Data, 60 (2015)
2684-2693.
[7] P. Serra-Crespo, R. Berger, W. Yang, J. Gascon, and F. Kapteijn, Separation of
CO2/CH4 mixtures over NH2-MIL-53An experimental and modelling study,
Chemical Engineering Science, 124 (2015) 96-108.
[8] A.F.P. Ferreira, A.M. Ribeiro, S. Kulaç, and A.E. Rodrigues, Methane
purification by adsorptive processes on MIL-53(Al), Chemical Engineering
Science, 124 (2015) 79-95.
[9] N. Álvarez-Gutiérrez, M.V. Gil, F. Rubiera, and C. Pevida, Adsorption
performance indicators for the CO2/CH4 separation: Application to biomass-
based activated carbons, Fuel Processing Technology, 142 (2016) 361-369.
[10] J.A.C. Silva, A.F. Cunha, K. Schumann, and A.E. Rodrigues, Binary adsorption
of CO2/CH4 in binderless beads of 13X zeolite, Microporous and Mesoporous
Materials, 187 (2014) 100-107.
[11] Y.J. Kim, Y.S. Nam, and Y.T. Kang, Study on a numerical model and PSA
(pressure swing adsorption) process experiment for CH4/CO2 separation from
biogas, Energy, 91 (2015) 732-741.
266 Capítulo VII
[12] M.C. Campo, A.M. Ribeiro, A.F.P. Ferreira, J.C. Santos, C. Lutz, J.M.
Loureiro, and A.E. Rodrigues, Carbon dioxide removal for methane upgrade by
a VSA process using an improved 13X zeolite, Fuel Processing Technology,
143 (2016) 185-194.
[13] J. Kim, D.A. Pham, and Y.I. Lim, Gasliquid multiphase computational fluid
dynamics (CFD) of amine absorption column with structured-packing for CO2
capture, Computers & Chemical Engineering, 88 (2016) 39-49.
[14] Y. Liu, H. Li, G. Wei, H. Zhang, X. Li, and Y. Jia, Mass transfer performance
of CO2 absorption by alkanolamine aqueous solution for biogas purification,
Separation and Purification Technology, 133 (2014) 476-483.
[15] Z. Bacsik, O. Cheung, P. Vasiliev, and N. Hedin, Selective separation of CO2
and CH4 for biogas upgrading on zeolite NaKA and SAPO-56, Applied Energy,
162 (2016) 613-621.
[16] B.M. Jeong, E.S. Ahn, J.H. Yun, C.H. Lee, and D.K. Choi, Ternary adsorption
equilibrium of H2/CH4/C2H4 onto activated carbon, Separation and
Purification Technology, 55 (2007) 335-342.
[17] J. McEwen, J.D. Hayman, and A. Ozgur Yazaydin, A comparative study of
CO2, CH4 and N2 adsorption in ZIF-8, Zeolite-13X and BPL activated carbon,
Chemical Physics, 412 (2013) 72-76.
[18] M. Kacem, M. Pellerano, and A. Delebarre, Pressure swing adsorption for
CO2/N2 and CO2/CH4 separation: Comparison between activated carbons and
zeolites performances, Fuel Processing Technology, 138 (2015) 271-283.
[19] H.R. Yu, S. Cho, B.C. Bai, K.B. Yi, and Y.S. Lee, Effects of fluorination on
carbon molecular sieves for CH4/CO2 gas separation behavior, International
Journal of Greenhouse Gas Control, 10 (2012) 278-284.
[20] S. Furmaniak, P. Kowalczyk, A.P. Terzyk, P.A. Gauden, and P.J.F. Harris,
Synergetic effect of carbon nanopore size and surface oxidation on CO2 capture
from CO2/CH4 mixtures, Journal of Colloid and Interface Science, 397 (2013)
144-153.
Capítulo VII 267
[21] Z.H. Rada, H.R. Abid, J. Shang, Y. He, P. Webley, S. Liu, H. Sun, and S.
Wang, Effects of amino functionality on uptake of CO2, CH4 and selectivity of
CO2/CH4 on titanium based MOFs, Fuel, 160 (2015) 318-327.
[22] M.V. Gil, N. Álvarez-Gutiérrez, M. Martínez, F. Rubiera, C. Pevida, and A.
Morán, Carbon adsorbents for CO2 capture from bio-hydrogen and biogas
streams: Breakthrough adsorption study, Chemical Engineering Journal, 269
(2015) 148-158.
[23] C.A. Grande, R. Blom, A. Möller, and J. Möllmer, High-pressure separation of
CH4/CO2 using activated carbon, Chemical Engineering Science, 89 (2013) 10-
20.
[24] T. Dasgupta, S.N. Punnathanam, and K.G. Ayappa, Effect of functional groups
on separating carbon dioxide from CO2/N2 gas mixtures using edge
functionalized graphene nanoribbons, Chemical Engineering Science, 121
(2015) 279-291.
[25] D.J. Seo, Z. Gou, H. Fujita, T. Fujii, and A. Sakoda, Simple fabrication of
molecular sieving carbon for biogas upgrading via a temperature controlled
carbonization of Phyllostachys pubescens, Renewable Energy, 86 (2016) 693-
702.
[26] X. Wu, M. Niknam Shahrak, B. Yuan, and S. Deng, Synthesis and
characterization of zeolitic imidazolate framework ZIF-7 for CO2 and CH4
separation, Microporous and Mesoporous Materials, 190 (2014) 189-196.
[27] A. Heidari, H. Younesi, A. Rashidi, and A.A. Ghoreyshi, Evaluation of CO2
adsorption with eucalyptus wood based activated carbon modified by ammonia
solution through heat treatment, Chemical Engineering Journal, 254 (2014)
503-513.
[28] A.R. Mohamed, M. Mohammadi, and G.N. Darzi, Preparation of carbon
molecular sieve from lignocellulosic biomass: A review, Renewable and
Sustainable Energy Reviews, 14 (2010) 1591-1599.

268 Capítulo VII
[29] A. Amaya, N. Medero, N. Tancredi, H. Silva, and C. Deiana, Activated carbon
briquettes from biomass materials, Bioresource Technology, 98 (2007) 1635-
1641.
[30] M.G. Plaza, I. Durán, F. Rubiera, and C. Pevida, CO2 adsorbent pellets
produced from pine sawdust: Effect of coal tar pitch addition, Applied Energy,
144 (2015) 182-192.
[31] M.J. Regufe, J. Tamajon, A.M. Ribeiro, A. Ferreira, U.H. Lee, Y.K. Hwang,
J.S. Chang, C. Serre, J.M. Loureiro, and A.E. Rodrigues, Syngas Purification by
Porous Amino-Functionalized Titanium Terephthalate MIL-125, Energy Fuels,
29 (2015) 4654-4664.

Capítulo VIII RESORCINOL-FORMALDEHYDE CARBON
XEROGEL AS SELECTIVE ADSORBENT OF
CARBON DIOXIDE PRESENT ON BIOGAS


RESORCINOL-FORMALDEHYDE CARBON XEROGEL
AS SELECTIVE ADSORBENT OF CARBON DIOXIDE
PRESENT ON BIOGAS
Article to be sent to Separation and Purification Technology
Highlights
Resorcinol-Formaldehyde carbon xerogel was obtained employing Cs2CO3 as catalyst.
An adsorbent with developed microporosity and macroporosity was synthesized.
This material showed a large CO2 to CH4 selectivity in equilibrium adsorption.
Carbon xerogel could be an excellent CO2 selective adsorbent from CO2/CH4 mixtures.
Abstract
A carbon xerogel obtained by carbonization of a Resorcinol-Formaldehyde polymer which was synthesized using Cs2CO3 as catalyst was employed as CO2 selective adsorbent for biogas upgrading. The material presented a large narrow micropore volume (W0(CO2) = 0.34 cm3·g -1) and macropore one; as expected for a carbon xerogel, these macropores were very regular in size. The CO2 preferential adsorption onto this material was tested by analysing equilibrium isotherms of both gases (CO2 and CH4) and breakthrough curves at different inlet concentrations. Equilibrium studies showed a large CO2 uptake (qsat = 6.57 mol·kg -1 and Hads= 28.4 kJ·mol -1) regarding CH4 one (qsat = 3.83 mol·kg-1 and Hads= 19.6 kJ·mol -1) which results in a high CO2 to CH4 selectivity, specially at low pressures. Dynamic adsorption of both gases at different concentrations demonstrated the excellent performance of our xerogel in biogas upgrading by selective adsorption of CO2. Keywords: Carbon xerogel; biogas upgrading; carbon dioxide; selective adsorption.

Capítulo VIII 273
8.1. INTRODUCTION
Biogas is obtained by anaerobic digestion of diverse materials such as manure,
crops and food industry wastes. Depending on the source, its composition may vary,
but it contains mainly carbon dioxide (more than 30%) and methane (about 60%)1-4.
The rest of contaminants which conformed the rest of the mixture are air and really
hazardous compounds such as siloxanes or hydrogen sulphide at low concentrations4,5.
These are removed before biogas can be utilized in electric power plants or other
applications where it is not necessary to remove CO2. Nevertheless, biogas needs to be
transformed into biomethane (CO2 separation) for applications which imply the
transport of liquefied CH4 (LBG), since methane needs to be compressed6-10.
Furthermore, the main application of biomethane it is to be used as fuel, so high heat
capacity, which is lower for CO2 than for CH4, is required.
In order to perform the separation of CO2, process known as biogas upgrading,
several technologies have been studied. Cryogenic distillation7 or membrane
separation9 are some of the alternatives to liquid amine absorption8,10,11, the one utilized
nowadays in the industry. The main problem with the chemical absorption is the
amount of energy required to regenerate the amines6,10,12. To solve this problem,
adsorption-based technologies are presented as a sound alternative for CO2/CH4
separation, and there is an increasing interest on finding suitable materials for the
selective adsorption of carbon dioxide from biogas stream6,10,12-20. Several materials
have been tested at this purpose: Metal-organic frameworks (MOFs)16,21, functionalized
silica17,20, zeolites13,15 and carbon based materials12,14,18,19,22-25. From these last,
activated carbons from agricultural wastes could be a proper choice due to their low
prize, which makes them very competitive12,18,19; however, their main drawback is that
the control of pore size through activation methods is hard, and often, their textural
properties strongly depends on the raw material.
Over the last years, a great effort has been made in finding synthetic routes
which yield nanostructured carbon materials from polymeric precursors22,26-30. Carbon
precursors obtained by sol-gel polymerization of different monomers (such as aromatic
compounds or sugars) have been widely studied29-32. From them, resorcinol-
274 Capítulo VIII
formaldehyde gels are commonly found in literature for different applications since
Pekala patented the first one in the early 90s26,27. The versatility of this process where
people can vary the catalyst, dilution ratio, solvent, temperature, drying method and
other variables, joint to its reproducibility are the two main factors which make it so
attractive for researchers29,31-35.
In our work, a resorcinol-formaldehyde carbon xerogel was utilized as CO2
selective adsorbent for biogas upgrading. The material was synthesized, characterized
by diverse techniques, and then tested in the adsorption of both gases (carbon dioxide
and methane) under equilibrium and dynamic conditions. Results were analyzed in
order to optimize the textural properties of samples which will be used in future work.
8.2. MATERIALS AND METHODS
8.2.1. Synthesis of XCs300
A carbon xerogel was obtained by carbonization of a polymer made by
resorcinol and formaldehyde (Fig. 8.1). The recipe used to obtain this xerogel was very
similar to one already published by our group34. Briefly, resorcinol and formaldehyde
in a 1:2 molar proportion were dissolved in water (R/W=0.07) joint to the
polymerization catalyst which was Cs2CO3 (R/C=300). Once reactants and catalyst
were totally dissolved, solution was transferred to cylindrical glass moulds with 6 mm
of inner diameter, and moulds were sealed. Then, a temperature program was selected
to perform the gelification and curing of the RF hydrogel (1 day, 25 °C; 1 day, 50 °C
and 5 days, 80 °C). The polymeric precursor was then removed from glass moulds, cut
into pellets of 2-3 cm and dried in a furnace at 110°C till constant weight to obtain the
organic Xerogel (in the case of Morales-Torres et al. water was exchanged by acetone
before drying). This xerogel was put into a tubular oven and carbonized at 900 °C (1.5
°C·min -1) on nitrogen. The sample was labelled as XCs300.
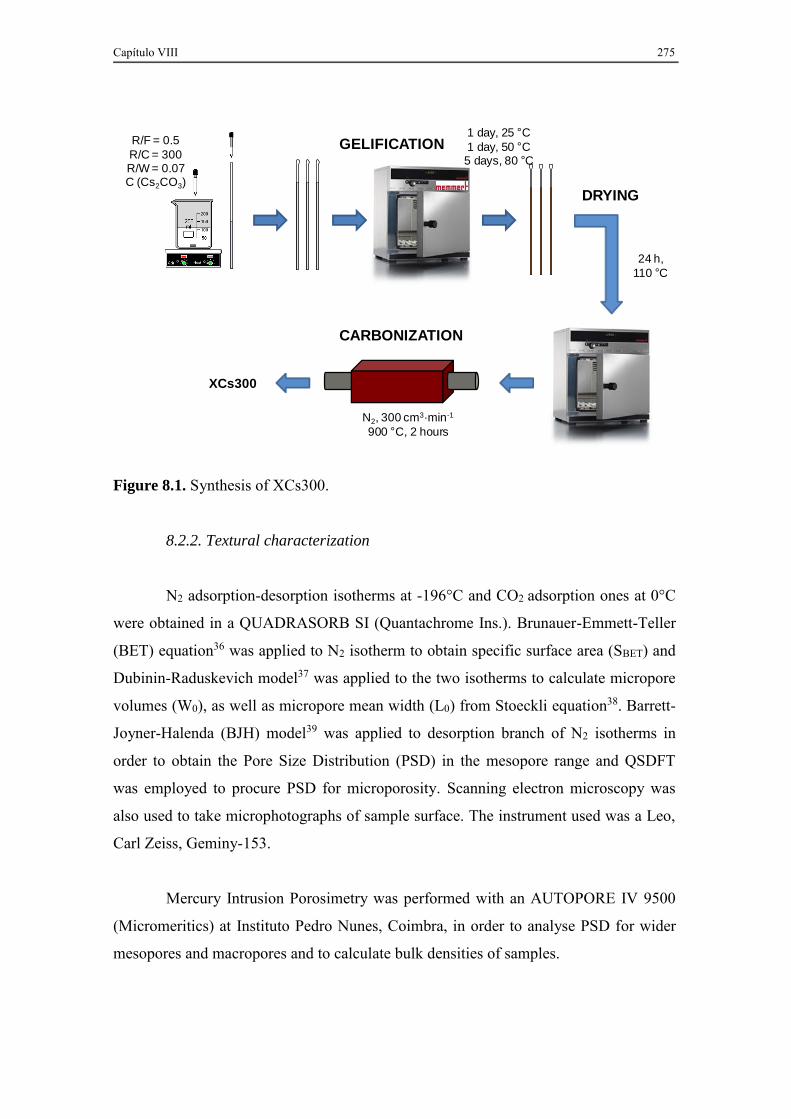
Capítulo VIII 275
XCs300
R/F = 0.5
R/C = 300R/W = 0.07C (Cs2CO3)
1 day, 25 C
1 day, 50 C5 days, 80 C
N2, 300 cm3·min-1
900 C, 2 hours
24 h,
110 C
GELIFICATION
DRYING
CARBONIZATION
Figure 8.1. Synthesis of XCs300.
8.2.2. Textural characterization
N2 adsorption-desorption isotherms at -196°C and CO2 adsorption ones at 0°C
were obtained in a QUADRASORB SI (Quantachrome Ins.). Brunauer-Emmett-Teller
(BET) equation36 was applied to N2 isotherm to obtain specific surface area (SBET) and
Dubinin-Raduskevich model37 was applied to the two isotherms to calculate micropore
volumes (W0), as well as micropore mean width (L0) from Stoeckli equation38. Barrett-
Joyner-Halenda (BJH) model39 was applied to desorption branch of N2 isotherms in
order to obtain the Pore Size Distribution (PSD) in the mesopore range and QSDFT
was employed to procure PSD for microporosity. Scanning electron microscopy was
also used to take microphotographs of sample surface. The instrument used was a Leo,
Carl Zeiss, Geminy-153.
Mercury Intrusion Porosimetry was performed with an AUTOPORE IV 9500
(Micromeritics) at Instituto Pedro Nunes, Coimbra, in order to analyse PSD for wider
mesopores and macropores and to calculate bulk densities of samples.

276 Capítulo VIII
8.2.3. Equilibrium isotherms of CH4 and CO2 at high pressures
Isotherms of target compounds were obtained at different temperatures (30 °C,
50 °C and 70 °C). The pressure was varied from 0 to 10 bars and differences in weight
were registered with a magnetic suspension balance (Rubotherm, Germany).
Firstly, samples were activated under vacuum at 150°C for 24 hours and after
cooling, Helium pycnometry was performed to obtain skeletal density and sample
volume, so buoyancy correction could be performed. After that, different pressures of
methane or carbon dioxide were introduced into the equipment, measuring the weight
changes on the sample and waiting till equilibrium was reached. From these data, gas
uptakes at different pressures were obtained (kg·mol-1) and equilibrium isotherms were
analysed by fitting experimental points to Langmuir/Toth model (Equations 8.1 and
8.2) and the same equation was used for the three isotherms of each gas. Finally, in
order to obtain the variation of isosteric heat of adsorption with loading (Equation 8.3)
individual regression curves were adjusted to experimental points at 30°C and 50°C.
These plots and experimental points at 70°C were used to calculate the characteristic
curve for each adsorbent-adsorbate system from isosteric pressures.
Equation 8.1
Equation 8.2
Equation 8.3
Where q, adsorbed amount, and, qsat, saturation capacity (mol kg-1); b,
Langmuir/Toth constant (bar-1); n, the heterogeneity parameter (n=1 for the Langmuir
model); P and T, pressure and temperature (bar, K); and Hads, heat of adsorption (kJ
mol-1).

Capítulo VIII 277
8.2.4. Breakthrough experiments
Adsorptive bed was packed with 10.2 g of XCs300, resulting on a column of
9.1 cm in height, with an inner diameter of 2.3 cm (Fig. 8.2). The activation was
performed on He (100 cm3·min -1) at 150 °C for 24 hours. Detection at the exit was
made by using an infrared gas analyser GasDataLMSxiTypeG4.18 (GasDataLtd,UK).
T
2.3 cm
9.7 cm
9.6 cm
0.5 cm 5.0
cm
Figure 8.2. Length of column for XCs300 and other important distances.
Several breakthrough tests were performed at 30°C and 2.5 bar, varying inlet
concentration. Three mass flow controllers (MFC) were used to set the amount of each
gas that would enter inside the column and a mass flow meter (MFM) was placed at the
exit. Temperature variation was registered by means of a thermocouple located at the
middle part of the column. Once saturated, XCs300 was isothermally regenerated by
switching inlet gas to Helium.
8.3. RESULTS AND DISCUSSION
8.3.1. Textural Characterization
XCs300 is a micro-mesoporous xerogel with a type I-IV nitrogen isotherm
(Fig. 8.3a) where a great amount of gas was adsorbed at low pressures but the
adsorption continued at higher pressures. A large hysteresis loop which covers different

278 Capítulo VIII
pressures indicates the presence of mesopores of diverse width as denoted by the PSD
curve (Fig. 8.3c). A large portion of micropores are narrow, therefore, W0(CO2),
micropore volume calculated from CO2 isotherm (Fig. 8.3b), resulted larger than
W0(N2), calculated from N2 one (Table 8.1). Regarding Mercury Intrusion Porosimetry,
the corresponding PSD showed a maximum at 100 nm with macropores very regular in
size (±20nm) and rising 4.0 cm3·g -1 which is a considerable volume. This homogeneity
in the pore size within the meso-macropore range is usual for carbon gels29,31,32, since
these pores are generated during the sol-gel polymerization (although a shrinkage is
produced when gels are dried and carbonized, so the width of these pores is reduced,
but homogeneity is maintained). The large volume of macropores present on XCs300 is
responsible for its low bulk density (Table 8.1).
0.00
0.20
0.40
0.60
0.0 0.5 1.0
Vliq(c
m3
g-1
)
P/P0
a
0.00
0.10
0.20
0.00 0.01 0.02 0.03
Vliq(c
m3
g-1
)
P/P0
b
0.00
1.00
2.00
3.00
4.00
0 1 10 100 1000 10000 1000001000000
dV
(lo
gD
)(c
m3
g-1
)
D (nm)
c
Figure 8.3. a) Adsorption (continuous) and desorption (dashed) N2 isotherms at -
196°C. b) Adsorption CO2 isotherms at 0°C. c) PSD obtained from different techniques
QSDFT (continuous); BJH (dots); Hg porosimetry (dashed). XCs300.

Capítulo VIII 279
Table 8.1. Textural properties of sample XCs300.
Sample SBET
m2·g -1
W0(N2)
cm3·g -1
W0(CO2)
cm3·g -1
L0(CO2)
nm
VBJH
cm3·g -1
Hg
g·cm-3
XCs300 591 0.23 0.34 0.73 0.27 0.58
SEM microphotographs showed the typical structure for Resorcinol-
Formaldehyde carbon gels. Xerogels are conformed by spherical particles which are
more or less condensed depending on the synthesis conditions, the drying and the
carbonization process. In the case of XCs300, it is constituted by particles of
approximately 50 nm, very regular in size, but forming some agglomerates. The void
space between each group of condensate particles was about 100 nm which is
consistent with PSD obtained by Mercury Intrusion Porosimetry.
300 nm 100 nm
Figure 8.4. SEM microphotographs of XCs300.
8.3.2. Equilibrium CO2 and CH4 isotherms at different temperatures
Once porous texture of sample was characterized, it was introduced in a
gravimetric equipment in order to obtain adsorption-desorption isotherms for the target
gases, CO2 and CH4 (Fig. 8.4). As commented in previous section, experimental data

280 Capítulo VIII
were fitted to Langmuir/Toth model and different parameters were obtained (Table
8.2).
Adsorption isotherms illustrated the preferential CO2 adsorption regarding CH4
onto XCs300. At low pressures, CO2 uptake was several times larger than CH4’s one,
and in the range from atmospheric pressure up to 10 bar, the CO2 adsorbed amount
resulted higher than twice the CH4 one. This is better observed when ideal selectivity
for a 50%/50% mixture of both gases is plotted versus total pressure (Fig. 8.5).
0.0
2.0
4.0
0.0 2.0 4.0 6.0 8.0 10.0
q (m
ol
kg
-1)
P (bar)
303 K
323 K
343 K
aa
0.0
2.0
4.0
0.0 2.0 4.0 6.0 8.0 10.0
q (m
ol
kg
-1)
P (bar)
303 K
323 K
343 K
b
Figure 8.4. Adsorption (close) and desorption (open) isotherms of CH4 (a) and CO2 (b).
0
2
4
6
8
0 10 20
S C
O2/C
H4
PT (bar)
a
0
2
4
6
8
0 1 2
S C
O2/C
H4
PT (bar)
b
0
1
2
5 10 15 20
S C
O2/C
H4
PT (bar)
c
Figure 8.5. Variation of CO2/CH4 selectivity with total pressure for XCs300. a) All the
range of P; b) Low pressures; c) High pressures.

Capítulo VIII 281
Table 8.2. Parameters obtained from CO2 and CH4 isotherms with Langmuir/Toth
model.
Compound Model qsat
mol·kg -1
b0
bar-1
Hads
kJ·mol -1 n
CH4 Langmuir 3.83 1.81·10-4 19.6 -
CO2 Toth 6.57 2.17·10-5 28.4 0.53
Isosteric heat of adsorption was obtained at each loading in order to obtain the
characteristic curve for each adsorbate-adsorbent system (Fig. 8.6). The heat of
adsorption increased with loading in the case of CO2 while the opposite tendency was
observed for CH4 adsorption, therefore, the affinity of XCs300 was stronger for CO2.
10.0
15.0
20.0
25.0
30.0
0.0 1.0 2.0 3.0
Q (
kJ
mo
l-1)
q (mol kg-1)
a
22.5
25.0
27.5
30.0
32.5
0.0 2.0 4.0
Q (
kJ
mo
l-1)
q (mol kg-1)
b
Figure 8.6. Variation of isosteric heat of adsorption (Q) with loading (q) for CH4 (a)
and CO2 (b).
8.3.3. Dynamic adsorption experiments
Single component breakthrough tests were carried out at different
concentrations for each of the gases. Experiments were conducted at 2.5 bar,

282 Capítulo VIII
temperature was kept at 30°C and temperature variations due to the adsorption and the
desorption processes were registered.
Breakthrough curves at 2.5 bar were obtained at several inlet gas concentration
to evaluate the adsorptive behaviour of XCs300. Differences in breakthrough times
were observed for CH4 (Fig. 8.7) and CO2 (Fig. 8.8), specially at larger concentrations,
since partial pressure was higher, and the isotherm started to curve (if adsorption
capacity increased linearly with gas pressure, breakthrough curves should not change
significantly, but this is not the case).
0.00
0.10
0.20
0 500 1000 1500 2000
FC
H4
(mm
ol
s-1
)
t (s)
a
20
30
40
50
0 500 1000 1500 2000
T ( C
)
t (s)
b
0.00
0.10
0.20
0 100 200 300 400 500
FC
H4
(mm
ol
s-1
)
t (s)
c
0.00
0.10
0.20
1300 1500 1700 1900
FC
H4
(mm
ol
s-1
)
t (s)
d
Figure 8.7. Breakthrough curves for CH4 adsorption onto XCs300. a) Entire
experiments, b) Temperature profiles, c) Adsorption branch, d) Desorption branch
(after dashed line on a). 100%(■), 63%(◆) and 22%(▲) CH4 diluted with He.

Capítulo VIII 283
When breakthrough curves for pure components (100%) are compared, it
becomes clear that CH4 breakthrough time was shorter than CO2 ones. This difference
increased as gas partial pressures decreased, which was not surprising since CO2 to CH4
selectivity was larger at low pressures (Fig. 8.5). Regeneration was completed no
matter what the conditions were.
Regarding differences between curves at increasing concentration, these are
larger in the case of CO2, where the delay on breakthrough time as concentration
decreased were larger. This was also in good agreement with the isotherms (Fig. 8.4),
since the adsorption of CO2 was very large at low pressures and then increased slowly.
0.00
0.10
0.20
0 2000 4000
FC
O2
(mm
ol
s-1
)
t (s)
a
20
30
40
50
60
0 2000 4000
T ( C
)
t (s)
b
0.00
0.10
0.20
0 500 1000 1500
FC
O2
(mm
ol
s-1
)
t (s)
c
0.00
0.10
0.20
2300 2800 3300 3800 4300
FC
O2
(mm
ol
s-1
)
t (s)
d
Figure 8.8. Breakthrough curves for CO2 adsorption onto XCs300. a) Entire
experiments, b) Temperature profiles, c) Adsorption branch, d) Desorption branch.
100%(■), 40%(◆) and 8%(▲) CO2 diluted with He.

284 Capítulo VIII
Regarding temperature profiles, as expected, the temperature increase was
larger as the adsorbed amount was, and also greater for the CO2 since the specific heat
of adsorption was larger and the adsorbed amount also. Single component breakthrough
tests, joint to equilibrium isotherms, demonstrated the preferential adsorption of CO2
regarding CH4. Nevertheless, binary adsorption experiments should be performed in
order to evaluate the behaviour of XCs300 when both gases are present.
Table 8.3. Parameters obtained from single component breakthrough curves at 2.5 bar.
Compound Inl. Conc.
%
qads
mol kg-1
tb
s
CH4 22 0.20 136
CH4 63 2.56 106
CH4 100 2.60 98
CO2 8 0.98 756
CO2 100 6.08 146
8.4. CONCLUSIONS
A carbon xerogel was prepared by carbonization of a resorcinol-formaldehyde
gel polymerized using Cs2CO3 as catalyst. This material was prepared by a similar
procedure to one already published by our group, since porous texture of this sample
could be proper for the desired application, which was biogas upgrading.
The micro-mesoporous solid obtained, named XCs300, was characterized and
tested as selective adsorbent of CO2 in CO2/CH4 mixtures. This material presented a
large volume of micropores, which would be responsible for adsorption, but also
mesopore and macropore, these last very regular in size, which would favour the

Capítulo VIII 285
regeneration of the adsorbent. XCs300 showed high CO2 to CH4 selectivity in
equilibrium conditions, adsorbing more than twice carbon dioxide regarding methane.
Dynamic adsorption experiments confirmed the excellent behaviour of this
sample on biogas upgrading, since breakthrough times for CO2 were always larger than
CH4 ones even at high concentrations, where the differences between uptakes for the
two gases were shorter. Results reflected that XCs300 would be a good candidate to be
used as CO2 selective adsorbent.
8.5. REFERENCES
[1] A. Wu, D. Lovett, M. McEwan, F. Cecelja, and T. Chen, A spreadsheet
calculator for estimating biogas production and economic measures for UK-
based farm-fed anaerobic digesters, Bioresource Technology, 220 (2016) 479-
489.
[2] J. Pessuto, B.S. Scopel, D. Perondi, M. Godinho, and A. Dettmer, Enhancement
of biogas and methane production by anaerobic digestion of swine manure with
addition of microorganisms isolated from sewage sludge, Process Safety and
Environmental Protection, 104, Part A (2016) 233-239.
[3] N. Pérez-Rodríguez, D. García-Bernet, and J.M. Domínguez, Effects of
enzymatic hydrolysis and ultrasounds pretreatments on corn cob and vine
trimming shoots for biogas production, Bioresource Technology, 221 (2016)
130-138.
[4] L. Corno, R. Pilu, F. Tambone, B. Scaglia, and F. Adani, New energy crop giant
cane (Arundo donax L.) can substitute traditional energy crops increasing
biogas yield and reducing costs, Bioresource Technology, 191 (2015) 197-204.
[5] N. de Arespacochaga, C. Valderrama, J. Raich-Montiu, M. Crest, S. Mehta, and
J.L. Cortina, Understanding the effects of the origin, occurrence, monitoring,
control, fate and removal of siloxanes on the energetic valorization of sewage
biogas A review, Renewable and Sustainable Energy Reviews, 52 (2015) 366-
381.

286 Capítulo VIII
[6] B. Wu, X. Zhang, Y. Xu, D. Bao, and S. Zhang, Assessment of the energy
consumption of the biogas upgrading process with pressure swing adsorption
using novel adsorbents, Journal of Cleaner Production, 101 (2015) 251-261.
[7] M.J. Tuinier and M. van Sint Annaland, Biogas Purification Using Cryogenic
Packed-Bed Technology, Industrial & Engineering Chemistry Research, 51
(2012) 5552-5558.
[8] G. Leonzio, Upgrading of biogas to bio-methane with chemical absorption
process: simulation and environmental impact, Journal of Cleaner Production,
131 (2016) 364-375.
[9] A. Molino, M. Migliori, Y. Ding, B. Bikson, G. Giordano, and G. Braccio,
Biogas upgrading via membrane process: Modelling of pilot plant scale and the
end uses for the grid injection, Fuel, 107 (2013) 585-592.
[10] Q. Sun, H. Li, J. Yan, L. Liu, Z. Yu, and X. Yu, Selection of appropriate biogas
upgrading technology-a review of biogas cleaning, upgrading and utilisation,
Renewable and Sustainable Energy Reviews, 51 (2015) 521-532.
[11] H. Nie, H. Jiang, D. Chong, Q. Wu, C. Xu, and H. Zhou, Comparison of Water
Scrubbing and Propylene Carbonate Absorption for Biogas Upgrading Process,
Energy Fuels, 27 (2013) 3239-3245.
[12] N. Álvarez-Gutiérrez, S. García, M.V. Gil, F. Rubiera, and C. Pevida, Towards
Bio-upgrading of Biogas: Biomass Waste-based Adsorbents, Energy Procedia,
63 (2014) 6527-6533.
[13] T. Montanari, E. Finocchio, E. Salvatore, G. Garuti, A. Giordano, C. Pistarino,
and G. Busca, CO2 separation and landfill biogas upgrading: A comparison of
4A and 13X zeolite adsorbents, Energy, 36 (2011) 314-319.
[14] M.V. Gil, N. Álvarez-Gutiérrez, M. Martínez, F. Rubiera, C. Pevida, and A.
Morán, Carbon adsorbents for CO2 capture from bio-hydrogen and biogas
streams: Breakthrough adsorption study, Chemical Engineering Journal, 269
(2015) 148-158.
[15] M.C. Campo, A.M. Ribeiro, A.F.P. Ferreira, J.C. Santos, C. Lutz, J.M.
Loureiro, and A.E. Rodrigues, Carbon dioxide removal for methane upgrade by

Capítulo VIII 287
a VSA process using an improved 13X zeolite, Fuel Processing Technology,
143 (2016) 185-194.
[16] X. Wu, B. Yuan, Z. Bao, and S. Deng, Adsorption of carbon dioxide, methane
and nitrogen on an ultramicroporous copper metal-organic framework, Journal
of Colloid and Interface Science, 430 (2014) 78-84.
[17] Y. Belmabkhout and A. Sayari, Adsorption of CO2 from dry gases on MCM-41
silica at ambient temperature and high pressure. 2: Adsorption of CO2/N2,
CO2/CH4 and CO2/H2 binary mixtures, Chemical Engineering Science, 64
(2009) 3729-3735.
[18] N. Álvarez-Gutiérrez, M.V. Gil, F. Rubiera, and C. Pevida, Adsorption
performance indicators for the CO2/CH4 separation: Application to biomass-
based activated carbons, Fuel Processing Technology, 142 (2016) 361-369.
[19] D.J. Seo, Z. Gou, H. Fujita, T. Fujii, and A. Sakoda, Simple fabrication of
molecular sieving carbon for biogas upgrading via a temperature controlled
carbonization of Phyllostachys pubescens, Renewable Energy, 86 (2016) 693-
702.
[20] Q. Xue and Y. Liu, Mixed-amine Modified SBA-15 as Novel Adsorbent of CO2
Separation for Biogas Upgrading, Separation Science and Technology, 46
(2011) 679-686.
[21] A.F.P. Ferreira, A.M. Ribeiro, S. Kulaç, and A.E. Rodrigues, Methane
purification by adsorptive processes on MIL-53(Al), Chemical Engineering
Science, 124 (2015) 79-95.
[22] X.q. Zhang, W.c. Li, and A.h. Lu, Designed porous carbon materials for
efficient CO2 adsorption and separation, New Carbon Materials, 30 (2015) 481-
501.
[23] S. Fatemi, M. Vesali-Naseh, M. Cyrus, and J. Hashemi, Improving CO2/CH4
adsorptive selectivity of carbon nanotubes by functionalization with nitrogen-
containing groups, Chemical Engineering Research and Design, 89 (2011)
1669-1675.
288 Capítulo VIII
[24] J. Wang, R. Krishna, J. Yang, K.P.R. Dandamudi, and S. Deng, Nitrogen-doped
porous carbons for highly selective CO2 capture from flue gases and natural gas
upgrading, Materials Today Communications, 4 (2015) 156-165.
[25] M. Nandi, K. Okada, A. Dutta, A. Bhaumik, J. Maruyama, D. Derks, and H.
Uyama, Unprecedented CO2 uptake over highly porous N-doped activated
carbon monoliths prepared by physical activation, Chemical Communications,
48 (2012) 10283-10285.
[26] R.W. Pekala, Low density, resorcinol-formaldehyde aerogels, US Patent,
US4997804 A, 1991.
[27] R.W. Pekala, Organic aerogels from the polycondensation of resorcinol with
formaldehyde, Journal of Materials Science, 24 (1989) 3221-3227.
[28] J. Yu, M. Guo, F. Muhammad, A. Wang, G. Yu, H. Ma, and G. Zhu, Simple
fabrication of an ordered nitrogen-doped mesoporous carbon with
resorcinolmelamineformaldehyde resin, Microporous and Mesoporous
Materials, 190 (2014) 117-127.
[29] N. Rey-Raap, J. Angel Menéndez, and A. Arenillas, RF xerogels with tailored
porosity over the entire nanoscale, Microporous and Mesoporous Materials,
195 (2014) 266-275.
[30] J. Pampel, C. Denton, and T.P. Fellinger, Glucose derived ionothermal carbons
with tailor-made porosity, Carbon, 107 (2016) 288-296.
[31] S.A. Al-Muhtaseb and J.A. Ritter, Preparation and Properties of
ResorcinolFormaldehyde Organic and Carbon Gels, Adv. Mater., 15 (2003)
101-114.
[32] F.J. Maldonado-Hódar, Advances in the development of nanostructured
catalysts based on carbon gels, Catalysis Today, 218219 (2013) 43-50.
[33] E. Gallegos-Suárez, A.F. Pérez-Cadenas, F.J. Maldonado-Hódar, and F.
Carrasco-Marín, On the micro- and mesoporosity of carbon aerogels and
xerogels. The role of the drying conditions during the synthesis processes,
Chemical Engineering Journal, 181-182 (2012) 851-855.
Capítulo VIII 289
[34] S. Morales-Torres, F.J. Maldonado-Hódar, A.F. Pérez-Cadenas, and F.
Carrasco-Marín, Structural characterization of carbon xerogels: From film to
monolith, Microporous and Mesoporous Materials, 153 (2012) 24-29.
[35] J.F. Vivo-Vilches, F. Carrasco-Marín, A.F. Pérez-Cadenas, and F.J. Maldonado-
Hódar, Fitting the porosity of carbon xerogel by CO2 activation to improve the
TMP/n-octane separation, Microporous and Mesoporous Materials, 209 (2015)
10-17.
[36] S. Brunauer, P.H. Emmett, and E. Teller, Adsorption of Gases in
Multimolecular Layers, Journal of the American Chemical Society, 60 (1938)
309-319.
[37] M.M. Dubinin, Inhomogeneous microporous structures of carbonaceous
adsorbents, Carbon, 19 (1981) 321-324.
[38] F. Stoeckli, Porosity in carbon. Characterization and applications. Eds. Patrick
J. Arnold, London, 1995.
[39] E.P. Barrett, L.G. Joyner, and P.P. Halenda, The Determination of Pore Volume
and Area Distributions in Porous Substances. I. Computations from Nitrogen
Isotherms, Journal of the American Chemical Society, 73 (1951) 373-380.