Universal access to medicine: HIV and...
52
Universal access to medicine: HIV and beyond Dr Andrew Hill Department of Pharmacology and Therapeutics University of Liverpool United Kingdom UNAIDS STAC meeting, Lilongwe, May 15 th 2017
Transcript of Universal access to medicine: HIV and...
Universal access to medicine: HIV and beyond
Dr Andrew HillDepartment of Pharmacology and TherapeuticsUniversity of LiverpoolUnited Kingdom
UNAIDS STAC meeting, Lilongwe, May 15th 2017
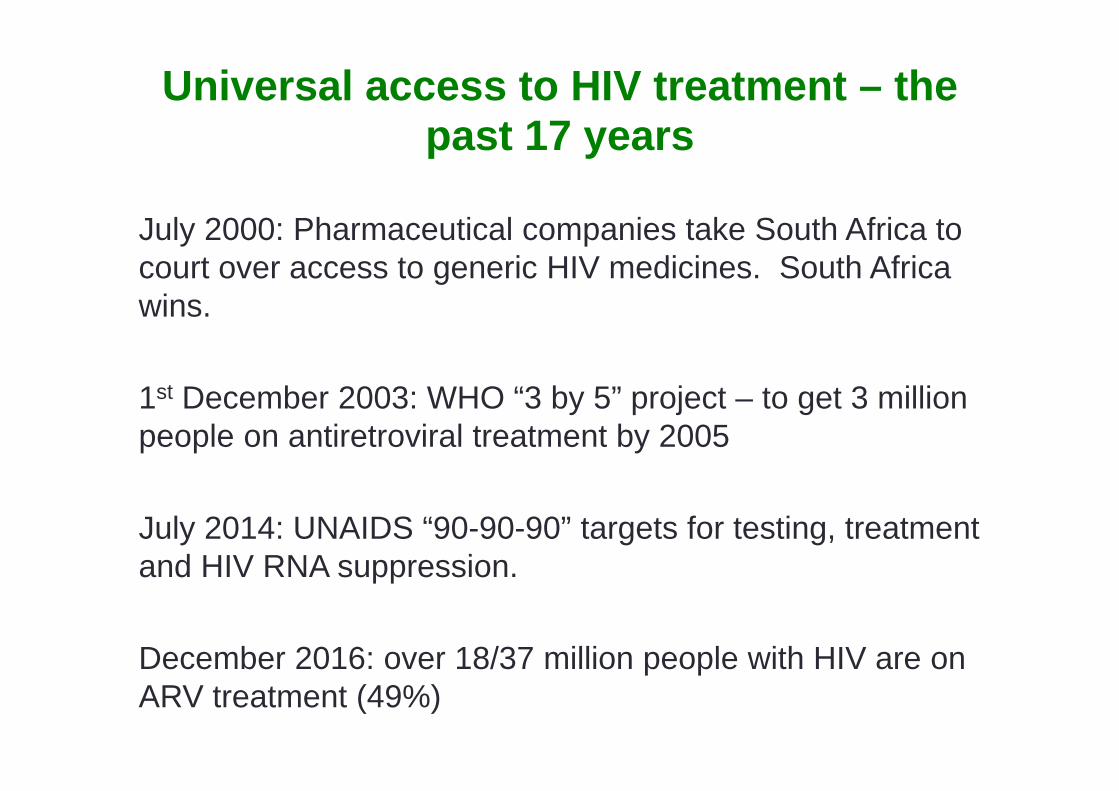
July 2000: Pharmaceutical companies take South Africa to court over access to generic HIV medicines. South Africa wins.
1st December 2003: WHO “3 by 5” project – to get 3 million people on antiretroviral treatment by 2005
July 2014: UNAIDS “90-90-90” targets for testing, treatment and HIV RNA suppression.
December 2016: over 18/37 million people with HIV are on ARV treatment (49%)
Universal access to HIV treatment – the past 17 years
53%
49%32%*
0%
20%
40%
60%
80%
100%
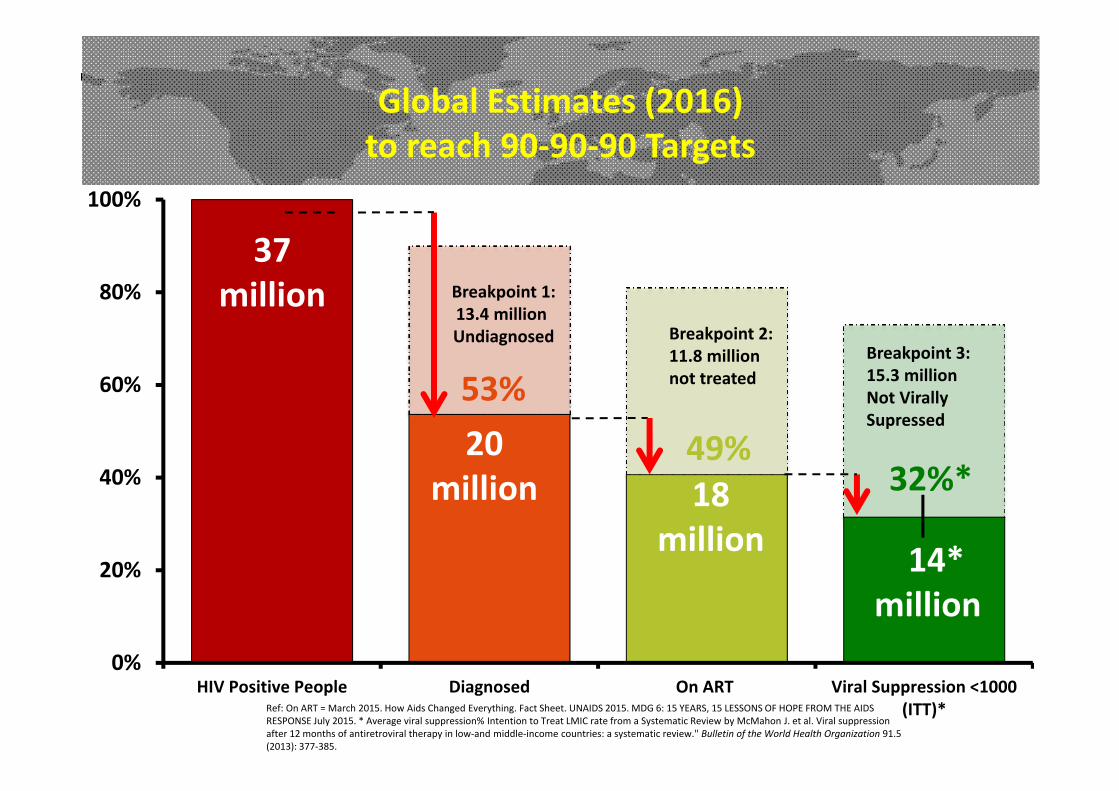
HIV Positive People Diagnosed On ART Viral Suppression <1000(ITT)*
37million
20million 18
million 14*million
Global Estimates (2016) to reach 90‐90‐90 Targets
Ref: On ART = March 2015. How Aids Changed Everything. Fact Sheet. UNAIDS 2015. MDG 6: 15 YEARS, 15 LESSONS OF HOPE FROM THE AIDS RESPONSE July 2015. * Average viral suppression% Intention to Treat LMIC rate from a Systematic Review by McMahon J. et al. Viral suppression after 12 months of antiretroviral therapy in low‐and middle‐income countries: a systematic review." Bulletin of the World Health Organization 91.5 (2013): 377‐385.
Breakpoint 1:13.4 million Undiagnosed Breakpoint 2:
11.8 million not treated
Breakpoint 3: 15.3 millionNot Virally Supressed
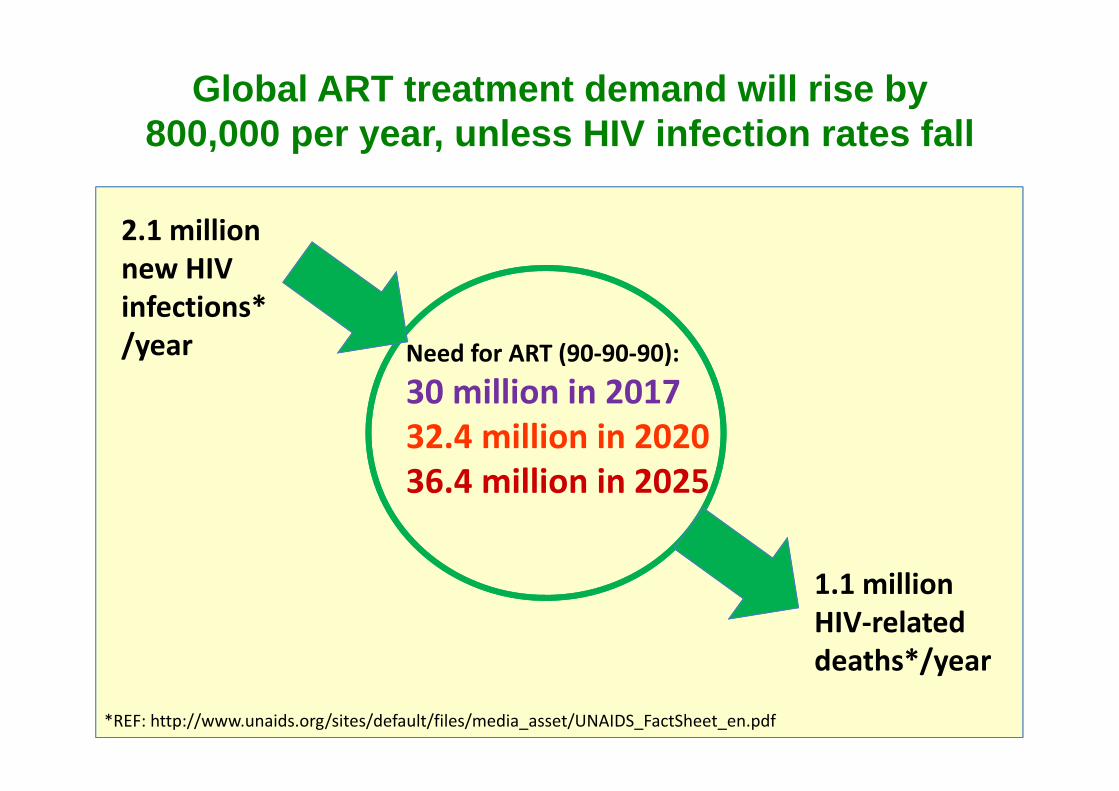
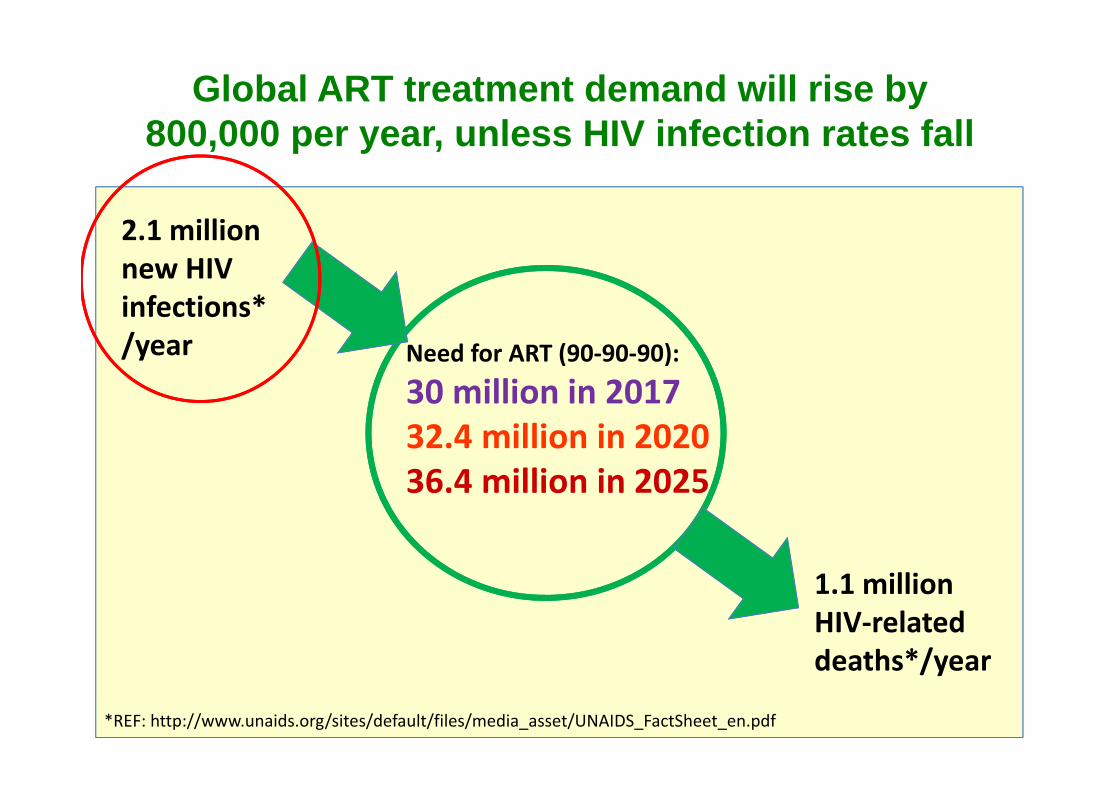
2.1 millionnew HIV infections*/year
1.1 millionHIV‐related deaths*/year
Global ART treatment demand will rise by 800,000 per year, unless HIV infection rates fall
Need for ART (90‐90‐90):
30 million in 201732.4 million in 202036.4 million in 2025
*REF: http://www.unaids.org/sites/default/files/media_asset/UNAIDS_FactSheet_en.pdf
• Region
• HIV prevalence
• Global Peace Index
Three main predictors of HIV treatment coverage

UNAIDSTargets
WesternEurope
Australia(2013) Caribbean South
AmericaSub Saharan
AfricaCentralAmerica USA (2011) South East
Asia & Pacific
EasternEurope andCentral Asia
Middle Eastand NorthAfrica
% On ART 81% 67% 66% 50% 50% 42% 40% 37% 36% 17% 10%
81%
67% 66%
50% 50%
42% 40%37% 36%
17%
10%
0%
20%
40%
60%
80%
100%Pe
rcen
tage of E
stim
ated
Total PLH
IV
Percentage of people with HIVon Antiretroviral treatment, by region
Europe / Australia
S America / Caribbean
Africa, C America, USASE Asia
E Europe, M EastC Asia, N Africa
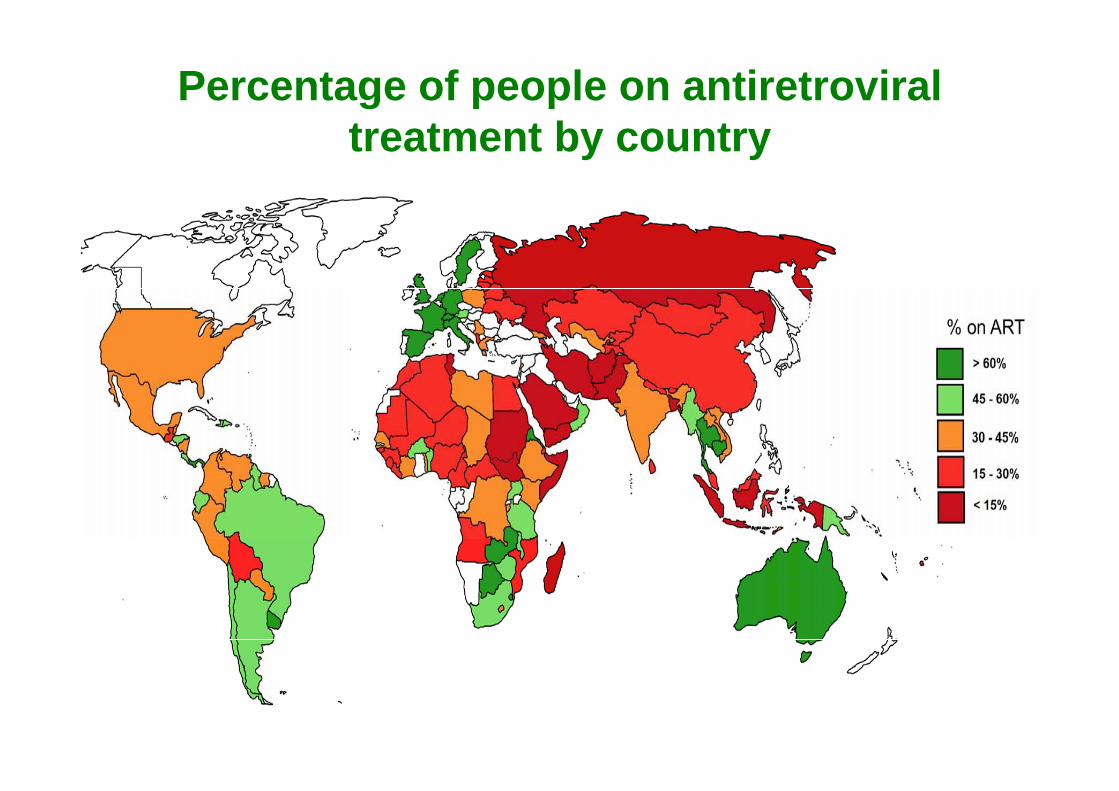
Percentage of people on antiretroviral treatment by country
• Region
• HIV prevalence
• Global Peace Index
Three main predictors of HIV treatment coverage
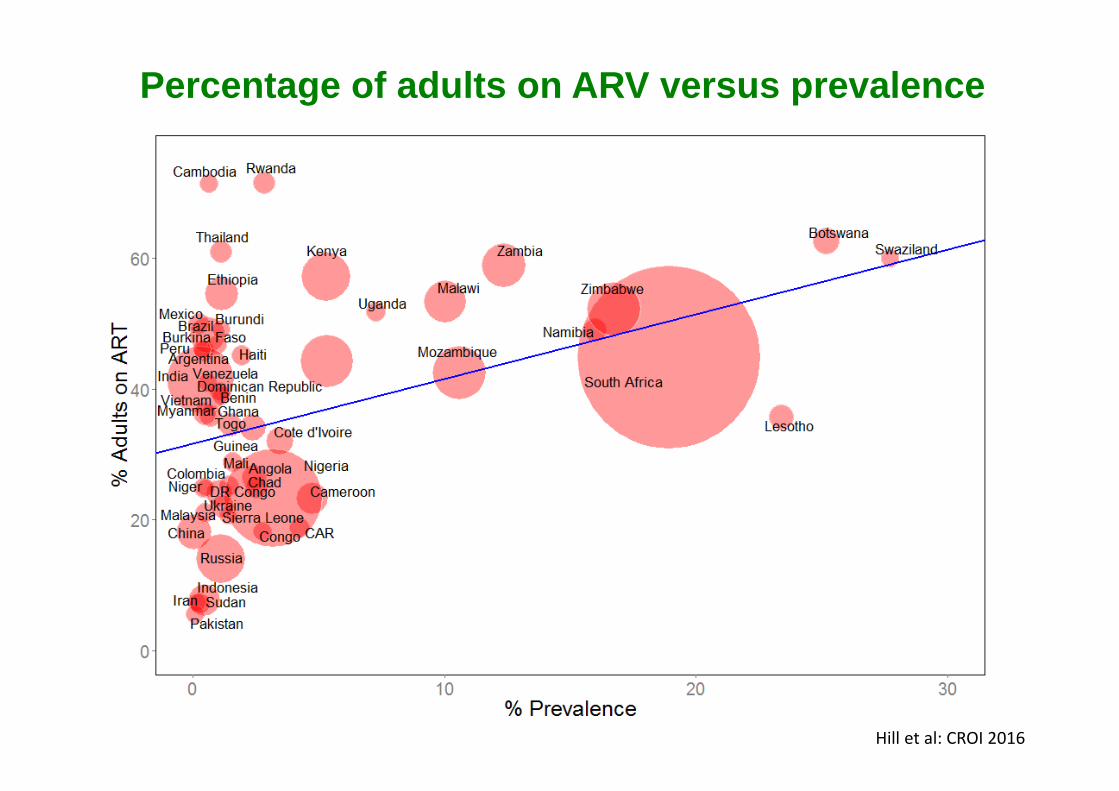
Percentage of adults on ARV versus prevalence
Hill et al: CROI 2016

Percentage of children on ARV vs prevalence
Hill et al: CROI 2016

Percentage pregnant women on ARV vs prevalence
Hill et al: CROI 2016

• Region
• HIV prevalence
• Global Peace Index
Three main predictors of HIV treatment coverage

Hill et al: IAS 2017
YemenSomaliaS SudanPakistanAfghanistan
SwedenSwitzerlandNew ZealandDenmarkAustralia
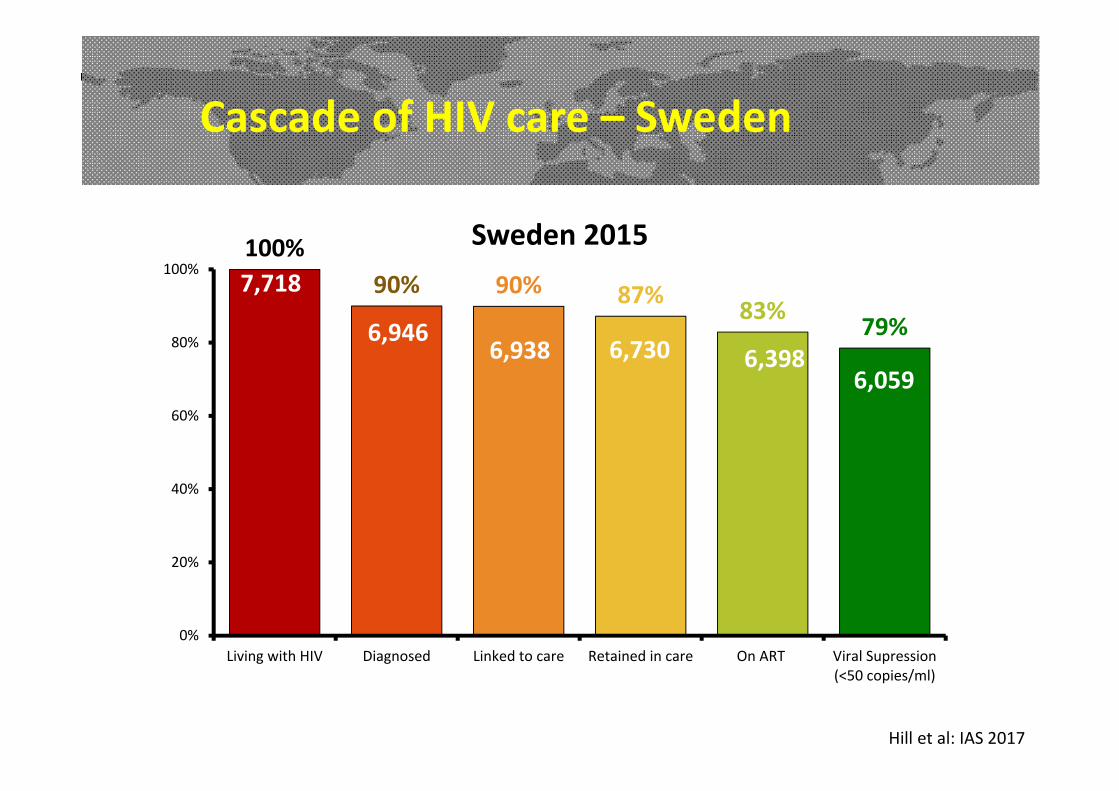
Cascade of HIV care – Sweden
100%90% 90% 87% 83% 79%
0%
20%
40%
60%
80%
100%
Living with HIV Diagnosed Linked to care Retained in care On ART Viral Supression(<50 copies/ml)
Sweden 20157,718
6,9466,938 6,398
6,0596,730
Hill et al: IAS 2017

Cascade of HIV care – Somalia
17%13%
8% 5%
0%
20%
40%
60%
80%
100%
Living with HIV Diagnosed Linked to care Retained in care On ART Viral Suppresion(NA)
Somalia 201332,000
1,700
16,516
2,424
4,219
60,390
5,581
Hill et al: IAS 2017
2.1 millionnew HIV infections*/year
1.1 millionHIV‐related deaths*/year
Global ART treatment demand will rise by 800,000 per year, unless HIV infection rates fall
Need for ART (90‐90‐90):
30 million in 201732.4 million in 202036.4 million in 2025
*REF: http://www.unaids.org/sites/default/files/media_asset/UNAIDS_FactSheet_en.pdf

Can HIV incidence fall with high treatment coverage and PrEP?
Centres with:
• High rates of HIV testing• Treating all HIV+ people• Rapid uptake of ART – same day starts• PrEP available / PEP prescribed• Regular monitoring

New HIV diagnoses among adults attending sexual health services
Current HIV trends in England
0
100
200
300
400
500
600
Q1 Q2 Q3 Q4 Q1 Q2 Q3 Q4 Q1 Q2 Q3 Q4 Q1 Q2 Q3 Q4 Q1 Q2 Q3
2012 2013 2014 2015 2016
Gay/bisexual men Heterosexual men Heterosexual women

HIV+ diagnoses, 56 Dean Street Clinic, London, 2015 to 2017
72
15
What is driving this fall:
Expanded testingTreating all HIV+Earlier treatment startsPrEP and PEP widely used
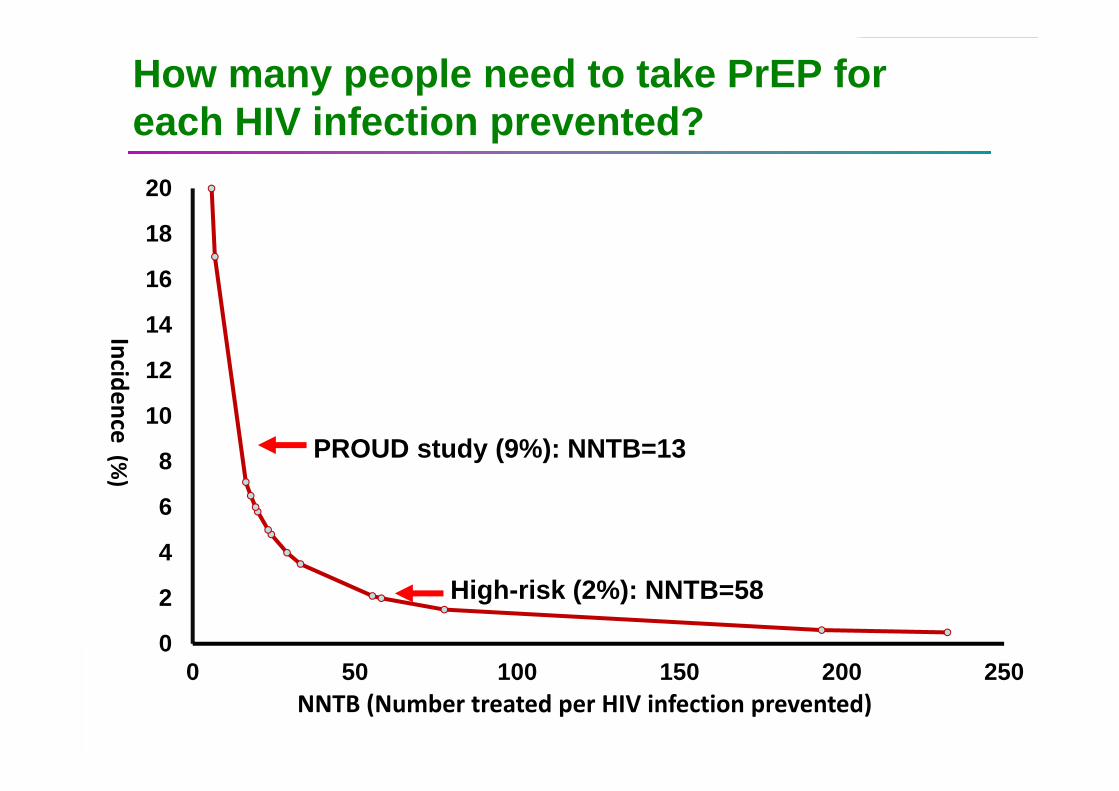
How many people need to take PrEP for each HIV infection prevented?
0
2
4
6
8
10
12
14
16
18
20
0 50 100 150 200 250
Incidence(%
)
NNTB (Number treated per HIV infection prevented)
PROUD study (9%): NNTB=13
High-risk (2%): NNTB=58

How many people need PrEP per HIV infection prevented?
Mozambique, Beira 6.5% 18
Mozambiqye, Manhica 3.6% 33
Uganda, Lake Victoria 3.4% 35
Mozambique, Southern 3.2% 37
South Africa, Matlosana 2.2% 53
Mozambique, Maputo 1.1% 103
Kenya, Kisumu 1.1% 106
Uganda 0.6% 214
____________________________________________________________________
Country, region HIV incidence NNTB____________________________________________________________________
___________________________________________________________________Studies of heterosexuals in sub‐Saharan AfricaNNTB assumes PrEP is 85% effective in preventing HIV infection
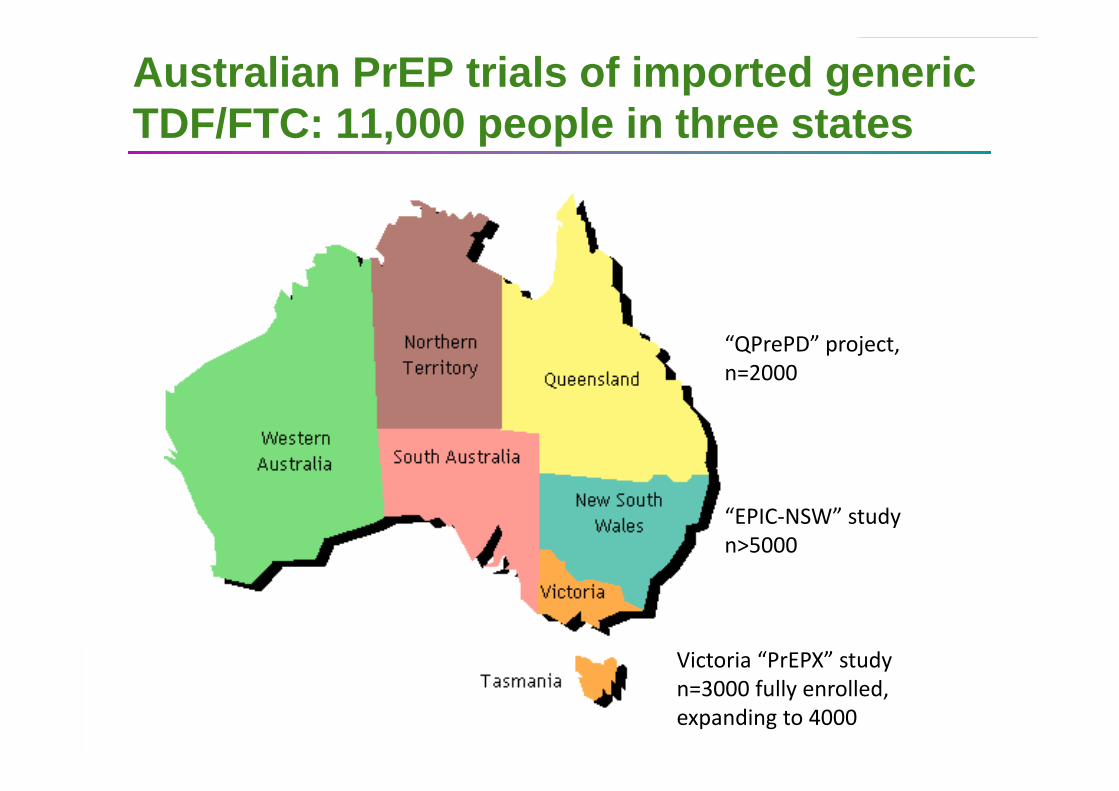
Australian PrEP trials of imported generic TDF/FTC: 11,000 people in three states
“QPrePD” project, n=2000
“EPIC‐NSW” studyn>5000
Victoria “PrEPX” studyn=3000 fully enrolled, expanding to 4000

Expanded treatment and preventionResults so far
• 40% fall in new HIV diagnoses in London: 2015 to 2016
• Lowest ever incidence of new HIV infections in Australia in 2016 – 25% reduction since 2015
• 17% falls in new HIV diagnoses in San Francisco in 2016

Eliminating HIV infection by 2030?
1. Country-level targets for 90-90-90 will continue to rise if global HIV infections remain at 2 million/year
2. Countries with lower HIV prevalence and higher levels of conflict need to give HIV treatment higher priority. North Africa and E Europe need to upscale their services.
3. In centres with Expanded Treatment and Prevention programmes, HIV incidence appears to be falling
4. PrEP could lower HIV incidence, but millions will need access – could this save money in the long-term?
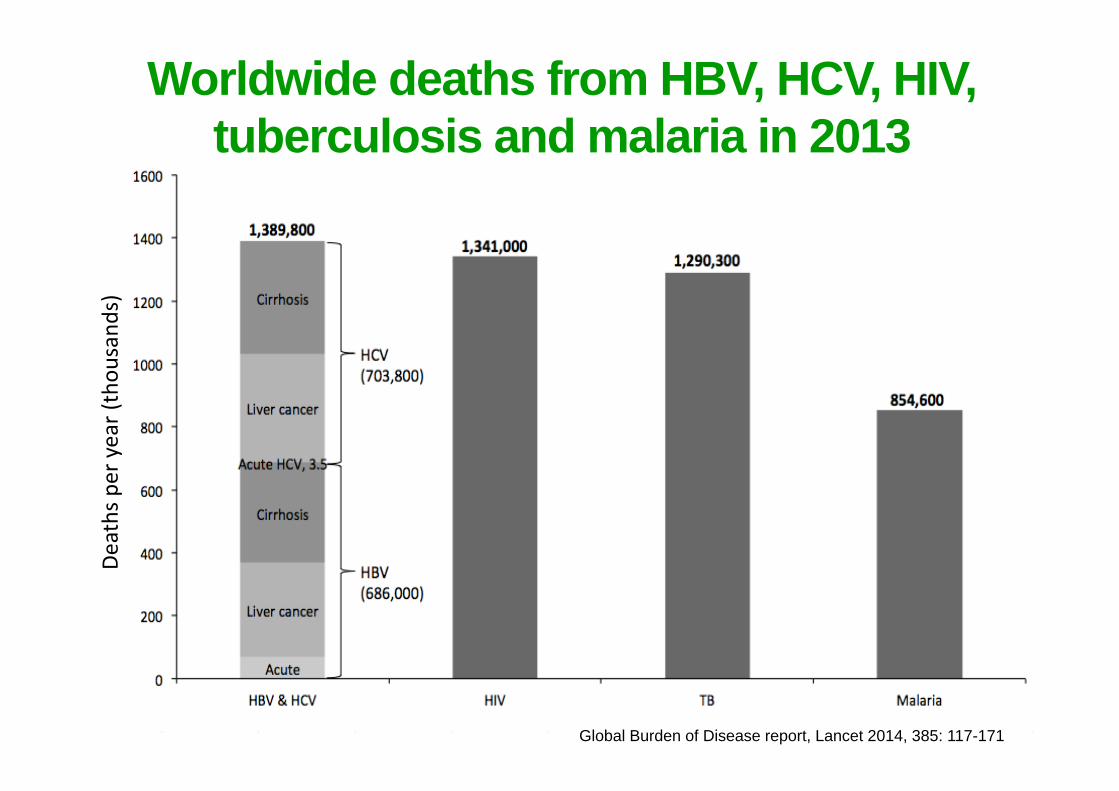
Global Burden of Disease report, Lancet 2014, 385: 117-171
Deaths per year (thou
sand
s)Worldwide deaths from HBV, HCV, HIV,
tuberculosis and malaria in 2013

How could we achieve Universal Access to all Essential Medicines?
26
The WHO Essential Medicines List
All drugs in the EML have been included
Prices available for India, South Africa and the UK
Also, “estimated generic prices” estimated, based on costs of API. Almost all medicines in the EML are extremely cheap to make.
We need data for more countries
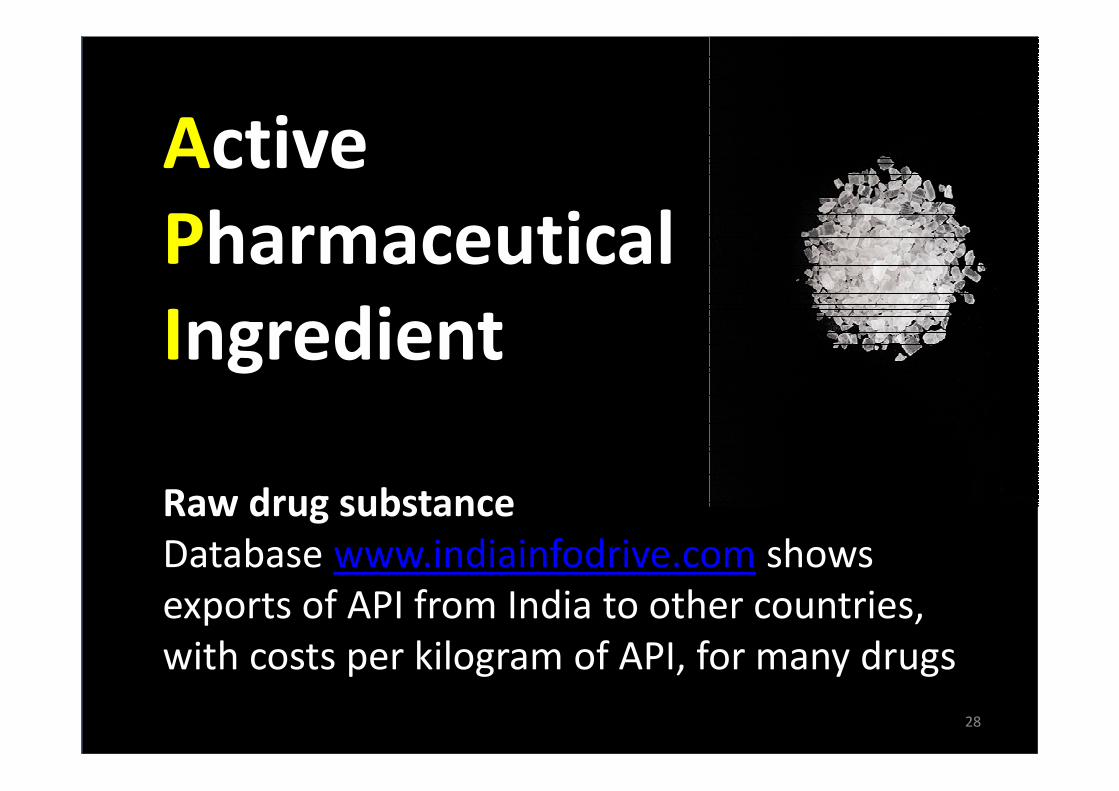
ActivePharmaceuticalIngredient
Raw drug substanceDatabase www.indiainfodrive.com shows exports of API from India to other countries, with costs per kilogram of API, for many drugs
28

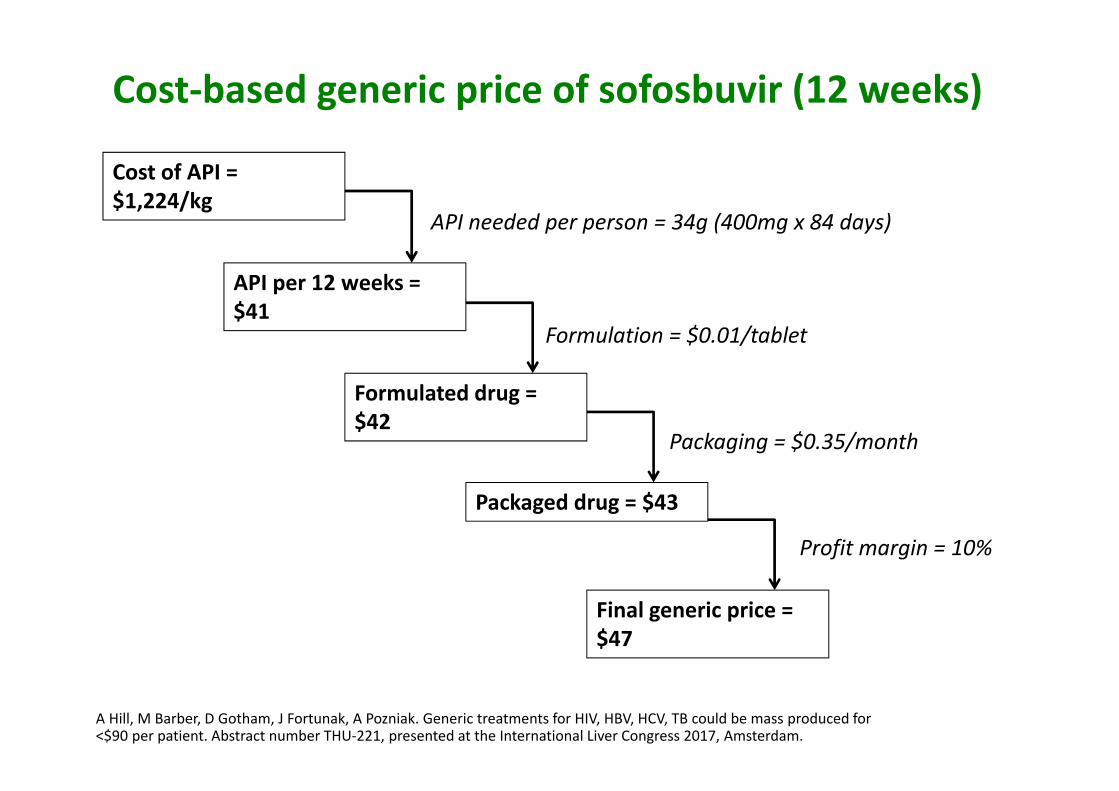
A Hill, M Barber, D Gotham, J Fortunak, A Pozniak. Generic treatments for HIV, HBV, HCV, TB could be mass produced for <$90 per patient. Abstract number THU‐221, presented at the International Liver Congress 2017, Amsterdam.
Cost/kg of sofosbuvir API exports Jan 15 ‐ July 16
A Hill, M Barber, D Gotham, J Fortunak, A Pozniak. Generic treatments for HIV, HBV, HCV, TB could be mass produced for <$90 per patient. Abstract number THU‐221, presented at the International Liver Congress 2017, Amsterdam.
API needed per person = 34g (400mg x 84 days)
Cost of API =$1,224/kg
API per 12 weeks = $41
Formulated drug = $42
Packaged drug = $43
Final generic price = $47
Formulation = $0.01/tablet
Packaging = $0.35/month
Profit margin = 10%
Cost‐based generic price of sofosbuvir (12 weeks)

Lowest global price versus estimated generic price, for HIV, TB and Malaria
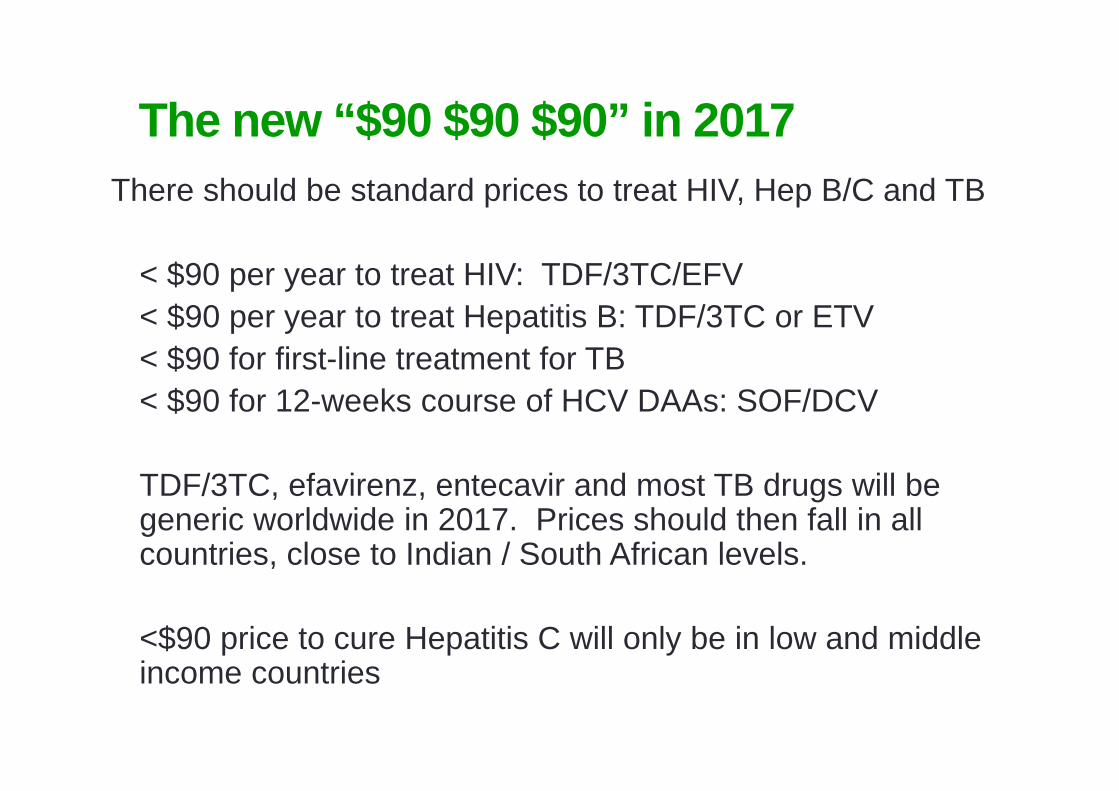
The new “$90 $90 $90” in 2017There should be standard prices to treat HIV, Hep B/C and TB
< $90 per year to treat HIV: TDF/3TC/EFV< $90 per year to treat Hepatitis B: TDF/3TC or ETV< $90 for first-line treatment for TB< $90 for 12-weeks course of HCV DAAs: SOF/DCV
TDF/3TC, efavirenz, entecavir and most TB drugs will be generic worldwide in 2017. Prices should then fall in all countries, close to Indian / South African levels.
<$90 price to cure Hepatitis C will only be in low and middle income countries

How can you access patented drugs at low
prices?
33

Voluntary licenses
Some pharmaceutical companies allow cheap generics to be sold in certain low and middle income countries, with voluntary licenses. However:
1. China, South America, Russia and Eastern European countries are not included in most of these agreements. As a result, prices in these countries can be unaffordable
2. Other countries may have voluntary licenses but if the company does not register the drug for regulatory approval, then the drug cannot be accessed
3. Merck and AbbVie have no voluntary licenses for their Hepatitis C treatments.

Sofosbuvir voluntary license coverage

A Hill, M Barber, D Gotham, J Fortunak, A Pozniak. Generic treatments for HIV, HBV, HCV, TB could be mass produced for <$90 per patient. Abstract number THU‐221, presented at the International Liver Congress 2017, Amsterdam.
Lowest prices of sofosbuvir (for HCV) by country
$84.000
$56.658
$49.860
$46.831
$45.568
$42.625
$14.607
$6.750
$72
$47
$45
$ 0
$ 15.000
$ 30.000
$ 45.000
$ 60.000
$ 75.000
$ 90.000
US (list price)
Germany
US (Vet. A
ffairs)
France UK
Canada
Spain
Brazil
India
Target
Pakistan
price in USD
for 1
2‐week course
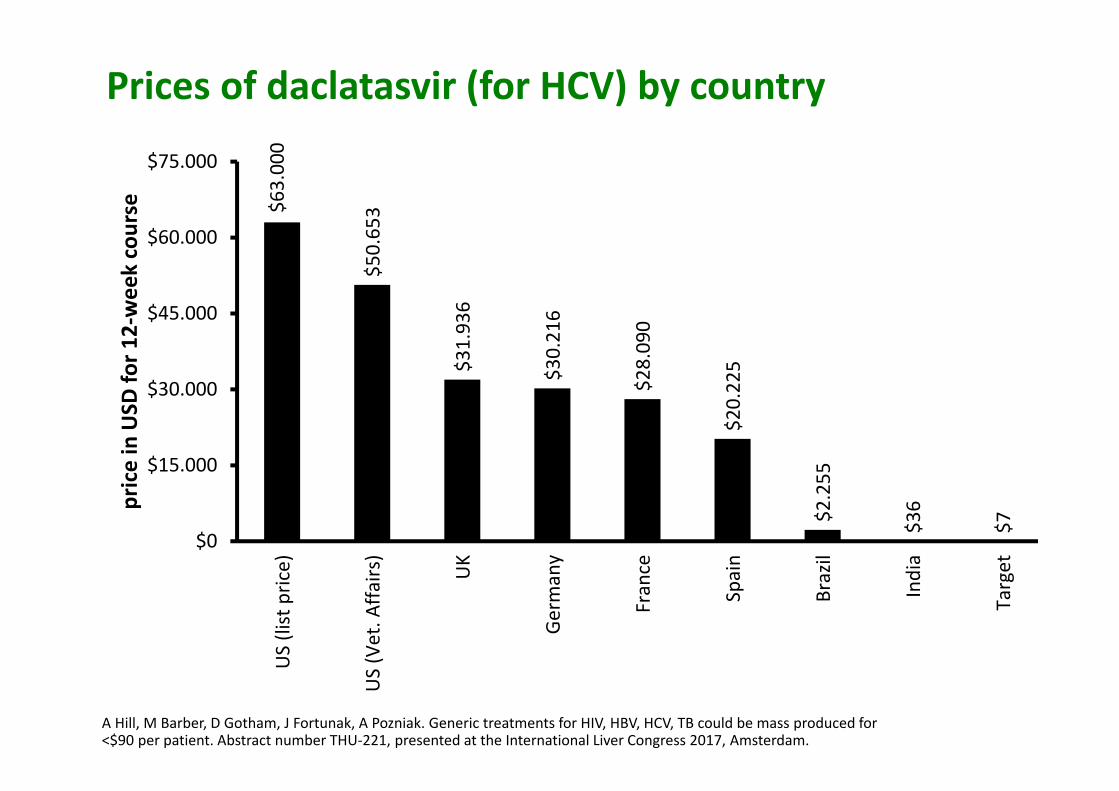
A Hill, M Barber, D Gotham, J Fortunak, A Pozniak. Generic treatments for HIV, HBV, HCV, TB could be mass produced for <$90 per patient. Abstract number THU‐221, presented at the International Liver Congress 2017, Amsterdam.
Prices of daclatasvir (for HCV) by country
$63.000
$50.653
$31.936
$30.216
$28.090
$20.225
$2.255
$36
$7
$0
$15.000
$30.000
$45.000
$60.000
$75.000
US (list price)
US (Vet. A
ffairs)
UK
Germany
France
Spain
Brazil
India
Target
price in USD
for 1
2‐week course
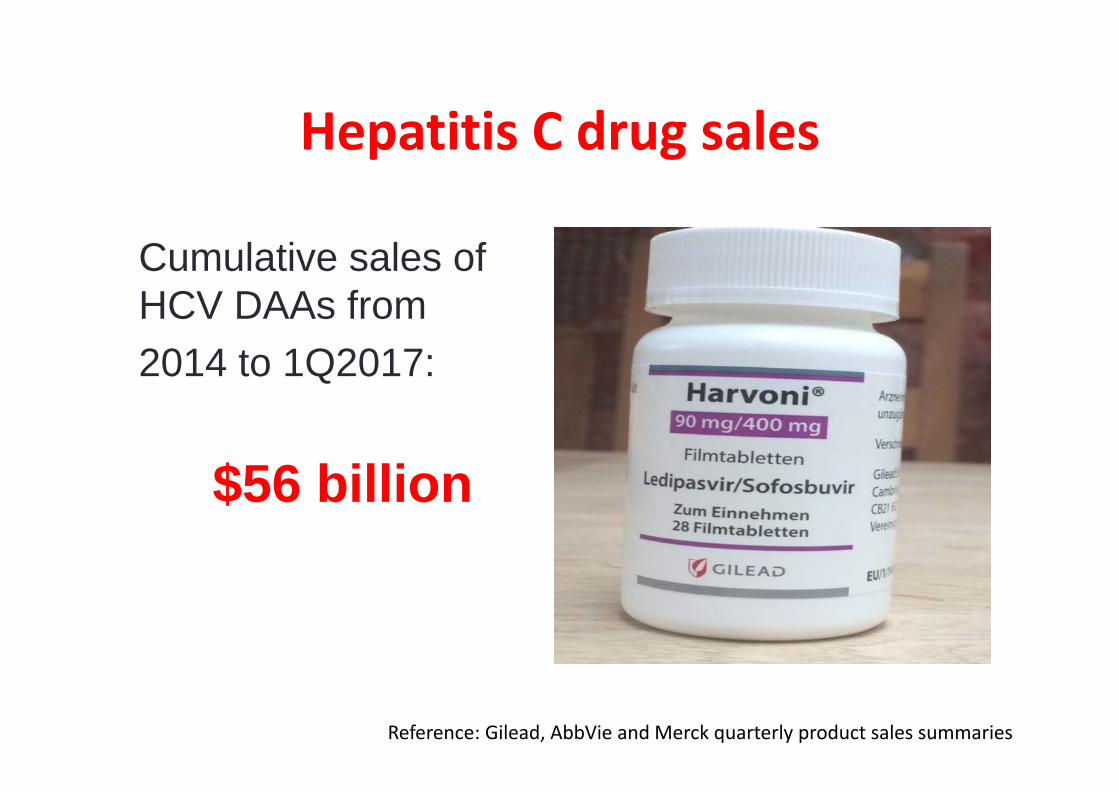
Hepatitis C drug sales
Cumulative sales of HCV DAAs from 2014 to 1Q2017:
$56 billion
Reference: Gilead, AbbVie and Merck quarterly product sales summaries
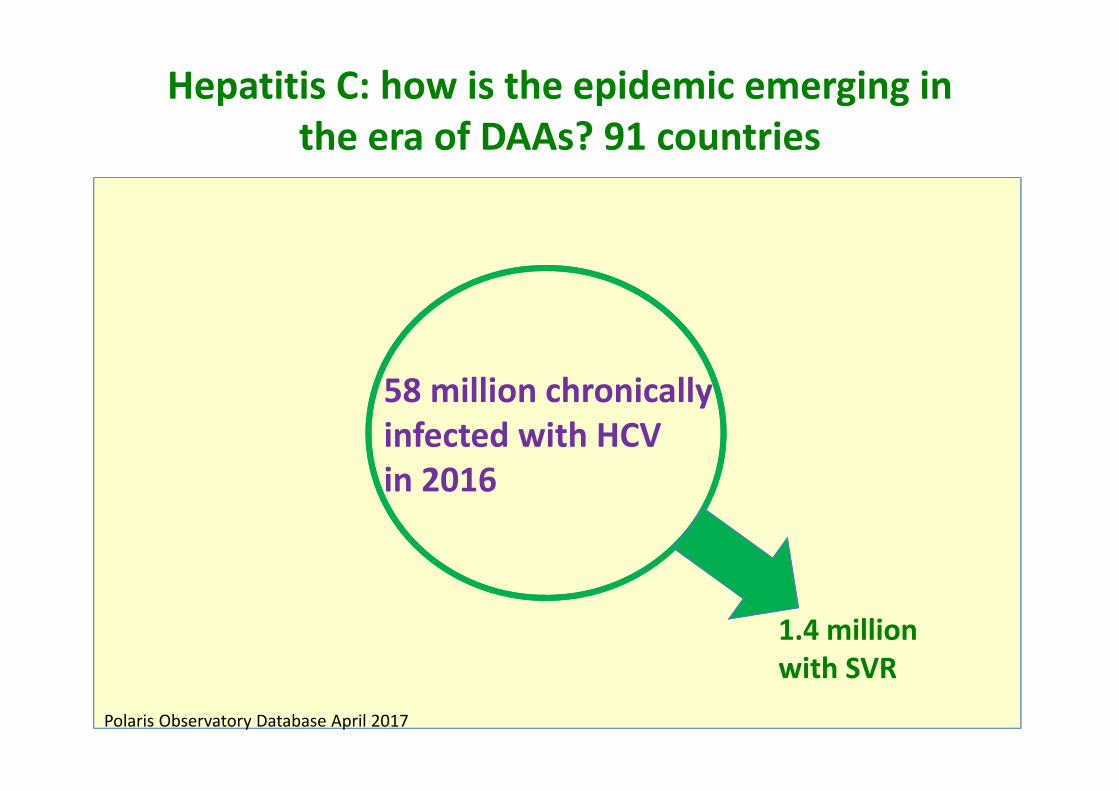
1.4 million with SVR
Hepatitis C: how is the epidemic emerging in the era of DAAs? 91 countries
58 million chronically infected with HCVin 2016
Polaris Observatory Database April 2017
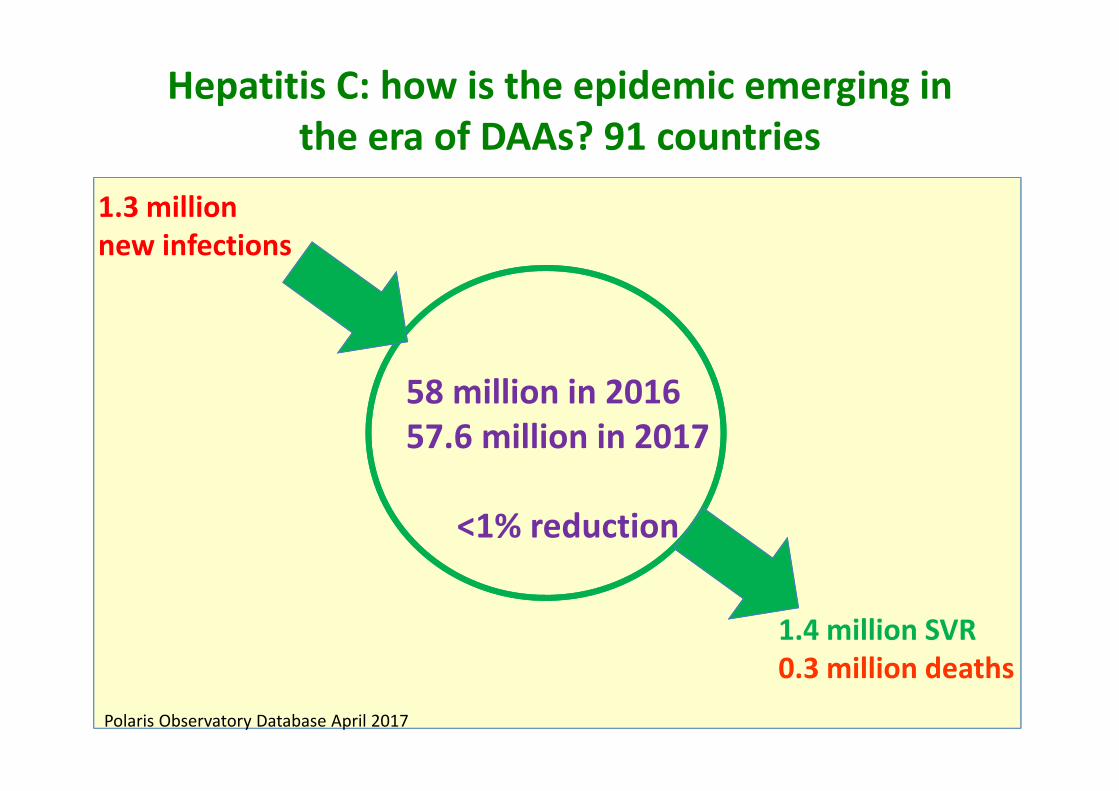
1.4 million SVR0.3 million deaths
Hepatitis C: how is the epidemic emerging in the era of DAAs? 91 countries
58 million in 201657.6 million in 2017
<1% reduction
Polaris Observatory Database April 2017
1.3 million new infections
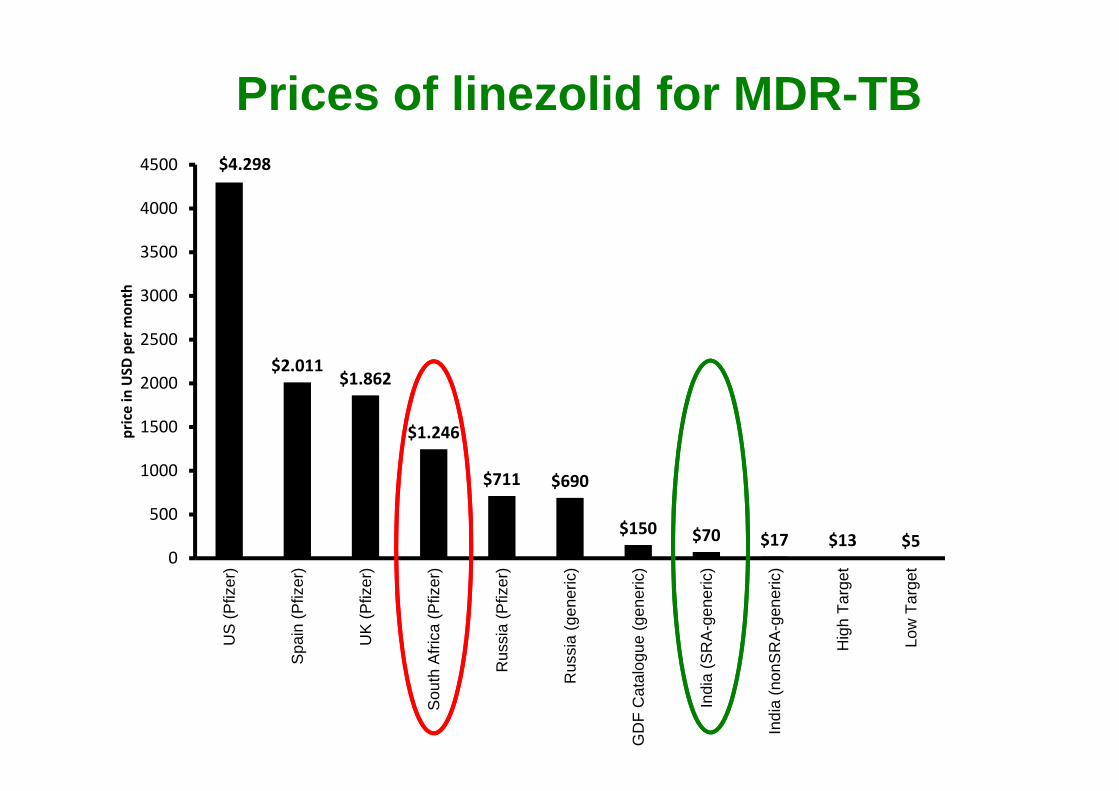
Prices of linezolid for MDR-TB$4.298
$2.011$1.862
$1.246
$711 $690
$150 $70 $17 $13 $50
500
1000
1500
2000
2500
3000
3500
4000
4500
US
(Pfiz
er)
Spa
in (P
fizer
)
UK
(Pfiz
er)
Sou
th A
frica
(Pfiz
er)
Rus
sia
(Pfiz
er)
Rus
sia
(gen
eric
)
GD
F C
atal
ogue
(gen
eric
)
Indi
a (S
RA
-gen
eric
)
Indi
a (n
onS
RA
-gen
eric
)
Hig
h Ta
rget
Low
Tar
get
price in USD
per m
onth
Are you getting the best price for generics
in your country?
42
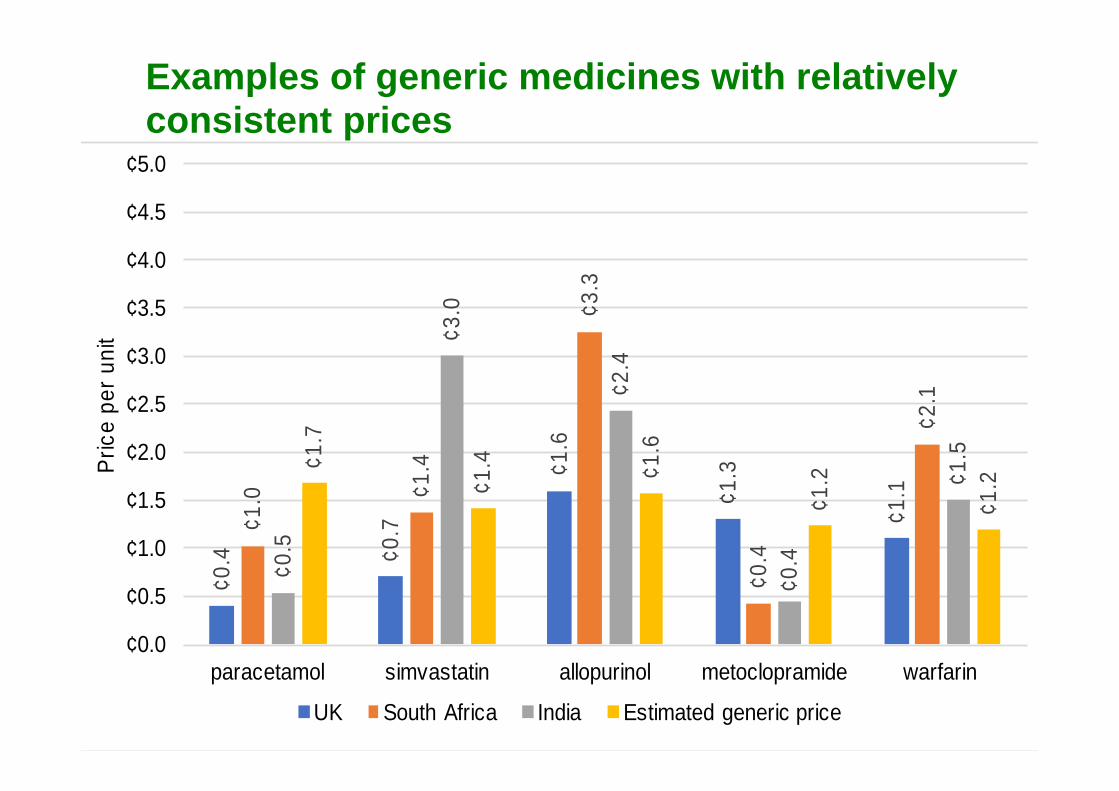
¢0.4 ¢0
.7
¢1.6
¢1.3
¢1.1
¢1.0 ¢1
.4
¢3.3
¢0.4
¢2.1
¢0.5
¢3.0
¢2.4
¢0.4
¢1.5¢1
.7
¢1.4 ¢1
.6
¢1.2
¢1.2
¢0.0
¢0.5
¢1.0
¢1.5
¢2.0
¢2.5
¢3.0
¢3.5
¢4.0
¢4.5
¢5.0
paracetamol simvastatin allopurinol metoclopramide warfarin
Pric
e pe
r uni
t
UK South Africa India Estimated generic price
Examples of generic medicines with relatively consistent prices
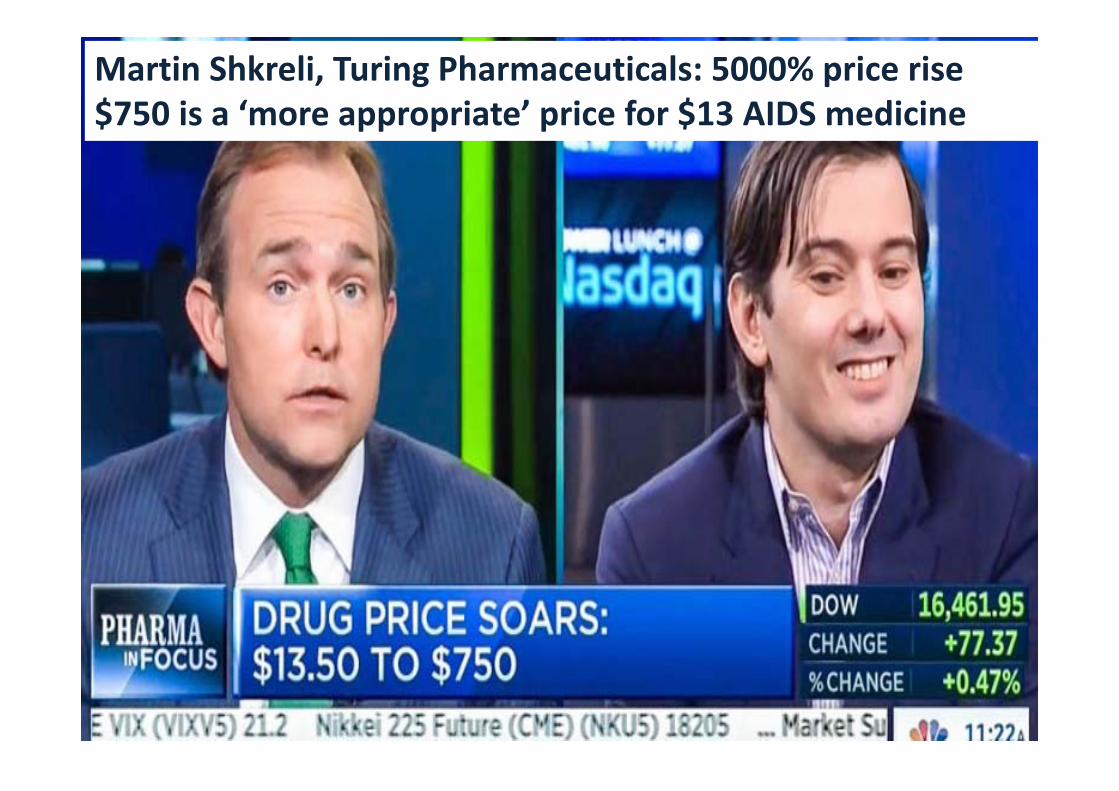
Martin Shkreli – Turing Pharmaceuticals
Martin Shkreli, Turing Pharmaceuticals: 5000% price rise$750 is a ‘more appropriate’ price for $13 AIDS medicine
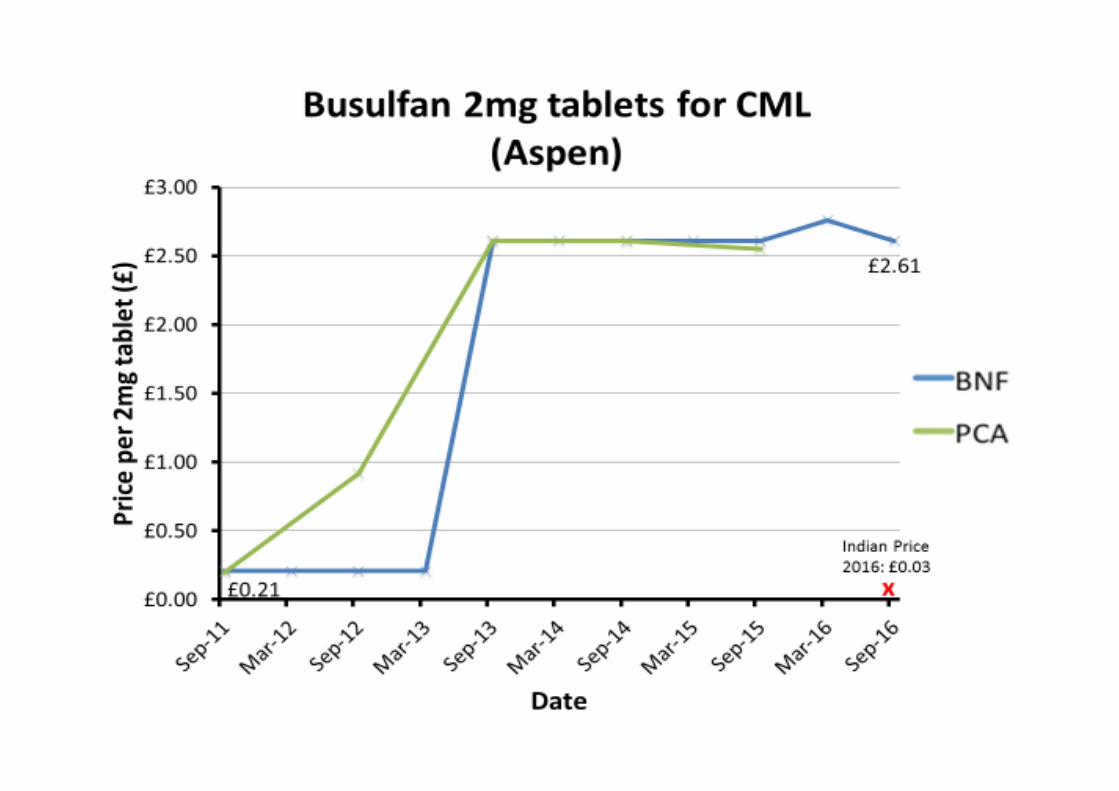
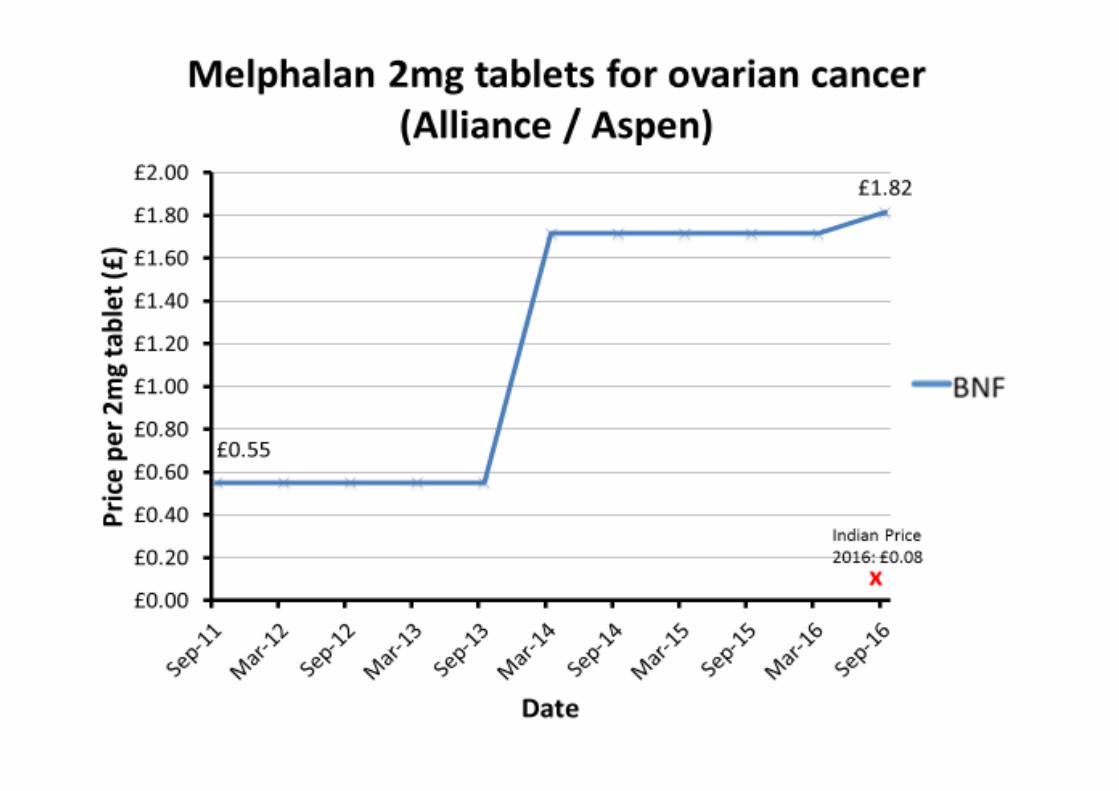
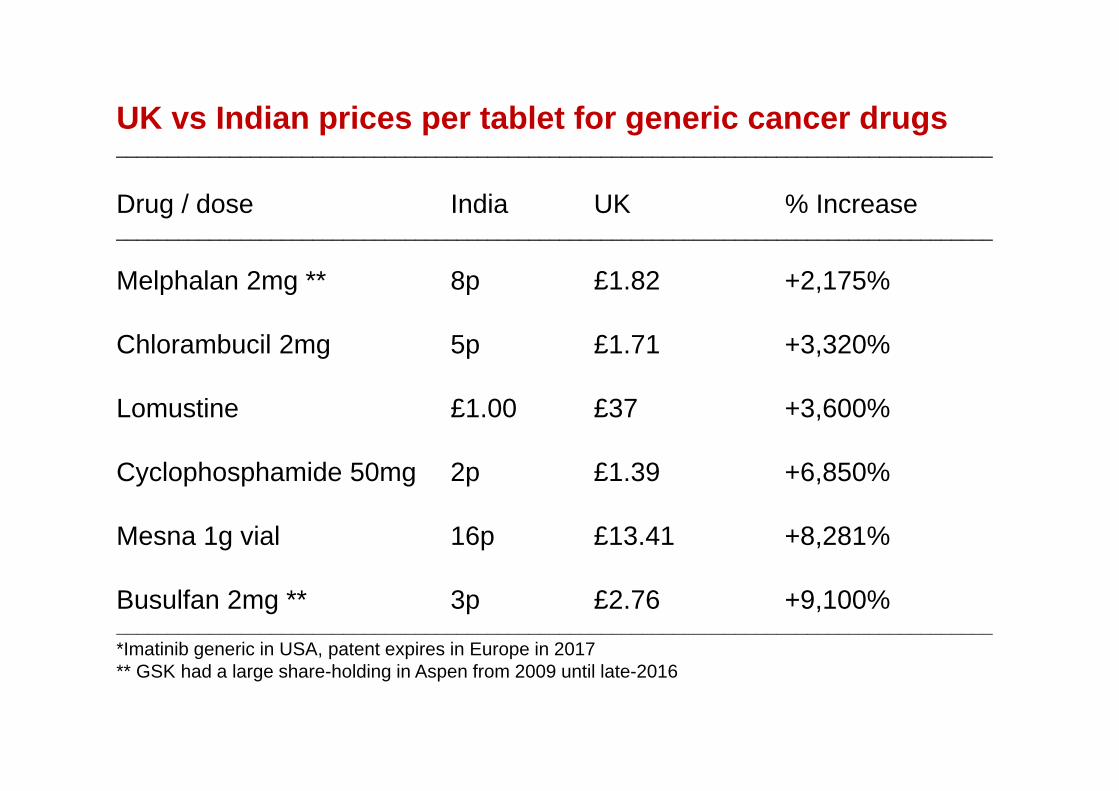
UK vs Indian prices per tablet for generic cancer drugs_____________________________________________________________________________________
Drug / dose India UK % Increase_____________________________________________________________________________________
Melphalan 2mg ** 8p £1.82 +2,175%
Chlorambucil 2mg 5p £1.71 +3,320%
Lomustine £1.00 £37 +3,600%
Cyclophosphamide 50mg 2p £1.39 +6,850%
Mesna 1g vial 16p £13.41 +8,281%
Busulfan 2mg ** 3p £2.76 +9,100%_____________________________________________________________________________________*Imatinib generic in USA, patent expires in Europe in 2017** GSK had a large share-holding in Aspen from 2009 until late-2016
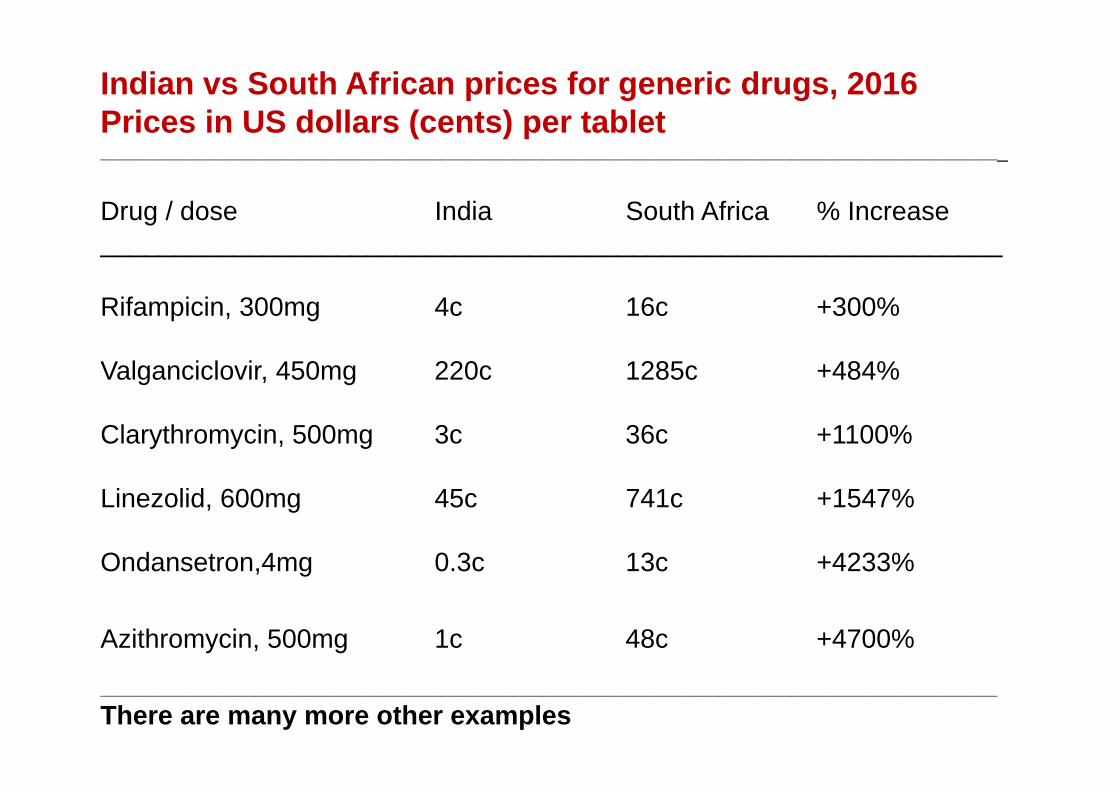
Indian vs South African prices for generic drugs, 2016Prices in US dollars (cents) per tablet________________________________________________________________________________________
Drug / dose India South Africa % Increase_____________________________________________________________
Rifampicin, 300mg 4c 16c +300%
Valganciclovir, 450mg 220c 1285c +484%
Clarythromycin, 500mg 3c 36c +1100%
Linezolid, 600mg 45c 741c +1547%
Ondansetron,4mg 0.3c 13c +4233%
Azithromycin, 500mg 1c 48c +4700%
_______________________________________________________________________________________There are many more other examples
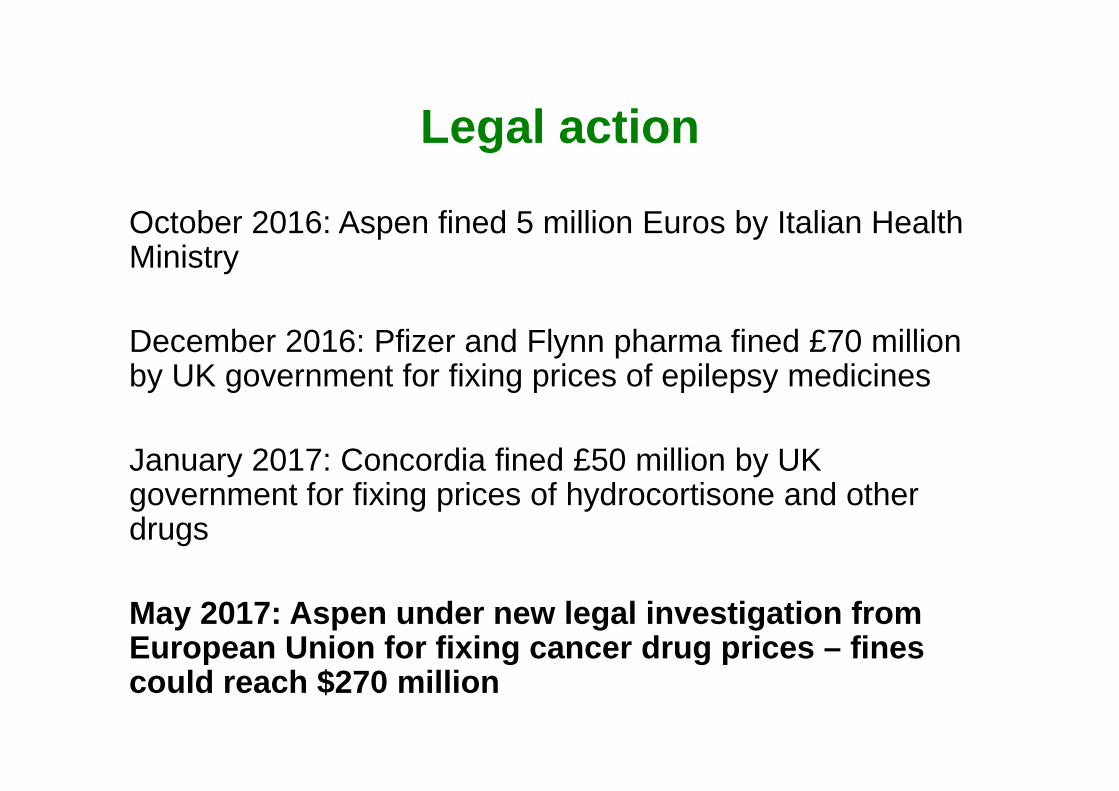
Legal action
October 2016: Aspen fined 5 million Euros by Italian Health Ministry
December 2016: Pfizer and Flynn pharma fined £70 million by UK government for fixing prices of epilepsy medicines
January 2017: Concordia fined £50 million by UK government for fixing prices of hydrocortisone and other drugs
May 2017: Aspen under new legal investigation from European Union for fixing cancer drug prices – fines could reach $270 million
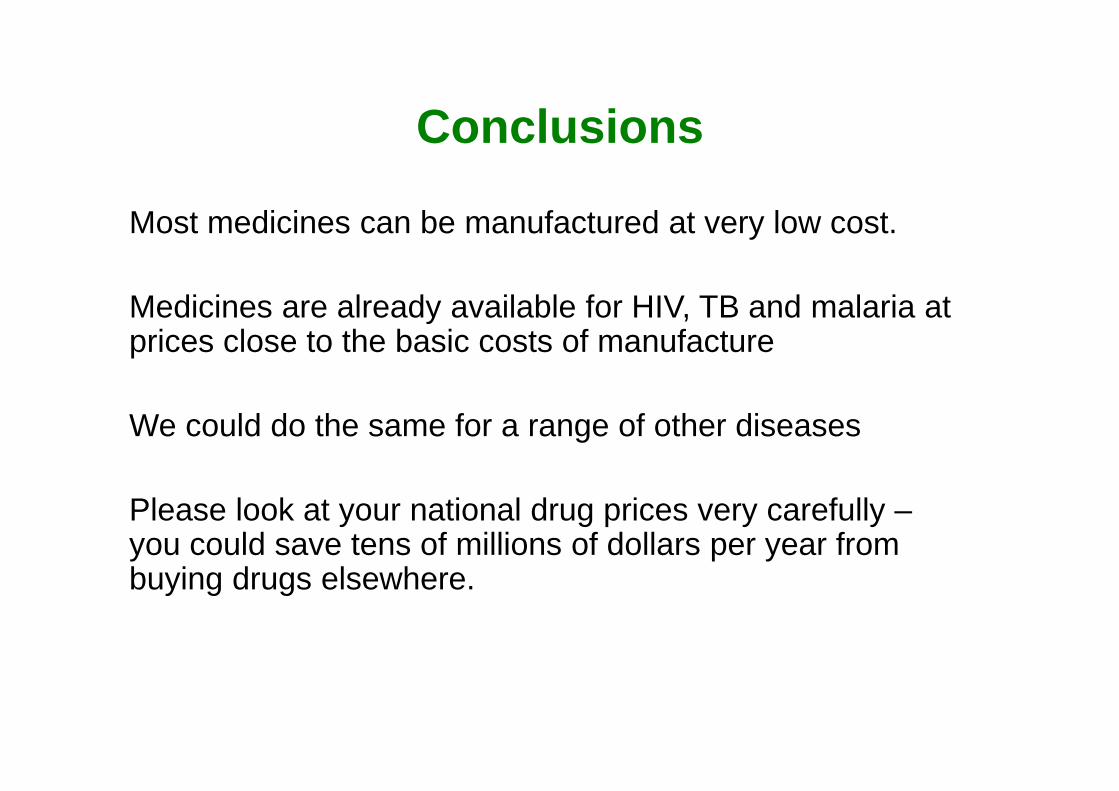
Conclusions
Most medicines can be manufactured at very low cost.
Medicines are already available for HIV, TB and malaria at prices close to the basic costs of manufacture
We could do the same for a range of other diseases
Please look at your national drug prices very carefully –you could save tens of millions of dollars per year from buying drugs elsewhere.
“With drug prices, you don’t get what you deserve: you get what you can negotiate”
51
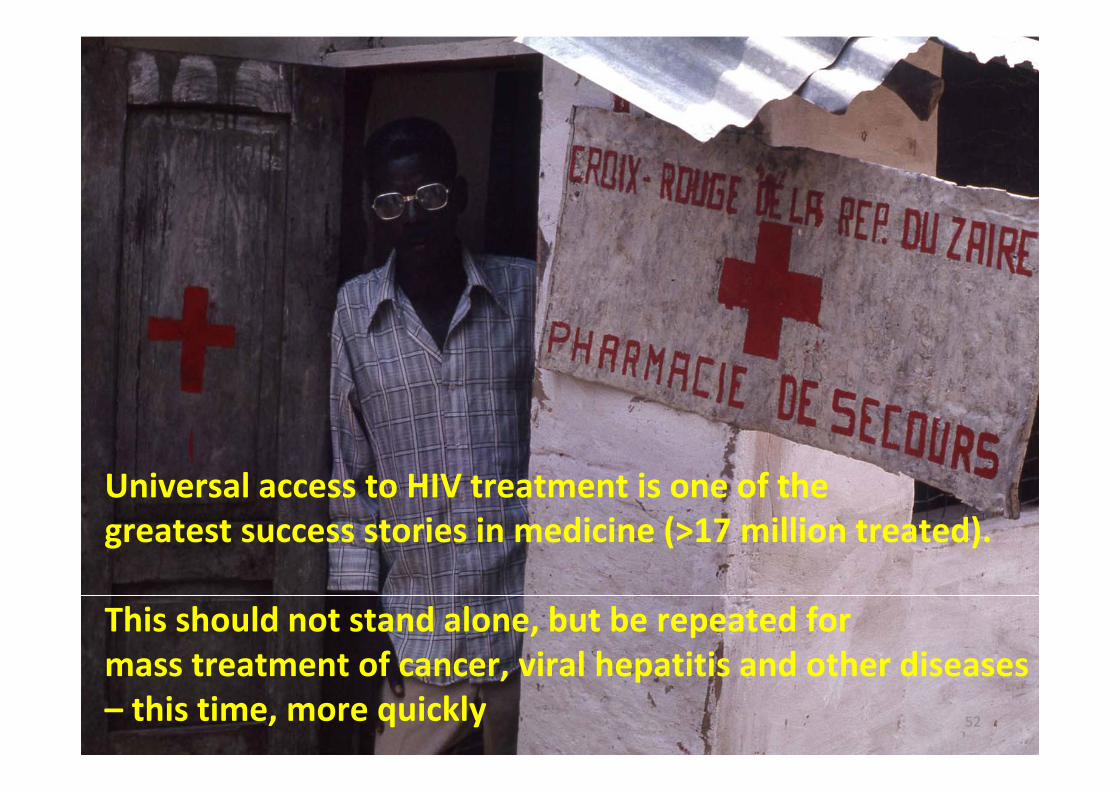
Universal access to HIV treatment is one of the greatest success stories in medicine (>17 million treated).
This should not stand alone, but be repeated for mass treatment of cancer, viral hepatitis and other diseases– this time, more quickly 52