UNIV BLACKSBURG VA FIGll/9,7/4 VIRGINIA POLYTECHNIC INST ... · ad-a079 6u7 virginia polytechnic...
29
AD-A079 6U7 VIRGINIA POLYTECHNIC INST AND STATE UNIV BLACKSBURG VA FIGll/9,7/4 TEREPHTHALAT E ). TANT , MAE N N . WIKE S GAGTH L. UNCLASSIFIED.9 NOV 79 REPT. NO. TN-I NOOGS B -C062 9
Transcript of UNIV BLACKSBURG VA FIGll/9,7/4 VIRGINIA POLYTECHNIC INST ... · ad-a079 6u7 virginia polytechnic...
AD-A079 6U7 VIRGINIA POLYTECHNIC INST AND STATE UNIV BLACKSBURG VA FIGll/9,7/4
TEREPHTHALAT E ). TANT , M AE N N . WIKE S GAGTH L.
UNCLASSIFIED.9 NOV 79 REPT. NO. TN-I NOOGS B -C062 9
OFFICE OF NAVAL RESEARCH
Contract N00014-78-C-0629
Task No. NR 356-692
TECHNICAL REPORT NO. 1
Physical Aging Studies of Semicrystalline
QPoly(ethylene Terephthalate)by
Martin R. Tant arid Garth L. Wilkes
Prepared for Publication
in the
Journal of Applied Polymer Science
Virginia Polytechnic Institute and State UniversityDepartment of Chemical Engineering
Blacksburg, Virginia
November 9, 1979
Reproduction in whole or in part is permitted for anypurpose of the United States Government.
This document has been approved for public release and sale;its distribution is unlimited.
• + 1. +4,8
%ECUAITY CLASSIFICATION OF THIS PAGE (hen Date Enleted)
REPORT DOCUMENTATION PAGE READ INSTRUCTIONSBEFORE COMPLETING FORM
1 REPORT NUMBER 2. GOVT ACCESSION NO. 3. RECIPIENT'S CATALOG NUMBER
4. TITLE (and Subtitle) 5. TYPE OF REPORT 6 PERIOD COVERED
Physical Aging Studies of Semicrystalline TechnicalPoly(ethylene Terephthalate)
6. PERFORMING ORG. REPORT NUMBER
7. AUTHOR(s) G. CONTRACT OR GRANT NUMBER(*)
Martin R. Tant and Garth L. Wilkes N00014-78-C-0629
9. PERFORMING ORGANIZATION NAME AND ADDRESS 10. PROGRAM ELEMENT. PROJECT. TASK
Virginia Polytechnic Institute & State Univ. AREA & WORK UNIT NUMBERS
Department of Chemical Engineering NR 356-692Blacksburg, Virginia 24061
II. CONTROLLING OFFICE NAME AND ADDRESS t2. REPORT DATE
Department of the Navy November 9, 1979Office of Naval Research, Code 472 -. NUMBEROF PAGES
Arlington, VA 22217 244. MONITORING AGENCY NAME I ADORESS(/t dflferent frot Controlling Office) IS. SECURITY CLASS. (of this report)
Uncl assi fied
So. DIECLASSIFICATION/DOWNGRAOINGSCHEDULE
16. DISTRIBUTION STATEMENT (of thi. RepotI)
This document has been approved for public release and sale - itsdistribution is unlimited.
17. DISTRIBUTION STATEMENT (of the abstract entered in Block 20. II diflerent Iro. Repot)
iS. SUPPLEMENTARY NOTES
19. KEY WORDS (Continue oi ,ee,.e side It nec.ssar 'ad Identify by block n-mbe,)Polymer glassesNon equilibrium glassesStress relaxationBlock copolymers
20, ABSTRACT (Continue on revere side It neceeary and Identify by block number)
Physical aging of semicrystalline poly(ethylene terephthalate) has beeninvestigated as a function of crystalline content. Stress-strain, stress relax-ation, and differential scanning calorimetry experiments were used to monitor th(physical aging process. It was found that both the overall extent and the rateof physical aging in this material decrease with increasing crystallinity.Several possible reasons for this behavior are advanced and discussed. It wasalso found that the drawing behavior of amorphous PET changes significantly asphysical aging progresses. Specifically, for samples aged and then elongated,
DD ,R, 1473 EDITION Of INOY 1 IS OSOLETEUS/N 0102.,F-01A61 UNCLASS IFIE D
UNCLASSIFIED
SECURITY CLASSIFICATIONG OF THIS PAGE (Wheni Data Enere4
(20. Continued)the extent of localized deformation (necking) and associated strain-inducedcrystallization was greater for samples aged for longer periods of time.
UNCLASSIFIEDSECURITY CLASSIFICATION OF THIS PAGEtIK e 08*0 E,.Q
Physical Aging Studies of Semicrystalline
Poly(ethylene Terephthalate)
Martin R. Tant and Garth L. Wilkes
Virginia Tech, Blacksburg, Virginia 24061
Abstract
Physical aging of semicrystalline poly(ethylene terephthalate) has
been investigated as a function of crystalline content. Stress-strain,
stress relaxation, and differential scanning calorimetry experiments were
used to monitor the physical aging process. It was found that both the
overall extent and the rate of physical aging in this material decrease
with increasing crystallinity. Several possible reasons for this behavior
are advanced and discussed. It was also found that the drawing behavior
of amorphous PET changes significantly as physical aging progresses.
Specifically, for samples aged and then elongated, the extent of localized
deformation (necking) and associated strain-induced crystallization was
greater for samples aged for longer periods of time.
Introductico-
The importance of the nonequilibrium state of glassy polymers has
become increasingly more prominent over the past several years. Glassy
polymers in this nonequilibrium condition exhibit quite dramatic structural
and property changes upon annealing below the glass transition temperature
(1-10). This observed aging behavior - variously referred to as non-
equilibrium behavior, enthalpy or volume recovery, or simply physical aging -
is a direct result of the nonequilibrium nature of the glassy state. As
a polymer is cooled at a finite rate through the glass transition, the
molecules are not able to reach their equilibrium conformation with respect
to temperature due to the rapid increase in viscosity and associated decrease
in molecular mobility in the Tg region. As the temperature is further decreased,
the polymer molecules are essentially "frozen" into a nonequilibrium state
at that same temperature. There is thus a thermodynamic potential or driving
force for the molecules to approach the equilibrium state by undergoing further
packing. Although the molecular mobility is greatly decreased in the glass
as compared to the rubbery region, it remains finite thus allowing the
molecules to approach the equilibrium state corresponding to normal liquidlike
packing. The measureable thermodynamic state functions, enthalpy and volume,
have been found to decrease with sub-Tg annealing time as the excess enthalpy
and volume originally quenched into the system decrease.
Associated with this approach toward the equilibrium state, there occur
changes in the mechanical properties of the polymer system (1,2,8,9). Typical
of these changes are an increase in tensile and flexural yield stresses, a
decrease in impact strength, fracture energy, ultimate elongation, and creep
rate, and a transition from ductile behavior to brittle fracture. The
-2-
utilization of polymers as engineering materials requires that the nature
and extent of these changes in properties be fully understood. Almost all
experimental work reported in the literature has been conducted on purely
glassy linear homopolymers. Although it had been previously established
that network glassy epoxies undergo physical aging (2), it was only recently
that the first systematic studies of physical aging in these network systems
and rubber-modified derivatives were completed (11,12). Since nonequilibrium
behavior has been observed to occur in covalently crosslinked systems, it
may be asked whether similar behavior occurs in "pseudo" network systems
such as semicrystalline polymers, where the crystalline regions serve as
physical crosslinks, and in partially glassy domain-forming block copolymers,
where the glassy regions may also serve as physical crosslinks. Of course,
the glassy phase in these materials would be expected to undergo the same
changes it would experience if isolated, i.e. as a purely glassy material.
However, the important questions which must be asked are whether or not the
property changes ia the glassy phase result in observable property changes
in the two-phase material, and if so, to what extent do these changes occur
and how do they relate to the concentration of glassy polymer.
One study has demonstrated that semicrystalline polymers undergo physical
aging (2), but here has been no report of a systematic physical aging study
with respect to the variable of crystalline content. Certainly one would
expect that increasing the crystallinity would decrease the overall extent
of physical aging, since there would be less glassy amorphous material to
undergo this process. In this paper we report results of an investigation
on the physical aging of semicrystalline poly(ethylene terephthalate) as a
function of the degree of crystallinity. The results of this study are
considered important due to the widespread use of this material. Results of a
similar study on block copolymers will be reported elsewhere (13,14).
-3-
Materials
Amorphous films of poly(ethylene terephthalate)(PET) supplied through the
courtesy of Dr. G. Adams of E.I. duPont de Nemours and Company were crystallized
by heating under vacuum at various temperatures to induce different levels of
crystallinity. Table I shows the levels of crystallinity obtained, along with
the time and temperature of crystallization for each. Crystallinity determin-
ations were made with a density gradient column containing an ethanol-carbon
tetrachloride mixture (15). Crystallinities were calculated by taking the
density of the perfect PET crystal to be 1.455 g/cm 3 and that of amorphous
PET to be 1.335 g/cm 3 (16). The density measurements were consistently made
within 10 minutes after cooling due to the rather significant changes in density,
attributable to nonequilibrium behavior, which occur upon sub-Tg annealing.
For example, using the density values stated above, amorphous PET has a dens;ty
corresponding to 0% crystallinity immediately after quenching, but as free
volume decreases and density increases upon sub-Tg annealing, tris method
shows an apparent crystallinity of as much as 3-5%. This effect was also
observed for semicrystalline PET but, of course, to a lesser extent. As the
crystalline fraction increases the degree of density change upon sub-Tg
a-nealing is diminished due to the decreased fraction of glassy material and
the increased structural rigidity provided by the crystals. It should therefore
be noted that the density of amorphousPET obtained from the literature is
the density of PET in a nonequilibrium state, based upon the results reported
here.
-4-
Experimental
Three characterization techniques were used to follow changes in the
mechanical and thermal properties of the PET materials. Stress-strain,
stress relaxation, and differential scanning calorimetry experiments were
performed as a function of sub-Tg annealing time.
All stress-strain experiments were performed on an Instron Model 1122,
and stress relaxation experiments were performed on a Tensilon Model UTM-II
(Toyo Measuring Instruments Co. Ltd.). Dog-bone-shaped samples were cut
from films of PET of various crystallinities. The dimensions of these
samples were 10.00 mm (length) by 2.80 mm (width) by 0.31 mm (thickness).
The linear portion of these materials measured 5.75 mm. This was the
initial sample length used to calculate percent elongation, since most
of the strain occurs in this region.
The amorphous and semicrystalline PET samples were heated to a temperature
above their Tg and annealed at that temperature for a period of 10 minutes
to erase any previous aging. This annealing temperature was 92°C for the
amorphous material, but the semicrystalline PET samples were heated to higher
temperatures due to the broadening of the glass transition with increasing
crystallinity. These temperatures were: 102C for the 12 and 22% crystalline
materials and 132C for the 29, 39, and 51% crystalline materials. Density
measurements confirmed that no change in crystallinity had occurred as a
result of this 10 minute thermal treatment. After the 10 minutes of annealing
above Tg, the samples were then immediately quenched below Tg in an ice water
bath, removed, immediately dried, and then stored at room temperature under
atmospheric conditions. Stress-strain and stress relaxation experiments were
performed on the amorphous and semicrystalline PET samples as a function of
sub-Tg annealing time. The stress-strain experiments were all performed at
-5-
a crosshead speed of 1 mm/min. For the stress relaxation experiments, the
samples were elongated to 0.65% at a crosshead speed of 2 mm/min. The percent
relaxation of stress during the first 10 minutes of the experiment was
calculated for each sample. It was realized that although the macroscopic
strain was the same for all stress-relaxation experiments, the local strain
in the glassy amorphous regions may vary with percent crystallinity, thus
possibly contributing to variations in the rate of stress relaxation.
Differential scanning calorimetry experiments were performed on amorphous
and 12% crystalline PET to determine the basic qualitative features of the
enthalpy recovery process in these materials. A Perkin-Elmer DSC-2 instrument
was used for these studies. DSC scans were made with a 10°C-min -I heating
rate. EAch sample was scanned through its glass transition, annealed at about
200C above the Tg for 5 minutes, cooled rapidly, and then scanned again. This
second scan was taken as the DSC trace of a quenched, unannealed sample.
-6-
Results and Discussion
Stress Relaxation
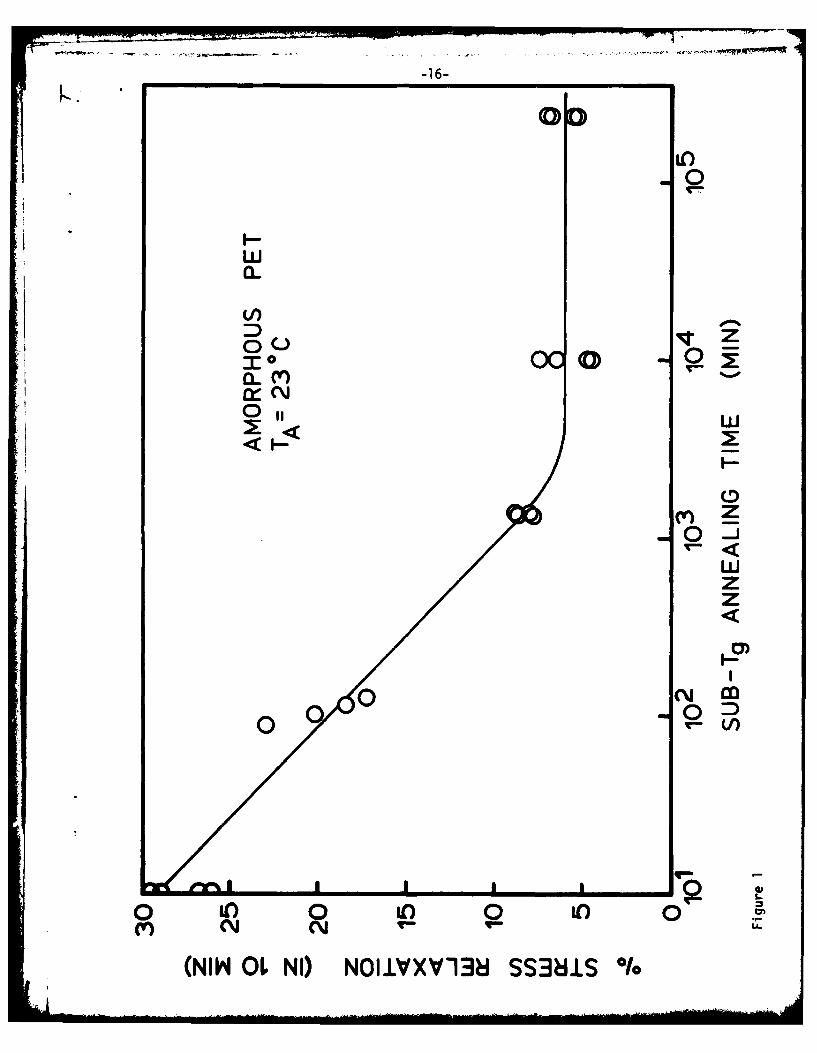
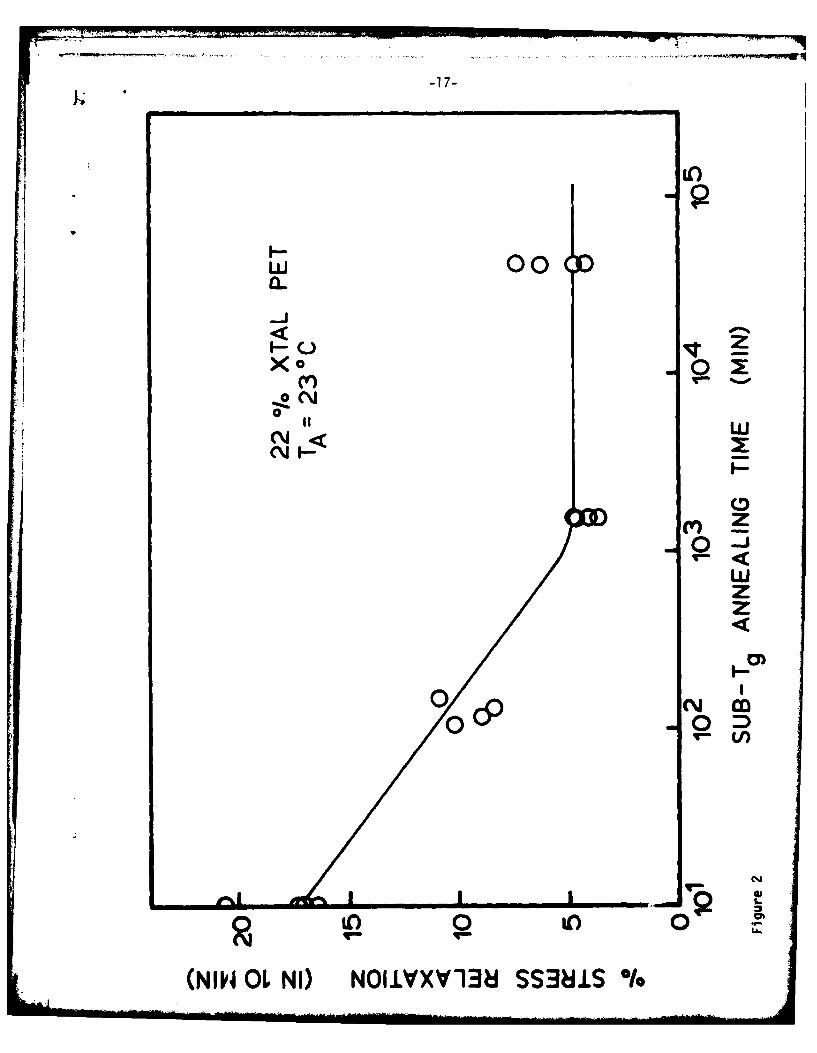
Stress relaxation data for amorphous and 22% crystalline PET are shown
in Figures 1 and 2, respectively. It is clear that percent stress relaxation
during the first 10 minutes of the experiment decreases with sub-Tg annealing
time, thus indicating an increase in the molecular relaxation times. This
result is expected during physical aging as the decrease in free volume with
time results in a corresponding decrease in molecular mobility. This reduced
mobility causes molecular relaxations to become slower, thus shifting the
relaxation spectrum to longer times as the physical aging process proceeds
and the shorter time relaxations occur. Determining the percent relaxation
of stress during the first 10 minutes of relaxation as a function of sub-Tg
annealing time is only one method of monitoring this shift in the relaxation
spectrum.
As can be seen from Figures 1 and 2, the decrease in percent stress
relaxation is linear with respect to logarithmic sub-Tg annealing times
until an apparent equilibrium value for this experiment at about 2000 minutes.
From the data, one might be tempted to say that an actual equilibrium state
has been reached and that physical aging has ceased, but this has proven not
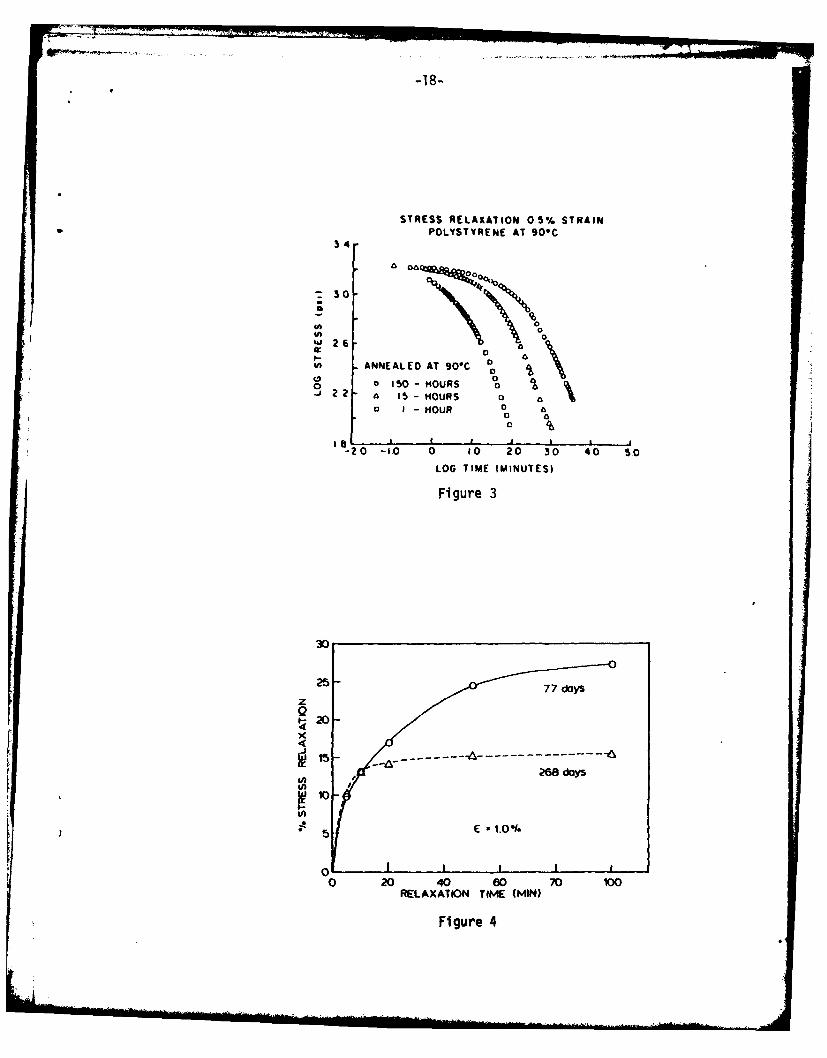
to be the case. Matsuoka, et al. (8) obtained stress relaxation data for
polystyrene aged below Tg for different times, as is shown in Figure 3. These
curves show very little variation during the first part of the stress
relaxation experiment. However, as the experiment proceeds the data for the
different annealing times deviate greatly, with the more aged samples relaxing
much more slowly than the samples which had been aged for shorter times. The
first part of the curves are seen to approach a single curve with sub-Tg
annealing time, while for longer times the respective curves show different
behavior. Thus, it is expected that an apparent equilibrium value of percent
-7-
stress relaxation during the first few minutes of the stress relaxation
experiment would be observed for these polystyrene samples annealed for
longer periods of time. This is exactly what has been observed for PET
in the present work. To further substantiate this explanation, stress
relaxation experiments were performed on two amorphous PET samples which
had been annealed below Tg for different times. It was found that "+i
percent stress relaxation in 10 minutes was the same for both samples, but
as the stress relaxation experiment proceeded the results were very different
with the older sample relaxing at a much slower rate than the sample which
had been annealed for a shorter time period. The results of this experiment
are shown in Figure 4, where the calculated percent relaxation of stress is
plotted vs. time since the beginning of the stress relaxation experiment
(relaxation time). It is clear that had a longer time "window" than 10
minutes been used to determine the percent stress relaxation, the apparent
equilibrium at 2,000 minutes would not have occurred - at least until a
longer annealing time had been reached. Thus, the apparent equilibrium reached
at about 2,000 minutes, is simply a consequence of the experiment, and does
not indicate that an equilibrium condition has been reached and that physical
aging has stopped.
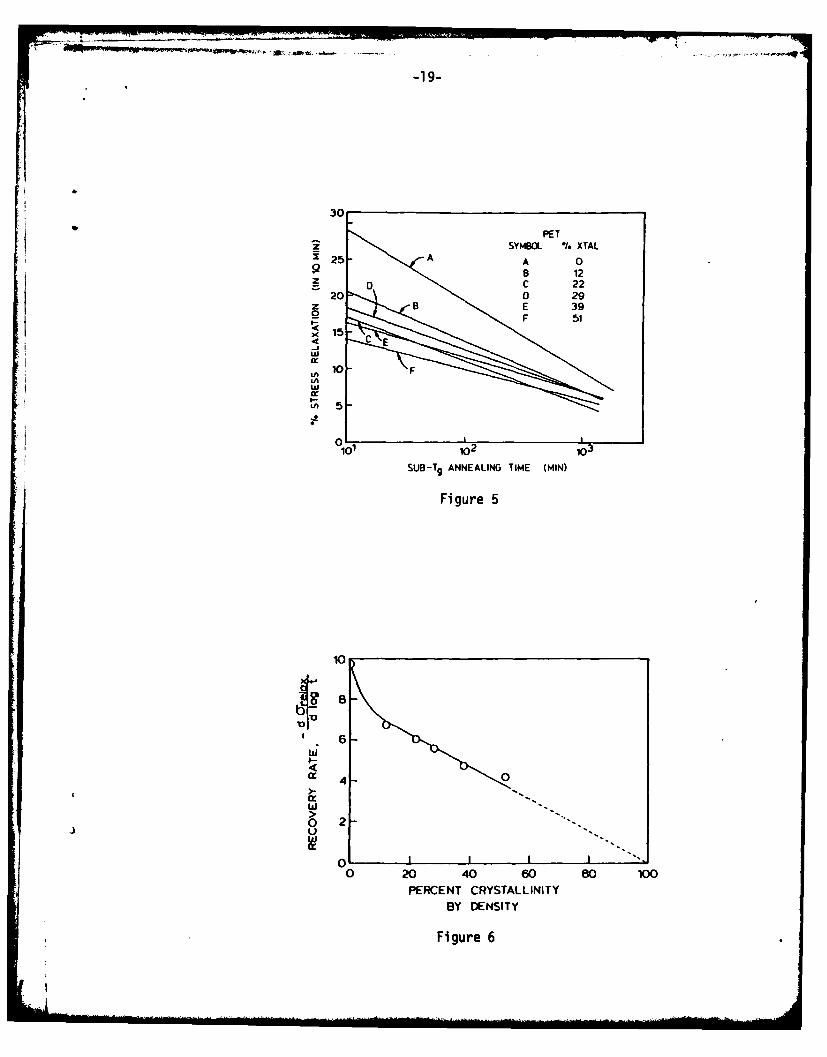
A composite presentation of the stress relaxation data for amorphous
PET and the various degrees of semicrystalline PET is given in Figure 5.
In general these curves move to lower values of percent stress relaxation
with an increasing degree of crystallinity. The fact that the curve for the
22% crystalline PET lies below the curve for the 29% crystalline PET is likely
due to scatter in the data. The slopes of these lines may be related to the
rate of recovery toward equilibrium or the rate of physical aging. For
discussion purposes, the recovery rate is defined here as being the negative
of the slope for the percent stress relaxation vs. logarithmic annealing time

plot. The recovery rate, as defined here, is thus related to the rate of
physical aging. Figure 6 shows this recovery rate as a function of crystallin-
ity for PET. The change in recovery rate with percent crystallinity is
significant, as the recovery rate of amorphous PET is more than twice that
of 51% crystalline PET. The decrease in recovery rate with increasing
percent crystallinity may occur for several different reasons. First, as
crystallinity increases, the amorphous fraction decreases thereby affecting
the degree of stress relaxation accoraingly. Secondly, broadening of the
glass transition with increasing crystallinity would effectively increase
the temperature increment below Tg and thus retard the aging process.
Thirdly, the local strain in the glassy amorphous regions may vary as a
function of crystallinity, thus altering the rate of stress relaxation (9).
Finally, the crystlline regions may well alter the relaxation spectrum as a
result of increasing the rigidity of the overall structure and decreasing
the mobility of amorphous molecules that extend into and become part of the
crystals. Likely more than one of the above mechanisms contribute to the
aging process.
The nonequilibrium phenomenon is an inherent feature of glassy materials
and is not observed in crystalline materials. For a totally crystalline
polymer then, one would not expect physical aging to occur, and indeed the
recovery rate, as defined here, would be zero. Strikingly, it is found that
if the linear portion of the curve in Figure 6 is extrapolated beyond 51%
crystallinity, as shown by the dashed line, this extended line intersects
zero recovery rate et 100% crystallinity - precisely where the physical aging
process would be expected to cease.
The recovery rate for amorphous PET does not fall on the linear line
formed by data from PET of various crystallinities, as shown in Figure 6.
This result might have been expected. Amorphous and crystalline polymers
-9-
differ greatly in structure, and the properties displayed by these two
types of materials are vastly different. Thus, when even a small amount
of crystallinity is introduced into an amorphous polymer, the resulting
properties and associated relaxation processes are significantly influenced
by the crystalline regions. The fact that the recovery rate for amorphous
PET is not collinear with the recovery rates for semicrystalline PET
materials is therefore not surprising.
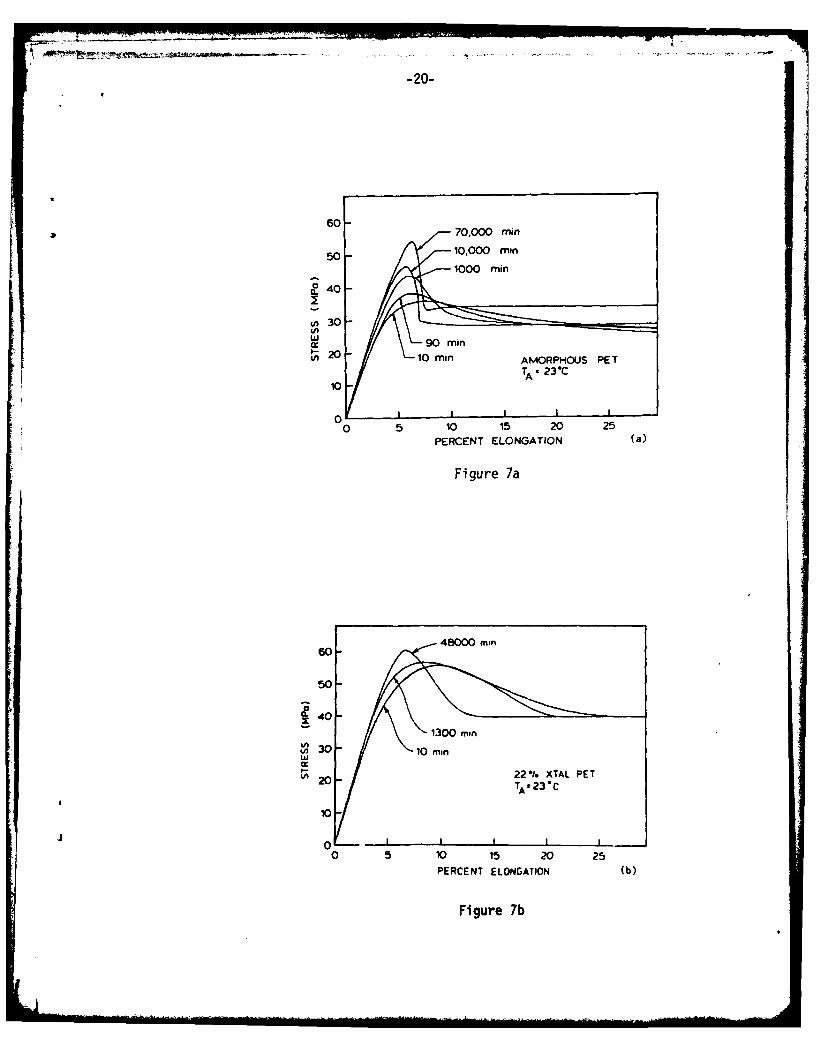
Stress-strain Behavior
Stress-strain curves for amorphous PET and PET materials of various
crystallinity are shown in Figures 7a-d as a function of sub-Tg annealing
time. Clearly, there is an increase in both Young's modulus and yield
stress as well as a decrease in yield strain as physical aging progresses
for PET of crystallinities ranging from 0% to 39%. Somewhat similar
behavior has been observed for amorhpous PET by Petrie (1) and Minnini (17).
There is no observable change with sub-Tg annealing in the stress-strain
behavior of 51% crystalline PET. Again the increase in Young's modulus is
due to the shifting of the relaxation spectrum to longer times, i.e. as
free volume and molecular mobility decrease when the material is aged, molecular
arrangement mechanisms become progressively slower due to the increased time
required for these rearrangements to occur. Thus, when samples annealed
below Tg for a short time are stretched, their high molecular mobility, as
contrasted with longer annealed samples, allow more rapid rearrangement of
the polymer molecules in reducing stress, and thus stress increases at a
slower rate. When samples annealed below Tg for Ilroger times are stretched
at the same rate, reduction of stress by molecular rearrangement is slower,
and thus stress increases at a faster rate. The increase in yield stress
with sub-Tg annealing occurs because, as molecular mobility is decreased upon
-10-
annealing, a greater amount of energy is necessary to initiate the molecular
motions associated with yielding. The fact that stress-strain behavior of
51% crystalline PET does not change upon sub-Tg annealing is clearly due to
the high crystallinity involved. As the 51% crystalline sample is stretched,
the stress distribution is apparently rather concentrated in the interconnected
crystalline regions due to their high resistance to deformation. Thus, changes
in the amorphous regions due to physical aging anparently have an insignificant
effect on the stress-strain behavior of 51% crystalline PET at the strain
rate used for this experiment.
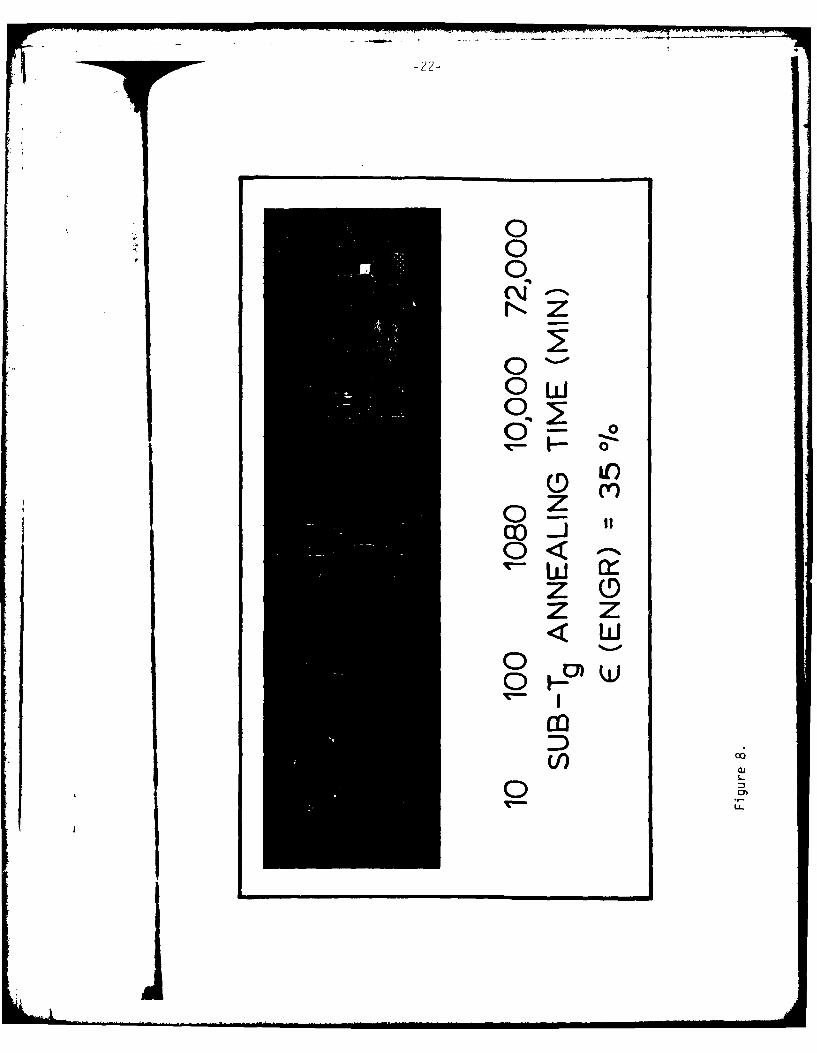
While performing the stress-strain experiments on amorphous PET, another
interesting observation was made. Figure 8 shows dog-bone samples of
amorphous PET which were annealed at room temperature for various times and
then elongated 35% (engineering strain) at a crosshead speed of 1 mm/min.
There is an obvious difference in optical clarity in the drawn region for
samples annealed for different times. It has been demonstrated by wide-angle
x-ray scattering (WAXS) that the increased whitening in the drawn region with
sub-Tg annealing is due to increased crystallinity. Thus strain induced
crystallinity at 35% elongation, for samples aged for various times and then
elongated, increases with sub-Tg annealing time. This is probably due to the
decrease in free volume upon annealing, i.e. the closer proximity of the
molecules in aged samples may possibly promote necking and associated
crystallization upon orientation. Further work will be necessary to prove
or disprove this speculation.
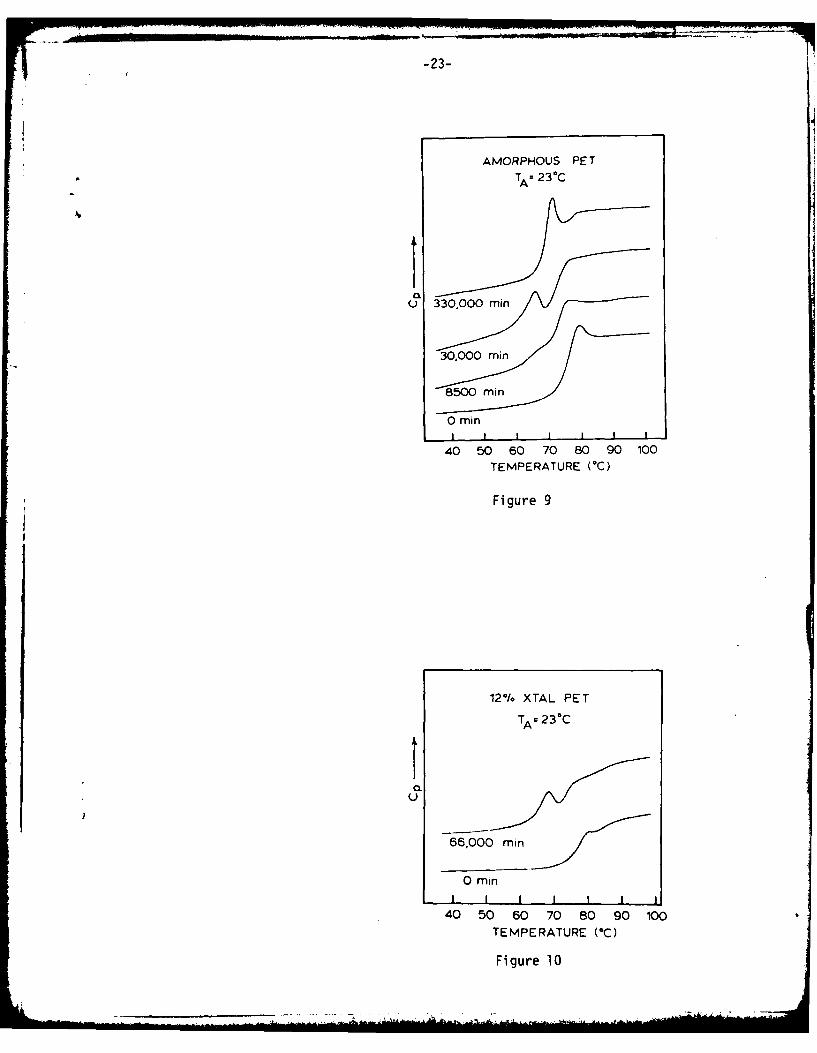
Differential Scanning Calorimetry
DSC data for amorphous and 12% crystalline PET are shown in Figures 9
and 10. Figure 9 shows that, in addition to increasing in size, the endo-
thermic enthalpy recovery peak begins well below Tg and shifts toward Tg with
• -1 1-
sub-Tg annealing time. This has been explained on the basis of free volume
and molecular mobility (1). As the temperature of the polymer material
is increased during the DSC scan, the enthalpy increases in a manner typical
of a solid. When the molecular mobility becomes sufficient, the equilibrium
amorphous conformation is rapidly approached and this is reflected by an
absorption of energy - the enthalpy recovery peak. The temperature at
which this critical molecular ability is reached is dependent upon both the
availability of free volume necessary for molecular mobility and the heating
rate. However, the degree of free volume is dependent upon the aging history
of the material. As stated earlier, as sub-Tg annealing time increases the
free volume related to nolecular mobility decreases, and thus the temperature
at which the molecular rearrangement occurs will increase with annealing time
since more thermal energy will be required to cause motion. Also, the enthalpy
recovery peak will occur at higher temperatures for faster heating rates (18).
This is also explained on the basis of molecular mobility. As an aged
material is heated, different relaxation processes begin at different tempera-
tures. At faster heating rates, some of these processes occur more slowly
than the rate of change of temperature. Thus their effect of the DSC trace,
the enthalpy recovery peak, is observed at higher temperatures. At slower
heating rates, the effects of these processes are observed much closer to the
temperature at which they were initiated.
Petrie (19) has also studied the enthalpy recovery behavior of amorphous
PET, but did not observe a substantial shifting of the recovery peak to
higher temperatures. However, Petrie's annealing study was conducted at 650C,
just below Tg, while annealing for this work was conducted at 230 C. The enthalpy
recovery peak would not be expected to occur below the annealing temperature,

-12-
and thus the fact that it occurs at Tg when annealed at 650 C is not surprising.
The position of the endotherm is dependent upon the initial state of the glass,
as described before, and materials annealed at different temperatures should
certainly be expected to be in different states. This shifting of the
endotherm to higher temperatures, beginning well below Tg, has also been
observed in amorphous PET by Mitsuishi and Kuroda (20).
Figure 10 shows that enthalpy recovery also occurs for 12% crystalline
PET. This behavior was expected due to the high percentage of glassy polymer
present, but it was not previously known whether or not enthalpy recovery
would be easily detectable in this semicrystalline polymer by the DSC technique.
-13-
Conclusions
Both the extent and rate of physical aging in PET were found to decrease
with increasing percent crystallinity, as was expected. The recovery rate of
semicrystalline PET was determined to be related to percent crystallinity in
a linear fashion above 20% crystallinity, with this line extrapolating to
zero recovery rate at 100% crystallinity.
The drawing behavior of amorphous PET was found to depend greatly upon
the aging history. After aging for different periods of time and then elongat-
ing 35%, the drawn region is increasingly more opaque for longer aged samples.
This was found to be due to a higher crystallinity in the drawn region for more
aged samples, apparently due to the increase in packing density which may
possibly promote crystallization upon orientation.
Enthalpy recovery behavior was observed in both amorphous and semi-
crystalline PET, supporting the finding that physical aging occurs in semi-
crystalline as well as amorphous polymers.
Il
-14-
References
1. S.E.B. Petrie in "Polymeric Materials: Relationships Between Structure
and Mechanical Behavior", Am. Soc. for Metals, Metal Park, OH (1975).
2. L.C.E. Struik, "Physical Aging in Amorphous Polymers and Other Materials",Elsevier, New York (1978).
3. A.J. Kovacs, J.M. Hutchinson, and J.J. Aklonis, in "The Structure ofNoncrystalline Materials", P.H. Gaskell, Ed., Taylor and Francis,Ltd., London (1977).
4. E. Ito, K. Yamamoto, Y. Kobazashi, and T. Hatakeyama, Polymer 19, 39 (1978).
5. S.G. Brown, R.E. Witlan, M.J. Richardson, and N.G. Savill, Polymer 19,659 (1978).
6. M.J. Richardson and N.G. Savill, Polymer 18, 413 (1977).
7. R.E. Robertson, J. Polym. Sci., Polym. Symp. 63, 173 (1978).
8. S. Matsuoka and H.E. Bair, J. Appl. Phys. 48, 4058 (1977).
9. S. Matsuoka, H.E. Bair, S.S. Bearder, H.E. Kern and J.T. Ryan, Polym.Eng. Sci. 18, 1073 (1978).
10. J.M. O'Reilly, Polym. Prepr. 20 (1), 762 (1979).
11. Z.H. Ophir, J.A. Emerson, and G.L. Wilkes, J. Appl. Phys. 49, 5032 (1978).
12. J. Kaiser, Macromol. Chem. 180, 573 (1979).
13. M.R. Tant and G.L. Wilkes, Polym. Prepr., in press.
14. M.R. Tant and G.L. Wilkes, in preparation.
15. B. Wunderlich, "Macromolecular Physics", Vol. 1, Academic Press, New York(1973), p. 382.
16. R. De P. Daubery and C.W. Bunn, Proc. Ray. Soc. A, 226, 531 (1954).
17. R.M. Mininni, R.S. Moore, J.R. Flick and S.E.B. Petrie, J. Macromol. Sci.Phvs B8, 343 (1973).
18. S..rOWn, R.E. Wetton, M.J. Richardson, and N.G. Savill, Polymer 19,659 (1978).
19. S.E.B. Petrie, J. Polym. Sci. A-2 10, 1255 (1972).
20. Y. Mitsuishi and Y. Kuroda, Sen-i Gakkaishi 24, 11 (1968).
-15-
Figure Captions
Figure 1: Percent stress relaxation as a function of sub-Tg annealingtime for amorphous PET aged at 230C.
Figure 2: Percent stress relaxation as a function of sub-Tg annealingtime for 29% crystalline PET aged at 230C.
Figure 3: Stress relaxation in PS with various thermal histories, but atthe same strain and same temperature (Matsuoka, et al. (9)).
Figure 4: Percent stress relaxation in amorphous PET with different thermalhistories as a function of relaxation time, at the same strainand temperature.
Figure 5: Composite plot of percent stress relaxation as a function ofsub-Tg annealing time for PET of various degrees of crystallinity.
Figure 6: Recovery rate (-d log relax/d log t) for PET as a function ofpercent crystallinity, showing extrapolation to 100% crystallinity.
Figure 7: a) Stress-strain curves measured at various sub-Tg annealing timesfor amorphous PET.
b) Stress-strain curves measured at various sub-Tg annealing timesfor 22% crystalline PET.
c) Stress-strain curves measured at various sub-Tg annealing timesfor 29% crystalline PET.
d) Stress-strain curves measured at various sub-Tg annealing timesfor 39% crystalline PET.
Figure 8: Drawn amorphous PET elongated at various times after the quench,showing increasing whitening of the drawn region.
Figure 9: Annealing time effects on the DSC traces of amorphous PET.
Figure I : Annealing time effects on the DSC traces of 12% crystalline PET.
,.
00
LLIn
C-
~0 0)
1<
0
zz
0 CO
to0 toj 0t
(NIH OL NI) NOIIVXV13H SS381S %~
H 000-
-jr<HOC-
o\J
0do)
wzz
NM co
0 0 04
IA) 0
(NIH4 OL NI) NOliLVXV13?3 SS3W..S
STRESS RELAXATION 0.5% STRAINPOLYSTYRENE AT 909C
34
06,1 0004
0
(A ANNEALED AT 90*C 00
0o 115 IS-HOURS a2. 2 -6 15 -HOURS
--HOUR 0
-20 -v0 0 10 20 30 40 so
LOG TIME (MINUTES)
Figure 3
30
25-77aS
z
Q- 20
408dy
10
RELAXATION TIME (MIN)
Figure 4
-19-
30
PETK SYMBOL T% XTALX 25 A A 0
a 1220 D 29
20 C 22z B E 39o F 51
x 15-
10- FLA
wI 5-
101 102 103
SUB-Tg ANNEALING TIME (MIN)
Figure 5
10
6Li
-4 :
Il
o 2-U
0 I I l I " -
0 20 40 60 80 100PERCENT CRYSTALLINITY
BY DENSITY
Figure 6
-20-
60-
50-000 mi
CL 40-
S30-
(-A 0 -/0 0;mnAMORPHOUS PET
TA - 2PC U
10
PERCENT ELONGATION(a
Figure 7a
6000mi
50-
30 - 10mi
U) 22%. XTAL PET20-TA-23-*C
0 - I I III i
PERCENT ELONGATION (b)
Figure 7b
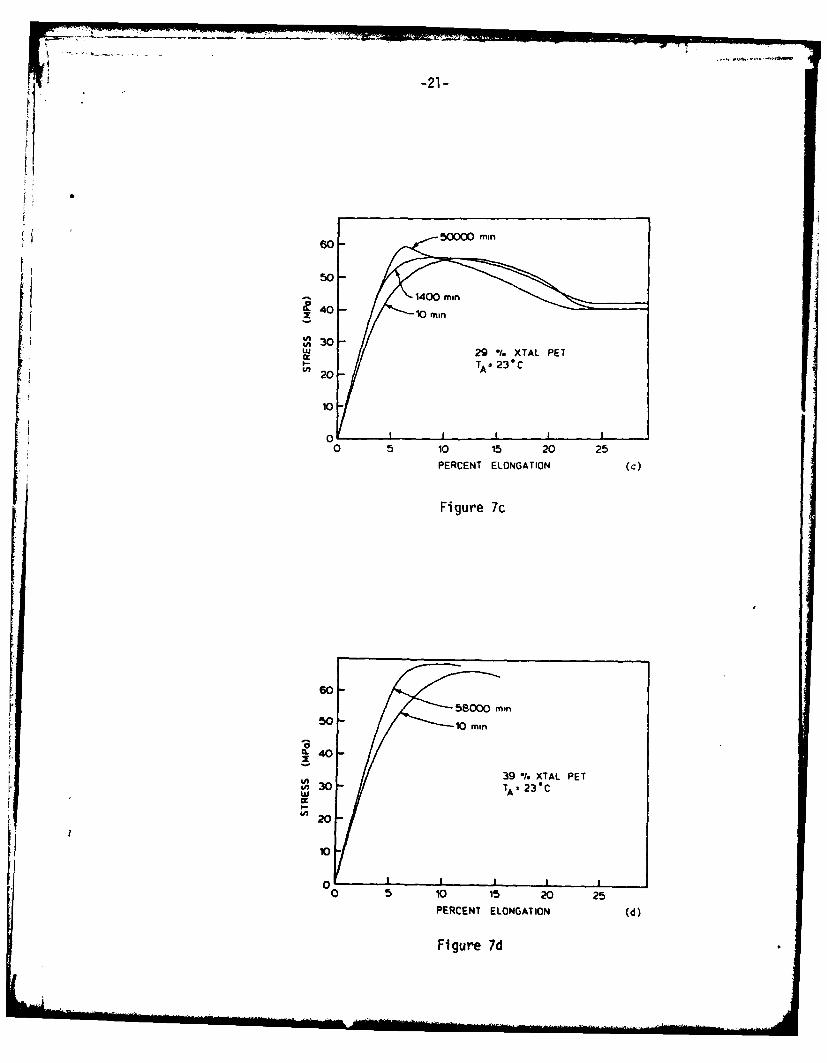
-21-
K
50*
14040 mn-,0 rniu 30'LU 29 % XTAL PET
TA=23-C
0
0 5 10 15 20 25
PERCENT ELONGATION (c)
Figure 7c
60-
58000 min5)0 - /10 m in
C 40
39 1. XTAL PETt3o 3TA 2CLU
20
10
00 5) 1 20 25PERCENT ELONGATION (d)
Figure 7d
whom
0 00
(Y)
zOz z
0GoL
-23-
AMORPHOUS PET
TA 23°C
330,000 min
0 rmin
40 50 60 70 80 90 100
TEMPERATURE (°C)
Figure 9
12% XTAL PET
TA= 23°C
U
66,000 min
0 min
40 50 60 70 80 90 100
TEMPERATURE (C)
Figure 10

LI