United Study May 3 updated - Godig.abclocal.go.com/ktrk/UnitedStudyMay3.pdfExhibit 42: Expected...
66
May 3, 2012 Prepared by United Airlines in collaboration with William Swelbar Research Engineer, International Center for Air Transportation, Massachusetts Institute of Technology with Houston regional economic impact analysis conducted by Dr. Barton Smith Professor Emeritus of Economics, University of Houston
Transcript of United Study May 3 updated - Godig.abclocal.go.com/ktrk/UnitedStudyMay3.pdfExhibit 42: Expected...

May 3, 2012 Prepared by
United Airlines
in collaboration with
William Swelbar
Research Engineer, International Center for Air Transportation,
Massachusetts Institute of Technology
with Houston regional economic impact analysis conducted by
Dr. Barton Smith
Professor Emeritus of Economics, University of Houston

The Economic Impact of Dividing International Air Service between Houston Airports
i
Table of Contents
Report Highlights ..................................................................................................................... 1
1) Executive Summary .......................................................................................................... 3
2) The Economics of Gateway Hubs ...................................................................................... 7
a) United Remains Houston’s Committed Economic Partner ............................................................... 7
b) Because Large Network Carriers Such as United Operate on Very Thin Profit Margins, Even Small Changes in Traffic Can Quickly Undermine the Economics of a Hub ...................................................... 12
3) The HAS Hobby Study Suffers From Numerous Analytical Flaws and Incorrect Assumptions That Render Its Conclusions Invalid .................................................................. 16
a) The “Projected Fares” in the HAS Hobby Study—A Key Determinant of the Purported Stimulation of Traffic Because of the “Southwest Effect”—Are Unrealistically Low ................................................. 16
b) The HAS Hobby Study Assumptions Regarding the State of Airline Competition at Houston and Current Houston Fares are Unfounded .................................................................................................. 22
c) The HAS Hobby Study’s Analysis of Passenger Stimulation Resulting from Lower Fares Suffers from Numerous Fundamental Flaws ...................................................................................................... 23
d) Based on the Projected Fares in the HAS Hobby Study, Southwest Would Lose More Than $75 Million and Have an Operating Margin of Approximately Negative 50% on the 11 Hypothetical Routes …………………………………………………………………………………………………………………………………………………..33
e) The HAS Hobby Study Ignores the Impact of Weakening IAH vis‐à‐vis Other Hubs as an International Gateway ............................................................................................................................ 34
4) The HAS Hobby Study’s Economic Impact Analysis is Critically Flawed ........................... 37
a) Economic Impact Analysis ............................................................................................................... 37
b) Flaws in the HAS Hobby Study: Erroneous Inputs ......................................................................... 39
c) Flaws in the HAS Hobby Study: Improper Use of Economic “Output” (i.e., Sales) vs. Value‐Added (i.e., Regional GDP) ................................................................................................................................. 43
d) The Differences in the Results of the HAS and the United Studies ................................................ 45
e) Conclusions Regarding the HAS Hobby Study I‐O Analysis ............................................................. 47
5) All Hobby Passengers – Not Southwest – Will Pay for the Proposal ................................ 47
a) Contrary to its Public Statements, Southwest Will Not Fund this Project, the Houston Airport System and Hobby Passengers Will ........................................................................................................ 47
6) Custom and Border Protection Impacts .......................................................................... 49
a) A New Mandate to Staff a CBP Inspection Facility for Commercial Traffic at Hobby Could Result in CBP Service Degradation at IAH and Other CBP Ports of Entry in Texas ................................................ 49

The Economic Impact of Dividing International Air Service between Houston Airports
ii
b) CBP Passenger Wait Times at IAH are Already Significantly Longer than the National Average and those at Competing Airports, Especially at Peak Times .......................................................................... 52
c) Substantial Funding Increases of Federal Budgets, Including CBP’s, are Extremely Unlikely, Further Stressing CBP’s Houston Field Office ......................................................................................... 55
7) The HAS Hobby Study Ignores the Environmental Impact ............................................... 56
8) Conclusions .................................................................................................................... 57
Appendix A ............................................................................................................................ 58
Appendix B ............................................................................................................................ 59
Appendix C ............................................................................................................................ 60

The Economic Impact of Dividing International Air Service between Houston Airports
iii
Table of Exhibits
Exhibit 1: IAH is United’s Largest Hub Offering Flights to the Most Destinations ....................................... 7 Exhibit 2: IAH is the Second Largest U.S.‐Latin America Gateway Airport by Connecting Passengers PDEW ............................................................................................................................................................ 8 Exhibit 3: Growth in IAH Destinations Since 1996 ....................................................................................... 9 Exhibit 4: Change in Number of Destinations Served From IAH, 1996 vs. 2012 .......................................... 9 Exhibit 5: Growth in Destinations and Departures, IAH vs. Hobby, 1996‐2012 ........................................ 10 Exhibit 6: New Non‐Stop Routes Added Since October 2010 from United Hubs ...................................... 10 Exhibit 7: Departing Seats per Local Passenger (Top 40 Cities in the U.S.) ................................................ 11 Exhibit 8: Pre‐Tax Margins of the Large Network Carriers, 2002‐2011Q3 ................................................. 12 Exhibit 9: Only a Small Handful of Passengers on United’s Flights Generate a Profit ............................... 13 Exhibit 10: Composition of Passengers on Typical United IAH flight to Latin America ............................. 14 Exhibit 11: A Degradation of United’s IAH Hub Will Force United to Pull Down Service and Forego Growth Opportunities ................................................................................................................................. 14 Exhibit 12: Even Ignoring Additional Costs of Providing International Services, the Fare Projections Based on Southwest Hobby Fares are, on Average, Approximately 60% Higher than the HAS Hobby Study’s Projections .................................................................................................................................................. 17 Exhibit 13: The IAH Fares in the HAS Hobby Study are Substantially Overstated ..................................... 19 Exhibit 14: Traffic and Fare Changes Proposed in the HAS Hobby Study are Inconsistent with Observed Results ......................................................................................................................................................... 21 Exhibit 15: % Change in Domestic Yield vs. 1993 for Southwest and Legacy Carriers ............................... 22 Exhibit 16: Southwest Airlines Average One‐Way Fares, Houston vs. Remainder of System ................... 23 Exhibit 17: Existing Non‐Stop Service on HAS Hobby Study Southwest Routes from Hobby .................... 25 Exhibit 18: Five‐Year Percentage Change in International Seats ............................................................... 26 Exhibit 19: Five‐Year Percentage Change in Seats at Major Western European Hubs .............................. 27 Exhibit 20: United and American Latin America Service at ORD, March 2012 vs. March 2010 ................ 28 Exhibit 21: 2006 vs. 2011 Change in Overlapping EWR/JFK – Latin America Markets .............................. 28 Exhibit 22: 2007 vs. 2011 Capacity Change in Overlapping FLL/MIA – Latin Markets ............................... 29 Exhibit 23: Change in American Daily Seats, 2006 vs. 2012 ....................................................................... 30 Exhibit 24: Total Seats San Juan, 2001‐2012 .............................................................................................. 31 Exhibit 25: A Well‐Timed Southwest Flight from Houston Hobby to Cancun Would Connect to Only 18 Cities ............................................................................................................................................................ 32 Exhibit 26: United’s Cancun Services Connect to 111 Destinations in the U.S., Canada, Europe and Japan .................................................................................................................................................................... 33 Exhibit 27: Estimated Impact of International Service at Hobby Airport on Passenger Traffic at Houston Airports ....................................................................................................................................................... 35 Exhibit 28: IAH is Smaller than the Other Two Primary Alternate Hubs for Latin Service ......................... 36 Exhibit 29: Estimated Economic Impact of International Service at Hobby Airport .................................. 37 Exhibit 30: GRA’s Estimated Job Impacts per Passenger are Inconsistent with the HAS 2011 Study ....... 40 Exhibit 31: The HAS Hobby Study’s Estimated Job Impacts per New Flight are Inconsistent with the HAS 2011 Study .................................................................................................................................................. 41

The Economic Impact of Dividing International Air Service between Houston Airports
iv
Exhibit 32: Estimated Impact of International Service at Hobby Airport on Passenger Traffic at Houston Airports ....................................................................................................................................................... 43 Exhibit 33: Estimated Impact of International Service at Hobby Airport on Employment ........................ 45 Exhibit 34: Estimated Impact of International Service at Hobby Airport on Output ................................. 46 Exhibit 35: Southwest Contribution to the Hobby FIS Compared to United’s Contribution to IAH Terminal B .................................................................................................................................................................. 48 Exhibit 36: CBP Ports of Entry by State ...................................................................................................... 50 Exhibit 37: Texas Ports of Entry by Field Office ......................................................................................... 51 Exhibit 38: CBP Wait Time Ranking ............................................................................................................ 52 Exhibit 39: 2011 CBP Wait‐Time Range by Airport .................................................................................... 53 Exhibit 40: Three Year IAH Wait‐Time Average and Range at Peak Times ............................................... 54 Exhibit 41: CBP Wait Times at Key Southern Hubs .................................................................................... 55 Exhibit 42: Expected Southwest Airlines’ Loss Under the HAS Assumptions ............................................ 58 Exhibit 43: Expected Southwest Airlines’ Loss Under the HAS Assumptions ............................................ 59 Exhibit 44: Operating Phase Results .......................................................................................................... 61

The Economic Impact of Dividing International Air Service between Houston Airports
1
ReportHighlights
• The Houston Airport System’s (HAS) April 4, 2012, study of economic impact of international flights from William P. Hobby Airport (HAS Hobby Study) reaches the wholly unrealistic conclusion that the new flying would result in 18,000 jobs and $1.6 billion in annual economic impact. The HAS Hobby Study reaches these incorrect conclusions as a result of three basic, critical flaws in its assumptions:
o Unrealistically low fares on the new routes, which in turn result in unrealistically high new passenger volumes;
o Significantly overstated direct employment requirements at William P. Hobby Airport (Hobby) to support the new international flying, compared to current employment levels; and
o That United Airlines (United) would not reallocate flying away from Houston to other, more profitable parts of United’s network as a result of the drain of passenger traffic from George Bush Intercontinental Airport (IAH).
• Allowing international flights at Hobby would result in a net loss to the Houston region of 3,700 jobs and $295 million in gross regional product. This net impact is the result of the loss of 5,000 jobs and $414 million in gross regional product from impacts at IAH combined with the gain of 1,500 jobs and $120 million gross regional product from impacts at Hobby.
• Adding Hobby international flights would jeopardize future growth at IAH and result in a reduction of 6% of United’s current capacity and another 4% of planned capacity at IAH.
• International expansion by low cost carriers (LCC) does not stimulate service by incumbent carriers. In fact, based on analysis of other multi‐airport metropolitan areas, it causes reduced capacity on overlapping routes.
• HAS debt backed by a 50% increase in Passenger Facility Charges (PFCs) paid by all Hobby customers would fund the estimated $100 million cost of the Hobby international gates.
• United’s local Houston domestic passenger share is 48%, compared to 31% for Southwest Airlines (Southwest), but, because of the connecting traffic United brings through IAH, United is able to offer more flight options to more destinations than Houston traffic alone can support. Today, IAH is United’s largest hub. Since the 2010 merger with Continental, United has added 12 new nonstop routes from IAH, more than it has added from any other hub and the same number it has added at Newark Liberty (EWR), Denver International Airport (DEN) and Chicago O’Hare (ORD) combined.

The Economic Impact of Dividing International Air Service between Houston Airports
2
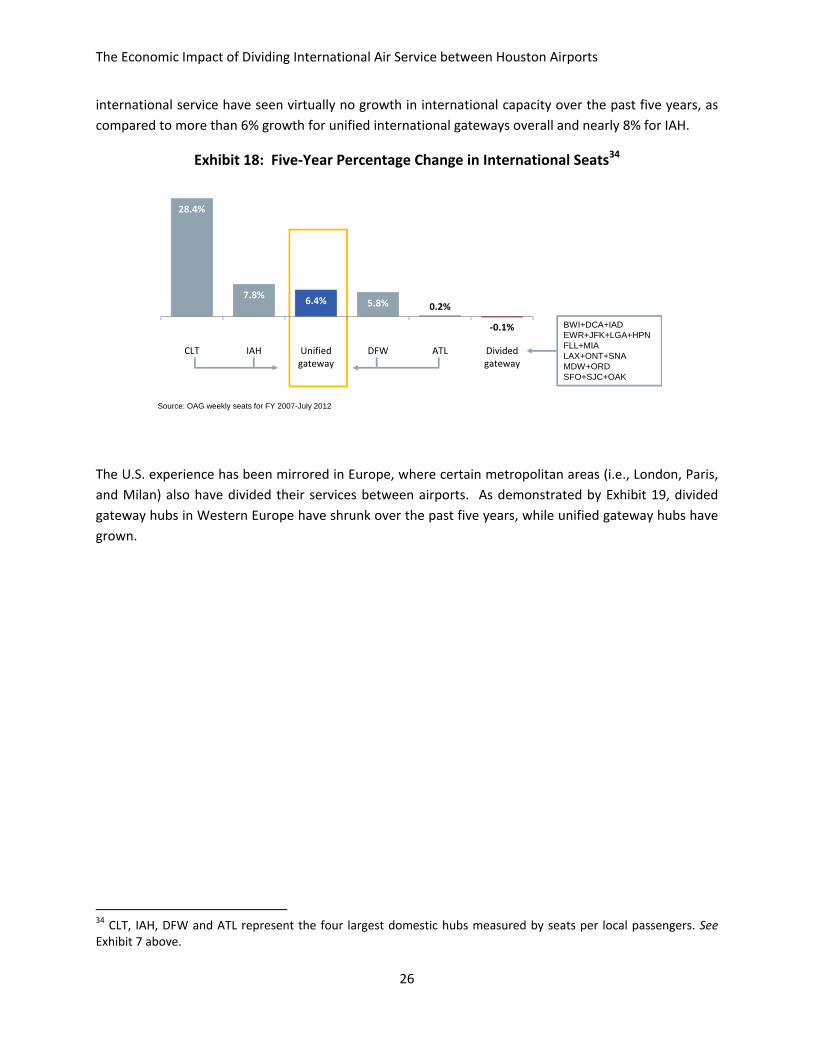
• Metropolitan areas with multiple airports providing international service have seen virtually no growth in international capacity over the past five years, as compared to more than 6% growth for unified international gateways overall and nearly 8% for IAH.
• United’s growth at IAH and the resulting connectivity opportunities have benefited all 16 airlines that serve IAH and compete vigorously there. For example, Frontier just announced it would become the 17th carrier at IAH, citing the benefits of connectivity there. There is ample capacity at IAH to accommodate new flying.
• Adding an additional Federal Inspection Services (FIS) facility in Houston at a time of federal budget constraints would leave insufficient U.S. Customs and Border Protection (CBP) staff to serve customers effectively, further exacerbating the long customs processing time for IAH customers and degrading IAH’s position as an international gateway.

The Economic Impact of Dividing International Air Service between Houston Airports
3
1) ExecutiveSummary
The Houston Airport System Director of Aviation, Mr. Mario Diaz, recommended in an April 9, 2012, letter to Mayor Annise Parker that the City of Houston (the City) accept the proposal of Southwest to initiate scheduled international air service through its subsidiary AirTran (the Proposal) at William P. Hobby Airport (Hobby). Mr. Diaz based his support for this recommendation on the HAS Hobby Study conducted by GRA and InterVISTAS.1 United Airlines (United) undertook this study in collaboration with Mr. William Swelbar2 and Dr. Barton Smith3 to demonstrate the real impact of the Proposal on the Houston economy (the United Study).
The United Study will demonstrate that the HAS Hobby Study suffers from fundamental flaws that undermine all of its key findings. The flaws compound upon one another, resulting in a grossly exaggerated annual economic impact of $1.6 billion and 18,000 jobs4 from the addition of 23 international flights from Hobby. The United Study corrects the HAS Hobby Study’s faulty assumptions and analysis and demonstrates that dividing international air service at Houston would cost the city close to 3,700 jobs and would result in lost gross regional product (GRP) of $295 million per year.5
1 As Mr. Diaz’s letter notes, “Critical to my recommendation are the results of economic impact reports completed at HAS's request…” and “…the report speaks for itself...” 2 Mr. Swelbar is a Research Engineer in the Massachusetts Institute of Technology’s International Center for Air Transportation, where he is affiliated with the Global Airline Industry Program and Airline Industry Research Consortium. Mr. Swelbar has spent 25 years in the consulting world with a focus on airline‐labor cost restructuring, regulatory issues governing air transport, communication strategy and support, and air‐service development on behalf of airports and communities. He also currently serves as a member of the Board of Directors of Hawaiian (Airlines) Holdings, Inc. 3 Dr. Smith was assisted by Evert Crawford, Director of the Institute for Regional Forecasting. Dr. Smith is a Professor Emeritus of Economics at the University of Houston. He formerly taught and conducted academic research in urban economics and public finance. He has been affiliated with the University of Houston since 1973 and has previously served as Chairman of University of Houston’s Economics Department, the Director of the Center for Public Policy and the Director of the Institute for Regional Forecasting. Dr. Smith has conducted numerous studies in urban, housing, transportation, and environmental economics and has published many articles in academic journals and books. During the past 15 years, Dr. Smith has gained national and local recognition for his analyses of the Houston economy and real estate markets. He wrote the Center’s Handbook on the Houston Economy and continues to publish two symposium reports per year on Houston’s economy and real estate markets. In addition to his academic work, Dr. Smith has served as a consultant to many national and local organizations, conducting analyses of real estate markets, regional economic trends, and socio‐economic impacts. Dr. Smith is also a highly sought‐after speaker by both profit and non‐profit organizations from coast to coast. 4 The 18,000 figure appears in HAS Exhibit 21 (18,111 jobs) and is the sum of the direct (3,167), indirect (3,714), and induced (11,230) jobs. On page 2 of the same report, they say that “New international air service at Houston Hobby and the resulting competition would generate…over 10,000 jobs across the greater Houston metropolitan area.” 5 Gross regional product is the market value for all goods and services produced in a region in a given time and is the regional equivalent of Gross Domestic Product (GDP).

The Economic Impact of Dividing International Air Service between Houston Airports
4
Many of the HAS Hobby Study’s underlying assumptions (e.g., Southwest’s projected fares) are also inconsistent with the HAS Hobby Study’s own data. The HAS Hobby Study grossly overstates anticipated benefits for the City and should not be relied upon as the basis for making an important policy decision regarding the future of Houston’s status as a global aviation hub.
The most critical flaws and most unrealistic assumptions of the HAS Hobby Study include:
• Basing passenger and economic stimulation forecast on wholly unrealistic decreases in fares on the new international routes launched from Hobby.6 These hypothetical fare reductions are the result of compounding two serious errors: (1) using “projected fares” that are both unrealistically low and also directly contradicted by the HAS Hobby Study’s own yield analysis; and (2) dramatically overstating the current fares from IAH on the hypothetical routes that are relevant to the HAS Hobby Study’s fare comparison.7
• Assuming stimulation levels from the new service at Hobby that are not based on recent industry trends.
• Misrepresenting the causal links between LCC service and overall levels of traffic at a city.
• Using demonstrably incorrect assumptions regarding the current state of competition for air passenger service and fares in the Houston metropolitan area. For example, the HAS Hobby Study focuses on seat share rather than the share of origin and destination (O&D) passengers flying to or from Houston (the industry standard measure of market share) and compares average fares at Houston with those in other large U.S. metropolitan areas without consideration of local economic conditions.
• Erroneously assuming that United would not reduce capacity at IAH in response to expanded service by Southwest at Hobby, when basic economics and previous experience strongly suggest that the opposite would occur and when, in fact, United already has identified the capacity that it would reduce and the future growth that it would forego as a result of a second international gateway in Houston.
• Ignoring entirely the positive and well‐documented network effects that large airline hubs generate through the symbiotic relationship between local and connecting traffic. Houston—more than any other United hub—has benefited from these positive effects as a result of the United/Continental merger, as United has added more new destinations at IAH than at any other of its hubs. The proposal, however, would place these benefits at risk.
• Making incorrect “cause‐and‐effect” statements based only on a cursory review of the data. For example, in one instance the HAS Hobby Study concludes that de minimis new LCC service at
6See HAS Hobby Study, Exhibit 18. 7At the April 16, 2012, City Council meeting, even Southwest’s representatives were non‐committal regarding whether or not they would offer fares as low as those upon which the HAS Hobby Study is based.

The Economic Impact of Dividing International Air Service between Houston Airports
5
Chicago Midway caused increased competitive legacy carrier service, ignoring the more significant fact that a primary competitor (Mexicana) went bankrupt and exited the city. In another case, the HAS Hobby Study purports to show that the incumbent network carrier, American Airlines (American), expanded service at its Miami International Airport (MIA) as the result of LCC entry by JetBlue at Fort Lauderdale (FLL), when, in fact, MIA grew as a result of American dismantling its nearby San Juan hub (which itself resulted from JetBlue’s entry).
• Failing to consider the overwhelming number of both short‐ and long‐haul connecting passengers for whose business Houston competes directly with American and Delta Air Lines (Delta) hubs at Dallas/Fort Worth (DFW), Hartsfield‐Jackson Atlanta (ATL), and MIA, among others. By undermining the viability of IAH as a hub, the HAS Hobby Study’s recommendation would diminish Houston’s status as a premier gateway where it competes with these other hubs.
• Assuming airline‐ and airport‐related employment effects from the new Hobby services that are entirely inconsistent with current levels of employment at Hobby. For example, the HAS Hobby Study assumes that for each 1,000 newly stimulated passengers at Hobby (as a result of the proposed services), 2.45 airline jobs would be added, even though HAS’s own 2011 study (HAS 2011 Study) found that each 1,000 Hobby passengers accounts for only 0.98 airline jobs. 8
• Speculatively asserting economic benefits per‐gate that are inconsistent with the HAS 2011 Study published by the same consultancy not 18 months ago.9 For example, the HAS 2011 Study found that the Houston airports drive about $28 billion in economic benefit to Houston, or approximately $195 million per gate. In the HAS Hobby Study, however, the purported economic benefit is $325 million per gate, two‐thirds higher than in the previous study.
• Inflating economic impact figures by incorrectly focusing on “output” (i.e., sales) as the measure of economic impact rather than value‐added (or regional GDP). Put differently, the HAS Hobby Study counts the full value at each point that a good or service is sold, rather than just the added value at each point, substantially over‐counting the impact.
• Ignoring the impact on wait times at IAH as a result of dividing CBP resources between the two airports, and also ignoring the difficulty of adequately funding the additional CBP expenditures in a time of tight government budgets.
• Ignoring potential environmental impacts of the Hobby expansion. This includes the impact of the HAS Hobby Study’s purported increase in flights, increased traffic through congested areas, and other issues discussed below.
8 “Houston Airport System Economic Impact Study,” prepared by GRA, Incorporated, June 30, 2011. 9 Ibid.

The Economic Impact of Dividing International Air Service between Houston Airports
6
The United Study, in contrast:
• Derives the changes in passenger volumes using United’s ordinary course of business Quality‐of‐Service (QSI)‐based passenger forecast model, which the Company uses to plan and evaluate all of its network decisions.
• Acknowledges the delicate and symbiotic relationship between the amount of flow traffic and the economic viability of a hub and accounts for well‐understood network effects by assuming that United would re‐allocate current and future flying elsewhere in its network to maximize returns in response to Southwest’s entry into international markets from Hobby.
• Recognizes that unified international gateways maximize the ability to connect passengers to and from international flights, thereby providing greater incentives for other international carriers to offer non‐stop services to Houston and increasing the number of international destinations that are served by all carriers from the City.
• Draws conclusions regarding fares and capacity stimulation resulting from LCC entry based on a rigorous—rather than cursory—analysis of the available and relevant data.
• Retains Dr. Barton Smith, an expert renowned for his intimate knowledge of the local Houston economy, to analyze the effect of these more reasonable assumptions on the Houston‐area employment and income.
• Demonstrates that dividing CBP resources between the two airports will increase wait times and put IAH at a competitive disadvantage to other hub airports such as DFW, ATL and MIA.
The remainder of the report is organized as follows. Section 2 provides a general introduction and overview. Section 3 explains why an international gateway hub such as IAH is so dependent on connecting traffic and why even a small decrease in that traffic can make a significant difference in the service offered. Section 4 describes and illustrates the inconsistencies and exaggerations in the HAS Hobby Study’s economic impact analysis and sets forth Dr. Smith’s analysis. Section 5 describes how the Proposal would be funded, not at the risk of Southwest, but at the risk of HAS, with its debt repaid by a 50% increase in the PFC paid by passengers traveling from Hobby. Section 6 explains how the Proposal would strain the resources of the CBP. Section 7 addresses how the HAS Hobby Study avoids any discussion of the significant environmental impacts associated with the proposed service. Finally, Section 8 provides concluding comments.

The Economic Impact of Dividing International Air Service between Houston Airports
7
2) TheEconomicsofGatewayHubs
a) UnitedRemainsHouston’sCommittedEconomicPartner
United has served Houston since 1951 — more than 20 years before Dallas‐based Southwest began its Houston service — and, since that time, United has partnered with the city of Houston to build a world‐class international gateway at IAH. As demonstrated in Exhibit 1, Houston is United’s largest hub.
Exhibit 1: IAH is United’s Largest Hub Offering Flights to the Most Destinations
As Houston’s sole international airport, IAH has been able to compete globally with hubs at DFW, ATL, MIA and other major international gateways by achieving a critical mass and realizing economies of scale despite serving only eight international markets that have a local demand of at least 100 passengers who travel per day each way (PDEW). The competition with these international gateway hubs is especially fierce for passengers making connections to Latin America.
Source: OAG, June 2012.
113 124
79
114
8165 54 60
64 31
70 11
28
1912 3
177
155 149
125
109
84
66 63
0
50
100
150
200
HoustonIntercontinental
Chicago O'Hare Newark Liberty DenverInternational
WashingtonDulles
San FranciscoInternational
Los AngelesInternational
ClevelandHopkins
International
Air
port
s
Domestic International

The Economic Impact of Dividing International Air Service between Houston Airports
8
Exhibit 2: IAH is the Second Largest U.S.‐Latin America Gateway Airport by Connecting Passengers PDEW
United has proven its commitment to long‐term sustainable growth at IAH. Since 1996, United has invested almost $1 billion in facilities at IAH, including $268 million to construct the world‐class Terminal E international connecting facilities, and nearly $100 million for Phase 1 of a multi‐phase project to renovate Terminal B at an additional cost to United of $700 million. In addition, United has invested billions more in aircraft dedicated to the City and has sustained losses while developing new markets.10 United made these investments in good‐faith reliance on IAH remaining Houston’s sole international airport as it has been since it opened in 1969. As a result, as shown in Exhibit 3 and Exhibit 4, Houston residents have benefited from the addition of scores of new non‐stop destinations from IAH since 1996.
10 In addition, HAS has invested $440 million into the existing FIS as part of the International Services Expansion Program (at one of the airport’s international terminals), and plans an additional investment to upgrade the infrastructure at an estimated cost of $20 million for the first phase and an estimated $300‐400 million for a longer term reconstruction of the facilities to make IAH a world‐class international facility.
Source: Superset TME September 2011
7,293
4,819 4,624
2,6401,985
1,191 879 712 595 421
MIA IAH ATL DFW CLT PHX FLL JFK LAX PHL

The Econo
In total, tworld’s la
omic Impact o
the number orgest airport)
Exhibit 4: C
89
264
1996
Domes
2121
of Dividing In
Exhibit 3
of destination) has added m
Change in Nu
6
stic Latin
1
ternational A
3: Growth in
ns from IAH hmore internat
umber of De
Atlantic C
Air Service bet
9
n IAH Destina
has grown bytional destina
estinations S
115
54
8
2012
Canada Paci
183
tween Housto
ations Since 1
y 50% since 1ations than IA
Served From
fic
51
DLACP
T
on Airports
1996
1996. MoreoAH since 1996
m IAH, 1996 v
Change in
DomesticLatinAtlanticCanadaPacific
Total
over, only AT6.
vs. 2012
Destinatio
+2+2+4+3+1
+6
L (the
ns
262843
62

The Economic Impact of Dividing International Air Service between Houston Airports
10
Moreover, as shown in Exhibit 5, more service has been added at IAH since 1996 than exists in total today at Hobby.
Exhibit 5: Growth in Destinations and Departures, IAH vs. Hobby, 1996‐2012
This investment in IAH has continued since the merger of Continental and United. As demonstrated in Exhibit 6, since the close of the merger, United has added 12 new non‐stop routes from IAH, more than at any other United hub.
Exhibit 6: New Non‐Stop Routes Added Since October 2010 from United Hubs
As a result of its rapidly expanding service at IAH, United’s overall capacity in terms of seats at IAH has grown sharply. In fact, United has added half as many seats at IAH since the merger as the proposed
121
25
183
41
0
50
100
150
200
Bush Intercontinental Hobby
1996 2012
+ 62 Destinations
Total Destinations Served
497
182
658
153
0
200
400
600
800
Bush Intercontinental Hobby1996 2012
Average Daily Departures
+ 161 Departures
Based on OAG data, calendar 1996 compared to TME July 2012
Note: Data based on OAG for Oct 2009-Sept 2010 vs. Oct 2010-2012, as of April 2012.
12
9 98
7
5
32
Houston San Francisco Washington D.C. Newark ‐Liberty
Los Angeles Denver Chicago Cleveland

The Econo
plan callspassengedestinatiocities in te(then ConATL, and measure,
MoreoverAirlines jopportunchoices.” and thereBritish AiAviancaTa
11 United hfrom Hobbapproach omillion of assumptio12 “Frontie16, 2012.
omic Impact o
s for Southwrs also benefons made avaerms of seatsntinental) havCharlotte (Conly one (Ch
Exhibit
r, United’s grust announcities that Bu12 As illustrate is strong coirways, Emiraaca, VivaAero
has added 1,90by, assuming of job creationoutput to thns are wrong,
r Airlines to Sh
of Dividing In
est to add ait local Houstailable to Hous per local pasve vaulted HoLT). It is imicago) has sp
7: Departing
rowth at IAHced a decisioush Intercontted by Frontiempetition amates, KLM Robus, United,
08 daily seats 143 seats pern and output ashe growth of United does n
hift Houston O
ternational A
as part of thton passengeuston residentssenger. Sincouston from nportant to nolit internation
g Seats per Lo
H has benefiton to move tinental offeer’s move, themong the sixteoyal Dutch AAir Canada, A
while the HASr departure, wssociated withUnited’s opeot make such c
perations Back
Air Service bet
11
e Proposal.11
rs because ofts. As Exhibite 1996, the inninth on this lote that, of tnal gateways
ocal Passenge
ted all of thefrom Hobbrs will proviere is ample ceen carriers sAirlines, LuftAlaska Airline
S Hobby Study would add 3,2h additional fligrations at IAHclaims.
k to Bush Inter
tween Housto
1 The seats f the many adt 7 shows, Honvestment anlist to its currthe top 10 la.
er (Top 40 Cit
e airlines thay to IAH beide our passcapacity at IAserving the athansa, Qataes, Delta, Ame
forecasts that289 daily seatghts, then one H since the m
rcontinental in
on Airports
added to sudditional flighouston ranks nd focus by thrent position,argest air ser
ties in the U
at serve IAH.ecause “the sengers withAH to accommirport: AeroMr Airways, Serican, and US
t 23 daily interts. If one subwould assign merger; howe
July,” Frontier
upport conneht frequenciefourth amonhe City and U behind only rvice cities b
.S.)
. In fact, Frogreat conne additional modate new fMexico, Air FrSingapore AirSAirways.
rnational depabscribes to th5,000 jobs andever, because
r Press Release
ecting es and g U.S. United DFW, y this
ontier ection travel flying, rance, rlines,
artures e HAS d $800 those
e, April
The Economic Impact of Dividing International Air Service between Houston Airports
12
United made its network decisions on the assumption that IAH would continue as Houston’s sole international gateway airport. If the City fosters dilution of connecting traffic, it will change the assumptions on which United made its investments and placed its assets. For example, United has plans to add additional services, including service to Auckland, New Zealand (AKL), scheduled to begin with the delivery of the Boeing 787 Dreamliners. However, a decision to degrade the network benefits at IAH by dividing international flow traffic will make markets such as these, which are heavily dependent on connecting traffic, no longer viable. Given the thin operating margins that characterize today’s airline industry (discussed below), United will have little choice but to respond to those changed circumstances by re‐allocating its limited resources to hubs where they will generate a better return.
b) BecauseLargeNetworkCarriersSuchasUnitedOperateonVeryThinProfitMargins,EvenSmallChangesinTrafficCanQuicklyUnderminetheEconomicsofaHub
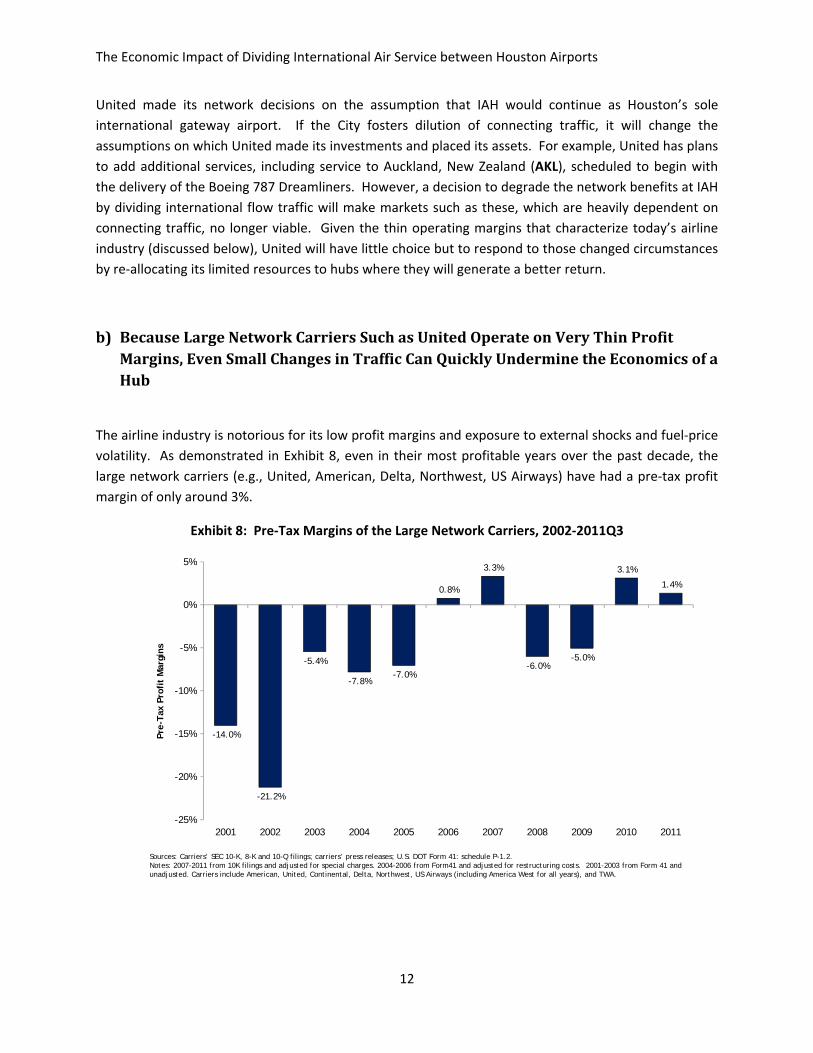
The airline industry is notorious for its low profit margins and exposure to external shocks and fuel‐price volatility. As demonstrated in Exhibit 8, even in their most profitable years over the past decade, the large network carriers (e.g., United, American, Delta, Northwest, US Airways) have had a pre‐tax profit margin of only around 3%.
Exhibit 8: Pre‐Tax Margins of the Large Network Carriers, 2002‐2011Q3
Sources: Carriers’ SEC 10-K, 8-K and 10-Q filings; carriers’ press releases; U.S. DOT Form 41: schedule P-1.2.Notes: 2007-2011 from 10K filings and adjusted for special charges. 2004-2006 from Form41 and adjusted for restructuring costs. 2001-2003 from Form 41 and unadjusted. Carriers include American, United, Continental, Delta, Northwest, US Airways (including America West for all years), and TWA.
-14.0%
-21.2%
-5.4%
-7.8%-7.0%
0.8%
3.3%
-6.0%-5.0%
3.1%
1.4%
-25%
-20%
-15%
-10%
-5%
0%
5%
2001 2002 2003 2004 2005 2006 2007 2008 2009 2010 2011
Pre-
Tax
Prof
it M
argi
ns
The Econo
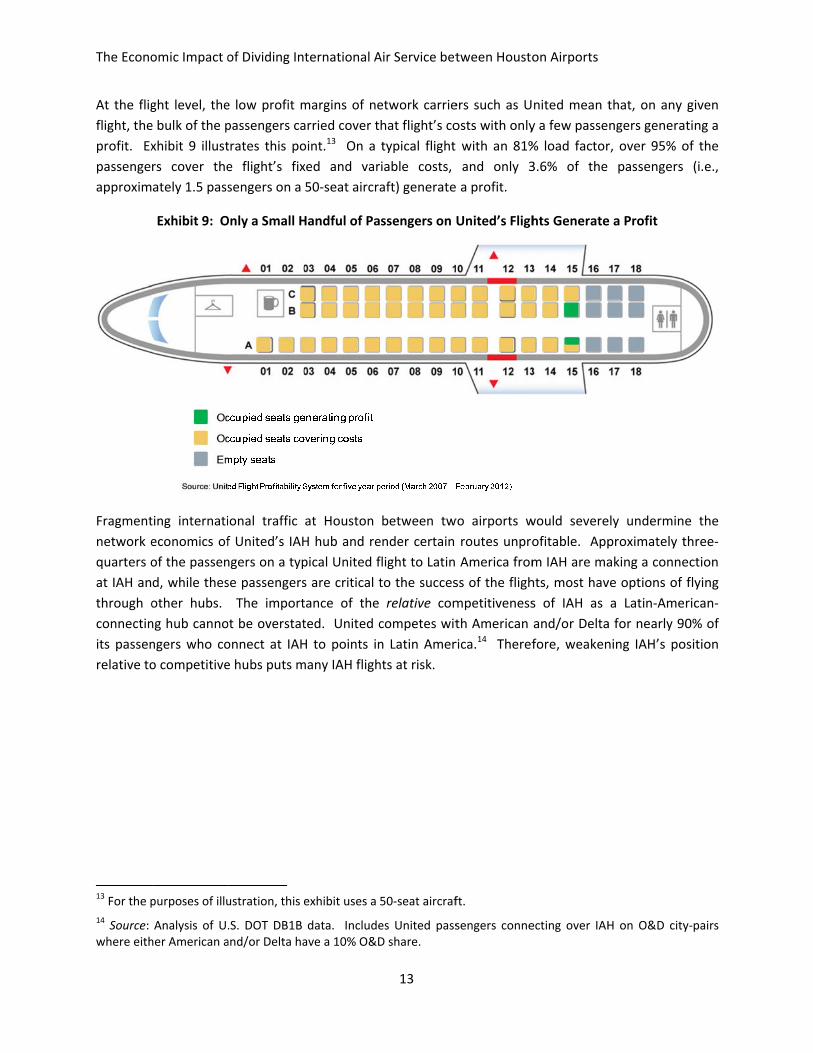
At the fligflight, theprofit. Expassengeapproxim
Fragmentnetwork equarters oat IAH anthrough oconnectinits passenrelative to
13 For the p14 Source: where eith
omic Impact o
ght level, thee bulk of the pxhibit 9 illustrs cover theately 1.5 pass
Exhibit 9: O
ting internatieconomics ofof the passend, while thesother hubs. ng hub cannongers who coo competitive
purposes of illu
Analysis of U.her American a
of Dividing In
e low profit mpassengers catrates this poe flight’s fixsengers on a
Only a Small H
ional traffic f United’s IAHngers on a typse passengers The import
ot be overstatonnect at IAHe hubs puts m
ustration, this e
.S. DOT DB1B and/or Delta ha
ternational A
margins of nearried cover toint.13 On a xed and var50‐seat aircra
Handful of Pa
at Houston H hub and repical United fs are critical ttance of the ted. United cH to points inmany IAH fligh
exhibit uses a
data. Includeave a 10% O&D
Air Service bet
13
etwork carriehat flight’s cotypical flight iable costs, aft) generate
ssengers on U
between twender certain flight to Latinto the succesrelative com
competes witn Latin Amerhts at risk.
50‐seat aircraf
es United passD share.
tween Housto
ers such as Uosts with onlywith an 81%and only 3 a profit.
United’s Fligh
wo airports wroutes unpro America fromss of the flighmpetitivenessth American rica.14 Theref
ft.
sengers conne
on Airports
nited mean ty a few passe% load factor3.6% of the
hts Generate
would severeofitable. Appm IAH are mahts, most havs of IAH as and/or Deltafore, weaken
ecting over IAH
that, on any ngers generar, over 95% opassengers
e a Profit
ely underminproximately taking a conneve options of a Latin‐Amea for nearly 9ning IAH’s po
H on O&D city
given ting a of the (i.e.,
e the three‐ection flying rican‐0% of osition
y‐pairs

The Econo
Because o11) if intemarket st
Exhibit
As a resulshort‐hau
omic Impact o
Exhibit 10: C
of these realiternational seimulation ana
t 11: A Degra
t of the Propul and long‐h
of Dividing In
Composition
ties, as discurvice were oalysis using th
adation of Un
osal, United waul destinati
ternational A
of Passenger
ssed above, Uoffered at Hohe same meth
nited’s IAH HuGrowth
would have tons in the U
Air Service bet
14
rs on Typical
United wouldbby. This reshods and dat
ub Will Forceh Opportunit
o pull down cU.S., Latin Am
tween Housto
United IAH fl
d be forced tosponse is basa that United
e United to Puties
current flightmerica, and a
on Airports
light to Latin
o cut service sed on United relies on for
ull Down Serv
s and cancel around the w
America
at IAH (see Ed’s own pricr all of its plan
vice and Fore
planned servworld. There
Exhibit e and nning.
ego
vice to e is a

The Economic Impact of Dividing International Air Service between Houston Airports
15
segment of United’s operation at IAH that is not profitable today. United operates this flying relying on future growth improving the performance of the non‐profitable routes. If international service were permitted at Hobby, however, some of the future growth would not occur and, as a result, United would cut unprofitable flying in its schedule. This would result in a reduction of about 6% of United’s current capacity at IAH. As demonstrated by Exhibit 11 above, reductions would occur to several cities, including Charlotte, Detroit, San Jose (CA) and Louisville, as well as to various Mexican destinations, including Mazatlan. Additionally, new service that is currently planned would not occur because the reduction in connecting passengers would make this flying unprofitable from IAH. This includes the previously announced service to AKL and other planned service to South America, Europe, and Asia, along with a host of new domestic markets. In addition, as a result of the Proposal, United would not commence China service out of IAH. Overall, it is expected that total United IAH capacity ultimately would be 10% lower than had been planned.
How does Southwest’s addition of AirTran flights from Hobby to Mexico impact United’s ability to offer service out of IAH to places like AKL? The answer is best illustrated with an example. Today, United’s Baltimore (BWI) to IAH flights each carry almost two passengers to Mexico City (MEX) per flight; in the future, but for the Proposal, those flights also would carry passengers connecting at IAH to AKL. As a result of the Proposal, assume that some of those BWI‐IAH‐MEX passengers would fly over Hobby instead. Further assume for argument’s sake that the BWI‐IAH flight is one of the segments of United’s IAH operation that is not profitable today. If enough MEX passengers leave the BWI‐IAH flights, United would need to reduce service on that route. The same logic would apply to a variety of other similar routes, which in turn would reduce the passenger flow over IAH needed to make IAH‐to‐AKL service profitable. In sum, if even a small handful of passengers are drawn away from United’s IAH‐based services, the flow generated by those passengers is lost. This undermines the economic viability not only of the particular routes on which they flew (e.g., BWI‐IAH and IAH‐MEX), but also that of a multitude of other current and planned routes (e.g., IAH‐AKL) that rely upon critical feed traffic from the very same flights that would need to be eliminated.
Because of IAH’s stature as United’s pre‐eminent hub, United offers services and has made investments at IAH far beyond what the City can support solely based on local (i.e., Houston) traffic. Moreover, to the benefit of Houston’s residents and businesses, United has increased its commitment to Houston since its merger with Continental by adding more service at IAH than at any of its other hubs, and this has contributed to United’s employment levels in Houston reaching pre‐merger levels.
United now employs nearly 17,000 Houston and surrounding‐area residents, close to the same number it employed before the merger. The overwhelming majority of these are long‐time employees with established ties to the Houston community. The reduction in capacity that would result from Mr. Diaz’s recommendation would stop that upward trend and, between lost current flying and lost future growth, would displace more than 1,300 United and United Express partner employees at IAH. United would try to find jobs for these displaced employees at its other hubs. These are not actions United wants to take, but are actions the City would force it to take if it were to divide Houston’s international air service.

The Economic Impact of Dividing International Air Service between Houston Airports
16
3) TheHASHobbyStudySuffersFromNumerousAnalyticalFlawsandIncorrectAssumptionsThatRenderItsConclusionsInvalid
a) The“ProjectedFares”intheHASHobbyStudy—AKeyDeterminantofthePurportedStimulationofTrafficBecauseofthe“SouthwestEffect”—AreUnrealisticallyLow
The HAS Hobby Study’s analysis of fares is critically flawed and inconsistent with the HAS Hobby Study’s own data. Because the projected fare reductions play a pivotal role in the “stimulated demand” that drives the HAS Hobby Study’s purported economic benefits, the flaws in the analysis serve to undermine the reliability of the entire study’s key findings.
The centerpiece of the HAS Hobby Study’s fare analysis is its Exhibit 18, which purports to find a percentage “Decrease in Fare” of as much as 83% on certain hypothetical markets as a result of Southwest’s international entry at Hobby. As described in detail below, not only does the HAS Hobby Study dramatically overstate the level of existing fares at IAH relevant to this analysis, it vastly understates the projected fares on the hypothetical routes that Southwest might enter from Hobby. The net result of these two compounding errors are projected “fare reductions” that have no basis in reality. Not only are they dramatically overstated and wholly unreliable as the basis for making an informed policy decision, they are also internally inconsistent with the HAS Hobby Study’s own analysis.
Southwest’s“ProjectedFares”AreVastlyUnderstated
A critical flaw in the HAS Hobby Study’s fare analysis is that Southwest’s “projected fares” (HAS Hobby Study Exhibit 18) are vastly understated. Although the HAS Hobby Study claims that “Southwest’s domestic market pricing was used as a proxy for its pricing of new international services,”15 the projected fares are so low that they should raise concerns regarding the credibility of the entire HAS Hobby Study. In fact, they appear to be inconsistent with the HAS Hobby Study’s own model. To begin with, when one applies the yield equation in Exhibit 1‐6 of the HAS Hobby Study (which is purportedly based on all of Southwest’s domestic routes) to the distance of each of the 11 routes in HAS Hobby Study Exhibit 18, it results in fares that are—on average—30% higher than the “projected fares” in Exhibit 18.16 Moreover, when the yield curve methodology from HAS Hobby Study Exhibit 1‐6 is estimated using Southwest’s domestic local Houston fares (as it should be because of differences in local
15 See HAS Hobby Study, Page 27. 16 For example, applying Houston‐Bogota’s distance (2,203 miles) to the yield equation in Exhibit 1‐6 yields a fare of $178, not the $133 fare in Exhibit 18. Put differently, the “projected fares” in the HAS Hobby Study are internally inconsistent with Exhibit 1‐6.

The Economic Impact of Dividing International Air Service between Houston Airports
17
economies) and then applied to the same 11 routes, the resulting fares are, on average, nearly 60% higher than those projected in Exhibit 18 of the HAS Hobby Study. Moreover, the “projected fares” in the HAS Hobby Study are understated by even more than this would suggest because of a wide array of additional costs that are incurred by airlines on international routes, leading to international fares that are relatively higher than domestic fares on average.17
Exhibit 12: Even Ignoring Additional Costs of Providing International Services, the Fare Projections Based on Southwest Hobby Fares are, on Average, Approximately 60% Higher
than the HAS Hobby Study’s Projections
TheCurrentIAHFaresRelevanttotheHASHobbyStudyareVastlyOverstated
In addition to vastly understated projected fares, the HAS Hobby Study has also overstated current actual fares at IAH. As a threshold matter, a simple comparison of average fares between IAH and even reliably derived “projected fares” for Southwest from Hobby would not be meaningful for several reasons. First, unlike Southwest, the primary carriers currently offering service on the 11 routes in HAS Hobby Study Exhibit 18 offer both First Class and Economy seating (and Economy Plus in the case of
17 Among other costs incurred by international flights are: air navigation charges; labor and infrastructure costs associated with maintaining foreign air service (including regulatory and legal staff); additional slot acquisition and maintenance costs in many cases; increased related direct labor cost (including hotels, security, per diem); increased overhead associated with international gates; the need for language‐qualified airport and inflight staff, ticket offices and distribution in foreign countries; and visas, work permits, and associated costs for labor.
Source: “The Economic Impact of International Commercial Air Service at William P. Hobby Airport,”GRA/InterVISTAS; US DOT O&D survey FYE 2011Q3.
Notes: Projections based on estimated regression equation in GRA/InterVISTAS Exhibit 1-6 applied to Southwest nonstop O&D fares from Hobby airport for FYE2011Q3 adjusted for fees and taxes.
133
108
134
108122
10693
110123
113 117
220
167
221
168
197
164
139
172
200
178186
0
50
100
150
200
250
Bogota,Colombia
Cancun,Mexico
Caracas,Venezuela
Guadalajara,Mexico
Liberia,Costa Rica
Mexico City,Mexico
Monterrey,Mexico
PuertoVallarta,Mexico
San Jose,Costa Rica
San Jose DelCabo, Mexico
San Salvador,El Salvador
Proj
ecte
d O
ne-W
ay B
ase
Fare
($)
HAS Study Projections Based on Southwest Yields at Hobby

The Economic Impact of Dividing International Air Service between Houston Airports
18
United).18 Because First‐Class passengers choose to pay for a higher level of service (and flexibility) than Economy passengers, the inclusion of those passengers drives the average IAH fares upwards.
The second, equally important, reason that a simple comparison of average fares can be highly misleading is because frequent business travelers have travel patterns that can result in their paying higher fares than those paid by non‐business travelers, as business travelers are likely to be attracted to IAH’s more convenient schedule of flights and greater flight frequency, the availability of First Class and Economy Plus, the availability of airport lounges, and United’s expansive frequent flyer program. As a result, it is reasonable to expect that a greater proportion of business passengers, who tend to purchase their tickets much closer to their date of travel and also tend to purchase more flexible (and thus more expensive) tickets than leisure travelers, will choose to fly out of IAH rather than Hobby. Differences in the “mix” of passengers alone can result in average fares that are substantially higher at one airport versus another (or, alternatively, across two different routes) even if the fares being charged to sub‐groups of passengers are the same.19
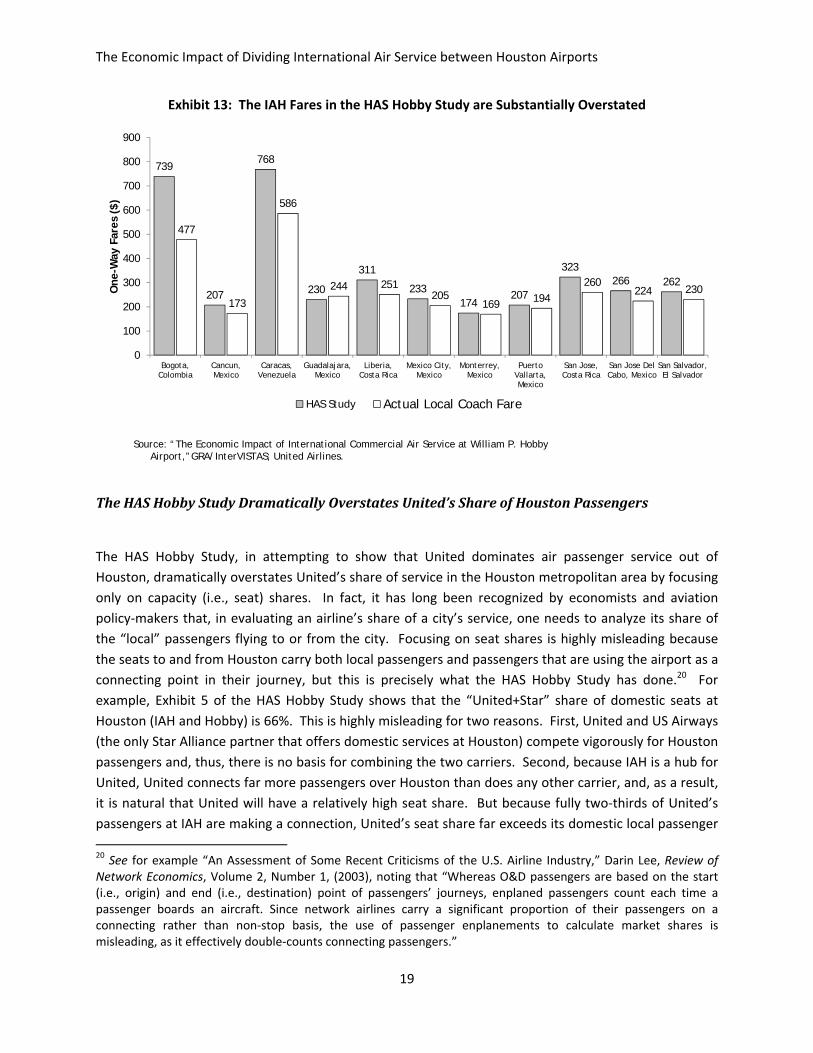
Turning now to the HAS Hobby Study’s flawed fare analysis, consider the average base fares presented in Exhibit 18 of the HAS Hobby Study report, which are average fares for all passenger classes from IAH for the 11 Latin American routes the HAS Hobby Study claims Southwest might enter from Hobby. As discussed above, because Southwest offers only Economy class service, the IAH fares are significantly overstated for the purposes of the HAS Hobby Study’s fare comparisons because they include all fare classes. Further, the fares are biased upwards since the fares are based on Global Distribution System (GDS) fares and, therefore, exclude many fares purchased directly from the airline or through other channels (i.e., consolidators) which tend to be lower fares. Exhibit 13 below demonstrates that, when fares are calculated using only passengers limited to United’s Economy cabin (including Economy Plus), the average IAH fares are substantially lower. In the case of Bogota (a thriving business destination), excluding First Class fares reduces the average fare by $260. On average, the HAS Hobby Study overstates the relevant IAH fares by an average of 18.5%.
18 The exception is VivaAerobus, which serves Monterrey, Mexico, but only offers Coach Class Seating. 19 For example, consider two routes (A and B) with different mixes of business and leisure passengers. On Route A 25% of passengers are “business” passengers, while on Route B the proportion of business passengers is 50%. Further, Route A has an average business fare of $1,000 and an average leisure fare of $250, while Route B has a business fare of $800 and a leisure fare of $200. Even though Route A has higher fares for both types of passengers, the average fare on the route ($438) is lower than the average fare on Route B ($500), because Route A has a lower mix of business passengers. Hence, if one were only to examine average fares, one would erroneously conclude that the fares were higher on Route B (the route with a higher business mix) despite the fact that both the business and leisure fares were in fact lower than on Route A.
The Economic Impact of Dividing International Air Service between Houston Airports
19
Exhibit 13: The IAH Fares in the HAS Hobby Study are Substantially Overstated
TheHASHobbyStudyDramaticallyOverstatesUnited’sShareofHoustonPassengers
The HAS Hobby Study, in attempting to show that United dominates air passenger service out of Houston, dramatically overstates United’s share of service in the Houston metropolitan area by focusing only on capacity (i.e., seat) shares. In fact, it has long been recognized by economists and aviation policy‐makers that, in evaluating an airline’s share of a city’s service, one needs to analyze its share of the “local” passengers flying to or from the city. Focusing on seat shares is highly misleading because the seats to and from Houston carry both local passengers and passengers that are using the airport as a connecting point in their journey, but this is precisely what the HAS Hobby Study has done.20 For example, Exhibit 5 of the HAS Hobby Study shows that the “United+Star” share of domestic seats at Houston (IAH and Hobby) is 66%. This is highly misleading for two reasons. First, United and US Airways (the only Star Alliance partner that offers domestic services at Houston) compete vigorously for Houston passengers and, thus, there is no basis for combining the two carriers. Second, because IAH is a hub for United, United connects far more passengers over Houston than does any other carrier, and, as a result, it is natural that United will have a relatively high seat share. But because fully two‐thirds of United’s passengers at IAH are making a connection, United’s seat share far exceeds its domestic local passenger 20 See for example “An Assessment of Some Recent Criticisms of the U.S. Airline Industry,” Darin Lee, Review of Network Economics, Volume 2, Number 1, (2003), noting that “Whereas O&D passengers are based on the start (i.e., origin) and end (i.e., destination) point of passengers’ journeys, enplaned passengers count each time a passenger boards an aircraft. Since network airlines carry a significant proportion of their passengers on a connecting rather than non‐stop basis, the use of passenger enplanements to calculate market shares is misleading, as it effectively double‐counts connecting passengers.”
Source: “The Economic Impact of International Commercial Air Service at William P. Hobby Airport,”GRA/InterVISTAS; United Airlines.
739
207
768
230
311
233174
207
323266 262
477
173
586
244 251205
169 194260
224 230
0
100
200
300
400
500
600
700
800
900
Bogota,Colombia
Cancun,Mexico
Caracas,Venezuela
Guadalajara,Mexico
Liberia,Costa Rica
Mexico City,Mexico
Monterrey,Mexico
PuertoVallarta,Mexico
San Jose,Costa Rica
San Jose DelCabo, Mexico
San Salvador,El Salvador
One
-Way
Far
es (
$)
HAS Study Actual Local Coach Fare

The Economic Impact of Dividing International Air Service between Houston Airports
20
share. Thus, in contrast to Exhibit 5 in the HAS Hobby Study, United’s share of domestic local passengers in Houston is 48% while Southwest’s share of the local Houston passengers is 31%.21 Finally, it is important to emphasize that the HAS Hobby Study’s inference that high airport shares (as a result of a carrier operating a large connecting hub) at an airport are detrimental to a city’s economic development flies in the face of a myriad of economic impact studies that have shown the power that hubs have to positively affect a city’s level of employment and economic activity.22
BesidesBeingBasedonFaultyData,theOverallFareChangeandTrafficStimulationEstimatedbytheHASHobbyStudyAlsoContradicttheRecentHistoryofSouthwestMarketEntry
An examination of the routes that Southwest has entered since 2006 shows that the huge stimulation and fare decreases that the HAS Hobby Study assumes for the new routes are completely out of line with what actually occurs when Southwest enters a market. Exhibit 14 shows that historically markets grew on average by 10% after Southwest’s entry and fares actually increased slightly (4%). This is in stark contrast to the HAS Hobby Study’s assumptions of a market growth of 180% — a growth rate 18 times higher than that evidenced by the most recent history — and a 55% decline in average fares.23 Simply put, the HAS Hobby Study forecasts a change in price and traffic that is completely inconsistent with what actually occurs when Southwest enters a market.
21 Source: U.S. DOT DB1B, full year ending 2011Q3. 22 See for example “Airline Traffic and Urban Economic Development,” Jan K. Brueckner, Urban Studies, Volume 40, No. 8, pp. 1455‐1469 (2003), which concluded that, “The evidence confirms the common view that good airline service is an important factor in urban economic development. Frequent service to a variety of destinations, reflected in a high level of passenger enplanements, facilitates easy face‐to‐face contact with businesses in other cities, attracting new firms to the metro area and stimulating employment at established enterprises. The empirical results show that a 10 percent increase in passenger enplanements in a metro area leads approximately to a 1 percent increase in employment in service‐related industries.” See also “The Economic Impact of the Cincinnati/Northern Kentucky International Airport on Greater Cincinnati, May 2005,” which noted that, “The location of a major airline hub at the Airport gives the region a higher level of service than it would otherwise have, and research has shown that the presence of such a hub increases an area’s high‐tech job growth,” (page 4). 23 The 180% is an estimate made by United of the stimulation rates used in the HAS Hobby Study (the actual rates were not provided). The 180% is derived using a) the local passengers onboard the Southwest flights, as stated by the HAS Hobby Study; b) seat share of the local market, as a proxy for the QSI share used by the HAS Hobby Study (but not provided); and c) existing local market sizes as estimated by United.

The Economic Impact of Dividing International Air Service between Houston Airports
21
Exhibit 14: Traffic and Fare Changes Proposed in the HAS Hobby Study are Inconsistent with Observed Results
Moreover, an analysis of Southwest’s fare trends since the U.S. DOT’s 1993 “Southwest Effect” study (which Mr. Diaz’s letter to the Mayor cites for support) was released, shows quite a different picture than the one painted by Mr. Diaz. 24 As demonstrated in Exhibit 15, since 1993, Southwest’s domestic yields have increased approximately six times faster than that of the legacy carriers.25
24 Bennett, Randall D. and James M. Craun. "The Airline Deregulation Evolution Continues: The Southwest Effect". Office of Aviation Analysis, U.S. Department of Transportation, May 1993. 25 Similarly, a recent study found that Southwest’s fare quotes for last‐minute bookings tend to be higher than the lowest fare quotes available on Orbitz for similar flights. See Bilotkach, Volodymyr, “Reputation, Search Cost, and Airfares,” Journal of Air Transport Management 16 (2010) pp. 251–257.
10%
181%
4%
(55%)
(100%)
(50%)
‐
50%
100%
150%
200%
Historical Southwest Entry HAS Study
Southwest Average Historical Stimulation vs HAS Study ForecastWN 2006‐2011 DOT Data (Traffic/Fare 4QE 2011Q3 versus Pre‐WN Entry)
Market Size Fare
.

The Economic Impact of Dividing International Air Service between Houston Airports
22
Exhibit 15: % Change in Domestic Yield vs. 1993 for Southwest and Legacy Carriers
b) TheHASHobbyStudyAssumptionsRegardingtheStateofAirlineCompetitionatHoustonandCurrentHoustonFaresareUnfounded
The HAS Hobby Study is premised—at least in part—on flawed and demonstrably incorrect assumptions regarding the state of airline competition and the level of fares in Houston. For example, the HAS Hobby Study points to a study purporting to show that the Metropolitan Houston area has the highest fares in the country and one of the highest “fare premiums” in the country.26 The HAS Hobby Study attempts to attribute these high average fares and fare premiums to United’s “dominance” at IAH.27 A closer examination of the data, however—which the HAS Hobby Study failed to conduct—clearly shows that Houston’s higher‐than‐average fares are simply the result of a strong local economy in the Houston metropolitan area and not, as the HAS Hobby Study alludes, a result of airport “dominance.” Airline demand and hence prices are strongly influenced by the level of economic activity, and Houston has enjoyed a strong local economy over the past several years, especially compared to the broader U.S. economy. Indeed, this is consistent with the point Mr. Diaz made at the April 16 City Council hearings that the strong Houston economy helps to stimulate new traffic.
One simple way to establish that local economic conditions—and not market power—are the cause of Houston having average fares higher than the national average is to compare Southwest’s average fares from Hobby to its fares from the remainder of its domestic system. As demonstrated by Exhibit 16, 26 See HAS Hobby Study, footnote 12. 27 As discussed above, the HAS Hobby Study’s erroneously relies on seat (rather than local passenger shares) in support of its incorrect assertion that United is “dominant” in Houston.
(20%)
(10%)
0%
10%
20%
30%
40%
50%
60%
70%19
93
1994
1995
1996
1997
1998
1999
2000
2001
2002
2003
2004
2005
2006
2007
2008
2009
2010
2011
Legacy Southwest
Southwest enters PHL
Fuel hedges begin to expire
“Southwest Effect” report released
66% increase for Southwest
11% increase for legacy carriers

The Economic Impact of Dividing International Air Service between Houston Airports
23
Southwest also has benefited from the vibrant Houston economy, with its average non‐stop fares from Houston‐Hobby exceeding those from the remainder of Southwest’s domestic system in every distance band by a wide margin.28
Exhibit 16: Southwest Airlines Average One‐Way Fares, Houston vs. Remainder of System
Simply put, the HAS Hobby Study contention that Houston suffers from “high” fares because of any alleged dominance by United is simply without basis.
c) TheHASHobbyStudy’sAnalysisofPassengerStimulationResultingfromLowerFaresSuffersfromNumerousFundamentalFlaws
The United Study does not dispute the underlying methodology that was used as part of the HAS Hobby Study to estimate the level of passenger traffic. Indeed, much of United’s own planning is based on
28 As discussed in detail below, the HAS Hobby Study ignores entirely differences in fares based on local economic conditions in its own analysis when constructing its “projected fares” for Southwest, which are purportedly based on Southwest’s average domestic fares. As discussed earlier, even this analysis suffers from serious errors. Likewise, the HAS Hobby Study attempts to draw a link between the level of competition and fares at Houston and Chicago by purporting to show that fares from Chicago are lower than fares from Houston to select destinations. However, Southwest’s fares are also higher for Houston passengers than for Chicago passengers and this is true at every distance band.
Sources: U.S. DOT O&D Survey. FYE 2011Q3.Notes: Fares are one way. Other are non-stop O&Ds that do not include Houston. Average non-stop distance (each way)
for Houston is 660 miles versus 719 miles for non-Houston O&Ds.
145 147
201190
212
174
128 132
161 157
193
154
0
50
100
150
200
250
<250 250 - 500 500 - 750 750 - 1000 > 1000 All
Sout
hwes
t Non
-Sto
p Fa
res (
$), F
YE20
11Q
3
Miles
Houston Other

The Economic Impact of Dividing International Air Service between Houston Airports
24
variations of a QSI model. The United Study’s disagreement with the HAS Hobby Study lies in the underlying data and assumptions that the HAS Hobby Study uses as inputs to its model. Because the HAS Hobby Study relies on a series of fundamentally flawed inputs and assumptions, its results are unreliable and should not be used as the basis for a critical decision about the future of Houston’s aviation policy, especially given the significance of Houston’s air service to the city’s overall economy.
To demonstrate this, the United Study will review the impact of the hypothesized schedule of international services at Hobby that the HAS Hobby Study outlines, without accepting that such hypothetical schedule would be viable. Indeed, as is demonstrated below, the projected fare levels that have been applied to the hypothetical schedule would generate substantial losses for Southwest (or any carrier flying the proposed schedule).
InternationalServiceatHobbyWillNotStimulateTrafficasClaimedbytheHASHobbyStudy
Mr. Diaz claims that international service at Hobby would generate an additional 1.5 million passengers traveling to, from and through Houston each year. The facts indicate that the proposed Hobby international service would stimulate far less traffic than that claimed in the HAS Hobby Study, and that ultimately it would lead to less capacity and traffic in Houston overall.
The economic benefits of launching international service are the greatest when the service represents new (i.e., first time) non‐stop service between two cities, such as, for example, United’s planned new service between Houston and AKL, and United’s recently launched service between Houston and Lagos, Nigeria (LOS).29 However, as demonstrated in Exhibit 17, all of the assumed Southwest‐served international routes in the HAS Hobby Study already enjoy non‐stop service, some multiple times per day.
29 A variety of studies have estimated that each new non‐stop international flight generates millions of dollars in annual economic benefits to the United States. For example, a study conducted for the DFW found that a flight from DFW to Beijing would generate $180 million per year for the state of Texas (see “DFW International Airport Releases New Economic Impact Assessment of Proposed American Airlines DFW‐Beijing Route," Public Relations Department, Dallas/Fort Worth International Airport (Sept. 20, 2006). Similarly, a study conducted for DEN estimated that a single new international flight to Asia was worth at least $142 million to the Denver local economy annually (see "Economic Impact of International Flights on Denver's Economy," http://www.metrodenver.org/files/documents/transportation‐infrastructure/air/Air_IntlFlight_EconomicImpact.pdf). InterVISTAS has also previously recognized the value of new international service, noting that “nonstop international services can often cause international traffic to double in only a year, even for city‐pairs that already have a profusion of one‐stop connecting services. Any mechanism that allows international services to proliferate to non‐traditional gateways can be a powerful stimulus to traffic,” InterVISTAS‐ga2 “The Economic Impact of Air Service Liberalization,” p. ES‐8.

The Economic Impact of Dividing International Air Service between Houston Airports
25
Exhibit 17: Existing Non‐Stop Service on HAS Hobby Study Southwest Routes from Hobby
The HAS Hobby Study erroneously concludes that Southwest or another LCC entering these routes would result in increased traffic at IAH.30 This conclusion, however, is based on the erroneous assumption that United would lower fares (while keeping capacity fixed) to such an extent at IAH in response to Southwest’s entry that it would actually fly more passengers, thus capturing some of the demand (both local and flow) resulting from lower fares.31 In essence, the HAS Hobby Study argues that IAH, on net, would benefit from a smaller share of a much larger pie.32 There are several flaws in this analysis.
First, as discussed above, there is a segment of United’s operation at IAH that is unprofitable today and that United operates in reliance on future growth improving performance. International service at Hobby would limit some of that future growth and lead to United cutting unprofitable flying out of IAH.
Second, the HAS Hobby Study also argues that dividing international traffic within a metropolitan area poses no risk to the growth of that metropolitan area as an international hub by simply asserting, with no supporting empirical analysis, that other metropolitan areas like New York, Los Angeles, Chicago, Miami/Ft. Lauderdale, Washington/Baltimore, and the San Francisco Bay Area have multiple international airports, and that this has “successfully lowered fares and grown the air travel market.”33 As demonstrated by Exhibit 18, however, metropolitan areas with multiple airports providing
30 HAS Hobby Study, Exhibit 16. 31 It is interesting to note that in a previous InterVISTAS study, it was shown that in at least one case (the effect of the Open Skies Agreement on New Zealand air service), opening up markets to LCC competition came, at least partially, at the expense of the major carriers. InterVISTAS‐ga2 “The Economic Impact of Air Service Liberalization,” figure III‐14 p. 50. 32 HAS Hobby Study, Exhibit 1‐14. 33 HAS Hobby Study, page 2.
Source: OAG, FYE2012Q2.
Average Daily Roundtrip Departures
Average Daily Roundtrip Departures
Bogota, Colombia United 2.0Cancun, Mexico United 5.3Caracas, Venezuela United 1.0Guadalajara, Mexico United 5.6Liberia, Costa Rica United 1.5Mexico City, Mexico United 8.1 Aeromexico 3.0Monterrey, Mexico United 8.1 VivaAerobus 0.5Puerto Vallarta, Mexico United 1.7San Jose, Costa Rica United 3.2San Jose Del Cabo, Mexico United 2.3San Salvador, El Salvador United 2.0 Taca Int'l Airlines 1.0
The Economic Impact of Dividing International Air Service between Houston Airports
26
international service have seen virtually no growth in international capacity over the past five years, as compared to more than 6% growth for unified international gateways overall and nearly 8% for IAH.
Exhibit 18: Five‐Year Percentage Change in International Seats34
The U.S. experience has been mirrored in Europe, where certain metropolitan areas (i.e., London, Paris, and Milan) also have divided their services between airports. As demonstrated by Exhibit 19, divided gateway hubs in Western Europe have shrunk over the past five years, while unified gateway hubs have grown.
34 CLT, IAH, DFW and ATL represent the four largest domestic hubs measured by seats per local passengers. See Exhibit 7 above.
Source: OAG weekly seats for FY 2007-July 2012
28.4%
7.8% 6.4% 5.8% 0.2%
‐0.1%
CLT IAH Unifiedgateway
DFW ATL Dividedgateway
BWI+DCA+IADEWR+JFK+LGA+HPNFLL+MIALAX+ONT+SNAMDW+ORDSFO+SJC+OAK

The Economic Impact of Dividing International Air Service between Houston Airports
27
Exhibit 19: Five‐Year Percentage Change in Seats at Major Western European Hubs
The HAS Hobby Study’s incorrect assertion that divided international service poses no threat to international growth appears, in large part, to be based on a flawed and overly simplistic observation of events at Chicago ORD following the entry of Mexican LCCs at Chicago‐Midway (MDW). The HAS Hobby Study asserts that, “The entry of the Mexican carriers at MDW has caused American and United to increase their ORD departures by 29% and 46%, respectively, in March 2012 over March 2010.”35 However, an analysis of the data reveals that the increase at ORD by American and United was caused by the carriers’ back‐filling the capacity void left by the bankruptcy and subsequent exit of Mexicana, the largest Mexican carrier to the U.S.
35 HAS Hobby Study, Page 18, emphasis added.
4.9%
4.0%
2.8%2.3%
1.0% 0.6%
‐0.4%
MUC ZRH FCO Unifiedgateway
FRA AMS Dividedgateway
Source: OAG weekly seats for FY 2006-2011 CDG+ORYLHR+LGW+LTN+STN+LCYLIN+MXP

The Econo
Exhibit
Similarly, clearly thcomes atfollowing reduced cdestinatio
Exh
Third, theas a resu
%C
omic Impact o
20: United
an analysis oat internatiot the expensJetBlue’s grocapacity on thons served by
hibit 21: 200
e HAS Hobby ult of LCC en
Source:
% Change
of Dividing In
and Americ
of the data fnal expansioe of incumbowth into Lathe overlappiny JetBlue from
06 vs. 2011 C
Study also grntry in its de
844,819
2006
OAG weekly sea
ternational A
can Latin Am
from other ann by LCCs dobent carrier ctin American ng routes, anm JFK actually
Change in O
rossly mischaescription of
267,850
Jet Blue
ats for FY 2006-20
197%
Air Service bet
28
merica Servic
nalysis of othoes not stimucapacity. Fomarkets at Jd, as a resultdeclined betw
Overlapping
racterizes thef service at M
(247,386)
American
011
-59.4%
tween Housto
ce at ORD, M
her multi‐airpulate incumbor example, FK in 2006, At, overall capween 2006 a
EWR/JFK –
e stimulativeMiami/Fort L
(34,832)
United
-14.8%
on Airports
March 2012
port metropobent carrier gExhibit 21 dAmerican, Unpacity on the nd 2011.
Latin Ameri
effect on incLauderdale b
(3,064)
Delta
-5.4%
vs. March 2
olitan areas sgrowth but raemonstrates nited, and De19 Latin Ame
ca Markets
cumbents’ capby suggesting
827,387
2011
-2.1%
2010
shows ather, that,
elta all erican
pacity g that

The Economic Impact of Dividing International Air Service between Houston Airports
29
American increased capacity at MIA as a result of entry by LCCs Spirit and JetBlue at FLL. Indeed, as shown in Exhibit 22, capacity between Miami/Fort Lauderdale and Latin America on routes overlapping with JetBlue and Spirit actually declined since the entry of JetBlue.
Exhibit 22: 2007 vs. 2011 Capacity Change in Overlapping FLL/MIA – Latin Markets
Further, while it is true that American has increased its Latin American capacity from MIA over the past six years, this was not caused by a stimulative effect of LCCs at nearby Fort Lauderdale, but rather driven by American’s closure of its San Juan hub. As demonstrated in Exhibit 23, between 2006 and 2012 (when LCCs were expanding internationally out of Fort Lauderdale), American’s overall Latin American Capacity from MIA and San Juan combined actually fell by close to 8%.
1,227,804
75,000 (78,679)
(26,966)
1,197,159
2007 Jet Blue American Spirit 2011
Source: OAG weekly seats for FY 2007-2011
% Change
New -7.9% -11.6% -2.5%
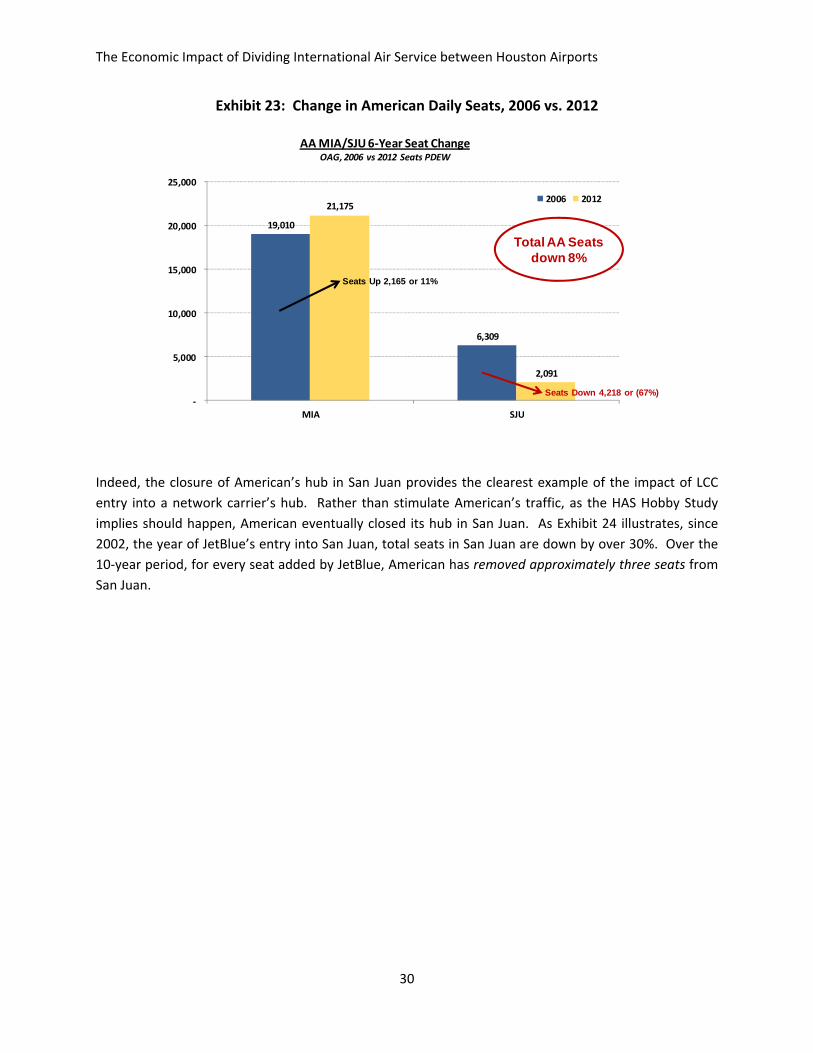
The Economic Impact of Dividing International Air Service between Houston Airports
30
Exhibit 23: Change in American Daily Seats, 2006 vs. 2012
Indeed, the closure of American’s hub in San Juan provides the clearest example of the impact of LCC entry into a network carrier’s hub. Rather than stimulate American’s traffic, as the HAS Hobby Study implies should happen, American eventually closed its hub in San Juan. As Exhibit 24 illustrates, since 2002, the year of JetBlue’s entry into San Juan, total seats in San Juan are down by over 30%. Over the 10‐year period, for every seat added by JetBlue, American has removed approximately three seats from San Juan.
19,010
6,309
21,175
2,091
‐
5,000
10,000
15,000
20,000
25,000
MIA SJU
AA MIA/SJU 6‐Year Seat ChangeOAG, 2006 vs 2012 Seats PDEW
2006 2012
Seats Up 2,165 or 11%
Seats Down 4,218 or (67%)
Total AA Seats down 8%

The Economic Impact of Dividing International Air Service between Houston Airports
31
Exhibit 24: Total Seats San Juan, 2001‐2012
Finally, the HAS Hobby Study speculates that Southwest’s international expansion at Hobby would result in a high proportion of its passengers on those new services flowing over Hobby to and from other destinations the carrier serves. For Cancun, for example, the HAS Hobby Study projects that 62% of Southwest’s passengers would be connecting passengers, a proportion similar to United’s.36 This assumption is unrealistic, as Southwest currently connects only 30% of its current Houston‐Hobby passengers.37 Further evidence of how aggressive this assumption is can be found in Exhibit 25, which demonstrates the fact that a well‐timed flight to Cancun would offer connections to only 18 cities, half of which already have non‐stop service to Cancun.38
36 See HAS Hobby Study, Exhibit 1‐13, which projects that Southwest’s Cancun service would result in 91,776 local and 148,908 connecting passengers. 37 Source: Analysis of U.S. DOT DB1B data. 38 Assumes Southwest’s Houston‐to‐Cancun flight departs at 10:05 AM and arrives at 11:25 AM and its Cancun‐to‐Houston flight departs at 12:25 arriving at 15:55. The average connecting time at HOU would be 3 hours and 11 minutes.
Source: OAG, June of each year.
17,29814,246 13,162
14,913 13,867 13,581 13,19611,821
6,520 6,6844,538 4,199
450695
815820 1,365 1,070
1,235
2,560 2,685
3,615 4,608
5,436
6,6955,807
7,3587,135 6,547
6,0065,615
6,490 6,5877,330 6,947
22,73421,391
19,663
23,08621,822 21,494
20,27218,671
15,571 15,956 15,483 15,755
0
5,000
10,000
15,000
20,000
25,000
2001 2002 2003 2004 2005 2006 2007 2008 2009 2010 2011 2012
Dai
ly S
eats
Fro
m S
an J
uan
American JetBlue Others

The Economic Impact of Dividing International Air Service between Houston Airports
32
Exhibit 25: A Well‐Timed Southwest Flight from Houston Hobby to Cancun Would Connect to Only 18 Cities
In order to generate the levels of connectivity assumed by the HAS Hobby Study, substantially greater numbers of connections are required. For example, approximately 75% of the passengers on United’s Houston‐Cancun flights make a connection at IAH, but this level of connectivity is only possible because: 1) United offers connections to more than 100 domestic and international destinations, and 2) United offers six daily roundtrip flights providing the breadth of schedule options travelers value. Moreover, the average connect time at IAH is one hour and 49 minutes. Southwest’s theoretical schedule would result in longer connect times at Hobby versus United’s at IAH, resulting in no improvement to Houston’s competitive position in terms of connect times vis‐à‐vis DFW, ATL, and CLT.39
39 Assumes a hypothetical schedule (timings not provided by HAS Hobby Study) operating at times reasonable for services of this nature. Southwest does not “bank” its HOU operation, resulting in inferior connect times at all times of day versus United’s “banked” operation at IAH.
CUN
ATL (DL/FL)
AUS (UA/FL)
BNA
BWI (FL)
CRP
DEN (Multiple)
ELP
HRL
JAN
MCO (B6)
MDW (Multiple at ORD)
MSY
OKC
PHL (F9/US)
SAT (FL/UA) TPA
TUL
DAL (Multiple at DFW)
Airport (Carrier): represents cities with greater than once/week nonstop service to CUN

The Econo
Exhibit 2
In summathat interdata. Thebroad‐ranwell‐being
d) BasedThanonth
Not surpHobby Stcombinethat Souoperatin
40 Southwesources. Smainline o
omic Impact o
26: United’s
ary, each of thrnational serverefore, the Hnging implicatg of the city’s
donthePr$75Millioe11Hypot
prisingly, whetudy with thees these assumuthwest woug margin of a
est passenger Southwest domperational cos
of Dividing In
s Cancun Ser
he assertionsvice at HobbyHAS Hobby Sttions for the s residents an
ojectedFarnandHavetheticalRou
en one combe HAS Hobby mptions withuld lose morapproximatel
revenues are
mestic costs arests..
ternational A
rvices Connea
s made by they would haveudy is not a rfuture of Ho
nd the compe
resintheHeanOperatutes
bines the unStudy’s othe Southwest’se than $75 y ‐50% (see A
grossed‐up toe grossed‐up b
Air Service bet
33
ect to 111 Dnd Japan
e HAS Hobby e on IAH are reliable basis ouston as a gtitiveness of
HASHobbytingMargin
realistically ler assumption publicly avaimillion annuAppendix A).4
o include Southby the ratio of U
tween Housto
Destinations
Study with resimply untrufor making aglobal aviatioits businesse
yStudy,SounofAppro
low projectens (e.g., abouilable cost daually from th40 Indeed, in
hwest’s ancillaUnited’s dome
on Airports
in the U.S.,
egards to theue and are unn informed pon hub, and, s.
uthwestWoximatelyN
d Southwestut load factorata from 2011hese operati order to sim
ary revenue asestic and intern
Canada, Eu
e stimulative nsupported bolicy decisionconsequently
ouldLoseMNegative50
t fares in the and capacity1, the results ons and inc
mply break ev
s reported by national narrow
rope
effect by the n with y, the
More0%
e HAS y) and show ur an en on
public wbody

The Economic Impact of Dividing International Air Service between Houston Airports
34
these 11 routes under the assumptions in the model contained in the HAS Hobby Study, Southwest would need to charge an average one‐way fare of approximately $175 (i.e., over 50% more than the $112 average “projected fare” in the HAS Hobby Study). Further, if Southwest were to earn a modest 3% return on these flights, it would need to charge an average fare of $187 (or 67% more than the average “projected fare” in the HAS Hobby Study). Notably, United’s average coach fare (including the pro‐rated amount for connecting passengers traveling on these routes) is $185. It is important to note that this forecasted loss is despite the unreasonable traffic stimulations assumed by the study. In summary, the HAS Hobby Study’s projected fare decreases and traffic increases—that underpin the economic benefits—are clearly unreasonable. Not only are they inconsistent with the HAS Hobby Study’s own yield equations, they imply that Southwest would set fares at levels that would result in the carrier losing more than $75 million annually from the operation of only 20 daily flights (a negative 50% operating margin). Simply put, the HAS Hobby Study’s projected fares and traffic levels—and thus economic benefits—are grossly overstated. In fact, traffic levels will decrease and not increase as the HAS Hobby Study claims.
e) TheHASHobbyStudyIgnorestheImpactofWeakeningIAHvis‐à‐visOtherHubsasanInternationalGateway Based on its flawed fare‐decrease analysis, the HAS Hobby Study concludes that there would be a net increase in traffic at IAH of more than 160,000 annual passengers in the “Initial Phase Scenario” and an increase of more than half a million passengers in the “Developed Phase Scenario.”41 According to the HAS Hobby Study, the net increase in IAH passengers results from a combination of newly stimulated passengers because of the (erroneous) lower fares and a diversion of flow traffic to Latin America from other hubs (e.g., DFW, MIA, and ATL). As described in detail above, the hypothetical decrease in fares is grossly exaggerated. The other key flaw in the HAS Hobby Study’s results is the assumption that United would not decrease capacity and would be willing to endure losses in order to maintain marginal routes when higher return opportunities exist elsewhere in its network.
In contrast to the HAS Hobby Study, the United Study analyzes the effect of the projected new Southwest service using its ordinary course of business QSI‐based passenger forecast model. This model, which United uses to plan and evaluate all of its network decisions, results in the common‐sense finding that United would be forced to pare back its operations at IAH and re‐allocate future growth opportunities to other hubs as a result of Southwest’s services, leading to a substantial decline in traffic at IAH, and an overall decline in passenger volumes at Houston airports. The difference in projected changes in passenger volumes between the HAS Hobby Study and the United Study is illustrated in Exhibit 32. As discussed, the HAS Hobby Study fails to account for the dozens of frequency reductions on United’s existing routes, the termination of service to several destinations, as well as the growth opportunities from IAH that United would be forced to forego. Thus, contrary to virtually all prior
41 See HAS Hobby Study, Exhibits 2, 1‐16, and 1‐19.

The Econo
evidence traffic levmodels popportunpassengepassenge
Exhib
Importantas a hub (and nowATL. How
42 InterVISimplicitly tair transpoevidence dparticular significant Liberalizat
omic Impact o
and logic regvels actually wredict that, aities to otherrs. As a resulrs (see Appen
bit 27: Estima
tly, the HAS Hwould affect
w United) has wever, this po
STAS has previthe negative efortation plays demonstratingthey note onpositive impaion,” p. 87.
of Dividing In
garding operwill increase as a result or hubs in its nt, Houston ovndix B for det
ated Impact o
Hobby Study’st Houston’s rinvested to dsition is tenu
ously recognizffect should it an important g a strong linke study whichact on employm
ternational A
rations of netat IAH. In cof reducing dnetwork, IAH verall will expails).
of InternationHous
s analysis hasresidents anddevelop IAH ous given IAH
zed the value get smaller. Throle in businesage between h “showed thament in that r
Air Service bet
35
twork airlineontrast, Unitdaily IAH flighwill see a neperience a ne
nal Service atston Airports
s simply ignord businesses.4
as a successfH’s smaller siz
of increasing hey note that,ss location decair service anat expansion region.” InterV
tween Housto
s, the HAS Hted’s ordinaryhts by 46 anet decline of met reduction o
t Hobby Airps
red how the c42 Over the ful competingze and scope.
the size of an“The studies dcisions. Other d economic dof the airline VISTAS‐ga2 “Th
on Airports
Hobby Study y course forend re‐allocatinmore than thof more than t
ort on Passen
consequencespast two decg gateway re.
n airline’s netwdescribed abovstudies have uevelopment anetwork serv
he Economic Im
forecasts thaecast and plang several grhree million atwo million a
nger Traffic a
s of weakenincades, Continelative to DFW
work, and theve demonstratuncovered emand investmenving a region mpact of Air S
at net nning rowth nnual nnual
at
ng IAH nental W and
erefore te that mpirical t.” In had a Service

The Economic Impact of Dividing International Air Service between Houston Airports
36
Exhibit 28: IAH is Smaller than the Other Two Primary Alternate Hubs for Latin Service
IAH’s smaller size and scope is especially troubling considering the further growth being planned at DFW and ATL. As Mr. Diaz mentioned in his presentation, ATL has just opened a new 1.2‐million‐square‐foot international facility. The new facility has 12 international gates and 40 CBP inspection stations and cost $1.4 billion to build.43 Additionally, as part of it restructuring plans, American has announced plans to add a substantial number of new destinations from its hubs, particularly to international destinations. Development of a competing international airport in Houston will only serve to further undermine IAH’s position as a premier international gateway. Further, while Southwest seeks to divide international air service in Houston, it agreed never to do so in its hometown of Dallas, by signing a contract with the Cities of Dallas and Fort Worth, DFW Airport, and American Airlines, that stated:
The Parties agree that non‐stop international service to and from the Dallas‐Fort Worth area shall be limited exclusively to DFW International Airport (“DFW Airport”). The Cities will jointly encourage all such flights into DFW Airport.44
43 http://www.11alive.com/news/article/238837/40/Inside‐Hartsfield‐Jackson‐ 44 See “Contract Among the City of Dallas, The City of Fort Worth, Southwest Airlines Co., American Airlines, Inc., and DFW International Airport Board Incorporating the Substance of the Terms of the June 15, 2006 Joint Statement Between the Parties to Resolve the ‘Wright Amendment’ Issues,“ July 11, 2006.
Source: OAG, June 2012.
154 142113
68
45
67
222
187180
0
50
100
150
200
250
Atlanta: Hartsfield-Jackson Dallas/Ft Worth International Houston Intercontinental
Air
port
s
Domestic International

The Econo
4) The
a) Econ
Overview
Dr. Smitheconomicintimate kpublic‐ animpact stu
One of thproposedinternatioeconomicmisleadineconomicSmith hasuses for Proposal comparedloss to the
omic Impact o
HASHob
nomicImpa
w
, Professor Ec analysis of knowledge ofnd private‐secudies.
he objectives internationaonal service ac output for g and incorrc impact is ons employed reits network would resultd to a gain of e Houston eco
Exhibit 29:
of Dividing In
bbyStudy
actAnalysis
Emeritus of ththe Proposaf the local Hoctor clients, a
s of the HASal flights froat Hobby wilthe City.
rect. As willnly as good aealistic assumplanning, andin the loss oonly 1,500 joonomy of alm
Estimated E
ternational A
’sEconom
s
he Universityl for United uston economand is well aw
S Hobby Studom Hobby. l lead to theFor a varietyl be describeas the modelmptions provid has appliedof more thanobs and $120 most 3,700 job
conomic Imp
Air Service bet
37
micImpac
y of Houston’(Dr. Smith’s my and has coware of pitfall
dy is to estimThe HAS H
e creation ofy of reasonsed in detail that is usedded by United a nationalln 5,000 jobs amillion in GRbs and $295 m
pact of Intern
tween Housto
ctAnalysi
’s Departmens Analysis). onducted imps that often b
mate the regHobby Studyf 18,111 jobss, these estiin this sectiod and the inped based on tly recognizedand $414 miRP per year frmillion in GRP
national Servi
on Airports
isisCritic
nt of EconomDr. Smith is pact studies fbefall other r
gional econompurports to
s and $1.6 biimated econon, the estimputs applied tthe passenged model, to llion in GRP rom Hobby, wP per year.
ice at Hobby
callyFlaw
mics, conductrenowned fofor a wide ranregional econ
mic impact oo show thatillion in addiomic impactmation of regto the moder forecast moconclude thaper year fromwith a resultin
Airport
wed
ed an or his nge of omic‐
of the t new tional ts are gional l. Dr. odel it at the m IAH ng net
The Economic Impact of Dividing International Air Service between Houston Airports
38
The stark differences in the two studies’ conclusions are a result of several differences in both the assumptions used and in the modeling employed. For example, while the HAS Hobby Study relies on (as inputs) grossly exaggerated passenger stimulation figures that are in turn the result of non‐credible assumptions regarding the fares Southwest would charge, Dr. Smith’s Analysis uses passenger levels that are estimated by United using United’s ordinary course network planning tools. Likewise, the HAS Hobby study assumes changes in employment levels as a result of the additional services from HOU that are far in excess of current levels. Similarly, whereas the HAS Hobby study uses a measure known as “output,” which significantly overstates the amount of economic impact that stays within the Houston area to describe the economic purported economic impact, Dr. Smith’s Analysis correctly uses “total value added,” (i.e., Gross Regional Product) which describes the economic impact that directly benefits the Houston area.
The remainder of this section describes how both the inputs and assumptions embedded in the HAS Hobby Study are critically flawed and why, in turn, the results of the HAS Hobby Study cannot be used as the basis for any critical policy decision regarding the future of Houston’s status as a global aviation hub. Likewise, we demonstrate that the underlying data and assumptions used as inputs in the HAS Hobby Study analysis are also inconsistent with a previous study conducted by the very same consultants in 2011.
ThePrimaryToolUsedinEconomicImpactStudies:Input‐OutputAnalysis
The HAS Hobby Study uses Input‐Output (I‐O) models to estimate economic impact. Dr. Smith does not challenge the use of I‐O models as a legitimate tool in conducting economic impact studies; in fact the use of I‐O models is the only acceptable methodology in both the academic and professional literature for this sort of regional analysis. There are several credible commercial I‐O models available, including the model utilized in the HAS empirical analysis. However, these models need to be carefully applied by a competent regional economist with ample experience in conducting regional economic impact studies. There have been literally hundreds of impact studies produced over the years for a wide variety of public and private sector initiatives that have violated key requirements of a sound analysis. In general, the results of these flawed analyses are that they greatly exaggerate the purported economic impact of the project or initiative considered.
Dr. Smith’s Analysis applies the IMPLAN I‐O model in analyzing all of the various economic impacts associated with changes in Houston‐area air traffic. Dr. Smith has conducted numerous studies using I‐O models to analyze changes in the Houston economy associated with dozens of different types of proposed changes in public‐ and private‐sector investment, as well as many associated with the presence of already existent facilities.45 Such studies begin with a pre‐packaged I‐O model available from one of several national firms, all of which rely to some extent on the U.S. Department of Commerce’s national I‐O model, which is then adapted to the specifics of individual regions. All three of
45 His most recent study involved estimating the overall effect of the Houston Livestock Show and Rodeo.

The Economic Impact of Dividing International Air Service between Houston Airports
39
the most well‐known and most utilized models (IMPLAN, RIMS II, and REMI) imperfectly match every region in the country to its own peculiarities. The IMPLAN model was chosen for the Dr. Smith’s Analysis because it is the easiest for an expert researcher to modestly adjust to meet the realities of the region to be analyzed. Of course, this requires that the analyst has a thorough understanding of the region’s economy and economic structure.
HowEconomicImpactisMeasured:Direct,Indirect,andInducedImpacts
Economic impact studies measure three types of impacts to a local economy to derive the total economic impact: 1) the initial direct economic effects on output and direct employment of any new business activity (or reduced business activity); 2) the indirect impacts from purchases required to produce the direct impacts, and 3) the induced impacts related to the spending of increased incomes as they circulate throughout the economy. The total economic impact is the sum of the direct, indirect, and induced impacts.
In this study, direct impacts arise from expenditures and employment directly associated with the airport itself, the airlines involved, and any local spending of the passengers they carry. Indirect impacts arise from expenditures that support this initial spending; for example, the purchase of jet fuel for the aircraft or the purchase of food by restaurants servicing new passengers.46 Finally, induced impacts occur when the additional income from the direct and indirect impacts is re‐spent on local goods and services (for example, the increased income of fuel‐truck operators might be spent on local groceries, clothing or entertainment).47
b) FlawsintheHASHobbyStudy:ErroneousInputs
ExaggeratedAirlineandAirportJobEffectsatHobby
First, the HAS Hobby Study drastically overstates the incremental impact on airline‐ and airport‐related employment from increased passenger traffic. That is, the number of additional airline and airport‐related employees that would be added to support the increased traffic and service. The HAS Hobby Study states that the new flying at Hobby will create 2,931 new direct, “on airport” jobs at Hobby. As a point of reference, Southwest recently stated, in a March 13, 2012, letter to HAS Director Mr. Diaz, that
46 Note that passengers who are residents of Houston are not expected to create any direct or indirect effects since they are not bringing into the region additional outside dollars. 47 For similar type studies see, for example, ATL, “Connecting the Region to the World, Final Technical Report, Economic Impact Study,” 2005; "The Contribution of Bradley International Airport To Connecticut’s Economy, State of Connecticut Economic Impact Analysis" May 27, 2005; “The Economic Impact of the Cincinnati/Northern Kentucky International Airport on Greater Cincinnati,” prepared by the Economics Center for Education and Research, George M. Vredeveld, University of Cincinnati, May 2005.

The Economic Impact of Dividing International Air Service between Houston Airports
40
they currently operate “135 daily nonstop flights to 34 cities with 2,770 local employees.”48 That same letter also states that “staffing a HOU CPB [sic] will require about 20 agents.”49 It is difficult to reconcile how the 23 additional flights from Hobby Airport described in the HAS Hobby Study could possibly require more direct employment than Southwest’s entire current schedule, which is nearly six times larger.
In fact, the employment estimates in the HAS Hobby Study directly conflict with the assumptions of the HAS 2011 Study conducted by the very same consultants.50 The HAS 2011 Study estimated that each 1,000 airline passengers at Hobby created 0.98 airline jobs and 1.54 other airport jobs for a total of 2.52 airline‐related jobs (see Exhibit 30). The HAS Hobby Study projects that, for each 1,000 new passengers at Hobby, an additional 2.45 airline jobs and 3.86 other airport jobs (for total of 6.31 airline‐related jobs) would be created to support the new service. In other words, the current HAS Hobby Study implies, for no apparent reason, that the new service creates more than double the number of employees as does the existing service.
Exhibit 30: GRA’s Estimated Job Impacts per Passenger are Inconsistent with the HAS 2011 Study
48 See Letter from Bob Montgomery to Mario Diaz, March 13, 2012, page 4. 49 Ibid, page 2. 50 “Houston Airport System Economic Impact Study,” prepared by GRA, Incorporated, June 30, 2011.
Source: “The Economic Impact of International Air Service at William P. Hobby Airport” Prepared for HAS by GRA, Incorporated and InterVISTAS Consulting LLC. ; “Houston Airport System Economic Impact Study,” prepared by GRA, Incorporated, June 30, 2011; U.S. BTS.Notes: Passengers are the sum or arriving and departing passengers. Other airport jobs include airport passenger services, passenger ground transportation, and airport and aircraft services. The HAS study’s estimated impact on employment corresponds to the “Developed Phase Scenario.” The United study’s estimated impact on employment corresponds to the “Operating Phase.”
2.45
0.98
3.86
1.54
6.31
2.52
0
1
2
3
4
5
6
7
New Service Existing Service
Jobs
per
1,0
00 P
asse
nger
s
Airline Jobs Per 1,000 Passengers at Hobby Other Airport Jobs Per 1,000 Passengers at Hobby

The Econo
The exaggbasis. Foresponsibdaily flightotal of 40service.52 employmflights per
Exhibit
51 It is impthe same aand would52 While itthan two‐f
omic Impact o
gerated impaor example, Eble for approxht at Hobby.51
03 airline‐ an In contrastent growth ar day from Ho
31: The HAS
portant to noteaircraft type (i thus require t
is true that infold difference
of Dividing In
cts are also sExhibit 31 shoximately 60 a1 The HAS Hod airport‐rela to these infat Hobby of 8obby, as comp
S Hobby Study
e that the HAS.e., the Boeingthe same crew
nternational tris entirely unr
ternational A
seen if one coows that the irline jobs anobby Study, hated jobs perflated job gro892 jobs, whicpared to curr
y’s EstimatedHAS
S Hobby Studyg 737) that Soucomplements
raffic may reqrealistic.
Air Service bet
41
onsiders the i2011 study ed 95 other aihowever, findr daily flight, oowth assumpch is consisterent Hobby Ai
d Job ImpactsS 2011 Study
assumes thatuthwest uses o.
uire more airp
tween Housto
ncremental joestimated thrport‐relatedds that the 23or more thanptions, Dr. Sment with an airport direct e
s per New Flig
t the additionaon all of its cu
port employee
on Airports
ob impacts ohat each Hobd jobs for a to3 additional fn 2.5 times thmith’s Analyspproximate 1employment.
ght are Incon
al 23 flights worrent flights fr
es than domes
n a per‐daily‐by daily flighotal of 155 jobflights will crehan for the exsis assumes 10‐15% increa.
nsistent with
ould be operatrom Houston‐H
stic traffic, the
‐flight ht was bs per eate a xisting direct ase in
the
ted by Hobby,
e more

The Economic Impact of Dividing International Air Service between Houston Airports
42
RelianceonExaggeratedPassengerStimulationNumbers
The HAS Hobby Study’s inflated economic impact analysis is compounded by a second critical flaw, in that it relies on projected changes in passenger traffic that are entirely unrealistic. The changes in passenger volume projected by the HAS Hobby Study are based on overstated fare reductions, resulting in greatly exaggerated estimates of net additional trips that will be generated by opening up Hobby to international flights. Further, because the resulting increase in demand is estimated to be so large, the study comes to the erroneous conclusion that United would not be forced to reduce capacity at IAH in response to expanded service by Southwest at Hobby. Indeed, the HAS Hobby Study comes to the illogical conclusion that both Houston‐area airports will experience growth in traffic volumes as a result of dividing international service at Houston — all to destinations already currently served from IAH.
Dr. Smith’s Analysis begins with changes in passenger volume that are based on United’s ordinary course of business QSI‐based passenger forecast model. As discussed in Section 3 above, this model, which United uses to plan and evaluate all of its network decisions, results in the common‐sense finding that traffic at IAH would be diminished in response to the new Hobby international service. United would be forced to pare back its operations at IAH and re‐allocate future growth opportunities to other hubs in the United network as a result of the Proposal, leading to a substantial decline in traffic at IAH and an overall decline in passenger volumes at Houston airports collectively. This overall reduction in total passenger volume is combined with United’s estimates (based on its own experience and an analysis of publicly available data) of airline operations to predict the incremental changes in airline and airport employment resulting from the changed traffic levels at each Houston airport. These more realistic estimates become important key inputs in Dr. Smith’s IMPLAN I‐O model. Furthermore, it is important to note that, in formulating the economic impact analysis, several conservative assumptions were made so as to not overstate the magnitude of the conclusion that new international service at Hobby actually would have a negative impact on the Houston economy.53
Exhibit 29 shows the difference in projected changes in passenger volumes between the HAS Hobby Study and the United Study. As discussed, the HAS Hobby Study fails to account for the dozens of reductions on United’s existing routes, the termination of service to several destinations, as well as the growth opportunities from IAH that United will now be forced to forego. These routes all involve flights from Houston that were dependent upon connecting flight demand emanating from travel to and from Latin America. The failure to account for these reductions leads the HAS Hobby Study to incorrectly forecast that net traffic levels will actually increase at IAH, contrary to virtually all previous evidence and basic logic of how network airlines operate. In contrast, United’s ordinary course forecast and planning models predict that, as a result of being forced to reduce daily IAH flights by 46 and of re‐allocating several growth opportunities to other hubs in its network, IAH would experience a net decline of over 53 For example, it was assumed that all of the forgone passengers generated low (i.e., tourist‐level) spending and that there will be no incremental changes in high‐level management at the airports as a result of the service reductions at IAH. It was also assumed the resident travelers do not generate any new local expenditures that regional economists would classify as “import substitution” stimuli. Dr. Smith’s Analysis also assumes that the facilities at Hobby will be completed in one year and that, by year three, Southwest Airlines will have fully achieved its expected passenger trip forecast, both of which are generous to the Hobby results.

The Econo
3.0 millionmillion ansizable inrespect toregarding
Exhib
The HAS unrealisticthat traffi
c) FlawValu
The diffebetween are the a
54 As discus
omic Impact o
n annual passnnual passengncreases in po annual passg annual passe
bit 32: Estima
Hobby Studyc and inconsc, lead to wil
wsintheHAue‐Added(i
rences in inpthe economissumptions u
ssed above, th
of Dividing In
sengers, leavgers. Note thpassenger vosengers, the engers at IAH
ated Impact o
y’s incorrect sistent assumdly exaggerat
ASHobbySi.e.,Regiona
puts to the Ic impact conutilized in the
is is despite So
ternational A
ing the overahat at Hobby, lume, 1.5 anbiggest differ.
of InternationHous
projections amptions regarted total econ
tudy:ImpralGDP)
‐O model annclusions of the HAS Hobby
outhwest losin
Air Service bet
43
all Houston mthe HAS Hobnd 1.0 milliorence in the i
nal Service atston Airports
about future rding the incrnomic impact
roperUseo
nalyses only ehe HAS Hobby Study gross
g money unde
tween Housto
market with a bby Study andn annual painputs to the
t Hobby Airps
Houston airremental emt estimates.
ofEconomi
explain a poby Study and ly exaggerate
er either of the
on Airports
net reductiond the United Sassengers rese I‐O models
ort on Passen
port traffic, mployment re
c“Output”
rtion of the Dr. Smith’s Aed, but the H
se forecasts.
n of more thaStudy both pspectively.54 involves estim
nger Traffic a
combined wiequired to su
(i.e.,Sales)
overall diffeAnalysis. NotHAS Hobby St
an 2.0 roject With
mates
at
ith its upport
)vs.
erence t only tudy’s
The Economic Impact of Dividing International Air Service between Houston Airports
44
improper use of “Output” (i.e., sales) rather than Value‐Added (i.e., regional GDP) inflates even further the HAS Hobby Study results.
When conducting I‐O analysis, the analyst must select the correct measure of an overall economic impact within a region. The HAS Hobby Study’s I‐O model results are reported in terms of regional economic “output.” Although estimates of regional output are reported in most available I‐O models, this statistic is highly misleading. This is because the term “output” in these models in effect refers to “sales.” As such, output is a measure of total gross receipts, or sales, at each point of transaction and is inappropriate as a reliable measure of a policy’s potential economic impact on a region. For example, the “output” measure applied to the price of a loaf of bread includes not only the sale of the bread by the grocery store to its customers, it also includes the sale of the same bread to the grocery store by the local wholesaler and the sale of the same bread to the wholesaler by the bakery. Indeed, most I‐O model manuals available to analysts remind the researcher that output is really regional sales and the use of such measure involves double counting.55
For some products, the chain of purchases is even more convoluted. For example, airlines purchase jet fuel from a supplier who purchases from a wholesaler/deliverer who purchases it from a producer who purchases all the required raw inputs to produce the fuel and so forth. Therefore, output measures the total sales price for each transaction, not the value‐added created at each individual firm. Indeed, total value added is the correct measure to use in estimating the economic impacts upon a region and is equivalent to what regional economists call “Gross Regional Product” (similar to Gross Domestic Product at the national level). The use of output as a measure of regional economic impacts can easily imply effects that are two to four times greater than what actually occurs. “Total value added” eliminates double counting and captures only the economic impact of the activity which is actually conducted in Houston and is therefore the variable of choice in reporting economic impact.
The results of Dr. Smith’s Analysis are stated in terms of total value added, but also in terms of output to afford the reader an apples‐to‐apples comparison with the HAS Hobby Study (which only provides estimates in terms of output). However, the key point here is that value added is the appropriate measure of economic activity when evaluating public policies. It would seem that the HAS Hobby Study’s focus on output as a measure of economic activity is used to inflate the magnitude of its estimated positive economic impact — again, an impact which is positive only because of the exaggerated projected increase in passenger volumes at both Hobby and IAH airports.
55 See, for example, The Double Counting of Output, IMPLAN, noting that, “The output of an industry requires output of other industries so output is double counted. Analysts will focus on output because those numbers are bigger than value added and income. But, while output is a measure of economic activity, as an indicator it can be meaningless.”

The Econo
d) The
The exaggthe estimThe HAS projects aadditionaStudy usipassengethan what
Ex
Likewise, “output” estimates$0.2 billio
56 Again, tparticular, Houston, wpurported
omic Impact o
Difference
geration of tated total emHobby Studyat Hobby alol Hobby passing excessivers at Hobby at the HAS 201
xhibit 33: Est
as shown in Eas a result ofs that the 1.0on in addition
he HAS Hobbythe HAS 2011which equateseconomic ben
of Dividing In
sintheRes
he overall HAmployment imy attributes 1ne, while thesengers it proely optimisticand wildly ex11 Study relie
timated Impa
Exhibit 34, thf its projected0 million addial output.56
y Study’s estim1 Study found to approximanefit is $325 mi
ternational A
sultsofthe
AS Hobby Stumpact associa16,943 new re United Studojects. The hc assumptionxaggerated imed upon (as sh
act of Interna
e HAS Hobbyd 1.5 million tional Hobby
mated of totalthat that Hou
ately $195 millillion per gate,
Air Service bet
45
eHASandt
udy’s results ated with theregional jobs dy attributes huge differencns regardingmpacts of newhown in Exhib
ational Servic
y Study attribadditional pay passengers
l output impacuston airportslion per gate. two‐thirds hig
tween Housto
theUnited
is particularle new serviceto the 1.5 m1,503 new rce in jobs creg the long‐ruw flights on ebit 30 and Exh
ce at Hobby A
utes approximassengers at it is projectin
ct is inconsistedrive about $ In the currengher than in th
on Airports
Studies
y evident whes at Hobby imillion additioregional jobs eated is due un, steady‐stemployment thibit 31 abov
Airport on Em
mately $1.5 bHobby, whileng would cre
ent with the H28 billion in ent HAS Hobby She HAS 2011 St
hen one comn the two stuonal passengto the 1.0 mto the HAS Htate level ofthat are far he).
mployment
billion in addie the United eate approxim
HAS 2011 Studconomic beneStudy, howevetudy.
mpares udies. gers it million Hobby f new higher
tional Study mately
dy. In efits to er, the
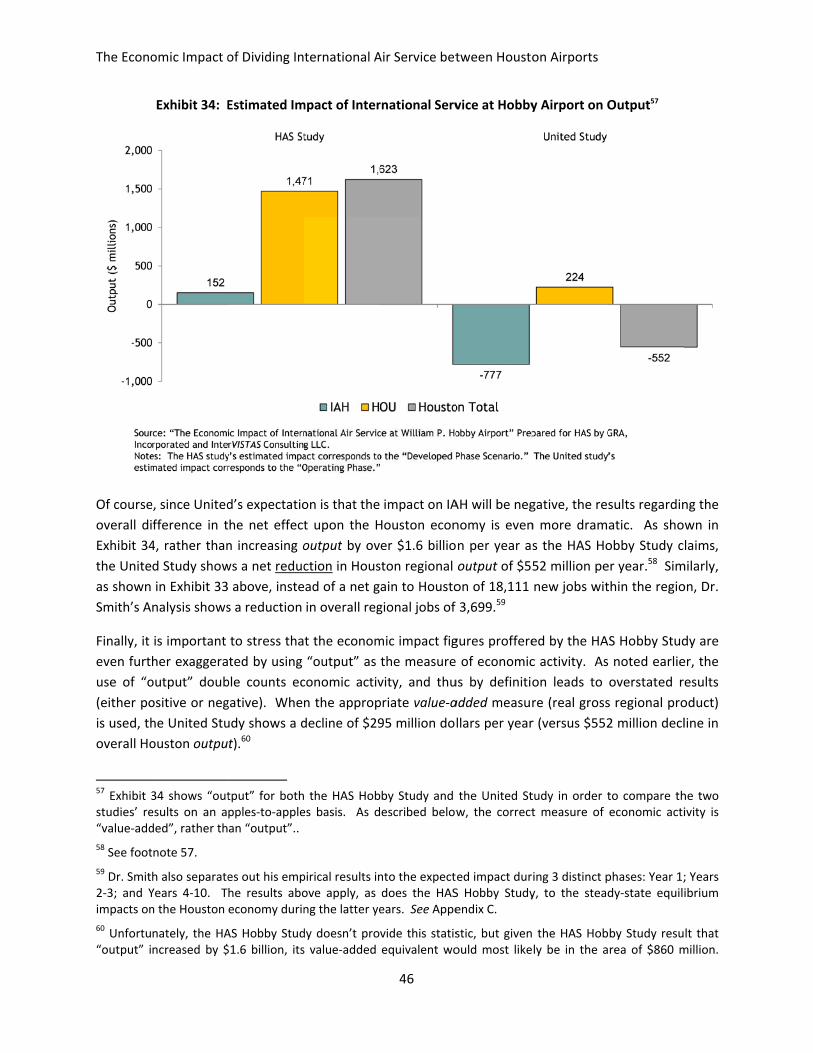
The Econo
Of courseoverall diExhibit 34the Uniteas shown Smith’s A
Finally, it even furtuse of “o(either pois used, thoverall Ho
57 Exhibit 3studies’ re“value‐add58 See foot59 Dr. Smit2‐3; and Yimpacts on60 Unfortu“output” i
omic Impact o
Exhibit 34: E
e, since Unitedfference in t4, rather thand Study showin Exhibit 33nalysis shows
is important her exaggeraoutput” doubositive or neghe United Stuouston outpu
34 shows “outesults on an aded”, rather th
note 57.
h also separateYears 4‐10. Tn the Houston
nately, the HAncreased by $
of Dividing In
Estimated Im
d’s expectatiohe net effectn increasing ows a net reduc above, instes a reduction
to stress thated by using ble counts ecgative). Whenudy shows a dt).60
tput” for bothpples‐to‐applean “output”..
es out his emphe results aboeconomy durin
AS Hobby Stud$1.6 billion, its
ternational A
mpact of Inter
on is that the t upon the Houtput by ovction in Housad of a net gin overall reg
t the econom“output” as conomic activn the appropdecline of $29
the HAS Hobes basis. As d
pirical results inove apply, as ng the latter ye
dy doesn’t provs value‐added
Air Service bet
46
rnational Serv
impact on IAHouston econer $1.6 billioston regional ain to Houstogional jobs of
mic impact figthe measurevity, and thupriate value‐a95 million dol
by Study and escribed below
nto the expectdoes the HASears. See Appe
vide this statisequivalent wo
tween Housto
vice at Hobby
AH will be negnomy is evenn per year asoutput of $55on of 18,111 3,699.59
gures proffere of economicus by definitioadded measurllars per year
the United Stw, the correct
ed impact durS Hobby Studyendix C.
stic, but givenould most like
on Airports
y Airport on O
gative, the resn more drams the HAS Ho52 million penew jobs wit
ed by the HAc activity. Ason leads to re (real grossr (versus $552
tudy in order tt measure of
ing 3 distinct py, to the stead
the HAS Hobly be in the a
Output57
sults regardinatic. As shoobby Study cer year.58 Simthin the regio
S Hobby Stud noted earlieoverstated rs regional pro2 million decl
to compare theconomic acti
phases: Year 1;dy‐state equili
by Study resurea of $860 m
ng the wn in laims,
milarly, on, Dr.
dy are er, the esults oduct) line in
he two ivity is
; Years ibrium
lt that million.

The Economic Impact of Dividing International Air Service between Houston Airports
47
e) ConclusionsRegardingtheHASHobbyStudyI‐OAnalysis
In summary, the HAS Hobby Study portrays an entirely inaccurate impact of the Proposal on the Houston economy because it assumes highly inaccurate changes in net overall regional passengers trips per year, which are inflated by its untenable assumptions regarding the direct jobs associated with each trip. The impact is exaggerated further by reporting their results only in terms of output rather than value‐added (gross regional product). With this many compounding errors, it would be irresponsible to rely upon the HAS Hobby Study’s results to make such an important decision regarding Houston’s future. In contrast, Dr. Smith’s Analysis is based on inputs derived from United’s ordinary course planning tools and benefits from his many years of expertise regarding the local Houston economy. As such, unlike the HAS Hobby Study, the United Study results in credible projections regarding the likely impact of the proposed Hobby expansion on Houston’s economy.
5) AllHobbyPassengers–NotSouthwest–WillPayfortheProposal
a) ContrarytoitsPublicStatements,SouthwestWillNotFundthisProject,theHoustonAirportSystemandHobbyPassengersWill
Prior Airport Directors for the Houston Airport System encouraged a funding model through which airlines that benefited from terminal development also assumed a portion of the financial burden. Perhaps the most relevant example is the redevelopment of Terminal B at IAH, to which United is contributing $97 million of its own corporate funds while the City is contributing $53 million in funds from a PFC, which the airport collects from passengers using the terminal. This results in United paying $2 for every $1 of investment by the City. This method of financing, where the beneficiary of the facility shares in the financial risk, aligns the interests of the airport and the airline. This is not the case for the new International Concourse and FIS (Hobby FIS facility), where Southwest proposes to contribute $0 of the $100 million investment.
In the April 4 Houston Chronicle, a Southwest senior executive was quoted as saying, “We're asking for an opportunity to invest $100 million in a new building in your city to provide more passengers…” The facts, as stated in Director Diaz’s April 9th memo, show that Southwest is not investing a single dollar in the Hobby FIS facility. In fact, it is the City, through HAS, and not Southwest, that would be paying for the new Hobby FIS facility. As described by Mr. Diaz, the cost of constructing the new facility would be funded by a 50% increase of the PFC at Hobby Airport, from $3 to $4.50 per passenger, which is paid directly by the traveling public and used at the discretion of the airport. These PFCs would not only be paid by Southwest passengers, but also by passengers on American, Delta, and all other carriers that
Even this impact upon the region is, of course, biased significantly upward by the unreasonable assumptions that enter the HAS Hobby Study I‐O model to begin with.

The Econo
serve thethe fundinthe availainvestmen
Exhibi
Additionaautomobiparking gathe cost a
Adding fuAssumingtime that serve Hobchooses e
Currently advantagePFC differhave the referenceat Hobby.benefit thOffice fou(and hav
61 Both ter
omic Impact o
airport, wheng of the prinable PFC revnt by Southw
it 35: Southw
ally, Mr. Diaz ile parking garage and roaand therefore
urther financiag a three‐yearthe Hobby Fbby past 201either to unde
both IAH ane when comprential is a cochoice to coe, connecting . The HAS Hohe impact of und “that fore a midrang
med “enabling
of Dividing In
ether they usencipal compoenue at Hob
west.
west Contribu
stated that Harage and imadway improe the risk for t
al risk to HASr constructioFIS facility wo15, nor has Serutilize the F
nd Hobby Airpared to otheompetitive adnnect over mpassengers mobby Study hthis increaser a $1 increasge estimate
g” projects, wh
ternational A
e the facility nent of this pbby Airport t
ution to the HT
HAS, and not mproved roaovements in tthese projects
S is the fact tn schedule aould be compSouthwest mFIS or not to p
rport passenger large and dvantage to tmultiple airpomake up 52% has not discoue in passengese in the PFCof 0.85%) a
hich also mean
Air Service bet
48
or not. Assuproject, not ththrough at le
Hobby FIS CoTerminal B
Southwest, adways.61 Whe memo, Ms.
hat the airpos described bplete. Southwade any comprovide any in
gers pay a $medium airpthe Houston orts will choosof passengerunted from itr cost. In facC, passenger and would b
s “required.”
tween Housto
uming the cuhe interest exeast 2020 —
mpared to U
also would beWhile he did r. Diaz again
ort leases at Hby Mr. Diaz, twest has madmmitment to nternational s
3 PFC. This ports that chaAirports as pse the less exrs at Interconts passenger ct, a 1999 stureductions wbe proportio
on Airports
rrent traffic xpense, woul
— and likely l
nited’s Contr
e responsible not estimatestated that H
Hobby expire this is approxde no apparerepay the Cservice whats
is a $1.50 parge $4.50 peprice‐sensitivxpensive opttinental and increase andudy by the Gwould range fnally greater
patterns contld commit 10longer — wit
ribution to IA
for funding ae the costs oHAS would as
on June 30, ximately the nt commitmeity in the evsoever in 201
per passengeer passenger.ve passengerstion. As a po24% of passed overall econGeneral Accoufrom 0.5% tor for nonbus
tinue, 00% of th no
AH
a new of the ssume
2015. same ent to vent it 5.
r cost . This s who oint of engers nomic unting 1.8% siness
The Economic Impact of Dividing International Air Service between Houston Airports
49
passengers, low‐fare airlines, large airports, and passengers taking relatively short flights.”62 Given that Mr. Diaz is proposing a $1.50 increase (50% more than the increase studied by the GAO), and the proposed flights to be added by Southwest would predominantly carry non‐business passengers on relatively short flights, it is not unreasonable to fear the upper bound in passenger loss across the entirety of the Hobby airport traffic base, which is more than 175,000 passengers per year. The HAS Hobby Study completely ignores this impact of increasing the PFC.
Finally, the higher PFCs and debt would come at a time when IAH is capable of accommodating all demand for international service in Houston. The international Terminal D has 12 international gates for use by global carriers other than United, and those carriers currently provide a total of 12 flights on an average day.
6) CustomandBorderProtectionImpacts
a) ANewMandatetoStaffaCBPInspectionFacilityforCommercialTrafficatHobbyCouldResultinCBPServiceDegradationatIAHandOtherCBPPortsofEntryinTexas
CBP is the federal agency responsible for securing the nation’s borders and protecting the public against terrorism. Its officers inspect and process thousands of passengers and containers at air, land, and maritime ports in the Houston region and throughout the State of Texas every day with no margin for error.
Due to its geographic location and the essential national security role it plays, Texas has the highest number of CBP ports of entry of any state (see Exhibit 36). These ports of entry are assigned to three CBP Field Operations Offices for oversight. In addition to IAH, the Houston field office is responsible for 18 ports of entry, including DFW (see Exhibit 37). Adding an additional Port of Entry at Hobby to CBP’s existing burden in the Houston region would place additional strain on already limited resources.
62 United State General Accounting Office, “Passenger Facility Changes: Program Implementation and the Potential Effects of Proposed Changes,” May 1999, p.44.

The Econo
omic Impact oof Dividing In
Ex
ternational A
hibit 36: CBP
Air Service bet
50
P Ports of Ent
tween Housto
try by State
on Airports

The Econo
omic Impact oof Dividing In
Exhibit
ternational A
t 37: Texas P
Air Service bet
51
Ports of Entry
tween Housto
y by Field Offi
on Airports
ice

The Economic Impact of Dividing International Air Service between Houston Airports
52
b) CBP Passenger Wait Times at IAH are Already Significantly Longer than theNationalAverageandthoseatCompetingAirports,EspeciallyatPeakTimes
As shown in Exhibit 38, based on CBP’s statistics, in recent years IAH’s ranking in average CBP wait times (passenger‐weighted) has dropped from among the best in 2006 to near the bottom in 2011.
Exhibit 38: CBP Wait Time Ranking
Best
Worse
Airports ranked based on the passenger-weighted monthly average CBP wait times reported in the CBP Airport Wait Times website athttp://apps.cbp.gov/awt/index.asp for flight processing times at primary processing area. For 2006-2007 only 16 airports reported.
Rank 2006 2007 2008 2009 2010 20111 SJU SJU FLL SJU SJU SJU2 EWR CVG SEA SEA SEA SEA3 IAH IAH DFW PHL FLL IAD4 CVG EWR PHL FLL CVG CVG5 DTW SFO SJU DFW PHL FLL6 LAX DTW MCO IAD DFW MSP7 SFO MSP LAS DTW BOS HNL8 HNL LAX BOS CVG MSP DFW9 ORD ORD CVG LAS IAD ATL
10 ONT IAD DTW BOS LAS BOS11 MSP HNL IAH MSP ATL PHL12 ATL MIA IAD MCO DTW LAS13 IAD ATL SFB LAX EWR SFO14 MIA ONT MSP ORD HNL EWR15 JFK JFK EWR EWR LAX DTW16 SFB SFB SFO SFO ORD ORD17 LAX SFB MIA IAH18 ORD ATL MCO MIA19 ONT HNL SFO MCO20 ATL IAH IAH ONT21 HNL MIA SFB LAX22 JFK ONT ONT SFB23 MIA JFK JFK JFK

The Economic Impact of Dividing International Air Service between Houston Airports
53
IAH’s relative performance is especially challenged during peak international arrival times, with wait times regularly exceeding one hour, and with higher average wait times than at the key competing hubs of ATL and DFW. In fact, as shown in Exhibit 39, in 2011, IAH ranked in the bottom three airports in the nation in CBP peak wait times as reported in CBP’s statistics. Furthermore, IAH CBP wait times during peak hours have been increasing in the last three years (Exhibit 40).
Exhibit 39: 2011 CBP Wait‐Time Range by Airport
0 10 20 30 40 50 60 70 80 90
JFKORDIAH
MCOEWRMIALAXSFBIADPHLFLLSFODTWDFWATLBOSSJULASHNLSEAMSPONTCVG
Wait Time (minutes)
Wait time ranges are from averages for minimum to averages for maximum average CBP wait time as reported in the CBP Airport Wait times website at http://apps.cbp.gov/awt/index.asp. Peak times reflect top four one‐hour time periods based on arrival passenger counts processed by CBP.
Wait time average range at peak times Passenger‐weighted average wait times at peak times

The Economic Impact of Dividing International Air Service between Houston Airports
54
Exhibit 40: Three Year IAH Wait‐Time Average and Range at Peak Times
CBP wait times not only affect passengers’ perceptions of an arrival airport’s service performance, but also affect an airport’s overall competitiveness. Clearance time is one of the key elements determining airline connecting schedules. Slower lines require airlines to increase their connecting times and make an airport less attractive to connecting passengers.
As shown in Exhibit 41, IAH’s average CBP wait times were longer than wait times at ATL and DFW and therefore put it at a competitive disadvantage. Frequent international business flyers consider the speed and efficiency of customs processing when they choose their itineraries. ATL’s opening of an additional international terminal in May of this year will further exacerbate this competitive imbalance.
0 10 20 30 40 50 60 70
2011
2010
2009
Wait Time (minutes)
Wait time average range at peak times Passenger-weighted average wait times at peak times
Wait time ranges are from averages for minimum to averages for maximum average CBP wait time as reported in the CBP Airport Wait times wehttp://apps.cbp.gov/awt/index.asp. Peak times reflect top four one-hour time periods based on arrival passenger counts processed by CBP.

The Economic Impact of Dividing International Air Service between Houston Airports
55
Exhibit 41: CBP Wait Times at Key Southern Hubs
c) SubstantialFundingIncreasesofFederalBudgets,IncludingCBP’s,areExtremelyUnlikely,�FurtherStressingCBP’sHoustonFieldOffice
The nation's increasing debt has forced Congress and the Administration to face the harsh budget reality that federal programs must shrink. In fact, the Administration’s proposed FY13 budget has no year‐over‐year increase in CBP Officers and calls for a reduction in overtime. In addition, existing federal budgets will be subject to sequestration and potentially steep cuts in January 2013, and earmarks that were once used by Members of Congress to boost CBP resources/staffing at various international gateways are no longer allowed under House and Senate rules. Given the state of our federal debt, this budget environment is not likely to change anytime soon. It is therefore highly unlikely that increases sufficient to expand CBP resources in Houston to cover a new FIS at Hobby will be secured in the foreseeable future. Even if additional resources are made available, a better and more efficient use of these resources for Houston would be to increase the competitive nature of IAH as a premier international hub by adding the resources/staffing there to reduce wait times as compared to ATL, DFW, and other competitive international gateways.
Facing increased demands with finite resources, CBP will be forced to shift personnel from IAH, the Port of Houston, and other stations and functions in the region in order to manage the new FIS facility at Hobby. This reallocation of resources will further increase wait times at IAH, which already has wait
Wait Time (m
inutes)
Passenger‐weighted annual averages for monthly CBP wait times reported in the CBP Airport Wait Times website at http://apps.cbp.gov/awt/index.asp for flight processing times at primary processing area.
0
10
20
30
40
50
60
70
ATL DFW IAH MIA ATL DFW IAH MIA ATL DFW IAH MIA
2009 2010 2011
Average Wait Times Average Maximum Wait Times

The Economic Impact of Dividing International Air Service between Houston Airports
56
times that are not competitive with other regional international gateways. Resource sharing across airports is inefficient.
7) TheHASHobbyStudyIgnorestheEnvironmentalImpact
In addition to its numerous failings on economic grounds, assumptions, financing, and CBP staffing, the HAS Hobby Study also avoids any discussion of the significant environmental impacts associated with the proposed international service at Hobby as well as the statutorily required analysis of those impacts. This omission of any discussion of the significant environmental impacts of the Proposal substantially inflates the Proposal’s benefits to the City and its residents while also misleading the public about its true costs and impacts. Those impacts with associated costs include:
• The proposed $100‐million development, as depicted on the HAS website, would require substantial revisions to the Hobby Airport Layout Plan.
• The large number of additional aircraft operations proposed by Southwest would bring increased aircraft noise and emissions to noise‐sensitive areas in the vicinity of Hobby, not to mention increased automobile emissions associated with the hundreds of thousands of new passengers being projected to access the terminal.
• The project is not yet completely defined, yet Mr. Diaz notes that runway length at Hobby is a limiting factor for international operations proposed there. The current Master Plan includes several taxiway modifications as well as a runway extension of 2,400 feet and another runway extension of over 3,000 feet.
These impacts and the cumulative effects of the projects listed (plus those which the City of Houston and Southwest have not yet revealed) mean that the projects cannot be funded and built unless and until the Federal Aviation Administration (FAA) prepares an environmental analysis. The FAA makes the determination whether an environmental impact study (EIS) or other environmental review will be required for such projects. If the FAA determines an EIS is required under applicable statutory standards, it will include full public participation and consultation of other agencies with jurisdiction to fully inform the public of the proposal’s full, significant impacts on the environment around Houston Hobby.
In addition to an environmental review, coordination with federal agencies which have jurisdiction beyond the FAA is mandated by other federal laws, including those designed to protect areas containing natural surface water drainages, resources of potential national historical significance (e.g., Native American cultural features or artifacts), and endangered species. There is no evidence that HAS has considered the potential impact of the proposed projects on any of these statutorily protected categories.

The Economic Impact of Dividing International Air Service between Houston Airports
57
8) Conclusions
Mr. Diaz proposes that the City make a change in aviation policy that will forever alter Houston’s economic future. He bases his recommendation on the HAS Hobby Study, which reaches its erroneous conclusions on air passenger service and jobs on the basis of fundamentally flawed assumptions, and also fails entirely to account for the Proposal’s service, financial, environmental and CBP‐related impacts on the City, its residents, and its passengers. The HAS Hobby Study’s analytical flaws and incorrect assumptions render it completely unreliable as a basis for the decision to change 40 years of policy that IAH is the City’s sole international airport.
The Proposal would:
• Harm IAH and the City’s position as a premier international gateway, making it less competitive with DFW, ATL, and other unified international gateways;
• Result in a net loss to the City of 3,700 jobs and $295 million in gross regional product per year; • Be paid for by HAS debt to be repaid by a 50% increase in PFCs that would be borne by all
passengers using Hobby Airport; • Exacerbate the already long CBP processing wait times for passengers at IAH, further degrading
its position as an international gateway vis‐à‐vis competing international gateway hubs such as DFW and ATL;
• Have significant environmental impacts that the HAS Hobby Study has ignored; and • Undermine $1 billion in investments United has made at IAH since 1996 and another $700
million it just announced in good‐faith reliance on HAS maintaining its policy of keeping IAH the sole international airport.
The United Study is an effort to help ensure that, when the Administration and City Council make this seminal decision, they are able to make it with an understanding of the facts about the real impact that their decision will have on Houston’s future.

The Economic Impact of Dividing International Air Service between Houston Airports
58
AppendixA
The Proposed Growth Missions for Southwest at Hobby are Not Viable Under the Assumptions Presented
The Southwest growth markets as presented in the HAS Hobby Study are expected to lose $76 million per year based on the assumptions presented in that study and publicly available financial information on Southwest Airlines (adjusted to include ancillary revenue and cost premiums on international flights). These results imply that much of this growth will not occur and, at the very least, Southwest will be unable to lower fares by the amounts assumed in the HAS Hobby Study.
Exhibit 42: Expected Southwest Airlines’ Loss Under the HAS Assumptions
Source: WN FY 2011 financials as reported in10K filing; HAS Hobby Study.
MarketStage Length
CASMDaily
DeparturesLoad Factor
% Local Fare Pax Revenue Other Revenue Total Revenue Total Expense Profit
Bogota 2,206 8.58 1.00 67% 67% 133 9,102,520 570,182 9,672,702 19,305,080 (9,632,378)Cancun 793 12.45 4.00 74% 41% 108 32,802,732 2,054,762 34,857,494 40,283,929 (5,426,435)Caracas 2,245 9.59 1.00 70% 76% 135 9,713,242 608,437 10,321,679 21,985,960 (11,664,281)Guadalajara 805 12.65 1.00 40% 40% 108 4,351,104 272,553 4,623,657 10,384,030 (5,760,373)Liberia 1,457 9.08 1.00 63% 58% 122 7,858,996 492,287 8,351,283 13,508,230 (5,156,947)Mexico City 744 13.44 4.00 73% 51% 106 31,448,080 1,969,907 33,417,987 40,798,345 (7,380,358)Monterrey 398 18.43 2.00 30% 62% 93 5,638,962 353,224 5,992,186 14,962,166 (8,969,979)Puerto Vallarta 877 12.20 1.00 68% 33% 110 7,573,940 474,431 8,048,371 10,919,702 (2,871,331)San Jose 1,533 9.42 1.00 72% 52% 123 9,077,031 568,585 9,645,616 14,735,424 (5,089,808)San Jose Cabo 998 11.29 3.00 53% 55% 113 12,248,861 767,268 13,016,129 23,004,011 (9,987,881)San Salvador 1,170 10.67 1.00 66% 69% 117 7,866,144 492,735 8,358,879 12,736,057 (4,377,178)
Total 1,012 11.47 20.00 65% 52% 112 137,681,612 8,624,372 146,305,984 222,622,934 (76,316,950)

The Economic Impact of Dividing International Air Service between Houston Airports
59
AppendixB
United’s Houston Impact Study’s Passenger Volume Estimates
This appendix elaborates the United Airlines estimates for both the passenger impacts at Hobby and at IAH.63 The output below is based on applying the hypothetical schedule from the HAS Hobby Study to United’s ordinary course QSI‐based passenger forecast and share models.
Exhibit 43: Expected Southwest Airlines’ Loss Under the HAS Assumptions
63 The data sums from left to right: Houston Resident traveler, Houston Visitor traveler, and Connecting (transit) traveler. Note the data are in (Passengers per Day Each Way) * 2 * 365, so for the number of visitors staying in Houston that drive local expenditure, you would need to divide by 2, whereas for the number of Transit passengers you would not divide by 2, since they connect through the airport twice, once in each direction.
United Study
Excludes Mexican LCCs
Houston ImpactsHouston Resident
Houston VisitorTransit
PassengerTotal
Passengers
Step 1 : WN Adds / No UA ReactionLocal Market Stimulation to HOU 27,391 7,516 0 34,908Shift from Other Gateway Cities 61,032 16,605 156,936 234,573Diversion from IAH 191,707 62,877 463,601 718,184Net Gain / (Loss) at HOU 280,131 86,998 620,537 987,665
Local Market Stimulation to IAH 40,621 12,075 0 52,696Less Diversion from IAH (191,707) (62,877) (463,601) (718,184)Net Gain / (Loss) at IAH (151,085) (50,802) (463,601) (665,489)
Net Gain / (Loss) for Houston 129,045 36,196 156,936 322,176
Step 2 : UA Reduces IAH FlyingLess Diversion from IAH (389,798) (239,565) (1,492,856) (2,122,220)Net Gain / (Loss) for Houston (260,753) (203,370) (1,335,921) (1,800,043)
Step 3 : UA Forgoes Future GrowthLess Diversion from IAH (150,695) (79,872) (400,061) (630,628)Net Gain / (Loss) for Houston (411,448) (283,242) (1,735,981) (2,430,671)
Note: Forecast is for WN only and excludes Mexican LCCs

The Economic Impact of Dividing International Air Service between Houston Airports
60
AppendixC
Details of United’s Total Economic Impact Analysis
Assumptions and Inputs
As explained in the report, Dr. Smith’s Analysis of the total economic impact of new international service at Hobby begins with a set of assumptions largely provided by United. Dr. Smith’s Analysis excludes the impact of the FIS construction at Hobby and the loss of construction at IAH resulting from failure to initiate phases 2 and 3 of planned IAH expansion. Dr. Smith used the following assumptions regarding the timing of events:
• Year 1 o United eliminates unprofitable flying at IAH
• Years 2‐4 o Southwest begins flying new international routes at Hobby o Price competition temporarily stimulates traffic o United cancels more flights.
• Years 4‐10 o Steady state period o United fails to add planned expansion flights
Changes in passenger volume were estimated by United. Appendix B provides details.
Visitors’ spending in Houston was assumed to be $436.00 per trip on average and connecting passengers spending was assumed to be $11.29 per trip on average. Spending by residents is assumed to be zero, which obviously excludes minor expenditures such as parking.
While the total impact to the City would include both the impact from the change in operations and the impact from the change in construction, the results in Section 4 are for the “steady‐state” (Years 4‐10) without the construction impact. Results of both are shown below. The construction includes the positive impact of the construction of the new facilities at Hobby (which is complete at the end of Year 1) and the negative impact if failing the initiate phases 2 and 3 of the planned IAH expansion construction. This is referred to as the “Operating Phase Results”. The impact including construction is also shown below.
Operating Phase Results
The operating phase results shown in Exhibit 44 represent estimates of the steady‐state equilibrium impact of new international service at Hobby, excluding the impact of changes in construction activity. The economic impact results cited in the main report correspond to the operating phase.
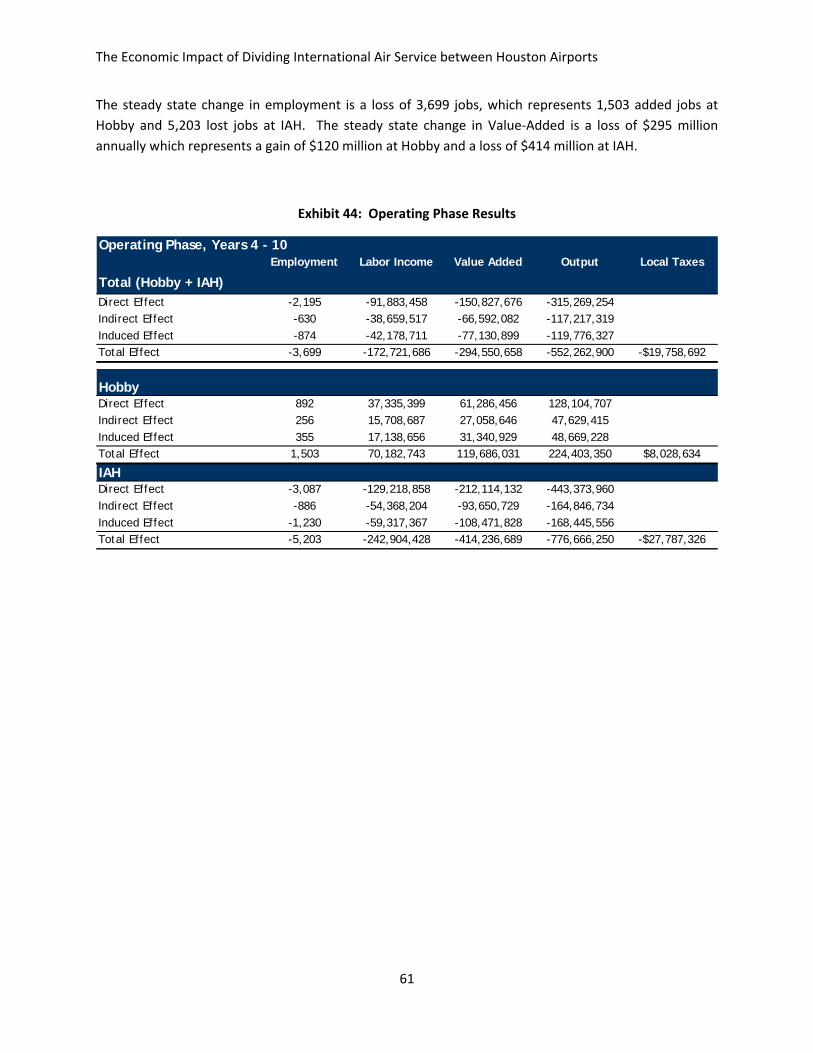
The Economic Impact of Dividing International Air Service between Houston Airports
61
The steady state change in employment is a loss of 3,699 jobs, which represents 1,503 added jobs at Hobby and 5,203 lost jobs at IAH. The steady state change in Value‐Added is a loss of $295 million annually which represents a gain of $120 million at Hobby and a loss of $414 million at IAH.
Exhibit 44: Operating Phase Results
Operating Phase, Years 4 - 10Employment Labor Income Value Added Output Local Taxes
Total (Hobby + IAH)Direct Effect -2,195 -91,883,458 -150,827,676 -315,269,254Indirect Effect -630 -38,659,517 -66,592,082 -117,217,319Induced Effect -874 -42,178,711 -77,130,899 -119,776,327Total Effect -3,699 -172,721,686 -294,550,658 -552,262,900 -$19,758,692
HobbyDirect Effect 892 37,335,399 61,286,456 128,104,707Indirect Effect 256 15,708,687 27,058,646 47,629,415Induced Effect 355 17,138,656 31,340,929 48,669,228Total Effect 1,503 70,182,743 119,686,031 224,403,350 $8,028,634
IAHDirect Effect -3,087 -129,218,858 -212,114,132 -443,373,960Indirect Effect -886 -54,368,204 -93,650,729 -164,846,734Induced Effect -1,230 -59,317,367 -108,471,828 -168,445,556Total Effect -5,203 -242,904,428 -414,236,689 -776,666,250 -$27,787,326