UNITED STATES TARIFF COMMISSION HATTERS' FUR Report to … › publications › 701_731 ›...
32
UNITED STATES TARIFF COMMISSION HATTERS' FUR Report to the President on Investigation No. 7-115 (TEA-1-3) Under Section 301(b) of the Trade Expansion Act of 1962 TC Publication 82 Washington, D.C. March 1963
Transcript of UNITED STATES TARIFF COMMISSION HATTERS' FUR Report to … › publications › 701_731 ›...
UNITED STATES TARIFF COMMISSION
HATTERS' FUR
Report to the President on Investigation No. 7-115 (TEA-1-3) Under Section 301(b) of the Trade Expansion Act of 1962
TC Publication 82
Washington, D.C. March 1963

UNITED STATES TARIFF .COMMISSION
BEN DORFMAN, Chairman
JOSEPH E. TALBOT
WALTER R. SCHREIBER
GLENN W. SUTTON
WILLIAM B« DOWLINO
JAMES W. CULLiTON
BONN N. BENT/ Secretary
Addresa a l l communications to
UNITED STATES TARIFF COMMISSION
Washington 25, D.C.
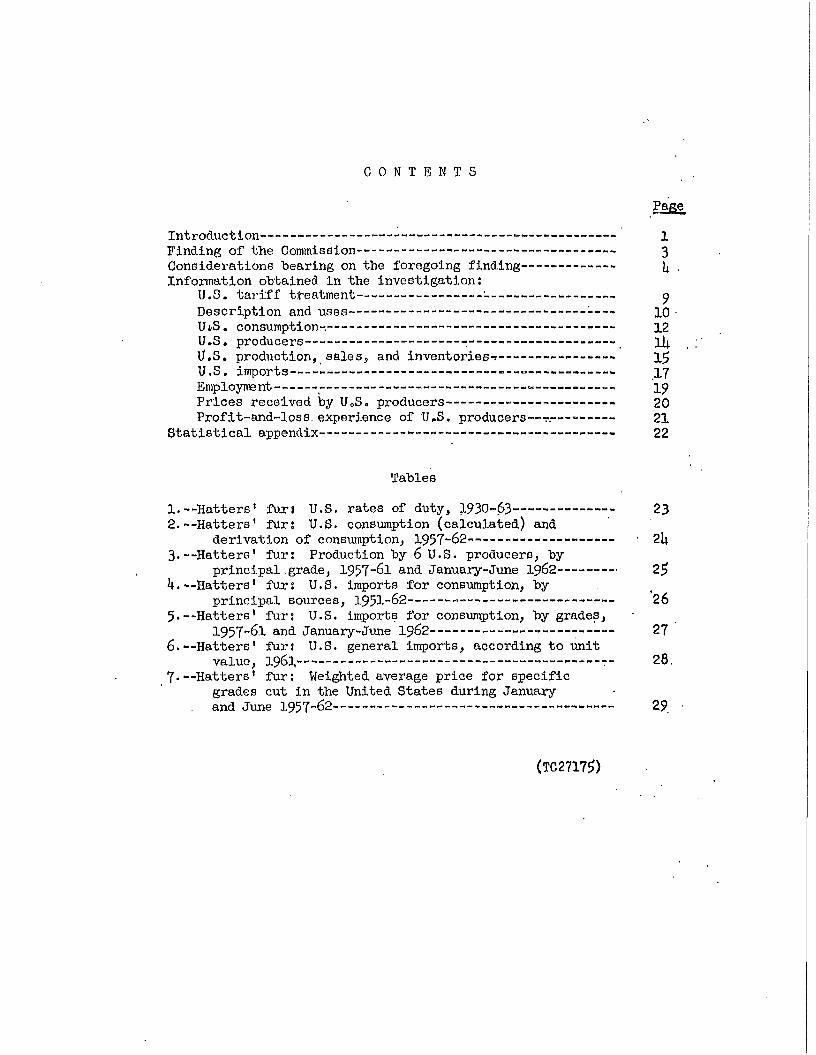
C O N T E N T S
PifiSL
I n t r o d u c t i o n • 1 Finding of the Commission 3 Considerations bearing on the foregoing f i n d i n g ^ . Information obtained i n the investigations
U.S. t a r i f f treatment : o Description and uses- • '• 10 • UtS. consumption-. 12 U.S. producers , U.S. production, sales, and inventories-7 l j j U.S. imports •—= 17 Employment _ • — ] _ o Prices received by UoS. producers 20 Prof it-and-loss. experience of U.S. p r o d u c e r s — - — 21
S t a t i s t i c a l appendix • 22
Tables
1. — H a t t e r s ' furs U.S. rates of duty, 1930-63 -— 23 2. — H a t t e r s ' furs U.S. consumption (calculated) and
de r i v a t i o n of consumption, 1957-62 • 2I4. 3. --Hatters' furs Production by 6 U.S. producers, by
p r i n c i p a l .grade, 1957-61 and January-June 1962 2$ ^.--Hatters' furs U.S. imports f o r consumption, by
p r i n c i p a l sources, 1951-62 • 26 5. --Hatters' furs U.S. imports f o r consumption, by grades,
1957-61 and January-June 1962 — — ——— 27 ' 6. --Hatters' furs U.S. general Imports, according t o u n i t
value, 1961 - — 28. 7. --Hatters' f u r : Weighted average price f o r spe c i f i c
grades cut i n the United States during January and June 1957-62— 29.
(TC 27175")
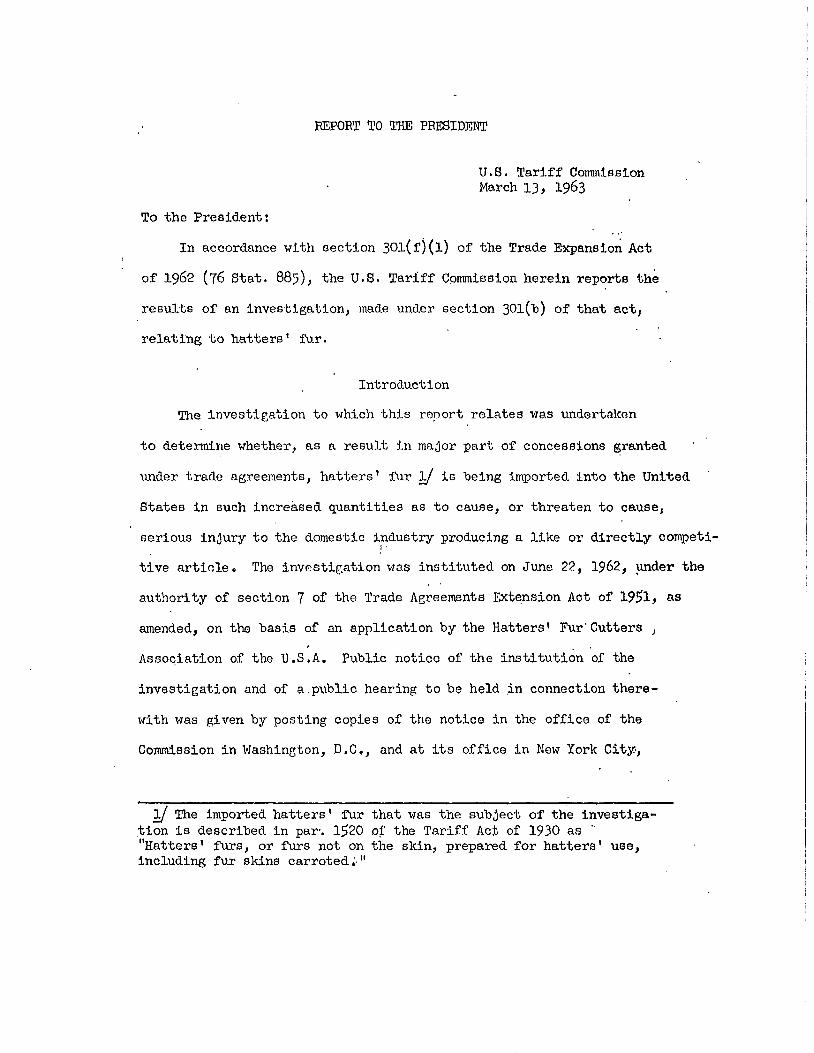
REPORT TO THE PRESIDENT
U.S. T a r i f f Commission March 13 , 1963
To the President:
I n accordance w i t h Bectlon 3 0 1 ( f ) ( l ) of the Trade Expansion Act
of 1962 (76 Stat. 885), the U.S. T a r i f f Cpmmission herein reports the
resu l t s of an i n v e s t i g a t i o n , made under section 30l(b) of that act,
r e l a t i n g t o h a t t e r s ' f u r .
I n t r o d u c t i o n
The i n v e s t i g a t i o n t o which t h i s report relates was undertaken
t o determine whether, as a r e s u l t i n major part of concessions granted
under trade agreements, h a t t e r s ' f u r l / i s "being imported i n t o the United
States i n Buch increased qua n t i t i e s as t o cause, or threaten t o cause,
serious i n j u r y t o the domestic industry producing a l i k e or d i r e c t l y competi
t i v e a r t i c l e . The i n v e s t i g a t i o n was i n s t i t u t e d on June 22, 1962, under the
a u t h o r i t y of section 7 of the Trade Agreements Extension Act of 1951, as
amended, on the basis of an appl i c a t i o n by the Hatters' Fur'Cutters ,
Association of the U.S.A. Public notice of the i n s t i t u t i o n of the
in v e s t i g a t i o n and of a.public hearing t o be held i n connection there
w i t h was given by posting copies of the notice i n the o f f i c e of the
Commission i n Washington, D.C, and at i t s o f f i c e l n New York C i t y ,
l / The imported h a t t e r s ' f u r t h a t was the subject of the investigat i o n i s described i n par. l £ 2 0 D f the T a r i f f Act of 1930 as " "Hatters' f u r s , or furs not on the skin, prepared f o r h a t t e r s ' use, including f u r skins c a r r o t e d ; "
2
and by publishing the notice i n the Federal Register (27 F.R. 6107)
and i n the June 28, 1962 issue-of Treasury Decisions.
The public.hearing was held on September 11, 1962, and a l l i n t e r e s t e d
p a r t i e s were afforded opportunity t o be present, t o produce evidence,
and t o be heard. A t r a n s c r i p t of the hearing and formal b r i e f s sub
m i t t e d by i n t e r e s t e d p a r t i e s i n connection w i t h the i n v e s t i g a t i o n are
attached, l /
On October 11, 1962, the Trade Expansion Act of 1962 was signed
i n t o law. On October 12 the Commission issued a notice t h a t , i n accord
ance w i t h the provisions of section 257(e)(3) o f tha t act, the Investiga
t i o n r e l a t i n g t o h a t t e r s ' f u r was being continued under section 301(b)
of the act. Thi6 notice was published i n the Federal Register (27 F.R.
10139) a n d I n the October 18, I962, issue of Treasury Decisions. No
a d d i t i o n a l hearing was scheduled, but the Commission's notice advised
i n t e r e s t e d p a r t i e s t h a t they might request an a d d i t i o n a l hearing w i t h i n
20 days a f t e r the date' o f p u b l i c a t i o n of the notice i n the Federal
Register. Interested p a r t i e s were advised also that they might submit
w r i t t e n information t o supplement the Information presented at the
hearing t h a t was held on September 11. No requests f o r an a d d i t i o n a l
hearing were received and no such hearing was held.
I n a d d i t i o n t o tha t obtained at the hearing i n t h i s
i n v e s t i g a t i o n , the Commission obtained information from I t s f i l e s ,
from other agencies of the U.S. Government, through fieldwork by
l / T r anscript and b r i e f s attached t o the o r i g i n a l report sent t o the President.
3
members of the Commission's s t a f f , and from responses t o questionnaires
8<ettt t o domestic producers and importers.
Finding of the Commission
On the basis of i t s i n v e s t i g a t i o n the Commission unanimously
finds t h a t hatters' f u r i s not, as a r e s u l t i n major part of conces
sions granted under trade agreements, being imported i n such increased
quantities as t o cause, or threaten t o cause, serious i n j u r y t o the
domestic industry producing a l i k e or d i r e c t l y competitive a r t i c l e .
h
Considerations Bearing on the Foregoing Finding
Before the T a r i f f Commission may make an a f f i r m a t i v e f i n d i n g
under the provisions of section 301(b) of the Trade Expansion Act of
1962, i t must determine ( l ) t h a t imports of the a r t i c l e i n question
are entering the United States i n increased q u a n t i t i e s , (2) t h a t such
increased imports are a t t r i b u t a b l e " i n major p a r t " t o trade-agreement
concessions, and (3) t h a t the increased Imports are "the major f a c t o r "
i n causing, or threatening t o cause, serious i n j u r y t o the domestic
In d u s t r y concerned. I f the Commission finds i n the negative w i t h re
spect t o any one of these three r e q u i s i t e s , i t i s foreclosed from
making an a f f i r m a t i v e f i n d i n g f o r the Industry.
I n the i n s t a n t case the Commission has determined t h a t h a t t e r s ' f u r
i s being 'imported i n t o the United States i n increased q u a n t i t i e s , but
th a t such.increased imports are not the major f a c t o r causing or threatening
t o cause d i f f i c u l t i e s f o r the domestic Industry. I n view of that deter
mination, the Commission i s not obliged t o consider whether the increased .'•
Imports of h a t t e r s ' f u r are a t t r i b u t a b l e l n major part t o trade-agreement
concessions.
U.S. imports of ha t t e r s ' f u r rose from 180,000 pounds l n i960 t o
219,000 pounds l n 1961 and to 2lj0,000 pounds l n 1962. These data are
s u f f i c i e n t t o show tha t such f u r i s being imported i n Increased quantities
w i t h i n the meaning of the Trade Expansion Act.

5
Various forces have contributed to the r i s e i n imports i n recent
years. Restoration of the trade-agreement concession l n September
1958 l / and an increase i n demand f o r hat t e r s ' f u r i n 1959 resulted i n
an increase i n Imports from 10it,000 pounds i n 1958 t o 21*6,000 pounds
i n 1959. Imports declined to 180,000 pounds i n i960, however,•indicating
that other forces i n the aggregate were more important than the duty
reduction i n governing the volume of imports, at least i n i960. Although,
as shown above, imports rose s i g n i f i c a n t l y a f t e r i960, the volume i n 1962
was s t i l l below th a t -in 1959.
Following the r e s t o r a t i o n of the trade-agreement concession, which
Involved a greater duty reduction on low-grade f u r s than on other
grades, 2j there was a marked increase i n the r e l a t i v e Importance of low-
grade f u r s i n the imports. This s h i f t i n the composition of Imports i s
a t t r i b u t e d not only to the change i n Import duty, but also to a s h i f t i n
recent years by U.S. hat manufacturers t o a greater use of the cheaper
grades of f u r , both domestic and Imported. The s h i f t to the cheaper grades
was made possible by technological improvements i n blending and shrinking
and by the stepped-up promotion of lower q u a l i t y hats f o r men.
1/ As shown l a t e r i n t h i s report, the concession rate of 15 percent ad valorem was modified by escape-clause action t o provide a rate of duty of U7-1/2 cents per pound, but not less that 15 percent nor more than 35 percent ad valorem, e f f e c t i v e Feb. 9, 1952. The, concession rate of l 5 percent ad valorem was restored, e f f e c t i v e Sept. Ik, 1958 (table 1 i n the appendix).
2/ The r e s t o r a t i o n of the concession involved no reduction i n the duty on~hatters' f u r valued at $3.16-2/3 or more per pound. The rate on t h i s category of f u r has remained unchanged at 15 percent ad valorem since Jan. 1, 19U8. •

6
I t i s apparent from the foregoing that the f a c t o r s c o n t r i b u t i n g t o
the r i s e i n imports of h a t t e r s 1 ' f u r are so closely i n t e r r e l a t e d that
separate evaluation would be extremely d i f f i c u l t . Such evaluation i s •»
unnecessary, however, i n view of the Commission's determination that i n
creased imports are not the major factor causing the current d i f f i c u l t i e s
of the hatt e r s ' f u r industry.
In I960 the T a r i f f Commission conducted an escape-clause i n v e s t i
gation of h a t t e r s ' f u r and found unanimously th a t t h i s f u r was not being
imported l n such increased q u a n t i t i e s as to cause or threaten serious
i n j u r y to the domestic h a t t e r s ' f u r industry. 1/ The l a t e s t year f o r which
f u l l - y e a r import s t a t i s t i c s were available at the time of the Commission's
f i n d i n g was 1959. In t h a t year imports of ha t t e r s ' f u r t o t a l e d 21*6,000
pounds. Imports i n 1962, however, t o t a l e d 2ljO,OO0 pounds, or 6,000 pounds
less than i n 1959. Meanwhile, the use o f domestically cut hatt e r s ' f u r f e l l
by 1*51*,000 pounds from 2,177,000 pounds i n 1959 to 1,723,000 pounds i n 1962..
A s i m i l a r comparison may be made using i960 as the base year. From i960 t o
1962, imports rose by 60,000 poundB while the use of domestically cut f u r
1/ k report of the Commission's f i n d i n g was issued on Oct. 7, I960 ( I n v e s t i g a t i o n No. 7-89).
7
declined by 338*000 pounds. These data Bhow conclusively t h a t other '
factors were much more important than increased imports i n causing the
indicated decline i n U.S. production of hatters'- f u r since e i t h e r
1959 or i960.
The, hat t e r s ' f u r industry's d i f f i c u l t i e s stem predominately from
the continuing decline i n the consumption of hatters' f u r . The con
sumption of ha t t e r s ' f u r i n 1962 was less t h a t h a l f the annual consump
t i o n a decade or so e a r l i e r . Annual consumption averaged U.3 m i l l i o n
pounds i n 1950-51, 2.3 m i l l i o n pounds i n 1959-60, and 1.9 m i l l i o n pounds
i n 1961-62. The decline r e f l e c t s the substantial drop i n the U. S.
output of f u r f e l t hats, which l n t u r n has resulted from various causes,
including the increasing acceptance of "hatlessness," s t y l e trends i n
women's hats t h a t encourage the use of materials other than h a t t e r s '
f u r , and the s u b s t i t u t i o n f o r hats of other types of headwear, such as
scarves, hoods, and caps. The outstanding cause of any i n j u r y t o the
domestic h a t t e r s ' f u r industry i s , therefore, the declining demand f o r

8
the industry's product. The increase i n imports i s c e r t a i n l y not the
major factor i n causing i n j u r y or the threat thereof.
Respectfully submitted.
Ben Dorfnian, Chprman
. Talbot, Commissioner
Walter R. Schreiber, Commissioner
CO.
Glenn W. Sutton, Commissioner •
William E. Dowling, Commissiett©*
.es W. C u l l i t o n , Commissioner

9
Information Obtained i n the I n v e s t i g a t i o n '
U.S. t a r i f f treatment
Hatters' f u r i s dutiable under paragraph 15>20 of the T a r i f f Act of
1930. The rate of duty o r i g i n a l l y established i n the T a r i f f Act of 1930
was 35 percent ad valorem (table 1 ) . Pursuant t o a concession granted
i n the b i l a t e r a l trade agreement with the Belgo-Luxembourg Economic
Union, tlie duty was reduced to 27-1/2 percent, e f f e c t i v e May 1, 1935*
and pursuant t o a concession granted i n the General-Agreement on T a r i f f s
and Trade (OATT), the rate was f u r t h e r reduced t o 15 percent ad valorem,
e f f e c t i v e January 1, 19h8.
As a r e s u l t of an "escape clause" i n v e s t i g a t i o n completed under sec
t i o n 7 of the Trade Agreements Extension Act of 1951, the GATT concession
was modified t o provide f o r a rate of duty of u7-l /2 cents per pound but
not less than 15 percent or more than 35 percent ad valorem, which became
the applicable rate on February 9, 1952. On January 2li, 1958, a f t e r a
review of developments during the preceding year under paragraph-1 of
Executive Order lOliOl-, the Commission i n s t i t u t e d a formal i n v e s t i g a t i o n
concerning hatters' f u r under paragraph 2 of the Order. On June 26, 1958,
i t reported t o the President i t s f i n d i n g t h a t the 1952 modification of the
t a r i f f concession was no longer necessary. By proclamation e f f e c t i v e on
September Ih, 1958, the President terminated the modification of. the t a r i f f
concession and thus restored the o r i g i n a l GATT concession and the duty of
15 percent ad valorem on a l l hatters' f u r .
On June 1, I960, the Hatters' Fur Cutters Association of the U.S.A.
applied f o r a nevr escape-clause i n v e s t i g a t i o n with respect t o hatters' f u r
under section 7 of the Trade Agreements Extension Act of 1951» as amended.

10
The Commission i n s t i t u t e d the i n v e s t i g a t i o n on June 21, I960, I n a
rep o r t published October 7, I960, the Commission unanimously found t h a t
h a t t e r s ' f u r was not being imported i n such increased q u a n t i t i e s as to
cause or threaten serious I n j u r y to the domestic industry concerned, 1/
On June U, 1962, the Association f i l e d the a p p l i c a t i o n which resulted i n
the current, i n v e s t i g a t i o n
Description and uses
Hatters' f u r , which i s used I n the production o f f u r f e l t hats,,
i s the s o f t underfur cut c h i e f l y from the raw skins of rabbits and
hares, and t o a small extent from the skinB or pieces of skins of
beavers and other fur-bearing animals. I n the manufacturing oper
a t i o n a chemical s o l u t i o n i s applied t o the f u r while B t i l l on the
s k i n t o give the f u r f i b e r s f e l t i n g properties j t h i s process i s known
as c a r r o t i n g . The f e l t i n g property of the f u r i s the d i s t i n g u i s h i n g
c h a r a c t e r i s t i c of h a t t e r s ' f u r . Carroted f u r i s used only i n the
manufacture of hats.
Hatters' f u r 1B produced i n several grades; the grades and the
degrees o f q u a l i t y w i t h i n them are determined c h i e f l y by kind, o r i g i n ,
and condition of the skins from which the f u r i s cut, and the season
of the year l n which the skins are taken from the animals. V i r t u a l l y
a l l of the h a t t e r s ' f u r produced i n the United States i s cut from
Imported f u r skins—about 65 percent from the skins of tame ( c h i e f l y
French) rabbits and the remainder from the skins of w i l d ( c h i e f l y
A u s t r a l i a n ) rabbits and from hare skins.
The p r i n c i p a l grades of f u r cut i n the United States from the
skins o f tame rabbits are Grey E n t i r e , Grey En t i r e Special, and Grey
l / Report on i n v e s t i g a t i o n Mo. 7-09. '
11
Pure' Backs. The c h i e f grades cut from the skins of w i l d animals are
Best Coney Back (BCB) Unpulled, BCB E n t i r e , and No. 1 Hare Double King
( H D R ) . Of these, the most important grades are the grey and the dark
furs known as Grey Entire and BCB E n t i r e , Grey En t i r e i s a low-grade
ha t t e r s ' f u r cut from the skins of European r a b b i t s . BCB Entire i s a
good-intermediate grade cut c h i e f l y from the skins of Australian
r a b b i t s .
Although imported hatters' f u r and domestic h a t t e r s ' f u r are cut
from the Bkins of the same kinds of animals and consiBt of roughly
s i m i l a r grades, the grades of Imported f u r are designated by d i f f e r e n t
names from those used t o designate the domestic grades." For example,
the low-grade f u r , P e t i t Bon, produced i n Europe i s cut from the same
kind of skins and i s e s s e n t i a l l y the same as the domestic Grey E n t i r e .
The p r i n c i p a l imported grades are P e t i t Bon, Pure Back, White, and-
Fawn.
An important byproduct of the hatterB 1 fur' industry i s blown f u r ,
which i s made from f u r pieces, d i r t y or greasy f u r , and from low-grade
skins not suitable f o r cut f u r . Blown f u r 1B blended w i t h the lower
grades of cut f u r by the hat manufacturers and U6ed i n the production
of hats. A lesB important byproduct i s known as short stock; i t does
not f e l t but may be used as a f i l l e r i n the manufacture of hats,
To date, no other raw material has been found t h a t has the
peculiar f e l t i n g and shrinking q u a l i t i e s t h a t are required i n the
manufacture of f u r f e l t hats.

12
U.S> consumption
U.S. consumption of n a t t e r s ' f u r has declined sharply i n the
period since 1950. Such consumption i n 1962 was less than h a l f the
annual consumption 10 years e a r l i e r * The chief causes of the decline
have "been the substantial drop i n the domestic production of f u r f e l t
hats brought about by the increasing acceptance of "hatlessness,"
the s t y l e trends t o materials other than hatt e r s ' f u r f o r women's
hats, and the s u b s t i t u t i o n of other types of headwear f o r f u r f e l t
hats.
U.S. consumption of h a t t e r s ' f u r , calculated from the domestic
production o f f u r f e l t hats, l / amounted t o about 2.2 m i l l i o n pounds
i n I957> Increased to about '2.k m i l l i o n pounds i n 1959, then declined
t o about 2.2 m i l l i o n pounds i n i960, and t o about 1.9 m i l l i o n pounds i n both
1961 and i n 1962, Over these years the share of consumption supplied
by imports increased s t e a d i l y from k.3 percent i n 1957 t o 11.5 percent
i n 1961 and t o 12.2 percent l n 1962 (table 2 ) .
According t o data supplied t o the Commission by the domestic
producers and importers, the lower and cheaper grades of ha t t e r s ' f u r - -
e s p e c i a l l y P e t i t Bon, Grey E n t i r e , and BCB Unpulled—have supplied since
.1957 a n increasing share o f the t o t a l U.S. consumption o f ha t t e r s ' f u r .
By c a r e f u l blending and w i t h improvements l n shrinking, the cheaper
grades o f f u r , which were formerly used p r i n c i p a l l y i n the manufacture
of women's hats, have become more acceptable f o r use i n the manufacture
o f men's f u r f e l t hats; Increasing quantities of these grades have been
l / See table 2 f o r method of ca l c u l a t i o n .
13
consumed I n an attempt t o increase sales by lowering the price l e v e l
of men's hats. Aggregate consumption of the three above-mentioned
low-priced grades of hatters' f u r accounted f o r 3^ percent of t o t a l
U.S. consumption of ha t t e r s ' f u r i n 1957; 37 percent i n 1958-59;
k2 percent i n I960; 50 percent i n 196I; and kg percent i n January- •
June 1962. The share of consumption of these grades supplied by
imports increased from about 6 percent i n 1957 t o I * * percent i n 1959*'
and t o l6 percent i n January-June 1962.
The Bhare of annual U.S. consumption of ha t t e r s ' f u r accounted
f o r by BCB E n t i r e , a good-intermediate grade, increased from about
20 percent i n 1957 t o 31 percent i n 1958, then declined t o 28 percent
i n 1959 a n d t o 13 percent i n I96IJ i t was 16 percent i n January-June
I962. Consumption of White, Mottled, and Fawn f u r s , as w e l l as t h a t
of special or higher grades, has decreased s t e a d i l y i n recent years'
because of the styl e trend i n women's hats away from white and past e l
shades. The r a t i o o f the consumption of these types t o the t o t a l
annual consumption declined from 16 percent i n 1957 t o 5 percent i n
1961 and-in January-June 1962. Consumption of hare's f u r , another
high-grade h a t t e r s ' f u r , has been i r r e g u l a r ; i n 1957-61 the r a t i o o f
hare's f u r t o t o t a l U.S. consumption of ha t t e r s ' f u r ranged between
6 percent and 11 percent.

Hi
U.S. producers •
The number of domestic concerns producing h a t t e r s ' f u r has
declined i n recent years. I n June 1958 there were 20 t o 25
• producing f i r m s , some o f which' operated i n t e r m i t t e n t l y . :' By i960
the number had declined t o about 15; since then 2 major and 3 small
producers.have discontinued operations. I n 1962 the domestic f u r '[
c u t t i n g . industry, located p r i n c i p a l l y i n the New York C i t y area
• and Connecticut, was comprised of s i x major.firms and several small
f i r m s which cut f u r only I n t e r m i t t e n t l y .
The s i x concerns t h a t supplied usable data to the Commission
operated s i x establishments which accounted f o r about 1;wo-thirdB of
t o t a l U.S. production o f h a t t e r s ' f u r i n 1957 and f o r more than nine-
tenths i n 1961. Four o f the s i x establishments produce h a t t e r s ' f u r
f o r sale t o hat manufacturers,and two establishments cut f u r on a *
commission basis from skins owned by others. The dommisslon cutters
receive f u r skins from, importers, dealers, and hat manufacturers;
they cut and de l i v e r the f i n i s h e d h a t t e r s ' f u r e i t h e r t o t h e i r o r i g i n a l
customer or as i n s t r u c t e d by him.
The machinery and methods used i n the hatters* f u r - c u t t i n g
• i n d u s t r y are not new, but are not i n e f f i c i e n t . The production o f
h a t t e r s ' f u r requires a number of hand operations and various gradlngs
which do not .lend themselves t o automation.

15
U.S. production, sales, and inventories
No o f f i c i a l s t a t i s t i c s on annual U.S. production of hatters' f u r
are available. 1/ A close approximation.of such production, however,
may be derived by calcu l a t i n g the annual consumption of ha t t e r s 1 f u r
on.the basis of the domestic output of f u r f e l t hats, and deducting
.from t h a t computed f i g u r e the imports of hatte r s ' f u r . On thlB basis,
annual production i s estimated t o have amounted to about 2,1 m i l l i o n
pounds i n 1957-60) and declined thereafter t o 1.7 m i l l i o n pounds both
i n 1961 and I n 1962 (table 2) .
The aggregate production'by the six major domestic establishments
th a t cut f u r throughout 1957-61 increased from l . l t m i l l i o n pounds i n
1957 t o 2.1 m i l l i o n pounds i n 1959, then declined t o 1.7 m i l l i o n pounds
i n I960, and to 1.6 .million pounds i n I96I; i t then rose t o 1.7 m i l l i o n
pounds i n 1962.
The production of hatters' f u r by the six.major producers i n 1957-61 '
and January-June 1962 i s shown, by. grade, i n table 3, As the lower
grade f u r s have accounted l n recent years f o r an increasing share of •
consumption of hatters' f u r by the hat manufacturers, the domestic •
producers of hatters' f u r have accordingly s h i f t e d l n an increasing measure
to the production of lower grade f u r s . Production of Grey Entire and BCB
Unpulled rose from 33 percent of the t o t a l i n 1957 to kh percent i n 196l.
The- share of White, Mottled, and Fawn decreased from 15 percent of the
t o t a l i n 1957 t o 5 percent i n 1961, while t h a t of BCB Entire and hares'
f u r was i r r e g u l a r ,
1/ The Bureau of the Census collected data on domestic production of hatters' f u r f o r 1958, but these data do not include the output by small producers.
16
Sales data on hatters' f u r were furnished t o the Commission by the
fou r establishments t h a t produced f u r f o r sale. As indicated-by these
data,'sales of domestically produced hatters' f u r followed a trend
• s i m i l a r t o t h a t of production—the t o t a l quantity and value of sales
Increased from 1957 through 1959, then declined to a l e v e l that was about
the same i n both I960 and 196l. The trend of sales by grade also, p a r a l l e l e d
t h a t of production,
'. Exports of hatters' f u r from the United States, i f any, are neg-
i i g i b l e . The United Kingdom, I t a l y , France, Germany, and other European
countries which have important hat-manufacturing industries also have
f u r - c u t t i n g i n d u s t r i e s . Belgium, because of i t s proximity to these markets,
• has furnished nearly a l l t h e i r supplemental requirements.
Inasmuch as the time required t o produce hatters' f u r from skins i s
from 1 week t o 10 days, inventories of cut f u r held by domestic producera
of h a t t e r s ' f u r need not be large. Such inventories t o t a l e d 107,000 pounds
a t the end of 1957} since t h a t date, yearend inventories have been about
50,000 pounds, On the other hand, stocks of raw f u r skins held by domestic
producers, formerly averaging a 2 months' supply, have increased u n t i l
they are equivalent t o a 6 months' supply.
Formerly the hat-manufacturing companies carri e d large inventories of
h a t t e r s 1 f u r , but they presently carry only about 1 month's supply.
However,' they purchase f u r f o r f u t u r e delivery.

17
U.S. Imports
U.S. imports of hatters' f u r f l u c t u a t e d from year t o year I n the
period 1951-62. Nevertheless, between 1951 and 1957, there was a d i s
t i n c t , though I r r e g u l a r , decline i n the annual imports, Since 1957
•there has been a d i s t i n c t increase of about equal magnitude. Imports
of hatters. 1 f u r amounted t o 21*7,000 pounds i n 1951 .< declined to a low
of 95,000 pounds i n 1957, and then rose t o 21*6,000 pounds i n 1959/ .
They amounted t b 180,000 pounds i n i960, t o 219,000 pounds i n 1961,
and t o 21*0,000 pounds i n 1962 (table 1*). ..In 1951-52., imports consisted
p r i m a r i l y of low-priced grades of hatters' f u r ; the average for e i g n u n i t
r
value of a l l Imports i n those 2 years averaged $2.63 per pound. By 195U,
the f o r e i g n u n i t value had ris e n s i g n i f i c a n t l y t o an average of $3.60
per pound. At the same time, imports decreased p a r t l y as.a r e s u l t o f
the duty increase but also p a r t l y as a r e s u l t of a sharp decrease i n con
sumption. I n 1959 imports were more than double those i n 1958, arid
t h e i r average f o r e i g n u n i t value f e l l to $2.13 per pound. The average
u n i t value declined to $2.09 per pound l n I960, remained at the same
l e v e l l n 1961, and then f e l l to $1.89 per pound i n 1962.
Imported hat t e r s ' f u r i s generally comparable t o domestically cut
fu r , although i t i s not usually as clean or as uniform i n color as the
domestic product.
18
U n t i l recent years Belgium was the predominant supplier of imports
of h a t t e r s ' f u r ; i t accounted f o r more than °0 percent of t h e . t o t a l i n
the period 195l-55« Since 19$$, however, Belgium has accounted f o r a
much smaller share of the t o t a l , while West Germany, France, I t a l y ,
and Spain have supplied Increasing shares. ' I n I960 and 1961. West
Germany surpassed Belgium as a s u p p l i e r ; . i t accounted f o r 39 percent of
the t o t a l l n I960 and 33 percent i n 196l. Belgium ranked as' the second
source l n these years, accounting f o r 23 percent--in i960 and 26 percent
i n 196.I. I n 1962, however, Belgium again ranked as the f i r s t supplier
and West Germany ranked second. Spain,, an unimportant supplier p r i o r
t o 1958, has since t h a t year supplied from l l * t o 29 percent of the t o t a l
imports. I n 1962 the average f o r e i g n u n i t value of imported f u r ranged
from $1.53 P8** pound f o r that imported from Belgium to $2.1*0 per pound
f o r t h a t imported from Spain. I t was $2.32 per pound f o r f u r imported
from France, $1.59 f o r that from I t a l y , and $2.20 f o r t h a t from West
Germany.
Thirteen concerns furnished data to the Commission on the grades
of h a t t e r s ' f u r that they imported: these concerns accounted f o r an
average of 95 percent of U.S. Imports f o r consumption i n the period
1957-62. ( t a b l e 5 ) . Of the several grades Imported, P e t i t Bon, a low
grade comparable to domestic Grey E n t i r e , predominated i n t h i s period.
Imports of P e t i t Bon accounted f o r 3l* percent of the t o t a l q u a n t ity'of
•reported imports i n 1957; the ratio-dropped t o 28 percent i n I958 and then
rose t o 57 percent i n i960 and t o 58 percent i n January-June I962. I n
19
1957 the average f o r e i g n value of P e t i t Bon was $2,09 per pound, and i n
1958 i t was $1.56 per pound} thereafter i t ranged between $1.62 per .
pound i n 1961 and $1.74 per pound i n January-June 1962. 1/
Imports of Pure Back and "French XX Special" (intermediate grades)
which have ranked second i n importance i n recent years, rose steadily-
from 3,000 pounds i n 1957 t o 61;,000 pounds i n 196l; imports of these'
grades amounted t o 1*0,000 pounds i n January-June 1962. Their f o r e i g n '
value averaged $2.81 per pound i n 1957, and about $2.10 i n the years
1958-59; thereafter i t increased almost s t e a d i l y to $2.25 per pound i n
January-June 1962.
Employment
The Commission' received usable data on employment from a l l s i x
major domestic producers; the average number of production and r e l a t e d
workers employed per f i r m averaged 67 i n 1961. Most of the work i n these
establishments i s performed by u n s k i l l e d women workers; the sorting, and',
grading operations, however, require s k i l l e d workers.
The aggregate number of man-hours worked annually by production
and related workers of the s i x firms Increased from 771,000 i n 1957 t o
912,000 i n 1958 and then t o 1,01*2,000 i n 1959. Thereafter the .number
of man-hours decreased t o 943,000 i n i960 and to 765,000 i n 1961.
These changes corresponded closely to f l u c t u a t i o n s i n the volume of
production,
1/ See table 6 f o r the r e s u l t s of an analysis of invoices which shows imports by price range i n 196I.

20
The average annual number of production and related workers
employed by the six major producers i n each of the years 1957-62
was reported as follows:
1957- -. - 368 1958 — -1|21 1959 -—1*89 1960 li56 196.1 r hOO 1962 (January-June) 388
Prices received by U.S. producers
The grade designations of h a t t e r s 1 f u r which encompass several
degrees of q u a l i t y overlap; f o r example, a poor BCB Ent i r e may be
sold as BCB Unpulled. BCB Unpulled may also be mixed w i t h Grey Entire
t o improve the q u a l i t y of Grey E n t i r e , For t h i s reason domestic pro
ducers s e l l t o hat manufacturers on the basis of negotiated contracts
which specify the ch a r a c t e r i s t i c s of the hatters' f u r t o be delivered,
Nevertheless, the grades of hatters' f u r indicate, i n general, f u r of
d i f f e r e n t q u a l i t i e s ranging from low-grade t o superior-grade f u r .
Four domestic producers l / and one dealer furnished the Commission
•with t h e i r net s e l l i n g prices of specified grades of ha t t e r s ' f u r i n
mid-January and mid-June i n each of the years 1957-62 and the quantity
of each grade sold at the reported prices during January and June i n
those years. The four grades of hat t e r s ' f u r f o r which data were f u r
nished were as fo l l o w s : Grey E n t i r e , a low-grade f u r ; BCB Unpulled,
a low-intermediate grade; BCB E n t i r e , an intermediate-good grade; and
No. 1 HDR, a superior grade. The weighted average prices calculated from
these data are shown i n table 7.
1/ The other two major producers are commission cutters and do not ' own the h a t t e r s ' f u r produced i n t h e i r plants.

21
From January 1957 through June 1958 the average price of Grey
Entire declined by about 35 percent; i t recovered somewhat l n 1959-60,
but then again declined i n 1961-62 t o a point about 12 percent below
the June I960 l e v e l . The price of BCB Unpulled, the next lowest grade
(produced i n s u b s t a n t i a l l y smaller quantities than Grey Entir e ) de~
c l i n e d by about 30 percent between January 1957 and June 1958, r e
covered somewhat i n 1959-60, since which period i t s p r i c e has not
changed s i g n i f i c a n t l y . The average price of BCB Entire was somewhat.
higher i n 1962 than i n June 1957.
Profit-and-loss experience of U.S. producers
Five of the s i x major firms that produced hatt e r s ' f u r furnished
usable data showing t h e i r profit-and-loss experience, on ah estab l i s h
ment basis, f o r a l l of the years 1957-6.1. These f i v e f i rms accounted
f o r about 62 percent of U.S. production of hatters' f u r i n 1957 and f o r
about 91 percent i n 196l. Three of the f i v e establishments purchase f u r
skins and manufacture and s e l l hatters' f u r ; the other two establishments
process skins and cut hatters' f u r on a commission basis. A l l except two
concerns produce only hat t e r s ' f u r .
Data r e l a t i n g t o the profit-and-loss experience of the f i v e estab
lishments show th a t the aggregate of t h e i r sales and receipts from
commission c u t t i n g were higher i n 1959 than i n 1957 and decreased each
year from 1959 through 196l. I n the aggregate, the f i v e establishments
had a loss l n 1957, p r o f i t s l n 1958-60, and a loss i n 1961.

22
S t a t i s t i c a l Appendix

23
Table 1 .--Hatters' f u r : U.S. rateB of duty, 1930-63
T a r i f f paragraph and desc r i p t i o n
Rate of duty
Au t h o r i t y and e f f e c t i v e date
Par. 1520: Hatters' f u r s , or furs not
on the skin, prepared f o r h a t t e r s ' use, i n cluding f u r skins carroted 35$ ad v a l . l /
27^$ ad v a l .
15$ ad v a l .
klzfi per lb..; 15% ad v a l . min.; 35$ ad v a l . max.
15$ ad v a l .
T a r i f f Act of I93O; June 18, 1930.
B i l a t e r a l trade agreement w i t h Belgo-Luxembourg Economic Union; May 1, 1935.-.
General Agreement on T a r i f f s and Trade; Jan. 1, 19kQ
P r e s i d e n t i a l Proclamation No.- 2960; 2 / Feb. 9, 1952.-
P r e s i d e n t i a l Proclamation No. 3255; Zj Sept..Ik, 1958.
l / Rate c u r r e n t l y applicable t o products of designated Communist-dominated or Communist-controlled countries or areas, which are denied the b e n e f i t s of trade-agreement concessions pursuant t o sec. 231 of the Trade Expansion Act of 1962 or sec. U0l(2) of the T a r i f f C l a s s i f i c a t i o n Act of 1962. ..
2/ This modification of the GATT concession was a r e s u l t o f an "escape clause" i n v e s t i g a t i o n completed under sec. 7 of,the Trade Agreements Extension Act of 1951.
3/ The modification of the concession was terminated (thus r e s t o r i n g the o r i g i n a l GATT concession) as a r e s u l t of an i n v e s t i g a t i o n under par. 2 of Executive Order lOuOl.

Table 2 . — H a t t e r s ' f u r : U.S. consumption (calculated) 1 / and d e r i v a t i o n of consumption, 1957-62-
Item ) 1957 ; 1958 ; 1959 ; 1960 ; 1961 ; 1962
Calculated consumption: 1,000 pounds—: 2,258 2,381 . 2,690 j 2,404 :' 2,014 : 2,167
.__d 0 : '505 • 417 : 339 397 : 370 : 237 T o t a l 2,763 2,798 3,029 2,801 : • 2,384 : 2,ii5U Less 20 percent "blown f u r " 2/ — d o 553 560 606 560 : 477 • ii91
T o t a l h a t t e r s ' f u r cons umed — d o 2,210 . 2,238 2,423 2,241 j 1,907 1,963
Derived consumption: Imported • —1,000 pounds — 95 : 104 246 : ' 180 3/ 219 * 3/' 2U0
Percent of t o t a l h a t t e r s ' f u r consumed : 4.3 4.6 : 10.1 : 8.0 11.5 : 12.2
Domestic 4/ 1,000 pounds— : 2,115 : 2,134 : 2,177 : 2,061 : 1,688 : 1,723 Percent of t o t a l h a t t e r s ' f u r
consumed : 95-7 : -95.^ : 89.9 : 92.0 88.5 :' 87.8
1 / Calculated on the basis of. 2.25 pounds of f u r per dozen women's hats and 3 pounds per dozen men's hats.
2/ Reused, blown, and other byproduct f u r accounts f o r about 20 percent of the weight of domestic production of f u r f e l t hats.
3/ Preliminary.' 4/ Consumption less imports; exports, i f any, are n e g l i g i b l e .
Source: Imports compiled from o f f i c i a l s t a t i s t i c s of the U.S. Department of Commerce; other data computed by U.S. T a r i f f Commission.

Table 3.—Hatters' f u r : Production by 6 U.S. producers, by p r i n c i p a l grades•, 1957-61 and January-June 1962.. if
Grade [ 1957 ; 1958 ; 1959 ; 1960 ; 1961 ; j 3 X l ' ~ ^ e
BCB Unpulled BCB En t i r e . White, Mottled, and Fawn Hares' f u r
T o t a l
BCB Ent i r e White, Mottled, and F'awn Hares' f u r
Quantity (pounds)
BCB Unpulled BCB En t i r e . White, Mottled, and Fawn Hares' f u r
T o t a l
BCB Ent i r e White, Mottled, and F'awn Hares' f u r
343,318 • 107,797 : 272,176 202,439 ' 97,479
354,524
483,286 126,286 : 536,498 : lil.8,661
98,867 350,390
572,179 : 150,995 : 553,749 • 177,867 148,244 530,753 •
509,470 140,748 . 304,965 114,680 206,823 424,747
588-, 009 •135,798 : 231,062
: 88,216 :' 111,101
476,108
323,095 71,426
149,014 : 53,130 ; 20,630
285,150
BCB Unpulled BCB En t i r e . White, Mottled, and Fawn Hares' f u r
T o t a l
BCB Ent i r e White, Mottled, and F'awn Hares' f u r
1,377,733 1,743,988 2,133,787 1,701,433 : 1,630,294 . 3 / 902,445
BCB Unpulled BCB En t i r e . White, Mottled, and Fawn Hares' f u r
T o t a l
BCB Ent i r e White, Mottled, and F'awn Hares' f u r
Percent of t o t a l
BCB Unpulled BCB En t i r e . White, Mottled, and Fawn Hares' f u r
T o t a l
BCB Ent i r e White, Mottled, and F'awn Hares' f u r
: 24.9 7.8
: 19-8 : lU.7 : 7.1 : 25-7
: 27.7 : 7.2 : 30..8 : 8.5
5.7 : 20.1
: 26.8 7.1
: 26.0 : 8.3 : 6.9 : 24.9
29.9 8.3
17.9 6.7
: 12.2 : 25.0
: 36.1 : 8.3 : 14 .2
5.4 : 6.8 : 29.2
35.8 7.9
16.5 5.9 2.3
: 31.6
BCB Unpulled BCB En t i r e . White, Mottled, and Fawn Hares' f u r
T o t a l
BCB Ent i r e White, Mottled, and F'awn Hares' f u r
: 100.0 : 100.0 : 100.0 : 100.0 : 100.0 : 100.0
1/ These 6"producers accounted f o r about two-thirds of t o t a l U.S. production i n 1957 and f o r more than nine-tenths of the t o t a l i n I 9 6 I .
2/-May include some White, Mottled, Fawn, and hares' f u r . 3 / Production f o r the f u l l year 1962 f o r these 6 producers amounted t o 1,682,893 pounds.
Source: Compiled from data submitted t o the U.S. T a r i f f Commission by 6 i n d i v i d u a l producers.

Table 4 .—Hatters' fur: U.S. Imports for consumption, by principal sources, 1951-62
Year :Belgium and: : Luxembourg : France .' I t a l y '. Spain
: West : ; Oermany t
A l l other
:Total or t average
Quantity (pounds)
1951- — 1952- — 1953 1954—r 1 9 5 5 — 1956 1957 1958- — 1959- — I960 1961 2/-1962 2/-
214,1*39 127,01*5 243,960 139,660 153,752 80,300 51,027 26,186 79,754 l a , 662 56,623 92,163
229 200
2,000 111, 902 13,200 19,561 9,265
23,130 10,501
1,985 i ,5oo 2,360 300 210
29,355 3,616
20,675 1)6,069 0)i,7O9 J2, '3lil 36,215
6,378
h,h09 1*1*1
2,30U 30,060 52,511 1*1,1*61 32,116 39,164 >
331
1,961 22,1*33 ll*,200 148,210 70,550 72,86? 61,000 :
1/ 23,612 : 3,985 : 1,637 :
300 : 5,59ll . 360 :
-1,963 17677 1,000
246,971* 132,730 21*7,957 139,960 158,671 119,651 94,61*2
104,321 21*6,105 179,610
218,952 21*0,01*3
Foreign value
1951 . $523,500 19$Z : 206,591 1953'rr- -. : 652,71*2 19$k : 503,337 15.55, : 527,51*7
336 , 285 217,070 60, 222
152,073 73,651*
I 1961 2/ : 109,221 I 1962 2/ : 11*1,11*9
1956^ 1957-1958-1959-1960-
U,600 30,518
: 23,247
$1*21* : $2,591) 263 » 2,781
l*,8ll* 599 515
69,71*9 7,906
35,529 38,757 1 77,728 19,21*7 : 28,266 1*3,922 : 55,910 21*.375 ! 57,686
$10,1*15
2,200 1,81*3 5,525
69,831 141,303 105,523 90,299 93,881
$795
7,218
33,946 114,363 1.1*2,578 154,567 133,975
1/ $11*1,069 20,007 5,81*6
617 21,182 1,407
6,003 3,186 2,500
$6?8,797 309,61*2 663,1*02 503,936 530,879 1*1*0,877 317,381 222,775 524,221* 375,271 1*57,105 1*53,566
Unit value (per pound)
1951 . $2.44 1952 . 2.26 1953 . 2.68 1951*- : 3.60 1955' . 3.43 1956^-- : 4.19 1957- : 4.25 1958:- : 2.30 1959^ . 1.91 i960—:--— : 1.77 196X2/- : 1.93 1962: 2/ : 1.53
$1.85 1.32
2.30 2.05 1.76 1.98 2.08 1.90 2.32
$1.31 . 1.85 2.01* 2.00 2.1)5 2.38 : 2.19 : 1.72 : I .69 : 1.92 t 1.73 1.59
$1.63
.50 1*.18 2.1*0 2.32 2.69 2.55 2.79 2.1*0 :
$2.40
3.68 2.1*5 2.39 » 2.37 r 2.02 : 2.12 : •2.20 :
1/ $5.97 5.02 3.57
2.06 3.79 3.91
3.06 1.90 2.50
$2.75 2.33 2.68-3.60 3.35 3.68 3.35 2.11* 2.13 2.09 2.09 1.89
1/ Includes 23,396 pounds of hatters' fur, valued at $131,569, with a unit value of $5.62 per pound, imported from Argentina. 2/ Preliminary.
Source: Compiled from o f f i c i a l s t a t i s t i c s of the U.S. Department of Commerce,
i
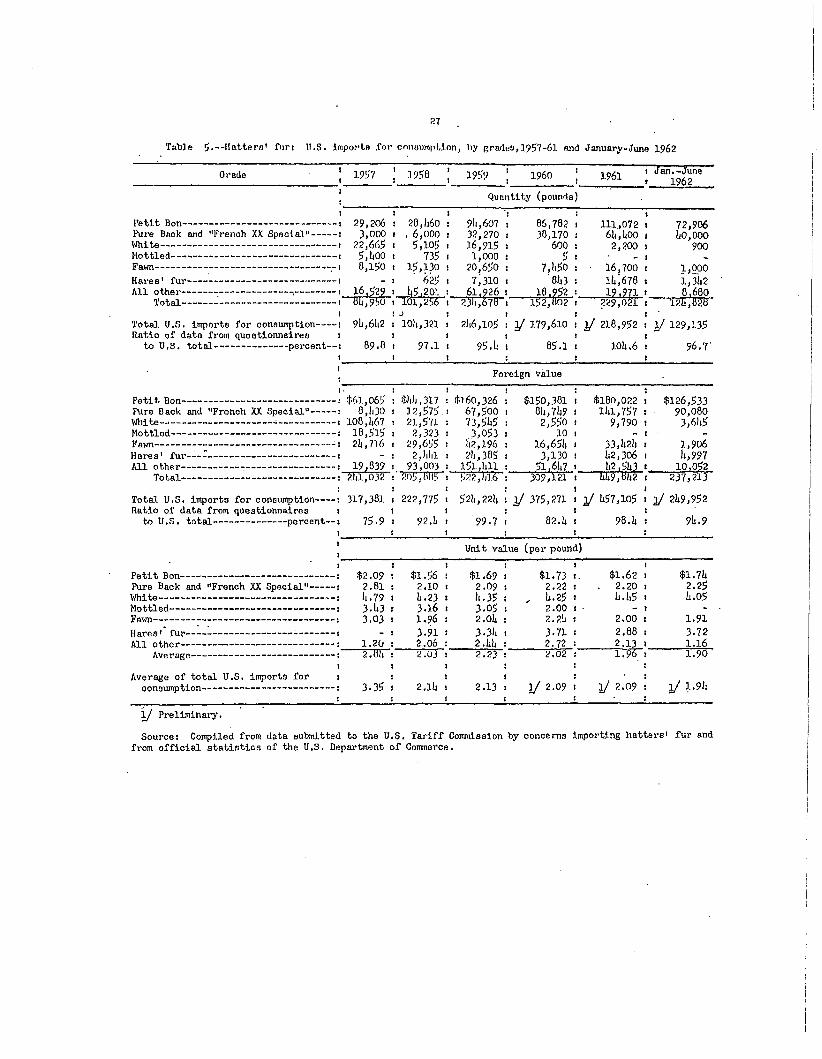
Table 5'.--Hatters' f u n U.S. importB .for consumption, by grades, 1957-61 and January-June 1962
Orade
P e t i t Bon Pure Back and "French XX Special"-White Mottled-Fawn ~-
Hares' f u r A l l other .
To t a l -'
To t a l U.S. Imports f o r consumption— Ratio of data from questionnaires
to U.S. t o t a l ' percent-
P e t i t Don Pure Back and "French XX Special"-W h i t e — — -Mottled Fawn — Hares' f u r — - • A l l other •
T o t a l
Total U.S. imports f o r c o n s u m p t i o n — Ratio of data from questionnaires
to U.S. t o t a l percent-
P e t i t Bon Pure Back and "French XX Special"-White Mottled Fawn
Hares' f u r — A l l other
Average
Average of t o t a l U.S, consumption
Imports f o r
1957 ]?5B 1959 I960 1961 Jan.-June
1962
Quantity (pounds)
29,206 s 3,000 i
22,665 i 5,boo i
8,150 i
16,529 '
9li,6li2
89.8
28,li60 i . 6,000 i 5,105 i
735 : 15,130 !
625 i
101,256 t o :
10!i,321 i
97.1 i
9li,607 32,270 16,915 1,000
20,650 7,310
61.926 s
86,782 30,170
600 5
7,1)50 '81.3
18.952
111,072 611,1)00 2,200
• 16,700
\\x,m 19,971
72,906 1)0,000
900
1,000 1,31)2 0,680
23!.,675 152,802 229,021 121), 82«
i 2li6,105 y 179,610 \J 218,952 1/ 129,135
95.Ii ' 85.1 10U.6 96.7'
Foreign value
1' : 4=61,065 ! 8,1)30 1 108,1)67 : 18,515 : 21),7.6
\ 19,839
• :M))j,317 • 12,575 • 21,571
2,323 29,655
2.)i)il 93,003
$160,326 ! $150,381 67,500 . 81),71)9 73,51)5 . 2,550 3.053 . 10
li2,196 i 16,651) : ?)),385 : 3,130
l 5 l , l i l l : 51,61)7
$180,022 l l i l ,757
9,790
33,1)24 1.2,306 1)2,51.3
$126,533 90,080
3,645
1,906 li,997
10,052 s 21)1,032
\ 317,381
! 75.9 !
205", It'll!,
222,775
92.1)
s 522,1)16 : 309,121
52)4,22!, i \J 375,271
99.7 i 82.Ii
UU9,81l2
2 / li57,lo5
98.1)
1 237,213
] / 2ll9,952
9U.9
[ Unit value (per pound)
>
: $2.09 : 2.81 ) 1).79 : 3.1)3 : 3.03
: 1.20
$1.56 2.10 li.23 3.16 1.96
3.91 2.06
$1.69 2.09 Ii . 35 3.05 2.0U
3.3!i 2.I1I1
$1.73 2.22
. ll.25 2.00 2.2!i 3.71 2.72
$1.62 . 2.20
li.ii5
2.00 2.88 2.13
$1.74 2.25 ti.o5
1.91 3.72 1.16
: 2.Oil ! 1 : 3-35
2.03
2.Ill
2.23
2.13
2.02
1 / 2.09
1.96
1/ 2.09
1.90
1/ 1.94
1 / Preliminary.
Source: Compiled from data submitted to the U.S. T a r i f f Commission by ooncerns importing h a t t e r s ' f u r and from o f f i c i a l s t a t i s t i c s of the U.S. Department o f Commerce.

28
' Table 6 .--Matters' furs U.S. general imports, i / according to u n i t value, 1961
Foreign value per pound Number t
of : Quantity, entries :
Not over $1.1*0- : 5 Over $1.1*0, not over $1.60 : 22 Over $1.60, not over $1.80 : 2° Over $1.80, not over $2 .00— : 12 Over $2.00, not over $2.20 : 6 Over $2.20, not over $2.1*0 : 19 Over $2.1*0, not over $2.60 : 3 Over $2.60, not over $2.80 : 2 Over $2;80, not over $3.00 : 3 Over $3.00, not over $3»50 : 8 Over $ 3 . £ 0 , not over $1*.00 : I* Ovex $1*.00 - : 5_
T o t a l or average . •—. 1 ,11b
Pounds
8,093 .26,819 65,075 20,1*96 16,200 1*7,790 6,828 3,865 1,115
10,583 9,11b It, 290
220,268
Value' j
$7,1*23 1*1,1*88
110,723 39,136 3h,260
107,680 16,522 10,21*5 3,262 3M20 33,102 22,651*
1*60,615
Unit value
$0.92 1.55 1.70 1.91 2.11 2.25 2.1*2 2.65 2.93 3.22 3.63 5.28 2.09
l/ General imports are the t o t a l of the entries e n t r i e s i n t o bonded warehouse.
f o r immediate consumption and
Source: Compiled from i n d i v i d u a l entries obtained"from the U.S. Bureau of the Census.
29
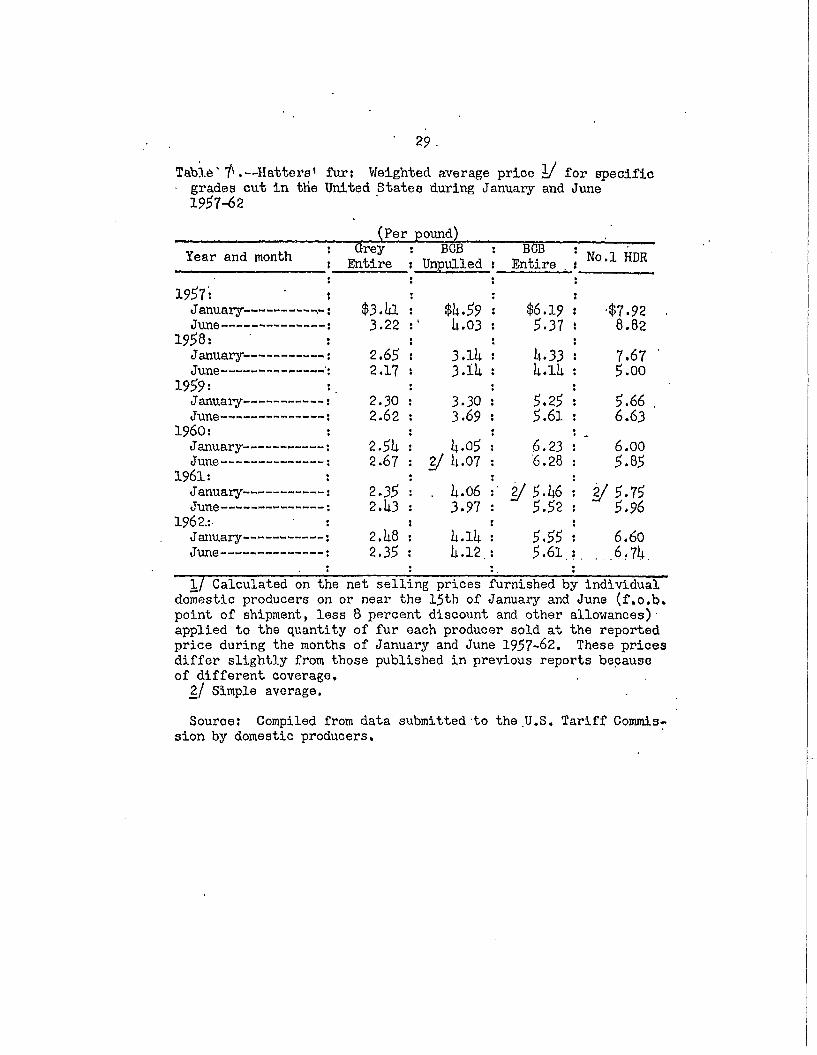
Table' 7̂ .—Hatters< f u r ; Weighted average price 1/ f o r sp e c i f i c • grades cut i n the United States during January and June
1957-62
(Per pound) . v 4.u • Grey : BCB : BCB : „ _ • Year and month ; , U n p u l l e d , E n t i r e , No.l HDR
1957: J anuary-June
1958: January-June
1959: J anuary-June—•—
I960: January-June
1961: J anuary-June
1962.:-January-June
1/ Calculated on the net s e l l i n g prices furnished by i n d i v i d u a l domestic producers on or near the 15th of January and June (f.o.b. point of shipment, less 8 percent discount and other allowances)• applied t o the quantity of f u r each producer sold a t the reported price during the months of January and June 1957-62. These prices d i f f e r s l i g h t l y from those published i n previous reports because of d i f f e r e n t coverage.
2/ Simple average.
Source: Compiled from data submitted t o the U.S. T a r i f f Commission by domestic producers.
$3.la 3.22
$b.59 : l U.03
2.65 2.17
3.1b 3-ib
2.30 2.62
3-30 3.69
2.5U 2.67
b.05 If b.07
2.35 2.b3
. b.06 3.97
2.U8 • 2.35 :
b.lb U.12
$6.19 5.37
• $7.92 i 8.82
b.33 b.lb
i 7.67 5.oo
5.25 5.61
5.66 6.63
6.23 • '6.28
6.00 5.85
2/5.b6 • 5.52
if S.75 5.96
5.55 • 5.61.:
6.60 . . .6.7b