UNITED STATES SECURITIES AND EXCHANGE COMMISSION...
208
UNITED STATES SECURITIES AND EXCHANGE COMMISSION Washington, D.C. 20549 FORM 20-F REGISTRATION STATEMENT PURSUANT TO SECTION 12(b) OR (g) OF THE SECURITIES EXCHANGE ACT OF 1934 OR ANNUAL REPORT PURSUANT TO SECTION 13 OR 15(d) OF THE SECURITIES EXCHANGE ACT OF 1934 For the fiscal year ended December 31, 2016 OR TRANSITION REPORT PURSUANT TO SECTION 13 OR 15(d) OF THE SECURITIES EXCHANGE ACT OF 1934 OR SHELL COMPANY REPORT PURSUANT TO SECTION 13 OR 15(d) OF THE SECURITIES EXCHANGE ACT OF 1934 Commission file number: 001-16429 ABB Ltd (Exact name of registrant as specified in its charter) Switzerland (Jurisdiction of incorporation or organization) Affolternstrasse 44 CH-8050 Zurich Switzerland (Address of principal executive offices) Richard A. Brown Affolternstrasse 44 CH-8050 Zurich Switzerland Telephone: +41-43-317-7111 Facsimile: +41-43-317-7992 (Name, Telephone, E-mail and/or Facsimile number and Address of Company Contact Person) Securities registered or to be registered pursuant to Section 12(b) of the Act: Title of each class Name of each exchange on which registered American Depositary Shares, each representing one Registered Share New York Stock Exchange Registered Shares, par value CHF 0.12 New York Stock Exchange* Securities registered or to be registered pursuant to Section 12(g) of the Act: None. Securities for which there is a reporting obligation pursuant to Section 15(d) of the Act: None. eriod covered by the annual report: 2,138,706,835 Registered Shares Indicate by check mark if the registrant is a well-known seasoned issuer, as defined in Rule 405 of the Securities Act. Yes No If this is an annual or transition report, indicate by check mark if the registrant is not required to file reports pursuant to Section 13 or 15(d) of the Securities Exchange Act of 1934. Yes No Indicate by check mark whether the registrant (1) has filed all reports required to be filed by Section 13 or 15(d) of the Securities Exchange Act of 1934 during the preceding 12 months (or for such shorter period that the registrant was required to file such reports), and (2) has been subject to such filing requirements for the past 90 days. Yes No Indicate by check mark whether the registrant has submitted electronically and posted on its corporate Web site, if any, every Interactive Data File required to be submitted and posted pursuant to Rule 405 of Regulation S-T (§232.405 of this chapter) during the preceding 12 months (or for such shorter period that the registrant was required to submit and post such files). Yes No Indicate by check mark whether the registrant is a large accelerated filer, an accelerated filer, or a non- 12b-2 of the Exchange Act. (Check one): Large accelerated filer Accelerated filer Non-accelerated filer Indicate by check mark which basis of accounting the registrant has used to prepare the financial statements included in this filing: U.S. GAAP International Financial Reporting Standards as issued by the International Accounting Standards Board Other on, indicate by check mark which financial statement item the registrant has elected to follow. item 17 item 18 If this is an annual report, indicate by check mark whether the registrant is a shell company (as defined in Rule 12b-2 of the Exchange Act). Yes No * Listed on the New York Stock Exchange not for trading or quotation purposes, but only in connection with the registration of American Depositary Shares pursuant to the requirements of the Securities and Exchange Commission.
Transcript of UNITED STATES SECURITIES AND EXCHANGE COMMISSION...
UNITED STATESSECURITIES AND EXCHANGE COMMISSION
Washington, D.C. 20549
FORM 20-F
REGISTRATION STATEMENT PURSUANT TO SECTION 12(b) OR (g) OF THE SECURITIESEXCHANGE ACT OF 1934
ORANNUAL REPORT PURSUANT TO SECTION 13 OR 15(d) OF THE SECURITIES EXCHANGE ACTOF 1934
For the fiscal year ended December 31, 2016OR
TRANSITION REPORT PURSUANT TO SECTION 13 OR 15(d) OF THE SECURITIES EXCHANGEACT OF 1934
ORSHELL COMPANY REPORT PURSUANT TO SECTION 13 OR 15(d) OF THE SECURITIESEXCHANGE ACT OF 1934
Commission file number: 001-16429
ABB Ltd(Exact name of registrant as specified in its charter)
Switzerland(Jurisdiction of incorporation or organization)
Affolternstrasse 44CH-8050 Zurich
Switzerland(Address of principal executive offices)
Richard A. BrownAffolternstrasse 44
CH-8050 ZurichSwitzerland
Telephone: +41-43-317-7111Facsimile: +41-43-317-7992
(Name, Telephone, E-mail and/or Facsimile number and Address of Company Contact Person)
Securities registered or to be registered pursuant to Section 12(b) of the Act:
Title of each class Name of each exchange on which registeredAmerican Depositary Shares,
each representing one Registered ShareNew York Stock Exchange
Registered Shares, par value CHF 0.12 New York Stock Exchange*
Securities registered or to be registered pursuant to Section 12(g) of the Act: None.
Securities for which there is a reporting obligation pursuant to Section 15(d) of the Act: None.
eriod covered by the annual report:2,138,706,835 Registered Shares
Indicate by check mark if the registrant is a well-known seasoned issuer, as defined in Rule 405 of the Securities Act. Yes No
If this is an annual or transition report, indicate by check mark if the registrant is not required to file reports pursuant to Section 13 or 15(d) of the SecuritiesExchange Act of 1934. Yes No
Indicate by check mark whether the registrant (1) has filed all reports required to be filed by Section 13 or 15(d) of the Securities Exchange Act of 1934 duringthe preceding 12 months (or for such shorter period that the registrant was required to file such reports), and (2) has been subject to such filing requirements for the past90 days. Yes No
Indicate by check mark whether the registrant has submitted electronically and posted on its corporate Web site, if any, every Interactive Data File required tobe submitted and posted pursuant to Rule 405 of Regulation S-T (§232.405 of this chapter) during the preceding 12 months (or for such shorter period that the registrant wasrequired to submit and post such files). Yes No
Indicate by check mark whether the registrant is a large accelerated filer, an accelerated filer, or a non- 12b-2 of the Exchange Act. (Check one):
Large accelerated filer Accelerated filer Non-accelerated filer
Indicate by check mark which basis of accounting the registrant has used to prepare the financial statements included in this filing: U.S. GAAP
International Financial Reporting Standards as issued by the International Accounting Standards Board Other
on, indicate by check mark which financial statement item the registrant has elected to follow.item 17 item 18
If this is an annual report, indicate by check mark whether the registrant is a shell company (as defined in Rule 12b-2 of the Exchange Act). Yes No
* Listed on the New York Stock Exchange not for trading or quotation purposes, but only in connection with the registration of American Depositary Sharespursuant to the requirements of the Securities and Exchange Commission.

(i)
TABLE OF CONTENTS
PagePART I 3Item 1. Identity of Directors, Senior Management and Advisers 3Item 2. Offer Statistics and Expected Timetable 3Item 3. Key Information 4Item 4. Information on the Company 15Item 4A. Unresolved Staff Comments 31Item 5. Operating and Financial Review and Prospects 31Item 6. Directors, Senior Management and Employees 73Item 7. Major Shareholders and Related Party Transactions 111Item 8. Financial Information 112Item 9. The Offer and Listing 113Item 10. Additional Information 114Item 11. Quantitative and Qualitative Disclosures About Market Risk 124Item 12. Description of Securities Other than Equity Securities 125PART II 126Item 13. Defaults, Dividend Arrearages and Delinquencies 126Item 14. Material Modifications to the Rights of Security Holders and Use of Proceeds 126Item 15. Controls and Procedures 126Item 15T. Controls and Procedures 128Item 16A. Audit Committee Financial Expert 128Item 16B. Code of Ethics 128Item 16C. Principal Accountant Fees and Services 128Item 16D. Exemptions from the Listing Standards for Audit Committees 129Item 16E. Purchase of Equity Securities by Issuer and Affiliated Purchasers 129Item 16F. Change in Registrant s Certifying Accountant 129Item 16G. Corporate Governance 130Item 16H. Mine Safety Disclosure 130PART III 130Item 17. Financial Statements 130Item 18. Financial Statements 130Item 19. Exhibits 131

1
INTRODUCTION
ABB Ltd is a corporation organized under the laws of Switzerland. In this Annual Report, the ABB Group,ABB, the Company, we, our and us refer to ABB Ltd and its consolidated subsidiaries (unless the context
otherwise requires). We also use these terms to refer to ABB Asea Brown Boveri Ltd and its subsidiaries prior to theestablishment of ABB Ltd as the holding company for the entire ABB Group in 1999, as described in this Annual Reportunder Item 4. Information on the Company Introduction History of the ABB Group . Our American DepositaryShares (each representing one registered share of ABB Ltd) are referred to as ADSs . The registered shares of ABB Ltdare referred to as shares . Our principal corporate offices are located at Affolternstrasse 44, CH-8050 Zurich,Switzerland, telephone number +41-43-317-7111.
FINANCIAL AND OTHER INFORMATION
The Consolidated Financial Statements of ABB Ltd, including the notes thereto, as of December 31, 2016 and2015, and for each of the years in the three-year period ended December 31, 2016 (our Consolidated FinancialStatements) have been prepared in accordance with United States generally accepted accounting principles(U.S. GAAP). ABB Ltd has separately prepared its statutory unconsolidated financial statements in accordance with theSwiss Code of Obligations.
In this Annual Report: (i) U.S. dollar and USD refer to the lawful currency of the United States ofAmerica; (ii) CHF and Swiss franc refer to the lawful currency of Switzerland; (iii) EUR and euro refer to thelawful currency of the participating member states of the European Economic and Monetary Union (Eurozone);(iv) SEK and Swedish krona refer to the lawful currency of Sweden; (v) Chinese renminbi refers to the lawfulcurrency of the People s Republic of China; (vi) AED refers to the lawful currency of the United Arab Emirates;(vii) AUD and Australian dollar refer to the lawful currency of Australia; and (viii) INR and Indian Rupee referto the lawful currency of India.
Except as otherwise stated, all monetary amounts in this Annual Report are presented in U.S. dollars. Wherespecifically indicated, amounts in Swiss francs have been translated into U.S. dollars. These translations are provided forconvenience only, and they are not representations that the Swiss franc could be converted into U.S. dollars at the rateindicated. These translations have been made using the twelve o clock buying rate in the City of New York for cabletransfers as certified for customs purposes by the Federal Reserve Bank of New York as of December 30, 2016, unlessotherwise indicated. The twelve o clock buying rate for Swiss francs on December 30, 2016, was $1.00 = CHF 1.0160.The twelve o clock buying rate for Swiss francs on March 3, 2017, was $1.00 = CHF 1.0118.
FORWARD-LOOKING STATEMENTS
This Annual Report includes forward-looking statements within the meaning of the United States PrivateSecurities Litigation Reform Act of 1995. We intend such forward-looking statements to be covered by the safe harborprovisions for forward-looking statements contained in Section 27A of the Securities Act of 1933 and Section 21E of theSecurities Exchange Act of 1934. These forward-looking statements can be identified by the use of forward-lookingterminology, including the terms believes, estimates, anticipates, expects, intends, may, will, or shouldor, in each case, their negative, or other variations or comparable terminology. These forward-looking statementsinclude all matters that are not historical facts. They appear in a number of places throughout this Annual Report andinclude statements regarding our intentions, beliefs or current expectations concerning, among other things, our resultsof operations, financial condition, liquidity, prospects, growth, dispositions, strategies and the countries and industries inwhich we operate.
These forward-looking statements include, but are not limited to, statements about our financial condition andperformance, operating results, liquidity and our ability to fund our business operations and initiatives, capitalexpenditure and debt service obligations, plans regarding our capital structure, ability to take advantage of marketopportunities and drive growth, our products and service offerings, anticipated benefits to the shareholders (including inconnection with our share buyback program), acquisitions and integration, investment and risk management strategies,volatility in the credit markets and other market conditions and trends, industry trends and expectations regardingconsumer behavior, our ability to respond to changing business and economic conditions, our comparative advantages,our commitments and contingencies, availability of raw materials, and other plans, goals, strategies, priorities andinitiatives related to our business, including our brand management initiative, Next Level Strategy, white collarproductivity program, and other cost-saving measures, as well as, the following:
2
statements in Item 3. Key Information Dividends and Dividend Policy regarding our policy on futuredividend payments,
statements in Item 3. Key Information Risk Factors,
statements in Item 4. Information on the Company regarding the timing of intended capital expenditures,
statements in Item 5. Operating and Financial Review and Prospects regarding our managementobjectives, including our mid-term outlook, as well as trends in results, prices, volumes, operations,margins and overall market trends, and
statements in Item 8. Financial Information Legal Proceedings regarding the outcome of certain legaland compliance matters.
By their nature, forward-looking statements involve risks and uncertainties because they relate to events anddepend on circumstances that may or may not occur in the future. We caution you that forward-looking statements arenot guarantees of future performance and that our actual results of operations, financial condition and liquidity, and thedevelopment of the countries and industries in which we operate, may differ materially from those described in orsuggested by the forward-looking statements contained in this Annual Report. In addition, even if our results ofoperations, financial condition and liquidity, and the development of the countries and industries in which we operate,are consistent with the forward-looking statements contained in this Annual Report, those results or developments maynot be indicative of results or developments in subsequent periods. Important factors that could cause actual results todiffer materially from our expectations are contained in cautionary statements in this Annual Report and include,without limitation, the following:
Our business is exposed to risks associated with the volatile global economic environment and politicalconditions.
Illegal behavior by any of our employees or agents could have a material adverse impact on ourconsolidated operating results, cash flows, and financial position as well as on our reputation and ourability to do business.
We have identified a material weakness in our internal control over financial reporting that could, if notremediated, result in material inaccuracies in our consolidated financial statements and adversely affect ourbusiness and results of operations.
Our operations in emerging markets expose us to risks associated with conditions in those markets.
Undertaking long-term, fixed price or turnkey projects or technically complex projects exposes ourbusinesses to risk of loss should our actual costs exceed our estimated or budgeted costs or should we failto perform in line with the technical requirements.
We operate in very competitive markets and could be adversely affected if we fail to keep pace withtechnological changes.
Our multi-national operations expose us to the risk of fluctuations in currency exchange rates.
Our hedging activities may not protect us against the consequences of significant fluctuations in exchangerates, interest rates or commodity prices on our earnings and cash flows.
Increases in costs or limitation of supplies of raw materials may adversely affect our financial performance.
An inability to protect our intellectual property rights could adversely affect our business.
Many of our contracts contain performance obligations that require innovative design capabilities, aretechnologically complex, require state-of-the-art manufacturing expertise or are dependent upon factors notwholly within our control. Failure to meet these obligations could adversely affect our profitability andfuture prospects.

3
Industry consolidation could result in more powerful competitors and fewer customers.
We are subject to environmental laws and regulations in the countries in which we operate. We incur coststo comply with such regulations, and our ongoing operations may expose us to environmental liabilities.
We may be the subject of product liability claims.
The results of the United referendum on withdrawal from the European Union may have anegative effect on global economic conditions, financial markets and our business.
We may encounter difficulty in managing our business due to the global nature of our operations.
If we are unable to obtain performance and other guarantees from financial institutions, we may beprevented from bidding on, or obtaining, some contracts, or our costs with respect to such contracts couldbe higher.
Examinations by tax authorities and changes in tax regulations could result in lower earnings and cashflows.
If we are unable to attract and retain qualified management and personnel then our business may beadversely affected.
Anticipated benefits of existing and potential future mergers, acquisitions, divestments, joint ventures orstrategic alliances may not be realized.
There is no guarantee that our ongoing efforts to reduce costs will be successful.
Our business strategy may include making strategic divestitures. There can be no assurance that anydivestitures will provide business benefit.
We could be affected by future laws or regulations enacted to address climate change concerns as well asthe physical effects of climate change.
Increased information technology (IT) security threats and more sophisticated cyber-attacks could pose arisk to our systems, networks, products, solutions and services.
We urge you to read the other important factors set forth under sections of this Annual Report entitled Item 3.Key Information Risk Factors, Item 4. Information on the Company and Item 5. Operating and Financial Reviewand Prospects for a more complete discussion of the important factors that could affect our future performance and thecountries and industries in which we operate. In light of these risks, uncertainties and assumptions, the forward-lookingcircumstances described in this Annual Report and the assumptions underlying them may not occur.
Except as required by law or applicable stock exchange rules or regulations, we undertake no obligation toupdate or revise publicly any forward-looking statement, whether as a result of new information, future events orotherwise. All subsequent written and oral forward-looking statements attributable to us or to persons acting on ourbehalf are expressly qualified in their entirety by the cautionary statements referred to above and contained elsewhere inthis Annual Report.
PART I
Item 1. Identity of Directors, Senior Management and Advisers
Not applicable
Item 2. Offer Statistics and Expected Timetable
Not applicable

4
Item 3. Key Information
SELECTED FINANCIAL DATA
The following table presents our selected financial and operating information at the dates and for each of theperiods indicated. We report our financial results in U.S. dollars. Due to our global operations, a significant amount ofour revenues, expenses, assets and liabilities are denominated in other currencies. As a consequence, movements inexchange rates between currencies may affect our profitability, the comparability of our results between periods, as wellas the reported carrying value of our assets and liabilities. You should read the following information together with theinformation contained in Item 5. Operating and Financial Review and Prospects, as well as our Consolidated FinancialStatements and the Notes thereto, included elsewhere in this Annual Report.
Our selected financial data are presented in the following tables in accordance with U.S. GAAP and have beenderived from our published Consolidated Financial Statements. Our Consolidated Financial Statements as of and foreach of the years ended December 31, 2016, 2015, 2014, 2013 and 2012, were audited by Ernst & Young AG.
INCOME STATEMENT DATA:
($ in millions, except per share data in $) 2016 2015 2014 2013 2012Total revenues 33,828 35,481 39,830 41,848 39,336Total cost of sales (24,081) (25,347) (28,615) (29,856) (27,958)Gross profit 9,747 10,134 11,215 11,992 11,378Selling, general and administrative expenses (5,349) (5,574) (6,067) (6,094) (5,756)Non-order related research and development expenses (1,300) (1,406) (1,499) (1,470) (1,464)Other income (expense), net (111) (105) 529 (41) (100)Income from operations 2,987 3,049 4,178 4,387 4,058Interest and dividend income 73 77 80 69 73Interest and other finance expense (261) (286) (362) (390) (293)Income from continuing operations before taxes 2,799 2,840 3,896 4,066 3,838Provision for taxes (781) (788) (1,202) (1,122) (1,030)Income from continuing operations, net of tax 2,018 2,052 2,694 2,944 2,808Income (loss) from discontinued operations, net of tax 16 3 24 (37) 4Net income 2,034 2,055 2,718 2,907 2,812Net income attributable to noncontrolling interests (135) (122) (124) (120) (108)Net income attributable to ABB 1,899 1,933 2,594 2,787 2,704
Amounts attributable to ABB shareholders:Income from continuing operations, net of tax 1,883 1,930 2,570 2,824 2,700Net income 1,899 1,933 2,594 2,787 2,704
Basic earnings per share attributable to ABB shareholders:Income from continuing operations, net of tax 0.88 0.87 1.12 1.23 1.18Net income 0.88 0.87 1.13 1.21 1.18
Diluted earnings per share attributable to ABB shareholders:Income from continuing operations, net of tax 0.87 0.87 1.12 1.23 1.18Net income 0.88 0.87 1.13 1.21 1.18
Weighted-average number of shares outstanding (in millions)used to compute:Basic earnings per share attributable to ABB shareholders 2,151 2,226 2,288 2,297 2,293Diluted earnings per share attributable to ABB shareholders 2,154 2,230 2,295 2,305 2,295

5
BALANCE SHEET DATA:December 31,
($ in millions) 2016 2015 2014 2013 2012Cash and equivalents 3,644 4,565 5,443 6,021 6,875Marketable securities and short-term investments 1,953 1,633 1,325 464 1,606Total assets 39,499 41,356 44,852 48,032 49,033Long-term debt (excluding current maturities of long-term 5,800 5,985 7,312 7,538 7,497Total debt(1) 6,803 7,439 7,665 7,991 10,034Capital stock and additional paid-in capital 216 1,444 1,777 1,750 1,691
13,897 14,988 16,815 19,208 17,446
CASH FLOW DATA:
($ in millions) 2016 2015 2014 2013 2012Net cash provided by operating activities 3,843 3,818 3,845 3,653 3,779Net cash used in investing activities (1,305) (974) (1,121) (717) (5,575)Net cash provided by (used in) financing activities (3,355) (3,380) (3,024) (3,856) 3,762
(1) Total debt is equal to the sum of short-term debt (including current maturities of long-term debt) and long-term debt.
DIVIDENDS AND DIVIDEND POLICY
Payment of dividends is subject to general business conditions, ABB s current and expected financial conditionand performance and other relevant factors including growth opportunities. ABB s current dividend policy is to pay asteadily rising, sustainable annual dividend over time.
The unconsolidated statutory financial statements of ABB Ltd are prepared in accordance with Swiss law.Based on these financial statements, dividends may be paid only if ABB Ltd has sufficient distributable profits fromprevious years or sufficient free reserves to allow the distribution of a dividend. As a holding company, ABB Ltd s mainsources of income are dividend and interest payments from its subsidiaries.
At December 31, 2016, the total unconsolidated equity of ABB Ltd was CHF 9,029 million,including CHF 266 million representing share capital, CHF 10,283 million representing reserves and CHF 1,520 millionrepresenting a reduction of equity for own shares (treasury stock). Of the reserves, CHF 1,520 million relating to ownshares and CHF 53 million representing 20 percent of share capital, are restricted and not available for distribution.
With respect to the years ended December 31, 2012 and 2013, ABB Ltd paid a dividend of CHF 0.68(USD 0.71) per share and CHF 0.70 (USD 0.79) per share, respectively. With respect to the year ended December 31,2014, ABB Ltd distributed a total of CHF 0.72 per share to shareholders, which comprised a dividend of CHF 0.55(USD 0.59) paid out of ABB Ltd s capital contribution reserves and a distribution of CHF 0.17 (USD 0.18) by way of anominal value reduction (a reduction of CHF 0.17 in the par value of each share from CHF 1.03 to CHF 0.86). Withrespect to the year ended December 31, 2015, ABB Ltd distributed a total of CHF 0.74 (USD 0.75) per share toshareholders by way of a nominal value reduction (a reduction of CHF 0.74 in the par value of each share fromCHF 0.86 to CHF 0.12). The USD amounts for each of the foregoing dividend payments made in CHF have beentranslated using the average rates of the month in which the dividends were paid.
With respect to the year ended December 31, 2016, ABB Ltd s Board of Directors has proposed to pay adividend of CHF 0.76 per share to shareholders. The distribution is subject to approval by shareholders at ABB Ltd s2017 Annual General Meeting (AGM).
For further information on dividends and dividend policy see Item 6. Directors, Senior Management andEmployees Shareholders rights Shareholders dividend rights .
6
RISK FACTORS
You should carefully consider all of the information set forth in this Annual Report and the followingdescription of risks and uncertainties that we currently believe may exist. Our business, financial condition or results ofoperations could be adversely affected by any of these risks. Additional risks of which we are unaware or that wecurrently deem immaterial may also impair our business operations. This Annual Report also contains forward-lookingstatements that involve risks and uncertainties. Our results could differ materially from those anticipated in theseforward-looking statements as a result of certain factors, including those described below and elsewhere in this AnnualReport. See -Looking
Our business is exposed to risks associated with the volatile global economic environment and political conditions.
Adverse changes in economic or political conditions as well as concerns about global health pandemics,terrorist activities and the longevity of the euro, could have a material adverse effect on our business, financialcondition, results of operations and liquidity. Economic volatility including developments in the price of oil andfinancial market disruptions may adversely impact the demand for our products and services. These and other factorsmay prevent our customers and suppliers from obtaining the financing required to pursue their business activities asplanned, which may force them to modify, delay or cancel plans to purchase or supply our products or services. Inaddition, if our customers do not generate sufficient revenue, or fail to obtain access to the capital markets, they may notbe able to pay, or may delay payment of, the amounts they owe us. Customers with liquidity issues may lead toadditional bad debt expense for us, which may adversely affect our results of operations and cash flows. We are alsosubject to the risk that the counterparties to our credit agreements and hedging transactions may go bankrupt if theysuffer catastrophic demand on their liquidity that prevents them from fulfilling their contractual obligations to us.
Our business environment is influenced also by numerous other economic or political uncertainties which willaffect the global economy and the international capital markets. In periods of slow economic growth or decline, ourcustomers are more likely to decrease expenditures on the types of products and systems we supply and we are morelikely to experience decreased revenues as a result. Our power and automation divisions are affected by the level ofinvestments in the markets that we serve, principally utilities, industry and transport & infrastructure. At various timesduring the last several years, we also have experienced, and may experience in the future, gross margin declines incertain businesses, reflecting the effect of items such as competitive pricing pressures, inventory write-downs, chargesassociated with the cancellation of planned expansion, increases in pension and postretirement benefit expenses, andincreases in component and manufacturing costs resulting from higher labor and material costs borne by ourmanufacturers and suppliers that, as a result of competitive pricing pressures or other factors, we are unable to pass on toour customers. Economic downturns also may lead to restructuring actions and associated expenses. Uncertainty aboutfuture economic conditions makes it difficult for us to forecast operating results and to make decisions about futureinvestments.
In addition, we are subject to the risks that our business operations in or with certain countries may beadversely affected by trade or economic sanctions or other restrictions imposed on these countries and that actual orpotential investors that object to these business operations may adversely affect the price of our shares by disposing of,or deciding not to, purchase our shares. These countries may from time to time include countries that are identified bythe United States as state sponsors of terrorism. If any countries where or with whom we do business are subject to suchsanctions or restrictions, our business, consolidated operating results, financial condition and the trading price of ourshares may be adversely affected. In 2016, our total revenues from business with countries identified by the U.S.government as state sponsors of terrorism represented a very small percentage of our total revenues. Based on theamount of revenues and other relevant quantitative and qualitative factors, we have determined that our business in 2016with countries identified by the U.S. government as state sponsors of terrorism was not material.

7
Illegal behavior by any of our employees or agents could have a material adverse impact on our consolidatedoperating results, cash flows, and financial position as well as on our reputation and our ability to do business.
Certain of our employees or agents have taken, and may in the future take, actions that violate or are alleged toviolate the U.S. Foreign Corrupt Practices Act of 1977 (FCPA), legislation promulgated pursuant to the 1997Organisation for Economic Co-operation and Development (OECD) Convention on Combating Bribery of ForeignPublic Officials in International Business Transactions, applicable antitrust laws and other applicable laws orregulations. For more information regarding investigations of past actions taken by certain of our employees, see
8. Financial Information Legal Such actions have resulted, and in the future could result, ingovernmental investigations, enforcement actions, civil and criminal penalties, including monetary penalties and othersanctions, and civil litigation. It is possible that any governmental investigation or enforcement action arising from suchmatters could conclude that a violation of applicable law has occurred and the consequences of any such investigation orenforcement action may have a material adverse impact on our consolidated operating results, cash flows and financialposition. In addition, such actions, whether actual or alleged, could damage our reputation and ability to do business.
Further, detecting, investigating and resolving such actions could be expensive and could consume significanttime and attention of our senior management. While we are committed to conducting business in a legal and ethicalmanner, our internal control systems have not been, and in the future may not be, completely effective to prevent anddetect such improper activities by our employees and agents.
Our operations in emerging markets expose us to risks associated with conditions in those markets.
A significant amount of our operations is conducted in the emerging markets in South America, Asia, and theMiddle East and Africa. In 2016, approximately 46 percent of our consolidated revenues were generated from theseemerging markets. Operations in emerging markets can present risks that are not encountered in countries withwell-established economic and political systems, including:
economic instability, which could make it difficult for us to anticipate future business conditions in thesemarkets, cause delays in the placement of orders for projects that we have been awarded and subject us tovolatile geographic markets,
political or social instability which could make our customers less willing to make cross-borderinvestments in such regions and could complicate our dealings with governments regarding permits orother regulatory matters, local businesses and workforces,
boycotts and embargoes that may be imposed by the international community on countries in which we dobusiness or where we seek to do business could adversely affect the ability of our operations in thosecountries to obtain the materials necessary to fulfill contracts and our ability to pursue business or establishoperations in those countries,
foreign state takeovers of our facilities,
significant fluctuations in interest rates and currency exchange rates,
the imposition of unexpected taxes or other payments on our revenues in these markets,
the ability to obtain financing and/or insurance coverage from export credit agencies, and
the introduction of exchange controls and other restrictions by foreign governments.
Additionally, political and social instability resulting from increased violence in certain countries in which wedo business has raised concerns about the safety of our personnel. These concerns may hinder our ability to sendpersonnel abroad and to hire and retain local personnel. Such concerns may require us to increase security for personneltraveling to such facilities or to conduct more operations from our other facilities rather than from facilities located insuch countries, which may negatively impact our operations and result in higher costs and inefficiencies.

8
In addition, the legal and regulatory systems of many emerging market countries are less developed and lesswell-enforced than in industrialized countries. Therefore, our ability to protect our contractual and other legal rights inthese countries could be limited. Consequently, our exposure to the conditions in or affecting emerging markets mayadversely affect our business, financial condition, results of operations and liquidity.
Undertaking long-term, fixed price or turnkey projects or technically complex projects exposes our businesses to riskof loss should our actual costs exceed our estimated or budgeted costs or should we fail to perform in line with thetechnical requirements.
We derive a portion of our revenues from long-term, fixed price or turnkey projects or from technicallycomplex projects that are awarded on a competitive basis and can take many months, or even years, to complete. Suchcontracts involve substantial risks, including the possibility that we may underbid and the fact that we typically assumesubstantially all of the risks associated with completing the project and the post-completion warranty obligations. Theserisks include the technical risk, meaning that we must tailor our products and systems to satisfy the technicalrequirements of a project even though, at the time we are awarded the project, we may not have previously producedsuch a product or system. The revenue, cost and gross profit realized on such contracts can vary, sometimessubstantially, from our original projections because of changes in conditions, including but not limited to:
unanticipated technical problems with the equipment being supplied or developed by us which may requireus to incur incremental expenses to remedy the problem,
changes in the cost of components, materials or labor,
difficulties in obtaining required governmental permits or approvals,
project modifications that create unanticipated costs,
delays caused by force majeure or local weather and geological conditions, including natural disasters,
customer delays,
shortages of construction equipment,
changes in law or government policy,
supply bottlenecks, especially of key components, and
or consortium failure to perform.
These risks are exacerbated if the duration of the project is extended because then there is an increased risk thatthe circumstances upon which we originally bid and quoted a price change in a manner that increases our costs. Inaddition, we sometimes bear the risk of delays caused by unexpected conditions or events. Our project contracts oftenmake us subject to penalties or damages if we cannot complete portions of the project in accordance with agreed-upontime limits and guaranteed performance levels.
We operate in very competitive markets and could be adversely affected if we fail to keep pace with technologicalchanges.
We operate in very competitive markets in particular with respect to product performance, developingintegrated systems and applications that address the business challenges faced by our customers, pricing, new productintroduction time and customer service. The relative importance of these factors differs across the geographic marketsand product areas that we serve. The markets for our products and services are characterized by evolving industrystandards (particularly for our automation technology products and systems), rapidly changing technology and increasedcompetition as a result of privatization (particularly for our power products and systems). For example, as powertransmission and distribution providers throughout the world have been undergoing substantial privatization, their needhas increased for timely product and service innovations that increase efficiency and allow them to compete in aderegulated environment. Additionally, the continual development of advanced technologies for new products andproduct enhancements is an important way in which we maintain acceptable pricing levels. If we fail to keep pace withtechnological changes in the industrial sectors that we serve, we may experience price erosion and lower margins.

9
All of our primary competitors are sophisticated companies with significant resources that may developproducts and services that are superior to our products and services or may adapt more quickly than we do to newtechnologies, industry changes or evolving customer requirements. We are also facing increased competition from lowcost competitors in emerging markets, which may give rise to increased pressure to reduce our prices. Our failure toanticipate or respond quickly to technological developments or customer requirements could adversely affect ourbusiness, results of operations, financial condition and liquidity.
Our multi-national operations expose us to the risk of fluctuations in currency exchange rates.
Exchange rate fluctuations have had, and could continue to have, a material impact on our operating results, thecomparability of our results between periods, the value of assets or liabilities as recorded on our Consolidated BalanceSheet and the price of our securities. Volatility in exchange rates makes it harder to predict exchange rates and performaccurate financial planning. Changes in exchange rates can unpredictably and adversely affect our consolidatedoperating results and could result in exchange losses.
Currency Translation Risk. The results of operations and financial position of most of our non-U.S.companies are initially recorded in the currency, which we call of the country in which the respectivecompany resides. That financial information is then translated into U.S. dollars at the applicable exchange rates forinclusion in our Consolidated Financial Statements. The exchange rates between local currencies and the U.S. dollar canfluctuate substantially, which could have a significant translation effect on our reported consolidated results ofoperations and financial position.
Increases and decreases in the value of the U.S. dollar versus local currencies will affect the reported value ofour local currency assets, liabilities, revenues and costs in our Consolidated Financial Statements, even if the value ofthese items has not changed in local currency terms. These translations could significantly and adversely affect ourresults of operations and financial position from period to period.
Currency Transaction Risk. Currency risk exposure also affects our operations when our sales aredenominated in currencies that are different from those in which our manufacturing or sourcing costs are incurred. Inthis case, if after the parties agree on a price, the value of the currency in which the price is to be paid were to weakenrelative to the currency in which we incur manufacturing or sourcing costs, there would be a negative impact on theprofit margin for any such transaction. This transaction risk may exist regardless of whether or not there is also acurrency translation risk as described above.
Currency exchange rate fluctuations in those currencies in which we incur our principal manufacturingexpenses or sourcing costs may adversely affect our ability to compete with companies whose costs are incurred in othercurrencies. If our principal expense currencies appreciate in value against such other currencies, our competitive positionmay be weakened.
Our hedging activities may not protect us against the consequences of significant fluctuations in exchange rates,interest rates or commodity prices on our earnings and cash flows.
Our policy is to hedge material currency exposures by entering into offsetting transactions with third-partyfinancial institutions. Given the effective horizons of our risk management activities and the anticipatory nature of theexposures intended to be hedged, there can be no assurance that our currency hedging activities will fully offset theadverse financial impact resulting from unfavorable movements in foreign exchange rates. In addition, the timing of theaccounting for recognition of gains and losses related to a hedging instrument may not coincide with the timing of gainsand losses related to the underlying economic exposures.
As a resource-intensive operation, we are exposed to a variety of market and asset risks, including the effects ofchanges in commodity prices and interest rates. We monitor and manage these exposures as an integral part of ouroverall risk management program, which recognizes the unpredictability of markets and seeks to reduce the potentiallyadverse effects on our business. As part of our effort to manage these exposures, we may enter into commodity price andinterest rate hedging arrangements. Nevertheless, changes in commodity prices and interest rates cannot always bepredicted or hedged.
If we are unable to successfully manage the risk of changes in exchange rates, interest rates or commodityprices or if our hedging counterparties are unable to perform their obligations under our hedging agreements with them,then changes in these rates and prices could have an adverse effect on our financial condition and results of operations.

10
Increases in costs or limitation of supplies of raw materials may adversely affect our financial performance.
We purchase large amounts of commodity-based raw materials, including steel, copper, aluminum and oil.Prevailing prices for such commodities are subject to fluctuations due to changes in supply and demand and a variety ofadditional factors beyond our control, such as global political and economic conditions. Historically, prices for some ofthese raw materials have been volatile and unpredictable, and such volatility is expected to continue. Therefore,commodity price changes may result in unexpected increases in raw material costs, and we may be unable to increaseour prices to offset these increased costs without suffering reduced volumes, revenues or operating income. We do notfully hedge against changes in commodity prices and our hedging procedures may not work as planned.
We depend on third parties to supply raw materials and other components and may not be able to obtainsufficient quantities of these materials and components, which could limit our ability to manufacture products on atimely basis and could harm our profitability. For some raw materials and components, we rely on a single supplier or asmall number of suppliers. If one of these suppliers were unable to provide us with a raw material or component weneed, our ability to manufacture some of our products could be adversely affected until we are able to establish a newsupply arrangement. We may be unable to find a sufficient alternative supply channel in a reasonable time period or oncommercially reasonable terms, if at all. If our suppliers are unable to deliver sufficient quantities of materials on atimely basis, the manufacture and sale of our products may be disrupted, we might have obligations under ourperformance guarantees and our sales and profitability could be materially adversely affected.
An inability to protect our intellectual property rights could adversely affect our business.
Our intellectual property rights are fundamental to all of our businesses. We generate, maintain, utilize andenforce a substantial portfolio of trademarks, trade dress, patents and other intellectual property rights globally.Intellectual property protection is subject to applicable laws in various local jurisdictions where interpretations andprotections vary or can be unpredictable and costly to enforce. We use our intellectual property rights to protect thegoodwill of our products, promote our product recognition, protect our proprietary technology and developmentactivities, enhance our competitiveness and otherwise support our business goals and objectives. However, there can beno assurance that the steps we take to obtain, maintain and protect our intellectual property rights will be adequate. Ourintellectual property rights may fail to provide us with significant competitive advantages, particularly in foreignjurisdictions that do not have, or do not enforce, strong intellectual property rights. The weakening of protection of ourtrademarks, trade dress, patents and other intellectual property rights could adversely affect our business.
Many of our contracts contain performance obligations that require innovative design capabilities, aretechnologically complex, require state-of-the-art manufacturing expertise or are dependent upon factors not whollywithin our control. Failure to meet these obligations could adversely affect our profitability and future prospects.
We design, develop and manufacture technologically advanced and innovative products and services applied byour customers in a variety of environments. Problems and delays in our development or delivery of products or servicesas a result of issues with respect to design, technology, licensing and patent rights, labor, learning curve assumptions ormaterials and components could prevent us from achieving contractual requirements.
In addition, the quality and efficacy of our products cannot be tested and proven in all situations and areotherwise subject to unforeseen problems. Examples of unforeseen problems that could negatively affect revenue andprofitability include premature failure of products that cannot be accessed for repair or replacement, problems withquality, country of origin, delivery of subcontractor components or services and unplanned degradation of productperformance. In addition, factors such as unforeseen costs and expenses not covered by insurance or indemnificationfrom the customer, diversion of management focus in responding to unforeseen problems, loss of follow-on work, and,in the case of certain contracts, repayment to the customer of contract cost and fee payments we previously received aswell as potential damages, which may significantly exceed the contract price, may affect revenue and profitability.
Industry consolidation could result in more powerful competitors and fewer customers.
Competitors in the industries in which we operate are consolidating. In particular, the automation industry isundergoing consolidation that is reducing the number but increasing the size of companies that compete with us. As ourcompetitors consolidate, they likely will increase their market share, gain economies of scale that enhance their ability tocompete with us and/or acquire additional products and technologies that could displace our product offerings.

11
Our customer base also is undergoing consolidation. Consolidation within our industries (such asthe marine and cruise industry, the automotive, aluminum, steel, pulp and paper and pharmaceutical industries and theoil and gas industry) could affect our customers and their relationships with us. If one of our customersacquires any of our customers, we may lose that business. Additionally, as our customers become larger and moreconcentrated, they could exert pricing pressure on all suppliers, including us. For example, in an industry such as powertransmission, which historically has consisted of large and concentrated customers such as utilities, price competitioncan be a factor in determining which products and services will be selected by a customer. If we were to lose marketshare or customers or face pricing pressure due to consolidation, our results of operations and financial condition couldbe adversely affected.
We are subject to environmental laws and regulations in the countries in which we operate. We incur costs to complywith such regulations, and our ongoing operations may expose us to environmental liabilities.
Our operations are subject to U.S., European and other laws and regulations governing the discharge ofmaterials into the environment or otherwise relating to environmental protection. Our manufacturing facilities use andproduce paint residues, solvents, metals, oils and related residues. We use petroleum-based insulation in transformers,polyvinylchloride (PVC) resin to manufacture PVC cable and chloroparaffin as a flame retardant. We havemanufactured and sold, and we are using in some of our factories, certain types of transformers and capacitorscontaining polychlorinated biphenyls (PCBs). These are considered to be hazardous substances in many jurisdictions inwhich we operate. We may be subject to substantial liabilities for environmental contamination arising from the use ofsuch substances. All of our manufacturing operations are subject to ongoing compliance costs in respect ofenvironmental matters and the associated capital expenditure requirements.
In addition, we may be subject to significant fines and penalties if we do not comply with environmental lawsand regulations including those referred to above. Some environmental laws provide for joint and several or strictliability for remediation of releases of hazardous substances, which could result in us incurring a liability forenvironmental damage without regard to our negligence or fault. Such laws and regulations could expose us to liabilityarising out of the conduct of operations or conditions caused by others, or for our acts which were in compliance with allapplicable laws at the time the acts were performed. Additionally, we may be subject to claims alleging personal injuryor property damage as a result of alleged exposure to hazardous substances. Changes in the environmental laws andregulations, or claims for damages to persons, property, natural resources or the environment, could result in substantialcosts and liabilities to us.
We may be the subject of product liability claims.
We may be required to pay for losses or injuries purportedly caused by the design, manufacture or operation ofour products and systems. Additionally, we may be subject to product liability claims for the improper installation ofproducts and systems designed and manufactured by others.
Product liability claims brought against us may be based in tort or in contract, and typically involve claimsseeking compensation for personal injury or property damage. If the claimant runs a commercial business, claims areoften made also for financial losses arising from interruption of operations. Based on the nature and application of manyof the products we manufacture, a defect or alleged defect in one of these products could have serious consequences. Forexample:
If the products produced by our power technology divisions are defective, there is a risk of fires,explosions and power surges, and significant damage to electricity generating, transmission anddistribution facilities as well as electrical shock causing injury or death.
If the products produced by our automation technology divisions are defective, our customers could suffersignificant damage to facilities and equipment that rely on these products and systems to properly monitorand control their manufacturing processes. Additionally, people could be exposed to electrical shock and/orother harm causing injury or death.
If any of the products produced by us contain hazardous substances then there is a risk that such productsor substances could cause injury or death.
If any protective products produced by us were to fail to function properly, there is a risk that such failurecould cause injury or death.

12
If we were to incur a very large product liability claim, our insurance protection might not be adequate orsufficient to cover such a claim in terms of paying any awards or settlements, and/or paying for our defense costs.Further, some claims may be outside the scope of our insurance coverage. If a litigant were successful against us, a lackor insufficiency of insurance coverage could result in an adverse effect on our business, financial condition, results ofoperations and liquidity. Additionally, a well-publicized actual or perceived problem could adversely affect our marketreputation which could result in a decline in demand for our products and reduce the trading price of our shares.Furthermore, if we were required or we otherwise determined to make a product recall, the costs could be significant.
The results of the United referendum on withdrawal from the European Union may have a negative effecton global economic conditions, financial markets and our business.
We are a multinational company with material business operations in Europe. In June 2016, voters in theUnited Kingdom elected to withdraw from the European Union in an advisory national referendum that has createdsignificant uncertainty about the future relationship between the United Kingdom and the European Union, and hasgiven rise to calls for the governments of other European Union member states to consider withdrawal.
These developments, or the perception that any of them could occur, have had and may continue to have amaterial effect on global economic conditions and the stability of global financial markets, and could significantlyreduce global market liquidity. Lack of clarity about future United Kingdom laws and regulations or futuredevelopments in the European Union could depress economic activity, reduce demand for our products and services andrestrict our access to capital. The terms of any United Kingdom exit from the European Union or the decision by anyother European Union member state to pursue withdrawal, could diminish or eliminate barrier-free access between theUnited Kingdom and other European Union member states or among the European economic area overall. Any of thesefactors could have a material adverse effect on our business, financial condition and results of operations.
We may encounter difficulty in managing our business due to the global nature of our operations.
We operate in approximately 100 countries around the world and, as of December 31, 2016, employed about132,000 people, of which approximately 46 percent were located in Europe, approximately 22 percent in Asia, MiddleEast and Africa and approximately 32 percent in the Americas. In order to manage our day-to-day operations, we mustovercome cultural and language barriers and assimilate different business practices. In addition, we are required to createcompensation programs, employment policies and other administrative programs that comply with the laws of multiplecountries. We also must communicate and monitor group-wide standards and directives across our global network. Ourfailure to manage successfully our geographically diverse operations could impair our ability to react quickly tochanging business and market conditions and to enforce compliance with group-wide standards and procedures.
If we are unable to obtain performance and other guarantees from financial institutions, we may be prevented frombidding on, or obtaining, some contracts, or our costs with respect to such contracts could be higher.
In the normal course of our business and in accordance with industry practice, we provide a number ofguarantees including bid-bonds, advance payment guarantees and performance guarantees, which guarantee our ownperformance. These guarantees may include guarantees that a project will be completed or that a project or particularequipment will achieve defined performance criteria. If we fail to attain the defined criteria, we must make payments incash or in kind. Performance guarantees frequently are requested in relation to large projects in our power andautomation businesses.
Some customers require that performance guarantees be issued by a financial institution. In consideringwhether to issue a guarantee on our behalf, financial institutions consider our credit ratings. In addition, the globalfinancial crisis has made it more difficult and expensive to obtain these guarantees. If, in the future, we cannot obtainsuch a guarantee from a financial institution on commercially reasonable terms or at all, we could be prevented frombidding on, or obtaining, some contracts, or our costs with respect to such contracts could be higher, which wouldreduce the profitability of the contracts. If we cannot obtain guarantees on commercially reasonable terms or at all fromfinancial institutions in the future, there could be a material impact on our business, financial condition, results ofoperations or liquidity.

13
Examinations by tax authorities and changes in tax regulations could result in lower earnings and cash flows.
We operate in approximately 100 countries and therefore are subject to different tax regulations. Changes in taxlaw could result in higher tax expense and payments. Furthermore, this could materially impact our tax receivables andliabilities as well as deferred tax assets and deferred tax liabilities. In addition, the uncertainty of tax environment insome regions could limit our ability to enforce our rights. As a globally operating organization, we conduct business incountries subject to complex tax rules, which may be interpreted in different ways. Future interpretations ordevelopments of tax regimes may affect our tax liability, return on investments and business operations. We areregularly examined by tax authorities in various jurisdictions. An adverse decision by a tax authority could cause amaterial adverse effect on our business, financial condition and results of operations.
If we are unable to attract and retain qualified management and personnel then our business may be adverselyaffected.
Our success depends in part on our continued ability to hire, assimilate and retain highly qualified personnel,particularly our senior management team and key employees. Competition for highly qualified management andtechnical personnel remains intense in the industries and regions in which we operate. If we are unable to attract andretain members of our senior management team and key employees this could have an adverse effect on our business.
Anticipated benefits of existing and potential future mergers, acquisitions, joint ventures or strategic alliances maynot be realized.
As part of our overall strategy, we may, from time to time, acquire businesses or interests in businesses,including noncontrolling interests, or form joint ventures or create strategic alliances. Whether we realize the anticipatedbenefits from these transactions depends, in part, upon the integration between the businesses involved, the performanceand development of the underlying products, capabilities or technologies, our correct assessment of assumed liabilitiesand the management of the operations in question. Accordingly, our financial results could be adversely affected byunanticipated performance and liability issues, transaction-related charges, amortization related to intangibles, chargesfor impairment of long-term assets and partner performance.
There is no guarantee that our ongoing efforts to reduce costs will be successful.
We have announced our intention to reduce costs by approximately $1.3 billion in connection with our ongoingwhite-collar productivity savings program. Lowering our cost base is important for our business and futurecompetitiveness. However, there is no guarantee that we will achieve this goal. In the event that we are unsuccessful andthe shortfall is significant, there could be an adverse effect on our business, financial condition, and results of operations.
Our business strategy may include making strategic divestitures. There can be no assurance that any divestitures willprovide business benefit.
Our strategy includes divesting certain non-core businesses. The divestiture of an existing business couldreduce our future profits and operating cash flows and make our financial results more volatile. We may not find suitablepurchasers for our non-core businesses and may continue to pay operating costs associated with these businesses. Failedattempts to divest non-core businesses may distract attention from other business activities, erodeemployee morale and confidence, and harm our business. A divestiture could also cause a decline in the priceof our shares and increased reliance on other elements of our core business operations. If we do not successfully managethe risks associated with a divestiture, our business, financial condition, and results of operations could be adverselyaffected.
We could be affected by future laws or regulations enacted to address climate change concerns as well as the physicaleffects of climate change.
Existing or pending laws and regulations intended to address climate change concerns could materially affectus in the future. We may need to incur additional costs to comply with these laws and regulations. We could also beaffected indirectly by increased prices for goods or services provided to us by companies that are directly affected bythese laws and regulations and pass their increased costs through to their customers. At this time, we cannot estimatewhat impact such costs may have on our business, results of operations or financial condition. We could also be affectedby the physical consequences of climate change itself, although we cannot estimate what impact those consequencesmight have on our business or operations.

14
Increased information technology (IT) security threats and more sophisticated cyber-attacks could pose a risk to oursystems, networks, products, solutions and services.
We have observed a global increase in IT security threats and more sophisticated cyber-attacks, both in generaland against us, which pose a risk to the security of systems and networks and the confidentiality, availability andintegrity of data stored and transmitted on those systems and networks. While we attempt to mitigate these risks througha number of measures, including employee training, comprehensive monitoring of our networks and systems, andmaintenance of backup and protective systems such as firewalls and virus scanners, our systems, networks, products,solutions and services remain potentially vulnerable to attacks. Similarly, we have observed a continued increase inattacks generally against industrial control systems as well as against our customers and the systems we supplied tothem, which pose a risk to the security of those systems and networks. Depending on their nature and scope, such attackscould potentially lead to the compromising of confidential information, improper use of our systems and networks, orthose we supplied to our customers, manipulation and destruction of data, defective products, production downtimes andsupply shortages, which in turn could adversely affect our reputation, competitiveness and results of operations.
We have identified a material weakness in our internal control over financial reporting that could, if notremediated, result in material inaccuracies in our consolidated financial statements and adversely affect our businessand results of operations.
As described in 15. Controls and we have concluded that our internal control over financialreporting was ineffective as of December 31, 2016, due to a material weakness, which resulted in a failure to preventand detect a misappropriation in our subsidiary in South Korea on a timely basis, and therefore, affected our ability tosafeguard cash. In addition, the control deficiencies resulted in a failure to prevent the Company from being bound tounauthorized financial contracts, resulting in undetected financial obligations at December 31, 2016.
We are currently working to remediate the material weakness. We cannot be certain that the measures we havetaken, and expect to take, will be sufficient to address the deficiencies identified or ensure that our internal control overfinancial reporting is effective. Moreover, as our investigation is ongoing, other material weaknesses or deficiencies maydevelop or be identified in the future. Although we believe that we will be able to remediate the deficiencies identifiedand strengthen our internal control over financial reporting, it may be that our efforts will not be sufficient. If thishappens then there may be material inaccuracies in our consolidated financial statements and our business and results ofoperations may be materially adversely affected.
15
Item 4. Information on the Company
INTRODUCTION
About ABB
ABB is a pioneering technology leader in electrification products, robotics and motion, industrial automationand power grids serving customers in utilities, industry and transport & infrastructure globally. For more than fourdecades, ABB has been part of the industrial digitalization. With more than 70 million devices connected through itsinstalled base of more than 70,000 control systems across all customer segments it serves, ABB is well-positioned tobenefit from the Energy and Fourth Industrial Revolution. With a heritage of more than 130 years, ABB operates inmore than 100 countries with about 132,000 employees.
History of the ABB Group
The ABB Group was formed in 1988 through a merger between Asea AB and BBC Brown Boveri AG. Initiallyfounded in 1883, Asea AB was a major participant in the introduction of electricity into Swedish homes and businessesand in the development of Sweden s railway network. In the 1940s and 1950s, Asea AB expanded into the power,mining and steel industries. Brown Boveri and Cie. (later renamed BBC Brown Boveri AG) was formed in Switzerlandin 1891 and initially specialized in power generation and turbines. In the early to mid-1900s, it expanded its operationsthroughout Europe and broadened its business operations to include a wide range of electrical engineering activities.
In January 1988, Asea AB and BBC Brown Boveri AG each contributed almost all of their businesses to thenewly formed ABB Asea Brown Boveri Ltd, of which they each owned 50 percent. In 1996, Asea AB was renamedABB AB and BBC Brown Boveri AG was renamed ABB AG. In February 1999, the ABB Group announced a groupreconfiguration designed to establish a single parent holding company and a single class of shares. ABB Ltd wasincorporated on March 5, 1999, under the laws of Switzerland. In June 1999, ABB Ltd became the holding company forthe entire ABB Group. This was accomplished by having ABB Ltd issue shares to the shareholders of ABB AG andABB AB, the two companies that formerly owned the ABB Group. The ABB Ltd shares were exchanged for the sharesof those two companies, which, as a result of the share exchange and certain related transactions, became wholly-ownedsubsidiaries of ABB Ltd. ABB Ltd shares are currently listed on the SIX Swiss Exchange, the NASDAQ OMXStockholm Exchange and the New York Stock Exchange (in the form of American Depositary Shares).
Organizational structure
Our business is international in scope and we generate revenues in numerous currencies. We operate inapproximately 100 countries across three regions: Europe, the Americas, and Asia, Middle East and Africa (AMEA).We are headquartered in Zurich, Switzerland.
We manage our business based on a divisional structure, which until December 31, 2016, comprised of fourdivisions: Electrification Products, Discrete Automation and Motion, Process Automation and Power Grids. For abreakdown of our consolidated revenues (i) by operating division and (ii) derived from each geographic region in whichwe operate, see 5. Operating and Financial Review and Prospects Analysis of Results of Operations
Effective January 1, 2017, ABB operates in a streamlined set-up of four divisions: Electrification Products,Robotics and Motion, Industrial Automation and Power Grids. The divisions will be empowered as entrepreneurial unitswithin ABB, reflected in an enhancement of their performance and compensation model focusing on individualaccountability and responsibility. The divisions benefit from sales collaboration orchestrated by regions and countries aswell as from the group-wide digital offering, low-cost centralized administrative structure, common supply chainmanagement and corporate research centers. ABB intends to continue to strengthen its divisions through active portfoliomanagement. This includes pursuing strategic additions, transforming business models and pruning non-core businesses.Electrification Products strives to be the partner of choice for electrification across numerous consumption points,Robotics and Motion strives to be the partner of choice for robotics and intelligent motion solutions, IndustrialAutomation strives to be the partner of choice for industrial automation and Power Grids strives to be the partner ofchoice for stronger, smarter and greener grids. See Divisions Division for additionalinformation related to the realignment of certain business divisions.

16
Except where the context otherwise requires or where otherwise indicated, the information below is presentedto reflect our business prior to this realignment to be consistent with the basis used in preparing our ConsolidatedFinancial Statements.
Our principal corporate offices are located at Affolternstrasse 44, CH-8050 Zurich, Switzerland, telephonenumber +41-43-317-7111. Our agent for U.S. federal securities law purposes is ABB Holdings Inc., located at 12040Regency Parkway, Suite 200, Cary, North Carolina 27518.
BUSINESS DIVISIONS
Our markets
As a pioneering technology leader serving the utilities, industry, and transport & infrastructure markets, ABB isat the heart of the energy and fourth industrial revolutions. The rise of renewable energy is dramatically increasing thecomplexity of the grid, as the number of feed-in points from solar and wind sources multiply and transmission distanceslengthen thus driving the energy revolution. As the contribution of renewables in the energy mix increases, supplybecomes less predictable, driving the need for more equipment and technology to balance demand and supply in thegrid. At the same time, the shift from industrial to service-based economies is changing consumption patterns, makingthem more prone to peaks, and new consumer types, including prosumers, and electric vehicles are already having animpact on grid performance in some parts of the world. These changes are increasing complexity in the grid. At the sametime, demand for electricity is rising, driven by significant increases in the volume of data and the accelerating take-upof electric vehicles. The impact of digitalization is accelerating as more and more devices and systems are equipped withsensors and connectors. With the substantial increase in processing power, it is now possible to remotely monitor thehealth of equipment, machines and robots, and through state-of-the-art performance modelling, to diagnose potentialproblems and to intervene before an interruption of service.
Utilities Market
ABB focuses on the changing needs of utility customers with its complete offering for transmission anddistribution. The ongoing shift in the electricity value chain such as the growth in renewable power generation createsopportunities for companies that are able to deliver intelligent solutions to the challenges customers face with regard toincreased grid complexity and stability. Renewables are also making stand-alone grids possible for remote, off-gridcommunities. Currently, these must be equipped with back-up (diesel) generators to cope with intermittent supply, butinnovations in power storage technology promise to dramatically expand the application of these micro-grids, which areanother key focus for ABB.
With the significant shift in the electricity value chain, integration of renewables, micro-grids and automationsolutions to control the flow are key growth drivers for the future. The grid of tomorrow will increase in complexity asthere will be numerous feed-in points and a shift from uni-directional to bi-directional electricity flow. At the same time,market de-regulation and re-regulation continues. Generation, transmission and distribution are being unbundled, long-standing monopolies now have competitors and new entrants (e.g. pension funds, insurance funds, project developers)are investing in the sector. Many traditional utilities are being forced to reinvent themselves; some are refocusing onrenewables while others on providing additional services to the consumers they serve. These new grid challengesprovide numerous opportunities. More than 30 percent of the market we operate in are in these high-growth segments,such as grid automation, high-voltage direct current (HVDC), software and micro-grids. Our solutions help utilities,which generally are public or government-owned entities and tend to be more consolidated in nature, address thesechallenges.
Utilities remained cautious in 2016 but continued to make selective investments in infrastructure-critical powertransmission projects. For example, ABB has teamed up with national electricity grid operator Power GridCorporation of India Limited in a project with an order value over $640 million for ABB to deliver a transmission linkthat will have the capacity to bring reliable electricity to more than 80 million people. Furthermore, ABB won $300million of orders in China to supply advanced converter transformers for two long-distance ultra-high-voltage directcurrent (UHVDC) transmission links setting a new world record by enabling 10 gigawatts (GW) of power to betransmitted at 800 kilovolts (kV). Additionally, in China ABB won orders of more than $300 million to deliver keyequipment for a 1,100 kV UHVDC power link. ABB also won a $250 million order to deliver a 220 kV high-voltagesubmarine cable system to Danish utility DONG Energy.

17
Industry Market
On the industry side, we serve factories all around the world from discrete to process industries. Energyefficiency and productivity improvements are the hallmarks of offerings in this customer segment. Industrycustomers are diverse in nature and may be publicly traded or privately held companies. Our energy efficient products,systems and services reduce consumption and therefore electricity cost and carbon emissions, while our automationsystems increase productivity, quality and efficiency, and keep workplaces safe. Since industrial customers haveincreasingly been focusing on enhancing energy efficiency and asset productivity, our offering is a key value propositionfor them. Demand from industrial customers in 2016 varied by sector and region. However, low oil prices resulted in acontinued constraint in spending by oil and gas customers. The need for cutting-edge solutions to increase efficiency andto use renewable power generation to lower the environmental impact continued to be important demand drivers. In thiscontext, we launched smart sensor solution for electric motors which can deliver downtime reductions of up to70 percent, extend the lifetime of the motors by up to 30 percent, and reduce energy consumption by 10 percent. Inaddition, demand for robotics solutions in general industry is growing as there is an increased need for automatedprocesses and productivity. YuMi, collaborative robot, helps meet this need.
Transport & Infrastructure Market
Alongside offering for utilities and industry, we provide solutions for transport & infrastructurecustomers. As transport customers focus on energy efficiency and reduced operating costs, our offerings are key.Another key growth driver for this customer segment is the move to increased electric transportation as well asurbanization and growth in data centers. Our expertise has given us the edge when it comes to providing clean andreliable power solutions for transport networks and infrastructure. Demand from the transport & infrastructure market in2016 was mixed, with continued demand for energy efficient solutions, particularly in data centers, rail and electricmobility. For example, ABB continued its collaboration with Stadler Rail to deliver its newest traction equipment forreliable and energy-efficient trains and has received an order to provide additional fast chargers for hybrid electric busesin the city of Luxembourg. Demand for specialty vessel solutions remained strong and ABB won orders to supply thecomplete power, propulsion and automation package for a series of new cruise vessels being built by MV WERFTEN.
proven Azipod propulsion solutions will improve the safety and efficiency of the new generation of ships.
As a global pioneering technology leader, we serve utilities, industry and transport & infrastructure customersthrough our business divisions. These markets and our divisions are discussed in more detail below. Revenue figurespresented in this Business Divisions section are before interdivisional eliminations.
Electrification Products Division
Overview
The Electrification Products division provides solutions across the full electrical value chain from thesubstation to the point of consumption. The innovations from this business enable a safer and more reliable electricalflow, with a full range of low- and medium-voltage products and solutions for intelligent protection and connection aswell as pre-engineered packaged solutions and services tailored to needs. The portfolio withinincreasingly digital and connected solutions includes modular substation packages, distribution automation products,switchgear, circuit breakers, measuring and sensing devices, control products, wiring accessories, and enclosures andcabling systems, including KNX systems (global standard for home and building control) designed to integrate andautomate a lighting, heating and ventilation, and security and data communication networks.
Most of the revenue is derived from sales through distributors, wholesalers, original equipmentmanufacturers (OEMs), system integrators, utilities and panel builders, with some direct sales to end-users, utilitiesand other ABB divisions.
The Electrification Products division had approximately 40,600 employees as of December 31, 2016, andgenerated $9.3 billion of revenues in 2016.

18
Customers
The Electrification Products division serves a wide range of customers who are connecting, protecting andcontrolling electricity from a number of industry segments including buildings, data centers, rail, wind and solar, foodand beverage, marine and oil and gas.
Products and Services
The businesses of the Electrification Products division are more fully described below.
The Protection and Connection business offers products that protect, control and connect people, plants andsystems. ABB offers solutions to restore power rapidly in case of a fault and helps provide optimum protection forpeople and electrical installations. The product offering ranges from miniature circuit breakers to high-capacitymolded-case and air-circuit breakers and includes safety switches used for power distribution in factories andbuildings, switchgear systems for short circuit and overload protection as well as cabling and connection components.In addition, the business offers terminal blocks, a range of contactors, soft starters, starters, proximity sensors, safetyproducts for industrial protection, limit switches and manual motor starters, along with electronic relays and overloadrelays.
The Building Products business provides smart home and intelligent building control systems, also known asKNX protocol, to optimize efficiency, safety and comfort through the automated management of lighting, shutters andsecurity. In addition, the business supplies conventional wiring accessories, industrial plugs and sockets, andenclosures ideal for single family homes, multiple dwellings, commercial buildings, infrastructure and industrialapplications.
The Installation Products business offers products for low-voltage wire and cable management, making the taskof fastening, protecting, insulating and connecting wires easier and quicker for industrial applications, construction,communications, utility and OEM professionals, as well as do-it-yourself specialists. The business offers emergencylighting and lighting for explosive environments, as well as lightning protection and earth grounding apparatus.
The Medium Voltage Products business helps utility, industry and transport & infrastructure customers toimprove power quality and control, reduce outage time and enhance operational reliability and efficiency. Thebusiness offers products and services that largely serve the power distribution sector, often providing the link betweenhigh-voltage transmission systems and low-voltage users. Its comprehensive offering includes medium-voltageequipment (1 to 50 kilovolts), indoor and outdoor circuit breakers, reclosers, fuses, contactors, relays, instrumenttransformers, sensors, motor control centers, ring main units for primary and secondary distribution, as well as a rangeof air- and gas-insulated switchgear. It also produces indoor and outdoor modular systems and other solutions tofacilitate efficient and reliable power distribution.
The Electrification Solutions business offers systems solutions to customers across low- and medium-voltageapplications, integrating the entire offering from the division into complete solutions for customers, adding valuethrough design, engineering, project management and service.
In addition, the service offerings of the Electrification Products division span the entire value chain, from themoment a customer makes the first inquiry to disposal and recycling of the product. Throughout the value chain, ABBprovides training, technical support and customized contracts. All of this is supported by an extensive global sales andservice network.
Sales and Marketing
Sales are primarily made through indirect sales channels such as distributors and wholesalers to end customersincluding installers and system integrators. Direct customers include utilities, panel builders and machine builders, aswell as other ABB divisions. The proportion of direct sales compared to channel partner sales varies among thedifferent industries, product technologies and geographic markets. The business is focused on creating demand tosupport its channel sales, with a range of promotional activities and support services including configuration and otherdigital solutions.

19
Competition
The Electrification Products principal competitors vary by product line, but they include EatonCorporation, Legrand, Schneider, Siemens, Hubbell, Leviton, Rittal and Chint Electrical.
Capital Expenditures
The Electrification Products capital expenditures for property, plant and equipment totaled $200million in 2016, compared to $210 million and $248 million in 2015 and 2014, respectively. Investments in 2016 wereprimarily related to footprint changes, equipment replacement and upgrades. Geographically, in 2016, Europerepresented 52 percent of the capital expenditures, followed by the Americas (32 percent) and AMEA (16 percent).
Discrete Automation and Motion Division
Overview
The Discrete Automation and Motion division provides products, solutions and related services that increaseindustrial productivity and energy efficiency. Our key products such as motors, generators, drives, power electronics androbotics provide power, motion and control for a wide range of automation applications. The leading position in windgenerators and a growing offering in solar complement the industrial focus, leveraging joint technology, channels andoperations platforms.
Revenues are generated both from direct sales to end-users as well as from indirect sales through distributors,machine builders, system integrators, and panel builders.
The Discrete Automation and Motion division had approximately 29,100 employees as of December 31, 2016,and generated $8.7 billion of revenues in 2016.
Products and Services
The businesses of the Discrete Automation and Motion division are more fully described below.
The Robotics business offers robots, controllers, software systems, as well as complete robot automationsolutions and a comprehensive range of advanced services for automotive and Tier One OEMs as well as for the generalindustry. These improve flexibility, quality, productivity and connectivity, as part of the factory of the future. Robots arealso used in activities or environments which may be hazardous to employee health and safety, such as repetitive orstrenuous lifting, dusty, hot or cold rooms, or painting booths. In the automotive industry, robot products and systemsare used in such areas as press shop, body shop, paint shop, power train assembly, trim and final assembly. Generalindustry segments in which robotics solutions are used range from metal fabrication, foundry, plastics, food andbeverage, chemicals and pharmaceuticals, and electronics. Typical robotic applications in general industry includewelding, material handling, machine tending, painting, picking, packing, palletizing and small parts assemblyautomation.
The Motors and Generators business supplies a comprehensive range of electrical motors, generators, andmechanical power transmission products. The range of electrical motors includes high efficiency motors that conform toleading environmental and Minimum Energy Performance Standards (MEPS). Efficiency is an important selectioncriterion for customers, because electric motors account for nearly two-thirds of the electricity consumed by industrialplants. The business unit manufactures synchronous motors for the most demanding applications and a full range oflow- and high-voltage induction motors, for both IEC (International Electrotechnical Commission) and NEMA (NationalElectrical Manufacturers Association) standards. The business unit has recently launched a new condition monitoringsolution for low voltage (LV) motors that monitors and provides vital motor performance intelligence to help improveuptime, extend motor lifetimes, and increase machine performance and productivity. It connects motors with the Internetof Things (IoT).
The Drives and Controls business provides low-voltage and medium-voltage drives and systems for industrial,commercial and residential applications. Drives provide speed, torque and motion control for equipment such as fans,pumps, compressors, conveyors, centrifuges, mixers, hoists, cranes, extruders, printing and textile machines. They areused in industries such as building automation, marine, power, transportation, food and beverage, metals, mining, oil andgas.

20
The Power Conversion business produces excitation and synchronizing systems that provide stability for powerstations and high power rectifiers that convert alternating current (AC) to direct current (DC) for high-currentapplications such as electric arc furnaces and aluminum smelters. It also manufactures solar inverters, wind turbineconverters, uninterruptible power supply systems and converters for power protection, as well as rail traction converters,DC wayside power solutions and a range of solutions for charging of electric vehicles.
The division also offers services that complement its products, including design and project management,engineering, installation, training and life-cycle care, energy efficiency appraisals and preventive maintenance.
Customers
The Discrete Automation and Motion division serves a wide range of customers. Customers include machinerymanufacturers, process industries such as pulp and paper, oil and gas, and metals and mining companies, hybrid andbatch manufacturers such as food and beverage companies, rail equipment manufacturers, discrete manufacturingcompanies such as (computer, communication and consumer electronic), utilities and renewable energy suppliers,particularly in the wind and solar sectors, as well as customers in the automotive industry and electric vehicle chargingnetworks.
Sales and Marketing
Sales are made both through direct sales forces as well as through third-party channel partners, such asdistributors, wholesalers, installers, machine builders and OEMs, system integrators, and panel builders. The proportionof direct sales compared to channel partner sales varies among the different industries, product technologies andgeographic markets.
Competition
The Discrete Automation and Motion principal competitors vary by product line but include FanucRobotics, Kuka Robot Group, Rockwell Automation, Schneider, Siemens, Yaskawa, SMA and WEG Industries.
Capital Expenditures
The Discrete Automation and Motion capital expenditures for property, plant and equipment totaled$128 million in 2016, compared to $145 million and $192 million in 2015 and in 2014, respectively. Principalinvestments in 2016 were primarily related to equipment replacement and upgrades. Geographically, in 2016, Europerepresented 47 percent of the capital expenditures, followed by the Americas (30 percent) and AMEA (23 percent).
Process Automation Division
Overview
The Process Automation division offers customers solutions that are designed to optimize the productivity,energy efficiency and safety of their industrial processes by combining the integrated control products,systems and service offerings with deep domain and process expertise of each end market. Solutions include turnkeyengineering, control systems, measurement products, lifecycle services, outsourced maintenance and industry-specificproducts such as electric propulsion for ships, Azipods, mine hoists, turbochargers and pulp and paper quality controlequipment. The systems can link various processes and information flows which allows customers to manage theirentire manufacturing and business process based on real-time access to plant information. Additionally, the systemsallow customers to increase production efficiency, optimize their assets and reduce environmental waste. Some of theproducts from the Discrete Automation and Motion, Power Grids and Electrification Products divisions are integratedinto the process control and electrification solutions offered by the Process Automation division.
The Process Automation division offerings are available as separately sold products or as part of a totalautomation, electrification and/or instrumentation system. The technologies are sold primarily throughdirect sales forces as well as third-party channels.
The division had approximately 23,600 employees as of December 31, 2016, and generated revenues of$6.6 billion in 2016.

21
Customers
The Process Automation end customers are primarily companies in the oil and gas, minerals andmining, metals, pulp and paper, chemicals and pharmaceuticals, food and beverage, power generation and marineindustries. These customers are looking for complete automation, instrumentation, and electrification solutions thatdeliver value mainly through lower capital costs, increased plant availability, lower lifecycle costs and reduced projectcosts.
Products and Services
The businesses of the Process Automation division are described in more detail below; solutions by end marketas well as the stand alone products and solutions offerings.
The Oil, Gas and Chemicals business provides solutions across the entire hydrocarbon value chain, fromexploration and production to supply, transport and distribution, as well as refining, chemicals and petrochemicals.ABB specializes in mastering the control loop and transforming client operations through actionable insights thatoptimize performance in real time. From the well head to the refinery, ABB technologies connect people with data tooptimize performance, improve reliability, enhance efficiency and minimize environmental impact from project start-up throughout the entire plant life cycle.
Other Process Industry markets served include mining, minerals processing, metals, pharmaceuticals and pulpand paper as well as their associated service industries. The added value is deep industry expertise coupledwith the ability to integrate both automation and electronics, resulting in faster start-up times, increased plantproductivity and reduced overall capital and operating costs for customers. For mining, metals and cement industries,solutions include specialized products and services, as well as total production systems. The business designs, plans,engineers, supplies, erects and commissions electric equipment, drives, motors and equipment for automation andsupervisory control within a variety of areas including mineral handling, mining operations, aluminum smelting, hotand cold steel applications and cement production. In the pharmaceuticals and fine chemicals areas, the business offersapplications to support manufacturing, packaging, quality control and compliance with regulatory agencies. Theoffering for the pulp and paper industries includes quality control systems, control systems, drive systems, on-linesensors, actuators and field instruments.
ABB serves the Power Generation market with leading automation solutions for all types of power generationsuch as coal, gas, combined-cycle, waste-to-energy as well as renewable sources such as hydro, solar, wind andbiomass. With an offering that includes instrumentation and control systems, ABB technologies help optimizeperformance, improve reliability, enhance efficiency and minimize environmental impact throughout the plant lifecycle. The business also serves the water industry, including applications such as pumping stations and desalinationplants.
ABB services the Marine and Ports business through its leading solutions for specialty vessels, container andbulk cargo handling. For the shipping industry, ABB offers an extensive portfolio of integrated marine systems andsolutions that improve the flexibility, reliability and energy efficiency of vessels. By coupling power, automation andmarine software, proven fuel-efficient technologies and services that ensure maximum vessel uptime, ABB is in theposition to improve the profitability of a business throughout the entire lifecycle of a fleet. ABB designs,engineers, builds, supplies and commissions automation and electrical systems for marine power generation, powerdistribution and electric propulsion, as well as turbochargers to improve efficiency. With integrated operationscenters around the world and marine software solutions, owners and operators can run their fleets at lower fuel andmaintenance cost, while improving crew, passenger, and cargo safety and overall productivity of their operations. Inaddition, ABB delivers automation and electrical systems for container and bulk cargo handling - from ship to gate.The systems and services help terminal operators meet the challenge of larger ships, taller cranes and bigger volumesper call, and make terminal operations safer, greener and more productive.
22
ABB offers an extensive portfolio of products and software from stand-alone basic control to integratedcollaborative systems for complex or critical processes. One of the solutions, System 800xA, provides a scalableextended automation system for process and production control, safety, and production monitoring. Freelance, anothersolution, is a full-fledged, easy-to-use distributed control system for small to medium size applications. The PLCAutomation portfolio offers a scalable range for small, middle and high-end applications. Components for basicautomation solutions, process and safety controllers, field interfaces, panels, process recorders and Human MachineInterfaces are available through our Compact Product Suite offering. The product portfolio is complemented byAutomation Sentinel, a subscription-based life cycle management program that provides services to maintain andcontinually advance and enhance ABB control systems (e.g. cyber security patches) and thus allows it to manage acustomer s life cycle costs. The Advanced Services offering provides individual software-based services tocontinuously improve automation and processes. ABB also offers Manufacturing Execution Systems that createagility and transparency for production processes by synchronizing and orchestrating a flow across individualautomation islands. An interactive software platform, Decathlon Software, combines plant operations data fromcontrol systems, enterprise resource planning (ERP) and other data sources into actionable information for decision-makers creates additional customer value. ABB focuses strongly on the human factor and thus offers operatorinterfaces from panels to holistic control room solutions with ergonomic furniture and control centers to driveproductivity, quality and safety to new levels.
The offerings of the Measurement and Analytics business are designed to measure product properties, such asweight, thickness, color, brightness, moisture content and additive content. Actuators allow the customer to makeautomatic adjustments during the production process to improve the quality and consistency of the product. Fieldinstruments measure properties of the process, such as flow rate, chemical content and temperature. The business alsooffers a full line of instrumentation and analytical products to analyze, measure and record industrial and powerprocesses.
ABB manufactures and maintains turbochargers for diesel and gas engines having power levels ranging from500 kilowatts to over 80 megawatts. The business provides engine builders and application operators with advancedturbocharging solutions for efficient and flexible application operations and in compliance with the most stringentenvironmental requirements.
In addition, ABB offers a complete range of lifecycle services across all customer segments to help customersoptimize their assets. Demand for process automation services is driven by customers seeking to increase productivityby improving the performance of existing equipment.
Sales and Marketing
The Process Automation division primarily uses its direct sales force as well as third-party channel partners,such as distributors, system integrators and OEMs. The majority of revenues are derived through the owndirect sales channels.
Competition
The Process Automation principal competitors vary by industry or product line. Competitors includeEmerson, Honeywell, Metso Automation, Rockwell Automation, Schneider, Siemens, Voith, and Yokogawa ElectricCorporation.
Capital Expenditures
The Process Automation capital expenditures for property, plant and equipment totaled $51 millionin 2016, compared to $56 million and $47 million in 2015 and 2014, respectively. Principal investments in 2016 werein turbocharging and the measurement products businesses. Geographically, in 2016, Europe represented 57 percent ofthe capital expenditures, followed by AMEA (23 percent) and Americas (20 percent).

23
Power Grids Division
Overview
The Power Grids division is a global leader in power and automation technologies that help balance thegrowing need for electricity with minimum environmental impact, by enabling a stronger, smarter and greener grid. ThePower Grids division provides electrical and automation product, system, software and service solutions across thepower value chain. These solutions support utility, industry and transport & infrastructure customers to plan, build,operate and maintain their power infrastructure. They are designed to facilitate the safe, reliable and efficient integration,transmission and distribution of bulk and distributed energy generated from conventional and renewable sources.
Around three quarters of the revenues come from utility customers but a significant portion isgenerated from industry and transport & infrastructure customers. Power Grids has a worldwide customer base, with awide spread of revenues from a regional perspective across the Americas, Europe and AMEA. The division also has aglobally diversified and well balanced manufacturing and engineering footprint. Direct sales account for a significantpart of the total revenues and external channel partners such as wholesalers, distributors and OEMs accountfor the rest.
The division had approximately 37,000 employees as of December 31, 2016, and generated $11.0 billion ofrevenues in 2016.
Customers
The Power Grids principal customers include utilities, transmission and distribution owners andoperators as well as industrial, transportation and infrastructure customers.
Products and Services
The businesses of the Power Grids division are more fully described below.
The Grid Systems business is the largest provider of HVDC systems. These systems use LineCommutated Converter (HVDC Classic) technology or Voltage Sourced Converter (HVDC Light) technology. Theportfolio also encompassed high-voltage AC and DC cables, mainly used for subsea or underground applications andHVDC links. It also includes a range of high power semi-conductors, a core technology for power electronics deployedin HVDC, Flexible Alternating Current Transmission Systems (FACTS) and rail applications.
The Grid Integration business is one of the leading providers of transmission and distributionsubstations and associated life-cycle services. The substations are provided either as engineered solutions (systemintegration) or on a turnkey, engineering, procurement, construction (EPC) basis, for utility and non-utility applicationsincluding renewables, rail, data-centers, industry, battery energy storage and shore-to-ship power supply. This businessis also the leading global provider of FACTS, which includes Static Var Compensation (SVC) and static compensator(STATCOM) technology. These systems stabilize voltages, minimize losses, and keep power quality in accordance withgrid codes.
The Transformers business supplies transformers that are an integral component found across the power valuechain, enabling the efficient and safe conversion of electricity to different voltages. ABB is the largest maker oftransformers. The product range is designed for reliability, durability and efficiency with a portfolio that includes powertransformers, dry- and liquid-distribution transformers, traction transformers for rail applications, and special applicationtransformers and related components such as insulation kits, bushings and other transformer accessories. In addition,
power transformers are pushing the voltage barrier to unprecedented levels of 1100 kV DC and 1200 kV AC,facilitating more power to be transported longer distances with minimum losses. Other technology developments includegrid-resilient transformers designed to withstand physical attack, eco-efficient transformers using biodegradable oil andinnovative sensor-based as well as software-leveraging solutions for remote maintenance and asset optimization.
The High Voltage products business is a global leader in high voltage switchgear with a portfolio spanning air-insulated, gas-insulated and hybrid technologies. It also manufactures generator circuit breakers, a key product forintegrating large power plants into the grid. The portfolio also includes a broad range of capacitors and filters thatfacilitate power quality as well as instrument transformers and other substation components.

24
The Grid Automation business is at the forefront of grid automation and digitalization. It supplies substationautomation products, systems and services. It also provides Supervisory Control and Data Acquisition (SCADA)systems for transmission and distribution networks as well as a range of wireless, fiber optic and power line carrierbased telecommunication technologies for mission critical applications. This business also offers microgrid solutionsthat are being increasingly deployed for remote and partially grid connected applications. Also included in this businessis the enterprise software portfolio a provider of an industry-leading suite of software solutions that help utilities andother asset-intensive industries (e.g. rail, mining) manage, maintain and optimize their assets.
The division also provides services which represent an increasing part of each business and which are agrowing focus area for the division with its significant installed product base. The portfolio of services offered includesspare parts, installation, commissioning, condition monitoring and maintenance services, on- and off-site repairs as wellas retrofits and upgrades. Increasingly more advanced software-based monitoring and advisory services are being addedto the portfolio to support the development of the digitalization of the grids.
Competition
On a global basis, the Power Grids division faces worldwide competition across its portfolio mainly fromSiemens and General Electric (GE Alstom). It also competes in specific geographies and in parts of the business withcompanies such as Hyundai, Hyosung, Crompton Greaves, TBEA and NARI. The breadth of its portfolio, technologyand innovation, a global footprint and a vast installed base enable the division to maintain its leading position in thepower sector.
Capital Expenditures
The Power Grids capital expenditures for property, plant and equipment totaled $203 million in2016, compared to $191 million and $242 million in 2015 and 2014, respectively. Principal investments in 2016 wererelated to capacity expansion as well as the replacement of existing equipment, particularly in Sweden, the U.S. andSwitzerland. Geographically, in 2016, Europe represented 68 percent of the capital expenditures, followed by theAmericas (19 percent) and AMEA (13 percent).
Corporate and Other
Corporate and Other includes headquarters, central research and development, our real estate activities, GroupTreasury Operations and other minor business activities. In addition, we have classified the historical business activitiesof significant divested businesses in Corporate and Other.
Corporate headquarters and stewardship activities include the operations of our corporate headquarters inZurich, Switzerland, as well as corporate-related activities in various countries. These activities cover staff functionswith group-wide responsibilities, such as accounting and financial reporting, corporate finance and taxes, planning andcontrolling, internal audit, legal and integrity, compliance, risk management and insurance, corporate communications,information systems, investor relations and human resources.
Corporate research and development primarily covers our research activities, as our development activities areorganized under the four business divisions. We have two global research laboratories, one focused on powertechnologies and the other focused on automation technologies, which both work on technologies relevant to the futureof our four business divisions. Each laboratory works on new and emerging technologies and collaborates withuniversities and other external partners to support our divisions in advancing relevant technologies and in developingcross-divisional technology platforms. We have corporate research centers in seven countries (China, India, Germany,Poland, Sweden, Switzerland and the U.S.).
Corporate and Other had approximately 2,000 employees at December 31, 2016.
Division realignment
On October 4, 2016, we announced a planned change in the composition of the business portfolio of our fourdivisions. Effective January 1, 2017, the scope of the Electrification Products division has been expanded to include theelectric vehicle charging, solar, and power quality businesses from the Discrete Automation and Motion division.

25
In addition, the Discrete Automation and Motion division has been renamed the Robotics and Motion divisionwhile the Process Automation division has been renamed the Industrial Automation division.
CAPITAL EXPENDITURES
Total capital expenditures for property, plant and equipment and intangible assets (excluding intangiblesacquired through business combinations) amounted to $831 million, $876 million, $1,026 million in 2016, 2015 and2014, respectively. In 2016, 2015 and 2014, capital expenditures were 27 percent, 24 percent and 21 percent lower,respectively, than depreciation and amortization (excluding acquisition-related amortization, capital expenditures were3 percent lower and 3 percent and 11 percent higher, respectively, than depreciation and amortization).
Capital expenditures in 2016 remained at a significant level in mature markets, reflecting the geographicdistribution of our existing production facilities. Capital expenditures in Europe and North America in 2016 were drivenprimarily by upgrades and maintenance of existing production facilities, mainly in the U.S., Sweden, Switzerland andGermany. Capital expenditures in emerging markets were highest in China, Poland, India, and Turkey. Capitalexpenditures in emerging markets were made primarily to increase production capacity by investment in new orexpanded facilities. The share of emerging markets capital expenditures as a percentage of total capital expenditures in2016, 2015 and 2014 was 35 percent, 31 percent and 29 percent, respectively.
At December 31, 2016, construction in progress for property, plant and equipment was $515 million, mainly inthe U.S., China, Sweden, Switzerland and Germany. At December 31, 2015, construction in progress for property, plantand equipment was $559 million, mainly in Sweden, the U.S., China, Switzerland and Germany, while at December 31,2014, construction in progress for property, plant and equipment was $653 million mainly in Sweden, the U.S.,Switzerland, Saudi Arabia and China.
Our capital expenditures relate primarily to property, plant and equipment. For 2017, we estimate theexpenditures for property, plant and equipment will be higher than our annual depreciation and amortization charge(excluding acquisition-related amortization).
SUPPLIES AND RAW MATERIALS
We purchase a variety of raw materials and products which contain raw materials for use in our production andproject execution processes. The primary materials used in our products, by weight, are copper, aluminum, carbon steel,mineral oil and various plastics. We also purchase a wide variety of fabricated products and electronic components. Weoperate a worldwide supply chain management network with employees dedicated to this function in our businesses andkey countries. Our supply chain management network consists of a number of teams, each focusing on different productcategories. These category teams, on global, divisional and/or regional level, take advantage of opportunities to leveragethe scale of ABB and to optimize the efficiency of our supply networks, in a sustainable manner.
Our supply chain management organization s activities have continued to expand in recent years, to:
pool and leverage procurement of materials and services,
provide transparency of ABB s global spending through a comprehensive performance and reportingsystem linked to our ERP systems,
strengthen ABB s supply chain network by implementing an effective product category managementstructure and extensive competency-based training, and
monitor and develop our supply base to ensure sustainability, both in terms of materials and processesused.
We buy many categories of products which contain steel, copper, aluminum, crude oil and other commodities.Continuing global economic growth in many emerging economies, coupled with the volatility in foreign currencyexchange rates, has led to significant fluctuations in these raw material costs over the last few years. While we expectglobal commodity prices to remain highly volatile, we expect to offset some market volatility through the use oflong-term contracts and global sourcing.
26
We seek to mitigate the majority of our exposure to commodity price risk by entering into hedges. For example,we manage copper and aluminum price risk using principally swap contracts based on prices for these commoditiesquoted on leading exchanges. ABB s hedging policy is designed to safeguard margins by minimizing price volatility andproviding a stable cost base during order execution. In addition to using hedging to reduce our exposure to fluctuationsin raw materials prices, in some cases we can reduce this risk by incorporating changes in raw materials prices into theprices of our products (through price escalation clauses).
Overall, during 2016 supply chain management personnel in our businesses, and in the countries in which weoperate, along with the global category teams, continued to focus on value chain optimization efforts in all areas, whilemaintaining and improving quality and delivery performance.
In August 2012, the United States Securities and Exchange Commission (SEC) issued its final rules regardingConflict Minerals , as required by section 1502 of the Dodd-Frank Wall Street Reform and Consumer Protection Act.
We initiated conflict minerals processes in 2013 and have continuously improved and tailored the processes to our valuechain. We continue to work with our suppliers and customers, to enable us to comply with the rules and disclosureobligations. Further information on ABB s Conflict Minerals policy and supplier requirements can be found underMaterial Compliance at new.abb.com/about/supplying
PATENTS AND TRADEMARKS
As a technology-driven company, we believe that intellectual property rights are crucial to protect the assets ofour business. Over the past ten years, we have substantially increased the number of first patent filings, and we intend tocontinue our aggressive approach to seeking patent protection. Currently, we have approximately 25,700 patentapplications and registrations, of which more than 9,200 are pending applications. In addition to these patents, we havemore than 3,700 utility model and design applications and registrations, of which more than 1,100 are pendingapplications. In 2016, we filed more than 700 patent, utility model and design applications for more than 1,500 newinventions. Based on our existing intellectual property strategy, we believe that we have adequate control over our coretechnologies. The ABB trademarks and logo are protected in all of the countries in which we operate. We aggressivelydefend our intellectual property rights to safeguard the reputation associated with the ABB technology and brand. Whilethese intellectual property rights are fundamental to all of our businesses, there is no dependency of the business on anysingle patent, utility model or design application.
SUSTAINABILITY ACTIVITIES
Sustainability management is one of our highest business priorities. We seek to address sustainability issues inall our business operations in order to improve our social, safety and environmental performance continuously, and toenhance the quality of life in the communities and countries where we operate.
Our social and environmental efforts include:
implementing sustainability objectives covering all relevant parts of our operations,
joining initiatives that foster economic, environmental, social and educational development, and strengthenobservance of human rights in business practice,
making positive contributions in the communities where we operate so they welcome us and consider ABBa good neighbor, an attractive employer and a good investment,
offering our customers eco-efficient products that save energy and are safe to use, that optimize the use ofnatural resources, minimize waste and reduce environmental impact over their complete life cycles,
applying non-financial risk assessment to key business decision-making processes, and to projects,
sharing our latest technologies with emerging markets by, for example, helping customers in developingcountries implement environmentally sound processes and technologies and providing environmentalawareness and safety training to our business partners,

27
ensuring that our operations and processes comply with applicable environmental and health and safetystandards and social legislation. Specifically, every operating unit must implement an environmentalmanagement system that seeks to continuously improve its environmental performance and a health andsafety management system that similarly seeks to continuously improve health and safety performance,
ensuring that our social, health and safety and environmental policies are communicated and implemented,
working towards achieving best practices in occupational health and safety, and ensuring the health andsafety of our employees, contractors and others involved in or affected by our activities,
ensuring that suppliers have sustainability policies and systems that are comparable with our own, and
continuing our program to decontaminate sites that were polluted by historical manufacturing processes.
To manage environmental aspects of our own operations, we have implemented environmental managementsystems according to the ISO 14001 standard at our manufacturing and service sites. For non-manufacturing sites wehave implemented an adapted environmental management system in order to ensure management of environmentalaspects and continual improvement of performance. Globally, operations at 392 sites and offices are covered byexternally certified environmental management systems.
We have Environmental Product Declarations to communicate the environmental performance of our coreproducts. These describe the significant environmental aspects and impacts of a product line, viewed over its completelife cycle. Declarations are based on Life Cycle Assessment studies, created according to the international standardISO/TR 14025. Approximately 70 declarations for major product lines are published on our Web site (www.abb.com),some of which have been externally certified.
In 2016, approximately 97 percent of our employees were covered by confirmed data gathered throughformal environmental reporting system that is verified by an independent verification body. The operations of companiesacquired during 2016 are not yet covered by our environmental reporting. We expect that this reporting will beimplemented in 2017. The remaining parts of our business that are not yet covered by our environmental reportingsystem, mainly sales, have very limited environmental exposure. A total of 38 environmental incidents were reported in2016, none of which had a material environmental impact.
In 2016, substantially all of our employees were covered by confirmed data gathered through formalsocial reporting system that is verified by an independent verification body. The remaining parts of our business that arenot yet covered by our social reporting system, mainly sales offices in countries where we do not performmanufacturing, have very limited social exposure.
REGULATION
Our operations are subject to numerous governmental laws and regulations including those governing antitrustand competition, corruption, the environment, securities transactions and disclosures, import and export of products,currency conversions and repatriation, taxation of foreign earnings and earnings of expatriate personnel and use of localemployees and suppliers.
As a reporting company under Section 12 of the U.S. Securities Exchange Act of 1934, we are subject to theFCPA s anti-bribery provisions with respect to our conduct around the world.
Our operations are also subject to the 1997 OECD Convention on Combating Bribery of Foreign PublicOfficials in International Business Transactions. The convention obliges signatories to adopt national legislation thatmakes it a crime to bribe foreign public officials. Those countries which have adopted implementing legislation andhave ratified the convention include the U.S. and several European nations in which we have significant operations.

28
We conduct business in certain countries known to experience governmental corruption. While we arecommitted to conducting business in a legal and ethical manner, our employees or agents have taken, and in the futuremay take, actions that violate the U.S. FCPA, legislation promulgated pursuant to the 1997 OECD Convention onCombating Bribery of Foreign Public Officials in International Business Transactions, antitrust laws or other laws orregulations. These actions have resulted and could result in monetary or other penalties against us and could damage ourreputation and, therefore, our ability to do business. For more information, see Item 8. Financial Information LegalProceedings
The U.S. Iran Threat Reduction and Syria Human Rights Act of 2012 requires U.S. listed companies to discloseinformation relating to certain transactions with Iran. With the partial lifting of international sanctions, from January2016, ABB started to seek business opportunities in Iran. In 2016, certain non-U.S. subsidiaries of ABB, in accordancewith applicable laws, provided electrical equipment to an EPC contracting company and on-site services to a customer inthe shipping industry. The revenues attributable to these products and services in 2016 amounted to approximately $6million. We are abiding by remaining applicable sanctions.
ORGANIZATIONAL STRUCTURE
ABB Ltd is the ultimate parent company of the ABB Group. Its sole shareholding is in ABB Asea BrownBoveri Ltd which directly or indirectly owns the other companies in the ABB Group. The table below both sets forth, asof December 31, 2016, the name, place of incorporation and ownership interest of the significant direct and indirectsubsidiaries of ABB Ltd, Switzerland. operational group structure is described above in thesection of Item 4.

29
Company name/location CountryABB
interest %
SARPI - Société Algérienne pour la réalisation de projets industriels, Alger Algeria 50.00ABB S.A., Buenos Aires Argentina 100.00ABB Australia Pty Limited, Moorebank, NSW Australia 100.00ABB Group Investment Management Pty. Ltd., Moorebank, NSW Australia 100.00ABB N.V., Zaventem Belgium 100.00ABB Ltda., Osasco Brazil 100.00ABB Bulgaria EOOD, Sofia Bulgaria 100.00ABB Canada Holding Limited Partnership, Saint-Laurent, Quebec Canada 100.00ABB Inc., Saint-Laurent, Quebec Canada 100.00Thomas & Betts Limited, Saint-Jean-sur-Richelieu, Quebec Canada 100.00ABB Beijing Drive Systems Co. Ltd., Beijing China 90.00ABB (China) Ltd., Beijing China 100.00ABB Engineering (Shanghai) Ltd., Shanghai China 100.00ABB High Voltage Switchgear Co. Ltd., Beijing China 60.00ABB Xiamen Low Voltage Equipment Co. Ltd., Xiamen China 100.00ABB Xiamen Switchgear Co. Ltd., Xiamen China 64.30ABB Xinhui Low Voltage Switchgear Co. Ltd., Xinhui China 90.00ABB s.r.o., Prague Czech Republic 100.00ABB A/S, Skovlunde Denmark 100.00ABB for Electrical Industries (ABB ARAB) S.A.E., Cairo Egypt 100.00Asea Brown Boveri S.A.E., Cairo Egypt 100.00ABB AS, Jüri Estonia 100.00ABB Oy, Helsinki Finland 100.00ABB France, Cergy Pontoise France 99.83ABB S.A., Cergy Pontoise France 100.00ABB AG, Mannheim Germany 100.00ABB Automation GmbH, Mannheim Germany 100.00ABB Automation Products GmbH, Ladenburg Germany 100.00ABB Beteiligungs- und Verwaltungsges. mbH, Mannheim Germany 100.00ABB Stotz-Kontakt GmbH, Heidelberg Germany 100.00Busch-Jaeger Elektro GmbH, Lüdenscheid Germany 100.00ABB Holding Ltd., Hong Kong Hong Kong 100.00ABB (Hong Kong) Ltd., Hong Kong Hong Kong 100.00ABB Global Industries and Services Private Limited, Bangalore India 100.00ABB India Limited, Bangalore India 75.00ABB S.p.A., Milan Italy 100.00Power-One Italy S.p.A., Terranuova Bracciolini (AR) Italy 100.00ABB K.K., Tokyo Japan 100.00ABB Ltd., Seoul Korea, Republic of 100.00ABB Holdings Sdn. Bhd., Subang Jaya Malaysia 100.00ABB Malaysia Sdn. Bhd., Subang Jaya Malaysia 100.00ABB Mexico S.A. de C.V., San Luis Potosi SLP Mexico 100.00

30
Company name/location CountryABB
interest %
Asea Brown Boveri S.A. de C.V., San Luis Potosi SLP Mexico 100.00ABB B.V., Rotterdam Netherlands 100.00ABB Capital B.V., Rotterdam Netherlands 100.00ABB Finance B.V., Rotterdam Netherlands 100.00ABB Holdings B.V., Rotterdam Netherlands 100.00ABB Investments B.V., Rotterdam Netherlands 100.00ABB AS, Billingstad Norway 100.00ABB Holding AS, Billingstad Norway 100.00ABB Sp. z o.o., Warsaw Poland 99.92ABB Ltd., Moscow Russian Federation 100.00ABB Contracting Company Ltd., Riyadh Saudi Arabia 65.00ABB Electrical Industries Ltd., Riyadh Saudi Arabia 65.00ABB Holdings Pte. Ltd., Singapore Singapore 100.00ABB Pte. Ltd., Singapore Singapore 100.00ABB Holdings (Pty) Ltd., Longmeadow South Africa 100.00ABB South Africa (Pty) Ltd., Longmeadow South Africa 74.91Asea Brown Boveri S.A., Madrid Spain 100.00ABB AB, Västerås Sweden 100.00ABB Norden Holding AB, Västerås Sweden 100.00ABB Asea Brown Boveri Ltd, Zurich Switzerland 100.00ABB Information Systems Ltd., Zurich Switzerland 100.00ABB Investment Holding GmbH, Zurich Switzerland 100.00ABB Management Services Ltd., Zurich Switzerland 100.00ABB Schweiz AG, Baden Switzerland 100.00ABB Turbo Systems AG, Baden Switzerland 100.00ABB LIMITED, Bangkok Thailand 100.00ABB Elektrik Sanayi A.S., Istanbul Turkey 99.95ABB Industries (L.L.C.), Dubai United Arab Emirates 49.00 (1)
ABB Holdings Limited, Warrington United Kingdom 100.00ABB Limited, Warrington United Kingdom 100.00ABB Finance (USA) Inc., Wilmington, DE United States 100.00ABB Holdings Inc., Cary, NC United States 100.00ABB Inc., Cary, NC United States 100.00ABB Treasury Center (USA), Inc., Wilmington, DE United States 100.00Baldor Electric Company, Fort Smith, AR United States 100.00Edison Holding Corporation, Wilmington, DE United States 100.00Thomas & Betts Corporation, Knoxville, TN United States 100.00Verdi Holding Corporation, Wilmington, DE United States 100.00
(1) Company consolidated as ABB exercises full management control.

31
DESCRIPTION OF PROPERTY
As of December 31, 2016, we occupy real estate in around 100 countries throughout the world. The facilitiesconsist mainly of manufacturing plants, office buildings, research centers and warehouses. A substantial portion of ourproduction and development facilities are situated in the U.S., China, Sweden, Germany, Italy, Finland, India,Switzerland, Canada and Poland. We also own or lease other properties, including office buildings, warehouses, researchand development facilities and sales offices in many countries. We own substantially all of the machinery and equipmentused in our manufacturing operations.
From time to time, we have a surplus of space arising from acquisitions, production efficiencies and/orrestructuring of operations. Normally, we seek to sell such surplus space which may involve leasing property to thirdparties for an interim period.
The net book value of our property, plant and equipment at December 31, 2016, was $4,743 million, of whichmachinery and equipment represented $2,109 million, land and buildings represented $2,119 million and construction inprogress represented $515 million. We believe that our current facilities are in good condition and are adequate to meetthe requirements of our present and foreseeable future operations.
Item 4A. Unresolved Staff Comments
Not applicable
Item 5. Operating and Financial Review and Prospects
MANAGEMENT OVERVIEW
In 2016, we continued our Next Level transformation aimed at accelerating sustainable value creation andachieved significant results in our three focus areas: profitable growth, relentless execution and business-ledcollaboration.
Profitable growth
To drive a growth mindset, we adopted ourfocus on greater competitiveness, organic growth, and reducing risks by aligning business models more closely with ourcore competencies. In 2016, the PIE initiatives helped mitigate market headwinds resulting in a stable revenuedevelopment in local currencies (however, in U.S. dollars revenues declined 5 percent). There was positive demand instrategic growth areas such as food and beverage and robotics, while demand from other areas such as process marketsremained subdued. Improving growth momentum resulted in order growth in the fourth quarter of 2016, supported bystrong growth in key markets such as the U.S. and China.
At our Capital Markets Day in October 2016, we announced our decision related to the strategic portfolioreview of our Power Grids division. We intend to continue the Power Grids transformation under ABB ownership,with the focus on high-growth segments and digitally enabled services and software. As part of the ongoingtransformation, we intend to continue to de-risk the Power Grids business model while tapping growth opportunitiesthrough strategic partnerships, such as those with two leading EPC companies, Fluor and Aibel, announced in 2016. The
large orders included a $640 million UHVDC systems order for Raigarh-Pugalur in India and a $100 million order forthe upgrade of the Sylmar converter station of the Pacific Intertie high-voltage direct current power link in the U.S.
We laid the groundwork for future growth with our quantum leap in digital around ABB AbilityTM whichwe launched at our Capital Markets Day in October 2016. ABB AbilityTM
and services across all customer segments, cementing our leading position in the Fourth Industrial Revolution andsupport the competiveness of our four entrepreneurial divisions. We entered into a far-reaching strategic partnershipwith Microsoft to develop next-generation digital solutions on an integrated cloud platform. We believe that ourcustomers will benefit from the unique combination of our deep domain knowledge and extensive portfolio of industrial
, as well as B2B engineering competence. Together, we believe thepartners will drive digital tra -mobility. Our digital transformation will be led by our Chief Digital Officer, Guido Jouret, a pioneer in the Internet ofThings, who joined ABB on October 1, 2016, reporting to our CEO, Ulrich Spiesshofer.

32
As of 2017, ABB is driving growth in four market-leading entrepreneurial divisions: Electrification Products,Robotics and Motion, Industrial Automation and Power Grids. The new division structure was effective January 1, 2017,and is now fully operational. The divisions are expected to drive growth as entrepreneurial units within ABB, in linewith one of our core valuescompensation model, which focuses on individual accountability and responsibility. The divisions benefit from sales
well as from the group-wide digital offering, a low-costcentralized administrative structure, common supply chain management and corporate research centers. We plan tocontinue to strengthen our divisions through active portfolio management. This includes pursuing strategic additions,transforming business models and pruning non-core businesses.
Relentless execution
The transformation of Power Grids continues. In 2016, the division increased Operational EBITA by 16percent, mainly driven by improved productivity, solid project execution and continued cost savings. These resultsreflect the success of the previously announced is expectedto continue to drive further transformation and value creation through its previously announced Inlight of this strong operational excellence performance, ABB increased the profitability targets for this division effectiveJanuary 1, 2018.
A key objective of the Next Level strategy is to achieve world-class operational excellence at all levels of thecompany. The White Collar Productivity savings program has outperformed expectations since its launch in 2015. As a
. In 2016, the White CollarProductivity savings program amounted to $0.6 billion. We also continued to deliver on our regular cost-savingsprogram of achieving savings equivalent to an expected 3-5 percent of cost of sales each year. We continued to executeour Net Working Capital program, which aims to free-up approximately $2 billion from 2015-2017. In 2016, we reducedworking capital by around $550 million bringing the total reduction to $900 million for the first two years of theprogram.
In addition, we continued to align and drive our new performance-based compensation model, which has beenimplemented for 70,000 of our 132,000 employees.
Business-led collaboration
We are adopting a single corporate brand, consolidating all our brands around the world under one umbrella.Our portfolio of companies is being unified, showcasing the full breadth and depth of ABBmaster brand. The unified brand plays a key part in realizing the value potential of our digital offering, as we expect itwill increase brand loyalty, price premiums and purchase probability. The brand features design elements intended to
nd allother stakeholders. Our heritage as a pioneering technology leader and the three focus areas of our Next Level strategyare reflected in our TM
Over the past two years, we have simplified our organizational setup, reducing the number of global regionsfrom eight to three, and the divisions from five to four. In addition, many business units have been relocated closer totheir key markets and customers, leading to a more responsive, customer-focused organization. The work is not over, buttoday ABB is a simpler, faster and more agile company, positioned at the heart of the Energy and Fourth IndustrialRevolutions, and ready to take advantage of the exciting growth opportunities that are emerging across its markets.
Next Level strategy stage 3
On October 4, 2016, we launched stage 3 of our Next Level strategy to unlock additional value forshareholders and customers. Building on the focus areas of profitable growth, relentless execution and business -led collaboration, stage 3 consists of four actions:
Driving growth in four market-leading entrepreneurial divisions,
Quantum leap in digital,
Accelerating momentum in operational excellence, and

33
Strengthening the global ABB brand.
Driving growth in four market-leading, entrepreneurial units
We are driving growth in four market leading entrepreneurial divisions: Electrification Products, Robotics andMotion, Industrial Automation and Power Grids. The new division structure was effective January 1, 2017, and is nowfully operational.
A quantum leap in digital with ABB Ability TM
The ABB AbilityTM offering combines our portfolio of digital solutions and services across all customersegments, cementing our leading position in the Fourth Industrial Revolution and supporting the competitiveness of ourfour entrepreneurial divisions. With ABB AbilityTM, we see an annual addressable market of up to $20 billion.
Accelerating momentum in operational excellence
The White Collar Productivity savings program is on track to deliver the increased cost reduction target of $1.3billion (run rate end of 2017). We intend to achieve these additional savings within the initially announced timeframeand for approximately $200 million lower of total combined restructuring program costs and implementation costs thaninitially announced in 2015. We are continuing our regular cost-savings programs to achieve savings equivalent to anexpected 3-5 percent of cost of sales each year.
We continue to deliver on our Net Working Capital program which plans to free-up a total of $2 billion by theend of 2017. In the first two years of the program, we have freed up approximately $900 million.
We are adopting a single corporate brand, consolidating all our brands around the world under one umbrella.Our portfolio of companies is being unified, showcasing the full breadth and depth of our global offering under onemaster brand. The unified brand plays a key part in realizing the value potential of our digital offering, as we expect itwill increase brand loyalty, price premiums and purchase probability.
Capital allocation
Our shareholders are expected to benefit from our expected strong cash generation and financial positionthrough a new share buyback program of up to $3 billion from 2017 through 2019. In addition, the Board ofDirectors is proposing an eighth consecutive increase in the dividend to 0.76 Swiss francs per share at the 2017AGM.
funding organic growth, research and development, and capital expenditures at attractive cashreturns,
paying a steadily rising, sustainable dividend,
investing in value-creating acquisitions, and
returning additional cash to shareholders.
As a pioneering technology leader, committed to unlocking value, we believe we are well positioned tocapture growth opportunities as the Energy and Fourth Industrial Revolutions unfold. We have a cleartransformation plan to drive earnings per share and cash return on invested capital, as well as an efficient balancesheet to generate attractive returns for shareholders.
34
South Korea
One very unfortunate development was that ABB uncovered a sophisticated criminal scheme involvingsignificant embezzlement and misappropriation of funds in its South Korean subsidiary. The companyimmediately launched a thorough investigation, involving internal and external parties, which is progressing well.The company has checked and reconfirmed the balances of its global bank accounts and can confirm that thissituation is limited to South Korea. ABB has a zero-tolerance approach to unethical behavior and maintains thehighest standards regarding integrity and ethical business practices. We have started implementing disciplinaryconsequences and will continue to do so as appropriate. Due to the investigation, ABB had to postpone thepublication of its 2016 annual report.
Outlook
Macroeconomic and geopolitical developments are signaling a mixed picture with continued uncertainty. Somemacroeconomic signs in the U.S. remain positive and growth in China is expected to continue. The overall global marketremains impacted by modest growth and increased uncertainties, such as the United potential withdrawalfrom the European Union and geopolitical tensions in various parts of the world. Oil prices and foreign exchangetranslation effects are expected to continue to influence our results. With this and the ongoing transformation of ABB,we expect 2017 to be a transitional year.
The attractive long-term demand outlook in our three major customer sectors utilities, industry and transport& infrastructure is driven by the Energy and Fourth Industrial Revolutions.
We believe we are well positioned to tap into these opportunities for long-term profitable growth with ourstrong market presence, broad geographic and business scope, technology leadership and financial strength.
APPLICATION OF CRITICAL ACCOUNTING POLICIES
General
We prepare our Consolidated Financial Statements in accordance with U.S. GAAP and present these in U.S.dollars unless otherwise stated.
The preparation of our financial statements requires us to make assumptions and estimates that affect thereported amounts of assets, liabilities, revenues and expenses and the related disclosure of contingent assets andliabilities. We evaluate our estimates on an ongoing basis, including, but not limited to, those related to: gross profitmargins on long-term construction-type contracts; costs of product guarantees and warranties; provisions for bad debts;recoverability of inventories, investments, fixed assets, goodwill and other intangible assets; the fair values of assets andliabilities assumed in business combinations; income tax expenses and provisions related to uncertain tax positions;pensions and other postretirement benefit assumptions; and legal and other contingencies. Where appropriate, we baseour estimates on historical experience and on various other assumptions that we believe to be reasonable under thecircumstances, the results of which form the basis for making judgments about the carrying values of assets andliabilities that are not readily apparent from other sources. Actual results may differ from our estimates and assumptions.
We deem an accounting policy to be critical if it requires an accounting estimate to be made based onassumptions about matters that are highly uncertain at the time the estimate is made and if different estimates thatreasonably could have been used, or if changes in the accounting estimates that are reasonably likely to occurperiodically, could materially impact our Consolidated Financial Statements. We also deem an accounting policy to becritical when the application of such policy is essential to our ongoing operations. We believe the following criticalaccounting policies require us to make difficult and subjective judgments, often as a result of the need to make estimatesregarding matters that are inherently uncertain. These policies should be considered when reading our ConsolidatedFinancial Statements.

35
Revenue recognition
We generally recognize revenues for the sale of goods when persuasive evidence of an arrangement exists,delivery has occurred, the price is fixed or determinable, and collectability is reasonably assured. With regard to the saleof products, delivery is not considered to have occurred, and therefore no revenues are recognized, until the customerhas taken title to the products and assumed the risks and rewards of ownership of the products specified in the purchaseorder or sales agreement. Generally, the transfer of title and risks and rewards of ownership are governed by thecontractually-defined shipping terms. We use various International Commercial shipping terms (as promulgated by theInternational Chamber of Commerce) such as Ex Works (EXW), Free Carrier (FCA) and Delivered Duty Paid (DDP).Subsequent to delivery of the products, we generally have no further contractual performance obligations that wouldpreclude revenue recognition.
Revenues under long-term construction-type contracts are generally recognized using thepercentage-of-completion method of accounting. We use the cost-to-cost method to measure progress towardscompletion on contracts. Under this method, progress of contracts is measured by actual costs incurred in relation tomanagement s best estimate of total estimated costs, which are reviewed and updated routinely for contracts in progress.The cumulative effect of any change in estimate is recorded in the period in which the change in estimate is determined.
The percentage-of-completion method of accounting involves the use of assumptions and projections,principally relating to future material, labor and project-related overhead costs. As a consequence, there is a risk thattotal contract costs will exceed those we originally estimated and the margin will decrease or the long-termconstruction-type contract may become unprofitable. This risk increases if the duration of a contract increases becausethere is a higher probability that the circumstances upon which we originally developed estimates will change, resultingin increased costs that we may not recover. Factors that could cause costs to increase include:
unanticipated technical problems with equipment supplied or developed by us which may require us toincur additional costs to remedy,
changes in the cost of components, materials or labor,
difficulties in obtaining required governmental permits or approvals,
project modifications creating unanticipated costs,
suppliers or subcontractors failure to perform, and
delays caused by unexpected conditions or events.
Changes in our initial assumptions, which we review on a regular basis between balance sheet dates, may resultin revisions to estimated costs, current earnings and anticipated earnings. We recognize these changes in the period inwhich the changes in estimates are determined. By recognizing changes in estimates cumulatively, recorded revenue andcosts to date reflect the current estimates of the stage of completion of each project. Additionally, losses on long-termcontracts are recognized in the period when they are identified and are based upon the anticipated excess of contractcosts over the related contract revenues.
Short-term construction-type contracts, or long-term construction-type contracts for which reasonablydependable estimates cannot be made or for which inherent hazards make estimates difficult, are accounted for under thecompleted-contract method. Revenues under the completed-contract method are recognized upon substantialcompletion that is: acceptance by the customer, compliance with performance specifications demonstrated in a factoryacceptance test or similar event.
For non construction-type contracts that contain customer acceptance provisions, revenue is deferred untilcustomer acceptance occurs or we have demonstrated the customer-specified objective criteria have been met or thecontractual acceptance period has lapsed.

36
Revenues from service transactions are recognized as services are performed. For long-term service contracts,revenues are recognized on a straight-line basis over the term of the contract or, if the performance pattern is other thanstraight-line, as the services are provided. Service revenues reflect revenues earned from our activities in providingservices to customers primarily subsequent to the sale and delivery of a product or complete system. Such revenuesconsist of maintenance-type contracts, field service activities that include personnel and accompanying spare parts, andinstallation and commissioning of products as a stand-alone service or as part of a service contract.
Revenues for software license fees are recognized when persuasive evidence of a non-cancelable licenseagreement exists, delivery has occurred, the license fee is fixed or determinable, and collection is probable. In softwarearrangements that include rights to multiple software products and/or services, the total arrangement fee is allocatedusing the residual method, under which revenue is allocated to the undelivered elements based on vendor-specificobjective evidence (VSOE) of fair value of such undelivered elements and the residual amounts of revenue are allocatedto the delivered elements. Elements included in multiple element arrangements may consist of software licenses,maintenance (which includes customer support services and unspecified upgrades), hosting, and consulting services.VSOE is based on the price generally charged when an element is sold separately or, in the case of an element not yetsold separately, the price established by authorized management, if it is probable that the price, once established, will notchange once the element is sold separately. If VSOE does not exist for an undelivered element, the total arrangement feewill be recognized as revenue over the life of the contract or upon delivery of the undelivered element.
We offer multiple element arrangements to meet our customers needs. These arrangements may involve thedelivery of multiple products and/or performance of services (such as installation and training) and the delivery and/orperformance may occur at different points in time or over different periods of time. Deliverables of such multipleelement arrangements are evaluated to determine the unit of accounting and if certain criteria are met, we allocaterevenues to each unit of accounting based on its relative selling price. A hierarchy of selling prices is used to determinethe selling price of each specific deliverable that includes VSOE (if available), third-party evidence (if VSOE is notavailable), or estimated selling price if neither of the first two is available. The estimated selling price reflects our bestestimate of what the selling prices of elements would be if the elements were sold on a stand-alone basis. Revenue isallocated between the elements of an arrangement consideration at the inception of the arrangement. Such arrangementsgenerally include industry-specific performance and termination provisions, such as in the event of substantial delays ornon-delivery.
Revenues are reported net of customer rebates and similar incentives. Taxes assessed by a governmentalauthority that are directly imposed on revenue-producing transactions between us and our customers, such as sales, use,value-added and some excise taxes, are excluded from revenues.
These revenue recognition methods require the collectability of the revenues recognized to be reasonablyassured. When recording the respective accounts receivable, allowances are calculated to estimate those receivables thatwill not be collected. These reserves assume a level of default based on historical information, as well as knowledgeabout specific invoices and customers. The risk remains that actual defaults will vary in number and amount from thoseoriginally estimated. As such, the amount of revenues recognized might exceed or fall below the amount which will becollected, resulting in a change in earnings in the future. The risk of deterioration is likely to increase during periods ofsignificant negative industry, economic or political trends.
As a result of the above policies, judgment in the selection and application of revenue recognition methodsmust be made.

37
Contingencies
As more fully described in Item 8. Financial Information Legal Proceedings and in Note 15 Commitmentsand contingencies to our Consolidated Financial Statements, we are subject to proceedings, litigation or threatenedlitigation and other claims and inquiries related to environmental, labor, product, regulatory, tax (other than income tax)and other matters. We are required to assess the likelihood of any adverse judgments or outcomes to these matters, aswell as potential ranges of probable losses. A determination of the provision required, if any, for these contingencies ismade after analysis of each individual issue, often with assistance from both internal and external legal counsel andtechnical experts. The required amount of a provision for a contingency of any type may change in the future due to newdevelopments in the particular matter, including changes in the approach to its resolution.
We record provisions for our contingent obligations when it is probable that a loss will be incurred and theamount can be reasonably estimated. Any such provision is generally recognized on an undiscounted basis using ourbest estimate of the amount of loss or at the lower end of an estimated range when a single best estimate is notdeterminable. In some cases, we may be able to recover a portion of the costs relating to these obligations from insurersor other third parties; however, we record such amounts only when it is probable that they will be collected.
We provide for anticipated costs for warranties when we recognize revenues on the related products orcontracts. Warranty costs include calculated costs arising from imperfections in design, material and workmanship inour products. We generally make individual assessments on contracts with risks resulting from order-specific conditionsor guarantees and assessments on an overall, statistical basis for similar products sold in larger quantities. There is a riskthat actual warranty costs may exceed the amounts provided for, which would result in a deterioration of earnings in thefuture when these actual costs are determined.
Pension and other postretirement benefits
As more fully described in Note 17 Employee benefits to our Consolidated Financial Statements, we have anumber of defined benefit pension and other postretirement plans and recognize an asset for a plan s overfunded statusor a liability for a plan s underfunded status in our Consolidated Balance Sheets. We measure such a plan s assets andobligations that determine its funded status as of the end of the year.
Significant differences between assumptions and actual experience, or significant changes in assumptions, maymaterially affect the pension obligations. The effects of actual results differing from assumptions and the changing ofassumptions are included in net actuarial loss within Accumulated other comprehensive loss .
We recognize actuarial gains and losses gradually over time. Any cumulative unrecognized actuarial gain orloss that exceeds 10 percent of the greater of the present value of the projected benefit obligation (PBO) and the fairvalue of plan assets is recognized in earnings over the expected average remaining working lives of the employeesparticipating in the plan, or the expected average remaining lifetime of the inactive plan participants if the plan iscomprised of all or almost all inactive participants. Otherwise, the actuarial gain or loss is not recognized in theConsolidated Income Statements.
We use actuarial valuations to determine our pension and postretirement benefit costs and credits. The amountscalculated depend on a variety of key assumptions, including discount rates, mortality rates and expected return on planassets. Under U.S. GAAP, we are required to consider current market conditions in making these assumptions. Inparticular, the discount rates are reviewed annually based on changes in long-term, highly-rated corporate bond yields.Decreases in the discount rates result in an increase in the PBO and in pension costs. Conversely, an increase in thediscount rates results in a decrease in the PBO and in pension costs. The mortality assumptions are reviewed annually bymanagement. Decreases in mortality rates result in an increase in the PBO and in pension costs. Conversely, an increasein mortality rates results in a decrease in the PBO and in pension costs.
Holding all other assumptions constant, a 0.25-percentage point decrease in the discount rate would haveincreased the PBO related to our defined benefit pension plans by $394 million while a 0.25-percentage point increase inthe discount rate would have decreased the PBO related to our defined benefit pension plans by $362 million.
38
The expected return on plan assets is reviewed regularly and considered for adjustment annually based upon thetarget asset allocations and represents the long-term return expected to be achieved. Decreases in the expected return onplan assets result in an increase to pension costs. Holding all other assumptions constant, an increase or decrease of0.25 percentage points in the expected long-term rate of asset return would have decreased or increased, respectively, thenet periodic benefit cost in 2016 by $24 million.
The funded status, which can increase or decrease based on the performance of the financial markets or changesin our assumptions, does not represent a mandatory short-term cash obligation. Instead, the funded status of a definedbenefit pension plan is the difference between the PBO and the fair value of the plan assets. At December 31, 2016, ourdefined benefit pension plans were $1,403 million underfunded compared to an underfunding of $1,481 million atDecember 31, 2015. Our other postretirement plans were underfunded by $147 million and $178 million atDecember 31, 2016 and 2015, respectively.
We have multiple non-pension postretirement benefit plans. Our health care plans are generally contributorywith participants contributions adjusted annually. For purposes of estimating our health care costs, we have assumedhealth care cost increases to be 7.33 percent per annum for 2017, gradually declining to 5.00 percent per annum by 2028and to remain at that level thereafter.
Income taxes
In preparing our Consolidated Financial Statements, we are required to estimate income taxes in each of thejurisdictions in which we operate. Tax expense from continuing operations is reconciled from the weighted-averageglobal tax rate (rather than from the Swiss domestic statutory tax rate) as the parent company of the ABB Group,ABB Ltd, is domiciled in Switzerland. Income which has been generated in jurisdictions outside of Switzerland(hereafter foreign jurisdictions ) and has already been subject to corporate income tax in those foreign jurisdictions is,to a large extent, tax exempt in Switzerland. Therefore, generally no or only limited Swiss income tax has to be providedfor on the repatriated earnings of foreign subsidiaries. There is no requirement in Switzerland for a parent company of agroup to file a tax return of the group determining domestic and foreign pre-tax income and as our consolidated incomefrom continuing operations is predominantly earned outside of Switzerland, corporate income tax in foreign jurisdictionslargely determines our global weighted-average tax rate.
We account for deferred taxes by using the asset and liability method. Under this method, we determinedeferred tax assets and liabilities based on temporary differences between the financial reporting and the tax bases ofassets and liabilities. Deferred tax assets and liabilities are measured using the enacted tax rates and laws that areexpected to be in effect when the differences are expected to reverse. We recognize a deferred tax asset when it is morelikely than not that the asset will be realized. We regularly review our deferred tax assets for recoverability and establisha valuation allowance based upon historical losses, projected future taxable income and the expected timing of thereversals of existing temporary differences. To the extent we increase or decrease this allowance in a period, werecognize the change in the allowance within Provision for taxes in the Consolidated Income Statements unless thechange relates to discontinued operations, in which case the change is recorded in Income (loss) from discontinuedoperations, net of tax . Unforeseen changes in tax rates and tax laws, as well as differences in the projected taxableincome as compared to the actual taxable income, may affect these estimates.
Certain countries levy withholding taxes, dividend distribution taxes or additional corporate income taxes(hereafter withholding taxes ) on dividend distributions. Such taxes cannot always be fully reclaimed by theshareholder, although they have to be declared and withheld by the subsidiary. Switzerland has concluded doubletaxation treaties with many countries in which we operate. These treaties either eliminate or reduce such withholdingtaxes on dividend distributions. It is our policy to distribute retained earnings of subsidiaries, insofar as such earnings arenot permanently reinvested or no other reasons exist that would prevent the subsidiary from distributing them. Nodeferred tax liability is set up, if retained earnings are considered as permanently reinvested, and used for financingcurrent operations as well as business growth through working capital and capital expenditure in those countries.

39
We operate in numerous tax jurisdictions and, as a result, are regularly subject to audit by tax authorities. Weprovide for tax contingencies whenever it is deemed more likely than not that a tax asset has been impaired or a taxliability has been incurred for events such as tax claims or changes in tax laws. Contingency provisions are recordedbased on the technical merits of our filing position, considering the applicable tax laws and OECD guidelines and arebased on our evaluations of the facts and circumstances as of the end of each reporting period. Changes in the facts andcircumstances could result in a material change to the tax accruals. Although we believe that our tax estimates arereasonable and that appropriate tax reserves have been made, the final determination of tax audits and any relatedlitigation could be different than that which is reflected in our income tax provisions and accruals.
An estimated loss from a tax contingency must be accrued as a charge to income if it is more likely than notthat a tax asset has been impaired or a tax liability has been incurred and the amount of the loss can be reasonablyestimated. We apply a two-step approach to recognize and measure uncertainty in income taxes. The first step is toevaluate the tax position for recognition by determining if the weight of available evidence indicates that it is morelikely than not that the position will be sustained on audit, including resolution of related appeals or litigation processes,if any. The second step is to measure the tax benefit as the largest amount which is more than 50 percent likely of beingrealized upon ultimate settlement. The required amount of provisions for contingencies of any type may change in thefuture due to new developments.
Goodwill and other intangible assets
We review goodwill for impairment annually as of October 1, or more frequently if events or circumstancesindicate the carrying value may not be recoverable. We use either a qualitative or quantitative assessment method foreach reporting unit. The qualitative assessment involves determining, based on an evaluation of qualitative factors,whether it is more likely than not that the fair value of a reporting unit is less than its carrying amount. If, based on thisqualitative assessment, it is determined to be more likely than not that the reporting unit s fair value is less than itscarrying value, the two-step quantitative impairment test is performed. If we elect not to perform the qualitativeassessment for a reporting unit, then we perform the two-step impairment test.
Our reporting units are the same as our business divisions for Electrification Products, Discrete Automation andMotion, and Power Grids. For the Process Automation division, we determined the reporting units to be one level belowthe division, as the different products produced or services provided by this division do not share sufficiently similareconomic characteristics to permit testing of goodwill on a total division level.
When performing the qualitative assessment, we first determine, for a reporting unit, factors which would affectthe fair value of the reporting unit including: (i) macroeconomic conditions related to the business, (ii) industry andmarket trends, and (iii) the overall future financial performance and future opportunities in the markets in which thebusiness operates. We then consider how these factors would impact the most recent quantitative analysis of thereporting unit s fair value. Key assumptions in determining the value of the reporting unit include the projected level ofbusiness operations, the weighted-average cost of capital, the income tax rate and the terminal growth rate.
If, after performing the qualitative assessment, we conclude that events or circumstances have occurred whichwould indicate that it is more likely than not that the fair value of the reporting unit is less than its carrying value, or ifwe have elected not to perform a qualitative assessment, the two-step quantitative impairment test is performed. In thefirst step, we calculate the fair value of the reporting unit (using an income approach whereby the fair value is calculatedbased on the present value of future cash flows applying a discount rate that represents our weighted-average cost ofcapital) and compare it to the reporting unit s carrying value. Where the fair value of the reporting unit exceeds thecarrying value of the net assets assigned to that unit, goodwill is not impaired and no further testing is performed.However, if the carrying value of the net assets assigned to the reporting unit is equal to or exceeds the reporting unit sfair value, we would perform the second step of the impairment test. In the second step, we would determine the impliedfair value of the reporting unit s goodwill and compare it to the carrying value of the reporting unit s goodwill. If thecarrying value of a reporting unit s goodwill were to exceed its implied fair value, then we would record an impairmentloss equal to the difference. Any goodwill impairment losses would be recorded as a separate line item in the incomestatement in continuing operations, unless related to a discontinued operation, in which case the losses would berecorded in Income (loss) from discontinued operations, net of tax .

40
In 2016, we performed the two-step quantitative impairment test for all of our reporting units to reflect newassumptions and forecasts resulting from our newly-developed strategic plan for the period 2017 to 2020. Thequantitative test concluded that the estimated fair values for each of our reporting units exceeded their respectivecarrying values by more than 100 percent and as no reporting unit had a zero or negative carrying value, we concludedthat none of the reporting units was at risk of failing the goodwill impairment test. Consequently, the second step ofthe impairment test was not performed.
The projected future cash flows used in the 2016 fair value calculation were based on approved business plansfor the reporting units which covered a period of four years plus a calculated terminal value. The projected future cashflows required significant judgments and estimates involving variables such as future sales volumes, sales prices, awardsof large orders, production and other operating costs, capital expenditures, net working capital requirements and othereconomic factors. The after-tax weighted-average cost of capital of 8 percent was based on variables such as the risk freerate derived from the yield of 10-year U.S. treasury bonds as well as an ABB-specific risk premium. The terminal valuegrowth rate was assumed to be 1 percent. The mid-term tax rate used in the test was 27 percent. We based our fair valueestimates on assumptions we believed to be reasonable, but which were inherently uncertain. Consequently, actual futureresults may differ from those estimates.
We assessed the reasonableness of the fair value calculations of our reporting units by reconciling the sum ofthe fair values for all our reporting units to our total market capitalization. The assumptions used in the fair valuecalculation were challenged each year (through the use of sensitivity analysis) to determine the impact on the fair valueof the reporting units. Our sensitivity analysis in 2016 showed that, holding all other assumptions constant, a 1-percentage point increase in the discount rate would have reduced the calculated fair value by approximately 12.9percent, while a 1-percentage point decrease in the terminal value growth rate would have reduced the calculated fairvalue by approximately 9.7 percent.
For 2015, our reporting units were the same as our former business divisions (Discrete Automation and Motion,Low Voltage Products, Power Products and Power Systems) with the exception of Process Automation, where they weredetermined to be one level below. In 2015, we performed a qualitative assessment and determined that it was not morelikely than not that the fair value for each of these reporting units was below the carrying value. As a result, weconcluded that it was not necessary to perform the two-step quantitative impairment test.
Intangible assets are reviewed for recoverability upon the occurrence of certain triggering events (such as adecision to divest a business or projected losses of an entity) or whenever events or changes in circumstances indicatethat the carrying amount may not be recoverable. We record impairment charges in Other income (expense), net , inour Consolidated Income Statements, unless they relate to a discontinued operation, in which case the charges arerecorded in Income (loss) from discontinued operations, net of tax .
NEW ACCOUNTING PRONOUNCEMENTS
For a description of accounting changes and recent accounting pronouncements, including the expected dates ofadoption and estimated effects, if any, on our Consolidated Financial Statements, see Note 2 Significant accountingpolicies to our Consolidated Financial Statements.
RESEARCH AND DEVELOPMENT
Each year, we invest significantly in research and development. Our research and development focuses ondeveloping and commercializing the technologies of our businesses that are of strategic importance to our future growth.In 2016, 2015, and 2014, we invested $1,300 million, $1,406 million and $1,499 million, respectively, or approximately3.8 percent, 4.0 percent and 3.8 percent, respectively, of our annual consolidated revenues on research and developmentactivities. We also had expenditures of $155 million, $271 million and $310 million, respectively, or approximately0.5 percent, 0.8 percent and 0.8 percent, respectively, of our annual consolidated revenues in 2016, 2015 and 2014, onorder-related development activities. These are customer- and project-specific development efforts that we undertake todevelop or adapt equipment and systems to the unique needs of our customers in connection with specific orders orprojects. Order-related development amounts are initially recorded in inventories as part of the work in process of acontract and then are reflected in cost of sales at the time revenue is recognized in accordance with our accountingpolicies.

41
In addition to continuous product development, and order-related engineering work, we develop platforms fortechnology applications in our automation and power businesses in our research and development laboratories, whichoperate on a global basis. Through active management of our investment in research and development, we seek tomaintain a balance between short-term and long-term research and development programs and optimize our return oninvestment.
Universities are incubators of future technology, and a central task of our research and development team is totransform university research into industry-ready technology platforms. We collaborate with a number of universitiesand research institutions to build research networks and foster new technologies. We believe these collaborations shortenthe amount of time required to turn basic ideas into viable products, and they additionally help us recruit and train newpersonnel. We have built numerous university collaborations in the U.S., Europe and Asia, including long-term, strategicrelationships with the Carnegie Mellon University, Massachusetts Institute of Technology, North Carolina StateUniversity, ETH Zurich, EPFL Lausanne, Royal Institute of Technology (KTH) Stockholm, Cambridge University,Imperial College London, Huazhong University of Science and Technology (HUST) and Jiaotong University(XJTU). Our collaborative projects include research on materials, sensors, micro-engineered mechanical systems,robotics, controls, manufacturing, distributed power and communication. Common platforms for power and automationtechnologies are developed around advanced materials, efficient manufacturing, information technology and datacommunication, as well as sensor and actuator technology.
Common applications of basic power and automation technologies can also be found in power electronics,electrical insulation, and control and optimization. Our power technologies, including our insulation technologies,current interruption and limitation devices, power electronics, flow control and power protection processes, apply asmuch to large, reliable, blackout-free transmission systems as they do to everyday household needs. Our automationtechnologies, including our control and optimization processes, power electronics, sensors and microelectronics,mechatronics and wireless communication processes, are designed to improve efficiency in plants and factories aroundthe world, including our own.
ACQUISITIONS AND DIVESTMENTS
Divestments and Assets held for sale
There were no significant divestments in 2016 and 2015.
During 2014, ABB divested several businesses which were primarily its Full Service business, the Meyer SteelStructures business of Thomas & Betts, the heating, ventilation and air conditioning (HVAC) business of Thomas &Betts and the Power Solutions business of Power-One. Total cash proceeds from all business divestments during 2014amounted to $1,090 million, net of transaction costs and cash disposed.
In September 2016, ABB announced an agreement to divest its high-voltage cable system business (Cablesbusiness). The assets and liabilities of this business are shown as assets and liabilities held for sale in our ConsolidatedBalance Sheet as at December 31, 2016. The divestment was completed on March 1, 2017.
For more information on our divestments, see Note 3 Acquisitions and business divestments to ourConsolidated Financial Statements.
EXCHANGE RATES
We report our financial results in U.S. dollars. Due to our global operations, a significant amount of ourrevenues, expenses, assets and liabilities are denominated in other currencies. As a consequence, movements inexchange rates between currencies may affect: (i) our profitability, (ii) the comparability of our results between periods,and (iii) the reported carrying value of our assets and liabilities.
We translate non-USD denominated results of operations, assets and liabilities to USD in our ConsolidatedFinancial Statements. Balance sheet items are translated to USD using year-end currency exchange rates. Incomestatement and cash flow items are translated to USD using the relevant monthly average currency exchange rate.

42
Increases and decreases in the value of the USD against other currencies will affect the reported results ofoperations in our Consolidated Income Statements and the value of certain of our assets and liabilities in ourConsolidated Balance Sheets, even if our results of operations or the value of those assets and liabilities have notchanged in their original currency. As foreign exchange rates impact our reported results of operations and the reportedvalue of our assets and liabilities, changes in foreign exchange rates could significantly affect the comparability of ourreported results of operations between periods and result in significant changes to the reported value of our assets,liabilities and stockholders equity.
While we operate globally and report our financial results in USD, exchange rate movements between the USDand both the EUR and the CHF are of particular importance to us due to (i) the location of our significant operations and(ii) our corporate headquarters being in Switzerland.
The exchange rates between the USD and the EUR and the USD and the CHF at December 31, 2016, 2015 and2014, were as follows:
Exchange rates into $ 2016 2015 2014EUR 1.00 1.05 1.09 1.22CHF 1.00 0.98 1.01 1.01
The average exchange rates between the USD and the EUR and the USD and the CHF for the years endedDecember 31, 2016, 2015 and 2014, were as follows:
Exchange rates into $ 2016 2015 2014EUR 1.00 1.10 1.11 1.33CHF 1.00 1.01 1.04 1.09
When we incur expenses that are not denominated in the same currency as the related revenues, foreignexchange rate fluctuations could affect our profitability. To mitigate the impact of exchange rate movements on ourprofitability, it is our policy to enter into forward foreign exchange contracts to manage the foreign exchange transactionrisk of our operations.
In 2016, approximately 80 percent of our consolidated revenues were reported in currencies other than theUSD. The following percentages of consolidated revenues were reported in the following currencies:
Euro, approximately 20 percent,
Chinese renminbi, approximately 13 percent, and
Swedish krona, approximately 5 percent.
In 2016, approximately 79 percent of our cost of sales and selling, general and administrative expenses werereported in currencies other than the USD. The following percentages of consolidated cost of sales and selling, generaland administrative expenses were reported in the following currencies:
Euro, approximately 19 percent,
Chinese renminbi, approximately 11 percent, and
Canadian Dollar, approximately 5 percent.
We also incur expenses other than cost of sales and selling, general and administrative expenses in variouscurrencies.
The results of operations and financial position of many of our subsidiaries outside of the United States arereported in the currencies of the countries in which those subsidiaries are located. We refer to these currencies as localcurrencies . Local currency financial information is then translated into USD at applicable exchange rates for inclusionin our Consolidated Financial Statements.

43
The discussion of our results of operations below provides certain information with respect to orders, revenues,income from operations and other measures as reported in USD (as well as in local currencies). We measureperiod-to-period variations in local currency results by using a constant foreign exchange rate for all periods undercomparison. Differences in our results of operations in local currencies as compared to our results of operations in USDare caused exclusively by changes in currency exchange rates.
While we consider our results of operations as measured in local currencies to be a significant indicator ofbusiness performance, local currency information should not be relied upon to the exclusion of U.S. GAAP financialmeasures. Instead, local currencies reflect an additional measure of comparability and provide a means of viewingaspects of our operations that, when viewed together with the U.S. GAAP results, provide a more completeunderstanding of factors and trends affecting the business. As local currency information is not standardized, it may notbe possible to compare our local currency information to other companies financial measures that have the same or asimilar title. We encourage investors to review our financial statements and publicly-filed reports in their entirety andnot to rely on any single financial measure.
ORDERS
Our policy is to book and report an order when a binding contractual agreement has been concluded with acustomer covering, at a minimum, the price and scope of products or services to be supplied, the delivery schedule andthe payment terms. The reported value of an order corresponds to the undiscounted value of revenues that we expect torecognize following delivery of the goods or services subject to the order, less any trade discounts and excluding anyvalue added or sales tax. The value of orders received during a given period of time represents the sum of the value of allorders received during the period, adjusted to reflect the aggregate value of any changes to the value of orders receivedduring the period and orders existing at the beginning of the period. These adjustments, which may in the aggregateincrease or decrease the orders reported during the period, may include changes in the estimated order price up to thedate of contractual performance, changes in the scope of products or services ordered and cancellations of orders.
The undiscounted value of revenues we expect to generate from our orders at any point in time is representedby our order backlog. Approximately 13 percent of the value of total orders we recorded in 2016 were large orderswhich we define as orders from third parties involving a value of at least $15 million for products or services.Approximately 78 percent of the total value of large orders in 2016 were recorded by our Power Grids division andapproximately 14 percent in our Process Automation division. The other divisions accounted for the remainder of thetotal large orders recorded during 2016. The remaining portion of total orders recorded in 2016 was base orders whichwe define as orders from third parties with a value of less than $15 million for products or services.
The level of orders fluctuates from year to year. Portions of our business involve orders for long-term projectsthat can take months or years to complete and many large orders result in revenues in periods after the order is booked.Consequently, the level of large orders and orders generally cannot be used to accurately predict future revenues oroperating performance. Orders that have been placed can be cancelled, delayed or modified by the customer. Theseactions can reduce or delay any future revenues from the order or may result in the elimination of the order.
PERFORMANCE MEASURES
We evaluate the performance of our divisions based on orders received, revenues and Operational EBITA.
In 2016, the Company modified the definition of Operational EBITA to also exclude non-operational pensioncost and changes in estimates relating to opening balance sheets of acquired businesses (changes in pre-acquisitionestimates). After these revisions, Operational EBITA represents income from operations excluding (i) amortizationexpense on intangibles arising upon acquisitions (acquisition-related amortization), (ii) restructuring andrestructuring-related expenses, (iii) non-operational pension cost, (iv) changes in pre-acquisition estimates, (v) gains andlosses from sale of businesses, acquisition-related expenses and certain other non-operational items, as well as(vi) foreign exchange (FX)/commodity timing differences in income from operations consisting of: (a) unrealized gainsand losses on derivatives (foreign exchange, commodities, embedded derivatives), (b) realized gains and losses onderivatives where the underlying hedged transaction has not yet been realized, and (c) unrealized foreign exchangemovements on receivables/payables (and related assets/liabilities).

44
See Note 23 Operating segment and geographic data to our Consolidated Financial Statements for areconciliation of the total consolidated Operational EBITA to income from continuing operations before taxes.
ANALYSIS OF RESULTS OF OPERATIONS
Our consolidated results from operations were as follows:
INCOME STATEMENT DATA:
($ in millions, except per share data in $) 2016 2015 2014Orders 33,379 36,429 41,515Order backlog at December 31, 22,981 24,121 24,900
Revenues 33,828 35,481 39,830Cost of sales (24,081) (25,347) (28,615)Gross profit 9,747 10,134 11,215Selling, general and administrative expenses (5,349) (5,574) (6,067)Non-order related research and development expenses (1,300) (1,406) (1,499)Other income (expense), net (111) (105) 529Income from operations 2,987 3,049 4,178Net interest and other finance expense (188) (209) (282)Provision for taxes (781) (788) (1,202)Income from continuing operations, net of tax 2,018 2,052 2,694Income from discontinued operations, net of tax 16 3 24Net income 2,034 2,055 2,718Net income attributable to noncontrolling interests (135) (122) (124)Net income attributable to ABB 1,899 1,933 2,594
Amounts attributable to ABB shareholders:Income from continuing operations, net of tax 1,883 1,930 2,570Net income 1,899 1,933 2,594
Basic earnings per share attributable to ABB shareholders:Income from continuing operations, net of tax 0.88 0.87 1.12Net income 0.88 0.87 1.13
Diluted earnings per share attributable to ABB shareholders:Income from continuing operations, net of tax 0.87 0.87 1.12Net income 0.88 0.87 1.13
A more detailed discussion of the orders, revenues, Operational EBITA and income from operations for ourdivisions follows in the sections of Divisional analysis below entitled DiscreteAutomation and Motion , Process Automation , Power and Corporate and Other . Orders and revenues of ourdivisions include interdivisional transactions which are eliminated in the Corporate and Other line in the tables below.
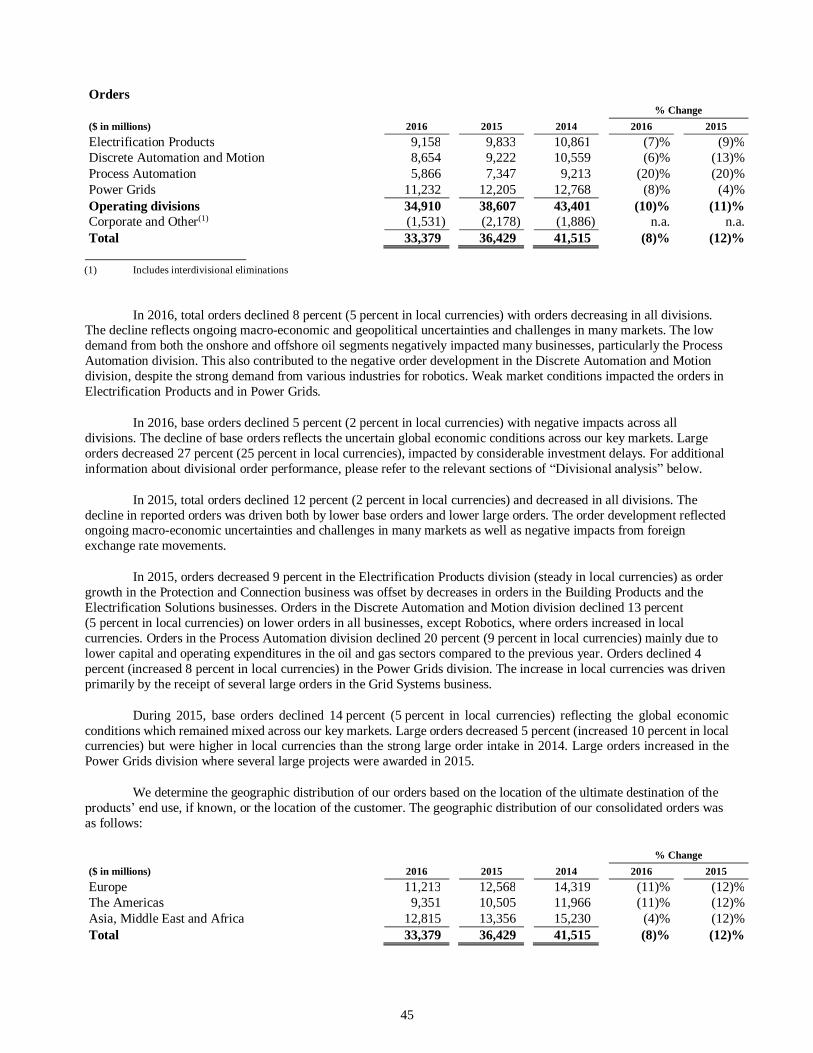
45
Orders% Change
($ in millions) 2016 2015 2014 2016 2015Electrification Products 9,158 9,833 10,861 (7)% (9)%Discrete Automation and Motion 8,654 9,222 10,559 (6)% (13)%Process Automation 5,866 7,347 9,213 (20)% (20)%Power Grids 11,232 12,205 12,768 (8)% (4)%Operating divisions 34,910 38,607 43,401 (10)% (11)%Corporate and Other(1) (1,531) (2,178) (1,886) n.a. n.a.Total 33,379 36,429 41,515 (8)% (12)%
(1) Includes interdivisional eliminations
In 2016, total orders declined 8 percent (5 percent in local currencies) with orders decreasing in all divisions.The decline reflects ongoing macro-economic and geopolitical uncertainties and challenges in many markets. The lowdemand from both the onshore and offshore oil segments negatively impacted many businesses, particularly the ProcessAutomation division. This also contributed to the negative order development in the Discrete Automation and Motiondivision, despite the strong demand from various industries for robotics. Weak market conditions impacted the orders inElectrification Products and in Power Grids.
In 2016, base orders declined 5 percent (2 percent in local currencies) with negative impacts across alldivisions. The decline of base orders reflects the uncertain global economic conditions across our key markets. Largeorders decreased 27 percent (25 percent in local currencies), impacted by considerable investment delays. For additionalinformation about divisional order performance, please refer to the relevant sections of below.
In 2015, total orders declined 12 percent (2 percent in local currencies) and decreased in all divisions. Thedecline in reported orders was driven both by lower base orders and lower large orders. The order development reflectedongoing macro-economic uncertainties and challenges in many markets as well as negative impacts from foreignexchange rate movements.
In 2015, orders decreased 9 percent in the Electrification Products division (steady in local currencies) as ordergrowth in the Protection and Connection business was offset by decreases in orders in the Building Products and theElectrification Solutions businesses. Orders in the Discrete Automation and Motion division declined 13 percent(5 percent in local currencies) on lower orders in all businesses, except Robotics, where orders increased in localcurrencies. Orders in the Process Automation division declined 20 percent (9 percent in local currencies) mainly due tolower capital and operating expenditures in the oil and gas sectors compared to the previous year. Orders declined 4percent (increased 8 percent in local currencies) in the Power Grids division. The increase in local currencies was drivenprimarily by the receipt of several large orders in the Grid Systems business.
During 2015, base orders declined 14 percent (5 percent in local currencies) reflecting the global economicconditions which remained mixed across our key markets. Large orders decreased 5 percent (increased 10 percent in localcurrencies) but were higher in local currencies than the strong large order intake in 2014. Large orders increased in thePower Grids division where several large projects were awarded in 2015.
We determine the geographic distribution of our orders based on the location of the ultimate destination of the end use, if known, or the location of the customer. The geographic distribution of our consolidated orders was
as follows:
% Change($ in millions) 2016 2015 2014 2016 2015Europe 11,213 12,568 14,319 (11)% (12)%The Americas 9,351 10,505 11,966 (11)% (12)%Asia, Middle East and Africa 12,815 13,356 15,230 (4)% (12)%Total 33,379 36,429 41,515 (8)% (12)%

46
Orders in 2016 declined in all regions, although we achieved growth within some divisions in Europe and Asia,Middle East and Africa. Orders in Europe decreased 11 percent (9 percent in local currencies) due primarily to lowerlarge orders compared to 2015. Orders in Europe for the Electrification Products and the Discrete Automation andMotion divisions grew in local currencies but were offset by decreases in the other divisions. In local currencies, orderswere lower in Germany, the United Kingdom, Norway, Switzerland, Russia, France, Finland, Turkey and theNetherlands while orders increased in Italy, Sweden and Spain. In the Americas orders declined 11 percent (9 percent inlocal currencies) on lower base and large orders. In local currencies, orders decreased in the U.S. (mainly due to lowerlarge orders), Canada, Brazil, Chile and Argentina while orders increased in Mexico. In Asia, Middle East and Africa,orders decreased 4 percent (flat in local currencies) as lower base orders were offset by strong demand for our poweroffering and higher large orders. Orders in China and India increased mainly due to investment activities in the HVDCpower transmission technology while orders declined in Saudi Arabia, South Korea, the United Arab Emirates,Australia, Japan, South Africa and Qatar.
Orders in 2015 declined in all regions on lower orders in all divisions. Orders in Europe decreased 12 percent(increased 5 percent in local currencies). Orders in Europe were higher in local currencies due to the receipt of largeorders for HVDC interconnections. In local currencies, orders were lower in the United Kingdom, Sweden, Finland,Switzerland, France, Spain and Russia, offset by higher orders in Germany, Norway, Italy, Turkey and the Netherlands.Orders declined 12 percent (6 percent in local currencies) in the Americas on lower base and large orders. In localcurrencies, orders decreased in the U.S., Canada and Brazil but were higher in Mexico, Chile and Argentina. In Asia,Middle East and Africa, orders decreased 12 percent (7 percent in local currencies) on lower base and large orders. Inlocal currencies, orders declined in China, Saudi Arabia, South Korea, Australia and Japan while orders were higher inIndia, the United Arab Emirates, South Africa and Qatar.
Order backlogDecember 31, % Change
($ in millions) 2016 2015 2014 2016 2015Electrification Products 2,612 2,872 2,798 (9)% 3%Discrete Automation and Motion 4,078 4,232 4,385 (4)% (3)%Process Automation 5,258 6,036 6,515 (13)% (7)%Power Grids 12,437 12,502 12,619 (1)% (1)%Operating divisions 24,385 25,642 26,317 (5)% (3)%Corporate and Other(1) (1,404) (1,521) (1,417) n.a. n.a.Total 22,981 24,121 24,900 (5)% (3)%
(1) Includes interdivisional eliminations
As at December 31, 2016, the consolidated order backlog declined 5 percent (2 percent in local currencies) andwas lower in all divisions. The decline in the Electrification Products division was driven by the Medium VoltageProducts and Building Products businesses. In the Discrete Automation and Motion division, the backlog was flat inlocal currencies as the increase in the Robotics and Power Conversion businesses were offset by declines in the otherbusinesses. In the Process Automation division, order backlog declined and was lower across all businesses, except forin the Measurement and Analytics business. In the Power Grids division, local currency order backlog increased, drivenby the Transformers and Grid System businesses.
As at December 31, 2015, the consolidated order backlog decreased 3 percent (increased 5 percent in localcurrencies). Order backlog in all divisions was impacted by the effects of changes in foreign currency rates as the U.S.dollar strengthened against all major currencies during 2015. In local currencies, order backlog increased in all divisions.The increase in the Electrification Products division was driven by the Medium Voltage Products business. In theDiscrete Automation and Motion division, the increase was driven by the Robotics and Power Conversion businesses. Inthe Process Automation division, orders were lower but order backlog increased due to the receipt of higher large ordersnear the end of 2015. In the Power Grids division, order backlog increased in the High Voltage and Transformersbusinesses and also benefitted from higher large orders received in the Grid Systems business during the year.

47
Revenues% Change
($ in millions) 2016 2015 2014 2016 2015Electrification Products 9,292 9,547 10,572 (3)% (10)%Discrete Automation and Motion 8,714 9,127 10,142 (5)% (10)%Process Automation 6,598 7,224 8,618 (9)% (16)%Power Grids 10,975 11,621 12,518 (6)% (7)%Operating divisions 35,579 37,519 41,850 (5)% (10)%Corporate and Other(1) (1,751) (2,038) (2,020) n.a. n.a.Total 33,828 35,481 39,830 (5)% (11)%
(1) Includes interdivisional eliminations
Revenues in 2016, decreased 5 percent (2 percent in local currencies) and declined in all divisions. Revenueswere lower due to declining orders during the year and a lower opening order backlog compared to the beginning of2015. In the Process Automation division, a continued low level of orders from the oil and gas industry, as well as frommining and metals, negatively impacted revenues. Revenues in the Power Grids division were impacted by weaker orderintake, the exit from certain businesses as well as lower pull-through revenues from other divisions. Revenues werepositively impacted by growth in the Robotics business, despite market challenges while revenues in the ElectrificationProducts division slightly increased in local currencies. For additional information about the divisional revenuesperformance, please refer to below.
In 2015, revenues decreased 11 percent (1 percent in local currencies) and declined in all divisions. Thedecrease was due primarily to the impacts of the lower orders and lower opening order backlog in the Power Grids andProcess Automation divisions compared to the beginning of 2014. In addition, the decrease was also due to the impactsof divestments made in 2014 and negative impacts from foreign exchange rate movements.
On a divisional basis, revenues in the Electrification Products division decreased 10 percent (steady in localcurrencies) and were lower in most businesses. Revenues declined 10 percent (2 percent in local currencies) in theDiscrete Automation and Motion division on lower order intake in the short-cycle businesses such as low voltage motorsand drives offset partly by local currency revenue increases in the Robotics and Power Conversion businesses. In theProcess Automation division revenues decreased 16 percent (5 percent in local currencies) and were lower in localcurrencies in most businesses. Revenues were impacted primarily by decreases in the systems businesses such as theMarine and Ports, and the Oil, Gas and Chemicals businesses but also by the divestment of the Full Service business atthe end of 2014. Revenues in the Power Grids division decreased 7 percent (increased 3 percent in local currencies). Inlocal currencies revenues grew, driven by service revenues and by steady execution of the order backlog.
We determine the geographic distribution of our revenues based on the location of the ultimate destination ofthe end use, if known, or the location of the customer. The geographic distribution of our consolidatedrevenues was as follows:
% Change($ in millions) 2016 2015 2014 2016 2015Europe 11,315 11,602 13,745 (2)% (16)%The Americas 9,741 10,554 11,490 (8)% (8)%Asia, Middle East and Africa 12,772 13,325 14,595 (4)% (9)%Total 33,828 35,481 39,830 (5)% (11)%

48
In 2016, revenues decreased across all regions, although we achieved regional growth within some divisions. InEurope, revenues declined 2 percent (flat in local currencies) due to growth in the Electrification Products division andsteady revenues in the Process Automation division. In local currencies, revenues declined in Sweden, Norway,Switzerland, Germany and France, while revenues increased in Russia, the United Kingdom, Italy and Spain. Revenuesfrom the Americas decreased 8 percent (5 percent in local currencies). In local currencies, revenues decreased in theU.S. and Brazil while revenues were higher in Canada, Mexico, Argentina and Chile. In Asia, Middle East and Africa,revenues decreased by 4 percent (1 percent in local currencies), supported by strong demand for our power offering. Inlocal currencies, revenues declined in South Africa, Australia, Japan, Saudi Arabia and Singapore while revenuesincreased in China, India and Egypt.
In 2015, revenues declined in all regions. In Europe, revenues decreased 16 percent (increased 1 percent inlocal currencies). In local currencies, revenues declined in Norway, France, Switzerland, Spain and Russia. Revenueswere flat in Italy, while revenues increased in Germany, the United Kingdom, Sweden and Finland. Revenues from theAmericas declined 8 percent (2 percent in local currencies). In local currencies, revenues decreased in the U.S., Canadaand Brazil but were higher in Mexico, Chile and Peru. In Asia, Middle East and Africa revenues decreased 9 percent(2 percent in local currencies). In local currencies, revenues declined in China, South Korea, Australia and Singaporewhile revenues increased in Saudi Arabia, India, the United Arab Emirates, Japan and South Africa.
Cost of sales
Cost of sales consists primarily of labor, raw materials and component costs but also includes indirectproduction costs, expenses for warranties, contract and project charges, as well as order-related development expensesincurred in connection with projects for which corresponding revenues have been recognized.
In 2016, cost of sales decreased 5 percent (2 percent in local currencies) to $24,081 million. As a percentage ofrevenues, cost of sales decreased from 71.4 percent in 2015 to 71.2 percent in 2016. In particular, the Process Automationand Power Grids divisions had a reduction in cost of sales as a percentage of revenues, resulting from improvement inproject margins and savings from supply chain and operational excellence cost take-out programs. In 2016, cost of saleswas negatively impacted by approximately 0.5 percent due to the charges recorded for a change in previously estimatedwarranty liabilities for certain solar inverters sold by Power-One in the Discrete Automation and Motion division.
In 2015, cost of sales decreased 11 percent (2 percent in local currencies) to $25,347 million. As a percentageof revenues, cost of sales decreased from 71.8 percent in 2014 to 71.4 percent in 2015. Cost of sales as a percentage ofrevenues decreased as benefits from higher cost savings and benefits from ongoing measures taken in the former PowerSystems program more than offset the impact from price erosion in the market and impacts fromrestructuring and related costs for the White Collar Productivity program.
Selling, general and administrative expenses
The components of selling, general and administrative expenses were as follows:
($ in millions) 2016 2015 2014Selling expenses 3,480 3,729 4,054Selling expenses as a percentage of orders received 10.4% 10.2% 9.8%General and administrative expenses 1,869 1,845 2,013General and administrative expenses as a percentage of revenues 5.5% 5.2% 5.1%Total selling, general and administrative expenses 5,349 5,574 6,067Total selling, general and administrative expenses as a percentage
of revenues 15.8% 15.7% 15.2%Total selling, general and administrative expenses as a percentage
of the average of orders received and revenues 15.9% 15.5% 14.9%

49
In 2016, general and administrative expenses increased 1 percent compared to 2015 (4 percent in localcurrencies). As a percentage of revenues, general and administrative expenses increased from 5.2 percent to 5.5 percent.General and administrative expenses were impacted by approximately $183 million of restructuring and restructuring-related expenses for the White Collar Productivity program. Restructuring-related expenses include the additional costsof running parallel operations during the relocation and transition phase, advisory costs for external consultants,expenses associated with our internal restructuring program implementation teams and costs for hiring and trainingpersonnel at new locations.
In 2015, general and administrative expenses decreased 8 percent (increased 4 percent in local currencies)compared to 2014. As a percentage of revenues, general and administrative expenses increased from 5.1 percent to5.2 percent. General and administrative expenses included approximately $121 million from costs for the White CollarProductivity program and restructuring-related expenses of approximately $18 million.
In 2016, selling expenses decreased 7 percent compared to 2015 (decreased 4 percent in local currencies)primarily driven by lower restructuring expenses related to the White Collar Productivity program. Selling expenses as apercentage of orders received increased from 10.2 percent to 10.4 percent on lower orders. Selling expenses wereimpacted by approximately $34 million from costs for the White Collar Productivity program.
In 2015, selling expenses have decreased 8 percent (increased 3 percent in local currencies) compared to 2014.Selling expenses as a percentage of orders have increased from 9.8 percent to 10.2 percent. Selling expenses wereimpacted by approximately $89 million from costs for the White Collar Productivity program.
In 2016, selling, general and administrative expenses decreased 4 percent compared to 2015 (2 percent in localcurrencies) and as a percentage of the average of orders and revenues, selling, general and administrative expensesincreased from 15.5 percent to 15.9 percent mainly impacted by lower orders and revenues.
In 2015, selling, general and administrative expenses decreased 8 percent (increased 3 percent in localcurrencies) compared to 2014 and as a percentage of the average orders and revenues, selling, general and administrativeexpenses increased from 14.9 percent to 15.5 percent on both lower revenues and orders and higher costs.
Non-order related research and development expenses
In 2016, non-order related research and development expenses decreased 8 percent (6 percent in localcurrencies) compared to 2015 and reflects the savings realized by reducing the number of employees. In 2015, non-orderrelated research and development expenses decreased 6 percent (increased 6 percent in local currencies) compared to2014. Non-order related research and development expenses as a percentage of revenues decreased in 2016 to 3.8percent, after increasing to 4.0 percent in 2015 from 3.8 percent in 2014.
Other income (expense), net
($ in millions) 2016 2015 2014Restructuring and restructuring-related expenses(1) (49) (67) (37)Net gain from sale of property, plant and equipment 38 26 17Asset impairments (61) (33) (34)Net gain (loss) from sale of businesses (10) (20) 543Misappropriation loss, net (73)Income from equity-accounted companies and other income (expense) 44 (11) 40Total (111) (105) 529
(1) Excluding asset impairments
Other income (expense), net primarily includes certain restructuring and restructuring-related expenses, gainsand losses from sale of businesses and sale of property, plant and equipment, recognized asset impairments, as well asour share of income or loss from equity-accounted companies.

50
In 2016, income (expense), was an expense of $111 million compared to an expense of $105million in 2015. In 2016, we recorded lower restructuring costs (see 22 Restructuring and related ),higher gains on sale of property, plant and equipment, and lower losses from sale of businesses. Higher assetimpairments also negatively impacted Other income (expense), net. We also recorded a loss of $73 million, net ofexpected insurance recoveries, for the misappropriation of cash by the treasurer of our subsidiary in South Korea. Inaddition, in 2016, other income included gains on certain foreign currency derivatives entered into in connection withthe planned sale of the Cables business.
In 2015, income (expense), was an expense of $105 million, compared with an income of $529million in 2014, and changed primarily due to higher restructuring costs and lower gains from sale of businesses.
Income from operations% Change(1)
($ in millions) 2016 2015 2014 2016 2015Electrification Products 1,335 1,356 1,562 (2)% (13)%Discrete Automation and Motion 831 991 1,422 (16)% (30)%Process Automation 696 685 931 2% (26)%Power Grids 888 613 257 45% 139%Operating divisions 3,750 3,645 4,172 3% (13)%Corporate and Other (767) (609) (5) n.a. n.a.Intersegment elimination 4 13 11 n.a. n.a.Total 2,987 3,049 4,178 (2)% (27)%
(1) Certain percentages are stated as n.a. as the computed change would not be meaningful.
In 2016 and 2015, changes in income from operations were a result of the factors discussed above and in thedivisional analysis below.
Net interest and other finance expense
Net interest and other finance expense consists of Interest and dividend income offset by Interest and otherfinance expense .
Interest and other finance expense includes interest expense on our debt, the amortization of upfronttransaction costs associated with long-term debt and committed credit facilities, commitment fees on credit facilities,foreign exchange gains and losses on financial items and gains and losses on marketable securities.
($ in millions) 2016 2015 2014Interest and dividend income 73 77 80Interest and other finance expense (261) (286) (362)Net interest and other finance expense (188) (209) (282)
In 2016, Interest and other finance expense decreased compared to 2015. Interest expense on bonds and otherdebt was lower and interest charges for uncertain tax positions were lower in 2016 compared to 2015. This was partiallyoffset by higher foreign exchange losses.
In 2015, Interest and other finance expense decreased compared to 2014, mainly due to a reduction in foreignexchange losses and lower interest expense on debt. Interest expense on debt was lower due to lower effective interestrates and lower foreign currency exchange rates. In addition, interest charges for uncertain tax positions were lower in2015 compared to 2014.
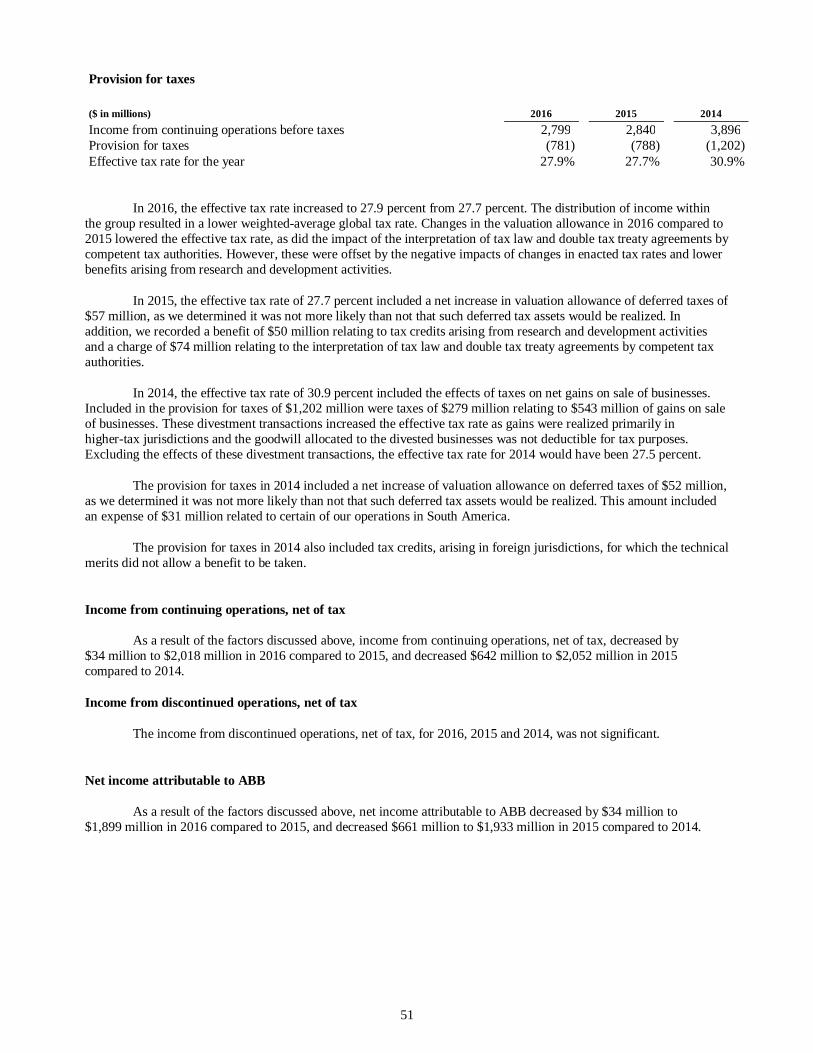
51
Provision for taxes
($ in millions) 2016 2015 2014Income from continuing operations before taxes 2,799 2,840 3,896Provision for taxes (781) (788) (1,202)Effective tax rate for the year 27.9% 27.7% 30.9%
In 2016, the effective tax rate increased to 27.9 percent from 27.7 percent. The distribution of income withinthe group resulted in a lower weighted-average global tax rate. Changes in the valuation allowance in 2016 compared to2015 lowered the effective tax rate, as did the impact of the interpretation of tax law and double tax treaty agreements bycompetent tax authorities. However, these were offset by the negative impacts of changes in enacted tax rates and lowerbenefits arising from research and development activities.
In 2015, the effective tax rate of 27.7 percent included a net increase in valuation allowance of deferred taxes of$57 million, as we determined it was not more likely than not that such deferred tax assets would be realized. Inaddition, we recorded a benefit of $50 million relating to tax credits arising from research and development activitiesand a charge of $74 million relating to the interpretation of tax law and double tax treaty agreements by competent taxauthorities.
In 2014, the effective tax rate of 30.9 percent included the effects of taxes on net gains on sale of businesses.Included in the provision for taxes of $1,202 million were taxes of $279 million relating to $543 million of gains on saleof businesses. These divestment transactions increased the effective tax rate as gains were realized primarily inhigher-tax jurisdictions and the goodwill allocated to the divested businesses was not deductible for tax purposes.Excluding the effects of these divestment transactions, the effective tax rate for 2014 would have been 27.5 percent.
The provision for taxes in 2014 included a net increase of valuation allowance on deferred taxes of $52 million,as we determined it was not more likely than not that such deferred tax assets would be realized. This amount includedan expense of $31 million related to certain of our operations in South America.
The provision for taxes in 2014 also included tax credits, arising in foreign jurisdictions, for which the technicalmerits did not allow a benefit to be taken.
Income from continuing operations, net of tax
As a result of the factors discussed above, income from continuing operations, net of tax, decreased by$34 million to $2,018 million in 2016 compared to 2015, and decreased $642 million to $2,052 million in 2015compared to 2014.
Income from discontinued operations, net of tax
The income from discontinued operations, net of tax, for 2016, 2015 and 2014, was not significant.
Net income attributable to ABB
As a result of the factors discussed above, net income attributable to ABB decreased by $34 million to$1,899 million in 2016 compared to 2015, and decreased $661 million to $1,933 million in 2015 compared to 2014.
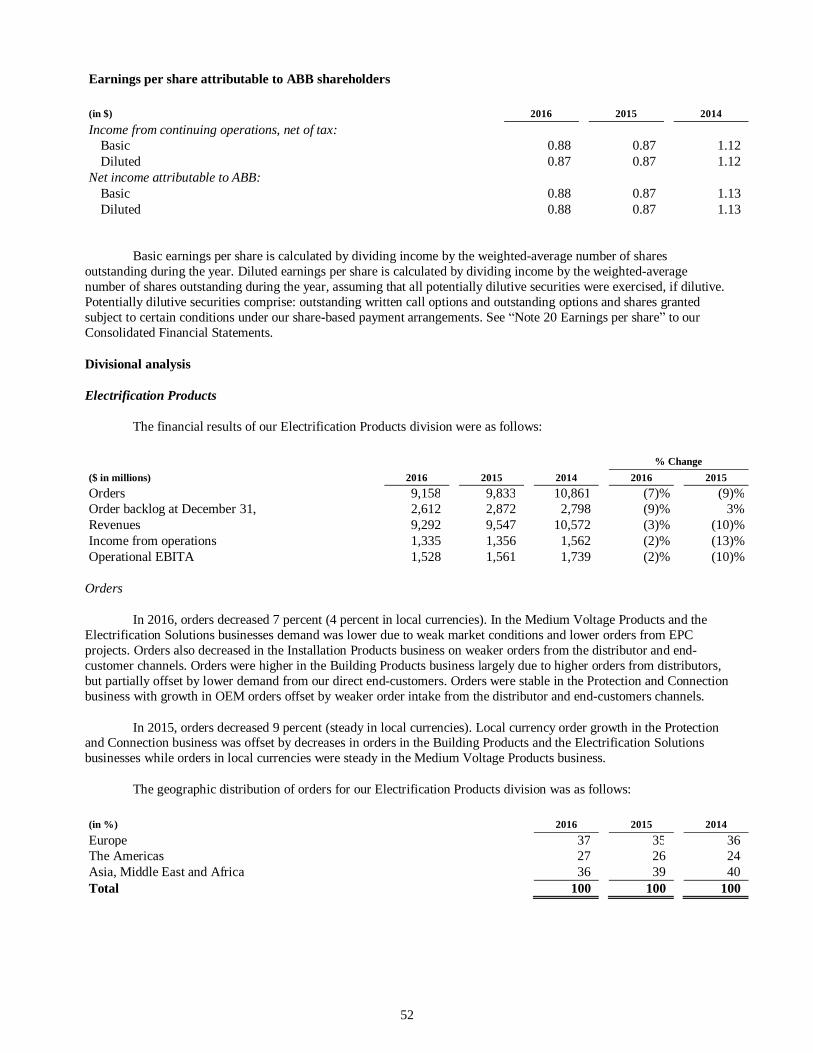
52
Earnings per share attributable to ABB shareholders
(in $) 2016 2015 2014Income from continuing operations, net of tax:
Basic 0.88 0.87 1.12Diluted 0.87 0.87 1.12
Net income attributable to ABB:Basic 0.88 0.87 1.13Diluted 0.88 0.87 1.13
Basic earnings per share is calculated by dividing income by the weighted-average number of sharesoutstanding during the year. Diluted earnings per share is calculated by dividing income by the weighted-averagenumber of shares outstanding during the year, assuming that all potentially dilutive securities were exercised, if dilutive.Potentially dilutive securities comprise: outstanding written call options and outstanding options and shares grantedsubject to certain conditions under our share-based payment arrangements. See Note 20 Earnings per share to ourConsolidated Financial Statements.
Divisional analysis
Electrification Products
The financial results of our Electrification Products division were as follows:
% Change($ in millions) 2016 2015 2014 2016 2015Orders 9,158 9,833 10,861 (7)% (9)%Order backlog at December 31, 2,612 2,872 2,798 (9)% 3%Revenues 9,292 9,547 10,572 (3)% (10)%Income from operations 1,335 1,356 1,562 (2)% (13)%Operational EBITA 1,528 1,561 1,739 (2)% (10)%
Orders
In 2016, orders decreased 7 percent (4 percent in local currencies). In the Medium Voltage Products and theElectrification Solutions businesses demand was lower due to weak market conditions and lower orders from EPCprojects. Orders also decreased in the Installation Products business on weaker orders from the distributor and end-customer channels. Orders were higher in the Building Products business largely due to higher orders from distributors,but partially offset by lower demand from our direct end-customers. Orders were stable in the Protection and Connectionbusiness with growth in OEM orders offset by weaker order intake from the distributor and end-customers channels.
In 2015, orders decreased 9 percent (steady in local currencies). Local currency order growth in the Protectionand Connection business was offset by decreases in orders in the Building Products and the Electrification Solutionsbusinesses while orders in local currencies were steady in the Medium Voltage Products business.
The geographic distribution of orders for our Electrification Products division was as follows:
(in %) 2016 2015 2014Europe 37 35 36The Americas 27 26 24Asia, Middle East and Africa 36 39 40Total 100 100 100

53
In 2016, the share of orders in Europe increased driven by growth in several countries, especially Germany. Inthe Americas, while orders declined in local currencies, the region was able to slightly increase its share of ordersrelative to the larger decrease in the Asia, Middle East and Africa region. In Asia, Middle East and Africa the share oforders decreased primarily due to lower orders in China and Saudi Arabia compared to 2015.
In 2015, the share of orders in Europe decreased primarily due to the strong U.S. dollar. The order developmentin the Americas was steady, resulting in an increase in the share of orders compared to the other two geographies. Theshare of orders in Asia, Middle East and Africa decreased due to a slowdown of markets in China, the Middle East andAustralia. The share of orders in that region compared to 2014 was also partially affected by the strong U.S. dollar.
Order backlog
In 2016, order backlog decreased by 9 percent (decrease of 5 percent in local currencies), primarily ondecreased backlog in the Medium Voltage Products business on higher order execution for modular systems and primaryswitchgear.
In 2015, order backlog increased by 3 percent (increased by 11 percent in local currencies), driven mainly byhigher backlog in the Medium Voltage Products business.
Revenues
In 2016, revenues decreased by 3 percent compared to 2015 (increased 1 percent in local currencies). In localcurrencies, revenues increased in the Medium Voltage Products business unit, which was primarily driven by sales formodular systems and which was partly offset by lower revenues from primary switchgear. Our Building Productsbusiness also showed an increase in revenues with growth driven through the distribution and panel builder channels,which was slightly offset by lower revenues from direct end-customers. Revenues were lower in all other business unitson lower demand from the distribution and OEM channels, although this was partly offset by increases in the panelbuilder channel.
In 2015, revenues decreased by 10 percent (steady in local currencies). In local currencies, revenues werehigher in the Medium Voltage Products, Protection and Connection and Installation Products businesses and were lowerin the Building Products and Electrification Solutions businesses.
The geographic distribution of revenues for our Electrification Products division was as follows:
(in %) 2016 2015 2014Europe 37 34 37The Americas 26 26 25Asia, Middle East and Africa 37 40 38Total 100 100 100
In 2016, the share of revenues in Europe increased due to growth across several European countries, especiallyGermany. Revenues in the Americas decreased slightly, maintaining a steady overall share of revenues. The share ofrevenues in Asia, Middle East and Africa decreased primarily due to lower revenues in China and the Middle East.
In 2015, the share of revenues in Europe decreased primarily due to the strong U.S. dollar, as the regionotherwise showed solid local currency growth. The revenues development in the Americas was steady, resulting in anincrease in the share of revenues compared to the other two geographies. The share of revenues in Asia, Middle East andAfrica increased slightly, however in local currencies the region revenues were lower compared to 2014 due to aslowdown of markets in China, the Middle East and Australia.

54
Income from operations
In 2016, income from operations decreased 2 percent primarily due to lower revenues and lower gross marginscompared to 2015. Reductions in selling, general and administrative expenses resulting from ongoing restructuring andcost savings programs, as well as lower restructuring and restructuring-related expenses partly offset the impact of lowergross margins. In addition changes in foreign currencies, including the impacts from FX/commodity timing differencessummarized in the table below, negatively impacted income from operations by 4 percent.
In 2015, income from operations decreased 13 percent. The decrease is primarily due to lower revenues as wellas higher restructuring charges in connection with the company-wide White Collar Productivity program whichnegatively impacted income from operations. In addition changes in foreign currencies, including the impacts fromFX/commodity timing differences summarized in the table below, negatively impacted income from operations by8 percent.
Operational EBITA
The reconciliation of income from operations to Operational EBITA for the Electrification Products divisionwas as follows:
($ in millions) 2016 2015 2014Income from operations 1,335 1,356 1,562Acquisition-related amortization 95 100 113Restructuring and restructuring-related expenses(1) 73 124 49Non-operational pension cost 3 (3) (2)Gains and losses on sale of businesses, acquisition-related expenses and certain
non-operational items 8 4 (7)FX/commodity timing differences in income from operations 14 (20) 24Operational EBITA 1,528 1,561 1,739
(1) Amounts also include the incremental implementation costs in relation to the White Collar Productivity program.
In 2016, Operational EBITA decreased 2 percent (steady when excluding the impacts from changes in foreigncurrencies) compared to 2015, as declines in Installation Products and Protection and Connection businesses were offsetby improvements across all other businesses.
In 2015, Operational EBITA decreased 10 percent (steady when excluding the impacts from changes in foreigncurrencies) compared to 2014, as declines in Installation Products business were offset by other businesses.

55
Discrete Automation and Motion
The financial results of our Discrete Automation and Motion division were as follows:
% Change($ in millions) 2016 2015 2014 2016 2015Orders 8,654 9,222 10,559 (6)% (13)%Order backlog at December 31, 4,078 4,232 4,385 (4)% (3)%Revenues 8,714 9,127 10,142 (5)% (10)%Income from operations 831 991 1,422 (16)% (30)%Operational EBITA 1,195 1,295 1,595 (8)% (19)%
Orders
Orders in 2016 were 6 percent lower (4 percent in local currencies). Strong order intake in the Roboticsbusiness and higher orders from light industries, such as the food and beverage industry, were more than offset by lowerorders in the Motors and Generators and the Drives and Controls businesses, primarily due to declining orders from theoil and gas sector. Orders in the Power Conversion business were also lower due to a decrease in orders from customersin the solar industry.
Orders in 2015 decreased 13 percent (5 percent in local currencies) due to weaker markets in most of ourbusinesses. Declining oil prices and slower growth in China affected the order intake negatively, especially in theMotors and Generators and the Drives and Controls businesses. Orders in the Robotics business increased in localcurrencies, supported by strong demand for services. Orders in the Power Conversion business were lower and wereimpacted by lower large orders from the rail segment.
The geographic distribution of orders for our Discrete Automation and Motion division was as follows:
(in %) 2016 2015 2014Europe 36 34 39The Americas 33 35 32Asia, Middle East and Africa 31 31 29Total 100 100 100
In 2016, the share of orders in Europe increased mainly due to strong demand in Germany and Finland,respectively driven by the Robotics business and the Drives and Controls business. The share of orders from theAmericas decreased mainly due to lower orders in the Motors and Generators business and lower orders in the Drivesand Controls business.
In 2015, the geographical distribution of our orders changed primarily due to the impact of the large rail ordersfrom Europe in 2014. In addition, orders from the Americas and Asia, Middle East and Africa benefitted from strongorders in the Robotics business.
Order backlog
Order backlog in 2016 decreased 4 percent. In local currencies, order backlog was flat as lower order backlogin the Drives and Controls business and Motors and Generators business was offset by increases in the backlog for theRobotics and Power Conversion businesses.
Order backlog in 2015 decreased 3 percent (increased 3 percent in local currencies) compared to 2014. In localcurrencies, order backlog increased as lower order backlog in the Motors and Generators business was offset byincreases in the backlog for the Robotics and Power Conversion businesses.
Revenues
In 2016, revenues decreased 5 percent (2 percent in local currencies) due to lower revenues in the Motors andGenerators, the Drives and Controls and the Power Conversion businesses. Revenues were higher in the Roboticsbusiness as we executed on the strong orders received and the strong order backlog.

56
In 2015, revenues were 10 percent lower (2 percent in local currencies). Revenues were weaker, as growth inthe Robotics and Power Conversion businesses, supported by strong order backlog, was offset by weaker revenuesresulting from the lower order intake in the short-cycle businesses such as low voltage motors and drives.
The geographic distribution of revenues for our Discrete Automation and Motion division was as follows:
(in %) 2016 2015 2014Europe 36 35 37The Americas 34 35 33Asia, Middle East and Africa 30 30 30Total 100 100 100
In 2016, the geographical distribution of revenues was similar to 2015. The share of revenues in Europe slightlyincreased due to the execution of a strong order backlog, while the share of revenues in the Americas decreased due tolower volume in the solar market. The share of revenues from Asia, Middle East and Africa remained flat as higherrevenues in the Robotics business offset the decline in the Drives and Controls and the Motors and Generatorsbusinesses.
In 2015, revenues declined in all regions. The share of revenue from Europe was lower than in 2014 due to theweak markets for motors and drives. The share of revenues from the Americas increased, especially due to the revenuedevelopment in the Robotics business. As a result the share of revenues from Asia, Middle East and Africa remained flatas higher revenues in the Robotics business somewhat compensated the decline in the Drives and Controls business.
Income from operations
In 2016, income from operations was 16 percent lower compared to 2015 mainly due to the impact of costsrecorded for a change in estimated warranty liabilities for certain solar inverters designed and sold by Power-One.During 2016, we recorded $151 million as a charge to cost of sales to recognize a change in the estimated warrantyliability for these products, the majority of which were delivered to customers by Power-One prior to the acquisitiondate in 2013. Of this charge, $131 million related to the products sold by Power-One prior to the acquisition and hasbeen included as an adjustment, in the table below, to determine the segment profit for the division. Additionally, lowerrevenues and low capacity utilization further reduced the income from operations. Restructuring and restructuring-related expenses in 2016 were lower than 2015. Income from operations benefitted from a strong performance of theRobotics business but was offset by declines in the other businesses. Changes in foreign currencies, including theimpacts from FX/commodity timing differences summarized in the table below, negatively impacted income fromoperations by 2 percent.
In 2015, income from operations decreased 30 percent compared to 2014 due to lower revenues and lowercapacity utilization. Steady income in the Robotics business could not compensate for the profit deterioration realized inother businesses. The Drives and Controls business was negatively affected by the weaker business climate in Chinawhile the Motors and Generators business suffered from low oil prices and weak demand leading to lower factoryutilization. Income from operations in the Power Conversion business was flat despite both continued price erosion andhigher warranty costs in the solar business. The income from operations was also negatively affected by theimpact of the higher restructuring charges incurred in connection with capacity adjustments and the company-wideWhite Collar Productivity program. Changes in foreign currencies, including the impacts from FX/commodity timingdifferences summarized in the table below, negatively impacted income from operations by 7 percent.

57
Operational EBITA
The reconciliation of income from operations to Operational EBITA for the Discrete Automation and Motiondivision was as follows:
($ in millions) 2016 2015 2014Income from operations 831 991 1,422Acquisition-related amortization 120 128 138Restructuring and restructuring-related expenses(1) 88 125 25Non-operational pension cost 2 3 6Changes in pre-acquisition estimates 131 21Gains and losses on sale of businesses, acquisition-related expenses and certain
non-operational items 18 26FX/commodity timing differences in income from operations 5 1 4Operational EBITA 1,195 1,295 1,595
(1) Amounts also include the incremental implementation costs in relation to the White Collar Productivity program.
In 2016, Operational EBITA decreased 8 percent (6 percent excluding the impacts from changes in foreigncurrencies) primarily due to the reasons described under from excluding the explanations related tothe reconciling items in the table above.
In 2015, Operational EBITA decreased 20 percent (11 percent excluding the impacts from changes in foreigncurrencies) compared to 2014, primarily due to the reasons described under from excluding theexplanations related to the reconciling items in the table above.
Process Automation
The financial results of our Process Automation division were as follows:
% Change($ in millions) 2016 2015 2014 2016 2015Orders 5,866 7,347 9,213 (20)% (20)%Order backlog at December 31, 5,258 6,036 6,515 (13)% (7)%Revenues 6,598 7,224 8,618 (9)% (16)%Income from operations 696 685 931 2% (26)%Operational EBITA 824 863 1,045 (5)% (17)%
Orders
Orders in 2016 declined 20 percent (18 percent in local currencies) compared with the previous year, mainlydue to continued low or decreased levels of capital expenditure in both the onshore and offshore oil segments. Orderswere lower in most Process Automation businesses, but mainly in the Oil, Gas and Chemicals business, Marine andPorts and Process Industries. The Process Industries business continued to be affected by low commodity prices leadingto weak demand from the mining and metals industries, where spending overall, both capital expenditure and operationalexpenditure, was cut.
Orders in 2015 declined 20 percent (9 percent in local currencies), mainly due to the impacts of a reduction incapital and operating expenditures in the oil and gas sector resulting from continued low oil prices. This negativelyimpacted the Oil, Gas and Chemicals business. The continued low oil prices adversely impacted the marine sector and inparticular the offshore drilling vessels segment. This development negatively impacted the Marine and Ports business.The Process Industries business was also adversely affected as the mining sector remained at a low level as customers inthis segment either continued to delay or postpone investments due to low commodity prices.

58
The geographic distribution of orders for our Process Automation division was as follows:
(in %) 2016 2015 2014Europe 42 38 34The Americas 21 22 22Asia, Middle East and Africa 37 40 44Total 100 100 100
In 2016, orders declined in all regions. Orders in Europe declined less than other regions, thus increasing thegeographic share of orders from Europe. The volume in Europe was supported by orders from marine industries,specifically for specialty vessels like cruise ships and ice-going vessels. The share of orders from the Americas fellslightly with order declines especially in Canada, the U.S. and Chile, where the Process Industries business was affectedby low capital expenditure in mining due to low demand from China for raw materials. In the Asia, Middle East andAfrica region, orders were lower especially in the Marine and Ports business due to weak demand for oil and gas relatedvessels and the lack of infrastructure projects from the ports business. In addition, the Oil, Gas and Chemical business aswell as the Process Industries business suffered from the lack of large orders in this geographic area.
In 2015, orders declined in all regions. The share of orders from Asia, Middle East and Africa declined due tolarge orders received from the Marine and Ports business in 2014. In addition, the region was impacted by weakdomestic demand in China. Orders in the Americas declined by a lower percentage than the division as a whole,resulting in a steady share of the orders from the Americas. Declines included the impacts of lower mining investmentsin South America, as well as slowing demand in the U.S. from the upstream oil and gas sector. As most major industrialeconomies in Europe were either steady or contracting only slightly, the geographic share of orders from Europeincreased.
Order backlog
Order backlog at December 31, 2016 was 13 percent lower (10 percent in local currencies) than at December31, 2015. The lower backlog was a result of the lower order intake during the year and the continued execution from theexisting backlog.
Order backlog at December 31, 2015, was 7 percent lower (3 percent higher in local currencies) than atDecember 31, 2014. Order backlog in most businesses was lower due to the impacts of lower orders during the year. Theincrease in order backlog in local currencies was due to the receipt of higher large orders near the end of 2015.
Revenues
In 2016, revenues declined 9 percent (6 percent in local currencies) compared with the previous year. Thelargest decline was in the Process Industries business due to the lower opening order backlog and the continued lowlevel of order activity from the mining and metals sector. A continued lack of orders from the oil and gas industrynegatively impacted revenues in the Oil, Gas and Chemicals business. The overall decrease in revenues was mitigatedby steady revenues in the Marine and Ports business which was supported by the strong opening order backlog for ice-going and cruise vessels. Revenues were also steady in the Power Generation business due to solid execution from theorder backlog. Of the product businesses, Control Technologies had revenue levels similar to the previous year, but theMeasurement and Analytics and Turbocharging businesses were slightly lower due to lower order intake.
In 2015, revenues decreased 16 percent (5 percent in local currencies). Revenues in the Oil, Gas and Chemicalsbusiness declined, reflecting the lower opening order backlog as well as reduced opportunities from slower customerorder tendering, especially in the service business. The Marine and Ports business also recorded lower revenues,reflecting lower activity in the offshore oil and gas industry and large project delays. The Process Industries business,which includes mining and metals, also declined. Revenues in the Measurement and Analytics business declined, largelydue to lower demand in the upstream oil and gas segment. In local currencies, the Turbocharging and the PowerGeneration businesses were flat while the Control Technologies business had higher revenues.

59
The geographic distribution of revenues for our Process Automation division was as follows:
(in %) 2016 2015 2014Europe 37 34 36The Americas 21 23 23Asia, Middle East and Africa 42 43 41Total 100 100 100
In 2016, revenues continued to decline in the Americas and in Asia, Middle East and Africa, while Europe wasstable. This resulted in an increase in the share of revenues from Europe. Except for the Marine and Ports business,revenues in the Americas declined in all businesses, especially the Oil, Gas and Chemicals, Process Industries and theproduct businesses. Revenues in Asia, Middle East and Africa were especially impacted by the weak demand from theProcess Industries business, particularly mining.
The regional distribution of revenues in 2015 remained steady compared to 2014 as a downturn in the oil andgas and commodities sectors affected all of the geographies. The share of revenues from Europe declined, reflectinglower oil and gas and marine activities in Norway. Revenues in the Americas decreased proportionally. The largerproportional revenue decrease in Europe and a steady share of revenues in the Americas resulted in a redistribution ofthe share to Asia, Middle East and Africa.
Income from operations
In 2016, income from operations increased 2 percent compared with 2015, despite decreasing revenues asrestructuring charges relating to the ongoing White Collar Productivity program and other restructuring activities werelower. Operating margins were maintained as we reduced overhead costs by removing organizational costs at the localdivision level and downsizing operations in areas with low order backlog and low market demand. Key actions includedclosing warehouses and consolidating operations to fewer locations, but mainly included reducing the number ofpersonnel. Restructuring programs were implemented in all businesses due to a continued weak market outlook. Overall,the number of employees in the Process Automation division was reduced by approximately 1,200 during 2016. Inaddition, changes in foreign currencies, including the impacts from FX/commodity timing differences summarized in thetable below, negatively impacted income from operations by 4 percent.
In 2015, income from operations declined 26 percent compared to 2014, mainly from higher restructuringcharges due to the implementation of the company-wide White Collar Productivity program as well as the decrease inrevenues explained above. Changes in foreign currencies, including the impacts from FX/commodity timing differencessummarized in the table below, negatively impacted income from operations by 8 percent.
Operational EBITA
The reconciliation of income from operations to Operational EBITA for the Process Automation division wasas follows:
($ in millions) 2016 2015 2014Income from operations 696 685 931Acquisition-related amortization 11 12 18Restructuring and restructuring-related expenses(1) 79 130 36Non-operational pension cost 2 6 17Gains and losses on sale of businesses, acquisition-related expenses and certain
non-operational items 9 14 32FX/commodity timing differences in income from operations 27 16 11Operational EBITA 824 863 1,045
(1) Amounts also include the incremental implementation costs in relation to the White Collar Productivity program.
In 2016, Operational EBITA decreased by 5 percent (2 percent excluding the impacts from changes in foreigncurrencies) compared to 2015, primarily due to the reasons described under from excluding theexplanations related to the reconciling items in the table above.

60
In 2015, Operational EBITA decreased 17 percent (9 percent excluding the impacts from changes in foreigncurrencies) compared to 2014, primarily due to the reasons described under from excluding theexplanations related to the reconciling items in the table above.
Power Grids
The financial results of our Power Grids division were as follows:
% Change($ in millions) 2016 2015 2014 2016 2015Orders 11,232 12,205 12,768 (8)% (4)%Order backlog at December 31, 12,437 12,502 12,619 (1)% (1)%Revenues 10,975 11,621 12,518 (6)% (7)%Income from operations 888 613 257 45% 139%Operational EBITA 1,021 877 607 16% 44%
Orders
In 2016, orders decreased 8 percent (5 percent in local currencies) compared with 2015. The decrease partlyreflected a lower level of large orders, which was primarily caused by the timing of order awards. Base orders were alsolower, reflecting general macro-economic uncertainty and sluggishness in some geographic markets such as SaudiArabia and the U.S. The lower pull-through of orders from other ABB divisions, primarily the Process Automationdivision, reduced orders by 3 percent. Third-party base orders decreased 3 percent (steady in local currencies) with ordergrowth in the Grid Systems, High Voltage Products and Grid Automation businesses offset by market-driven base orderweakness in the Transformers business. Large orders in 2016 included a $640 million UHVDC transmission link inIndia, two UHVDC orders for China (each worth more than $300 million), and a $250 million high-voltage cable systemto connect the Hornsea offshore wind farm in the North Sea to the United Kingdom mainland grid. The general marketremains competitive with macro-economic and geopolitical challenges.
In 2015, orders decreased 4 percent (increased 8 percent in local currencies) compared with 2014. The growthin local currencies mainly resulted from a higher level of large orders. Large orders in the Grid Systems businessincluded an HVDC order awarded to connect the Norwegian and German power grids and a $450 million HVDC orderfor an interconnection between Norway and the United Kingdom. Large orders were also supported by the continuedselective investments in large transmission projects in the U.S. and China. In local currencies, base orders were lower,mainly due to the challenging macro-economic conditions. The markets remained competitive with continued pricingpressure.
The geographic distribution of orders for our Power Grids division was as follows:
(in %) 2016 2015 2014Europe 27 37 34The Americas 27 27 31Asia, Middle East and Africa 46 36 35Total 100 100 100
In the Power Grids division, the change in the geographic share of orders often reflects changes in thegeographical location of large orders. In 2016, the share of orders from Asia, Middle East and Africa increased from 36percent to 46 percent, helped by strong order intake in China and India. Although the share of orders from the Americaswas steady, orders from the Americas were lower, resulting from market challenges particularly in the U.S. and Brazil.The share of orders from Europe decreased to 27 percent, compared with 37 percent in 2015, mainly due to the highamount of large orders received from Europe in 2015.
In 2015, Europe benefited from a higher level of large orders compared with 2014, supported by the largeHVDC awards. The share of orders from Asia, Middle East and Africa increased to 36 percent, supported by largeorders. Orders in the Americas were significantly lower, partly due to a significant large HVDC order received inCanada in 2014.

61
Order backlog
Order backlog at December 31, 2016, decreased 1 percent (increased 3 percent in local currencies). The localcurrency increase in order backlog was mainly driven by the Transformers business, resulting from a significantly highershare of large orders with long leadtimes.
Order backlog at December 31, 2015, decreased 1 percent (increased 7 percent in local currencies) comparedwith December 31, 2014. The local currency increase in order backlog reflects the impact of the high levels of largeorders, which typically have execution times stretching over several years.
Revenues
Revenues in 2016 decreased 6 percent (3 percent in local currencies) compared with 2015. The revenue volumein 2016 mainly reflected the scheduled execution of the order backlog. The revenue decrease was mainly attributable tothe Grid Systems business as the offshore wind projects which contributed strongly to the revenues in 2015 were eitherfinalized or nearing completion. A lower level of revenues in the Transformers business primarily resulted from orderweakness in the U.S. whereas revenues in the Grid Integration business were negatively impacted by the exit from theEPC Solar business and the wind-down of the plant electrification business.
Revenues in 2015 decreased 7 percent (increased 3 percent in local currencies) compared with 2014. Theincrease in local currencies was mainly driven by steady execution of the order backlog, led by growth in the GridSystems business, supported by the execution of offshore wind projects. In local currencies, revenues were also higher inthe business units Grid Automation, Transformers and High Voltage Products. These positives more than offset a lowerlevel of revenues in the Grid Integration business, which was partly caused by our exit from the EPC Solar business in2014.
The geographic distribution of revenues for our Power Grids division was as follows:
(in %) 2016 2015 2014Europe 30 32 34The Americas 29 30 28Asia, Middle East and Africa 41 38 38Total 100 100 100
The regional distribution of revenues partly reflects the geographical end-user markets of the projects executedduring the year, and consequently varies over time. In 2016, the share of revenues from Asia, Middle East and Africaincreased to 41 percent, supported by significantly higher revenues from the Transformer business in China. The shareof revenues from Europe decreased to 30 percent, mainly due to a lower level of revenues from the Grid Systemsbusiness, related to lower revenues in the offshore wind projects described above. The share of revenues from theAmericas was lower, mainly driven by lower revenue volumes from the U.S. and Brazil.
In 2015, revenues decreased in all regions. In Europe the share of revenues decreased due mainly to lowerrevenues in the Transformers and High Voltage businesses. The steady execution in the Americas resulted in aproportional increase of revenues from that region, while the revenues in Asia, Middle East and Africa decreasedproportionally, mainly due to the Grid Integration business.
Income from operations
In 2016, income from operations increased by $275 million to $888 million compared with $613 million in2015. The impact from lower revenues was more than offset by a higher gross margin, driven by solid project execution,improved productivity and continued cost savings. Restructuring and restructuring-related expenses in 2016 of $101million were $59 million lower than in 2015 and included additional charges for the White Collar Productivity program,as well as initiatives to align the cost structure and footprint of certain operations to reflect changing market conditions.We had lower research and development expenses and lower acquisition-related amortization in 2016 compared to 2015.In addition, changes in foreign currencies, including the changes in FX/commodity timing differences in income fromoperations decreased the income from operations by 2 percent compared to 2015.

62
In 2015, income from operations increased by $356 million to $613 million compared with $257 million in2014, mainly due to benefits from the ongoing measures taken in the program (implemented in the formerPower Systems division) and continued cost reduction initiatives. Restructuring-related expenses in 2015 of $160million were higher than in 2014 and included charges for the new company-wide White Collar Productivity programand ongoing costs for the previously-announced initiatives to align the cost structure of certain operations to reflectchanging market conditions. Continued cost savings, primarily related to supply chain management and operationalexcellence, helped to mitigate higher research and development spending as well as the negative effects from pricepressures. Acquisition-related amortization also decreased in 2015 compared to 2014. In addition, changes in the amountof FX/commodity timing differences in income from operations increased the income from operations by$124 million compared to 2014.
Operational EBITA
The reconciliation of income from operations to Operational EBITA for the Power Grids division was asfollows:
($ in millions) 2016 2015 2014Income from operations 888 613 257Acquisition-related amortization 35 52 89Restructuring and restructuring-related expenses(1) 101 160 106Non-operational pension cost (2) 3 12Gains and losses on sale of businesses, acquisition-related expenses and certain
non-operational items (2) 39 9FX/commodity timing differences in income from operations 1 10 134Operational EBITA 1,021 877 607
(1) Amounts also include the incremental implementation costs in relation to the White Collar Productivity program.
In 2016, Operational EBITA increased by 16 percent (19 percent excluding the impacts from changes inforeign currencies) compared to 2015, primarily due to the reasons described under fromexcluding the explanations related to the reconciling items in the table above.
In 2015, Operational EBITA increased by $270 million. This was primarily driven by the reasons describedunder from excluding the explanations related to the reconciling items in the table above.
Corporate and Other
Income (loss) from operations for Corporate and Other was as follows:
($ in millions) 2016 2015 2014Corporate headquarters and stewardship (380) (355) (343)Corporate research and development (133) (144) (174)Corporate real estate 47 50 44White Collar Productivity program costs (199) (130)Divested businesses 2 547Misappropriation loss, net (73)Other (29) (32) (79)Total Corporate and Other (767) (609) (5)
In 2016, Corporate headquarters and stewardship costs increased due to the launch of the new ABB brand andother costs related to the implementation of the Next Level Strategy program. In 2015, Corporate headquarters andstewardship costs were effectively at the same level of the prior year.
Corporate real estate primarily includes the income from property rentals and gains from the sale of real estateproperties. In 2016, 2015 and 2014, income from operations in Corporate real estate included gains of $33 million,$26 million and $17 million, respectively, from the sales of real estate property in various countries.
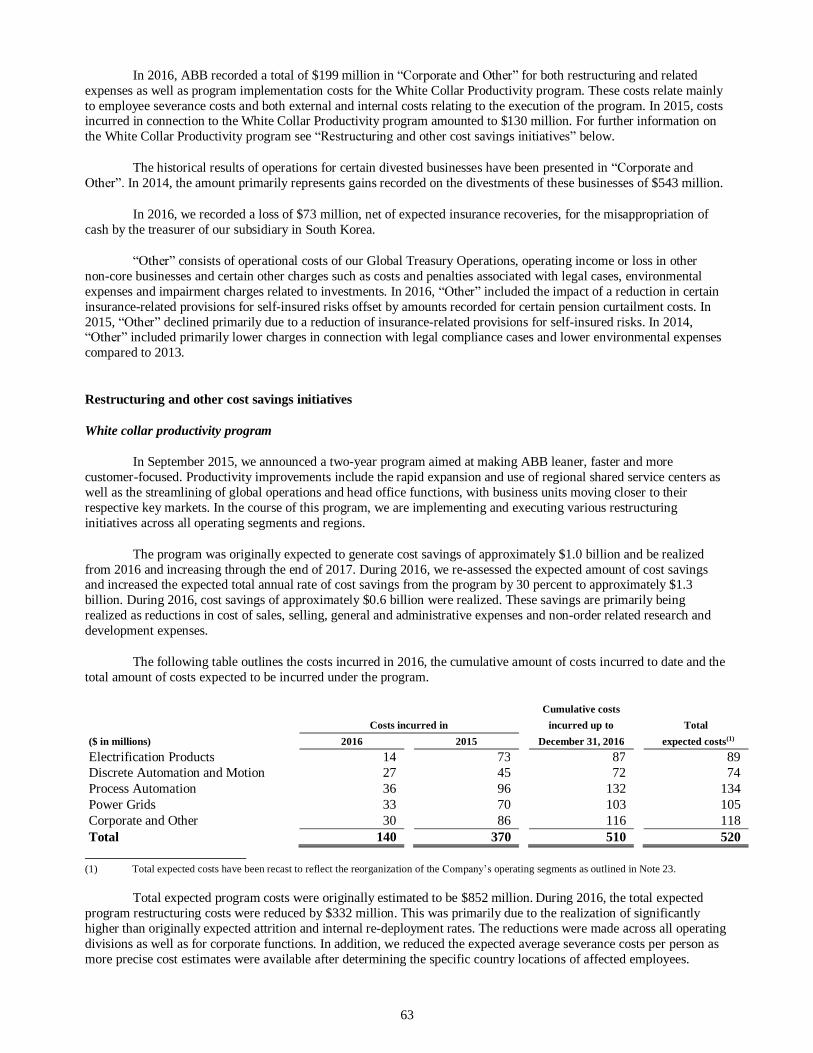
63
In 2016, ABB recorded a total of $199 million in and for both restructuring and relatedexpenses as well as program implementation costs for the White Collar Productivity program. These costs relate mainlyto employee severance costs and both external and internal costs relating to the execution of the program. In 2015, costsincurred in connection to the White Collar Productivity program amounted to $130 million. For further information onthe White Collar Productivity program see and other cost savings below.
The historical results of operations for certain divested businesses have been presented in and In 2014, the amount primarily represents gains recorded on the divestments of these businesses of $543 million.
In 2016, we recorded a loss of $73 million, net of expected insurance recoveries, for the misappropriation ofcash by the treasurer of our subsidiary in South Korea.
consists of operational costs of our Global Treasury Operations, operating income or loss in othernon-core businesses and certain other charges such as costs and penalties associated with legal cases, environmentalexpenses and impairment charges related to investments. In 2016, included the impact of a reduction in certaininsurance-related provisions for self-insured risks offset by amounts recorded for certain pension curtailment costs. In2015, declined primarily due to a reduction of insurance-related provisions for self-insured risks. In 2014,
included primarily lower charges in connection with legal compliance cases and lower environmental expensescompared to 2013.
Restructuring and other cost savings initiatives
White collar productivity program
In September 2015, we announced a two-year program aimed at making ABB leaner, faster and morecustomer-focused. Productivity improvements include the rapid expansion and use of regional shared service centers aswell as the streamlining of global operations and head office functions, with business units moving closer to theirrespective key markets. In the course of this program, we are implementing and executing various restructuringinitiatives across all operating segments and regions.
The program was originally expected to generate cost savings of approximately $1.0 billion and be realizedfrom 2016 and increasing through the end of 2017. During 2016, we re-assessed the expected amount of cost savingsand increased the expected total annual rate of cost savings from the program by 30 percent to approximately $1.3billion. During 2016, cost savings of approximately $0.6 billion were realized. These savings are primarily beingrealized as reductions in cost of sales, selling, general and administrative expenses and non-order related research anddevelopment expenses.
The following table outlines the costs incurred in 2016, the cumulative amount of costs incurred to date and thetotal amount of costs expected to be incurred under the program.
Cumulative costsCosts incurred in incurred up to Total
($ in millions) 2016 2015 December 31, 2016 expected costs(1)
Electrification Products 14 73 87 89Discrete Automation and Motion 27 45 72 74Process Automation 36 96 132 134Power Grids 33 70 103 105Corporate and Other 30 86 116 118Total 140 370 510 520
(1) Total expected costs have been recast to reflect the reorganization of the operating segments as outlined in Note 23.
Total expected program costs were originally estimated to be $852 million. During 2016, the total expectedprogram restructuring costs were reduced by $332 million. This was primarily due to the realization of significantlyhigher than originally expected attrition and internal re-deployment rates. The reductions were made across all operatingdivisions as well as for corporate functions. In addition, we reduced the expected average severance costs per person asmore precise cost estimates were available after determining the specific country locations of affected employees.

64
In 2016 and 2015, restructuring costs of $140 million and $370 million, respectively, were recorded based onthe anticipated number of personnel to be impacted by the program and a country-specific average severance cost perperson. Various functions including marketing and sales, supply chain management, research and development,engineering, service, and certain other support functions were impacted in various phases commencing in 2015 andcontinuing in 2016.
In 2016, we experienced a significantly higher than expected rate of attrition and re-deployment and a lowerthan expected severance cost per employee for the employee groups affected by the restructuring programs initiated in2015 and 2016. As a result, in 2016, we adjusted the amount of our estimated liability for restructuring which wasrecorded in 2015. This change in estimate of $103 million for the twelve months ended December 31, 2016 resulted in areduction primarily in cost of sales of $49 million and in selling, general and administrative expenses of $38 million forthe twelve months ended December 31, 2016. The expense recorded for the restructuring initiated in 2016 includes theimpacts of the attrition and re-deployments realized in 2016. Due to the significant subjectivity of our estimate of futureattrition and internal re-deployment rates, the amount reported for restructuring liabilities at December 31, 2016 willchange based on actual attrition and re-deployment rates realized in 2017.
To complete the remaining planned restructuring activities, we estimate that additional restructuring costs ofapproximately $10 million will be recorded in 2017.
The majority of the remaining cash outlays, primarily for employee severance benefits, are expected to occur in2017. We expect that our cash flow from operating activities will be sufficient to cover any obligations under thisrestructuring program.
For details of the nature of the costs incurred and their impact on the Consolidated Financial Statements, seeNote 22 Restructuring and related to our Consolidated Financial Statements.
Other restructuring-related activities and cost savings initiatives
In 2016, 2015 and 2014, we also executed other restructuring-related and cost saving measures to sustainablyreduce our costs and protect our profitability. Costs associated with these other measures amounted to $171 million,$256 million and $235 million in 2016, 2015 and 2014, respectively.
LIQUIDITY AND CAPITAL RESOURCES
Principal sources of funding
We meet our liquidity needs principally using cash from operations, proceeds from the issuance of debtinstruments (bonds and commercial paper), and short-term bank borrowings.
During 2016, 2015 and 2014, our financial position was strengthened by the positive cash flow from operatingactivities of $3,843 million, $3,818 million and $3,845 million, respectively.
Our net debt is shown in the table below:
December 31,($ in millions) 2016 2015Short-term debt and current maturities of long-term debt 1,003 1,454Long-term debt 5,800 5,985Cash and equivalents (3,644) (4,565)Marketable securities and short-term investments (1,953) (1,633)Net debt (defined as the sum of the above lines) 1,206 1,241
Net debt at December 31, 2016, decreased $35 million compared to December 31, 2015, as cash flows fromoperating activities during 2016 of $3,843 million exceeded cash outflows for the payment to our shareholders of thenominal value reduction ($1,610 million), net purchases of property, plant and equipment and intangible assets
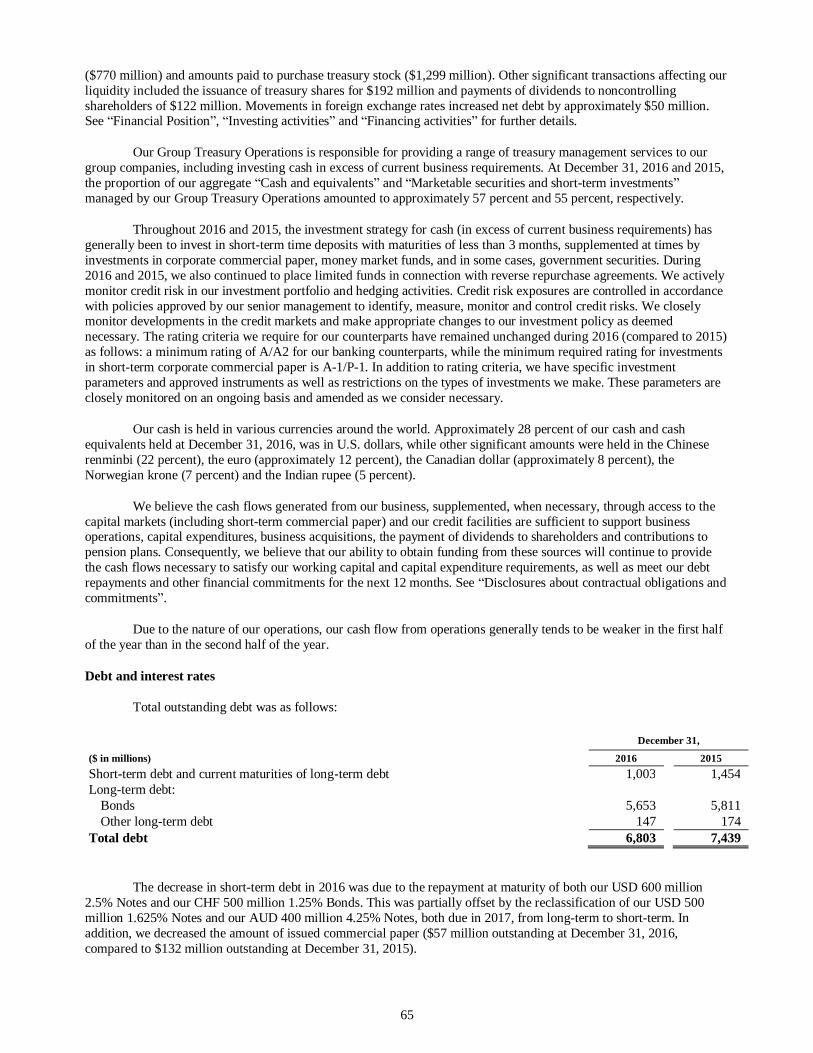
65
($770 million) and amounts paid to purchase treasury stock ($1,299 million). Other significant transactions affecting ourliquidity included the issuance of treasury shares for $192 million and payments of dividends to noncontrollingshareholders of $122 million. Movements in foreign exchange rates increased net debt by approximately $50 million.See Financial Position , Investing activities and Financing activities for further details.
Our Group Treasury Operations is responsible for providing a range of treasury management services to ourgroup companies, including investing cash in excess of current business requirements. At December 31, 2016 and 2015,the proportion of our aggregate Cash and equivalents and Marketable securities and short-term investmentsmanaged by our Group Treasury Operations amounted to approximately 57 percent and 55 percent, respectively.
Throughout 2016 and 2015, the investment strategy for cash (in excess of current business requirements) hasgenerally been to invest in short-term time deposits with maturities of less than 3 months, supplemented at times byinvestments in corporate commercial paper, money market funds, and in some cases, government securities. During2016 and 2015, we also continued to place limited funds in connection with reverse repurchase agreements. We activelymonitor credit risk in our investment portfolio and hedging activities. Credit risk exposures are controlled in accordancewith policies approved by our senior management to identify, measure, monitor and control credit risks. We closelymonitor developments in the credit markets and make appropriate changes to our investment policy as deemednecessary. The rating criteria we require for our counterparts have remained unchanged during 2016 (compared to 2015)as follows: a minimum rating of A/A2 for our banking counterparts, while the minimum required rating for investmentsin short-term corporate commercial paper is A-1/P-1. In addition to rating criteria, we have specific investmentparameters and approved instruments as well as restrictions on the types of investments we make. These parameters areclosely monitored on an ongoing basis and amended as we consider necessary.
Our cash is held in various currencies around the world. Approximately 28 percent of our cash and cashequivalents held at December 31, 2016, was in U.S. dollars, while other significant amounts were held in the Chineserenminbi (22 percent), the euro (approximately 12 percent), the Canadian dollar (approximately 8 percent), theNorwegian krone (7 percent) and the Indian rupee (5 percent).
We believe the cash flows generated from our business, supplemented, when necessary, through access to thecapital markets (including short-term commercial paper) and our credit facilities are sufficient to support businessoperations, capital expenditures, business acquisitions, the payment of dividends to shareholders and contributions topension plans. Consequently, we believe that our ability to obtain funding from these sources will continue to providethe cash flows necessary to satisfy our working capital and capital expenditure requirements, as well as meet our debtrepayments and other financial commitments for the next 12 months. See Disclosures about contractual obligations andcommitments .
Due to the nature of our operations, our cash flow from operations generally tends to be weaker in the first halfof the year than in the second half of the year.
Debt and interest rates
Total outstanding debt was as follows:
December 31,
($ in millions) 2016 2015Short-term debt and current maturities of long-term debt 1,003 1,454Long-term debt:
Bonds 5,653 5,811Other long-term debt 147 174
Total debt 6,803 7,439
The decrease in short-term debt in 2016 was due to the repayment at maturity of both our USD 600 million2.5% Notes and our CHF 500 million 1.25% Bonds. This was partially offset by the reclassification of our USD 500million 1.625% Notes and our AUD 400 million 4.25% Notes, both due in 2017, from long-term to short-term. Inaddition, we decreased the amount of issued commercial paper ($57 million outstanding at December 31, 2016,compared to $132 million outstanding at December 31, 2015).

66
Our debt has been obtained in a range of currencies and maturities and on various interest rate terms. Forcertain of our debt obligations, we use derivatives to manage the fixed interest rate exposure. For example, we useinterest rate swaps to effectively convert fixed rate debt into floating rate liabilities. After considering the effects ofinterest rate swaps, the effective average interest rate on our floating rate long-term debt (including current maturities) of$1,745 million and our fixed rate long-term debt (including current maturities) of $4,923 million was 1.3 percent and2.9 percent, respectively. This compares with an effective rate of 0.8 percent for floating rate long-term debt of$2,285 million and 3.2 percent for fixed rate long-term debt of $4,876 million at December 31, 2015.
For a discussion of our use of derivatives to modify the interest characteristics of certain of our individual bondissuances, see Note 12 Debt to our Consolidated Financial Statements.
Credit facility
During 2016 we exercised our second and final option to extend the maturity of our $2 billion multicurrencyrevolving credit facility from 2020 to 2021.
No amount was drawn under the credit facility at December 31, 2016 and 2015. The facility is for generalcorporate purposes. The facility contains cross-default clauses whereby an event of default would occur if we were todefault on indebtedness, as defined in the facility, at or above a specified threshold.
The credit facility does not contain financial covenants that would restrict our ability to pay dividends or raiseadditional funds in the capital markets. For further details of the credit facility, see Note 12 Debt to our ConsolidatedFinancial Statements.
Commercial paper
At December 31, 2016, we had two commercial paper programs in place:
a $2 billion commercial paper program for the private placement of U.S. dollar denominated commercialpaper in the United States, and
a $2 billion Euro-commercial paper program for the issuance of commercial paper in a variety ofcurrencies.
At December 31, 2016, $57 million was outstanding under the $2 billion program in the United States,compared to $132 million outstanding at December 31, 2015.
No amount was outstanding under the $2 billion Euro-commercial paper program at December 31, 2016 and2015.
European program for the issuance of debt
The European program for the issuance of debt allows the issuance of up to (the equivalent of) $8 billion incertain debt instruments. The terms of the program do not obligate any third party to extend credit to us and the termsand possibility of issuing any debt under the program are determined with respect to, and as of the date of issuance of,each debt instrument. During 2016, we issued EUR 700 million 0.625% Notes, due 2023, under the program. AtDecember 31, 2016, two bonds (principal amount of EUR 1,250 million, due in 2019, and principal amount of EUR 700million, due in 2023) having a combined carrying amount of $2,043 million were outstanding under the program. AtDecember 31, 2015, one bond (principal amount of EUR 1,250 million and due in 2019) having a carrying amount of$1,363 million was outstanding under the program. As of March 1, 2017, it was more than 12 months since the programhad been updated. New bonds could be issued under the program but could not be listed without us formally updatingthe program.
Australian program for the issuance of debt
During 2012, we set up a program for the issuance of up to AUD 1 billion (equivalent to $722 million, usingDecember 31, 2016, exchange rates) of medium-term notes and other debt instruments. The terms of the program do notobligate any third party to extend credit to us and the terms and possibility of issuing any debt under the program aredetermined with respect to, and as of the date of issuance of, each debt instrument. At both December 31, 2016 and
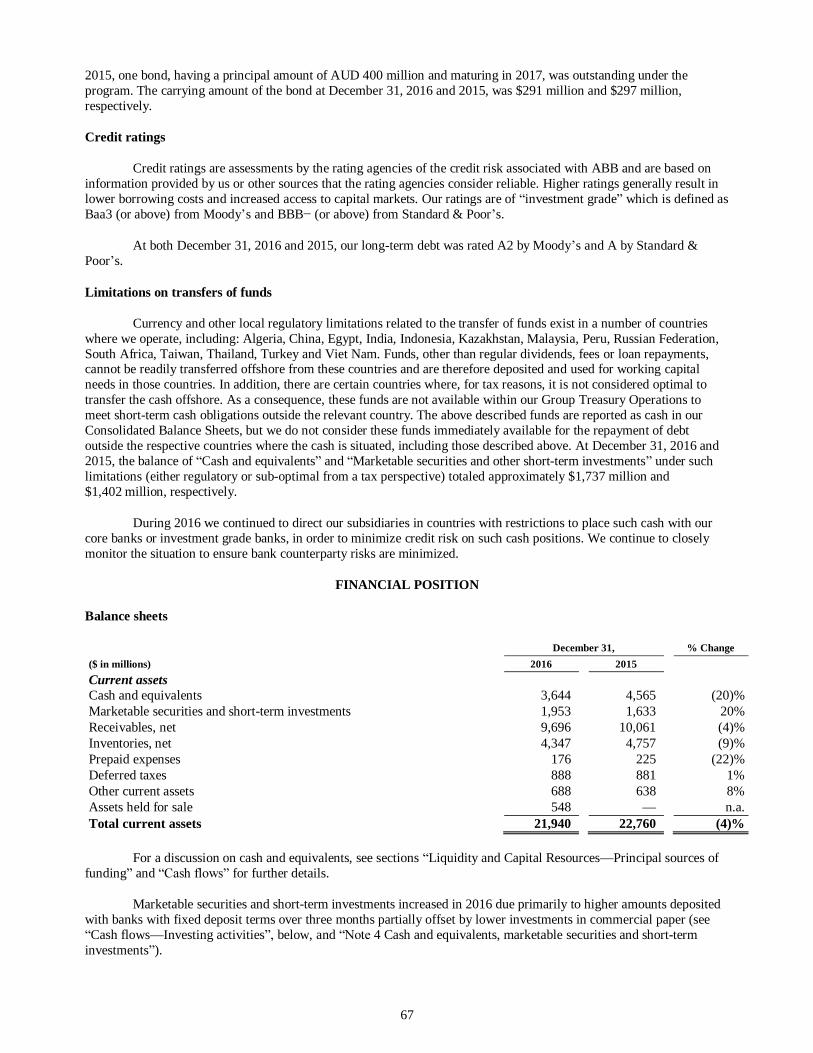
67
2015, one bond, having a principal amount of AUD 400 million and maturing in 2017, was outstanding under theprogram. The carrying amount of the bond at December 31, 2016 and 2015, was $291 million and $297 million,respectively.
Credit ratings
Credit ratings are assessments by the rating agencies of the credit risk associated with ABB and are based oninformation provided by us or other sources that the rating agencies consider reliable. Higher ratings generally result inlower borrowing costs and increased access to capital markets. Our ratings are of investment grade which is defined asBaa3 (or above) from Moody s and BBB (or above) from Standard & Poor s.
At both December 31, 2016 and 2015, our long-term debt was rated A2 by Moody s and A by Standard &Poor s.
Limitations on transfers of funds
Currency and other local regulatory limitations related to the transfer of funds exist in a number of countrieswhere we operate, including: Algeria, China, Egypt, India, Indonesia, Kazakhstan, Malaysia, Peru, Russian Federation,South Africa, Taiwan, Thailand, Turkey and Viet Nam. Funds, other than regular dividends, fees or loan repayments,cannot be readily transferred offshore from these countries and are therefore deposited and used for working capitalneeds in those countries. In addition, there are certain countries where, for tax reasons, it is not considered optimal totransfer the cash offshore. As a consequence, these funds are not available within our Group Treasury Operations tomeet short-term cash obligations outside the relevant country. The above described funds are reported as cash in ourConsolidated Balance Sheets, but we do not consider these funds immediately available for the repayment of debtoutside the respective countries where the cash is situated, including those described above. At December 31, 2016 and2015, the balance of Cash and equivalents and Marketable securities and other short-term investments under suchlimitations (either regulatory or sub-optimal from a tax perspective) totaled approximately $1,737 million and$1,402 million, respectively.
During 2016 we continued to direct our subsidiaries in countries with restrictions to place such cash with ourcore banks or investment grade banks, in order to minimize credit risk on such cash positions. We continue to closelymonitor the situation to ensure bank counterparty risks are minimized.
FINANCIAL POSITION
Balance sheets
December 31, % Change($ in millions) 2016 2015Current assetsCash and equivalents 3,644 4,565 (20)%Marketable securities and short-term investments 1,953 1,633 20%Receivables, net 9,696 10,061 (4)%Inventories, net 4,347 4,757 (9)%Prepaid expenses 176 225 (22)%Deferred taxes 888 881 1%Other current assets 688 638 8%Assets held for sale 548 n.a.Total current assets 21,940 22,760 (4)%
For a discussion on cash and equivalents, see sections Liquidity and Capital Resources Principal sources offunding and for further details.
Marketable securities and short-term investments increased in 2016 due primarily to higher amounts depositedwith banks with fixed deposit terms over three months partially offset by lower investments in commercial paper (seeCash flows Investing activities below, and 4 Cash and equivalents, marketable securities and short-term
investments ).

68
Receivables decreased 4 percent (1 percent in local currencies). The decrease was due partly to lower revenuelevels in 2016 compared to 2015 but was mostly offset by the impact of a small increase in days sales outstanding(DSO). The change in DSO was due primarily to the geographic mix of revenues with a higher proportion of revenuescoming from locations where there are longer customary payment terms. For details on the components of Receivables,see Note 7 Receivables, net .
Inventories decreased 9 percent (4 percent in local currencies) primarily due to lower business volumes. Inaddition, inventory was lower due to positive results from the 1,000-day program focusing on inventoryoptimization.
December 31, % Change($ in millions) 2016 2015Current liabilitiesAccounts payable, trade 4,446 4,342 2%Billings in excess of sales 1,241 1,375 (10)%Short-term debt and current maturities of long-term debt 1,003 1,454 (31)%Advances from customers 1,398 1,598 (13)%Deferred taxes 258 249 4%Provisions for warranties 1,142 1,089 5%Other provisions 1,765 1,920 (8)%Other current liabilities 3,936 3,817 3%Liabilities held for sale 218 n.a.Total current liabilities 15,407 15,844 (3)%
Accounts Payable increased 6 percent in local currencies due primarily to an increase in the number of days ofpayables outstanding which was achieved through focused efforts to extend payment terms with suppliers.
Billings in excess of sales decreased 7 percent in local currencies primarily due to the reclassification ofamounts to Liabilities held for sale.
The decrease in Short-term debt and current maturities of long-term debt was primarily due to the repaymentduring the year of the USD 600 million Notes and the CHF 500 million Bonds offset partially by the reclassification toshort-term debt of the USD 500 million and AUD 400 million Notes, both due in 2017.
Advances from customers decreased 10 percent in local currencies due to the impacts of lower orders,especially from the larger orders for capital expenditures from the oil and gas sector. In addition, market conditions haveplaced pressure on contract payment terms, reducing the amount of advances we have received.
Provisions for warranties increased 9 percent in local currencies due primarily to an increase in the warrantyliability in the solar business of the Discrete Automation and Motion division. This increase was required to cover costsassociated with higher than expected product failure rates of certain solar inverters manufactured by Power-One and soldto customers primarily before being acquired by the Company in 2013.
The decrease in Other provisions (5 percent in local currencies) was primarily due a reduction in the liabilityfor self-insurance and lower provisions for contract losses as the large offshore wind projects are completed.
December 31, % Change($ in millions) 2016 2015Non-current assetsProperty, plant and equipment, net 4,743 5,276 (10)%Goodwill 9,501 9,671 (2)%Other intangible assets, net 1,996 2,337 (15)%Prepaid pension and other employee benefits 90 68 32%Investments in equity-accounted companies 170 178 (4)%Deferred taxes 527 423 25%Other non-current assets 532 643 (17)%Total non-current assets 17,559 18,596 (6)%
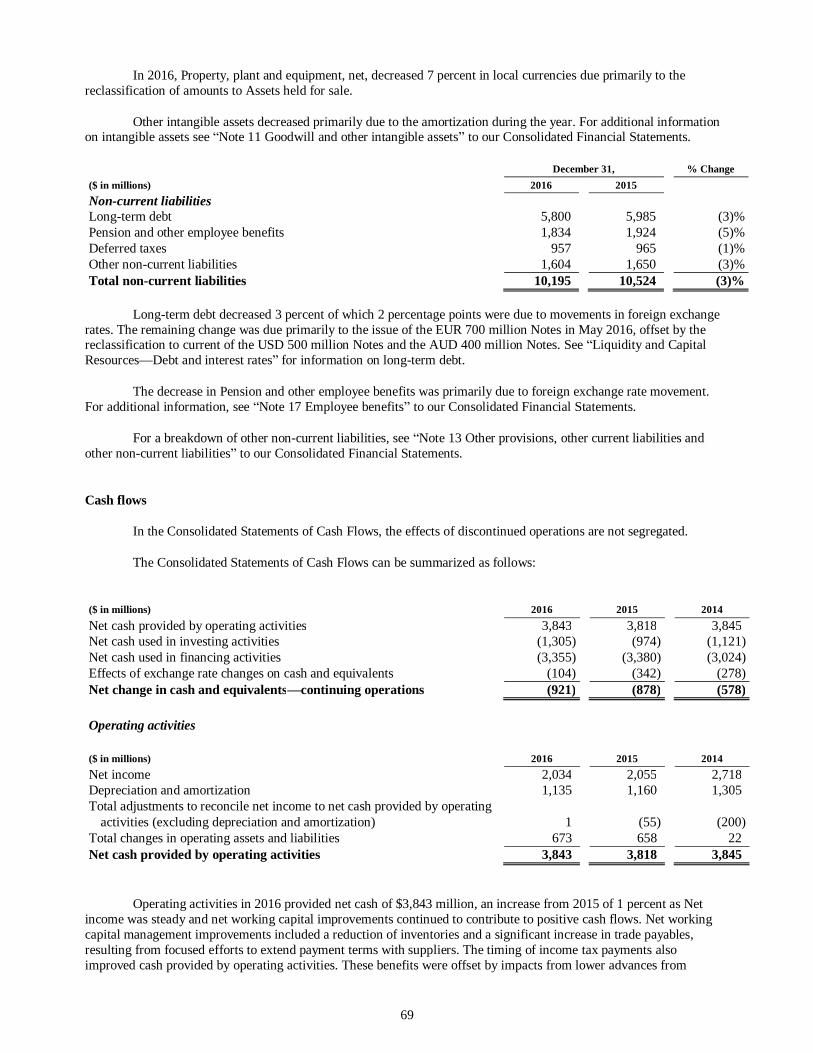
69
In 2016, Property, plant and equipment, net, decreased 7 percent in local currencies due primarily to thereclassification of amounts to Assets held for sale.
Other intangible assets decreased primarily due to the amortization during the year. For additional informationon intangible assets see Note 11 Goodwill and other intangible assets to our Consolidated Financial Statements.
December 31, % Change($ in millions) 2016 2015Non-current liabilitiesLong-term debt 5,800 5,985 (3)%Pension and other employee benefits 1,834 1,924 (5)%Deferred taxes 957 965 (1)%Other non-current liabilities 1,604 1,650 (3)%Total non-current liabilities 10,195 10,524 (3)%
Long-term debt decreased 3 percent of which 2 percentage points were due to movements in foreign exchangerates. The remaining change was due primarily to the issue of the EUR 700 million Notes in May 2016, offset by thereclassification to current of the USD 500 million Notes and the AUD 400 million Notes. See Liquidity and CapitalResources Debt and interest rates for information on long-term debt.
The decrease in Pension and other employee benefits was primarily due to foreign exchange rate movement.For additional information, see Note 17 Employee benefits to our Consolidated Financial Statements.
For a breakdown of other non-current liabilities, see Note 13 Other provisions, other current liabilities andother non-current liabilities to our Consolidated Financial Statements.
Cash flows
In the Consolidated Statements of Cash Flows, the effects of discontinued operations are not segregated.
The Consolidated Statements of Cash Flows can be summarized as follows:
($ in millions) 2016 2015 2014Net cash provided by operating activities 3,843 3,818 3,845Net cash used in investing activities (1,305) (974) (1,121)Net cash used in financing activities (3,355) (3,380) (3,024)Effects of exchange rate changes on cash and equivalents (104) (342) (278)Net change in cash and equivalents continuing operations (921) (878) (578)
Operating activities
($ in millions) 2016 2015 2014Net income 2,034 2,055 2,718Depreciation and amortization 1,135 1,160 1,305Total adjustments to reconcile net income to net cash provided by operating
activities (excluding depreciation and amortization) 1 (55) (200)Total changes in operating assets and liabilities 673 658 22Net cash provided by operating activities 3,843 3,818 3,845
Operating activities in 2016 provided net cash of $3,843 million, an increase from 2015 of 1 percent as Netincome was steady and net working capital improvements continued to contribute to positive cash flows. Net workingcapital management improvements included a reduction of inventories and a significant increase in trade payables,resulting from focused efforts to extend payment terms with suppliers. The timing of income tax payments alsoimproved cash provided by operating activities. These benefits were offset by impacts from lower advances from

70
customers. In addition, cash flows from operating activities was negatively impacted by the misappropriation of$103 million in cash by the treasurer of our subsidiary in South Korea.
Operating activities in 2015 provided net cash of $3,818 million, a decrease from 2014 of 1 percent. Thedecrease was driven by lower net income, partly offset by improvements in net working capital. Provisions, net,increased by $330 million reflecting the timing differences for cash payments on restructuring programs. Although netincome in 2015 included restructuring and related expenses of $370 million in relation to the White Collar Productivityprogram, cash payments during 2015 amounted to $35 million. Net working capital also improved due to strongercollections from customers as we decreased our trade receivables but also increased our advances from customers andbillings in excess of sales. Improvements in inventory were offset by similar reductions in trade payables.
Investing activities
($ in millions) 2016 2015 2014Purchases of marketable securities (available-for-sale) (1,214) (1,925) (1,430)Purchases of short-term investments (3,092) (614) (1,465)Purchases of property, plant and equipment and intangible assets (831) (876) (1,026)Acquisition of businesses (net of cash acquired) and
increases in cost- and equity-accounted companies (26) (56) (70)Proceeds from sales of marketable securities (available-for-sale) 1,057 434 361Proceeds from maturity of marketable securities (available-for-sale) 539 1,022 523Proceeds from short-term investments 2,241 653 1,011Proceeds from sales of property, plant and equipment 61 68 33Proceeds from sales of businesses (net of transaction costs and cash
disposed) and cost- and equity-accounted companies (1) 69 1,110Net cash from settlement of foreign currency derivatives (57) 231 (179)Other investing activities 18 20 11Net cash used in investing activities (1,305) (974) (1,121)
Net cash used in investing activities in 2016 was $1,305 million, compared to $974 million in 2015. Thechange was primarily due to the change in the cash impacts from derivative cash flows classified as investing activitiesas in 2016 we had net outflows of $57 million, compared to inflows of $231 million in 2015, on settlement of foreigncurrency derivatives relating to investing activities. These cash flows primarily result from the maturity and settlementof derivatives in place to hedge foreign currency exposures on internal subsidiary funding and the amount of thesettlement results from movements in foreign currency exchange rates throughout the year.
Net cash used in investing activities in 2015 was $974 million, compared to $1,121 million in 2014.Significantly lower proceeds from sales of businesses were partially offset by a reduction in the net amount invested inmarketable securities and other short-term investments as well as lower purchases of property, plant and equipment andintangible assets. Net cash used in investing activities was also lower in 2015 compared to 2014 as we received $231million in net cash on settlement of foreign currency derivatives relating to investing activities compared with net cashoutflows in 2014 of $179 million.
Total cash disbursements for the purchase of property, plant and equipment and intangibles were lower in 2016compared to 2015 and lower in 2015 compared to 2014, primarily due to movements in foreign exchange rates and anincrease in the amount of unpaid purchases. In 2016, total purchases of $831 million included $595 million forconstruction in process (generally for construction of buildings and other property facilities), $168 million for thepurchase of machinery and equipment, $28 million for the purchase of land and buildings, and $40 million for thepurchase of intangible assets. In 2015, total purchases of $876 million included $568 million for construction in process(generally for construction of buildings and other property facilities), $200 million for the purchase of machinery andequipment, $50 million for the purchase of land and buildings, and $58 million for the purchase of intangible assets. In2014, total purchases of $1,026 million included $724 million for construction in progress, $188 million for the purchaseof machinery and equipment, $38 million for the purchase of land and buildings, and $76 million for the purchase ofintangible assets.

71
In 2016 and 2015, we continued to increase the amount of our excess liquidity invested in marketable securitiesand short-term investments. Amounts at December 31, 2016, were placed primarily in fixed-term deposits with banksand in short-term money market funds. At December 31, 2015, amounts were placed primarily in short-term moneymarket funds and corporate commercial paper. The increase in investments during 2016, 2015 and 2014, resulted in anet outflow of $469 million, $430 million and $1,000 million, respectively.
In 2016 and 2015, there were no significant acquisitions or divestments of businesses. During 2014, wereceived net pre-tax proceeds from sales of businesses and cost- and equity-accounted companies of $1,110 million,primarily from the divestment of the Full Service business, the Steel Structures business of Thomas & Betts, the HVACbusiness of Thomas & Betts and the Power Solutions business of Power-One.
Financing activities
($ in millions) 2016 2015 2014Net changes in debt with maturities of 90 days or less (152) 3 (103)Increase in debt 912 68 150Repayment of debt (1,249) (101) (90)Delivery of shares 192 107 38Purchase of treasury stock (1,299) (1,487) (1,003)Dividends paid (1,357) (1,841)Reduction in nominal value of common shares paid to shareholders (1,610) (392)Dividends paid to noncontrolling shareholders (122) (137) (132)Other financing activities (27) (84) (43)Net cash used in financing activities (3,355) (3,380) (3,024)
Our financing activities primarily include debt transactions (both from the issuance of debt securities andborrowings directly from banks), share transactions and payments of distributions to controlling and noncontrollingshareholders.
In 2016, the net cash outflow for debt with maturities of 90 days or less related primarily to reduction of $75million in the amount outstanding under our commercial paper program in the U.S. and net repayments of short-termborrowings in various countries. In 2014, the net cash outflow for debt with maturities of 90 days or less relatedprimarily to repayments made of borrowings in various countries offset by a small increase in the amount outstandingunder our commercial paper program in the U.S.
In 2016, the increase in debt was due primarily to the issuance of our EUR 700 million 0.625% Notes due 2023(equal to $807 million at date of issuance). In 2015 and 2014, increases in other debt included cash flows fromadditional borrowings in various countries.
During 2016, $1,249 million of debt was repaid, reflecting primarily the repayment at maturity of the USD600 million 2.5% Notes and CHF 500 million 1.25% Bonds (in total equivalent to $1,106 million at dates of repayment).In 2015 and 2014 repayment of debt reflects repayments of borrowings in various countries.
In 2016 and 2015, Purchase of treasury stock reflects the cash paid to purchase 65 million and 73 million,respectively, of our own shares in connection with the share buyback program announced in September 2014. In 2014,the amount reflects cash paid to acquire 45 million of our own shares of which 33 million shares were purchased inconnection with the share buyback program. For additional information on the share buyback program see 19
to our Consolidated Financial Statements.
Disclosures about contractual obligations and commitments
The contractual obligations presented in the table below represent our estimates of future payments under fixedcontractual obligations and commitments. The amounts in the table may differ from those reported in our ConsolidatedBalance Sheet at December 31, 2016. Changes in our business needs, cancellation provisions and changes in interestrates, as well as actions by third parties and other factors, may cause these estimates to change. Therefore, our actualpayments in future periods may vary from those presented in the table. The following table summarizes certain of ourcontractual obligations and principal and interest payments under our debt instruments, leases and purchase obligationsat December 31, 2016.

72
Total Less than 1 3 3 5 More than($ in millions) 1 year years years 5 yearsPayments due by periodLong-term debt obligations 6,534 843 1,700 1,255 2,736Interest payments related to long-term debt 1,446 195 320 231 700Operating lease obligations 1,548 382 552 371 243Capital lease obligations(1) 177 30 48 31 68Purchase obligations 4,553 3,730 710 99 14Total 14,258 5,180 3,330 1,987 3,761
(1) Capital lease obligations represent the total cash payments to be made in the future and include interest expense of $62 million andexecutory costs of $1 million.
In the table above, the long-term debt obligations reflect the cash amounts to be repaid upon maturity of thosedebt obligations. The cash obligations above will differ from the long-term debt balance reflected in Note 12 Debt toour Consolidated Financial Statements due to the impacts of fair value hedge accounting adjustments and premiums ordiscounts on certain debt. In addition, capital lease obligations are shown separately in the table above while they arecombined with Long-term debt amounts in our Consolidated Balance Sheets.
We have determined the interest payments related to long-term debt obligations by reference to the paymentsdue under the terms of our debt obligations at the time such obligations were incurred. However, we use interest rateswaps to modify the interest characteristics of certain of our debt obligations. The net effect of these swaps may be toincrease or decrease the actual amount of our cash interest payment obligations, which may differ from those stated inthe above table. For further details on our debt obligations and the related hedges, see Note 12 Debt to ourConsolidated Financial Statements.
Of the total of $921 million unrecognized tax benefits (net of deferred tax assets) at December 31, 2016, it isexpected that $9 million will be paid within less than a year. However, we cannot make a reasonably reliable estimate asto the related future payments for the remaining amount.
Off balance sheet arrangements
Commercial commitments
We disclose the maximum potential exposure of certain guarantees, as well as possible recourse provisions thatmay allow us to recover from third parties amounts paid out under such guarantees. The maximum potential exposuredoes not allow any discounting of our assessment of actual exposure under the guarantees. The information belowreflects our maximum potential exposure under the guarantees, which is higher than our assessment of the expectedexposure.
Guarantees
The following table provides quantitative data regarding our third-party guarantees. The maximum potentialpayments represent a worst-case scenario, and do not reflect our expected outcomes.
December 31,2016 2015
Maximum potential($ in millions) paymentsPerformance guarantees 193 209Financial guarantees 69 77Indemnification guarantees 71 50Total 333 336

73
The carrying amounts of liabilities recorded in the Consolidated Balance Sheets in respect of the aboveguarantees were not significant at December 31, 2016 and 2015, and reflect our best estimate of future payments, whichwe may incur as part of fulfilling our guarantee obligations.
In addition, in the normal course of bidding for and executing certain projects, we have entered into standbyletters of credit, bid/performance bonds and surety bonds (collectively performance bonds ) with various financialinstitutions. Customers can draw on such performance bonds in the event that the Company does not fulfill itscontractual obligations. ABB would then have an obligation to reimburse the financial institution for amounts paid underthe performance bonds. At December 31, 2016 and 2015, the total outstanding performance bonds aggregated to $7.9billion and $9.5 billion, respectively. There have been no significant amounts reimbursed to financial institutions underthese types of arrangements in 2016, 2015 and 2014.
For additional descriptions of our performance, financial and indemnification guarantees see Note 15Commitments and contingencies to our Consolidated Financial Statements.
Item 6. Directors, Senior Management and Employees
SUMMARY OF CORPORATE GOVERNANCE APPROACH
General Meeting of Shareholders
Board of DirectorsExternalAuditor
Executive Committee
Corporate Governance - General principles
ABB is committed to the highest international standards of corporate governance and this is reinforced in itsstructure, processes and rules as outlined in this section of the Annual Report. In line with this, ABB complies with thegeneral principles as set forth in the Swiss Code of Best Practice for Corporate Governance, as well as those of thecapital markets where its shares are listed and traded. In addition to the provisions of the Swiss Code of Obligations,
and the ABB Ltd Related Party Transaction Policy), and the ABB Code of Conduct and the Addendum to the ABB
Board of Directors (the Board) to review and amend or propose amendments to those documents from time to time toreflect the most recent developments and practices, as well as to ensure compliance with applicable laws andregulations.
Compensation Governance and Board and EC compensation
can be found in the

74
BOARD OF DIRECTORS
Board and Board Committees (2016 - 2017 Board Term)
Board of DirectorsChairman: Peter R. Voser Matti Alahuhta Robyn Denholm Satish PaiVice Chairman: Jacob Wallenberg David Constable Louis R. Hughes Michel de Rosen
Frederico Fleury Curado David Meline Ying Yeh
Finance, Audit and ComplianceCommittee
Governance and NominationCommittee Compensation Committee
Louis R. Hughes (chairman) Peter R. Voser (chairman) Michel de Rosen (chairman)
Robyn Denholm Matti Alahuhta David ConstableDavid Meline Jacob Wallenberg Frederico Fleury Curado
Satish Pai Ying Yeh
Board governance
The Board
The Board defines the ultimate direction of the business of ABB and issues the necessary instructions. Itdetermines the organization of the ABB Group and appoints, removes and supervises the persons entrusted with theexecutive management and representation of ABB. The internal organizational structure and the definition of the areasof responsibility of the Board, as well as the information and control instruments vis-à-vis the Executive Committee, areset forth in the ABB Ltd Board Regulations & Corporate Governance Guidelines.
The Board takes decisions as a whole, supported by its three committees: the Finance, Audit and ComplianceCommittee (FACC), the Governance and Nomination Committee (GNC), and the Compensation Committee (CC).These committees assist the Board in its tasks and report regularly to the Board. The members of the Board committeeseither are required to be independent or are elected directly by the shareholders. The Board and its committees meetregularly throughout the year. Any Board Member may request a Board or committee meeting and the inclusion of anagenda item. Before meetings, Board Members receive materials to help them prepare for the discussions and decisionmaking.
The directors and officers of a Swiss corporation are bound, as specified in the Swiss Code of Obligations, toperform their duties with all due care, to safeguard the interests of the corporation in good faith and to extend equaltreatment to shareholders in like circumstances.
The Swiss Code of Obligations does not specify what standard of due care is required of the directors of acorporate board. However, it is generally held by Swiss legal scholars and jurisprudence that the directors must have therequisite capability and skill to fulfill their function, and must devote the necessary time to the discharge of their duties.Moreover, the directors must exercise all due care that a prudent and diligent director would have taken in likecircumstances. Finally, the directors are required to take actions in the best interests of the corporation and may not takeany actions that may be harmful to the corporation.
Chairman of the Board
The Chairman is elected by the shareholders to represent their interests in creating sustainable value througheffective governance. In addition, the Chairman (1) takes provisional decisions on behalf of the Board on urgent matterswhere a regular Board decision cannot be obtained (2) calls for Board meetings and sets the related agendas, (3) interactswith the CEO and other EC members on a more frequent basis outside of Board meetings and (4) represents the Boardinternally and in the public sphere.

75
Vice-Chairman of the Board
The Vice-Chairman is elected by the Board and handles the responsibilities of the Chairman to the extent theChairman is unable to do so or would have a conflict of interest in doing so. He also acts as counselor/advisor to theChairman on any matters that are Company or Board relevant and as appropriate or as the Chairman may require andwith a particular focus on strategic aspects related to the Company and its business in general. In addition, the Vice-Chairman takes such other actions as may be decided by the Board or requested by the Chairman.
Finance, Audit and Compliance Committee
The FACC is responsible for overseeing (1) the in
s capital structure, fundingrequirements and financial risk and policies.
The FACC must comprise three or more independent directors who have a thorough understanding of financeand accounting. The Chairman of the Board and, upon invitation by the committmembers of the Executive Committee may participate in the committee meetings, provided that any potential conflict ofinterest is avoided and confidentiality of the discussions is maintained. In addition, the Chief Integrity Officer, the Headof Internal Audit and the external auditors participate in the meetings as appropriate. As required by the U.S. Securitiesand Exchange Commission (SEC) at least one member of the FACC has to be an audit committee financial expert. TheBoard has determined that each member of the FACC is an audit committee financial expert.
Governance and Nomination Committee
The GNC is responsible for (1) overseeing corporate governance practices within ABB, (2) nominatingcandidates for the Board, the role of CEO and other positions on the Executive Committee, and (3) succession planningand employment matters relating to the Board and the Executive Committee. The GNC is also responsible formaintaining an orientation program for new Board members and an ongoing education program for existing Boardmembers.
The GNC must comprise three or more independent directors. The Chairman of the Board (unless he is alreadyxecutive Committee
may participate in the committee meetings, provided that any potential conflict of interest is avoided and confidentialityof the discussions is maintained.
Compensation Committee
The CC is responsible for compensation matters relating to the Board and the Executive Committee.
The CC must comprise three or more directors who are elected by the shareholders. The Chairman of the Board
participate in the committee meetings, provided that any potential conflict of interest is avoided and confidentiality ofthe discussions is maintained.
Board Membership
Board Composition
In proposing individuals to be elected to the Board, the Board seeks to align the composition and skills of theBoard with strategic needs, business portfolio, geographic reach and culture. The Board must be diversein all aspects including gender, nationalities, geographic/regional experience and business experience. In addition, theaverage tenure of the members of the Board should be well balanced. The Board also considers the number of othermandates of each Board member to ensure that he/she will have sufficient time to dedicate to his/her role as an ABBboard member.

76
Elections and Term of Office
The members of the Board of Directors and the Chairman of the Board as well as the members of theCompensation Committee are elected by shareholders at the General Meeting of Shareholders for a term of officeextending until completion of the next Ordinary General Meeting of Shareholders. Members whose terms of office haveexpired shall be immediately eligible for re-election. Our Articles of Incorporation do not provide for the retirement ofdirectors based on their age. However, an age limit for members of the Board is set forth in the ABB Ltd BoardRegulations & Corporate Governance Guidelines (although waivers are possible and subject to Board discretion. If theoffice of the Chairman of the Board of Directors or any position on the Compensation Committee becomes vacantduring a Board term, the Board of Directors may appoint (shall appoint in the case of the Chairman of the Board)another individual from among its members to that position for the remainder of that term. The Board of Directors shallconsist of no less than 7 and no more than 13 members.
Members of the Board (2016-2017 Board Term):
Name Nationality Year of BirthFirst election
at AGMEnd of
current termNon-
Executive IndependentPeter R. Voser CH 1958 2015 2017 Yes Yes
Jacob Wallenberg SE 1956 1999 2017 Yes Yes
Matti Alahuhta FI 1952 2014 2017 Yes Yes
David Constable CA 1961 2015 2017 Yes Yes
Frederico Fleury Curado BR 1961 2016 2017 Yes Yes
Robyn Denholm US/AU 1963 2016 2017 Yes Yes
Louis R. Hughes US 1949 2003 2017 Yes Yes
David Meline CH/US 1957 2016 2017 Yes Yes
Satish Pai IN 1961 2016 2017 Yes Yes
Michel de Rosen FR 1951 2002 2017 Yes Yes
Ying Yeh CN 1948 2011 2017 Yes Yes
Peter R. Vosermember of the boards of directors of Roche Holdings Ltd (Switzerland), IBM Corporation (U.S.) and Temasek Holdings(Private) Limited (Singapore). He is also the chairman of the board of Catalyst (U.S.), a non-profit organization. He wasthe chief executive officer of Royal Dutch Shell plc (The Netherlands) from 2009 until 2013. Mr. Voser was born in1958 and is a Swiss citizen.
Jacob Wallenberg oard of Directors since June 1999 and Vice-Chairman sinceApril 2015. He is the chairman of the board of Investor AB (Sweden). He is vice chairman of the boards ofTelefonaktiebolaget LM Ericsson AB, SAS AB, FAM AB and Patricia Industries AB (all Sweden). He is also a memberof the boards of directors of the Knut and Alice Wallenberg Foundation and the Stockholm School of Economics (bothSweden) and vice-chairman of the Swedish American Chamber of Commerce (U.S.). Mr. Wallenberg was born in 1956and is a Swedish citizen.
Matti Alahuhtaboards of Outotec Corporation and of DevCo Partners Oy (both Finland). He is also a member of the boards of directorsof KONE Corporation (Finland) and Volvo AB (Sweden). He was president and CEO of KONE Corporation from 2006until March 2014 and in addition he served as its president in 2005. He joined KONE Corporation after 26 years withNokia Corporation (Finland). Mr. Alahuhta was born in 1952 and is a Finnish citizen.
David Constableofficer of Sasol Limited (South Africa) from 2011 until June 2016 and in addition he was the president from 2014 untilJune 2016. He joined Sasol after more than 29 years with Fluor Corporation (U.S.). He is a member of the boards ofdirectors of Rio Tinto plc (U.K.), Rio Tinto Limited (Australia) and Anadarko Petroleum Corporation (U.S.). Mr.Constable was born in 1961 and is a Canadian citizen.

77
Frederico Fleury Curadothe boards of directors of Iochpe-Maxion S.A. (Brazil) and Transocean Ltd. (Switzerland). He was the CEO of EmbraerS.A. (Brazil) from 2007 until June 2016. Mr. Curado was born in 1961 and is a Brazilian citizen.
Robyn Denholmthe chief operations officer of Telstra Corporation Limited (Australia). Previously, she was the chief financial officer ofJuniper Networks (U.S.) from 2007 to March 2016 and in addition she was the chief operating officer from 2013 toMarch 2016. She is a member of the board of directors of Tesla, Inc. (U.S.). Ms. Denholm was born in 1963 and is aU.S. and Australian citizen.
Louis R. Hughesboard of InZero Systems (formerly GBS Laboratories LLC) (U.S.). He is also a member of the supervisory board ofAkzo Nobel N.V. (The Netherlands) and a member of the board of directors of Nokia Corporation (Finland). Mr.Hughes was born in 1949 and is a U.S. citizen.
David Meline 2016. He is the chief financialofficer of Amgen Inc. (U.S.). He was the chief financial officer of 3M Company (U.S.) from 2008 to 2014. Prior tojoining 3M, Mr. Meline worked for more than 20 years for General Motors Company (U.S.). Mr. Meline was born in1957 and is a Swiss and U.S. citizen.
Satish Paimember of the board of directors of Hindalco Industries Ltd. (India). He joined Hindalco in 2013 after 28 years withSchlumberger Limited (U.S.). Mr. Pai was born in 1961 and is an Indian citizen.
Michel de Rosenboard of Eutelsat Communications (France) and until March 2016 was also the chief executive officer. He is a memberof the boards of directors of Pharnext SAS and Faurecia SARL (both France). Mr. de Rosen was born in 1951 and is aFrench citizen.
Ying Yeh 1. She is a member of the board ofdirectors of Samsonite International S.A. (Luxembourg). Ms. Yeh was born in 1948 and is a Chinese citizen.
As of December 31, 2016, all Board members were non-executive and independent directors and none of
be found by clicking on the ABB Board of Directors CV link which can be found at www.abb.com/about/corporate-governance
Board Meetings
The Board meets as frequently as needed but at least four times per annual Board term. The Board has meetingswith Executive Committee members as well as private meetings without them. Board meetings are convened by thechairman or upon request by a director or the CEO. Documentation covering the various items of the agenda for eachBoard meeting is sent out in advance to each Board member in order to allow each member time to study the coveredmatters prior to the meetings. Decisions made at the Board meetings are recorded in written minutes of the meetings.
meetings are recorded in written minutes of the meetings.

78
Meetings and attendance
The table below shows the number of meetings held during 2016 by the Board and its committees, theiraverage duration, as well as the attendance of the individual Board members. The Board meetings shown include astrategic retreat attended by the members of the Board and the EC.
2016
Pre Annual General Meeting 2016 Post Annual General Meeting 2016
Board FACC GNC CC Board FACC GNC CC
Meetings and attendance Mtg. Conf. Call Mtg. Conf. Call
Average duration (hours) 7.5 1.0 3.7 1.5 1.5 8.0 1.0 3.5 1.0 1.5
Number of meetings 2 1 3 4 3 5 1 6 3 3
Meetings attended:
Peter R. Voser 2 1 - 4 - 5 1 - 3 -
Jacob Wallenberg 2 1 - 4 - 5 1 - 3 -
Roger Agnelli (1) 1 1 2 - - - - - - -
Matti Alahuhta 2 1 3 4 - 5 1 - 3 -
David Constable 2 1 - - 3 5 1 - - 3
Frederico Fleury Curado (2) - - - - - 5 1 - - 3
Robyn Denholm (2) - - - - - 5 1 6 - -
Louis R. Hughes 2 1 3 - - 5 1 6 - -
David Meline (2) - - - - - 5 1 6 - -
Satish Pai (2) - - - - - 5 1 6 - -
Michel de Rosen 2 1 - - 3 5 1 - - 3
Ying Yeh (3) 2 1 1 - 3 5 1 - - 3
(1) Roger Agnelli died in a tragic accident in March 2016.(2) Frederico Fleury Curado, Robyn Denholm, David Meline and Satish Pai were first elected to the Board at the April 2016 AGM.(3) Ying Yeh substituted for Roger Agnelli at the last FACC meeting before the AGM.
Mandates of Board members outside the ABB Group
No member of the Board may hold more than ten additional mandates of which no more than four may be inlisted companies. Certain types of mandates, such as those in our subsidiaries, those in the same group of companies andthose in non-profit and charitable institutions, are not subject to those limits. Additional details can be found inArticle
Business Relationships between ABB and its Board members
This section describes important business relationships between ABB and its Board members, or companiesand organizations represented by them. This determination has been made based on ABB Ltd's Related PartyTransaction Policy. This policy is contained in the ABB Ltd Board Regulations & Corporate Governance Guidelines.
Sasol Ltd (Sasol) is an important customer of ABB. ABB supplies Sasol primarily with modular systemsthrough its Electrification Products division. David Constable was president and chief executive officer of Sasol and amember of its board of directors through June 2016.
IBM Corporation (IBM) is an important supplier to ABB. IBM supplies ABB primarily with IT-relatedhardware, software and services. Peter Voser is a director of IBM.
ABB has an unsecured syndicated $2-billion revolving credit facility. As of December 31, 2016, SEBSkandinaviska Enskilda Banken AB (publ) (SEB) had committed to approximately $74 million out of the $2-billiontotal. In addition, ABB has regular banking business with SEB. Jacob Wallenberg was the vice chairman of SEB untilMarch 2014.
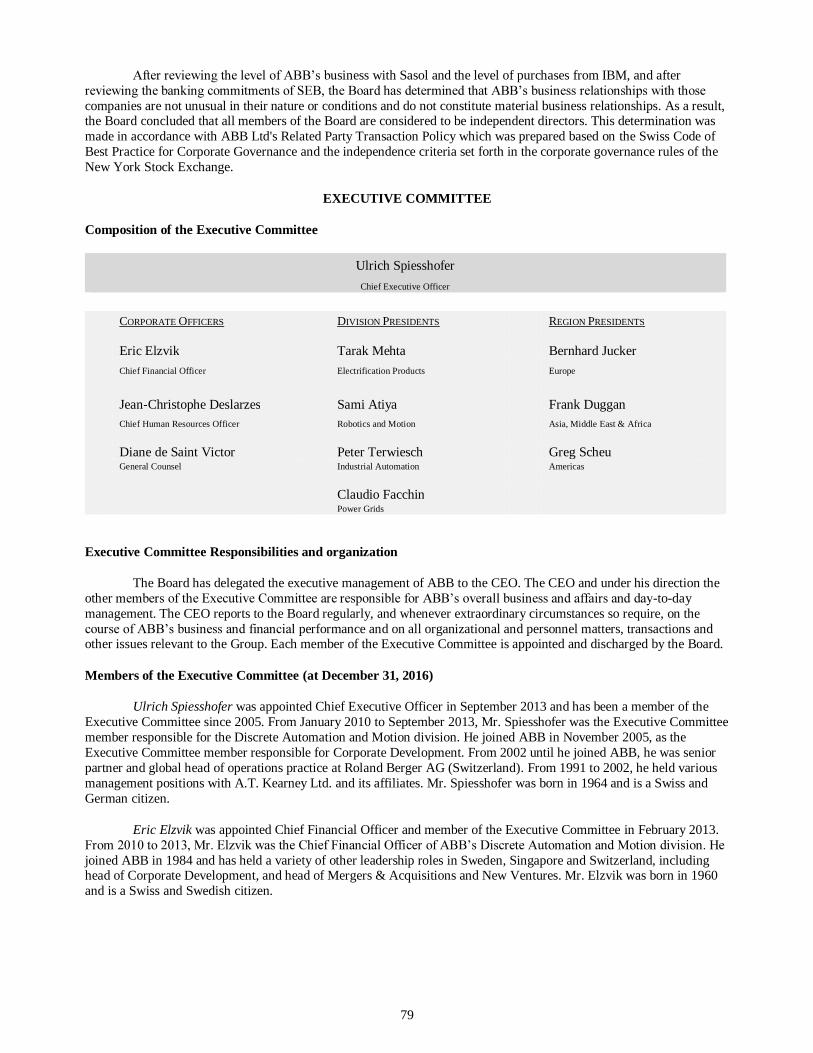
79
siness with Sasol and the level of purchases from IBM, and after
companies are not unusual in their nature or conditions and do not constitute material business relationships. As a result,the Board concluded that all members of the Board are considered to be independent directors. This determination wasmade in accordance with ABB Ltd's Related Party Transaction Policy which was prepared based on the Swiss Code ofBest Practice for Corporate Governance and the independence criteria set forth in the corporate governance rules of theNew York Stock Exchange.
EXECUTIVE COMMITTEE
Composition of the Executive Committee
Ulrich SpiesshoferChief Executive Officer
CORPORATE OFFICERS DIVISION PRESIDENTS REGION PRESIDENTS
Eric Elzvik Tarak Mehta Bernhard JuckerChief Financial Officer Electrification Products Europe
Jean-Christophe Deslarzes Sami Atiya Frank DugganChief Human Resources Officer Robotics and Motion Asia, Middle East & Africa
Diane de Saint Victor Peter Terwiesch Greg ScheuGeneral Counsel Industrial Automation Americas
Claudio FacchinPower Grids
Executive Committee Responsibilities and organization
The Board has delegated the executive management of ABB to the CEO. The CEO and under his direction theother -to-daymanagement. The CEO reports to the Board regularly, and whenever extraordinary circumstances so require, on the
performance and on all organizational and personnel matters, transactions andother issues relevant to the Group. Each member of the Executive Committee is appointed and discharged by the Board.
Members of the Executive Committee (at December 31, 2016)
Ulrich Spiesshofer was appointed Chief Executive Officer in September 2013 and has been a member of theExecutive Committee since 2005. From January 2010 to September 2013, Mr. Spiesshofer was the Executive Committeemember responsible for the Discrete Automation and Motion division. He joined ABB in November 2005, as theExecutive Committee member responsible for Corporate Development. From 2002 until he joined ABB, he was seniorpartner and global head of operations practice at Roland Berger AG (Switzerland). From 1991 to 2002, he held variousmanagement positions with A.T. Kearney Ltd. and its affiliates. Mr. Spiesshofer was born in 1964 and is a Swiss andGerman citizen.
Eric Elzvik was appointed Chief Financial Officer and member of the Executive Committee in February 2013.
joined ABB in 1984 and has held a variety of other leadership roles in Sweden, Singapore and Switzerland, includinghead of Corporate Development, and head of Mergers & Acquisitions and New Ventures. Mr. Elzvik was born in 1960and is a Swiss and Swedish citizen.

80
Jean-Christophe Deslarzes was appointed Chief Human Resources Officer and member of the ExecutiveCommittee in November 2013. In April 2015, he was elected to the board of directors of the Adecco Group(Switzerland). From 2010 through 2013, he was the Chief Human Resources and Organization Officer of the CarrefourGroup (France). From 2008 to 2010 he was President and CEO of the Downstream Aluminum Businesses of Rio Tinto(Canada). He was Senior Vice President Human Resources of Alcan Inc. (Canada) from 2006 to 2008 and in addition heco-led the integration of Rio Tinto and Alcan from 2007 to 2008. From 1994 to 2006, he held various human resourcesand management roles with Alcan Inc. Mr. Deslarzes was born in 1963 and is a Swiss citizen.
Diane de Saint Victor was appointed General Counsel, Company Secretary and member of the ExecutiveCommittee in January 2007. In March 2013, she was appointed as a non-executive director of Barclays plc and BarclaysBank plc (both U.K.). From 2004 to 2006, she was general counsel of the Airbus Group (France/Germany). From 2003to 2004, she was general counsel of SCA Hygiene Products (Germany). From 1993 to 2003, she held various legalpositions with Honeywell International (France/Belgium). From 1988 to 1993, she held various legal positions withGeneral Electric (U.S.). Ms. de Saint Victor was born in 1955 and is a French citizen.
Tarak Mehta was appointed President of the Electrification Products division effective January 2016 and hasbeen a member of the Executive Committee since October 2010. From October 2010 through December 2015, he wasPresident of the Low Voltage Products divisBetween 1998 and 2006, he held several management positions with ABB. Mr. Mehta was born in 1966 and is a U.S.citizen.
Sami Atiya was appointed President of the Robotics and Motion Division effective January 2017 and has been amember of the Executive Committee since June 2016. From June to December 2016 he was President of the DiscreteAutomation and Motion division. Prior to joining ABB, Mr. Atiya held senior roles at Siemens in Germany from 1997 to2015, including CEO of the Mobility and Logistics division in the Infrastructure and Cities Sector from 2011. Mr. Atiyawas born in 1964 and is a German citizen.
Peter Terwiesch was appointed President of the Industrial Automation division effective January 2017 and hasbeen a member of the Executive Committee since January 2015. He is a member of the board of directors of Metall ZugAG (Switzerland). He was the President of the Process Automation division from 2015 to 2016. From 2011 to 2014, he
to 2005, he held several positions with ABB. Mr. Terwiesch was born in 1966 and is a Swiss and German citizen.
Claudio Facchin was appointed President of the Power Grids division effective January 2016 and has been amember of the Executive Committee since December 2013. From December 2013 through December 2015, he wasPresident of the Power Systems division. From 2010 to 2013, Mr. Facchin was
various management roles with ABB. Mr. Facchin was born in 1965 and is an Italian citizen.
Bernhard Jucker was appointed President of the Europe region and Chairman of Divisional TransformationTeam effective January 2016 and has been a member of the Executive Committee since January 2006. He is a memberof the Board of directors of Rieter Holding Ltd. (Switzerland). From 2006 through 2015, he was President of the Power
various positions in ABB. Mr. Jucker was born in 1954 and is a Swiss citizen.
Frank Duggan was appointed President of the Asia, Middle East and Africa region in January 2015 and hasbeen a member of the Executive Committee since 2011. From 2011 to 2014, Mr. Duggan was the head of Global
anager for India, Middle East and Africa. From 2008 to 2011,
positions with ABB. Mr. Duggan was born in 1959 and is an Irish citizen.
Greg Scheu was appointed President of the Americas region as well as Head of Group Service and BusinessIntegration in January 2015 and has been a member of the Executive Committee since 2012. From 2013 to 2014, he wasHead of Business Integration, Group Service and North America. From 2012 to 2013, he was Head of Marketing andCustomer Solutions. Mr. Scheu, a former executive of Rockwell International, joined ABB in 2001 and was responsiblefor the integration of both Baldor Electric Co. and of Thomas & Betts into ABB. Mr. Scheu was born in 1961 and is aU.S. citizen.

81
In October 2016, it was announced that Mr. Elzvik will leave ABB in 2017 after facilitating the handover to hissuccessor Timo Ihamuotila who will be joining ABB from Nokia Corporation as CFO effective April 1, 2017.
Further information about the members of the Executive Committee can be found by clicking on the ExecutiveCommittee CV link at www.abb.com/about/corporate-governance
Mandates of EC members outside the ABB Group
No member of the EC may hold more than five additional mandates of which no more than one may be in alisted company. Certain types of mandates, such as those in our subsidiaries, those in the same group of companies andthose in non-profit and charitable institutions, are not subject to those limits. Additional details can be found inArticle
Business Relationships between ABB and its EC members
This section describes important business relationships between ABB and its EC members, or companies andorganizations represented by them. This determination has been made based on ABB Ltd's Related Party TransactionPolicy. This policy is contained in the ABB Ltd Board Regulations & Corporate Governance Guidelines.
Adecco S.A. (Adecco) is an important supplier to ABB. Adecco primarily supplies ABB with temporarypersonnel services. Jean-Christophe Deslarzes is a director of Adecco.
ABB has an unsecured syndicated $2-billion revolving credit facility. As of December 31, 2016, Barclays Bankplc (Barclays Bank) had committed to approximately $74 million out of the $2-billion total. In addition, ABB hasregular banking business with Barclays. Diane de Saint Victor is a director of Barclays Bank and Barclays plc.
After reviewing the level of purchases from Adecco, and after reviewing the banking commitments of Barclays,
conditions and do not constitute material business relationships. This determination was made in accordance with ABBLtd's Related Party Transaction Policy which was prepared based on the Swiss Code of Best Practice for CorporateGovernance and the independence criteria set forth in the corporate governance rules of the New York Stock Exchange.
SHARES
Share capital of ABB
At December 31, 2016, ordinary share capital (including treasury shares) as registered with theCommercial Register amounted to CHF 265,769,191.68, divided into 2,214,743,264 fully paid registered shares with apar value of CHF 0.12 per share.
s shares are listed on the SIX Swiss Exchange, the NASDAQ OMX Stockholm Exchange and theNew York Stock Exchange (where its shares are traded in the form of American depositary shares (ADS) each ADSrepresenting one registered ABB share). At December 31, 2016, ABB Ltd had a market capitalization based onoutstanding shares (total number of outstanding shares: 2,138,706,835) was approximately CHF 46 billion ($45 billion,SEK 410 billion). The only consolidated subsidiary in the ABB Group with listed shares is ABB India Limited,Bangalore, India, which is listed on the BSE Ltd. (Bombay Stock Exchange) and the National Stock Exchange of India.At December 31, 2016, ABB Ltd, Switzerland, directly or indirectly owned 75 percent of ABB India Limited,Bangalore, India, which at that time had a market capitalization of approximately INR 220 billion.

82
Stock exchange listings (At December 31, 2016)Stock exchange Security Ticker symbol ISIN codeSIX Swiss Exchange ABB Ltd, Zurich, share ABBN CH0012221716NASDAQ OMX Stockholm Exchange ABB Ltd, Zurich, share ABB CH0012221716New York Stock Exchange ABB Ltd, Zurich, ADS ABB US0003752047
BSE Ltd. (Bombay Stock Exchange) ABB India Limited, Bangalore, share ABB* INE117A01022National Stock Exchange of India ABB India Limited, Bangalore, share ABB INE117A01022* also called Scrip ID
Share repurchases and cancellation
Under the share buyback program announced in September 2014, ABB repurchased a total of 146,595,000Shareholders in 2016, the shareholders approved the cancellation
of 100 million shares. This was completed in July 2016 after the required waiting period. As a result of the cancellation,tends to ask the shareholders at the General
Meeting of Shareholders in 2017 to approve the cancellation of the remaining 46,595,000 shares that were repurchased.Further information can be found at www.abb.com/investorrelations
Changes to the ordinary share capital
In 2016, ABB paid its dividend relating to the year 2015 by way of a nominal value reduction in the par valueof its shares from CHF 0.86 to CHF 0.12. Corresponding adjustments were made to thand authorized shares. In 2015, ABB paid a portion of its dividend relating to the year 2014 by way of a nominal valuereduction in the par value of its shares from CHF 1.03 to CHF 0.86. Corresponding adjustments were made to the par
share capital during 2016, 2015 and 2014.
Convertible bonds and options
ABB does not have any bonds outstanding that are convertible into ABB shares. For information about optionson shares issued by ABB, please refer to 19 to Consolidated Financial Statements.
Contingent share capital
At December 31, 2016, share capital may be increased by an amount not to exceed CHF 24,000,000through the issuance of up to 200,000,000 fully paid registered shares with a par value of CHF 0.12 per share throughthe exercise of conversion rights and/or warrants granted in connection with the issuance on national or internationalcapital markets of newly or already issued bonds or other financial market instruments.
At December 31, 2016, share capital may be increased by an amount not to exceed CHF 1,200,000through the issuance of up to 10,000,000 fully paid registered shares with a par value of CHF 0.12 per share through theexercise of warrant rights granted to its shareholders. The Board may grant warrant rights not taken up by shareholdersfor other purposes in the interest of ABB.
The pre-emptive rights of the shareholders are excluded in connection with the issuance of convertible orwarrant-bearing bonds or other financial market instruments or the grant of warrant rights. The then current owners ofconversion rights and/or warrants will be entitled to subscribe for new shares. The conditions of the conversion rightsand/or warrants will be determined by the Board.
The acquisition of shares through the exercise of warrants and each subsequent transfer of the shares will besubject to the restrictions of Articles of Incorporation (see on transferability of shares and nominee
in Shareholders section below).

83
In connection with the issuance of convertible or warrant-bearing bonds or other financial market instruments,the Board is authorized to restrict or deny the advance subscription rights of shareholders if such bonds or other financialmarket instruments are for the purpose of financing or refinancing the acquisition of an enterprise, parts of an enterprise,participations or new investments or an issuance on national or international capital markets. If the Board deniesadvance subscription rights, the convertible or warrant-bearing bonds or other financial market instruments will beissued at the relevant market conditions and the new shares will be issued pursuant to the relevant market conditionstaking into account the share price and/or other comparable instruments having a market price. Conversion rights may beexercised during a maximum ten-year period, and warrants may be exercised during a maximum seven-year period, ineach case from the date of the respective issuance. The advance subscription rights of the shareholders may be grantedindirectly.
At December 31, 2016, share capital may be increased by an amount not to exceed CHF 11,284,656through the issuance of up to 94,038,800 fully paid shares with a par value of CHF 0.12 per share to employees. Thepre-emptive and advance subscription rights of shareholders are excluded. The shares or rights to subscribe forshares will be issued to employees pursuant to one or more regulations to be issued by the Board, taking into accountperformance, functions, level of responsibility and profitability criteria. ABB may issue shares or subscription rights toemployees at a price lower than that quoted on a stock exchange. The acquisition of shares within the context ofemployee share ownership and each subsequent transfer of the shares will be subject to the restrictions ofArticles of Incorporation (see on transferability of shares and nominee in Shareholders
section below).
Authorized share capital
At December 31, 2016, ABB had an authorized share capital in the amount of up to CHF 24,000,000 throughthe issuance of up to 200,000,000 fully paid registered shares with a par value of CHF 0.12 each, which is valid throughApril 29, 2017. The Board is authorized to determine the date of issue of new shares, the issue price, the type ofpayment, the conditions for the exercise of pre-emptive rights and the beginning date for dividend entitlement. In thisregard, the Board may issue new shares by means of a firm underwriting through a banking institution, a syndicate oranother third party with a subsequent offer of these shares to the shareholders. The Board may permit pre-emptive rightsthat have not been exercised by shareholders to expire or it may place these rights and/or shares as to which pre-emptiverights have been granted but not exercised at market conditions or use them for other purposes in the interest of thecompany. Furthermore, the Board is authorized to restrict or deny the pre-emptive rights of shareholders and allocatesuch rights to third parties if the shares are used (1) for the acquisition of an enterprise, parts of an enterprise, orparticipations, or for new investments, or in case of a share placement, for the financing or refinancing of suchtransactions; or (2) for the purpose of broadening the shareholder constituency in connection with a listing of shares ondomestic or foreign stock exchanges. The subscription and the acquisition of the new shares, as well as each subsequenttransfer of the shares, will be subject to the restrictions of Articles of Incorporation.
SHAREHOLDERS
Shareholder structure
As of December 31, 2016, the total number of shareholders directly registered with ABB Ltd wasapproximately 142,000 and another 198,000 shareholders held shares indirectly through nominees. In total as of thatdate, ABB had approximately 340,000 shareholders.
Significant shareholders
Investor AB, Sweden, held 232,165,142 ABB shares as of December 31, 2016. This holding representsapproximately 10.48 percent of total share capital and voting rights as registered in the Commercial Register onDecember 31, 2016. The number of shares held by Investor AB does not include shares held by Jacob Wallenberg, thechairman of Investor AB and a director of ABB, in his individual capacity.
Cevian Capital II GP Limited, Channel Islands, disclosed that as per February 23, 2017, on behalf of its generalpartners, it held 115,868,333 ABB shares. This holding represents approximately 5.23 percent of total sharecapital and voting rights as registered in the Commercial Register on December 31, 2016.

84
BlackRock Inc., New York, U.S., disclosed that as per July 25, 2011, it, together with its direct and indirectsubsidiaries, held 69,702,100 ABB shares. This holding represents 3.15 percent of total share capital and votingrights as registered in the Commercial Register on December 31, 2016.
To the best of knowledge, no other shareholder held 3 percent or more of total share capital andvoting rights as registered in the Commercial Register on December 31, 2016.
ABB Ltd has no cross shareholdings in excess of 5 percent of capital, or voting rights with any other company.
Under Articles of Incorporation, each registered share represents one vote. Significant shareholders donot have different voting rights. To our knowledge, we are not directly or indirectly owned or controlled by anygovernment or by any other corporation or person.
rights
Shareholders have the right to receive dividends, to vote and to execute such other rights as granted underSwiss law and Articles of Incorporation.
Right to vote
ABB has one class of shares and each registered share carries one vote at the general meeting. Voting rightsmay be exercised only after a shareholder has been registered in the share register of ABB as a shareholder with the rightto vote, or with Euroclear Sweden AB (Euroclear), which maintains a subregister of the share register of ABB.
A shareholder may be represented at the Annual General Meeting by its legal representative, by anothershareholder with the right to vote or the independent proxy elected by the shareholders (unabhängigerStimmrechtsvertreter). If the Company does not have an independent proxy, the Board of Directors shall appoint theindependent proxy for the next General Meeting of Shareholders. All shares held by one shareholder may be representedby one representative only.
For practical reasons shareholders must be registered in the share register no later than 6 business days beforethe general meeting in order to be entitled to vote. Except for the cases described under on transferability ofshares and nominee below, there are no voting rights restrictions limiting rights.
Shareholder dividend rights
The unconsolidated statutory financial statements of ABB Ltd are prepared in accordance with Swiss law.Based on these financial statements, dividends may be paid only if ABB Ltd has sufficient distributable profits fromprevious years or sufficient free reserves to allow the distribution of a dividend. Swiss law requires that ABB Ltd retainat least 5 percent of its annual net profits as legal reserves until these reserves amount to at least 20 percent of ABB
share capital. Any net profits remaining in excess of those reserves are at the disposal of themeeting.
Under Swiss law, ABB Ltd may only pay out a dividend if it has been proposed by a shareholder or the Boardof Directors and approved at a general meeting of shareholders, and the auditors confirm that the dividend conforms tostatutory law and Articles of Incorporation. In practice, the meeting usually approves dividends asproposed by the Board of Directors, if the Board of proposal is confirmed by the statutory auditors ascompliant with Swiss law and Articles of Incorporation.
Dividends are usually due and payable no earlier than two trading days after the resolution andthe ex-date for dividends is normally two trading days after the resolution approving the dividend.Dividends are paid out to the holders that are registered on the record date. Euroclear administers the payment of thoseshares registered with it. Under Swiss law, dividends not collected within five years after the due date accrue to ABBLtd and are allocated to its other reserves. As ABB Ltd pays cash dividends, if any, in Swiss francs (subject to theexception for certain shareholders in Sweden described below), exchange rate fluctuations will affect the U.S. dollaramounts received by holders of ADSs upon conversion of those cash dividends by Citibank, N.A., the depositary, inaccordance with the Amended and Restated Deposit Agreement dated May 7, 2001.

85
For shareholders who are residents of Sweden, ABB has established a dividend access facility (for up to600,004,716 shares). With respect to any annual dividend payment for which this facility is made available, shareholderswho register with Euroclear may elect to receive the dividend from ABB Norden Holding AB in Swedish krona (in anamount equivalent to the dividend paid in Swiss francs) without deduction of Swiss withholding tax. For furtherinformation on the dividend access facility, see ABB Articles of Incorporation.
Limitations on transferability of shares and nominee registration
ABB may decline a registration with voting rights if a shareholder does not declare that it has acquired theshares in its own name and for its own account. If the shareholder refuses to make such declaration, it will be registeredas a shareholder without voting rights. A person failing to expressly declare in its registration/application that it holdsthe shares for its own account (a nominee), will be entered in the share register with voting rights, provided that suchnominee has entered into an agreement with ABB concerning its status, and further provided that the nominee is subjectto recognized bank or financial market supervision. In special cases the Board may grant exemptions. There were noexemptions granted in 2016. The limitation on the transferability of shares may be removed by an amendment ofArticles of Incorporation by a resolution requiring two-thirds of the votes represented at the meeting.
No restriction on trading of shares
No restrictions are imposed on the transferability of ABB shares. The registration of shareholders in the ABBShare register, Euroclear and the ADS register kept by Citibank does not affect transferability of ABB shares or ADSs.Registered ABB shareholders or ADR holders may therefore purchase or sell their ABB shares or ADRs at any time,including before a General Meeting regardless of the record date. The record date serves only to determine the right tovote at a General Meeting.
Duty to make a public tender offer
Articles of Incorporation do not contain any provisions raising the threshold (opting up) or waiving theduty (opting out) to make a public tender offer pursuant to article 32 of the Swiss Stock Exchange and SecuritiesTrading Act.
OTHER GOVERNANCE INFORMATION
Management contracts
There are no management contracts between ABB and companies or natural persons not belonging to the ABBGroup.
Change of control clauses
Board members, Executive Committee members, and other members of senior management do not receive anyspecial benefits in the event of a change of control. However, the conditional grants under the Long Term IncentivePlan and the Management Incentive Plan may be subject to accelerated vesting in the event of a change of control.
Employee participation programs
Employee Share Acquisition Plan, theManagement Incentive Plan and the Long Term Incentive Plan. For a more detailed description of these incentive plans,
18 Share- s.
Governance differences from NYSE Standards
required to disclose significant ways in which its corporate governance practices differ from the Standards. ABB hasreviewed the Standards and concluded that its corporate governance practices are generally consistent with theStandards, with the following significant exceptions:

86
Swiss law requires that the external auditors be elected by the shareholders at the Annual General Meetingrather than by the audit committee or the board of directors.
The Standards require that all equity compensation plans and material revisions thereto be approved by theshareholders. Consistent with Swiss law such matters are decided by our Board. However, the shareholdersdecide about the creation of new share capital that can be used in connection with equity compensation plans.
Swiss law requires that the members of the compensation committee are elected by the shareholders rather thanappointed by our Board.
Swiss law requires shareholders to approve the maximum aggregate Board compensation and the maximumaggregate Executive Committee compensation.
COMPENSATION
Compensation Exhibit 1: Overview of total compensation (in CHF)
Board termBoard of Directors 2016 2017 2015 2016Number of members 11 members 8 membersTotal compensation 4,670,000 3,730,000Maximum aggregate compensation amount approved at AGM 4,700,000 4,500,000
Calendar yearExecutive Committee 2016 2015Number of members 11 members 12 membersTotal compensation 44,200,719 45,521,908
Maximum aggregate compensation amount approved at AGM 52,000,000not subject to
Compensation governance
engagement
Shareholders have been given a greater say on compensation matters in recent years. They approve the Articlesof Incorporation that outline the principles of compensation, including the requirement for shareholders each year toapprove the maximum aggregate compensation amounts of the Board and the EC. The provisions of the Articles of
-governance and are summarized below:
Compensation Committee (Articles 28 to 31): The CC is composed of a minimum of three members who areelected individually by the shareholders at the AGM for a period of one year. The CC supports the Board inestablishing and reviewing the compensation strategy, principles and programs, in preparing the proposals tothe AGM on compensation matters and in determining the compensation of the Board and of the EC. Theresponsibilities of the CC are defined in more detail in the ABB Ltd Board Regulations & CorporateGovernance G rporate governance website.Compensation principles (Article 33): Compensation of the members of the Board consists of fixedcompensation only. Compensation of the members of the EC consists of fixed and variable compensation.Variable compensation may comprise short-term and long-term elements. Compensation may be paid in cash,shares or other benefits.
-on- s (Article 34): Shareholders approve the maximum aggregate amount of compensation of theBoard for the following Board term and of the EC for the following financial year.Supplementary amount for new EC members (Article 35): If the maximum approved aggregate compensationamount is not sufficient to also cover the compensation of newly promoted/hired EC members, up to 30 percentof the last approved maximum aggregate amount shall be available as a supplementary amount to cover thecompensation of such new EC members.

87
Credits (Article 37): Credits may not be granted to members of the Board or of the EC.
Shareholders also have a consultative voCompensation report describes the compensation principles and programs as well as the governance framework relatedto the compensation of the Board and EC. The report also provides details of the compensation awarded to the membersof the Board and of the EC in the prior calendar year.
The Compensation report is written in accordance with the Ordinance against Excessive Remuneration in StockListed Corporations (Ordinance), the standard relating to information on Corporate Governance of the SIX SwissExchange, the rules of the stock markets of Sweden and the United States where shares are also listed, and theprinciples of the Swiss Code of Best Practice for Corporate Governance of economiesuisse.
Authority levels in compensation matters
The CC acts in an advisory capacity while the Board retains the decision authority on compensation matters,except for the maximum aggregate compensation amounts of the Board and of the EC, which are subject to the approvalof shareholders at the AGM. The authority levels of the different bodies on compensation matters are detailed inCompensation Exhibit 2.
Compensation Exhibit 2: Authority levels in compensation matters
Activities of the CC in 2016
The CC meets as often as business requires but at least four times a year. In 2016, the CC held six meetings andperformed the activities described in Compensation Exhibit 3. Details on meeting attendance of the individual CCmembers are provided in the se

88
Compensation Exhibit 3: CC activities during 2016
The Chairman of the CC reports to the full Board after each CC meeting. The minutes of the meetings areavailable to the members of the Board. As a general rule, the CEO, the Chief Human Resources Officer (CHRO) and theHead of Compensation and Benefits attend the CC meetings in an advisory capacity. The Chairman of the CC maydecide to invite other executives as appropriate. Executives do not attend the meetings or the parts of the meetings inwhich their own compensation and/or performance are being discussed.
The CC may decide to consult an external advisor for compensation matters. In 2016, Hostettler & Company(HCM) and PricewaterhouseCoopers (PwC) were mandated to provide services related to executive compensationmatters. HCM has no other mandate with ABB. Apart from its CC advisory role, PwC also provides human resources,tax and advisory services to ABB. In addition, support and expertise are provided to the CC by internal compensationexperts such as the CHRO and the Head of Compensation and Benefits.
Board compensation
Compensation principles
The compensation system for the members of the Board is designed to attract and retain experienced people onthe Board. Compensation of Board members takes into account the responsibilities, time and effort required to fulfilltheir roles on the Board and its committees. From time to time the levels and mix of compensation of Board membersare compared against the compensation of non-executive board members of publicly traded companies in Switzerlandthat are part of the Swiss Market Index.
The compensation of Board members is fixed. They do not receive variable compensation or pension benefits,underscoring their focus on corporate strategy, supervision and governance. In accordance with Swiss law, Boardmembers may not receive golden parachutes or other special benefits in the event of a change of control. Board membersare paid for their service over a 12-month period that starts with their election at the AGM. Payment is made in semi-annual installments in arrears.

89
In order to further align the interests of Board members with those of shareholders, half of their totalcompensation has to be paid in ABB shares, although Board members may choose to receive all of their compensation inshares. The number of shares delivered is calculated prior to each semi-annual payment by dividing the monetaryamount to which the Board members are entitled by the average closing price of the ABB share over a predefined30-day period. The shares are subject to a three-year restriction period during which they cannot be sold, transferred orpledged. Any restricted shares are unblocked when the Board member leaves the Board.
Structure of Board compensation
The structure of Board compensation for the term of office from AGM to AGM is described in CompensationExhibit 4.
Compensation Exhibit 4: Structure of Board compensationBoard term fee (CHF)
Chairman of the Board (1) 1,200,000Vice-chairman of the Board (1) 450,000Member of the Board 290,000
Additional committee fees:Chairman of FACC (2) 110,000Chairman of GNC and CC (2) 60,000Member of FACC (2) 40,000Member of GNC and CC (2) 30,000(1) The Chairman and Vice-chairman did not receive any additional committee fees for their roles on the GNC(2) CC: Compensation Committee
FACC: Finance, Audit & Compliance CommitteeGNC: Governance & Nomination Committee
The compensation amounts paid to the Board members for the calendar year 2016 and for the term of office from the2016 AGM to the 2017 AGM are disclosed in Compensation Exhibits 19 and 20, respectively, in the section
Executive Committee compensation
Compensation principles
talent&
infrastructure customers.
The compensation system is designed to provide competitive compensation and to encourage executives andemployees to deliver outstanding results and create sustainable shareholder value without taking excessive risks. Thecompensation system balances:
fixed and variable compensation elements;short-term and long-term incentives;the recognition of Group and individual performance.
rewards the achievement of financial and operational objectives and drives the leadership behaviors required for thelong-term and sustainable success of ABB. The compensation system is based on the following principles(Compensation Exhibit 5).

90
Compensation Exhibit 5: Principles of EC compensation
Strategic alignmentCompensation is directly linked to the Next Level Strategy through ambitiousperformance objectives and robust performance monitoring.
Performance orientation the upper quartile level when these objectives are met.
Comprehensive andbalanced KPIs
Performance metrics support the development of earnings per share and cash returnon invested capital. They also include measures of operational and behavioralperformance that are critical in the current change process of the Next LevelStrategy. Performance metrics are well-balanced as they reflect both Group andindividual performance, as well as short-term and long-term results.
Competitiveness
Compensation mix and levels are reviewed annually against benchmarks thatinclude relevant peer companies in the markets in which ABB operates. Annualbase salaries of EC members are set between the market median and upper quartilein order to attract suitable talent.
Alignment with
The Board defines the strategic direction of the company and regularly reviews the progress made on thestrategy. Based on these reviews, the Board sets performance targets and annual budgets, and ensures that the company'scompensation programs support the implementation of the strategy by appropriately rewarding performance (seeCompensation Exhibit 6).
Compensation Exhibit 6: Annual review of the business and performance cycle
To effectively align strategy, performance and compensation, the target setting and review processes are directly linkedto the financial and budget processes.

91
Market competitiveness and benchmarks
All EC and other senior positions at ABB have been evaluated using the job evaluation methodology of the HayGroup, which is used by more than 10,000 companies around the world. This approach provides a meaningful,transparent and consistent basis for evaluating roles and for comparing compensation levels with those of equivalentjobs at other companies.
The General Pan- Top Executive Compensation in Europe isprimarily used to benchmark EC compensation, which is targeted to be above the median values for the market. Other
European industry markets and on US peers (see Compensation Exhibit7).
Compensation Exhibit 7: Compensation benchmarksREFERENCE COMPOSITION RATIONALE
Main benchmarkGeneral Pan-European Market 360 largest European companies of
the FT Europe 500 listingContinuity and stability of datapoints
References to stress-test main benchmarkGlobal Industry Group Peer companies selected based on
business, geographic presence andsize
Specific peer group to benchmarkcompensation design
Swiss market SMI and SMIM companies that are-
European Market data
Comparison with othermultinational Swiss companies
US market US peers of similar size andindustry
Comparison with othermultinational US companies
Components of EC Compensation
The compensation of EC members consists of an annual base salary, benefits, a short-term variable componentbased on annual performance objectives and a long-term variable component based on long-term performance (seeCompensation Exhibit 8).
Compensation Exhibit 8: Structure of EC compensation
The main components of EC compensation are directly linked to performance.

92
The Board considers several factors when reviewing and setting the individual target compensation of each ECmember:
Market value of the role (external benchmark);Individual profile of the incumbent in terms of experience and skillset;Individual performance and potential; andAffordability for the company.
The compensation that is effectively paid depends on the performance of the Group and of the individualmembers of the EC. Compensation Exhibit 9 illustrates the relative proportions of the components of EC compensationunder the scenarios of minimum performance, target (expected) performance and maximum performance.
Compensation Exhibit 9: Compensation components under various scenarios
Fixed compensation annual base salary and benefits
The fixed compensation of EC members includes the fixed annual base salary and benefits. Benefits consistmainly of retirement, insurance and healthcare plans that are designed to provide a reasonable level of income for theemployees and their dependents in case of retirement, disability or death. Benefits plans vary in line with the localcompetitive and legal environment and are, at a minimum, in accordance with the legal requirements of the respectivecountry.
EC members are also provided with certain fringe benefits such as a company car according to competitivelocal market practice. Tax equalization is provided for EC members resident outside Switzerland to the extent that theyare not able to claim a tax credit in their country of residence for income taxes they paid in Switzerland. The monetaryvalue of these benefits is disclosed in Compensation Exhibits 21 and 22.

93
Short-term variable compensation
The short- r
success while being rewarded for their individual contributions.
Strategy that have beencommunicated to shareholders and have a weighting of 80 percent for the CEO and 65 percent for the other ECmembers. For 2016, the Group objectives included revenues, operational EBITA margin, operational net income,operating cash flow, cost savings and Net Promoter Score (NPS).
Individual objectives are set as part of the annual performance management process and support theimplementation of the Next Level Strategy in the respective area of responsibility of each EC member. They includemetrics that help the management to assess whether the results are achieved in a sustainable way in four differentcategories: financial performance, operational performance, strategic initiatives and leadership performance. Individualobjectives have a weighting of 20 percent for the CEO and 35 percent for other EC members (see Compensation Exhibit10).
Compensation Exhibit 10: Short-term variable compensation objectives and weighting in 2016
For each performance objective, a target is set corresponding to the expected level of performance that willgenerate a 100
ambitious financial plan and with theNext Level Strategy. Further, a minimum level of performance, below which there is no payout (threshold) and amaximum level of performance, above which the payout is capped at 150 percent of target (cap), are also defined. Thepayout percentages for achievements between the threshold, the target and the cap are determined by linearinterpolations.
Fully achieving all the objectives (target performance) results in a payout equivalent to 150 percent of theannual base salary for the CEO and 100 percent of the annual base salary for other EC members.
Long-term variable compensation
The long-term variable compensation for EC members consists of an annual conditional share grant under theLong Term Incentive Plan (LTIP), which is aimed at driving long-term shareholder value creation in a sustainablemanner. It rewards the achievement of predefined performance goals over a three-year vesting period.
The LTIP is split in two performance components:
a P1 component which isto the end of the vesting period, anda P2 component which is tied to the achieved weighted cumulative earnings-per-share (EPS) over thevesting period.
The P1 and P2 components are equally weighted in terms of the target fair value at grant.

94
(i) Determination of grant size
The number of shares conditionally granted under the LTIP is determined as follows:
A reference value for the LTIP is first established as a multiple of the annual base salary. In 2016, themultiples were 200 percent for the CEO and 107 percent for the other EC members. As the P1 and P2components are equally weighted, the reference value of these components for the CEO and the other ECmembers for the 2016 LTIP were as follows:
P1 component P2 component TotalCEO 100% 100% 200%EC 53.5% 53.5% 107%
The reference value for the grant size of the P1 component for the CEO as an individual and the other ECmembers as a pool may be increased or decreased by the Board by up to 25 percent. The increase or
preceding the grant, both in absolute terms and relative to a peer group comprising Alstom, Eaton,Emerson, GE, Honeywell, Legrand, Schneider and Siemens. The allocation from the pool to each
performance.The reference value of the P2 component is not subject to any adjustment.The number of shares conditionally granted under P1 and P2 to each EC member is determined bydividing the respective grant value by the average closing prices of ABB shares over the 20 trading days
n LTIP grant.
(ii) Determination of payout at vesting
To vest at the end of the three-year vesting period, the following performance conditions must be met:
For the P1 component, ABB has to achieve the threshold net income level set by the Board at thebeginning of the vesting period. The component will not vest if this threshold is not achieved and will vestat 100 percent if this threshold is met or exceeded. Therefore there is either no payout or 100 percentpayout.For the P2 component, the percentageEPS performance against an EPS objective set by the Board at the beginning of the vesting period. ThisEPS objective is based on an outside-in view, taking into account the growth expectations, risk profile,investment levels and profitability levels that are typical for the industry. This outside-in approach insetting EPS objectives for the LTIP assumes that investors expect a risk-adjusted return on theirinvestment, which is based on market value (and not book value) and translates such expected returns overa three-year period into EPS targets. The weighted cumulative EPS result is calculated as the addition ofthe EPS in the first financial year (weighted at 33 percent) plus the EPS in the second financial year(weighted at 67 percent) plus the EPS in the third financial year (weighted at 100 percent). This formulagives more weight to the EPS achieved in the later years of the vesting period. There is no payout if thelower EPS threshold is not reached and the payout is capped at 200 percent if EPS performance exceedsthe pre-defined payout cap. The payout formula is shown in Compensation Exhibit 11.

95
Compensation Exhibit 11: Payout formula for P2 (EPS performance)
The LTIP rewards participants for increasing EPS over a three-year period. The payout of the P2 componentis based
ers, both P1 and P2components are settled in shares (70 percent) and cash (30 percent), although participants can elect to receive100 percent in shares.
Key contractual provisions
Share ownership requirements
s with those of shareholders. To maintain focus on the long-termsuccess of the company, EC members are required to build up a holding of ABB shares that is equivalent to a multiple oftheir annual base salary (see Compensation Exhibit 12).
Compensation Exhibit 12: Share ownership requirements for EC membersChief Executive Officer 5 x annual base salaryOther EC members 4 x annual base salary
calculation. Vested and unvested stock options are not considered for this purpose.
The CC reviews the status of EC share ownership on an annual basis. It also reviews the required shareholdingamounts annually, based on salary and expected share price developments. As the level of the shareholding requirementis high relative to market practice, the Board has determined that members of the EC should generally aim to reach thesemultiples within five years of their appointment.
Notice period, severance provisions and non-competition clauses
Employment contracts for EC members include a notice period of 12 months, during which they are entitled totheir base salary, benefits and short-Incorporation, the contracts for EC members do not allow for any severance payment.
Non-compete agreements have been agreed with EC members for a period of 12 months after theiremployment. Compensation for such agreements, if any, may not exceed the EC memcompensation.
96
Malus and clawback
Any long-term incentive compensation awarded to members of the EC is subject to malus and clawback rules ifa plan participant has been involved in any illegal activity. This means that the Board of Directors may decide not to payany unpaid or unvested incentive compensation (malus), or may seek to recover incentive compensation that has beenpaid in the past (clawback).
Compensation awarded to Board and EC in 2016
Compensation of the Board in 2016
Board members received a total compensation of CHF 4.2 million in 2016 compared with CHF 3.68 million in2015, as presented in Compensation Exhibit 19 . The change incompensation is primarily due to the increase in the number of Board members from 8 to 11.
At the 2015 AGM, the shareholders approved a maximum aggregate compensation amount of CHF 4.5 millionfor the Board for the term of office 2015-2016. The compensation paid for that period amounts to CHF 3.73 million aspresented in Compensation Exhibit 20 in and is therefore within theapproved amount.
At the 2016 AGM, the shareholders approved a maximum aggregate compensation amount of CHF 4.7 millionfor the Board for the term of office 2016-2017. The compensation for that period amounts to CHF 4.67 million aspresented in Compensation Exhibit 20 is therefore within theapproved amount.
Compensation of the EC in 2016
As described in , thecompensation of the EC is aligned with the strategic targets of ABB's Next Level strategy set as performance objectives.
The ratio of fixed to variable compensation components in any given year depends on the performance of thecompany and of the individuals against these predefined performance objectives. In 2016, as shown in CompensationExhibit 13, the variable compensation represented 67 perc percent)and an average of 53 percent for the other EC members (previous year: 55 percent). This again illustrates the significantemphasis placed on performance-related compensation.

97
Compensation Exhibit 13: Ratios of fixed and variable compensation components of EC members in 2016
EC members received total compensation of CHF 44.2 million in 2016 compared with CHF 45.5 million in2015, as presented in Compensation Exhibit 14. The lower total compensation in 2016 is principally due to a reductionin the number of EC members from 12 to 11, partially offset by an increase in costs due to pension arrangements and anoverlap period between Pekka Tiitinen and Sami Atiya.
Compensation Exhibit 14: Total compensation of EC members (in CHF million)2016 2015
Base salaries 10.2 10.5Pension benefits 4.1 3.5Other benefits 5.2 5.3Total fixed compensation 19.5 19.3Short-term variable compensation 11.4 11.8Long-term variable compensation 13.3 14.4Total variable compensation 24.7 26.2Total compensation 44.2 45.5
For an overview of compensation by individual and component, please refer to Compensation Exhibit 21 andCompensation Exhibit 22 in .
Pension benefits increased as a result of adjustments that were decided in 2015 based on the benchmarkinganalysis conducted by Towers Watson. This review highlighted that the retirement benefits of EC members were belowthe median of 50 peer companies (part of Hay Group General Pan-European Market). As a result, the pension benefits ofcertain EC members were increased during 2016.
At the 2015 AGM, the shareholders approved a maximum aggregate compensation amount of CHF 52 millionfor the EC for the year 2016. The EC compensation for 2016 amounts to CHF 44.2 million and is therefore within theapproved amount.
Short-term variable compensation
2016 has been a solid year for ABB as highlighted in Compensation Exhibit 15. The company exceeded theGroup-wide objectives for cost savings and customer satisfaction (as measured by the use of the Net Promoter Score).On the other objectives (revenues, operational EBITA margin, operational net income and operating cash flow), the
while not achieving the set targets, was considerably above threshold. This resulted in an overallachievement of 101.8 percent for the Group component of the short-term variable compensation (previous year:101.3 percent).

98
Compensation Exhibit 15: Group-wide 2016 objectives, weighting and performance for short-term variablecompensation
For 2016, there is an 11 percentage point difference between the highest and lowest payout of the short-termvariable compensation of EC members (previous year: 16 percentage points). This reflects the performance of each ECmember against their individual objectives.
Long-term variable compensation
In 2016, the estimated value of the share-based grants to EC members under the LTIP was CHF 13.3 millioncompared with CHF 14.4 million in 2015. This difference was mainly due to the decrease in the number of EC membersfrom 12 to 11.
2015performance based on: revenue growth, cash return on invested capital, operational EBITDA margin, share pricedevelopment, share price to earnings ratio, NPS development, integrity and safety performance. This resulted in anaggregate increase of 3 percent in the reference grant size of the P1 component for EC members as a pool. Thiscompares to the 6 percent increase in 2015 versus 2014.
The payout for the performance component of the 2013 LTIP that vested in 2016 was 43 percent (previousyear: 51 percent for the 2012 LTIP). The payout was based on th -year vestingperiod.
Other compensation
Members of the EC are eligible to participate in the Employee Share Acquisition Plan (ESAP), a savings planbased on stock options, which is open to employees around the world. Seven members of the EC participated in the 13 th
annual launch of the plan in 2016. EC members who participated will, upon vesting, each be entitled to acquire up to500 ABB shares at CHF 20.12 per share, the market share price at the start of that launch.
18 Share- ourConsolidated Financial Statements.
In 2016, ABB did not pay any fees or compensation to the members of the Board or the EC for servicesrendered to ABB other than those disclosed in this report. Except as disclosed in the sections Board of DirectorsBusiness relationships between ABB and its Board and Executive Committee Business relations betweenABB and its EC sections above, ABB did not pay any additional fees or compensation in 2016 to personsclosely linked to a member of the Board or a member of the EC for services rendered to ABB.

99
Compensation of former Board and EC members
In 2016, no payment was made to any former Board member. One former EC member received contractualcompensation for the period after leaving the EC, as shown in Compensation Exhibit 21
.
Shareholdings of Board and EC members as of 31 December 2016
The members of the Board and EC owned less than 1 percent of total shares outstanding as ofDecember 31, 2016.
Compensation Exhibit 25 in shows the number of ABBshares held by each Board member as of December 31, 2016 and 2015. Except as described in this CompensationExhibit, no member of the Board and no person closely linked to a member of the Board held any shares of ABB oroptions in ABB shares.
As of December 31, 2016, members of the EC held ABB shares, conditional rights to receive shares under theLTIP, options (either vested or unvested as indicated) under the Management Incentive Plan (MIP), and unvested sharesin respect of other compensation arrangements, as shown in Compensation Exhibit 26 in
. Their holdings as of December 31, 2015, are shown in Compensation Exhibit 27 in.
Members of the EC cannot participate in the MIP. Any MIP instruments held by EC members were awarded tothem as part of the compensation they received in earlier roles they held at ABB. For a more detailed description ofMIP, please refer to 18 Share-based payment to Consolidated Financial Statementscontained in the Financial review of ABB Group section of this Annual Report.
Furthermore, as of December 31, 2016, members of the EC held conditionally granted ABB shares under theperformance component of the LTIP 2014, which at the time of vesting will be settled in cash, as shown inCompensation Exhibit 28 in . Their equivalent holdings as ofDecember 31, 2015, are shown in Compensation Exhibit 29 in .
Except as described in Compensation Exhibits 26 - 29, no member of the EC and no person closely linked to amember of the EC held any shares of ABB or options on ABB shares as of December 31, 2016 and 2015.
Outlook: changes to compensation system for 2017
In reviewing the EC compensation system and taking into account the feedback received by shareholders andother stakeholders, the Board decided to make a number of changes that will be implemented for 2017.
The successful implementation of Stage 3 of the Next Level Strategy will depend to a large extent on theleadership capabilities of our executives. Driving the culture of ownership and entrepreneurship throughout theorganization is critical, and to support this goal the Board has decided to strengthen the link between individualperformance and variable compensation. A stronger emphasis will be put on the individual performance in the short-term variable compensation as of 2017, while the LTIP will continue to depend fully on Group performance. Thecombination of Group objectives in the LTIP and of individual and Group objectives in the short-term variablecompensation provides a balance designed to generate and reward optimal performance of both the Group and theindividual EC members.
Short-term variable compensation
The short-term variable compensation will reward Group performance (between 35 and 50 percent weight) andindividual performance (between 50 and 65 percent weight) as described in Compensation Exhibit 16. The individualperformance includes regional objectives for the Region Presidents, divisional objectives for the Division Presidents andfunctional objectives for the Corporate Officers i.e., the CFO, CHRO and General Counsel.
The other parameters of the short-term variable compensation, such as the target setting and the maximumpayout factor, remain unchanged.

100
Compensation Exhibit 16: Weight of Group and individual objectives for EC membersCEO (no change) Division and region
presidentsCorporate Officers
(CFO, CHRO, GeneralCounsel)
Group objectives 80% 35% 50%Individual objectives 20% 65% (divisional/regional
and personal objectives)50% (functional and
personal objectives
Long-term variable compensation
The LTIP will continue to be built around two performance components. While P2 (cumulated EPS) remainsunchanged, P1 will be modified as follows:
The net income threshold will be replaced by a payout curve in order to remove the binary character of thepayout. A net income target will be determined, corresponding to a 100 percent payout, as well as athreshold amount below which there is no payout, and an amount above which the payout is capped at150 percent. Achievement levels between the threshold, the target and the cap will be calculated by linearinterpolations. Net incomethe three-year vesting period.To further reinforce the forward looking performance nature of the above modification, the Board will no
rformance (over the three financial years preceding thegrant) in order to determine an adjustment to the grant size pool. The Board, however, based on therecommendations of the CEO for the EC members and its own assessment of the CEO, may still vary thegrant size of individual EC members to reflect their individual performance and contributions to thecompany.
In summary, half of the fair value at grant of the LTIP will be based on the achievement of the cumulative EPStarget over the three-year vesting period and half on the achievement of the net income target measured over thethree-year vesting period.
Votes on compensation at the 2017 AGM
As illustrated in Compensation Exhibit 17, the proposals to shareholders at the 2017 AGM will relateto maximum aggregate Board compensation for the 2017-2018 term of office and maximum aggregate EC compensationfor the calendar year 2018. There will also be a non-binding vote on the 2016 Compensation report.

101
Compensation Exhibit 17: Shareholders will have three separate votes on compensation at the 2017 AGM
At the 2017 AGM there will be separate binding votes on maximum aggregate Board and EC compensation,and a non-binding vote on the 2016 Compensation report.
In determining the proposed maximum aggregate EC compensation, the Board takes into consideration thecriteria mentioned in Compensation Exhibit 18. Given the variable nature of some of the compensation components, theproposed maximum aggregate EC compensation will almost always be higher than the actual payout, as it must coverthe potential maximum value of each component of compensation.
Compensation Exhibit 18: Overview of key factors affecting the determination of maximum aggregate EC compensation
The proposal for maximum aggregate EC compensation for 2018 will incorporate assumptions for a normal increase.

102
Compensation and share ownership tables
Compensation Exhibit 19: Board compensation in 2016 and 2015
Paid in 2016 Paid in 2015
November May November May
Board term2016-2017
Board term2015-2016
Board term2015-2016
Board term2014-2015
Name
Settledin
cash(1)
Settled inshares -
number ofshares
received(2)
Settledin
cash(1)
Settled inshares -
number ofshares
received(2)
Totalcompensationpaid in 2016(3)
Settledin
cash(1)
Settled inshares -
number ofshares
received(2)
Settledin
cash(1)
Settled inshares -
number ofshares
received(2)
Totalcompensationpaid in 2015(3)
CHF CHF CHF CHF CHF CHF
Peter Voser, Chairman 2015-2016 (4) 25,960 30,618 1,200,000 32,559 600,000
Hubertus von Grünberg, Chairman 2014-2015 (5) 18,686 600,000
Jacob Wallenberg (6) 112,500 3,915 112,500 4,616 450,000 112,500 4,911 82,500 3,040 390,000
Roger Agnelli (7) 80,834 2,804 161,667 82,500 3,333 82,500 2,816 330,000
Matti Alahuhta (8) 80,000 2,784 90,000 3,693 340,000 90,000 3,929 80,000 2,947 340,000
David Constable (9) 80,000 2,784 80,000 3,282 320,000 80,000 3,229 160,000
Frederico Curado (10) 80,000 2,573 160,000
Robyn Denholm (11) 82,500 2,871 165,000
Louis R. Hughes (12) 100,000 3,480 100,000 4,103 400,000 100,000 4,365 100,000 3,455 400,000
David Meline (13) 82,500 2,871 165,000
Satish Pai (14) 82,500 2,871 165,000
Michel de Rosen (15) 87,500 3,045 87,500 3,590 350,000 87,500 3,820 87,500 3,224 350,000
Michael Treschow (16) 95,000 3,336 190,000
Ying Yeh (17) 80,000 2,616 81,666 3,145 323,333 80,000 3,281 80,000 2,765 320,000
Total 867,500 55,770 632,500 55,851 4,200,000 632,500 59,427 607,500 40,269 3,680,000
______________________________(1) Represents gross amounts paid, prior to deductions for social security, withholding tax etc.
(2) Number of shares per Board member is calculated based on net amount due after deductions for social security, withholding tax etc.(3) In addition to the Board remuneration stated in the above table, the Company paid in 2015 and 2016 CHF 461,208 and CHF 103,006, respectively, in related social security payments.
(4) Elected as new Board member and Chairman of the Board at the ABB Ltd 2015 AGM; Chairman of the Governance & Nomination Committee for the 2015-2016 and 2016-2017 board terms; elected to receive 100 percentof his gross compensation in the form of ABB shares.
(5) Chairman of ABB Ltd Board for the 2014-2015 board term; Member of the Governance & Nomination Committee for the 2014-2015 board term; did not stand for re-election at the ABB Ltd 2015 AGM; elected to
receive 100 percent of his gross compensation in the form of ABB shares for the 2014-2015 board term.(6) Vice-Chairman of the ABB Ltd Board and member of the Governance & Nomination Committee for the 2015-2016 and 2016-2017 board terms; elected to receive 50 percent of his gross compensation in the form
of ABB shares.
(7) Member of the Finance, Audit & Compliance Committee; elected to receive 50 percent of his gross compensation in the form of ABB shares; died in a tragic accident in March 2016.(8) Member of the Governance & Nomination Committee for the 2015-2016 and 2016-2017 board terms; Member of the Finance, Audit & Compliance Committee for the 2015-2016 board term; elected to receive 50 percent
of his gross compensation in the form of ABB shares.(9) Elected as new Board member at the ABB Ltd 2015 AGM; Member of the Compensation Committee for the 2015-2016 and 2016-2017 board terms; elected to receive 50 percent of his gross compensation in the form
of ABB shares.
(10) Elected as new Board member at the ABB Ltd 2016 AGM; Member of the Compensation Committee; elected to receive 50 percent of his gross compensation in the form of ABB shares.(11) Elected as new Board member at the ABB Ltd 2016 AGM; Member of the Finance, Audit & Compliance Committee; elected to receive 50 percent of her gross compensation in the form of ABB shares.(12) Chairman of the Finance, Audit & Compliance Committee; elected to receive 50 percent of his gross compensation in the form of ABB shares.
(13) Elected as new Board member at the ABB Ltd 2016 AGM; Member of the Finance, Audit & Compliance Committee; elected to receive 50 percent of his gross compensation in the form of ABB shares.(14) Elected as new Board member at the ABB Ltd 2016 AGM; Member of the Finance, Audit & Compliance Committee; elected to receive 50 percent of his gross compensation in the form of ABB shares.
(15) Chairman of the Compensation Committee; elected to receive 50 percent of his gross compensation in the form of ABB shares.(16) Chairman of the Governance & Nomination Committee and Member of the Compensation Committee until the ABB Ltd 2015 AGM; did not stand for re-election at the ABB Ltd 2015 AGM; elected to receive 50 percent
of his gross compensation in the form of ABB shares for the 2014-2015 board term.
(17) Member of the Compensation Committee; Member of the Finance, Audit and Compliance Committee for the last month of the 2015-2016 board term; elected to receive 50 percent of her gross compensation in the formof ABB shares.
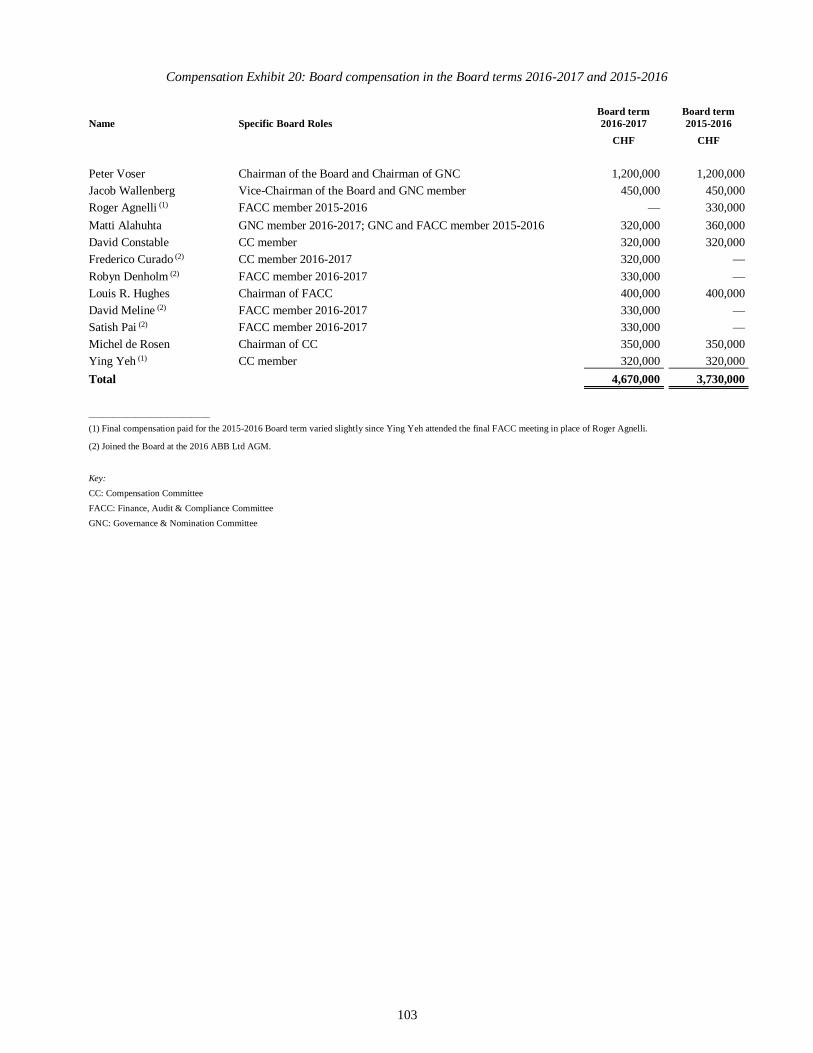
103
Compensation Exhibit 20: Board compensation in the Board terms 2016-2017 and 2015-2016
Name Specific Board RolesBoard term2016-2017
Board term2015-2016
CHF CHF
Peter Voser Chairman of the Board and Chairman of GNC 1,200,000 1,200,000Jacob Wallenberg Vice-Chairman of the Board and GNC member 450,000 450,000Roger Agnelli (1) FACC member 2015-2016 330,000Matti Alahuhta GNC member 2016-2017; GNC and FACC member 2015-2016 320,000 360,000David Constable CC member 320,000 320,000Frederico Curado (2) CC member 2016-2017 320,000Robyn Denholm (2) FACC member 2016-2017 330,000Louis R. Hughes Chairman of FACC 400,000 400,000David Meline (2) FACC member 2016-2017 330,000Satish Pai (2) FACC member 2016-2017 330,000Michel de Rosen Chairman of CC 350,000 350,000Ying Yeh (1) CC member 320,000 320,000Total 4,670,000 3,730,000
__________________________(1) Final compensation paid for the 2015-2016 Board term varied slightly since Ying Yeh attended the final FACC meeting in place of Roger Agnelli.
(2) Joined the Board at the 2016 ABB Ltd AGM.
Key:CC: Compensation CommitteeFACC: Finance, Audit & Compliance CommitteeGNC: Governance & Nomination Committee

104
Compensation Exhibit 21: EC compensation in 2016
Name Base salary
Short-termvariable
compensation(1) Pension benefitsOther
benefits(2)
2016Total
cash-basedcompensation(3)
Estimated valueof share-based
grants under theLTIP in 2016(4)
2016Total (incl.
conditional share-based grants)(5)
CHF CHF CHF CHF CHF CHF CHF
Ulrich Spiesshofer (6) 1,641,669 2,583,900 613,799 791,109 5,630,477 3,654,137 9,284,614Eric Elzvik 850,007 827,050 274,835 332,831 2,284,723 843,920 3,128,643Jean-Christophe Deslarzes (7) 911,677 971,520 261,986 572,775 2,717,958 1,169,063 3,887,021Diane de Saint Victor (8) 1,000,001 1,062,000 295,325 300,410 2,657,736 992,853 3,650,589Frank Duggan (9) 686,042 715,540 342,359 613,772 2,357,713 997,526 3,355,239Greg Scheu (10) 837,507 791,840 248,397 128,055 2,005,799 896,680 2,902,479Sami Atiya (EC member
as of June 14, 2016) (6) 387,122 373,858 213,242 292,415 1,266,637 745,453 2,012,090Tarak Mehta (6) 852,672 876,340 461,050 550,482 2,740,544 948,223 3,688,767Bernhard Jucker (6) 1,015,008 1,099,560 549,075 511,451 3,175,094 1,124,633 4,299,727Claudio Facchin (6) 770,837 771,540 442,172 507,909 2,492,458 991,170 3,483,628Peter Terwiesch 729,175 748,965 243,558 179,954 1,901,652 933,992 2,835,644Pekka Tiitinen (EC member
until September 30, 2016) 543,759 543,750 179,184 405,585 1,672,278 1,672,278Total Executive Committee
members 10,225,476 11,365,863 4,124,982 5,186,748 30,903,069 13,297,650 44,200,719
______________________________(1) Represents accrued short-term variable compensation for the year 2016 for all EC members, which will be paid in 2017, after the publication of ABB's financial results. Short-term variable compensation
is linked to the objectives defined in each EC member's scorecard. Upon full achievement of these objectives, the short-term variable compensation of the CEO corresponds to 150 percent of his base salary,
while for each other EC member it represents 100 percent of their respective base salary.(2) Other benefits comprise payments related to social security, health insurance, children's education, transportation, tax advice and certain other items.(3) Prepared on an accruals basis.
(4) On the day of vesting (June 6, 2019), the value of the share-based awards granted under the LTIP may vary from the above amounts due to changes in ABB's share price and the outcome of the performanceparameters. The LTIP is also subject to service conditions. The estimated values have been calculated using the market value of the ABB share on the day of grant and the Monte Carlo simulation model.
(5) In addition to the total compensation of current EC members, Veli-Matti Reinikkala received CHF 2,055,537 representing contractual obligations of ABB for the period January - September 2016. Payments totalingCHF 11,535 were made in 2016 on behalf of certain other former EC members for tax advice.
(6) The increase in pension benefits is the result of a review of the EC's pension arrangements during 2015.
(7) Other benefits of Jean-Christophe Deslarzes in 2016 went up primarily due to payment of social security premiums related to the vesting in November 2016 of the first tranche of his one-time replacement share grant.(8) Other benefits of Diane de Saint Victor in 2015 compared to 2016 were significantly higher because they included social security premiums related to the vesting on December 31, 2015 of her one-time special
share grant.
(9) Frank Duggan received 20 percent of his base salary in AED and 80 percent in EUR. The company purchased EUR with AED to meet this obligation.(10) Greg Scheu received 100 percent of his base salary in USD. All USD amounts were converted into Swiss francs using a rate of CHF 1.02135 per USD. Other benefits of Greg Scheu in 2015 were substantially
higher compared to 2016 because they also contained social security and pension premium payments related to 2014.

105
Compensation Exhibit 22: EC compensation in 2015
Name Base salary
Short-termvariable
compensation(1) Pension benefitsOther
benefits(2)
2015Total
cash-basedcompensation(3)
Estimated valueof share-based
grants under theLTIP in 2015(4)
2015Total (incl.
conditional share-based grants)(5)
CHF CHF CHF CHF CHF CHF CHF
Ulrich Spiesshofer (6) 1,600,004 2,544,000 408,448 780,735 5,333,187 3,765,554 9,098,741Eric Elzvik 850,007 856,800 270,335 349,021 2,326,163 974,264 3,300,427Jean-Christophe Deslarzes 866,669 995,280 257,319 377,786 2,497,054 1,122,174 3,619,228Diane de Saint Victor 1,000,001 1,002,000 293,177 674,074 2,969,252 1,005,044 3,974,296Frank Duggan (7) 664,632 708,890 336,122 591,990 2,301,634 1,012,539 3,314,173Greg Scheu (8) 808,012 823,352 360,922 598,259 2,590,545 1,001,756 3,592,301Pekka Tiitinen 720,844 720,650 234,266 218,550 1,894,310 935,163 2,829,473Tarak Mehta 813,345 831,504 242,003 446,628 2,333,480 935,304 3,268,784Veli-Matti Reinikkala 782,507 787,355 281,522 338,704 2,190,088 788,953 2,979,041Bernhard Jucker 986,505 1,056,330 295,325 392,338 2,730,498 1,134,740 3,865,238Claudio Facchin 720,844 783,725 243,266 336,543 2,084,378 935,163 3,019,541Peter Terwiesch 700,001 692,300 238,037 227,994 1,858,332 802,333 2,660,665Total Executive Committee
members 10,513,371 11,802,186 3,460,742 5,332,622 31,108,921 14,412,987 45,521,908
______________________________(1) Represents accrued short-term variable compensation for the year 2015 for all EC members, which will be paid in 2016, after the publication of ABB's financial results. Short-term variable compensation
is linked to predefined Group-wide and individual performance objectives defined in the ABB scorecard. Upon full achievement of these objectives, the short -term variable compensation of the CEO corresponds
to 150 percent of his base salary, while for all other EC members it represents 100 percent of their respective base salary.(2) Other benefits may include payments related to social security, health insurance, children's education, transportation, tax advice and certain other items.(3) Prepared on an accruals basis.
(4) On the day of vesting (June 5, 2018), the value of the share-based awards granted under the LTIP may vary from the above amounts due to changes in ABB's share price and the outcome of the performanceparameters. The LTIP is also subject to service conditions. The estimated values have been calculated using the market value of the ABB share on the day of grant and additionally, in the
case of the performance component P2 of the LTIP, the Monte Carlo simulation model.(5) In addition to the total compensation of current EC members, payments totaling CHF 8,169 were made in 2015 on behalf of certain former EC members for tax advice.(6) The increase in pension benefits is the result of a review of the CEO's pension arrangements during the second half of 2015.
(7) Frank Duggan received 20 percent of his base salary in AED and 80 percent in EUR. The company purchased EUR with AED to meet this obligation. The variance in base salary between 2014 and 2015primarily relates to exchange rate movements between EUR and AED.
(8) Greg Scheu received 100 percent of his base salary in USD. All USD amounts were converted into Swiss francs using a rate of CHF 0.9892 per USD. The pension benefits in 2015 are higher than 2014
as they represent contributions made in 2015 for both 2015 and 2014. Other benefits include CHF 269,000 of social security co ntributions in respect of 2014.

106
Compensation Exhibit 23: LTIP grants in 2016
Name
Reference numberof shares under the
performancecomponent P1 of the
2016 launchof the LTIP (1)
Total estimatedvalue of share-based
grants under theperformance
component P1 of the2016 launch of the
LTIP (1),(2),(4)
Reference numberof shares under the
performancecomponent P2 of the
2016 launchof the LTIP (1)
Total estimatedvalue of share-based
grants under theperformance
component P2 of the2016 launch of the
LTIP (1),(3),(4)
Total number ofshares grantedunder the 2016
launchof the LTIP (1)
Total estimatedvalue of share-based
grants under theLTIP in 2016 (2),(3),(4)
CHF CHF CHF
Ulrich Spiesshofer (5) 94,076 1,945,492 81,805 1,708,645 175,881 3,654,137
Eric Elzvik 18,037 373,006 22,546 470,914 40,583 843,920
Jean-Christophe Deslarzes (5) 31,884 659,362 24,403 509,701 56,287 1,169,063
Diane de Saint Victor (5) 21,220 438,830 26,525 554,023 47,745 992,853
Frank Duggan (5) 27,206 562,621 20,822 434,905 48,028 997,526
Greg Scheu 21,572 446,109 21,572 450,571 43,144 896,680
Sami Atiya (EC member
as of June 14, 2016) 19,125 376,380 18,568 369,073 37,693 745,453
Tarak Mehta (5) 22,812 471,753 22,812 476,470 45,624 948,223
Bernhard Jucker (5) 27,056 559,519 27,056 565,114 54,112 1,124,633
Claudio Facchin 27,032 559,022 20,690 432,148 47,722 991,170
Peter Terwiesch (5) 25,473 526,782 19,496 407,210 44,969 933,992
Total Executive Committee
members as of Dec. 31, 2016 335,493 6,918,876 306,295 6,378,774 641,788 13,297,650
__________________(1) Vesting date June 6, 2019.(2) The estimated value of the shares of the P1 component represents the fair value of the ABB shares on the grant date of the award multiplied by the respective number of reference shares.(3) The reference number of shares of the performance component P2 are valued using the fair value of the ABB shares on the grant date and the Monte Carlo simulation model.(4) The LTIP foresees delivering 70 percent of the value of vested performance shares (both performance components P1 and P2), if any, in shares and the remainder in cash. However, upon
vesting participants have the possibility to elect to receive 100 percent of the vested award in shares. The plan foresees a maximum payout of 200 percent of the number of reference shares grantedunder the P2 component, based on the weighted cumulative EPS performance against predefined objectives.
(5) In addition to the above awards, seven members of the EC participated in the 13th launch of the ESAP in 2016, which will allow them to save over a 12-month period and, inNovember 2017, use their savings to acquire ABB shares under the ESAP. Each EC members who participated in ESAP will be entitled to acquire up to 500 ABB shares at anexercise price of CHF 20.12 per share.

107
Compensation Exhibit 24: LTIP grants in 2015
Name
Reference numberof shares under the
performancecomponent P1 of the
2015 launchof the LTIP (1)
Total estimatedvalue of share-based
grants under theperformance
component P1 of the2015 launch of the
LTIP (1), (2), (4)
Reference numberof shares under the
performancecomponent P2 of the
2015 launchof the LTIP (1)
Total estimatedvalue of share-based
grants under theperformance
component P2 of the2015 launch of the
LTIP (1), (3), (4)
Total number ofshares grantedunder the 2015
launchof the LTIP (1), (4)
Total estimatedvalue of share-based
grants under theLTIP in 2015 (2), (3)
CHF CHF CHF
Ulrich Spiesshofer (5) 94,072 2,026,311 78,393 1,739,243 172,465 3,765,554
Eric Elzvik (5) 22,281 479,933 22,281 494,331 44,562 974,264
Jean-Christophe Deslarzes (5) 28,608 616,217 22,805 505,957 51,413 1,122,174
Diane de Saint Victor (5) 19,660 423,477 26,213 581,567 45,873 1,005,044
Frank Duggan 25,813 556,013 20,577 456,526 46,390 1,012,539
Greg Scheu 25,538 550,089 20,358 451,667 45,896 1,001,756
Pekka Tiitinen (5) 23,840 513,514 19,005 421,649 42,845 935,163
Tarak Mehta (5) 21,390 460,741 21,390 474,563 42,780 935,304
Veli-Matti Reinikkala 15,433 332,427 20,577 456,526 36,010 788,953
Bernhard Jucker (5) 25,951 558,985 25,951 575,755 51,902 1,134,740
Claudio Facchin 23,840 513,514 19,005 421,649 42,845 935,163
Peter Terwiesch 18,349 395,238 18,349 407,095 36,698 802,333
Total Executive Committee
members as of Dec. 31, 2015 344,775 7,426,459 314,904 6,986,528 659,679 14,412,987
__________________(1) Vesting date June 5, 2018.(2) The estimated value of the shares of the P1 component represents the market value of the ABB share on the grant date of the award multiplied by the respective number of
reference shares.(3) The shares of the performance component P2 are valued using the market value of the ABB share on the grant date of the award and the Monte Carlo simulation model.(4) The LTIP foresees delivering 30 percent of the value of vested shares (both performance components P1 and P2), if any, in cash. However, upon vesting participants have the
possibility to elect to receive 100 percent of the vested award in shares. The plan foresees a maximum payout of 200 percent of the number of reference shares granted under theP2 component, based on the weighted cumulative EPS performance against predefined objectives.
(5) In addition to the above awards, seven members of the EC participated in the 12th launch of the ESAP in 2015, which will allow them to save over a 12-month period and, inNovember 2016, use their savings to acquire ABB shares under the ESAP. Each EC member who participated in ESAP will be entitled to acquire up to 530 ABB shares at anexercise price of CHF 18.78 per share.

108
Compensation Exhibit 25: Board ownership of ABB shares
Total number of shares held
Name December 31, 2016 December 31, 2015
Peter Voser (1) 102,137 45,559Jacob Wallenberg (2) 202,190 193,659Roger Agnelli 176,820Matti Alahuhta 31,265 24,788David Constable 9,295 3,229Frederico Curado (3) 2,573Robyn Denholm (3) 2,871Louis R. Hughes 53,145 80,562David Meline (3)(4) 6,021Satish Pai (3) 2,871Michel de Rosen 79,443 146,646Ying Yeh 30,518 25,016Total 522,329 696,279_____________________(1) Includes 2,000 shares held by spouse.(2) Does not include shares beneficially owned by Investor AB, of which Mr. Wallenberg is Chairman.(3) First elected to the Board at the ABB Ltd AGM in 2016.(4) Includes 3,150 shares held by spouse.
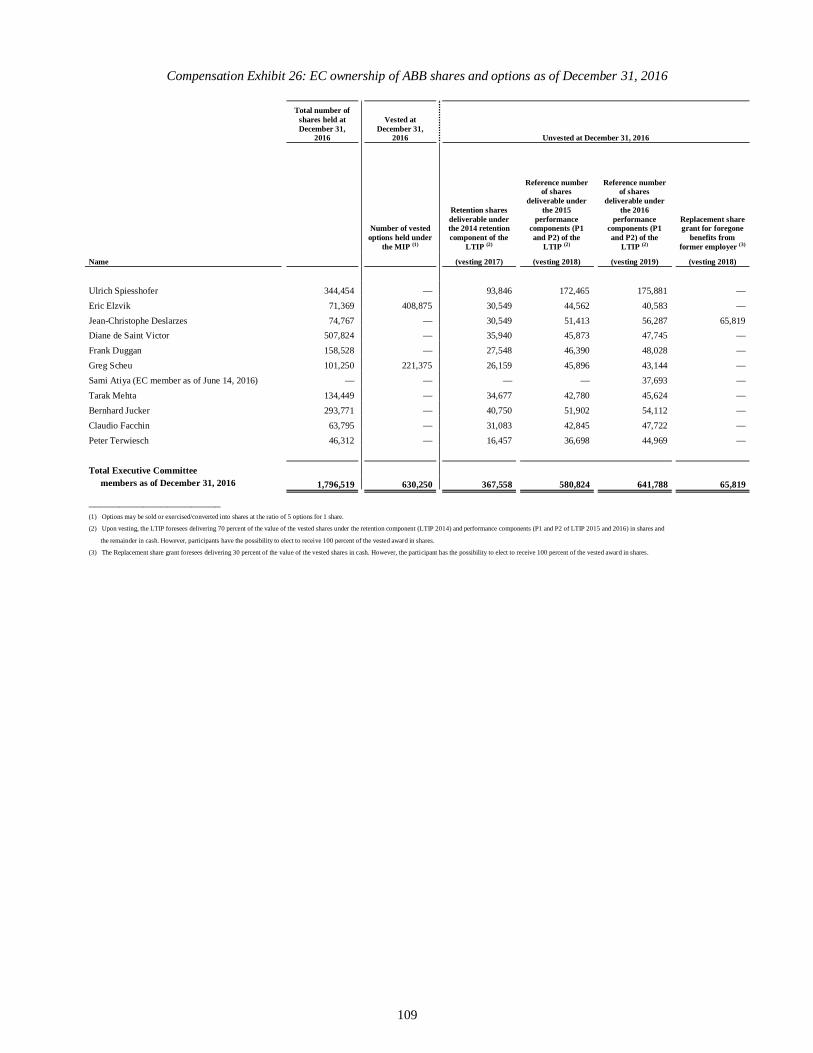
109
Compensation Exhibit 26: EC ownership of ABB shares and options as of December 31, 2016
Total number ofshares held atDecember 31,
2016
Vested atDecember 31,
2016 Unvested at December 31, 2016
Number of vestedoptions held under
the MIP (1)
Retention sharesdeliverable underthe 2014 retentioncomponent of the
LTIP (2)
Reference numberof shares
deliverable underthe 2015
performancecomponents (P1and P2) of the
LTIP (2)
Reference numberof shares
deliverable underthe 2016
performancecomponents (P1and P2) of the
LTIP (2)
Replacement sharegrant for foregone
benefits fromformer employer (3)
Name (vesting 2017) (vesting 2018) (vesting 2019) (vesting 2018)
Ulrich Spiesshofer 344,454 93,846 172,465 175,881Eric Elzvik 71,369 408,875 30,549 44,562 40,583Jean-Christophe Deslarzes 74,767 30,549 51,413 56,287 65,819Diane de Saint Victor 507,824 35,940 45,873 47,745Frank Duggan 158,528 27,548 46,390 48,028Greg Scheu 101,250 221,375 26,159 45,896 43,144Sami Atiya (EC member as of June 14, 2016) 37,693Tarak Mehta 134,449 34,677 42,780 45,624Bernhard Jucker 293,771 40,750 51,902 54,112Claudio Facchin 63,795 31,083 42,845 47,722Peter Terwiesch 46,312 16,457 36,698 44,969
Total Executive Committeemembers as of December 31, 2016 1,796,519 630,250 367,558 580,824 641,788 65,819
______________________(1) Options may be sold or exercised/converted into shares at the ratio of 5 options for 1 share.
(2) Upon vesting, the LTIP foresees delivering 70 percent of the value of the vested shares under the retention component (LTIP 2014) and performance components (P1 and P2 of LTIP 2015 and 2016) in shares and
the remainder in cash. However, participants have the possibility to elect to receive 100 percent of the vested award in shares.
(3) The Replacement share grant foresees delivering 30 percent of the value of the vested shares in cash. However, the participant has the possibility to elect to receive 100 percent of the vested award in shares.

110
Compensation Exhibit 27: EC ownership of ABB shares and options as of December 31, 2015
Total number ofshares held
Vested atDecember 31, 2015 Unvested at December 31, 2015
Number of vestedoptions held under
the MIP (1)
Retention sharesdeliverable underthe 2013 retentioncomponent of the
LTIP (2)
Retention sharesdeliverable underthe 2014 retentioncomponent of the
LTIP (2)
Reference numberof shares
deliverable underthe 2015
performancecomponents (P1and P2) of the
LTIP (2)
Replacement sharegrant for foregone
benefits fromformer employer (3)
Name (vesting 2016) (vesting 2017) (vesting 2018)(vesting 2016 and
2018)
Ulrich Spiesshofer 289,048 78,395 93,846 172,465Eric Elzvik 23,768 710,125 27,071 30,549 44,562Jean-Christophe Deslarzes 27,071 30,549 51,413 144,802Diane de Saint Victor 475,446 31,848 35,940 45,873Frank Duggan 132,896 25,632 27,548 46,390Greg Scheu 83,901 221,375 24,830 26,159 45,896Pekka Tiitinen 21,000 221,375 22,294 25,158 42,845Tarak Mehta 115,977 25,632 34,677 42,780Veli-Matti Reinikkala 202,175 9,810 27,674 36,010Bernhard Jucker 267,848 37,033 40,750 51,902Claudio Facchin 41,501 22,294 31,083 42,845Peter Terwiesch 30,393 250,000 15,919 16,457 36,698
Total Executive Committee members
as of December 31, 2015 1,683,953 1,402,875 347,829 420,390 659,679 144,802
______________________(1) Options may be sold or exercised/converted into shares at the ratio of 5 options for 1 share.
(2) Upon vesting, the LTIP foresees delivering 30 percent of the value of the vested shares under the retention component (LTIP 2013 and 2014) and performance components (P1 and P2 of LTIP 2015) in cash. However,
participants have the possibility to elect to receive 100 percent of the vested award in shares.
(3) The Replacement share grant foresees delivering 30 percent of the value of the vested shares in cash. However, the participant has the possibility to elect to receive 100 percent of the vested award in shares.
Compensation Exhibit 28: EC ownership of WARs and conditionally granted ABB shares (all cash-settled)as of December 31, 2016
Vested atDecember 31, 2016
Unvested atDecember 31, 2016
Number of fully vested WARsheld under the MIP
Reference number of shares underthe performance component of the
2014 launch of the LTIP
Name (vesting 2017)
Ulrich Spiesshofer 51,489Eric Elzvik 17,147Jean-Christophe Deslarzes 17,147Diane de Saint Victor 20,173Frank Duggan 15,463Greg Scheu 14,684Sami Atiya (EC member as of June 14, 2016)Tarak Mehta 16,139Bernhard Jucker 19,548Claudio Facchin 14,122Peter Terwiesch 10,292
Total Executive Committee members as of December 31, 2016 196,204

111
Compensation Exhibit 29: EC ownership of WARs and conditionally granted ABB shares (all cash-settled)as of December 31, 2015
Vested atDecember 31, 2015 Unvested at December 31, 2015
Number of fullyvested WARs held
under the MIP
Reference number ofshares under the
performancecomponent of the2013 launch of the
LTIP
Reference number ofshares under the
performancecomponent of the2014 launch of the
LTIPName (vesting 2016) (vesting 2017)
Ulrich Spiesshofer 50,024 51,489Eric Elzvik 16,659 17,147Jean-Christophe Deslarzes 16,659 17,147Diane de Saint Victor 19,599 20,173Frank Duggan 15,023 15,463Greg Scheu 14,553 14,684Pekka Tiitinen 13,720 14,122Tarak Mehta 15,023 16,139Veli-Matti Reinikkala 15,091 15,534Bernhard Jucker 18,992 19,548Claudio Facchin 287,500 13,720 14,122Peter Terwiesch 10,007 10,292Total Executive Committee members as of December 31, 2015 287,500 219,070 225,860
EMPLOYEES
A breakdown of our employees by geographic region is as follows:
December 31,2016 2015 2014
Europe 61,400 61,600 63,000The Americas 29,000 30,900 32,200Asia, Middle East and Africa 41,900 43,300 45,200Total 132,300 135,800 140,400
The proportion of our employees that are represented by labor unions or are the subject of collective bargainingagreements varies based on the labor practices of each country in which we operate.
Item 7. Major Shareholders and Related Party Transactions
MAJOR SHAREHOLDERS
At December 31, 2016, we had approximately 340,000 shareholders. Approximately 110,000 were U.S.holders, of which approximately 520 were record holders. Based on the share register, U.S. holders (including holders ofADSs) held approximately 8 percent of the total share capital and voting rights as registered in the Commercial Registeron that date.
For information on major shareholders see Item 6. Directors, Senior Management and EmployeesShareholders Significant shareholders .

112
RELATED PARTY TRANSACTIONS
Affiliates and associates
In the normal course of our business, we purchase products from, sell products to and engage in othertransactions with entities in which we hold an equity interest. The amounts involved in these transactions are notmaterial to ABB Ltd. Also, in the normal course of our business, we engage in transactions with businesses that we havedivested. We believe that the terms of the transactions we conduct with these companies are negotiated on an arm slength basis.
Key management personnel
For information on important business relationships between ABB and its Board and EC members, orcompanies and organizations represented by them, see Item 6. Directors, Senior Management and Employees sectionsentitled of Directors Board of Directors Business Relationships between ABB and its Board and
Committee Business Relationships between ABB and its EC members .
Item 8. Financial Information
CONSOLIDATED STATEMENTS AND OTHER FINANCIAL INFORMATION
See Item 18. Financial Statements
LEGAL PROCEEDINGS
Antitrust
In April 2014, the European Commission announced its decision regarding its investigation of anticompetitivepractices in the cables industry and granted ABB full immunity from fines under the European leniencyprogram. In December 2013, we agreed with the Brazilian Antitrust Authority (CADE) to settle its ongoing investigationinto our involvement in anticompetitive practices in the cables industry and we agreed to pay a fine of approximately1.5 million Brazilian reals (equivalent to approximately $1 million on date of payment).
In Brazil, our Gas Insulated Switchgear business is under investigation by the CADE for allegedanticompetitive practices. In addition, the CADE has opened an investigation into certain other power businesses ofABB, including flexible alternating current transmission systems (FACTS) and power transformers. With respect tothose aforementioned matters which are still ongoing, management is cooperating fully with the antitrust authorities. Aninformed judgment about the outcome of these investigations or the amount of potential loss or range of loss for ABB, ifany, relating to these investigations cannot be made at this stage.
Suspect payments
As a result of an internal investigation, ABB self-reported to the Securities and Exchange Commission (SEC)and the Department of Justice (DoJ) in the United States as well as to the Serious Fraud Office (SFO) in the UnitedKingdom concerning certain of its past dealings with Unaoil and its subsidiaries, including alleged improper paymentsmade by these entities to third parties. The SFO has commenced an investigation into this matter. We are cooperatingfully with the authorities. At this time, it is not possible for us to make an informed judgment about the outcome of thesematters.
General
In addition, we are aware of proceedings, or the threat of proceedings, against us and others in respect ofprivate claims by customers and other third parties with regard to certain actual or alleged anticompetitive practices.Also, we are subject to other various legal proceedings, investigations, and claims that have not yet been resolved. Withrespect to the above-mentioned regulatory matters and commercial litigation contingencies, we will bear the costs of thecontinuing investigations and any related legal proceedings.

113
Liabilities recognized
At December 31, 2016 and 2015, we had aggregate liabilities of $150 million and $160 million, respectively,included in and non-current for the above regulatory, compliance and legalcontingencies, and none of the individual liabilities recognized was significant. As it is not possible to make an informedjudgment on the outcome of certain matters and as it is not possible, based on information currently available tomanagement, to estimate the maximum potential liability on other matters, there could be material adverse outcomesbeyond the amounts accrued.
DIVIDENDS AND DIVIDEND POLICY
See Item 3. Key Information Dividends and Dividend Policy and Item 6. Directors, Senior Managementand Employees Shareholders Shareholders rights Shareholders dividend rights .
SIGNIFICANT CHANGES
Except as otherwise described in this Annual Report, there has been no significant change in our financialposition since December 31, 2016.
Item 9. The Offer and Listing
MARKETS
The shares of ABB Ltd are principally traded on the SIX Swiss Exchange (under the symbol ABBN ) and onthe NASDAQ OMX Stockholm Exchange (under the symbol ABB ). ADSs of ABB Ltd have been traded on the NewYork Stock Exchange under the symbol ABB since April 6, 2001. ABB Ltd s ADSs are issued under the Amendedand Restated Deposit Agreement, dated May 7, 2001, with Citibank, N.A. as depositary. Each ADS represents oneshare.

114
TRADING HISTORY
No suspension in the trading of our shares occurred in the years ended December 31, 2016, 2015 and 2014.
The table below sets forth, for the periods indicated, the reported high and low closing prices for the shares onthe SIX Swiss Exchange and the NASDAQ OMX Stockholm Exchange and for the ADSs on the New York StockExchange.
NASDAQ OMXSIX Swiss Stockholm New YorkExchange Exchange Stock Exchange
High Low High Low High Low(CHF) (SEK) ($)
Annual highs and lows2012 20.12 14.83 146.70 109.00 21.91 15.422013 23.53 19.20 172.30 133.50 26.56 20.872014 24.75 19.16 175.70 145.70 27.09 20.372015 21.77 16.72 192.70 144.50 23.14 17.142016 22.49 16.04 199.00 137.10 22.88 16.06Quarterly highs and lows2015
First quarter 20.91 16.83 185.00 155.60 21.64 19.14Second quarter 21.77 19.58 192.70 173.70 23.14 20.88Third quarter 20.40 16.72 180.40 144.50 20.88 17.14Fourth quarter 19.51 17.10 166.40 146.70 19.15 17.48
2016First quarter 18.89 16.04 160.50 137.10 19.58 16.06Second quarter 20.96 18.22 177.30 155.40 21.62 18.98Third quarter 22.12 18.71 194.90 163.50 22.81 18.90Fourth quarter 22.49 19.91 199.00 182.60 22.88 20.38
Monthly highs and lows2016
September 22.12 21.24 194.90 185.30 22.81 21.95October 22.49 20.40 199.00 185.90 22.88 20.53November 21.12 19.91 193.80 182.60 21.38 20.38December 21.79 20.84 197.60 189.50 21.28 20.59
2017January 23.75 21.73 210.40 192.40 23.83 21.28February 23.48 22.53 207.60 200.30 23.75 22.50
Item 10. Additional Information
DESCRIPTION OF SHARE CAPITAL AND ARTICLES OF INCORPORATION
This section summarizes the material provisions of ABB Ltd s Articles of Incorporation and the Swiss Code ofObligations relating to the shares of ABB Ltd. The description is only a summary and is qualified in its entirety byABB Ltd s Articles of Incorporation, a copy of which has been filed as Exhibit 1.1 to this Annual Report, ABB Ltd sfilings with the commercial register of the Canton of Zurich (Switzerland) and Swiss statutory law.
Registration and Business Purpose
ABB Ltd was registered as a corporation (Aktiengesellschaft) in the commercial register of the Canton ofZurich (Switzerland) on March 5, 1999, under the name of New ABB Ltd and its name was subsequently changed toABB Ltd . Its commercial register number is CHE-101.049.653.
115
ABB Ltd s purpose, as set forth in Article 2 of its Articles of Incorporation, is to hold interests in businessenterprises, particularly in enterprises active in the areas of industry, trade and services. It may acquire, encumber,exploit or sell real estate and intellectual property rights in Switzerland and abroad and may also finance othercompanies. It may engage in all types of transactions and may take all measures that appear appropriate to promote, orthat are related to, its purpose.
Our Shares
ABB Ltd s shares are registered shares (Namenaktien) with a par value of CHF 0.12 each. The shares are fullypaid and non-assessable. The shares rank pari passu in all respects with each other, including in respect of entitlementsto dividends, to a share of the liquidation proceeds in the case of a liquidation of ABB Ltd, to advance subscriptionrights and to pre-emptive rights.
Each share carries one vote in ABB Ltd s general shareholders meeting. Voting rights may be exercised onlyafter a shareholder has been recorded in ABB Ltd s share register (Aktienbuch) as a shareholder with voting rights, orwith Euroclear Sweden AB in Sweden, which maintains a subregister of ABB Ltd s share register. Euroclear SwedenAB is an authorized central securities depository under the Swedish Act on Registration of Financial Instruments andcarries out, among other things, the duties of registrar for Swedish companies listed on the NASDAQ OMX StockholmExchange. Registration with voting rights is subject to the restrictions described in Transfer of Shares .
The shares are not issued in certificated form and are held in collective custody at SIX SIS AG. Shareholdersdo not have the right to request printing and delivery of share certificates (aufgehobener Titeldruck), but may at any timerequest ABB Ltd to issue a confirmation of the number of registered shares held.
Capital Structure
For a description of ABB Ltd s capital structure (including issued shares, contingent share capital andauthorized share capital) and its dividend policy, see Item 6. Directors, Senior Management and Employeesand Item 3. Key Information Dividends and Dividend Policy .
Transfer of Shares
The transfer of shares is effected by corresponding entry in the books of a bank or depository institution. Anacquirer of shares must file a share registration form in order to be registered in ABB Ltd s share register as ashareholder with voting rights. Failing such registration, the acquirer will not be able to participate in or vote atshareholders meetings, but will be entitled to dividends, pre-emptive and advanced subscription rights, and liquidationproceeds.
An acquirer of shares will be recorded in ABB Ltd s share register with voting rights upon disclosure of itsname and address. However, ABB Ltd may decline a registration with voting rights if the shareholder does not declarethat it has acquired the shares in its own name and for its own account. If the shareholder refuses to make suchdeclaration, it will be registered as a shareholder without voting rights. A person failing to declare in its registrationapplication that it holds shares for its own account (a nominee), will be entered in the share register with voting rights,provided that such nominee has entered into an agreement with ABB concerning its status, and further provided that thenominee is subject to recognized bank or financial market supervision.
After having given the registered shareholder or nominee the right to be heard, the Board of Directors maycancel registrations in the share register retroactive to the date of registration if such registrations were made on the basisof incorrect information. The relevant shareholder or nominee will be informed promptly as to the cancellation. TheBoard of Directors will oversee the details and issue the instructions necessary for compliance with the precedingregulations. In special cases, it may grant exemptions from the rule concerning nominees.
Acquirers of registered shares who have chosen to have their shares registered in the share register withEuroclear Sweden AB are not requested to file a share registration form or declare that they have acquired the shares intheir own name and for their own account in order to be registered as a shareholder with voting rights. However, in orderto be entitled to vote at a shareholders meeting those acquirers need to be entered in the Euroclear Sweden AB shareregister in their own name no later than six business days prior to the shareholders meeting. Uncertificated sharesregistered with Euroclear Sweden AB may be pledged in accordance with Swedish law.

116
Except as described in this subsection, neither the Swiss Code of Obligations nor ABB Ltd s Articles ofIncorporation limit any right to own ABB Ltd s shares, or any rights of non-resident or foreign shareholders to exercisevoting rights of ABB Ltd s shares.
Shareholders Meetings
Under Swiss law, the annual general meeting of shareholders must be held within six months after the end ofABB Ltd s fiscal year. Annual general meetings of shareholders are convened by the board of directors, liquidators orrepresentatives of bondholders or, if necessary, by the statutory auditors. The board of directors is further required toconvene an extraordinary general meeting of shareholders if so resolved by the shareholders in a general meeting ofshareholders or if so requested by one or more shareholders holding in aggregate at least 10 percent of ABB Ltd s sharecapital. A general meeting of shareholders is convened by publishing a notice in the Swiss Official Gazette ofCommerce (Schweizerisches Handelsamtsblatt) at least 20 days prior to the meeting date. Holders of shares registeredwith Euroclear Sweden AB are able to attend shareholders meetings in respect of such shares. Notices of shareholdersmeetings are published in at least three national Swedish daily newspapers, as well as on ABB s Web site. Such noticescontain information as to procedures to be followed by shareholders in order to participate and exercise voting rights atthe shareholders meetings.
One or more shareholders whose combined holdings represent an aggregate par value of at least CHF 48,000may require, in the form of a written request, 40 calendar days prior to a general meeting of shareholders that specificitems and proposals be included on the agenda and voted on at the next general meeting of shareholders.
The following powers are vested exclusively in the general meeting of the shareholders:
adoption and amendment of the Articles of Incorporation,
election of members of the Board of Directors, the Chairman of the Board, the members of theCompensation Committee, the auditors and the independent proxy,
approval of the annual management report and the consolidated financial statements,
approval of the annual financial statements and decision on the allocation of profits shown on the balancesheet, in particular with regard to dividends,
approval of the compensation of the Board of Directors and of the Executive Committee pursuant toABB Ltd s Articles of Incorporation,
granting discharge to the members of the Board of Directors and the persons entrusted with management,and
passing resolutions as to all matters reserved to the authority of the shareholders meeting by law or underABB Ltd s Articles of Incorporation or that are submitted to the shareholders meeting by the Board ofDirectors to the extent permitted by law.
There is no provision in ABB Ltd s Articles of Incorporation requiring a quorum for the holding ofshareholders meetings.
Resolutions and elections usually require the approval of an absolute majority of the shares represented at ashareholders meeting (i.e. a majority of the shares represented at the shareholders meeting with abstentions having theeffect of votes against the resolution). If the first ballot fails to result in an election and more than one candidate isstanding for election, the presiding officer will order a second ballot in which a relative majority (i.e. a majority of thevotes) shall be decisive.
A resolution passed with a qualified majority (at least two-thirds) of the shares represented at a shareholdersmeeting is required for:
a modification of the purpose of ABB Ltd,
the creation of shares with increased voting powers,

117
restrictions on the transfer of registered shares and the removal of those restrictions,
restrictions on the exercise of the right to vote and the removal of those restrictions,
an authorized or conditional increase in share capital,
an increase in share capital through the conversion of capital surplus, through an in-kind contribution or inexchange for an acquisition of property, and the grant of special benefits,
the restriction or denial of pre-emptive rights,
a transfer of ABB Ltd s place of incorporation, and
ABB Ltd s dissolution.
In addition, the introduction of any provision in ABB Ltd s Articles of Incorporation providing for a qualifiedmajority must be resolved in accordance with such qualified majority voting requirements.
Pursuant to the Swiss Federal Merger Act, special quorum rules apply by law to a merger (Fusion) (including apossible squeeze-out merger), de-merger (Spaltung), or conversion (Umwandlung) of ABB Ltd.
At shareholders meetings, shareholders can be represented by proxy, but only by their legal representative,another shareholder with the right to vote, or the independent proxy elected by the shareholders (unabhängigerStimmrechtsvertreter). All shares held by one shareholder may be represented by only one representative. Votes aretaken on a show of hands unless a secret ballot is required by the general meeting of shareholders or the presidingofficer. The presiding officer may arrange for resolutions and elections to be carried out by electronic means. As a result,resolutions and elections carried out by electronic means will be deemed to have the same effect as secret ballots. Thepresiding officer may at any time order that a resolution or election decided by a show of hands be repeated through asecret ballot if, in his view, the results of the vote are in doubt. In this case, the preceding decision by a show of handsshall be deemed to have not occurred.
Only shareholders registered in ABB Ltd s share register with the right to vote are entitled to participate atshareholders meetings. See Transfer of Shares . For practical reasons, shareholders must be registered in the shareregister with the right to vote no later than six business days prior to a shareholders meeting in order to be entitled toparticipate and vote at such shareholders meeting.
Holders of Euroclear Sweden AB-registered shares are provided with financial and other information onABB Ltd in the Swedish language in accordance with regulatory requirements and market practice. For shares that areregistered in the system of Euroclear Sweden AB in the name of a nominee, such information is to be provided by thenominee.
Pre-emptive Rights
Shareholders of a Swiss corporation have certain pre-emptive rights to subscribe for new shares issued inconnection with capital increases in proportion to the nominal amount of their shares held. A resolution adopted at ashareholders meeting with a supermajority of two-thirds of the shares represented may, however, repeal, limit orsuspend (or authorize the board of directors to repeal, limit or suspend) pre-emptive rights for cause. Cause includes anacquisition of a business or a part thereof, an acquisition of a participation in a company or the grant of shares toemployees. In addition, based on Article 4bis para. 1 and para. 4 of ABB Ltd s Articles of Incorporation, pre-emptiverights of the shareholders are excluded in connection with the issuance of convertible or warrant-bearing bonds or otherfinancial market instruments, shares to employees of ABB issued out of ABB Ltd s contingent share capital or the grantof warrant rights to shareholders, or may be restricted or denied by the Board of Directors of ABB Ltd under certaincircumstances as set forth in Article 4ter of ABB Ltd s Articles of Incorporation. See Item 6. Directors, SeniorManagement and Employees Shares .

118
Advance Subscription Rights
Shareholders of a Swiss corporation may have an advance subscription right with respect to bonds and otherinstruments issued in connection with options or conversion rights for shares if such option or conversion rights arebased on the corporation s conditional capital. However, the shareholders meeting can, with a supermajority oftwo-thirds of the shares represented at the meeting, exclude or restrict (or authorize the board of directors to exclude orrestrict) such advance subscription rights for cause. See Item 6. Directors, Senior Management and EmployeesShares Contingent share capital .
Borrowing Power
Neither Swiss law nor ABB Ltd s Articles of Incorporation restrict in any way ABB Ltd s power to borrow andraise funds. The decision to borrow funds is taken by or under the direction of the Board of Directors or the ExecutiveCommittee, and no shareholders resolution is required.
Repurchase of Shares
Swiss law limits a corporation s ability to repurchase or hold its own shares. ABB Ltd and its subsidiaries mayonly repurchase shares if ABB Ltd has sufficient freely distributable reserves to pay the purchase price, and theaggregate nominal value of such shares does not exceed 10 percent of ABB Ltd s total share capital. Furthermore,ABB Ltd must create a special reserve on its balance sheet in the amount of the purchase price of the acquired shares.Such shares held by ABB Ltd or its subsidiaries do not carry any rights to vote at shareholders meetings, but are entitledto the economic benefits applicable to the shares generally and are considered to be outstanding under Swiss law.
Notices
Written communication by ABB Ltd to its shareholders will be sent by ordinary mail to the last address of theshareholder or authorized recipient entered in the share register. To the extent that personal notification is not mandatedby law, all communications to the shareholders are validly made by publication in the Swiss Official Gazette ofCommerce (Schweizerisches Handelsamtsblatt).
Notices required under the listing rules of the SIX Swiss Exchange will be published in two Swiss newspapersin German and French. ABB Ltd or the SIX Swiss Exchange may also disseminate the relevant information on theonline exchange information systems. Notices required under the listing rules of the NASDAQ OMX StockholmExchange will be published in three national daily Swedish newspapers, as well as on ABB s Web site.
Duration, Liquidation and Merger
The duration of ABB Ltd as a legal entity is unlimited. It may be dissolved at any time by a shareholdersresolution which must be approved by a supermajority of two-thirds of the shares represented at the general meeting ofshareholders (this supermajority requirement applies in the event of a dissolution by way of liquidation or a mergerwhere ABB Ltd is not the surviving entity). Dissolution by court order is possible if it becomes bankrupt or if holders ofat least 10 percent of its share capital registered in the commercial register can establish cause for dissolution.
Under Swiss law, any surplus arising out of a liquidation of a corporation (after the settlement of all claims ofall creditors) is distributed to the shareholders in proportion to the paid-up par value of shares held, but this surplus issubject to Swiss withholding tax of 35 percent (see Taxation below).
Disclosure of Major Shareholders
Under the Swiss Stock Exchange Act, shareholders and groups of shareholders acting in concert who directlyor indirectly acquire or sell shares of a listed Swiss corporation or rights based thereon and thereby reach, exceed or fallbelow the thresholds of 3 percent, 5 percent, 10 percent, 15 percent, 20 percent, 25 percent, 331/3 percent, 50 percent or662/3 percent of the voting rights of the corporation must notify the corporation and the exchange(s) in Switzerland onwhich such shares are listed of such holdings in writing within four trading days, whether or not the voting rights can beexercised. Following receipt of such a notification, the corporation must inform the public within two trading days.

119
An additional disclosure requirement exists under the Swiss Code of Obligations, according to which ABB Ltdmust disclose individual shareholders and groups of shareholders acting in concert and their shareholdings if they holdmore than 5 percent of all voting rights and ABB Ltd knows or has reason to know of such major shareholders. Suchdisclosures must be made once a year in the notes to the financial statements as published in its annual report. For a listof our major shareholders, see Item 7. Major Shareholders and Related Party Transactions Major Shareholders .
Mandatory Offering Rules
Under the Swiss Financial Market Infrastructure Act, shareholders and groups of shareholders acting in concertwho acquire more than 331/3 percent of the voting rights (whether exercisable or not) of a listed Swiss company have tosubmit a takeover bid to all remaining shareholders unless the articles of incorporation of the company provide for analteration of this obligation. ABB Ltd s Articles of Incorporation do not provide for any alterations of the sobligations under the Swiss Financial Market Infrastructure Act. The mandatory offer obligation may be waived undercertain circumstances, for example if another shareholder owns a higher percentage of voting rights than the acquiror. Awaiver from the mandatory bid rules may be granted by the Swiss Takeover Board. If no waiver is granted, themandatory takeover bid must be made pursuant to the procedural rules set forth in the Swiss Financial MarketInfrastructure Act and the implementing ordinances.
Other than the rules discussed in this section and in the section above entitled Duration, Liquidation andMerger and Shareholders Meetings (which reflect mandatory provisions of Swiss law), no provision ofABB Ltd s Articles of Incorporation would operate only with respect to a merger, acquisition or corporate restructuringof ABB (or any of our subsidiaries) and have the effect of delaying, deferring or preventing a change in control of ABB.
Cancellation of Remaining Equity Securities
Under Swiss law, any offeror who has made a tender offer for the shares of a Swiss target company and who, asa result of such offer, holds more than 98 percent of the voting rights of the target company, may petition the court tocancel the remaining equity securities. The corresponding petition must be filed against the target company within threemonths after the lapse of the offer period. The remaining shareholders may join in the proceedings. If the court orderscancellation of the remaining equity securities, the target company will reissue the equity securities and deliver suchsecurities to the offeror against performance of the offer for the benefit of the holders of the cancelled equity securities.
Directors and Officers
For further information regarding the material provisions of ABB Ltd s Articles of Incorporation and the SwissCode of Obligations regarding directors and officers, see Item 6. Directors, Senior Management and EmployeesBoard Of Directors Board governance .
Auditors
The auditors are elected by the shareholders at the Annual General Meeting. Pursuant to ABB Ltd s Articles ofIncorporation, their term of office is one year.
Ernst & Young AG, Switzerland, assumed the sole auditing mandate of the consolidated financial statements ofthe ABB Group beginning in the year ended December 31, 2001 (having previously been joint auditors since 1994). Theauditor in charge and responsible for the mandate, Leslie Clifford, began serving in this capacity in respect of thefinancial year ended December 31, 2013.
See Item 16C. Principal Accountant Fees and Services for information regarding the fees paid to Ernst &Young AG.
MATERIAL CONTRACTS
The following descriptions of the material provisions of the referenced agreements do not purport to becomplete and are subject to, and qualified in their entirety by reference to, the agreements which have been filed asexhibits to this Annual Report.

120
Revolving Credit Facility
On May 23, 2014, ABB entered into a syndicated $2-billion five-year revolving credit facility with the right toextend for up to two additional years in accordance with its terms. For a description of the facility, see Item 5.Operating and Financial Review and Prospects Liquidity and Capital Resources Credit Facilit and Note 12 Debtto our Consolidated Financial Statements. See Exhibit 4.1 to this Annual Report.
Notes Indenture
On May 8, 2012, ABB s subsidiary, ABB Finance (USA) Inc., issued $500,000,000 aggregate principal amountof 1.625% notes due 2017, $1,250,000,000 aggregate principal amount of 2.875% notes due 2022 and $750,000,000aggregate principal amount of 4.375% notes due 2042 under an Indenture, dated as of May 8, 2012, among ABBFinance (USA) Inc., ABB and Deutsche Bank Trust Company Americas (the Indenture ). Pursuant to the terms of theIndenture, ABB has fully and unconditionally guaranteed payment of principal, premium, if any, and interest in respectof the notes. See Exhibit 4.2 to this Annual Report.
EXCHANGE CONTROLS
Other than in connection with Swiss government sanctions imposed on Belarus, the Republic of Burundi, theCentral African Republic, the Democratic Republic of the Congo, Eritrea, Guinea, the Islamic Republic of Iran, theRepublic of Iraq, Lebanon, Libya, Myanmar (Burma), the Democratic People's Republic of Korea (North Korea), theRepublic of Guinea-Bissau, Somalia, the Republic of South Sudan, Sudan, Syria, Yemen, Zimbabwe, persons andorganizations with connection to the late Osama bin Laden, the group or the Taliban, certain personsconnected with the assassination of Rafik Hariri and certain measures in connection with the prevention ofcircumvention of international sanctions in connection with the situation in the Ukraine, there are currently no laws,decrees or regulations in Switzerland that restrict the export or import of capital, including, but not limited to, Swissforeign exchange controls on payment of dividends, interest or liquidation proceeds, if any, to non-Swiss residentholders of shares. In addition, there are no limitations imposed by Swiss law or ABB Articles of Incorporation onthe rights of non-Swiss residents or non-Swiss citizens as shareholders to hold shares or to vote.
TAXATION
Swiss Taxation
Withholding Tax on Dividends and Other Distributions
Dividends paid and similar cash or in-kind distributions that we make to a holder of shares or ADSs (includingdividends on liquidation proceeds and stock dividends and taxable income resulting from partial liquidation) are subjectto a Swiss federal withholding tax at a rate of 35 percent. A repurchase of shares by us for the purpose of a capitalreduction is defined as a partial liquidation of the Company. In this case, the difference between the nominal value of theshares and their repurchase price is qualified as taxable income. The same would be true upon a repurchase of shares ifwe were not to dispose of the repurchased shares within six years after the repurchase, or if 10 percent of outstandingshares were exceeded. We must withhold the tax from the gross distribution and pay it to the Swiss Federal TaxAdministration. A reduction of the shares nominal value by means of a capital reduction and repayments of qualifyingcontributions from shareholders exceeding the nominal share capital do not represent a dividend or similar distributionfor purposes of Swiss withholding tax and can therefore be distributed without deduction of Swiss withholding tax.
Obtaining a Refund of Swiss Withholding Tax for U.S. Residents
The Convention between the Swiss Confederation and the United States of America for the Avoidance ofDouble Taxation with Respect to Taxes on Income, which entered into force on December 19, 1997 and which we willrefer to in the following discussion as the Treaty, allows U.S. resident individuals or U.S. corporations to seek a refundof the Swiss withholding tax paid in respect of our shares or ADSs if they qualify for benefits under the Treaty. U.S.resident individuals and U.S. corporations holding less than 10 percent of the voting rights in respect of our shares orADSs are entitled to seek a refund of withholding tax to the extent the tax withheld exceeds 15 percent of the grossdividend or other distribution. U.S. corporations holding 10 percent or more of the voting rights of our shares or ADSsare entitled to seek a refund of withholding tax to the extent the tax withheld exceeds 5 percent of the gross dividend orother distribution. Qualifying U.S. pension or other retirement arrangements that do not control the Company areentitled to seek a full refund of withholding tax.

121
Claims for refunds must be filed with the Swiss Federal Tax Administration, Eigerstrasse 65, 3003 Bern,Switzerland, no later than December 31 of the third year following the calendar year in which the dividend or similardistribution became payable. The form used for obtaining a refund is Swiss Tax Form 82 (82C for companies; 82E forother entities; 82I for individuals; 82R for regulated investment companies (RICs)). This form may be obtained from anySwiss Consulate General in the United States, from the Swiss Federal Tax Administration at the address above or underwww.estv.admin.ch . The form must be filled out in triplicate with each copy duly completed and signed before a notarypublic in the United States. The form must be accompanied by evidence of the deduction of withholding tax withheld atthe source (including tax voucher issued by the custodian bank).
Stamp Duties upon Transfer of Securities
The sale of shares or ADSs, whether by Swiss resident or non-resident holders, may be subject to a Swisssecurities transfer stamp duty of up to 0.15 percent calculated on the sale proceeds if it occurs through or with a Swissbank or other Swiss securities dealer as defined in the Swiss Federal Stamp Tax Act. In addition to the stamp duty, thesale of shares or ADSs by or through a member of the SIX Swiss Exchange may be subject to a stock exchange levy.
United States Taxes
The following is a summary of the material U.S. federal income tax consequences of the ownership by U.S.holders (defined below) of shares or ADSs. This summary does not purport to address all of the tax considerations thatmay be relevant to a decision to purchase, own or dispose of shares or ADSs. This summary assumes that U.S. holdershold shares or ADSs as capital assets for U.S. federal income tax purposes. This summary does not address taxconsiderations applicable to holders that may be subject to special tax rules, such as U.S. expatriates, dealers or tradersin securities or currencies, partnerships owning shares or ADSs, tax-exempt entities, banks and other financialinstitutions, regulated investment companies, traders in securities that elect to apply a mark-to-market method ofaccounting, insurance companies, holders that own (or are deemed to own) at least 10 percent or more (by voting poweror value) of the stock of ABB, investors whose functional currency is not the U.S. dollar, persons subject to thealternative minimum tax, persons that will hold shares or ADSs as part of a position in a straddle or as part of a hedgingor conversion transaction for U.S. tax purposes and persons who are not U.S. holders. This discussion does not addressaspects of U.S. taxation other than U.S. federal income taxation, nor does it address state, local or foreign taxconsequences of an investment in shares or ADSs.
This summary is based (i) on the Internal Revenue Code of 1986, as amended, U.S. Treasury Regulations andjudicial and administrative interpretations thereof, in each case as in effect and available on the date of this registrationstatement and (ii) in part, on representations of the depositary and the assumption that each obligation in the depositagreement and any related agreement will be performed in accordance with its terms. The U.S. tax laws and theinterpretation thereof are subject to change, which change could apply retroactively and could affect the taxconsequences described below.
For purposes of this summary, a U.S. holder is a beneficial owner of shares or ADSs that, for U.S. federalincome tax purposes, is:
a citizen or resident of the United States,
a corporation (or other entity treated as a corporation for U.S. federal income tax purposes) created ororganized in or under the laws of the United States or any state, including the District of Columbia,
an estate if its income is subject to U.S. federal income taxation regardless of its source, or
a trust if such trust validly has elected to be treated as a U.S. person for U.S. federal income tax purposesor if (i) a U.S. court can exercise primary supervision over its administration and (ii) one or more U.S.persons have the authority to control all of its substantial decisions.
If a partnership (including any entity treated as a partnership for U.S. federal income tax purposes) is abeneficial owner of shares or ADSs, the treatment of a partner in the partnership will generally depend on the status ofthe partner and the activities of the partnership. If you are a partner in a partnership that holds shares or ADSs youshould consult your tax advisor.
Each prospective purchaser should consult the purchaser s tax advisor with respect to the U.S. federal, state,local and foreign tax consequences of acquiring, owning or disposing of shares or ADSs.

122
Ownership of ADSs in General
For U.S. federal income tax purposes, a holder of ADSs generally will be treated as the owner of the sharesrepresented by the ADSs.
Distributions
In general, for U.S. federal income tax purposes, the gross amount of any distribution (other than certaindistributions, if any, of shares distributed to all shareholders of ABB, including holders of ADSs) made to you withrespect to shares or ADSs, including the amount of any Swiss taxes withheld from the distribution, will constitutedividends to the extent of ABB s current and accumulated earnings and profits (as determined under U.S. federal incometax principles).
Non-corporate U.S. holders generally will be taxed on such distributions at the lower rates applicable tolong-term capital gains (i.e., gains from the sale of capital assets held for more than one year) with respect todistributions during 2016, provided that the U.S. holder meets certain holding period and other requirements andprovided that such distributions constitute qualified dividends for U.S. federal income tax purposes. Distributionstreated as dividends will not be treated as qualified dividends if we were to be treated as a passive foreign investmentcompany (a PFIC ) for U.S. federal income tax purposes in the year that the dividend is paid or in the year prior to theyear that the dividend is paid. Based on certain estimates of its gross income and gross assets and the nature of itsbusiness, ABB believes that it will not be classified as a PFIC for the taxable year ended December 31, 2016. ABB sstatus in future years will depend on its assets and activities in those years. ABB has no reason to believe that its assetsor activities will change in a manner that would cause it to be classified as a PFIC. However, as PFIC status is a factualmatter that must be determined annually at the close of each taxable year, there can be no certainty regarding ABB sPFIC status in any particular year until the end of that year. U.S. holders are urged to consult their own tax advisorsregarding the availability to them of the reduced dividend rate in light of their own particular circumstances and theconsequences to them if ABB were to be treated as a PFIC with respect to any taxable year.
Dividends paid to U.S. corporate holders will not be eligible for the dividends received deduction generallyallowed to corporate U.S. holders.
If you are a U.S. holder and distributions with respect to shares or ADSs exceed ABB s current andaccumulated earnings and profits as determined under U.S. federal income tax principles, then the excess generallywould be treated first as a tax-free return of capital to the extent of your adjusted tax basis in the shares or ADSs. Anyamount in excess of the amount of the dividend and the return of capital generally would be treated as capital gain. ABBdoes not maintain calculations of its earnings and profits under U.S. federal income tax principles.
If you are a U.S. holder, then dividends paid in Swiss francs, including the amount of any Swiss taxes withheldfrom the dividends, will be included in your gross income in an amount equal to the U.S. dollar value of the Swiss francscalculated by reference to the spot exchange rate in effect on the day the dividends are includible in income. In the caseof ADSs, dividends generally are includible in income on the date they are received by the depositary, regardless ofwhether the payment is in fact converted into U.S. dollars at that time. If dividends paid in Swiss francs are convertedinto U.S. dollars on the day they are includible in income, then you generally should not be required to recognize foreigncurrency gain or loss with respect to the conversion. However, any gains or losses resulting from the conversion ofSwiss francs between the time of the receipt of dividends paid in Swiss francs and the time the Swiss francs areconverted into U.S. dollars will be treated as ordinary income or loss to you, as the case may be. The amount of anydistribution of property other than cash will be the fair market value of the property on the date of distribution.
If you are a U.S. holder, then you will have a basis in any Swiss francs received as a refund of Swisswithholding taxes equal to a U.S. dollar amount calculated by reference to the exchange rate in effect on the date ofreceipt of the dividend on which the tax was withheld. See Swiss Taxation Obtaining a Refund of SwissWithholding Tax for U.S. Residents above.

123
If you are a U.S. holder, then dividends received by you with respect to shares or ADSs will be treated asforeign source income, which may be relevant in calculating your foreign tax credit limitation. Subject to certainconditions and limitations, Swiss tax withheld on dividends may be deducted from your taxable income or creditedagainst your U.S. federal income tax liability. However, to the extent that you would be entitled to a refund of Swisswithholding taxes pursuant to the U.S.-Switzerland tax treaty, you may not be eligible for a U.S. foreign tax credit withrespect to the amount of such withholding taxes which may be refunded, even if you fail to claim the refund. SeeSwiss Taxation Obtaining a Refund of Swiss Withholding Tax for U.S. Residents . The limitation on foreign taxeseligible for credit is calculated separately with respect to specific classes of income. For this purpose, dividendsdistributed by ABB generally will constitute passive income, or, in the case of certain U.S. holders, financial servicesincome. The rules relating to the determination of the U.S. foreign tax credit are complex, and you should consult yourtax advisor to determine whether and to what extent you would be entitled to this credit.
Sale or Exchange of Shares or ADSs
If you are a U.S. holder that holds shares or ADSs as capital assets, then you generally will recognize capitalgain or loss for U.S. federal income tax purposes upon a sale or exchange of your shares or ADSs in an amount equal tothe difference between your adjusted tax basis in the shares or ADSs and the amount realized on their disposition. If youare a non-corporate U.S. holder, the maximum marginal U.S. federal income tax rate applicable to the gain is generallylower than the maximum marginal U.S. federal income tax rate applicable to ordinary income (other than certaindividends) if your holding period for the shares or ADSs exceeds one year (i.e., long-term capital gains). If you are aU.S. holder, then the gain or loss, if any, recognized by you generally will be treated as U.S. source income or loss, asthe case may be, for U.S. foreign tax credit purposes.
If you are a U.S. holder and you receive any foreign currency on the sale of shares or ADSs, then you mayrecognize U.S. source ordinary income or loss as a result of currency fluctuations between the date of the sale of theshares or ADSs, as the case may be, and the date the sales proceeds are converted into U.S. dollars.
Medicare Tax
For taxable years beginning after December 31, 2012, certain U.S. holders who are individuals, estates or trustsmust pay a 3.8 percent tax on the lesser of (i) the U.S. holder s net investment income for the relevant taxable year and(ii) the excess of the U.S. holder s modified adjusted gross income for the taxable year over a certain threshold (which inthe case of individuals will be between $125,000 and $250,000, depending on the individual s circumstances). A U.S.holder s net investment income will generally include its dividend income and its net gains from the disposition ofshares or ADSs, unless such income or net gains are derived in the ordinary course of the conduct of a trade or business(other than a trade or business that consists of certain passive or trading activities). If you are a U.S. holder that is anindividual, estate or trust, you are urged to consult your tax advisor regarding the applicability of the Medicare tax toyour income and gains in respect of your investment in shares or ADSs.
Backup Withholding and Information Reporting
U.S. backup withholding tax and information reporting requirements generally apply to certain payments tocertain non-corporate holders of stock. Information reporting generally will apply to payments of dividends on, and toproceeds from the sale or redemption of, shares or ADSs made within the United States to a holder of shares or ADSs(other than an exempt recipient, including a corporation, a payee that is not a U.S. holder that provides an appropriatecertification, and certain other persons).
A payor will be required to withhold backup withholding tax from any payments of dividends on, or theproceeds from the sale or redemption of, shares or ADSs within the United States to you, unless you are an exemptrecipient, if you fail to furnish your correct taxpayer identification number or otherwise fail to establish an exceptionfrom backup withholding tax requirements. Backup withholding is not an additional tax. The amount of any backupwithholding from a payment to you will be allowed as a credit against your U.S. federal income tax liability and mayentitle you to a refund, provided that the required information is furnished timely to the U.S. Internal Revenue Service.The current backup withholding tax rate is 28 percent.
THE ABOVE SUMMARIES ARE NOT INTENDED TO CONSTITUTE A COMPLETE ANALYSISOF ALL TAX CONSEQUENCES RELATING TO THE OWNERSHIP OF SHARES OR ADSs.PROSPECTIVE PURCHASERS OF SHARES OR ADSs SHOULD CONSULT THEIR TAX ADVISORSCONCERNING THE TAX CONSEQUENCES OF THEIR PARTICULAR SITUATIONS.

124
DOCUMENTS ON DISPLAY
We are subject to the informational requirements of the Securities Exchange Act of 1934, as amended. Inaccordance with these requirements, we file reports and other information with the SEC. These materials, including thisAnnual Report and the exhibits thereto, may be inspected and copied at prescribed rates at the SEC s public referenceroom at 450 Fifth Street, N.W., Washington, D.C. 20549. Further information on the operation of the public referenceroom may be obtained by calling the SEC at 1-800-SEC-0330. The SEC also maintains a Web site at www.sec.gov thatcontains reports and other information regarding registrants that file electronically with the SEC. Our annual reports andsome of the other information we submit to the SEC may be accessed through this Web site. In addition, material thatwe file can be inspected at the offices of the New York Stock Exchange at 20 Broad Street, New York, New York10005.
Item 11. Quantitative and Qualitative Disclosures about Market Risk
Market Risk Disclosure
The continuously evolving financial markets and the dynamic business environment expose us to changes inforeign exchange, interest rate and other market price risks. We have developed and implemented comprehensivepolicies, procedures, and controls to identify, mitigate, and monitor financial risk on a firm-wide basis. To efficientlyaggregate and manage financial risks that could impact our financial performance, we operate a Group TreasuryOperations function. Our Group Treasury Operations provides an efficient source of liquidity, financing, riskmanagement and other global financial services to the ABB Group companies. Our policies do not allow our GroupTreasury Operations or ABB Group companies to perform speculative trading. Market risk management activities arefocused on mitigating material financial risks resulting from our global operating and financing activities.
Group Treasury Operations maintains risk management control systems to monitor foreign exchange andinterest rate risks and exposures arising from our underlying business, as well as the associated hedge positions. Ourwritten policies govern how such exposures are managed. Financial risks are monitored using a number of analyticaltechniques including market value and sensitivity analysis. The following quantitative analyses are based on sensitivityanalysis tests, which assume parallel shifts of interest rate yield curves, and foreign exchange rates and equity prices.
Currency Fluctuations and Foreign Exchange Risk
It is our policy to identify and manage all transactional foreign exchange exposures to minimize risk. With theexception of certain financing subsidiaries and to the extent certain operating subsidiaries are domiciled in high inflationenvironments, the functional currency of each of our companies is considered to be its local currency. Our policiesrequire our subsidiaries to hedge all contracted foreign exchange exposures, as well as a portion of their forecastexposures, against their local currency. These transactions are undertaken mainly with our Group Treasury Operations.
We have foreign exchange transaction exposures related to our global operating and financing activities incurrencies other than the functional currency in which our entities operate. Specifically, we are exposed to foreignexchange risk related to future earnings, assets or liabilities denominated in foreign currencies. The most significantcurrency exposures relate to operations in the Eurozone area, Sweden and Switzerland. In addition, we are exposed tocurrency risk associated with translating our functional currency financial statements into our reporting currency, whichis the U.S. dollar.
Our operating companies are responsible for identifying their foreign currency exposures and entering intointercompany derivative contracts with Group Treasury Operations, where legally possible, to hedge their exposures.Where local laws restrict our operating companies from entering into intercompany derivatives with Group TreasuryOperations, derivative contracts are entered into locally with third-party financial institutions. The intercompanytransactions have the effect of transferring the operating companies currency risk to Group Treasury Operations, butcreate no additional market risks on a consolidated basis. Group Treasury Operations then manages this risk by enteringinto offsetting transactions with third-party financial institutions. According to our policy, material net currencyexposures are required to be hedged and are primarily hedged with forward foreign exchange contracts. The majority ofthe foreign exchange hedge instruments have, on average, a maturity of less than twelve months. Group TreasuryOperations also hedges currency risks arising from monetary intercompany balances, primarily loans receivable fromother ABB companies.
125
As of December 31, 2016 and 2015, the net fair value of financial instruments with exposure to foreigncurrency rate movements was $876 million and $1,399 million, respectively. The potential loss in fair value of suchfinancial instruments from a hypothetical 10 percent move in foreign exchange rates against our position would beapproximately $444 million and $542 million for December 31, 2016 and 2015, respectively. The analysis reflects theaggregate adverse foreign exchange impact associated with transaction exposures, as well as translation exposures whereappropriate. Our sensitivity analysis assumes a simultaneous shift in exchange rates against our positions exposed toforeign exchange risk and as such assumes an unlikely adverse case scenario. Exchange rates rarely move in the samedirection. Therefore, the assumption of a simultaneous shift may overstate the impact of changing rates on assets andliabilities denominated in foreign currencies. The underlying trade-related transaction exposures of the industrialcompanies are not included in the quantitative analysis. If these underlying transaction exposures were included, theywould tend to have an offsetting effect on the potential loss in fair value detailed above.
Interest Rate Risk
We are exposed to interest rate risk due to our financing, investing, and liquidity management activities. Ouroperating companies primarily invest excess cash with, and receive funding from, our Group Treasury Operations on anarm s length basis. It is our policy that the primary third-party funding and investing activities, as well as the monitoringand management of the resulting interest rate risk, are the responsibility of Group Treasury Operations. Group TreasuryOperations adjusts the duration of the overall funding portfolio through derivative instruments in order to better matchunderlying assets and liabilities, as well as minimize the cost of capital.
As of December 31, 2016 and 2015, the net fair value of instruments subject to Interest Rate Risk was $(1,482)million and $(1,666) million, respectively. The potential loss in fair value for such instruments from a hypothetical 100basis points parallel shift in interest rates against our position (or a multiple of 100 basis points where 100 basis points isless than 10 percent of the interest rate) would be approximately $292 million and $289 million, for December 31, 2016and 2015, respectively.
Leases are not included as part of the sensitivity analysis. This represents a limitation of the analysis. Whilesensitivity analysis includes the interest rate sensitivity of the funding of the lease portfolio, a corresponding change inthe lease portfolio was not considered in the sensitivity model.
Equity Risk
Certain of our entities have equity investments that expose us to equity price risk. As of December 31, 2016and 2015, the net fair value of equity risk sensitive instruments was $37 million and $57 million, respectively. Thepotential loss in fair value of such financial instruments from a hypothetical 10 percent move in the underlying equityprices against our position would be approximately $10 million and $10 million, for December 31, 2016 and 2015,respectively.
Commodity Risk
We enter into commodity derivatives to hedge certain of our raw material exposures. As of December 31, 2016and 2015, the net fair value of commodity derivatives was $26 million and $(39) million, respectively. The potential lossin fair value for such commodity hedging derivatives from a hypothetical adverse 10 percent move against our positionin the underlying commodity prices would be approximately $31 million and $28 million for December 31, 2016 and2015, respectively. A portion of our commodity derivatives are denominated in euro. The foreign exchange risk arisingon such contracts has been excluded from the calculation of the potential loss in fair value from a hypothetical10 percent move in the underlying commodity prices as discussed above.
Item 12. Description of Securities Other Than Equity Securities
American Depositary Shares
Depositary fees payable upon the issuance and cancellation of ADSs are typically paid to the depositary bankby the brokers (on behalf of their clients) receiving the newly-issued ADSs from the depositary bank and by the brokers(on behalf of their clients) delivering the ADSs to the depositary bank for cancellation. The brokers in turn may chargethese transaction fees to their clients.

126
Depositary fees payable in connection with distributions of cash or securities to ADS holders and the depositaryservices fee are charged by the depositary bank to the holders of record of ADSs as of the applicable ADS record date.The depositary fees payable for cash distributions are generally deducted from the cash being distributed. In the case ofdistributions other than cash (i.e., stock dividends, rights offerings), the depositary bank charges the applicable fee to theADS record date holders concurrent with the distribution. In the case of ADSs registered in the name of the investor(whether certificated or un-certificated in direct registration), the depositary bank sends invoices to the applicable recorddate ADS holders. In the case of ADSs held in brokerage and custodian accounts via the central clearing and settlementsystem, The Depository Trust Company (DTC), the depositary bank, generally collects its fees through the systemsprovided by DTC (whose nominee is the registered holder of the ADSs held in DTC) from the brokers and custodiansholding ADSs in their DTC accounts. The brokers and custodians who hold their clients ADSs in DTC accounts in turncharge their clients accounts the amount of the fees paid to the depositary banks.
In the event of refusal to pay the depositary fees, the depositary bank may, under the terms of the depositagreement, refuse the requested service until payment is received or may set-off the amount of the depositary fees fromany distribution to be made to the ADS holder.
Depositary fees are as follows:
Depositary Service FeeIssuance of ADSs upon deposit of shares ................ Up to $5.00 per 100 ADSs (or fraction thereof) issued.Delivery of deposited security against surrender of
ADSs ................................................................. Up to $5.00 per 100 ADSs (or fraction thereof) surrendered.Distribution of dividend ......................................... Up to $2.00 per 100 ADSs (or fraction thereof) held.Distribution of cash proceeds.................................. Up to $2.00 per 100 ADSs (or fraction thereof) held.Distribution of ADSs pursuant to exercise of rights. Up to $5.00 per 100 ADSs (or fraction thereof) issued.
Depositary Payments
In 2016, we received reimbursements from Citibank N.A., the Depositary Bank of our ADS program, ofapproximately $4 million to help cover costs related to our ADS program. Those costs, in addition to costs associatedwith compliance with U.S. securities laws, include expenses such as listing fees, proxy expenses, printing anddistribution of reports, and other investor relations-related activities.
PART II
Item 13. Defaults, Dividend Arrearages and Delinquencies
Not applicable
Item 14. Material Modifications to the Rights of Security Holders and Use of Proceeds
Not applicable
Item 15. Controls and Procedures
Background and internal investigation
In February 2017, we discovered a scheme to embezzle and misappropriate funds in our subsidiary in SouthKorea. Under the direction and supervision of the Board of Directors, management commenced an investigation into thisfraudulent activity. Based on our investigation to date, we determined it was orchestrated by the treasurer of thesubsidiary in South Korea and amounted to a total of $109 million, of which $103 million occurred prior toDecember 31, 2016. As a result, we have restated our unaudited interim consolidated financial information for the yearand three months ended December 31, 2016, previously filed on Form 6-K on February 8, 2017. While theembezzlement occurred in a number of periods prior to 2016, such prior period amounts were not material to any suchprior period and, accordingly, we have not restated any previously issued financial statements relating to any periodprior to the year ended December 31, 2016.

127
Disclosure controls and procedures
In designing and evaluating our disclosure controls and procedures, management recognizes that any controlsand procedures can provide only reasonable, not absolute, assurance of achieving the desired control objectives. Inaddition, the design of disclosure controls and procedures must reflect the fact that there are resource constraints and thatmanagement is required to apply judgment in evaluating the benefits of possible controls and procedures relative to theircosts.
Our management, with the participation of our Chief Executive Officer, Ulrich Spiesshofer, and our ChiefFinancial Officer, Eric Elzvik, performed an evaluation of our disclosure controls and procedures (as defined inRule 13a-15(e) of the Securities Exchange Act of 1934, as amended (the as of December 31, 2016. Asa result of the material weakness described below, our Chief Executive Officer and Chief Financial Officer haveconcluded that, as of December 31, 2016, our disclosure controls and procedures were not effective at the reasonableassurance level.
annual report on internal control over financial reporting
The Board of Directors and management of the ABB Group are responsible for establishing and maintainingadequate internal control over financial reporting as defined in Rule 13a-15(f) of the Exchange Act.
Because of its inherent limitations, internal control over financial reporting may not prevent or detectmisstatements. Also, projections of any evaluation of effectiveness to future periods are subject to the risk that controlsmay become inadequate because of changes in conditions, or that the degree of compliance with the policies andprocedures may deteriorate.
Management conducted an assessment of the effectiveness of internal control over financial reporting as ofDecember 31, 2016. In making this assessment, management used the criteria established in Internal ControlIntegrated Framework issued by the Committee of Sponsoring Organizations of the Treadway Commission (2013framework).
A material weakness is a deficiency, or a combination of deficiencies, in internal control over financialreporting, such that there is a reasonable possibility that a material misstatement of the company's financial statementswill not be prevented or detected on a timely basis. We did not maintain adequate segregation of duties in the treasuryfunction in our South Korean subsidiary and failed to identify certain inappropriate access levels to the local ERPsystem. In addition, we failed to safeguard physical access to the signature seals of the subsidiary in South Korea andprevent the Company from being bound to unauthorized financial contracts, resulting in undetected financial obligations.We also failed to provide adequate management oversight and review of the local treasury activities. As a result, we didnot maintain effective controls over the safeguarding of cash and other treasury activities, including controls relating toentering into financial contracts. We have concluded that these deficiencies in the operation of our internal controlsconstituted a material weakness.
Based on its evaluation, our management has concluded that, as a result of the material weakness describedabove, our internal control over financial reporting was not effective as of December 31, 2016.
The effectiveness of our internal control over financial reporting as of December 31, 2016, has been audited byErnst & Young AG, the independent registered public accounting firm that audited the financial statements included inthis annual report.
Remediation plans
We are currently working to remediate the material weakness described above. We are reviewing roles andresponsibilities to ensure appropriate segregation of duties. We have adjusted certain access rights to the ERP system,and we will continue to evaluate access rights to ensure they are consistent with the job functions. We have implementedprocedures to enforce access controls over signature seals and will improve oversight and review procedures overtreasury activities. We believe these measures, once implemented and operating for a sufficient period of time, willremediate the control deficiencies identified and strengthen our internal control over financial reporting.

128
Report of the independent registered public accounting firm
Ernst & Young report on its audit of the effectiveness of the ABB internal control over financialreporting as of December 31, 2016, is included in 18. Financial
Changes in internal control over financial reporting
There have been no changes in our internal control over financial reporting that occurred during the periodcovered by this annual report that have materially affected, or are reasonably likely to materially affect, our internalcontrol over financial reporting.
Item 15T. Controls and Procedures
Not applicable
Item 16A. Audit Committee Financial Expert
Our Board of Directors has determined that Louis R. Hughes, Robyn Denholm, David Meline and Satish Pai,who serve on our Finance, Audit and Compliance Committee (FACC), are independent for purposes of serving on theaudit committee under Rule 10A-3 and the listing standards promulgated by the New York Stock Exchange, and areaudit committee financial experts.
Item 16B. Code of Ethics
Our chief executive officer, chief financial officer, principal accounting officer and persons performing similarfunctions are bound to adhere to our Code of Conduct, which applies to all employees of all companies in the ABBGroup. Our Code of Conduct is available on our Web site in the section Corporate governance atwww.abb.com/investorrelations
Item 16C. Principal Accountant Fees and Services
Audit Fees
Fees for audit services provided by Ernst & Young totaled approximately $24.9 million and $25.9 million in2016 and 2015, respectively. Audit fees include the standard audit work performed each fiscal year necessary to allowthe auditor to issue an opinion on our Consolidated Financial Statements (including the integrated audit of internalcontrols over financial reporting) and to issue an opinion on the local statutory financial statements of ABB Ltd and itssubsidiaries. Audit fees also include services that can be provided only by the ABB Group auditor such as pre-issuancereviews of quarterly financial results and comfort letters delivered to underwriters in connection with debt and equityofferings.
Audit-Related Fees
Fees for audit-related services provided by Ernst & Young totaled approximately $2.2 million and $1.6 millionin 2016 and 2015, respectively, consisting primarily of accounting consultations, audits of pension and benefit plans,accounting advisory services and other attest services related to financial reporting that are not required by statute orregulation.
Tax Fees
Fees for tax services provided by Ernst & Young totaled approximately $2.2 million and $6.1 million in 2016and 2015, respectively, representing primarily income tax and indirect tax compliance services as well as tax advisoryservices.

129
All Other Fees
Fees for other services provided by Ernst & Young, not included in the above three categories, totaledapproximately $0.2 million and $0.2 million in 2016 and 2015, respectively.
Pre-Approval Procedures and Policies
In accordance with the requirements of the U.S. Sarbanes-Oxley Act of 2002 and rules issued by the SEC, weutilize a procedure for the review and pre-approval of any services performed by Ernst & Young. The procedure requiresthat all proposed engagements of Ernst & Young for audit and permitted non-audit services are submitted to the FACCfor approval prior to the beginning of any such services. In accordance with this policy, all services performed by andfees paid to Ernst & Young in 2016 and 2015, as discussed above in this Item 16C, were approved by the FACC.
Item 16D. Exemptions from the Listing Standards for Audit Committees
None
Item 16E. Purchase of Equity Securities by Issuer and Affiliated Purchasers
The following table sets out certain information about purchases of our own shares made by us or on ourbehalf.
ApproximateTotal number USD-equivalent
of shares value of sharespurchased as that may yet be
Total number Average part of publicly purchased underof shares price paid announced the program (in
Period purchased per share(1) program(2) millions of USD)January 2016 $1,768February 4 - February 29, 2016 15,650,000 $17.48 15,650,000 $1,494March 1 - March 21, 2016 12,020,000 $18.55 12,020,000 $1,271April 22 - April 29, 2016 4,950,000 $20.89 4,950,000 $1,168May 2 - May 31, 2016 18,000,000 $20.73 18,000,000 $795June 1 - June 21, 2016 14,690,000 $20.87 14,690,000 $488July 2016 $488August 2016 $488September 2016October 2016November 2016December 2016Total 65,310,000 65,310,000
(1) Represents volume weighted-average prices in CHF translated into USD using daily closing foreign exchange rates.
(2) In September 2014, we announced a share buyback program for the purchase of up to $4 billion of our own shares. On September 30, 2016,we announced that we had completed this program. Under the program we purchased a total of 171,335,000 shares, of which 146,595,000shares (for approximately $3 billion) were bought for cancellation and 24,740,000 shares (for approximately $0.5 billion) were bought tosupport our employee share programs. Shares acquired for cancellation were acquired through a separate trading line on the SIX SwissExchange (on which only we could purchase shares), while shares acquired for delivery under employee share programs were acquiredthrough the ordinary trading line.
Item 16F. Change in Registrant s Certifying Accountant
Not applicable

130
Item 16G. Corporate Governance
See Item 6. Directors, Senior Management and Employees Other governance information Governancedifferences from NYSE Standards for significant ways in which ABB s corporate governance practices differ from theNew York Stock Exchange s standards.
Item 16H. Mine Safety Disclosure
Not applicable.
PART III
Item 17. Financial Statements
We have elected to provide financial statements and the related information pursuant to Item 18.
Item 18. Financial Statements
See pages F-1 to F-70, which are incorporated herein by reference. All schedules are omitted as the requiredinformation is inapplicable or the information is presented in the Consolidated Financial Statements or notes thereto.

131
Item 19. Exhibits1.1 Articles of Incorporation of ABB Ltd as amended to date.2.1 Form of Amended and Restated Deposit Agreement, by and among ABB Ltd, Citibank, N.A., as Depositary,
and the holders and beneficial owners from time to time of the American Depositary Shares issued thereunder(including as an exhibit the form of American Depositary Receipt). Incorporated by reference to Exhibit (a) toForm F-6EF (File No. 333-147488) filed by ABB Ltd on November 19, 2007.
2.2 Form of American Depositary Receipt (included in Exhibit 2.1).4.1 $2,000,000,000 Multicurrency Revolving Credit Agreement, dated May 23, 2014, and as amended on June 13,
2014, entered into between ABB Ltd, certain subsidiaries of ABB Ltd as borrowers, 27 banks as mandatedlead arrangers, Citibank International PLC, as facility agent and euro swingline agent and Citibank N.A. asdollar swingline agent. Incorporated by reference to Exhibit 4.1 to the Form 20-F filed by ABB Ltd on March5, 2015.
4.2 Indenture dated as of May 8, 2012, among ABB Finance (USA) Inc., ABB and Deutsche Bank Trust CompanyAmericas, pursuant to which ABB has fully and unconditionally guaranteed payment of principal, premium, ifany, and interest in respect of any notes issued thereunder. On May 8, 2012, ABB s subsidiary, ABB Finance(USA) Inc., issued $500,000,000 aggregate principal amount of 1.625% notes due 2017, $1,250,000,000aggregate principal amount of 2.875% notes due 2022 and $750,000,000 aggregate principal amount of4.375% notes due 2042 under the Indenture. Incorporated by reference to Exhibit 4.1 to the RegistrationStatement on Form F-3 filed by ABB Ltd and ABB Finance (USA) Inc. on April 25, 2012.
7.1 Computation of Ratio of Earnings to Fixed Charges.8.1 Subsidiaries of ABB Ltd as of December 31, 2016.12.1 Certification of the chief executive officer pursuant to Section 302 of the Sarbanes-Oxley Act of 2002.12.2 Certification of the chief financial officer pursuant to Section 302 of the Sarbanes-Oxley Act of 2002.13.1 Certification by the chief executive officer of ABB Ltd pursuant to 18 U.S.C. Section 1350, as adopted
pursuant to Section 906 of the Sarbanes-Oxley Act of 2002.*13.2 Certification by the chief financial officer of ABB Ltd pursuant to 18 U.S.C. Section 1350, as adopted
pursuant to Section 906 of the Sarbanes-Oxley Act of 2002.*15.1 Consent of Independent Registered Public Accounting Firm.101 The following financial information from this Annual Report formatted in XBRL (Extensible Business
Reporting Language) includes (i) Consolidated Income Statements, (ii) Consolidated Statements ofComprehensive Income, (iii) Consolidated Balance Sheets, (iv) Consolidated Statements of Cash Flows,(v) Consolidated Statements of Changes in Stockholders Equity, (vi) Notes to the Consolidated FinancialStatements, tagged as blocks of text, (vii) each significant accounting policy within Note 2 Significantaccounting policies , tagged as a single block of text, (viii) each table in the Notes to the ConsolidatedFinancial Statements, tagged as a separate block of text and, (ix) each amount in the Notes to the ConsolidatedFinancial Statements, tagged separately. Furnished electronically herewith.
* This document is being furnished in accordance with SEC Release Nos. 33-8212 and 34-74551.
132
SIGNATURES
The registrant hereby certifies that it meets all of the requirements for filing on Form 20-F and that it has dulycaused and authorized the undersigned to sign this Annual Report on its behalf.
ABB LTD
By: /s/ ERIC ELZVIKDate: March 10, 2017 Name: Eric Elzvik
Title: Executive Vice President andChief Financial Officer
By: /s/ RICHARD A. BROWNDate: March 10, 2017 Name: Richard A. Brown
Title: Group Senior Vice President andChief Counsel Corporate & Finance

F-1
INDEX TO CONSOLIDATED FINANCIAL STATEMENTS AND SCHEDULES
Consolidated Financial Statements:Report of management on internal control over financial reporting F-2Reports of Independent Registered Public Accounting Firm F-3Consolidated Income Statements for the years ended December 31, 2016, 2015 and 2014 F-5Consolidated Statements of Comprehensive Income for the years ended December 31, 2016, 2015 and 2014 F-6Consolidated Balance Sheets as of December 31, 2016 and 2015 F-7Consolidated Statements of Cash Flows for the years ended December 31, 2016, 2015 and 2014 F-8Consolidated Statements of Changes in Stockholders Equity for the years ended December 31, 2016, 2015
and 2014 F-9Notes to the Consolidated Financial Statements F-10

F-2
Report of management on internal control over financial reporting
The Board of Directors and management of ABB Ltd and its consolidated subsidiaries are responsiblefor establishing and maintaining adequate internal control over financial reporting as defined in Rule 13a-15(f) of theExchange Act.
Because of its inherent limitations, internal control over financial reporting may not prevent or detectmisstatements. Also, projections of any evaluation of effectiveness to future periods are subject to the risk that controlsmay become inadequate because of changes in conditions, or that the degree of compliance with policies andprocedures may deteriorate.
Management conducted an assessment of the effectiveness of internal control over financial reporting as ofDecember 31, 2016. In making this assessment, management used the criteria established in Internal ControlIntegrated Framework issued by the Committee of Sponsoring Organizations of the Treadway Commission (2013framework).
A material weakness is a deficiency, or a combination of deficiencies, in internal control over financialreporting, such that there is a reasonable possibility that a material misstatement of the company's financial statementswill not be prevented or detected on a timely basis. ABB did not maintain adequate segregation of duties in the treasuryfunction in its South Korean subsidiary and failed to identify certain inappropriate access levels to the local enterpriseresource planning (ERP) system. In addition, ABB failed to safeguard physical access to the signature seals of thesubsidiary in South Korea and prevent the Company from being bound to unauthorized financial contracts, resulting inundetected financial obligations. ABB also failed to provide adequate management oversight and review of the localtreasury activities. As a result, ABB did not maintain effective controls over the safeguarding of cash and other treasuryactivities, including controls relating to entering into financial contracts. Management has concluded that thesedeficiencies in the operation of internal controls constituted a material weakness.
Based on this evaluation, management has concluded that, as a result of the material weakness described above, internal control over financial reporting was not effective as of December 31, 2016.
Ernst & Young AG, the independent registered public accounting firmconsolidated financial statements included in this Form 20-F, has issued an opinion on the effectiveness of ABB sinternal control over financial reporting as of December 31, 2016, which is included on page F-4 of this Annual Report.
/s/ ULRICH SPIESSHOFER
Chief Executive Officer
/s/ ERIC ELZVIKChief Financial Officer
Zurich, March 10, 2017

F-3
Report of Independent Registered Public Accounting Firm
To the Board of Directors and Stockholders of ABB Ltd
We have audited the accompanying consolidated balance sheets of ABB Ltd as of December 31, 2016 and2015, and the related consolidated statements of income, comprehensive income, cash flows and changes in
31, 2016. These financial statements are
these financial statements based on our audits.
We conducted our audits in accordance with the standards of the Public Company Accounting Oversight Board(United States). Those standards require that we plan and perform the audit to obtain reasonable assurance aboutwhether the financial statements are free of material misstatement. An audit includes examining, on a test basis,evidence supporting the amounts and disclosures in the financial statements. An audit also includes assessing theaccounting principles used and significant estimates made by management, as well as evaluating the overall financialstatement presentation. We believe that our audits provide a reasonable basis for our opinion.
In our opinion, the financial statements referred to above present fairly, in all material respects, theconsolidated financial position of ABB Ltd at December 31, 2016 and 2015, and the consolidated results of itsoperations and its cash flows for each of the three years in the period ended December 31, 2016, in conformity with U.S.generally accepted accounting principles.
We also have audited, in accordance with the standards of the Public Company Accounting Oversight Board(United States), ABB Ltd's internal control over financial reporting as of December 31, 2016, based on criteriaestablished in Internal Control Integrated Framework issued by the Committee of Sponsoring Organizations of theTreadway Commission (2013 framework) and our report dated March 10, 2017 expressed an adverse opinion thereon.
/s/ Ernst & Young AG
Zurich, SwitzerlandMarch 10, 2017

F-4
Report of Independent Registered Public Accounting Firm
To the Board of Directors and Stockholders of ABB Ltd
31, 2016, based oncriteria established in Internal Control Integrated Framework issued by the Committee of Sponsoring Organizations ofthe Treadway Commission (2013responsible for maintaining effective internal control over financial reporting, and management is responsible for itsassessment of the effectiveness of internal control over financial reporting included in the accompanying Report of
internal control over financial reporting based on our audit.
We conducted our audit in accordance with the standards of the Public Company Accounting Oversight Board(United States). Those standards require that we plan and perform the audit to obtain reasonable assurance aboutwhether effective internal control over financial reporting was maintained in all material respects. Our audit includedobtaining an understanding of internal control over financial reporting, assessing the risk that a material weakness exists,testing and evaluating the design and operating effectiveness of internal control based on the assessed risk, andperforming such other procedures as we considered necessary in the circumstances. We believe that our audit provides areasonable basis for our opinion.
control over financial reporting is a process designed to provide reasonable assuranceregarding the reliability of financial reporting and the preparation of financial statements for external purposes inaccordance with generally accepted accounting princincludes those policies and procedures that (1) pertain to the maintenance of records that, in reasonable detail, accuratelyand fairly reflect the transactions and dispositions of the assets of the company; (2) provide reasonable assurance thattransactions are recorded as necessary to permit preparation of financial statements in accordance with generallyaccepted accounting principles, and that receipts and expenditures of the company are being made only in accordancewith authorizations of management and directors of the company; and (3) provide reasonable assurance regarding
material effect on the financial statements.
Because of its inherent limitations, internal control over financial reporting may not prevent or detectmisstatements. Also, projections of any evaluation of effectiveness to future periods are subject to the risk that controlsmay become inadequate because of changes in conditions, or that the degree of compliance with the policies orprocedures may deteriorate.
A material weakness is a deficiency, or combination of deficiencies, in internal control over financial reporting,
not be prevented or detected on a timely basis. The following material weakness has been identified and included inmthe South Korean subsidiary related to inadequate segregation of duties and inappropriate access levels to the localenterprise resource planning (ERP) system. Further, they failed to safeguard physical access to the signature seals andprevent the Company from being bound to unauthorized financial contracts, resulting in undetected financial obligations.Management also failed to provide adequate management oversight and review of the local treasury activities. We alsohave audited, in accordance with the standards of the Public Company Accounting Oversight Board (United States), theconsolidated balance sheets of ABB Ltd as of December 31, 2016 and 2015, and the related consolidated statements of
ended December 31, 2016. This material weakness was considered in determining the nature, timing and extent of audittests applied in our audit of the 2016 financial statements, and this report does not affect our report dated March 10,2017, which expressed an unqualified opinion on those financial statements.
In our opinion, because of the effect of the material weakness described above on the achievement of theobjectives of the control criteria, ABB Ltd has not maintained effective internal control over financial reporting as ofDecember 31, 2016, based on the COSO criteria.
/s/ Ernst & Young AG
Zurich, SwitzerlandMarch 10, 2017
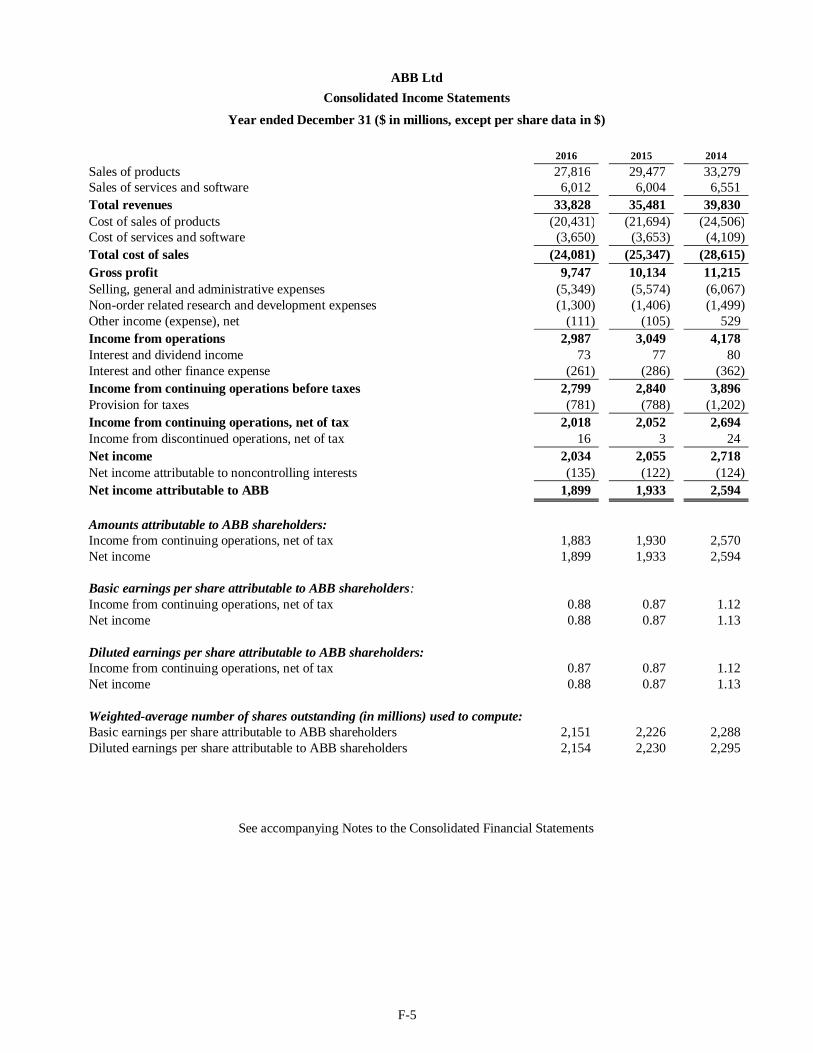
F-5
ABB LtdConsolidated Income Statements
Year ended December 31 ($ in millions, except per share data in $)
2016 2015 2014Sales of products 27,816 29,477 33,279Sales of services and software 6,012 6,004 6,551Total revenues 33,828 35,481 39,830Cost of sales of products (20,431) (21,694) (24,506)Cost of services and software (3,650) (3,653) (4,109)Total cost of sales (24,081) (25,347) (28,615)Gross profit 9,747 10,134 11,215Selling, general and administrative expenses (5,349) (5,574) (6,067)Non-order related research and development expenses (1,300) (1,406) (1,499)Other income (expense), net (111) (105) 529Income from operations 2,987 3,049 4,178Interest and dividend income 73 77 80Interest and other finance expense (261) (286) (362)Income from continuing operations before taxes 2,799 2,840 3,896Provision for taxes (781) (788) (1,202)Income from continuing operations, net of tax 2,018 2,052 2,694Income from discontinued operations, net of tax 16 3 24Net income 2,034 2,055 2,718Net income attributable to noncontrolling interests (135) (122) (124)Net income attributable to ABB 1,899 1,933 2,594
Amounts attributable to ABB shareholders:Income from continuing operations, net of tax 1,883 1,930 2,570Net income 1,899 1,933 2,594
Basic earnings per share attributable to ABB shareholders:Income from continuing operations, net of tax 0.88 0.87 1.12Net income 0.88 0.87 1.13
Diluted earnings per share attributable to ABB shareholders:Income from continuing operations, net of tax 0.87 0.87 1.12Net income 0.88 0.87 1.13
Weighted-average number of shares outstanding (in millions) used to compute:Basic earnings per share attributable to ABB shareholders 2,151 2,226 2,288Diluted earnings per share attributable to ABB shareholders 2,154 2,230 2,295
See accompanying Notes to the Consolidated Financial Statements

F-6
ABB LtdConsolidated Statements of Comprehensive Income
Year ended December 31 ($ in millions)
2016 2015 2014
Net income 2,034 2,055 2,718
Other comprehensive income (loss), net of tax:
Foreign currency translation adjustments (474) (1,058) (1,680)
Available-for-sale securities:Net unrealized gains (losses) arising during the year (7) (9)Reclassification adjustments for net (gains) losses included in net income 1 15Unrealized gains (losses) on available-for-sale securities (6) 6Pension and other postretirement plans:Prior service (costs) credits arising during the year (40) 88 (3)Net actuarial gains (losses) arising during the year 44 210 (614)Amortization of prior service cost included in net income 26 26 17Amortization of net actuarial loss included in net income 62 82 81Net losses from pension settlements included in net income 26 9 (2)Pension and other postretirement plan adjustments 118 415 (521)Cash flow hedge derivatives:Net unrealized gains (losses) arising during the year 16 (20) (52)Reclassification adjustments for net (gains) losses included in net income (6) 30 9Unrealized gains (losses) of cash flow hedge derivatives 10 10 (43)
Total other comprehensive income (loss), net of tax (346) (639) (2,238)
Total comprehensive income, net of tax 1,688 1,416 480Comprehensive income attributable to noncontrolling interests, net of tax (118) (100) (115)Total comprehensive income, net of tax, attributable to ABB 1,570 1,316 365
See accompanying Notes to the Consolidated Financial Statements

F-7
ABB LtdConsolidated Balance Sheets
December 31 ($ in millions, except share data)
2016 2015Cash and equivalents 3,644 4,565Marketable securities and short-term investments 1,953 1,633Receivables, net 9,696 10,061Inventories, net 4,347 4,757Prepaid expenses 176 225Deferred taxes 888 881Other current assets 688 638Assets held for sale 548Total current assets 21,940 22,760
Property, plant and equipment, net 4,743 5,276Goodwill 9,501 9,671Other intangible assets, net 1,996 2,337Prepaid pension and other employee benefits 90 68Investments in equity-accounted companies 170 178Deferred taxes 527 423Other non-current assets 532 643Total assets 39,499 41,356
Accounts payable, trade 4,446 4,342Billings in excess of sales 1,241 1,375Short-term debt and current maturities of long-term debt 1,003 1,454Advances from customers 1,398 1,598Deferred taxes 258 249Provisions for warranties 1,142 1,089Other provisions 1,765 1,920Other current liabilities 3,936 3,817Liabilities held for sale 218Total current liabilities 15,407 15,844
Long-term debt 5,800 5,985Pension and other employee benefits 1,834 1,924Deferred taxes 957 965Other non-current liabilities 1,604 1,650Total liabilities 25,602 26,368
Commitments and contingencies
equity:Capital stock and additional paid-in capital(2,214,743,264 and 2,314,743,264 issued shares at December 31, 2016 and 2015, respectively) 216 1,444Retained earnings 19,925 20,476Accumulated other comprehensive loss (5,187) (4,858)Treasury stock, at cost(76,036,429 and 123,118,123 shares at December 31, 2016 and 2015, respectively) (1,559) (2,581)
13,395 14,481Noncontrolling interests 502 507
13,897 14,98839,499 41,356
See accompanying Notes to the Consolidated Financial Statements

F-8
ABB LtdConsolidated Statements of Cash FlowsYear ended December 31 ($ in millions)
2016 2015 2014Operating activities:Net income 2,034 2,055 2,718Adjustments to reconcile net income to net cash provided by operating activities:
Depreciation and amortization 1,135 1,160 1,305Deferred taxes (147) (219) 65Net loss from derivatives and foreign exchange 10 15 167Net gain from sale of property, plant and equipment (38) (26) (17)Net loss (gain) from sale of businesses 10 20 (543)Share-based payment arrangements 54 61 73Other 112 94 55Changes in operating assets and liabilities:
Trade receivables, net 10 162 (12)Inventories, net 115 105 (176)Trade payables 340 (112) 257Accrued liabilities 80 (24) 9Billings in excess of sales (25) 35 (118)Provisions, net 14 330 (127)Advances from customers (163) 106 39Income taxes payable and receivable 125 (32) (13)Other assets and liabilities, net 177 88 163
Net cash provided by operating activities 3,843 3,818 3,845Investing activities:Purchases of marketable securities (available-for-sale) (1,214) (1,925) (1,430)Purchases of short-term investments (3,092) (614) (1,465)Purchases of property, plant and equipment and intangible assets (831) (876) (1,026)Acquisition of businesses (net of cash acquired) and increases in cost- and equity-accounted
companies (26) (56) (70)Proceeds from sales of marketable securities (available-for-sale) 1,057 434 361Proceeds from maturity of marketable securities (available-for-sale) 539 1,022 523Proceeds from short-term investments 2,241 653 1,011Proceeds from sales of property, plant and equipment 61 68 33Proceeds from sales of businesses (net of transaction costs and cash disposed) and cost- and
equity-accounted companies (1) 69 1,110Net cash from settlement of foreign currency derivatives (57) 231 (179)Other investing activities 18 20 11Net cash used in investing activities (1,305) (974) (1,121)Financing activities:Net changes in debt with maturities of 90 days or less (152) 3 (103)Increase in debt 912 68 150Repayment of debt (1,249) (101) (90)Delivery of shares 192 107 38Purchase of treasury stock (1,299) (1,487) (1,003)Dividends paid (1,357) (1,841)Reduction in nominal value of common shares paid to shareholders (1,610) (392)Dividends paid to noncontrolling shareholders (122) (137) (132)Other financing activities (27) (84) (43)Net cash used in financing activities (3,355) (3,380) (3,024)Effects of exchange rate changes on cash and equivalents (104) (342) (278)Net change in cash and equivalents continuing operations (921) (878) (578)Cash and equivalents, beginning of period 4,565 5,443 6,021Cash and equivalents, end of period 3,644 4,565 5,443Supplementary disclosure of cash flow information:Interest paid 213 221 259Taxes paid 814 1,043 1,155
See accompanying Notes to the Consolidated Financial Statements

F-9
ABB Ltd
Years ended December 31, 2016, 2015 and 2014 ($ in millions)Accumulated other comprehensive loss
Unrealized Pension UnrealizedCapital gains and other gains Total
stock and Foreign (losses) on post- (losses) accumulatedadditional currency available- retirement of cash other Total ABB Non- Total
paid-in Retained translation for-sale plan flow hedge comprehensive Treasury controllingcapital earnings adjustments securities adjustments derivatives loss stock equity interests equity
Balance at January 1, 2014 1,750 19,186 (431) 7 (1,610) 22 (2,012) (246) 18,678 530 19,208Comprehensive income:
Net income 2,594 2,594 124 2,718Foreign currency translation
adjustments, net of tax (1,671) (1,671) (1,671) (9) (1,680)Effect of change in fair value of
available-for-sale securities, net of tax 6 6 6 6Unrecognized income (expense)
related to pensions and otherpostretirement plans, net of tax (521) (521) (521) (521)
Change in derivatives qualifying ascash flow hedges, net of tax (43) (43) (43) (43)
Total comprehensive income 365 115 480Changes in noncontrolling interests (34) (34) 33 (1)Dividends paid to noncontrolling
shareholders (132) (132)Dividends paid (1,841) (1,841) (1,841)Share-based payment arrangements 73 73 73Purchase of treasury stock (1,015) (1,015) (1,015)Delivery of shares (17) 55 38 38Call options 5 5 5Balance at December 31, 2014 1,777 19,939 (2,102) 13 (2,131) (21) (4,241) (1,206) 16,269 546 16,815Comprehensive income:
Net income 1,933 1,933 122 2,055Foreign currency translation
adjustments, net of tax (1,033) (1,033) (1,033) (25) (1,058)Effect of change in fair value of
available-for-sale securities, net of tax (6) (6) (6) (6)Unrecognized income (expense)
related to pensions and otherpostretirement plans, net of tax 412 412 412 3 415
Change in derivatives qualifying ascash flow hedges, net of tax 10 10 10 10
Total comprehensive income 1,316 100 1,416Changes in noncontrolling interests (30) (25) (55) (2) (57)Dividends paid to noncontrolling
shareholders (137) (137)Dividends paid (1,317) (1,317) (1,317)Reduction in nominal value of common
shares paid to shareholders (349) (54) (403) (403)Share-based payment arrangements 61 61 61Purchase of treasury stock (1,501) (1,501) (1,501)Delivery of shares (19) 126 107 107Call options 4 4 4Balance at December 31, 2015 1,444 20,476 (3,135) 7 (1,719) (11) (4,858) (2,581) 14,481 507 14,988Comprehensive income:
Net income 1,899 1,899 135 2,034Foreign currency translation
adjustments, net of tax (457) (457) (457) (17) (474)Effect of change in fair value of
available-for-sale securities, net of taxUnrecognized income (expense)
related to pensions and otherpostretirement plans, net of tax 118 118 118 118
Change in derivatives qualifying ascash flow hedges, net of tax 10 10 10 10
Total comprehensive income 1,570 118 1,688Changes in noncontrolling interests (1) (1)Dividends paid to noncontrolling
shareholders (122) (122)Reduction in nominal value of common
shares paid to shareholders (1,224) (402) (1,626) (1,626)Cancellation of treasury shares (40) (2,007) 2,047Share-based payment arrangements 54 54 54Purchase of treasury stock (1,280) (1,280) (1,280)Delivery of shares (22) (41) 255 192 192Call options 4 4 4Balance at December 31, 2016 216 19,925 (3,592) 7 (1,601) (1) (5,187) (1,559) 13,395 502 13,897
See accompanying Notes to the Consolidated Financial Statements

F-10
Note 1 The Company
ABB Ltd and its subsidiaries (collectively, the Company) together form a pioneering technology leader inelectrification products, robotics and motion, industrial automation and power grids, serving customers in utilities,industry and transport & infrastructure globally.
Note 2 Significant accounting policies
The following is a summary of significant accounting policies followed in the preparation of theseConsolidated Financial Statements.
Basis of presentation
The Consolidated Financial Statements are prepared in accordance with United States of America (UnitedStates or U.S.) generally accepted accounting principles (U.S. GAAP) and are presented in United States dollars ($ orUSD) unless otherwise stated. The par value of capital stock is denominated in Swiss francs.
Reclassifications
Certain amounts reported for prior years in the Consolidated Financial Statements and the accompanying Notesprimarily relate to the change in the
definition of segment pro 23).
Scope of consolidation
The Consolidated Financial Statements include the accounts of ABB Ltd and companies which are directly orindirectly controlled by ABB Ltd. Additionally, the Company consolidates variable interest entities if it has determinedthat it is the primary beneficiary. Intercompany accounts and transactions are eliminated. Investments in joint venturesand affiliated companies in which the Company has the ability to exercise significant influence over operating andfinancial policies (generally through direct or indirect ownership of 20 percent to 50 percent of the voting rights), arerecorded in the Consolidated Financial Statements using the equity method of accounting.
Operating cycle
A portion of the Company s activities (primarily long-term construction activities) has an operating cycle thatexceeds one year. For classification of current assets and liabilities related to such activities, the Company elected to usethe duration of the individual contracts as its operating cycle. Accordingly, there are accounts receivable, inventories andprovisions related to these contracts which will not be realized within one year that have been classified as current.
Use of estimates
The preparation of financial statements in conformity with U.S. GAAP requires management to makeassumptions and estimates that directly affect the amounts reported in the Consolidated Financial Statements and theaccompanying Notes. The most significant, difficult and subjective of such accounting assumptions and estimatesinclude:
estimates used to record expected costs for employee severance in connection with restructuring programs,
estimates used to record warranty obligations,
assumptions and projections, principally related to future material, labor and project-related overheadcosts, used in determining the percentage-of-completion on projects,
estimates of loss contingencies associated with litigation or threatened litigation and other claims andinquiries, environmental damages, product warranties, self-insurance reserves, regulatory and otherproceedings,

F-11
assumptions used in the calculation of pension and postretirement benefits and the fair value of pensionplan assets,
estimates to determine valuation allowances for deferred tax assets and amounts recorded for uncertain taxpositions,
growth rates, discount rates and other assumptions used to determine impairment of long-lived assets andin testing goodwill for impairment,
assumptions used in determining inventory obsolescence and net realizable value,
estimates and assumptions used in determining the fair values of assets and liabilities assumed in businesscombinations, and
assessment of the allowance for doubtful accounts.
The actual results and outcomes may differ from the Company s estimates and assumptions.
Cash and equivalents
Cash and equivalents include highly liquid investments with maturities of three months or less at the date ofacquisition.
Currency and other local regulatory limitations related to the transfer of funds exist in a number of countrieswhere the Company operates. Funds, other than regular dividends, fees or loan repayments, cannot be readily transferredabroad from these countries and are therefore deposited and used for working capital needs locally. These funds areincluded in cash and equivalents as they are not considered restricted.
Marketable securities and short-term investments
Management determines the appropriate classification of held-to-maturity and available-for-sale securities atthe time of purchase. At each reporting date, the appropriateness of the classification of the Company s investments indebt and equity securities is reassessed. Debt securities are classified as held-to-maturity when the Company has thepositive intent and ability to hold the securities to maturity. Held-to-maturity securities are stated at amortized cost,adjusted for accretion of discounts or amortization of premiums to maturity computed under the effective interestmethod. Such accretion or amortization is included in Interest and dividend income . Marketable debt securities notclassified as held-to-maturity and equity securities that have readily determinable fair values are classified asavailable-for-sale and reported at fair value.
Unrealized gains and losses on available-for-sale securities are excluded from the determination of earnings andare instead recognized in the Accumulated other comprehensive loss component of stockholders equity, net of tax,until realized. Realized gains and losses on available-for-sale securities are computed based upon the historical cost ofthese securities, using the specific identification method.
Marketable debt securities are generally classified as either Cash and equivalents or Marketable securitiesand short-term investments according to their maturity at the time of acquisition.
Marketable equity securities are generally classified as Marketable securities and short-term investments ,however any marketable securities held as a long-term investment rather than as an investment of excess liquidity, areclassified as Other non-current assets .
The Company performs a periodic review of its debt and equity securities to determine whether another-than-temporary impairment has occurred. Generally, when an individual security has been in an unrealized lossposition for an extended period of time, the Company evaluates whether an impairment has occurred. The evaluation isbased on specific facts and circumstances at the time of assessment, which include general market conditions, and theduration and extent to which the fair value is below cost.

F-12
If the fair value of a debt security is less than its amortized cost, then an other-than-temporary impairment forthe difference is recognized if (i) the Company has the intent to sell the security, (ii) it is more likely than not that theCompany will be required to sell the security before recovery of its amortized cost base or (iii) a credit loss exists insofaras the Company does not expect to recover the entire recognized amortized cost of the security. Such impairmentcharges are generally recognized in Interest and other finance expense . If the impairment is due to factors other thancredit losses, and the Company does not intend to sell the security and it is not more likely than not that it will berequired to sell the security before recovery of the security s amortized cost, such impairment charges are recorded inAccumulated other comprehensive loss .
In addition, for equity securities, the Company assesses whether the cost value will recover within thenear-term and whether the Company has the intent and ability to hold that equity security until such recovery occurs. Ifan other-than-temporary impairment is identified, the security is written down to its fair value and the related losses arerecognized in Interest and other finance expense , unless the impairment relates to equity securities classified as Othernon-current assets , in which case the impairment is reported in Other income (expense), net .
Accounts receivable and allowance for doubtful accounts
Accounts receivable are recorded at the invoiced amount. The Company has a group-wide policy on themanagement of credit risk. The policy includes a credit assessment methodology to assess the creditworthiness ofcustomers and assign to those customers a risk category. Third-party agencies ratings are considered, if available. Forcustomers where agency ratings are not available, the customer s most recent financial statements, payment history andother relevant information are considered in the assignment to a risk category. Customers are assessed at least annuallyor more frequently when information on significant changes in the customers financial position becomes known. Inaddition to the assignment to a risk category, a credit limit per customer is set.
The allowance for doubtful accounts is the Company s best estimate of the amount of probable credit losses inexisting accounts receivable. The Company determines the allowance based on historical write-off experience andcustomer specific data. If an amount has not been settled within its contractual payment term then it is considered pastdue. The Company reviews the allowance for doubtful accounts regularly and past due balances are reviewed forcollectability. Account balances are charged off against the related allowance when the Company believes that theamount will not be recovered.
The Company, in its normal course of business, transfers receivables to third parties, generally withoutrecourse. The transfer is accounted for as a sale when the Company has surrendered control over the receivables. Controlis deemed to have been surrendered when (i) the transferred receivables have been put presumptively beyond the reachof the Company and its creditors, even in bankruptcy or other receivership, (ii) the third-party transferees have the rightto pledge or exchange the transferred receivables, and (iii) the Company has relinquished effective control over thetransferred receivables and does not retain the ability or obligation to repurchase or redeem the transferred receivables.At the time of sale, the sold receivables are removed from the Consolidated Balance Sheets and the related cash inflowsare classified as operating activities in the Consolidated Statements of Cash Flows. Costs associated with the sale ofreceivables, including the related gains and losses from the sales, are included in Interest and other finance expense .Transfers of receivables that do not meet the requirements for treatment as sales are accounted for as secured borrowingsand the related cash flows are classified as financing activities in the Consolidated Statements of Cash Flows.
Concentrations of credit risk
The Company sells a broad range of products, systems, services and software to a wide range of industrial,commercial and utility customers as well as various government agencies and quasi-governmental agencies throughoutthe world. Concentrations of credit risk with respect to accounts receivable are limited, as the Company s customer baseis comprised of a large number of individual customers. Ongoing credit evaluations of customers financial positions areperformed to determine whether the use of credit support instruments such as guarantees, letters of credit or creditinsurance are necessary; collateral is not generally required. The Company maintains reserves for potential credit lossesas discussed above in Accounts receivable and allowance for doubtful accounts . Such losses, in the aggregate, are inline with the Company s expectations.
It is the Company s policy to invest cash in deposits with banks throughout the world with certain minimumcredit ratings and in high quality, low risk, liquid investments. The Company actively manages its credit risk byroutinely reviewing the creditworthiness of the banks and the investments held. The Company has not incurredsignificant credit losses related to such investments.

F-13
The Company s exposure to credit risk on derivative financial instruments is the risk that the counterparty willfail to meet its obligations. To reduce this risk, the Company has credit policies that require the establishment andperiodic review of credit limits for individual counterparties. In addition, the Company has entered into close-out nettingagreements with most derivative counterparties. Close-out netting agreements provide for the termination, valuation andnet settlement of some or all outstanding transactions between two counterparties on the occurrence of one or morepre-defined trigger events. In the Consolidated Financial Statements derivative transactions are presented on a grossbasis.
Revenue recognition
The Company generally recognizes revenues for the sale of goods when persuasive evidence of an arrangementexists, delivery has occurred, the price is fixed or determinable and collectability is reasonably assured. With regards tothe sale of products, delivery is not considered to have occurred, and therefore no revenues are recognized, until thecustomer has taken title to the products and assumed the risks and rewards of ownership of the products specified in thepurchase order or sales agreement. Generally, the transfer of title and risks and rewards of ownership are governed bythe contractually-defined shipping terms. The Company uses various International Commercial shipping terms (aspromulgated by the International Chamber of Commerce) in its sales of products to third-party customers, such as ExWorks (EXW), Free Carrier (FCA) and Delivered Duty Paid (DDP). Subsequent to delivery of the products, theCompany generally has no further contractual performance obligations that would preclude revenue recognition.
Revenues under long-term construction-type contracts are generally recognized using thepercentage-of-completion method of accounting. The Company principally uses the cost-to-cost method to measureprogress towards completion on contracts. Under this method, progress of contracts is measured by actual costs incurredin relation to the Company s best estimate of total estimated costs, which are reviewed and updated routinely forcontracts in progress. The cumulative effect of any change in estimate is recorded in the period when the change inestimate is determined.
Short-term construction-type contracts, or long-term construction-type contracts for which reasonablydependable estimates cannot be made or for which inherent hazards make estimates difficult, are accounted for under thecompleted-contract method. Revenues under the completed-contract method are recognized upon substantialcompletion that is: acceptance by the customer, compliance with performance specifications demonstrated in a factoryacceptance test or similar event.
For non construction-type contracts that contain customer acceptance provisions, revenue is deferred untilcustomer acceptance occurs or the Company has demonstrated the customer-specified objective criteria have been metor the contractual acceptance period has lapsed.
Revenues from service transactions are recognized as services are performed. For long-term service contracts,revenues are recognized on a straight-line basis over the term of the contract or, if the performance pattern is other thanstraight-line, as the services are provided. Service revenues reflect revenues earned from the Company s activities inproviding services to customers primarily subsequent to the sale and delivery of a product or complete system. Suchrevenues consist of maintenance-type contracts, field service activities that include personnel and accompanying spareparts, and installation and commissioning of products as a stand-alone service or as part of a service contract.
Revenues for software license fees are recognized when persuasive evidence of a non-cancelable licenseagreement exists, delivery has occurred, the license fee is fixed or determinable, and collection is probable. In softwarearrangements that include rights to multiple software products and/or services, the total arrangement fee is allocatedusing the residual method. Under this method, revenue is allocated to the undelivered elements based on vendor-specificobjective evidence (VSOE) of the fair value of such undelivered elements and the residual amounts of revenue areallocated to the delivered elements. Elements included in multiple element arrangements may consist of softwarelicenses, maintenance (which includes customer support services and unspecified upgrades), hosting, and consultingservices. VSOE is based on the price generally charged when an element is sold separately or, in the case of an elementnot yet sold separately, the price established by management, if it is probable that the price, once established, will notchange once the element is sold separately. If VSOE does not exist for an undelivered element, the total arrangement feewill be recognized as revenue over the life of the contract or upon delivery of the undelivered element.
F-14
The Company offers multiple element arrangements to meet its customers needs. These arrangements mayinvolve the delivery of multiple products and/or performance of services (such as installation and training) and thedelivery and/or performance may occur at different points in time or over different periods of time. Deliverables of suchmultiple element arrangements are evaluated to determine the unit of accounting and if certain criteria are met, theCompany allocates revenues to each unit of accounting based on its relative selling price. A hierarchy of selling prices isused to determine the selling price of each specific deliverable that includes VSOE (if available), third-party evidence (ifVSOE is not available), or estimated selling price if neither of the first two is available. The estimated selling pricereflects the Company s best estimate of what the selling prices of elements would be if the elements were sold on astand-alone basis. Revenue is allocated between the elements of an arrangement at the inception of the arrangement.Such arrangements generally include industry-specific performance and termination provisions, such as in the event ofsubstantial delays or non-delivery.
Revenues are reported net of customer rebates and similar incentives. Taxes assessed by a governmentalauthority that are directly imposed on revenue-producing transactions between the Company and its customers, such assales, use, value-added and some excise taxes, are excluded from revenues.
Contract loss provisions
Losses on contracts are recognized in the period when they are identified and are based upon the anticipatedexcess of contract costs over the related contract revenues.
Shipping and handling costs
Shipping and handling costs are recorded as a component of cost of sales.
Inventories
Inventories are stated at the lower of cost or net realizable value. Cost is determined using the first-in, first-outmethod, the weighted-average cost method, or in certain circumstances (for example, where the completed-contractmethod of revenue recognition is used) the specific identification method. Inventoried costs are stated at acquisition costor actual production cost, including direct material and labor and applicable manufacturing overheads. Adjustments toreduce the cost of inventory to its net realizable value are made, if required, for decreases in sales prices, obsolescenceor similar reductions in value.
Impairment of long-lived assets
Long-lived assets that are held and used are assessed for impairment when events or circumstances indicate thatthe carrying amount of the asset may not be recoverable. If the asset s net carrying value exceeds the asset s netundiscounted cash flows expected to be generated over its remaining useful life including net proceeds expected fromdisposition of the asset, if any, the carrying amount of the asset is reduced to its estimated fair value. The estimated fairvalue is determined using a market, income and/or cost approach.
Property, plant and equipment
Property, plant and equipment is stated at cost, less accumulated depreciation and is depreciated using thestraight-line method. The estimated useful lives of the assets are generally as follows:
factories and office buildings: 30 to 40 years,
other facilities: 15 years,
machinery and equipment: 3 to 15 years,
furniture and office equipment: 3 to 8 years, and
leasehold improvements are depreciated over their estimated useful life or, for operating leases, over thelease term, if shorter.

F-15
Goodwill and other intangible assets
Goodwill is reviewed for impairment annually as of October 1, or more frequently if events or circumstancesindicate that the carrying value may not be recoverable.
Goodwill is evaluated for impairment at the reporting unit level. A reporting unit is an operating segment orone level below an operating segment. For the annual impairment review in 2016, the reporting units were the same asthe operating segments for Electrification Products, Discrete Automation and Motion and Power Grids, while for theProcess Automation operating segment, the reporting units were determined to be one level below the operatingsegment.
When evaluating goodwill for impairment, the Company uses either a qualitative or quantitative assessmentmethod for each reporting unit. The qualitative assessment involves determining, based on an evaluation of qualitativefactors, if it is more likely than not that the fair value of a reporting unit is less than its carrying value. If, based on thisqualitative assessment, it is determined to be more likely than not that the reporting unit s fair value is less than itscarrying value, the two-step quantitative impairment test (described below) is performed, otherwise no further analysis isrequired. If the Company elects not to perform the qualitative assessment for a reporting unit, the two-step quantitativeimpairment test is performed.
The two-step quantitative impairment test calculates the fair value of a reporting unit (based on the incomeapproach whereby the fair value of a reporting unit is calculated based on the present value of future cash flows) andcompares it to the reporting unit s carrying value. If the carrying value of the net assets of a reporting unit exceeds thefair value of the reporting unit then the Company performs the second step of the impairment test to determine theimplied fair value of the reporting unit s goodwill. If the carrying value of the reporting unit s goodwill exceeds itsimplied fair value, the Company records an impairment charge equal to the difference.
The cost of acquired intangible assets with a finite life is amortized using a method of amortization that reflectsthe pattern of intangible assets expected contributions to future cash flows. If that pattern cannot be reliably determined,the straight-line method is used. The amortization periods range from 3 to 5 years for software and from 5 to 20 yearsfor customer-, technology- and marketing-related intangibles. Intangible assets with a finite life are tested forimpairment upon the occurrence of certain triggering events.
Capitalized software costs
Software for internal use
Costs incurred in the application development stage until the software is substantially complete are capitalizedand are amortized on a straight-line basis over the estimated useful life of the software, typically ranging from 3 to5 years.
Software for sale
Costs incurred after the software has demonstrated its technological feasibility until the product is available forgeneral release to the customers are capitalized and amortized on a straight-line basis over the estimated life of theproduct. The Company periodically performs an evaluation to determine that the unamortized cost of software to be solddoes not exceed the net realizable value. If the unamortized cost of software to be sold exceeds its net realizable value,the Company records an impairment charge equal to the difference.
Derivative financial instruments and hedging activities
The Company uses derivative financial instruments to manage currency, commodity, interest rate and equityexposures, arising from its global operating, financing and investing activities (see Note 5).
The Company recognizes all derivatives, other than certain derivatives indexed to the Company s own stock, atfair value in the Consolidated Balance Sheets. Derivatives that are not designated as hedging instruments are reported atfair value with derivative gains and losses reported through earnings and classified consistent with the nature of theunderlying transaction.

F-16
If the derivatives are designated as a hedge, depending on the nature of the hedge, changes in the fair value ofthe derivatives will either be offset against the change in fair value of the hedged item attributable to the risk beinghedged through earnings (in the case of a fair value hedge) or recognized in Accumulated other comprehensive lossuntil the hedged item is recognized in earnings (in the case of a cash flow hedge). The ineffective portion of aderivative s change in fair value is immediately recognized in earnings consistent with the classification of the hedgeditem. Where derivative financial instruments have been designated as cash flow hedges of forecasted transactions andsuch forecasted transactions are no longer probable of occurring, hedge accounting is discontinued and any derivativegain or loss previously included in Accumulated other comprehensive loss is reclassified into earnings consistent withthe nature of the original forecasted transaction. Gains or losses from derivatives designated as hedging instruments in afair value hedge are reported through earnings and classified consistent with the nature of the underlying hedgedtransaction.
Certain commercial contracts may grant rights to the Company or the counterparties, or contain otherprovisions that are considered to be derivatives. Such embedded derivatives are assessed at inception of the contract anddepending on their characteristics, accounted for as separate derivative instruments and shown at their fair value in thebalance sheet with changes in their fair value reported in earnings consistent with the nature of the commercial contractto which they relate.
Derivatives are classified in the Consolidated Statements of Cash Flows in the same section as the underlyingitem. Cash flows from the settlement of undesignated derivatives used to manage the risks of different underlying itemson a net basis, are classified within Net cash provided by operating activities , as the underlying items are primarilyoperational in nature. Other cash flows on the settlement of derivatives are recorded within Net cash used in investingactivities .
Leases
The Company leases primarily real estate and office equipment. Rental expense for operating leases is recordedon a straight-line basis over the life of the lease term. Lease transactions where substantially all risks and rewardsincident to ownership are transferred from the lessor to the lessee are accounted for as capital leases. All other leases areaccounted for as operating leases. Amounts due under capital leases are recorded as a liability. The interest in assetsacquired under capital leases is recorded as property, plant and equipment. Depreciation and amortization of assetsrecorded under capital leases is included in depreciation and amortization expense.
Translation of foreign currencies and foreign exchange transactions
The functional currency for most of the Company s subsidiaries is the applicable local currency. The translationfrom the applicable functional currencies into the Company s reporting currency is performed for balance sheet accountsusing exchange rates in effect at the balance sheet date and for income statement accounts using average exchange ratesprevailing during the year. The resulting translation adjustments are excluded from the determination of earnings and arerecognized in Accumulated other comprehensive loss until the subsidiary is sold, substantially liquidated or evaluatedfor impairment in anticipation of disposal.
Foreign currency exchange gains and losses, such as those resulting from foreign currency denominatedreceivables or payables, are included in the determination of earnings, except as they relate to intercompany loans thatare equity-like in nature with no reasonable expectation of repayment, which are recognized in Accumulated othercomprehensive loss . Exchange gains and losses recognized in earnings are included in Total revenues , Total cost ofsales , Selling, general and administrative expenses or Interest and other finance expense consistent with the natureof the underlying item.
Income taxes
The Company uses the asset and liability method to account for deferred taxes. Under this method, deferred taxassets and liabilities are determined based on temporary differences between the financial reporting and the tax bases ofassets and liabilities. Deferred tax assets and liabilities are measured using enacted tax rates and laws that are expectedto be in effect when the differences are expected to reverse. The Company records a deferred tax asset when itdetermines that it is more likely than not that the deduction will be sustained based upon the deduction s technical merit.Deferred tax assets and liabilities that can be offset against each other are reported on a net basis. A valuation allowanceis recorded to reduce deferred tax assets to the amount that is more likely than not to be realized.

F-17
Deferred taxes are provided on unredeemed retained earnings of the Company s subsidiaries. However,deferred taxes are not provided on such unredeemed retained earnings to the extent it is expected that the earnings arepermanently reinvested. Such earnings may become taxable upon the sale or liquidation of these subsidiaries or upon theremittance of dividends.
The Company operates in numerous tax jurisdictions and, as a result, is regularly subject to audit by taxauthorities. The Company provides for tax contingencies whenever it is deemed more likely than not that a tax asset hasbeen impaired or a tax liability has been incurred for events such as tax claims or changes in tax laws. Contingencyprovisions are recorded based on the technical merits of the Company s filing position, considering the applicable taxlaws and Organisation for Economic Co-operation and Development (OECD) guidelines and are based on itsevaluations of the facts and circumstances as of the end of each reporting period.
The Company applies a two-step approach to recognize and measure uncertainty in income taxes. The first stepis to evaluate the tax position for recognition by determining if the weight of available evidence indicates that it is morelikely than not that the position will be sustained on audit, including resolution of related appeals or litigation processes,if any. The second step is to measure the tax benefit as the largest amount which is more than 50 percent likely of beingrealized upon ultimate settlement. Uncertain tax positions that could be settled against existing loss carryforwards orincome tax credits are reported net.
The expense related to tax penalties is classified in the Consolidated Income Statements as Provision fortaxes , while interest thereon is classified as Interest and other finance expense .
Research and development
Research and development costs not related to specific customer orders are generally expensed as incurred.
Earnings per share
Basic earnings per share is calculated by dividing income by the weighted-average number of sharesoutstanding during the year. Diluted earnings per share is calculated by dividing income by the weighted-averagenumber of shares outstanding during the year, assuming that all potentially dilutive securities were exercised, if dilutive.Potentially dilutive securities include: outstanding written call options, outstanding options and shares granted subject tocertain conditions under the Company s share-based payment arrangements. See further discussion related to earningsper share in Note 20 and of potentially dilutive securities in Note 18.
Share-based payment arrangements
The Company has various share-based payment arrangements for its employees, which are described morefully in Note 18. Such arrangements are accounted for under the fair value method. For awards that are equity-settled,total compensation is measured at grant date, based on the fair value of the award at that date, and recorded in earningsover the period the employees are required to render service. For awards that are cash-settled, compensation is initiallymeasured at grant date and subsequently remeasured at each reporting period, based on the fair value and vestingpercentage of the award at each of those dates, with changes in the liability recorded in earnings.
Fair value measures
The Company uses fair value measurement principles to record certain financial assets and liabilities on arecurring basis and, when necessary, to record certain non-financial assets at fair value on a non-recurring basis, as wellas to determine fair value disclosures for certain financial instruments carried at amortized cost in the financialstatements. Financial assets and liabilities recorded at fair value on a recurring basis include foreign currency,commodity and interest rate derivatives, as well as cash-settled call options and available-for-sale securities.Non-financial assets recorded at fair value on a non-recurring basis include long-lived assets that are reduced to theirestimated fair value due to impairments.

F-18
Fair value is the price that would be received when selling an asset or paid to transfer a liability in an orderlytransaction between market participants at the measurement date. In determining fair value, the Company uses variousvaluation techniques including the market approach (using observable market data for identical or similar assets andliabilities), the income approach (discounted cash flow models) and the cost approach (using costs a market participantwould incur to develop a comparable asset). Inputs used to determine the fair value of assets and liabilities are definedby a three-level hierarchy, depending on the reliability of those inputs. The Company has categorized its financial assetsand liabilities and non-financial assets measured at fair value within this hierarchy based on whether the inputs to thevaluation technique are observable or unobservable. An observable input is based on market data obtained fromindependent sources, while an unobservable input reflects the Company s assumptions about market data.
The levels of the fair value hierarchy are as follows:
Level 1: Valuation inputs consist of quoted prices in an active market for identical assets or liabilities(observable quoted prices). Assets and liabilities valued using Level 1 inputs includeexchange-traded equity securities, listed derivatives which are actively traded such ascommodity futures, interest rate futures and certain actively traded debt securities.
Level 2: Valuation inputs consist of observable inputs (other than Level 1 inputs) such as actively quotedprices for similar assets, quoted prices in inactive markets and inputs other than quoted pricessuch as interest rate yield curves, credit spreads, or inputs derived from other observable data byinterpolation, correlation, regression or other means. The adjustments applied to quoted pricesor the inputs used in valuation models may be both observable and unobservable. In these cases,the fair value measurement is classified as Level 2 unless the unobservable portion of theadjustment or the unobservable input to the valuation model is significant, in which case the fairvalue measurement would be classified as Level 3. Assets and liabilities valued or disclosedusing Level 2 inputs include investments in certain funds, reverse repurchase agreements,certain debt securities that are not actively traded, interest rate swaps, commodity swaps,cash-settled call options, forward foreign exchange contracts, foreign exchange swaps andforward rate agreements, time deposits, as well as financing receivables and debt.
Level 3: Valuation inputs are based on the Company s assumptions of relevant market data(unobservable input).
Whenever quoted prices involve bid-ask spreads, the Company ordinarily determines fair values based onmid-market quotes. However, for the purpose of determining the fair value of cash-settled call options serving as hedgesof the Company s management incentive plan (MIP), bid prices are used.
When determining fair values based on quoted prices in an active market, the Company considers if the level oftransaction activity for the financial instrument has significantly decreased, or would not be considered orderly. In suchcases, the resulting changes in valuation techniques would be disclosed. If the market is considered disorderly or ifquoted prices are not available, the Company is required to use another valuation technique, such as an incomeapproach.
Disclosures about the Company s fair value measurements of assets and liabilities are included in Note 6.
Contingencies
The Company is subject to proceedings, litigation or threatened litigation and other claims and inquiries, relatedto environmental, labor, product, regulatory, tax (other than income tax) and other matters, and is required to assess thelikelihood of any adverse judgments or outcomes to these matters, as well as potential ranges of probable losses. Adetermination of the provision required, if any, for these contingencies is made after analysis of each individual issue,often with assistance from both internal and external legal counsel and technical experts. The required amount of aprovision for a contingency of any type may change in the future due to new developments in the particular matter,including changes in the approach to its resolution.
F-19
The Company records a provision for its contingent obligations when it is probable that a loss will be incurredand the amount can be reasonably estimated. Any such provision is generally recognized on an undiscounted basis usingthe Company s best estimate of the amount of loss incurred or at the lower end of an estimated range when a single bestestimate is not determinable. In some cases, the Company may be able to recover a portion of the costs relating to theseobligations from insurers or other third parties; however, the Company records such amounts only when it is probablethat they will be collected.
The Company provides for anticipated costs for warranties when it recognizes revenues on the related productsor contracts. Warranty costs include calculated costs arising from imperfections in design, material and workmanship inthe Company s products. The Company makes individual assessments on contracts with risks resulting fromorder-specific conditions or guarantees and assessments on an overall, statistical basis for similar products sold in largerquantities.
The Company may have legal obligations to perform environmental clean-up activities related to land andbuildings as a result of the normal operations of its business. In some cases, the timing or the method of settlement, orboth, are conditional upon a future event that may or may not be within the control of the Company, but the underlyingobligation itself is unconditional and certain. The Company recognizes a provision for these obligations when it isprobable that a liability for the clean-up activity has been incurred and a reasonable estimate of its fair value can bemade. In some cases, a portion of the costs expected to be incurred to settle these matters may be recoverable. An assetis recorded when it is probable that such amounts are recoverable. Provisions for environmental obligations are notdiscounted to their present value when the timing of payments cannot be reasonably estimated.
Pensions and other postretirement benefits
The Company has a number of defined benefit pension and other postretirement plans. The Companyrecognizes an asset for such a plan s overfunded status or a liability for such a plan s underfunded status in itsConsolidated Balance Sheets. Additionally, the Company measures such a plan s assets and obligations that determineits funded status as of the end of the year and recognizes the changes in the funded status in the year in which thechanges occur. Those changes are reported in Accumulated other comprehensive loss .
The Company uses actuarial valuations to determine its pension and postretirement benefit costs and credits.The amounts calculated depend on a variety of key assumptions, including discount rates and expected return on planassets. Current market conditions are considered in selecting these assumptions.
The Company s various pension plan assets are assigned to their respective levels in the fair value hierarchy inaccordance with the valuation principles described in the Fair value measures section above.
See Note 17 for further discussion of the Company s employee benefit plans.
Business combinations
The Company accounts for assets acquired and liabilities assumed in business combinations using theacquisition method and records these at their respective fair values. Contingent consideration is recorded at fair value asan element of purchase price with subsequent adjustments recognized in income.
Identifiable intangibles consist of intellectual property such as trademarks and trade names, customerrelationships, patented and unpatented technology, in-process research and development, order backlog and capitalizedsoftware; these are amortized over their estimated useful lives. Such intangibles are subsequently subject to evaluationfor potential impairment if events or circumstances indicate the carrying amount may not be recoverable. See Goodwilland other intangible assets above. Acquisition-related costs are recognized separately from the acquisition andexpensed as incurred. Upon gaining control of an entity in which an equity method or cost basis investment was held bythe Company, the carrying value of that investment is adjusted to fair value with the related gain or loss recorded inincome. Deferred tax assets and liabilities based on temporary differences between the financial reporting and the taxbase of assets and liabilities as well as uncertain tax positions and valuation allowances on acquired deferred tax assetsassumed in connection with a business combination are initially estimated as of the acquisition date based on facts andcircumstances that existed at the acquisition date. These estimates are subject to change within the measurement period(a period of up to 12 months after the acquisition date during which the acquirer may adjust the provisional acquisitionamounts) with any adjustments to the preliminary estimates being recorded to goodwill. Changes in deferred taxes,uncertain tax positions and valuation allowances on acquired deferred tax assets that occur after the measurement periodare recognized in income.

F-20
New accounting pronouncements
Applicable for current period
Disclosures for investments in certain entities that calculate net asset value per share (or its equivalent)
As of January 1, 2016, the Company adopted an accounting standard update regarding fair value disclosures forcertain investments. Under the update, the Company is no longer required to categorize within the fair value hierarchyany investments for which fair value is measured using the net asset value per share practical expedient. Theamendments also removed the requirement to make certain disclosures for investments that are eligible to be measuredat fair value using the net asset value per share practical expedient. Rather, those disclosures are limited to investmentsfor which the Company has elected to measure the fair value using that practical expedient. This update was appliedretrospectively and did not have a significant impact on the consolidated financial statements.
Simplifying the measurement of inventory
As of January 1, 2016, the Company early-adopted an accounting standard update simplifying the subsequentmeasurement of inventories by replacing the current lower of cost or market test with a lower of cost and net realizablevalue test. The guidance applies only to inventories for which cost is determined by methods other than last-in first-outand the retail inventory methods. Net realizable value is the estimated selling price in the ordinary course of business,less reasonably predictable costs of completion, disposal and transportation. The update was applied prospectively anddid not have a significant impact on the consolidated financial statements.
Applicable for future periods
Revenue from contracts with customers
In May 2014, an accounting standard update was issued to clarify the principles for recognizing revenues fromcontracts with customers. The update, which supersedes substantially all existing revenue recognition guidance, providesa single comprehensive model for recognizing revenues on the transfer of promised goods or services to customers in anamount that reflects the consideration that is expected to be received for those goods or services. Under the standard it ispossible that more judgments and estimates would be required than under existing standards, including identifying theseparate performance obligations in a contract, estimating any variable consideration elements, and allocating thetransaction price to each separate performance obligation. The update also requires additional disclosures about thenature, amount, timing and uncertainty of revenue and cash flows arising from contracts with customers. Further updateswere issued in 2016 to clarify the guidance on identifying performance obligations, licensing and contract costs, toenhance the implementation guidance on principal versus agent considerations and to add other practical expedients.
In August 2015, the effective date for the update was deferred and the update is now effective for the Companyfor annual and interim periods beginning January 1, 2018, and is to be applied either (i) retrospectively to each priorreporting period presented, with the option to elect certain defined practical expedients, or (ii) retrospectively with thecumulative effect of initially applying the update recognized at the date of adoption in retained earnings (with additionaldisclosure as to the impact on individual financial statement lines affected). Early adoption of the standard is permittedfor annual reporting periods beginning after December 15, 2016, including interim reporting periods within thatreporting period.
The Company currently plans to adopt these updates as of January 1, 2018, pursuant to the aforementionedadoption method (ii) and currently does not anticipate these updates will have a significant impact on its consolidatedfinancial statements. The analysis of contracts performed in 2016 resulted in immaterial differences in theidentification of performance obligations compared to the current unit of accounting determination. Except for a limitednumber of contracts where the required criteria are not met, the analysis supports the recognition of revenue over timefollowing the cost-to-cost method under the new revenue recognition standard for those contracts which are followingthe cost-to-cost method under the current revenue recognition model. The Company continues to evaluate the expectedimpacts of the adoption of these updates and the expected impacts are subject to change.

F-21
Balance sheet classification of deferred taxes
In November 2015, an accounting standard update was issued which removes the requirement to separatedeferred tax liabilities and assets into current and non-current amounts and instead requires all such amounts, as well asany related valuation allowance, to be classified as non-current in the balance sheet. This update is effective for theCompany for annual and interim periods beginning January 1, 2017, with early adoption permitted, and is applicableeither prospectively to all deferred tax liabilities and assets or retrospectively to all periods presented. The Company willadopt this update as of January 1, 2017, on a retrospective basis and expects the balance of deferred tax assets andliabilities to decrease by approximately $300 million due to additional netting impacts.
Recognition and measurement of financial assets and financial liabilities
In January 2016, an accounting standard update was issued to enhance the reporting model for financialinstruments, which includes amendments to address aspects of recognition, measurement, presentation and disclosure.For example, the Company would be required to measure equity investments (except those accounted for under theequity method) at fair value with changes in fair value recognized in net income and to present separately financialassets and financial liabilities by measurement category and form of financial asset. This update is effective for theCompany for annual and interim periods beginning January 1, 2018, with early adoption permitted for certainprovisions. The Company is currently evaluating the impact of this update on its consolidated financial statements.
Leases
In February 2016, an accounting standard update was issued that requires lessees to recognize lease assets andcorresponding lease liabilities on the balance sheet for all leases with terms of more than 12 months. The update, whichsupersedes existing lease guidance, will continue to classify leases as either finance or operating, with the classificationdetermining the pattern of expense recognition in the income statement. This update is effective for the Company forannual and interim periods beginning January 1, 2019, with early adoption permitted, and is applicable on a modifiedretrospective basis with various optional practical expedients. The Company is currently evaluating the impact of thisupdate on its consolidated financial statements.
Simplifying the transition to the equity method of accounting
In March 2016, an accounting standard update was issued which eliminates the retroactive adjustments to aninvestment upon it qualifying for the equity method of accounting as a result of an increase in the level of ownershipinterest or degree of influence by the investor. It requires that the equity method investor add the cost of acquiring theadditional interest in the investee to the current basis of the previously held interest and adopt the equitymethod of accounting as of the date the investment qualifies for equity method accounting. This update is effective forthe Company for annual and interim periods beginning January 1, 2017, with early adoption permitted, and is applicableprospectively. The Company does not believe that this update will have a significant impact on its consolidated financialstatements.
Improvements to employee share-based payment accounting
In March 2016, an accounting standard update was issued which changes the accounting for certain aspects ofshare-based payment awards to employees, including the accounting for income taxes, forfeitures, and statutory taxwithholding requirements, as well as the classification in the statement of cash flows. This update is effective for theCompany for annual and interim periods beginning January 1, 2017, with early adoption permitted. The Company doesnot believe that this update will have a significant impact on its consolidated financial statements.
Measurement of credit losses on financial instruments
In June 2016, an accounting standard update was issued which replaces the existing incurred loss impairmentmethodology for most financial assets with a new expected credit model. The new model will result in theimmediate recognition of the estimated credit losses expected to occur over the remaining life of financial assets such astrade and other receivables, held-to-maturity debt securities, loans and other instruments. Credit losses relating toavailable-for-sale debt securities will be measured in a manner similar to current GAAP, except that the losses will berecorded through an allowance for credit losses rather than as a direct write-down of the security.

F-22
This update is effective for the Company for annual and interim periods beginning January 1, 2020, with earlyadoption permitted for annual and interim periods beginning January 1, 2019. The Company is currently evaluating theimpact of this update on its consolidated financial statements.
Classification of certain cash receipts and cash payments in the statement of cash flows
In August 2016, an accounting standard update was issued which clarifies how certain cash receipts and cashpayments, including debt prepayment or extinguishment costs, the settlement of zero coupon debt instruments,contingent consideration paid after a business combination, proceeds from insurance settlements, distributions fromcertain equity method investees and beneficial interests obtained in a financial asset securitization, should be presentedand classified in the statement of cash flows. This update is effective for the Company for annual and interim periodsbeginning January 1, 2018 on a retrospective basis, with early adoption permitted. The Company does not believe thatthis update will have a significant impact on its consolidated financial statements.
Income taxes - Intra-entity transfers of assets other than inventory
In October 2016, an accounting standard update was issued that requires the Company to recognize the incometax consequences of an intra-entity transfer of an asset other than inventory when the transfer occurs instead of when theasset has been sold to an outside party. This update is effective for the Company for annual and interim periodsbeginning January 1, 2018, with early adoption permitted, and is applicable on a modified retrospective basis through acumulative-effect adjustment directly to retained earnings as of the beginning of the period of adoption. The Company iscurrently evaluating the impact of this update on its consolidated financial statements.
Statement of cash flows - Restricted cash
In November 2016, an accounting standard update was issued which clarifies the classification and presentationof changes in restricted cash on the statement of cash flows. It requires the inclusion of cash and cash equivalents thathave restrictions on withdrawal or use in total cash and cash equivalents on the statement of cash flows. This update iseffective for the Company for annual and interim periods beginning January 1, 2018 on a retrospective basis, with earlyadoption permitted. The Company does not believe that this update will have a significant impact on its consolidatedfinancial statements.
Clarifying the definition of a business
In January 2017, an accounting standard update was issued which narrows the definition of a business. It alsoprovides a framework for determining whether a set of transferred assets and activities involves a business. This updateis effective for the Company for annual and interim periods beginning January 1, 2018 on a prospective basis, with earlyadoption permitted. The Company does not believe that this update will have a significant impact on its consolidatedfinancial statements.
Simplifying the test for goodwill impairment
In January 2017, an accounting standard update was issued which eliminates the requirement to calculate theimplied fair value of goodwill when measuring a goodwill impairment loss. Instead, the Company is required to recordan impairment loss based on the excess of a reporting carrying amount over its fair value provided that the lossrecognized does not exceed the total amount of goodwill allocated to that reporting unit. This update is effective for theCompany for annual and interim periods beginning January 1, 2020 on a prospective basis, with early adoptionpermitted. The Company plans to early adopt this update in the first quarter of 2017 and apply it prospectively. TheCompany does not believe that this update will have a significant impact on its consolidated financial statements.
Clarifying the scope of asset derecognition guidance and accounting for partial sales of nonfinancial assets
In February 2017, an accounting standard update was issued which clarifies the scope of asset derecognitionguidance, adds guidance for partial sales of nonfinancial assets and clarifies recognizing gains and losses from thetransfer of nonfinancial assets in contracts with noncustomers. The Company plans to adopt this update retrospectivelyas of January 1, 2018, with the cumulative effect of initially applying the update recognized at the date of adoption inretained earnings. The Company does not believe that this update will have a significant impact on its consolidatedfinancial statements.

F-23
Note 3 Acquisitions and business divestments
Acquisitions
Acquisitions were as follows:
($ in millions, except number of acquired businesses) 2016 2015 2014Acquisitions (net of cash acquired)(1) 13 37 58Aggregate excess of purchase price over fair value of net assets acquired(2) 12 34 9Number of acquired businesses 1 3 6
(1) Excluding changes in cost- and equity-accounted companies.(2) Recorded as goodwill (see Note 11). Includes adjustments of $42 million in 2014 arising during the measurement period of acquisitions,
primarily reflecting a reduction in certain deferred tax liabilities related to Power-One.
Business divestments
In 2014, the Company received proceeds (net of transaction costs and cash disposed) of $1,090 million, relatingto divestments of consolidated businesses and recorded net gains of $543 million in Other income (expense), net onthe sale of such businesses. In 2016 and 2015, there were no significant amounts recognized from divestments ofconsolidated businesses.
In September 2016, the Company announced an agreement to divest its high-voltage cable system business(Cables business). The assets and liabilities of this business are shown as assets and liabilities held for sale in the
Consolidated Balance Sheet as at December 31, 2016. The divestment was completed on March 1, 2017.
Note 4 Cash and equivalents, marketable securities and short-term investments
Current assets
Cash and equivalents and marketable securities and short-term investments consisted of the following:
December 31, 2016Marketable
securitiesGross Gross and
unrealized unrealized Cash and short-term($ in millions) Cost basis gains losses Fair value equivalents investmentsCash 1,704 1,704 1,704Time deposits 2,764 2,764 1,940 824Other short-term investments 271 271 271Debt securities available-for-sale:
U.S. government obligations 221 1 (2) 220 220Other government obligations 2 2 2Corporate 95 1 (1) 95 95
Equity securities available-for-sale 530 11 541 541Total 5,587 13 (3) 5,597 3,644 1,953

F-24
December 31, 2015Marketable
securitiesGross Gross and
unrealized unrealized Cash and short-term($ in millions) Cost basis gains losses Fair value equivalents investmentsCash 1,837 1,837 1,837Time deposits 2,821 2,821 2,717 104Other short-term investments 231 231 231Debt securities available-for-sale:
U.S. government obligations 120 2 (1) 121 121Other government obligations 2 2 2Corporate 519 1 (1) 519 11 508
Equity securities available-for-sale 658 9 667 667Total 6,188 12 (2) 6,198 4,565 1,633
Included in Other short-term investments at December 31, 2016 and 2015, are receivables of $268 million and$224 million, respectively, representing reverse repurchase agreements. These collateralized lendings, made to afinancial institution, have maturity dates of less than one year.
Non-current assets
Included in Other non-current assets are certain held-to-maturity marketable securities. At December 31,2016, the amortized cost, gross unrecognized gain and fair value (based on quoted market prices) of these securitieswere $80 million, $6 million and $86 million, respectively. At December 31, 2015, the amortized cost, grossunrecognized gain and fair value (based on quoted market prices) of these securities were $99 million, $11 million and$110 million, respectively. These securities are pledged as security for certain outstanding deposit liabilities and thefunds received at the respective maturity dates of the securities will only be available to the Company for repayment ofthese obligations.
Gains, losses and contractual maturities
Gross realized gains (reclassified from accumulated other comprehensive loss to income) on available-for-salesecurities totaled $1 million, $1 million and $2 million in 2016, 2015 and 2014, respectively. Gross realized losses(reclassified from accumulated other comprehensive loss to income) on available-for-sale securities totaled $1 million,$2 million and $23 million in 2016, 2015 and 2014, respectively. Such gains and losses were included in Interest andother finance expense .
In 2016, 2015 and 2014, other-than-temporary impairments recognized on available-for-sale equity securitieswere not significant.
At December 31, 2016, 2015 and 2014, gross unrealized losses on available-for-sale securities that have been ina continuous unrealized loss position were not significant and the Company does not intend and does not expect to berequired to sell these securities before the recovery of their amortized cost.
Contractual maturities of debt securities consisted of the following:
December 31, 2016Available-for-sale Held-to-maturity
($ in millions) Cost basis Fair value Cost basis Fair valueLess than one year 100 100One to five years 161 161 80 86Six to ten years 57 56Total 318 317 80 86
At December 31, 2016 and 2015, the Company pledged $91 million and $92 million, respectively, ofavailable-for-sale marketable securities as collateral for issued letters of credit and other security arrangements.

F-25
Note 5 Derivative financial instruments
The Company is exposed to certain currency, commodity, interest rate and equity risks arising from its globaloperating, financing and investing activities. The Company uses derivative instruments to reduce and manage theeconomic impact of these exposures.
Currency risk
Due to the global nature of the Company s operations, many of its subsidiaries are exposed to currency risk intheir operating activities from entering into transactions in currencies other than their functional currency. To managesuch currency risks, the Company s policies require the subsidiaries to hedge their foreign currency exposures frombinding sales and purchase contracts denominated in foreign currencies. For forecasted foreign currency denominatedsales of standard products and the related foreign currency denominated purchases, the Company s policy is to hedge upto a maximum of 100 percent of the forecasted foreign currency denominated exposures, depending on the length of theforecasted exposures. Forecasted exposures greater than 12 months are not hedged. Forward foreign exchange contractsare the main instrument used to protect the Company against the volatility of future cash flows (caused by changes inexchange rates) of contracted and forecasted sales and purchases denominated in foreign currencies. In addition, withinits treasury operations, the Company primarily uses foreign exchange swaps and forward foreign exchange contracts tomanage the currency and timing mismatches arising in its liquidity management activities.
Commodity risk
Various commodity products are used in the Company s manufacturing activities. Consequently it is exposed tovolatility in future cash flows arising from changes in commodity prices. To manage the price risk of commodities otherthan electricity, the Company s policies require that the subsidiaries hedge the commodity price risk exposures frombinding contracts, as well as at least 50 percent (up to a maximum of 100 percent) of the forecasted commodity exposureover the next 12 months or longer (up to a maximum of 18 months). Primarily swap contracts are used to manage theassociated price risks of commodities.
Interest rate risk
The Company has issued bonds at fixed rates. Interest rate swaps are used to manage the interest rate riskassociated with certain debt and generally such swaps are designated as fair value hedges. In addition, from time to time,the Company uses instruments such as interest rate swaps, interest rate futures, bond futures or forward rate agreementsto manage interest rate risk arising from the Company s balance sheet structure but does not designate such instrumentsas hedges.
Equity risk
The Company is exposed to fluctuations in the fair value of its warrant appreciation rights (WARs) issuedunder its MIP. A WAR gives its holder the right to receive cash equal to the market price of an equivalent listed warranton the date of exercise. To eliminate such risk, the Company has purchased cash-settled call options, indexed to theshares of the Company, which entitle the Company to receive amounts equivalent to its obligations under theoutstanding WARs.
Volume of derivative activity
In general, while the Company s primary objective in its use of derivatives is to minimize exposures arisingfrom its business, certain derivatives are designated and qualify for hedge accounting treatment while others either arenot designated or do not qualify for hedge accounting.

F-26
Foreign exchange and interest rate derivatives
The gross notional amounts of outstanding foreign exchange and interest rate derivatives (whether designatedas hedges or not) were as follows:
Total notional amounts atType of derivative December 31,($ in millions) 2016 2015 2014Foreign exchange contracts 15,353 16,467 18,564Embedded foreign exchange derivatives 2,162 2,966 3,013Interest rate contracts 3,021 4,302 2,242
Derivative commodity contracts
The following table shows the notional amounts of outstanding commodity derivatives (whether designated ashedges or not), on a net basis, to reflect the Company s requirements in the various commodities:
Total notional amounts atDecember 31,
Type of derivative Unit 2016 2015 2014Copper swaps metric tonnes 47,425 48,903 46,520Aluminum swaps metric tonnes 4,650 5,455 3,846Nickel swaps metric tonnes 18Lead swaps metric tonnes 15,100 14,625 6,550Zinc swaps metric tonnes 150 225 200Silver swaps ounces 1,586,395 1,727,255 1,996,845Crude oil swaps barrels 121,000 133,500 128,000
Equity derivatives
At December 31, 2016, 2015 and 2014, the Company held 47 million, 55 million and 61 million cash-settledcall options indexed to ABB Ltd shares (conversion ratio 5:1) with a total fair value of $23 million, $13 million and$33 million, respectively.
Cash flow hedges
As noted above, the Company mainly uses forward foreign exchange contracts to manage the foreign exchangerisk of its operations, commodity swaps to manage its commodity risks and cash-settled call options to hedge its WARliabilities. Where such instruments are designated and qualify as cash flow hedges, the effective portion of the changesin their fair value is recorded in Accumulated other comprehensive loss and subsequently reclassified into earnings inthe same line item and in the same period as the underlying hedged transaction affects earnings. Any ineffectiveness inthe hedge relationship, or hedge component excluded from the assessment of effectiveness, is recognized in earningsduring the current period.
At December 31, 2016, 2015 and 2014, Accumulated other comprehensive loss included net unrealizedlosses of $1 million, $11 million and $21 million, respectively, net of tax, on derivatives designated as cash flow hedges.Of the amount at December 31, 2016, net gains of $2 million are expected to be reclassified to earnings in 2017. AtDecember 31, 2016, the longest maturity of a derivative classified as a cash flow hedge was 39 months.
In 2016, 2015 and 2014, the amounts of gains or losses, net of tax, reclassified into earnings due to thediscontinuance of cash flow hedge accounting and the amount of ineffectiveness in cash flow hedge relationshipsdirectly recognized in earnings were not significant.

F-27
The pre-tax effects of derivative instruments, designated and qualifying as cash flow hedges, on Accumulatedother comprehensive loss (OCI) and the Consolidated Income Statements were as follows:
Gains (losses) recognized in OCI Gains (losses) reclassified fromon derivatives (effective portion) OCI into income (effective portion)
($ in millions) 2016 2015 2014 2016 2015 2014Type of derivative LocationForeign exchange contracts 2 (11) (42) Total revenues (11) (36) (9)
Total cost of sales 10 11 8Commodity contracts 4 (9) (7) Total cost of sales (2) (10) (3)Cash-settled call options 15 (6) (16) SG&A expenses(1) 10 (4) (6)Total 21 (26) (65) 7 (39) (10)
(1) SG&A expenses represent general and administrative
The amounts in respect of gains (losses) recognized in income for hedge ineffectiveness and amounts excludedfrom effectiveness testing were not significant in 2016, 2015 and 2014.
Net derivative gains of $6 million and net derivative losses of $30 million and $9 million, net of tax, werereclassified from Accumulated other comprehensive loss to earnings during 2016, 2015 and 2014, respectively.
Fair value hedges
To reduce its interest rate exposure arising primarily from its debt issuance activities, the Company usesinterest rate swaps. Where such instruments are designated as fair value hedges, the changes in the fair value of theseinstruments, as well as the changes in fair value of the risk component of the underlying debt being hedged, are recordedas offsetting gains and losses in Interest and other finance expense . Hedge ineffectiveness of instruments designated asfair value hedges in 2016, 2015 and 2014, was not significant.
The effect of Interest rate contracts, designated and qualifying as fair value hedges, on the Consolidated IncomeStatements was as follows:
($ in millions) 2016 2015 2014Gains (losses) recognized in Interest and other finance expense: - on derivatives designated as fair value hedges (28) 8 84 - on hedged item 30 (4) (83)
Derivatives not designated in hedge relationships
Derivative instruments that are not designated as hedges or do not qualify as either cash flow or fair valuehedges are economic hedges used for risk management purposes. Gains and losses from changes in the fair values ofsuch derivatives are recognized in the same line in the income statement as the economically hedged transaction.
Furthermore, under certain circumstances, the Company is required to split and account separately for foreigncurrency derivatives that are embedded within certain binding sales or purchase contracts denominated in a currencyother than the functional currency of the subsidiary and the counterparty.

F-28
The gains (losses) recognized in the Consolidated Income Statements on derivatives not designated in hedgingrelationships were as follows:
($ in millions) Gains (losses) recognized in incomeType of derivative not designated as a hedge Location 2016 2015 2014Foreign exchange contracts Total revenues (206) (216) (533)
Total cost of sales (56) 16 19 SG&A expenses(1) 8 13 2 Non-order related research and development (2) (1) Other income (expense), net 22 Interest and other finance expense (34) 287 (260)
Embedded foreign exchange contracts Total revenues (5) 127 149 Total cost of sales (5) (25) (27) SG&A expenses(1) (2) (5)
Commodity contracts Total cost of sales 42 (61) (28)Other Interest and other finance expense 4 (1) (1)Total (234) 134 (679)
(1) SG&A expenses represent general and administrative
The fair values of derivatives included in the Consolidated Balance Sheets were as follows:
December 31, 2016Derivative assets Derivative liabilities
Non-current Non-currentCurrent in Current in
non-current non-current($ in millions)Derivatives designated as hedging instruments:Foreign exchange contracts 5 6 5Commodity contracts 2Interest rate contracts 2 62Cash-settled call options 13 9Total 22 71 6 5Derivatives not designated as hedging instruments:Foreign exchange contracts 169 29 257 77Commodity contracts 29 2 6 1Cross-currency interest rate swaps 2Cash-settled call options 1Embedded foreign exchange derivatives 58 21 35 18Total 256 55 298 96Total fair value 278 126 304 101
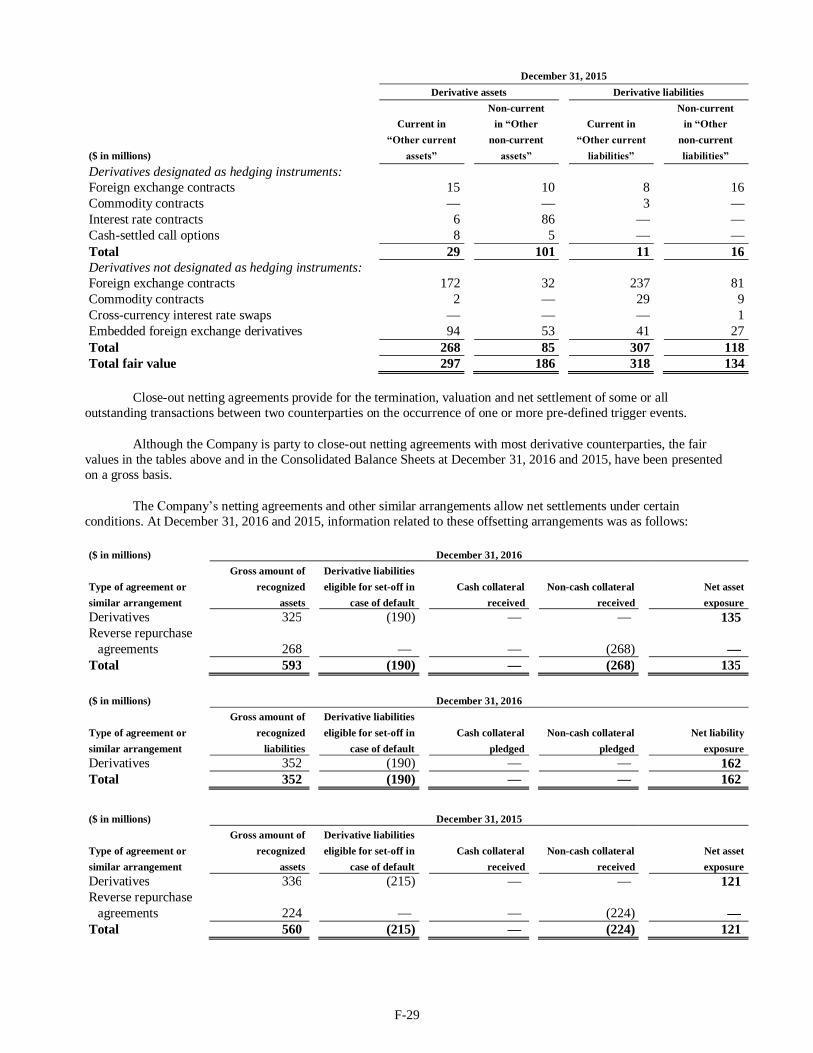
F-29
December 31, 2015Derivative assets Derivative liabilities
Non-current Non-currentCurrent in Current in
non-current non-current($ in millions)Derivatives designated as hedging instruments:Foreign exchange contracts 15 10 8 16Commodity contracts 3Interest rate contracts 6 86Cash-settled call options 8 5Total 29 101 11 16Derivatives not designated as hedging instruments:Foreign exchange contracts 172 32 237 81Commodity contracts 2 29 9Cross-currency interest rate swaps 1Embedded foreign exchange derivatives 94 53 41 27Total 268 85 307 118Total fair value 297 186 318 134
Close-out netting agreements provide for the termination, valuation and net settlement of some or alloutstanding transactions between two counterparties on the occurrence of one or more pre-defined trigger events.
Although the Company is party to close-out netting agreements with most derivative counterparties, the fairvalues in the tables above and in the Consolidated Balance Sheets at December 31, 2016 and 2015, have been presentedon a gross basis.
The netting agreements and other similar arrangements allow net settlements under certainconditions. At December 31, 2016 and 2015, information related to these offsetting arrangements was as follows:
($ in millions) December 31, 2016Gross amount of Derivative liabilities
Type of agreement or recognized eligible for set-off in Cash collateral Non-cash collateral Net assetsimilar arrangement assets case of default received received exposureDerivatives 325 (190) 135Reverse repurchase
agreements 268 (268)Total 593 (190) (268) 135
($ in millions) December 31, 2016Gross amount of Derivative liabilities
Type of agreement or recognized eligible for set-off in Cash collateral Non-cash collateral Net liabilitysimilar arrangement liabilities case of default pledged pledged exposureDerivatives 352 (190) 162Total 352 (190) 162
($ in millions) December 31, 2015Gross amount of Derivative liabilities
Type of agreement or recognized eligible for set-off in Cash collateral Non-cash collateral Net assetsimilar arrangement assets case of default received received exposureDerivatives 336 (215) 121Reverse repurchase
agreements 224 (224)Total 560 (215) (224) 121

F-30
($ in millions) December 31, 2015Gross amount of Derivative liabilities
Type of agreement or recognized eligible for set-off in Cash collateral Non-cash collateral Net liabilitysimilar arrangement liabilities case of default pledged pledged exposureDerivatives 384 (215) (3) 166Total 384 (215) (3) 166
Note 6 Fair values
Recurring fair value measures
The fair values of financial assets and liabilities measured at fair value on a recurring basis were as follows:
December 31, 2016Total
($ in millions) Level 1 Level 2 Level 3 fair value
AssetsAvailable-for-
short-Equity securities 541 541Debt securities U.S. government obligations 220 220Debt securities Other government obligations 2 2Debt securities Corporate 95 95
Derivative assets 278 278Derivative assets non- - 126 126Total 220 1,042 1,262LiabilitiesDerivative liabilities 304 304Derivative liabilities non- - 101 101Total 405 405
December 31, 2015Total
($ in millions) Level 1 Level 2 Level 3 fair value
AssetsAvailable-for-
Debt securities Corporate 11 11Available-for-
short-Equity securities 667 667Debt securities U.S. government obligations 121 121Debt securities Other government obligations 2 2Debt securities Corporate 508 508
Derivative assets 1 296 297Derivative assets non- - 186 186Total 122 1,670 1,792LiabilitiesDerivative liabilities 3 315 318Derivative liabilities non- - 134 134Total 3 449 452

F-31
The Company uses the following methods and assumptions in estimating fair values of financial assets andliabilities measured at fair value on a recurring basis:
Available-for-sale securities in Cash and equivalents and Marketable securities and short-terminvestments If quoted market prices in active markets for identical assets are available, these areconsidered Level 1 inputs; however, when markets are not active, these inputs are considered Level 2. Ifsuch quoted market prices are not available, fair value is determined using market prices for similar assetsor present value techniques, applying an appropriate risk-free interest rate adjusted for nonperformancerisk. The inputs used in present value techniques are observable and fall into the Level 2 category.
Derivatives: The fair values of derivative instruments are determined using quoted prices of identicalinstruments from an active market, if available (Level 1 inputs). If quoted prices are not available, pricequotes for similar instruments, appropriately adjusted, or present value techniques, based on availablemarket data, or option pricing models are used. Cash-settled call options hedging the Company s WARliability are valued based on bid prices of the equivalent listed warrant. The fair values obtained using pricequotes for similar instruments or valuation techniques represent a Level 2 input unless significantunobservable inputs are used.
Non-recurring fair value measures
There were no significant non-recurring fair value measurements during 2016 and 2015.
Disclosure about financial instruments carried on a cost basis
The fair values of financial instruments carried on a cost basis were as follows:
December 31, 2016Carrying Total
($ in millions) value Level 1 Level 2 Level 3 fair valueAssetsCash and equivalents (excluding available-for-sale securities
with original maturities up to 3 months):Cash 1,704 1,704 1,704Time deposits 1,940 1,940 1,940
Marketable securities and short-term investments (excludingavailable-for-sale securities):Time deposits 824 824 824Receivables under reverse repurchase agreements 268 268 268Other short-term investments 3 3 3
Other non-current assets:Loans granted 30 31 31Held-to-maturity securities 80 86 86Restricted cash and cash deposits 91 59 42 101
LiabilitiesShort-term debt and current maturities of long-term debt
(excluding capital lease obligations) 980 856 124 980Long-term debt (excluding capital lease obligations) 5,709 5,208 784 5,992Non- - 106 124 124

F-32
December 31, 2015Carrying Total
($ in millions) value Level 1 Level 2 Level 3 fair valueAssetsCash and equivalents (excluding available-for-sale securities
with original maturities up to 3 months):Cash 1,837 1,837 1,837Time deposits 2,717 2,717 2,717
Marketable securities and short-term investments (excludingavailable-for-sale securities):Time deposits 104 104 104Receivables under reverse repurchase agreements 224 224 224Other short-term investments 7 7 7
Other non-current assets:Loans granted 29 30 30Held-to-maturity securities 99 110 110Restricted cash and cash deposits 176 55 138 193
LiabilitiesShort-term debt and current maturities of long-term debt
(excluding capital lease obligations) 1,427 614 817 1,431Long-term debt (excluding capital lease obligations) 5,889 5,307 751 6,058Non- - 215 244 244
The Company uses the following methods and assumptions in estimating fair values of financial instrumentscarried on a cost basis:
Cash and equivalents (excluding available-for-sale securities with original maturities up to 3 months), andMarketable securities and short-term investments (excluding available-for-sale securities): The carryingamounts approximate the fair values as the items are short-term in nature.
Other non-current assets: Includes (i) loans granted whose fair values are based on the carrying amountadjusted using a present value technique to reflect a premium or discount based on current market interestrates (Level 2 inputs), (ii) held-to-maturity securities (see Note 4) whose fair values are based on quotedmarket prices in inactive markets (Level 2 inputs), (iii) restricted cash whose fair values approximate thecarrying amounts (Level 1 inputs) and restricted cash deposits pledged in respect of certain non-currentdeposit liabilities whose fair values are determined using a discounted cash flow methodology based oncurrent market interest rates (Level 2 inputs).
Short-term debt and current maturities of long-term debt (excluding capital lease obligations): Short-termdebt includes commercial paper, bank borrowings and overdrafts. The carrying amounts of short-term debtand current maturities of long-term debt, excluding capital lease obligations, approximate their fair values.
Long-term debt (excluding capital lease obligations): Fair values of bonds are determined using quotedmarket prices (Level 1 inputs), if available. For bonds without available quoted market prices and otherlong-term debt, the fair values are determined using a discounted cash flow methodology based uponborrowing rates of similar debt instruments and reflecting appropriate adjustments for non-performancerisk (Level 2 inputs).
Non-current deposit liabilities in Other non-current liabilities : The fair values of non-current depositliabilities are determined using a discounted cash flow methodology based on risk-adjusted interest rates(Level 2 inputs).

F-33
Note 7 Receivables, net
Receivables, net consisted of the following:
December 31,($ in millions) 2016 2015Trade receivables 7,293 7,197Other receivables 587 665Allowance (314) (258)
7,566 7,604Unbilled receivables, net:Costs and estimated profits in excess of billings 3,058 3,385Advance payments consumed (928) (928)
2,130 2,457Total 9,696 10,061
Trade receivables in the table above includes contractual retention amounts billed to customers of$463 million and $545 million at December 31, 2016 and 2015, respectively. Management expects that the substantialmajority of related contracts will be completed and the substantial majority of the billed amounts retained by thecustomer will be collected. Of the retention amounts outstanding at December 31, 2016, 65 percent and 21 percent areexpected to be collected in 2017 and 2018, respectively.
Other receivables in the table above consists of value added tax, claims, rental deposits and other non-tradereceivables.
Costs and estimated profits in excess of billings in the table above represents revenues earned and recognizedfor contracts under the percentage-of-completion or completed-contract method of accounting. Management expects thatthe majority of the amounts will be collected within one year of the respective balance sheet date.
The reconciliation of changes in the allowance for doubtful accounts is as follows:
($ in millions) 2016 2015 2014Balance at January 1, 258 279 317Additions 163 118 103Deductions (96) (113) (118)Exchange rate differences (11) (26) (23)Balance at December 31, 314 258 279
Note 8 Inventories, net
Inventories, net consisted of the following:
December 31,($ in millions) 2016 2015
Raw materials 1,692 1,793Work in process 1,326 1,574Finished goods 1,369 1,442Advances to suppliers 149 188
4,536 4,997Advance payments consumed (189) (240)Total 4,347 4,757
Work in process in the table above contains inventoried costs relating to long-term contracts of $212 millionand $411 million at December 31, 2016 and 2015, respectively. Advance payments consumed in the table aboverelates to contractual advances received from customers on work in process.

F-34
Note 9 Other non-current assets
Other non-current assets consisted of the following:
December 31,($ in millions) 2016 2015Pledged financial assets 112 220Derivatives (including embedded derivatives) (see Note 5) 126 186Investments 57 58Restricted cash 59 55Other 178 124Total 532 643
The Company entered into structured leasing transactions with U.S. investors prior to 1999. At the inception ofthe leasing arrangements the Company placed certain amounts in restricted cash deposits and held-to-maturity debtsecurities. These amounts, included as financial in the table above, are pledged as security for certainoutstanding deposit liabilities included in Other non-current liabilities (see Note 13) and the funds received uponmaturity of the respective pledged financial assets will only be available to the Company for repayment of theseobligations.
Investments represents shares and other equity investments carried at cost.
Note 10 Property, plant and equipment, net
Property, plant and equipment, net consisted of the following:
December 31,($ in millions) 2016 2015Land and buildings 3,786 4,003Machinery and equipment 7,368 7,554Construction in progress 515 559
11,669 12,116Accumulated depreciation (6,926) (6,840)Total 4,743 5,276
Assets under capital leases included in Property, plant and equipment, net were as follows:
December 31,($ in millions) 2016 2015Land and buildings 120 149Machinery and equipment 47 53
167 202Accumulated depreciation (82) (113)Total 85 89
In 2016, 2015 and 2014, depreciation, including depreciation of assets under capital leases, was $767 million,$764 million and $851 million, respectively.

F-35
Note 11 Goodwill and other intangible assets
Effective January 1, 2016, the Company reorganized its operating segments with the aim of delivering morecustomer value in a better, more focused way from its combined power and automation offering. The new ElectrificationProducts segment includes the business of the former Low Voltage Products segment and the Medium Voltage Productsbusiness from the former Power Products segment. The Process Automation segment has been expanded to include theDistributed Control Systems business from the former Power Systems segment, while the remaining businesses of theformer Power Products and Power Systems segments were combined to form the new Power Grids segment. There wereno significant changes to the Discrete Automation and Motion segment. The table below has been reclassified to reflectthis reorganization.
Changes in Goodwill were as follows:
($ in millions) Discrete
Electrification Automation Process Power Corporate
Products and Motion Automation Grids and Other Total
Cost at January 1, 2015 2,970 3,766 1,546 1,748 41 10,071Accumulated impairment charges (18) (18)Balance at January 1, 2015 2,970 3,766 1,546 1,748 23 10,053
Goodwill acquired during the year 4 24 6 34Goodwill allocated to disposals (23) (1) (24)Exchange rate differences and other (203) (92) (34) (62) (1) (392)
Balance at December 31, 2015 2,771 3,698 1,518 1,663 21 9,671Goodwill acquired during the year 12 12Goodwill allocated to assets held for sale (105) (105)Exchange rate differences and other (4) (49) (13) (11) (77)
Balance at December 31, 2016 2,767 3,661 1,505 1,547 21 9,501
In 2016, goodwill allocated to the Cables business, within the Power Grids operating segment, was transferredto held for see Note 3 for details.
In 2015, there were no significant acquisitions or divestments.
Intangible assets other than goodwill consisted of the following:
December 31,2016 2015
Gross Net Gross Netcarrying Accumulated carrying carrying Accumulated carrying
($ in millions) amount amortization amount amount amortization amountCapitalized software for internal use 712 (596) 116 692 (567) 125Capitalized software for sale 409 (365) 44 401 (357) 44Intangibles other than software:
Customer-related 2,500 (904) 1,596 2,517 (767) 1,750Technology-related 755 (660) 95 790 (585) 205Marketing-related 291 (159) 132 308 (140) 168Other 34 (21) 13 67 (22) 45
Total 4,701 (2,705) 1,996 4,775 (2,438) 2,337
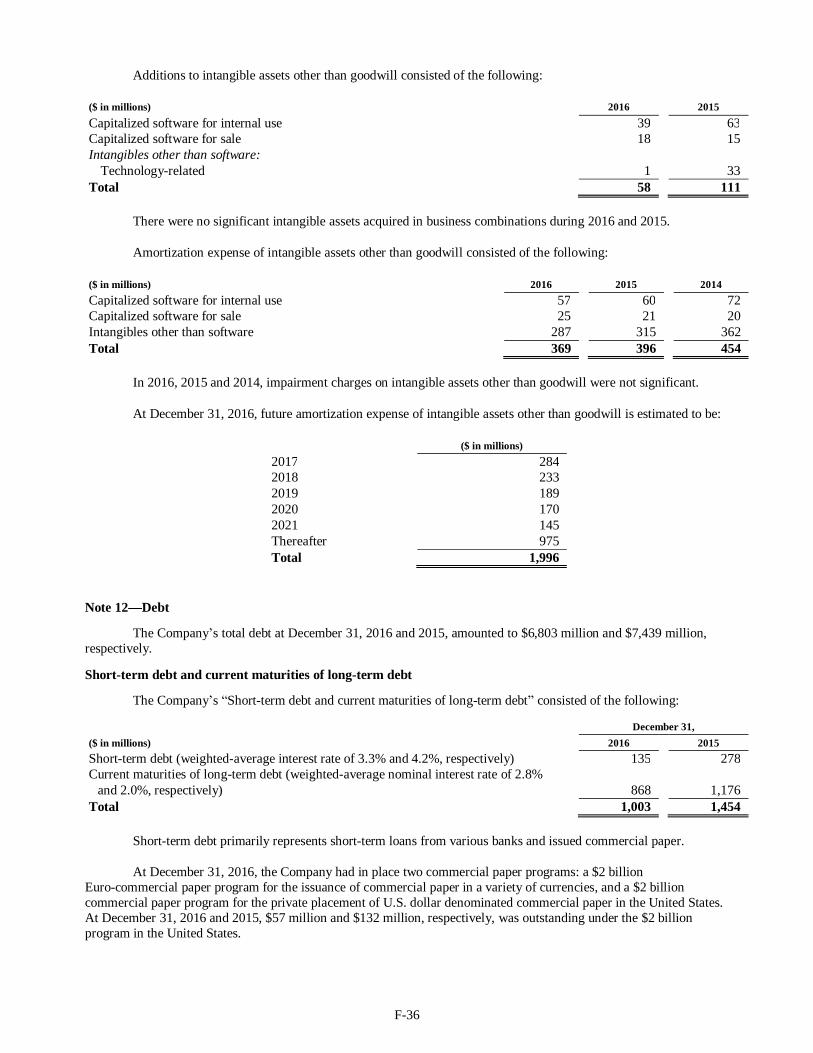
F-36
Additions to intangible assets other than goodwill consisted of the following:
($ in millions) 2016 2015Capitalized software for internal use 39 63Capitalized software for sale 18 15Intangibles other than software:
Technology-related 1 33Total 58 111
There were no significant intangible assets acquired in business combinations during 2016 and 2015.
Amortization expense of intangible assets other than goodwill consisted of the following:
($ in millions) 2016 2015 2014Capitalized software for internal use 57 60 72Capitalized software for sale 25 21 20Intangibles other than software 287 315 362Total 369 396 454
In 2016, 2015 and 2014, impairment charges on intangible assets other than goodwill were not significant.
At December 31, 2016, future amortization expense of intangible assets other than goodwill is estimated to be:
($ in millions)2017 2842018 2332019 1892020 1702021 145Thereafter 975Total 1,996
Note 12 Debt
The Company s total debt at December 31, 2016 and 2015, amounted to $6,803 million and $7,439 million,respectively.
Short-term debt and current maturities of long-term debt
The Company s Short-term debt and current maturities of long-term debt consisted of the following:
December 31,($ in millions) 2016 2015Short-term debt (weighted-average interest rate of 3.3% and 4.2%, respectively) 135 278Current maturities of long-term debt (weighted-average nominal interest rate of 2.8%
and 2.0%, respectively) 868 1,176Total 1,003 1,454
Short-term debt primarily represents short-term loans from various banks and issued commercial paper.
At December 31, 2016, the Company had in place two commercial paper programs: a $2 billionEuro-commercial paper program for the issuance of commercial paper in a variety of currencies, and a $2 billioncommercial paper program for the private placement of U.S. dollar denominated commercial paper in the United States.At December 31, 2016 and 2015, $57 million and $132 million, respectively, was outstanding under the $2 billionprogram in the United States.

F-37
In addition, during 2016, the Company exercised its option to further extend the maturity of its $2 billionmulticurrency revolving credit facility to 2021. The facility is for general corporate purposes. Interest costs on drawingsunder the facility are LIBOR or EURIBOR (depending on the currency of the drawings) plus a margin of 0.20 percent,while commitment fees (payable on the unused portion of the facility) amount to 35 percent of the margin, whichrepresents commitment fees of 0.07 percent per annum. Utilization fees, payable on drawings, amount to 0.075 percentper annum on drawings up to one-third of the facility, 0.15 percent per annum on drawings in excess of one-third butless than or equal to two-thirds of the facility, or 0.30 percent per annum on drawings over two-thirds of the facility. Noamount was drawn at December 31, 2016 and 2015. The facility contains cross-default clauses whereby an event ofdefault would occur if the Company were to default on indebtedness as defined in the facility, at or above a specifiedthreshold.
Long-term debt
The Company utilizes derivative instruments to modify the interest characteristics of its long-term debt. Inparticular, the Company uses interest rate swaps to effectively convert certain fixed-rate long-term debt into floating rateobligations. The carrying value of debt, designated as being hedged by fair value hedges, is adjusted for changes in thefair value of the risk component of the debt being hedged.
The following table summarizes the Company s long-term debt considering the effect of interest rate swaps.Consequently, a fixed-rate debt subject to a fixed-to-floating interest rate swap is included as a floating rate debt in thetable below:
December 31,2016 2015
Nominal Effective Nominal Effective($ in millions, except % data) Balance rate rate Balance rate rateFloating rate 1,745 2.0% 1.3% 2,285 2.7% 0.8%Fixed rate 4,923 2.9% 2.9% 4,876 3.2% 3.2%
6,668 7,161Current portion of long-term debt (868) 2.8% 2.4% (1,176) 2.0% 1.4%Total 5,800 5,985
At December 31, 2016, the principal amounts of long-term debt repayable (excluding capital lease obligations)at maturity were as follows:
($ in millions)2017 8432018 3792019 1,3212020 42021 1,251Thereafter 2,736Total 6,534
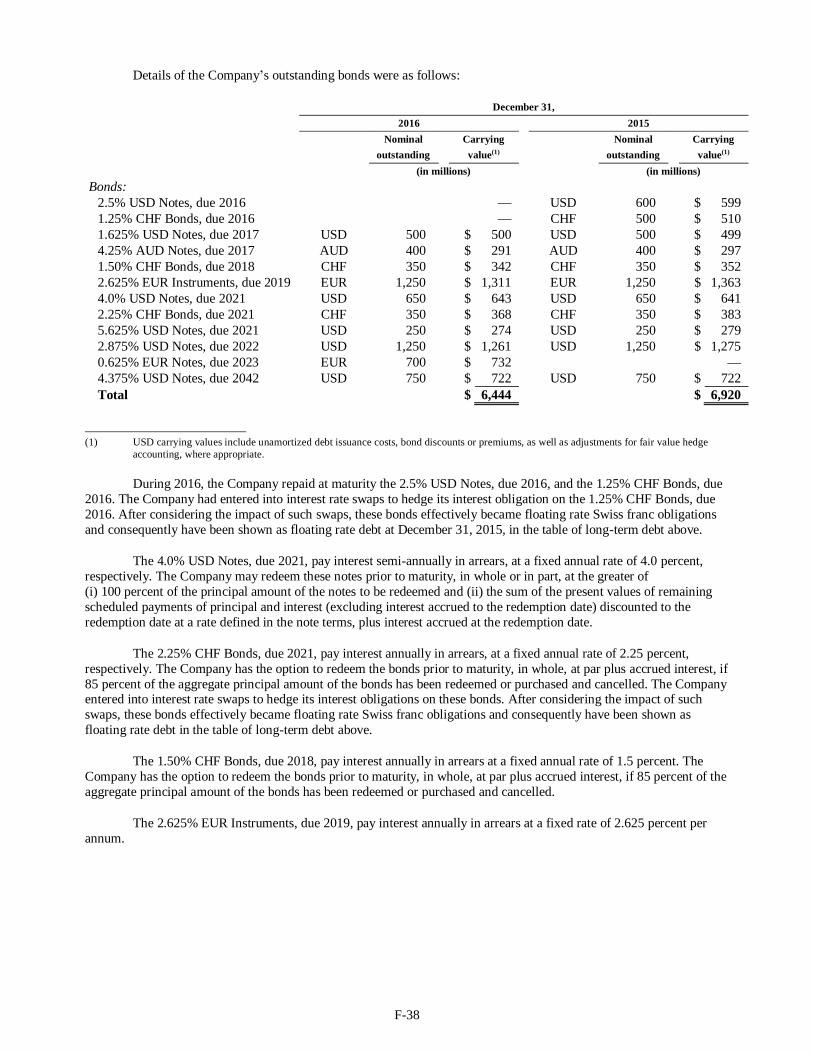
F-38
Details of the Company s outstanding bonds were as follows:
December 31,2016 2015
Nominal Carrying Nominal Carryingoutstanding value(1) outstanding value(1)
(in millions) (in millions)Bonds:
2.5% USD Notes, due 2016 USD 600 $ 5991.25% CHF Bonds, due 2016 CHF 500 $ 5101.625% USD Notes, due 2017 USD 500 $ 500 USD 500 $ 4994.25% AUD Notes, due 2017 AUD 400 $ 291 AUD 400 $ 2971.50% CHF Bonds, due 2018 CHF 350 $ 342 CHF 350 $ 3522.625% EUR Instruments, due 2019 EUR 1,250 $ 1,311 EUR 1,250 $ 1,3634.0% USD Notes, due 2021 USD 650 $ 643 USD 650 $ 6412.25% CHF Bonds, due 2021 CHF 350 $ 368 CHF 350 $ 3835.625% USD Notes, due 2021 USD 250 $ 274 USD 250 $ 2792.875% USD Notes, due 2022 USD 1,250 $ 1,261 USD 1,250 $ 1,2750.625% EUR Notes, due 2023 EUR 700 $ 7324.375% USD Notes, due 2042 USD 750 $ 722 USD 750 $ 722Total $ 6,444 $ 6,920
(1) USD carrying values include unamortized debt issuance costs, bond discounts or premiums, as well as adjustments for fair value hedgeaccounting, where appropriate.
During 2016, the Company repaid at maturity the 2.5% USD Notes, due 2016, and the 1.25% CHF Bonds, due2016. The Company had entered into interest rate swaps to hedge its interest obligation on the 1.25% CHF Bonds, due2016. After considering the impact of such swaps, these bonds effectively became floating rate Swiss franc obligationsand consequently have been shown as floating rate debt at December 31, 2015, in the table of long-term debt above.
The 4.0% USD Notes, due 2021, pay interest semi-annually in arrears, at a fixed annual rate of 4.0 percent,respectively. The Company may redeem these notes prior to maturity, in whole or in part, at the greater of(i) 100 percent of the principal amount of the notes to be redeemed and (ii) the sum of the present values of remainingscheduled payments of principal and interest (excluding interest accrued to the redemption date) discounted to theredemption date at a rate defined in the note terms, plus interest accrued at the redemption date.
The 2.25% CHF Bonds, due 2021, pay interest annually in arrears, at a fixed annual rate of 2.25 percent,respectively. The Company has the option to redeem the bonds prior to maturity, in whole, at par plus accrued interest, if85 percent of the aggregate principal amount of the bonds has been redeemed or purchased and cancelled. The Companyentered into interest rate swaps to hedge its interest obligations on these bonds. After considering the impact of suchswaps, these bonds effectively became floating rate Swiss franc obligations and consequently have been shown asfloating rate debt in the table of long-term debt above.
The 1.50% CHF Bonds, due 2018, pay interest annually in arrears at a fixed annual rate of 1.5 percent. TheCompany has the option to redeem the bonds prior to maturity, in whole, at par plus accrued interest, if 85 percent of theaggregate principal amount of the bonds has been redeemed or purchased and cancelled.
The 2.625% EUR Instruments, due 2019, pay interest annually in arrears at a fixed rate of 2.625 percent perannum.

F-39
The 1.625% USD Notes, due 2017, pay interest semi-annually in arrears at a fixed annual rate of 1.625 percent.The 2.875% USD Notes, due 2022, pay interest semi-annually in arrears at a fixed annual rate of 2.875 percent. The4.375% USD Notes, due 2042, pay interest semi-annually in arrears at a fixed annual rate of 4.375 percent. TheCompany may redeem any of these notes prior to maturity, in whole or in part, at the greater of (i) 100 percent of theprincipal amount of the notes to be redeemed and (ii) the sum of the present values of remaining scheduled payments ofprincipal and interest (excluding interest accrued to the redemption date) discounted to the redemption date at a ratedefined in the note terms, plus interest accrued at the redemption date. These notes, registered with the U.S. Securitiesand Exchange Commission, were issued by ABB Finance (USA) Inc., a 100 percent owned finance subsidiary, and werefully and unconditionally guaranteed by ABB Ltd. There are no significant restrictions on the ability of the parentcompany to obtain funds from its subsidiaries by dividend or loan. In reliance on Rule 3-10 of Regulation S-X, theseparate financial statements of ABB Finance (USA) Inc. are not provided. The Company has entered into interest rateswaps for an aggregate nominal amount of $1,050 million to partially hedge its interest obligations on the 2.875% USDNotes, due 2022. After considering the impact of such swaps, $1,050 million of the outstanding principal is shown asfloating rate debt in the table of long-term debt above.
The 5.625% USD Notes, due 2021, pay interest semi-annually in arrears at a fixed annual rate of 5.625 percent.The Company has the option to redeem the notes prior to maturity at the greater of (i) 100 percent of the principalamount of the notes to be redeemed, and (ii) the sum of the present values of remaining scheduled payments of principaland interest (excluding interest accrued to the redemption date) discounted to the redemption date at a rate defined in thenote terms, plus interest accrued at the redemption date.
The 4.25% AUD Notes, due 2017, pay fixed interest of 4.25 percent semi-annually in arrears. The Companyentered into interest rate swaps to hedge its interest obligations on these bonds. After considering the impact of suchswaps, these bonds effectively became floating rate Australian dollar obligations and consequently have been shown asfloating rate debt in the table of long-term debt above.
In May 2016, the Company issued notes with an aggregate principal of EUR 700 million, due 2023. The notespay interest annually in arrears at a fixed rate of 0.625 percent per annum. The Company recorded net proceeds of EUR697 million (equivalent to approximately $807 million on date of issuance).
The Company s bonds contain cross-default clauses which would allow the bondholders to demand repaymentif the Company were to default on any borrowing at or above a specified threshold. Furthermore, all such bondsconstitute unsecured obligations of the Company and rank pari passu with other debt obligations.
In addition to the bonds described above, included in long-term debt at December 31, 2016 and 2015, arecapital lease obligations, bank borrowings of subsidiaries and other long-term debt, none of which is individuallysignificant.
Note 13 Other provisions, other current liabilities and other non-current liabilities
Other Provisions consisted of the following:
December 31,($ in millions) 2016 2015Contract-related provisions 673 724Restructuring and restructuring-related provisions 577 538Provisions for contractual penalties and compliance and litigation matters 210 220Provision for insurance-related reserves 153 190Other 152 248Total 1,765 1,920

F-40
Other current liabilities consisted of the following:
December 31,($ in millions) 2016 2015Employee-related liabilities 1,670 1,709Accrued expenses 413 457Non-trade payables 394 319Derivative liabilities (see Note 5) 304 318Other tax liabilities 301 271Income taxes payable 226 240Accrued customer rebates 206 161Deferred income 147 156Accrued interest 67 67Pension and other employee benefits (see Note 17) 59 66Other 149 53Total 3,936 3,817
Other non-current liabilities consisted of the following:
December 31,($ in millions) 2016 2015Income tax related liabilities 923 851Non-current deposit liabilities (see Note 9) 106 215Derivative liabilities (see Note 5) 101 134Deferred income 80 85Employee-related liabilities 66 66Environmental provisions 62 86Provisions for contractual penalties and compliance and litigation matters 27 31Other 239 182Total 1,604 1,650
Note 14 Leases
The Company s lease obligations primarily relate to real estate and office equipment. Rent expense was$459 million, $497 million and $558 million in 2016, 2015 and 2014, respectively. Sublease income received by theCompany on leased assets was $13 million, $13 million and $17 million in 2016, 2015 and 2014, respectively.
At December 31, 2016, future net minimum lease payments for operating leases, having initial or remainingnon-cancelable lease terms in excess of one year, consisted of the following:
($ in millions)2017 3822018 3042019 2482020 2052021 166Thereafter 243
1,548Sublease income (24)Total 1,524
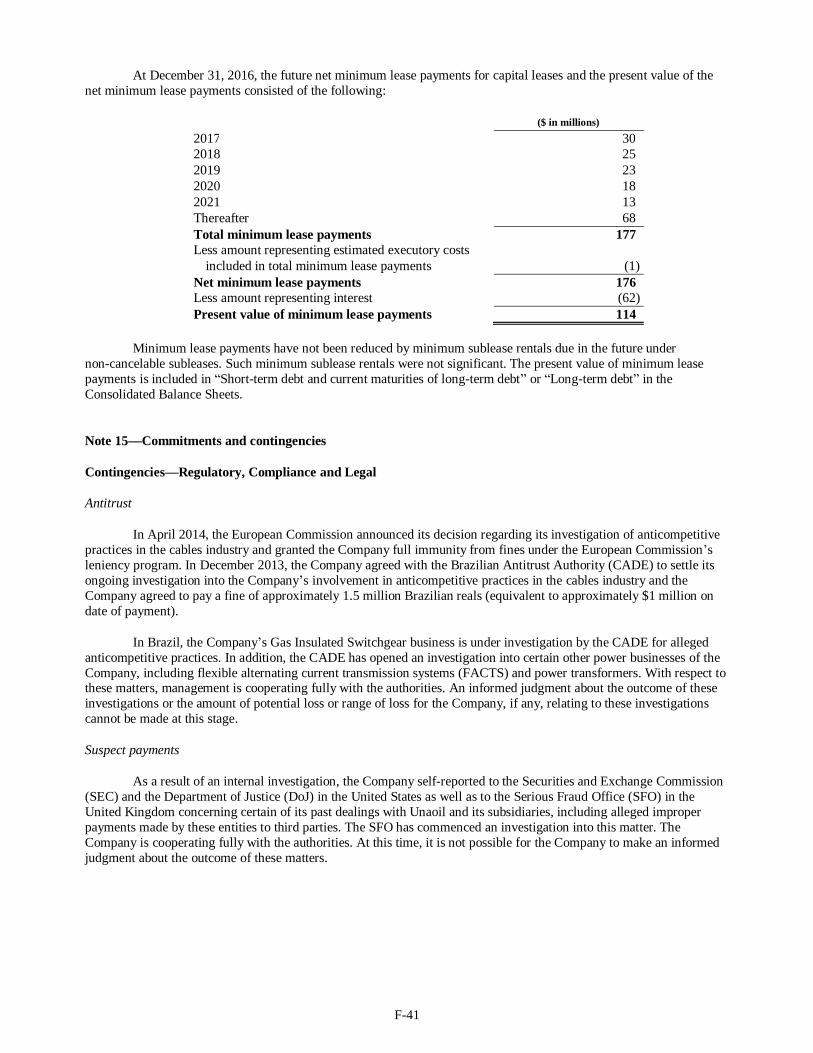
F-41
At December 31, 2016, the future net minimum lease payments for capital leases and the present value of thenet minimum lease payments consisted of the following:
($ in millions)2017 302018 252019 232020 182021 13Thereafter 68Total minimum lease payments 177Less amount representing estimated executory costs
included in total minimum lease payments (1)Net minimum lease payments 176Less amount representing interest (62)Present value of minimum lease payments 114
Minimum lease payments have not been reduced by minimum sublease rentals due in the future undernon-cancelable subleases. Such minimum sublease rentals were not significant. The present value of minimum leasepayments is included in Short-term debt and current maturities of long-term debt or Long-term debt in theConsolidated Balance Sheets.
Note 15 Commitments and contingencies
Contingencies Regulatory, Compliance and Legal
Antitrust
In April 2014, the European Commission announced its decision regarding its investigation of anticompetitivepractices in the cables industry and granted the Company full immunity from fines under the European Commission sleniency program. In December 2013, the Company agreed with the Brazilian Antitrust Authority (CADE) to settle itsongoing investigation into the Company s involvement in anticompetitive practices in the cables industry and theCompany agreed to pay a fine of approximately 1.5 million Brazilian reals (equivalent to approximately $1 million ondate of payment).
In Brazil, the Company s Gas Insulated Switchgear business is under investigation by the CADE for allegedanticompetitive practices. In addition, the CADE has opened an investigation into certain other power businesses of theCompany, including flexible alternating current transmission systems (FACTS) and power transformers. With respect tothese matters, management is cooperating fully with the authorities. An informed judgment about the outcome of theseinvestigations or the amount of potential loss or range of loss for the Company, if any, relating to these investigationscannot be made at this stage.
Suspect payments
As a result of an internal investigation, the Company self-reported to the Securities and Exchange Commission(SEC) and the Department of Justice (DoJ) in the United States as well as to the Serious Fraud Office (SFO) in theUnited Kingdom concerning certain of its past dealings with Unaoil and its subsidiaries, including alleged improperpayments made by these entities to third parties. The SFO has commenced an investigation into this matter. TheCompany is cooperating fully with the authorities. At this time, it is not possible for the Company to make an informedjudgment about the outcome of these matters.

F-42
General
In addition, the Company is aware of proceedings, or the threat of proceedings, against it and others in respectof private claims by customers and other third parties with regard to certain actual or alleged anticompetitive practices.Also, the Company is subject to other various legal proceedings, investigations, and claims that have not yet beenresolved. With respect to the above-mentioned regulatory matters and commercial litigation contingencies, the Companywill bear the costs of the continuing investigations and any related legal proceedings.
Liabilities recognized
At December 31, 2016 and 2015, the Company had aggregate liabilities of $150 million and $160 million,respectively, included in Other provisions and Other non-current liabilities , for the above regulatory, complianceand legal contingencies, and none of the individual liabilities recognized was significant. As it is not possible to make aninformed judgment on the outcome of certain matters and as it is not possible, based on information currently availableto management, to estimate the maximum potential liability on other matters, there could be material adverse outcomesbeyond the amounts accrued.
Guarantees
General
The following table provides quantitative data regarding the Company s third-party guarantees. The maximumpotential payments represent a worst-case scenario , and do not reflect management s expected outcomes.
December 31,2016 2015
Maximum potential($ in millions) paymentsPerformance guarantees 193 209Financial guarantees 69 77Indemnification guarantees 71 50Total 333 336
The carrying amount of liabilities recorded in the Consolidated Balance Sheets reflects the Company s bestestimate of future payments, which it may incur as part of fulfilling its guarantee obligations. In respect of the aboveguarantees, the carrying amounts of liabilities at December 31, 2016 and 2015, were not significant.
The Company is party to various guarantees providing financial or performance assurances to certain thirdparties. These guarantees, which have various maturities up to 2020, mainly consist of performance guarantees whereby(i) the Company guarantees the performance of a third product or service according to the terms of a contract and(ii) as member of a consortium that includes third parties, the Company guarantees not only its own performance butalso the work of third parties. Such guarantees may include guarantees that a project will be completed within aspecified time. If the third party does not fulfill the obligation, the Company will compensate the guaranteed party incash or in kind. The original maturity dates for the majority of these performance guarantees range from one to six years.
Commercial commitments
In addition, in the normal course of bidding for and executing certain projects, the Company has entered intostandby letters of credit, bid/performance bonds and surety bonds (collectively with variousfinancial institutions. Customers can draw on such performance bonds in the event that the Company does not fulfill itscontractual obligations. The Company would then have an obligation to reimburse the financial institution for amountspaid under the performance bonds. At December 31, 2016 and 2015, the total outstanding performance bondsaggregated to $7.9 billion and $9.5 billion, respectively. There have been no significant amounts reimbursed to financialinstitutions under these types of arrangements in 2016, 2015 and 2014.

F-43
Product and order-related contingencies
The Company calculates its provision for product warranties based on historical claims experience and specificreview of certain contracts.
The reconciliation of the Provisions for warranties , including guarantees of product performance, was asfollows:
($ in millions) 2016 2015 2014Balance at January 1, 1,089 1,148 1,362Net change in warranties due to acquisitions and divestments 11Claims paid in cash or in kind (329) (357) (319)Net increase in provision for changes in estimates, warranties issued
and warranties expired 424 377 224Exchange rate differences (42) (79) (130)Balance at December 31, 1,142 1,089 1,148
During 2016, the Company determined that the provision for product warranties in its solar business, acquiredin 2013 as part of the purchase of Power-One, was no longer sufficient to cover expected warranty costs in theremaining warranty period. Due to higher than originally expected product failure rates for certain solar invertersdesigned and manufactured by Power-One, a substantial portion of which relates to products which were delivered tocustomers prior to the acquisition date, the previously estimated product warranty provision was increased by a total of$151 million during the year. The corresponding increases were included in Cost of sales of products and resulted in adecrease in basic and diluted earnings per share of $0.06 and $0.05, respectively, for 2016. As $131 million relates toproducts which were sold prior to the acquisition date these costs have been excluded from the measure ofsegment profit, Operational EBITA (See Note 23). This warranty provision has been recorded based on the informationpresently available and is subject to change in the future.
The information for 2015 contained in the table above has been adjusted to correct a classification differencebetween Claims paid in cash and kind and Net effect of changes in estimates, warranties issued and warranties expired.
Related party transactions
The Company conducts business with certain companies where members of the Company s Board of Directorsor Executive Committee act, or in recent years have acted, as directors or senior executives. The Company s Board ofDirectors has determined that the Company s business relationships with those companies do not constitute materialbusiness relationships. This determination was made in accordance with the Company s related party transaction policywhich was prepared based on the Swiss Code of Best Practice and the independence criteria set forth in the corporategovernance rules of the New York Stock Exchange.
Note 16 Taxes
Provision for taxes consisted of the following:
($ in millions) 2016 2015 2014
Current taxes 925 1,005 1,130Deferred taxes (144) (217) 72Tax expense from continuing operations 781 788 1,202Tax expense (benefit) from discontinued operations (4) (2) 1

F-44
Tax expense from continuing operations is reconciled below from the Company s weighted-average global taxrate (rather than from the Swiss domestic statutory tax rate) as the parent company of the ABB Group, ABB Ltd, isdomiciled in Switzerland and income generated in jurisdictions outside of Switzerland (hereafter foreign jurisdictions )which has already been subject to corporate income tax in those foreign jurisdictions is, to a large extent, tax exempt inSwitzerland. There is no requirement in Switzerland for any parent company of a group to file a tax return of theconsolidated group determining domestic and foreign pre-tax income. As the Company s consolidated income fromcontinuing operations is predominantly earned outside of Switzerland, corporate income tax in foreign jurisdictionslargely determines the weighted-average global tax rate of the Company.
The reconciliation of Tax expense from continuing operations at the weighted-average tax rate to theeffective tax rate is as follows:
($ in millions, except % data) 2016 2015 2014
Income from continuing operations before taxes 2,799 2,840 3,896Weighted-average global tax rate 21.2% 21.8% 23.8%Income taxes at weighted-average tax rate 594 619 929Items taxed at rates other than the weighted-average tax rate 27 (36) 146Impact of non-deductible goodwill allocated to divested businesses 9 77Changes in valuation allowance, net (17) 57 52Effects of changes in tax laws and enacted tax rates 42 (52)Non-deductible expenses, excluding goodwill 86 52 45Other, net 49 87 5Tax expense from continuing operations 781 788 1,202Effective tax rate for the year 27.9% 27.7% 30.9%
In 2015, the benefit reported in Items taxed at rates other than the weighted-average tax rate predominantlyincluded $50 million related to tax credits arising from research and development activities. In 2014 the expensereported in Items taxed at rates other than the weighted-average tax rate predominantly related to tax credits arising inforeign jurisdictions for which the technical merits did not allow a benefit to be taken.
In 2016, 2015 and 2014, Changes in valuation allowance, net included reductions in valuation allowancesrecorded in certain jurisdictions where the Company determined that it was more likely than not that such deferred taxassets (recognized for net operating losses and temporary differences in those jurisdictions) would be realized, as well asincreases in the valuation allowance in certain other jurisdictions. In 2015, the Changes in valuation allowance, netincluded an expense of $21 million related to certain of the operations in Asia and in 2014, the Changes invaluation allowance, net included an expense of $31 million related to certain of the Company s operations in SouthAmerica.
In 2016 the Effects of change in tax laws and enacted tax rates included an expense of $16 million related tocertain of the operations in Europe. In 2014, the Effects of change in tax laws and enacted tax ratesincluded a benefit of $62 million related to enacted changes in double tax treaties.
In 2016, 2015 and 2014, Non-deductible of $86 million, of $52 million and $45 million,respectively, included expenses in relation to items that were deducted for financial accounting purposes, but were nottax deductible, such as interest expense, local taxes on productive activities, disallowed meals and entertainmentexpenses and other similar items.
In 2016, Other, net of $49 million included a net charge of $50 million due to the interpretation of tax lawand double tax treaty agreements by competent tax authorities. In 2015, Other, net of $87 million included a netcharge of $74 million due to the interpretation of tax law and double tax treaty agreements by competent tax authorities.
In 2014, Provision for taxes included $279 million relating to income taxes recorded on $543 million of netgains from sale of businesses. This expense is primarily included in taxes at weighted-average tax andImpact of non-deductible goodwill allocated to divested businesses .

F-45
Deferred income tax assets and liabilities consisted of the following:
December 31,($ in millions) 2016 2015Deferred tax assets:Unused tax losses and credits 514 623Provisions and other accrued liabilities 865 887Pension 507 528Inventories 273 267Property, plant and equipment and other non-current assets 266 282Other 93 89Total gross deferred tax asset 2,518 2,676Valuation allowance (561) (606)Total gross deferred tax asset, net of valuation allowance 1,957 2,070Deferred tax liabilities:Property, plant and equipment (234) (279)Intangibles and other non-current assets (616) (721)Pension and other accrued liabilities (79) (143)Inventories (91) (91)Other current assets (108) (139)Unremitted earnings (537) (523)Other (92) (84)Total gross deferred tax liability (1,757) (1,980)Net deferred tax asset (liability) 200 90Included in:
current assets 888 881non-current assets 527 423current liabilities (258) (249)non-current liabilities (957) (965)
Net deferred tax asset (liability) 200 90
Certain entities have deferred tax assets related to net operating loss carry-forwards and other items. Asrecognition of these assets in certain entities did not meet the more likely than not criterion, valuation allowances havebeen recorded and amount to $561 million and $606 million, at December 31, 2016 and 2015, respectively. Unused taxlosses and credits at December 31, 2016 and 2015, in the table above, included $108 million and $127 million,respectively, for which the Company has established a full valuation allowance as, due to limitations imposed by therelevant tax law, the Company determined that, more likely than not, such deferred tax assets would not be realized.
At December 31, 2016 and 2015, deferred tax liabilities totaling $537 million and $523 million, respectively,have been provided for primarily in respect of withholding taxes, dividend distribution taxes or additional corporateincome taxes (hereafter withholding taxes ) on unremitted earnings which will be payable in foreign jurisdictions onthe repatriation of earnings to Switzerland. Income which has been generated outside of Switzerland and has alreadybeen subject to corporate income tax in such foreign jurisdictions is, to a large extent, tax exempt in Switzerland.Therefore, generally no or only limited Swiss income tax has to be provided for on the repatriated earnings of foreignsubsidiaries.
Certain countries levy withholding taxes on dividend distributions. Such taxes cannot always be fully reclaimedby the shareholder, although they have to be declared and withheld by the subsidiary. In 2016 and 2015, certain taxesarose in certain foreign jurisdictions for which the technical merits do not allow utilization of benefits. At December 31,2016 and 2015, foreign subsidiary retained earnings subject to withholding taxes upon distribution of approximately$100 million and $500 million, respectively, were considered as permanently reinvested, as these funds are used forfinancing current operations as well as business growth through working capital and capital expenditure in thosecountries and, consequently, no deferred tax liability was recorded.
At December 31, 2016, net operating loss carry-forwards of $1,622 million and tax credits of $125 million wereavailable to reduce future taxes of certain subsidiaries. Of these amounts, $846 million of loss carry-forwards and$101 million of tax credits will expire in varying amounts through 2036. The largest amount of these carry-forwardsrelated to the Company s Europe operations.

F-46
Unrecognized tax benefits consisted of the following:
Penalties andinterest
related toUnrecognized unrecognized
($ in millions) tax benefits tax benefits TotalClassification as unrecognized tax items on January 1, 2014 733 154 887Net change due to acquisitions and divestments (3) 1 (2)Increase relating to prior year tax positions 25 39 64Decrease relating to prior year tax positions (24) (7) (31)Increase relating to current year tax positions 85 85Decrease relating to current year tax positions (1) (1)Decrease due to settlements with tax authorities (19) (10) (29)Decrease as a result of the applicable statute of limitations (36) (19) (55)Exchange rate differences (55) (12) (67)Balance at December 31, 2014, which would, if recognized, affect the
effective tax rate 705 146 851Increase relating to prior year tax positions 52 38 90Decrease relating to prior year tax positions (33) (3) (36)Increase relating to current year tax positions 155 155Decrease due to settlements with tax authorities (38) (13) (51)Decrease as a result of the applicable statute of limitations (62) (15) (77)Exchange rate differences (35) (8) (43)Balance at December 31, 2015, which would, if recognized, affect the
effective tax rate 744 145 889Increase relating to prior year tax positions 88 74 162Decrease relating to prior year tax positions (21) (20) (41)Increase relating to current year tax positions 167 13 180Decrease due to settlements with tax authorities (96) (21) (117)Decrease as a result of the applicable statute of limitations (95) (13) (108)Exchange rate differences (27) (6) (33)Balance at December 31, 2016, which would, if recognized, affect the
effective tax rate 760 172 932
In 2016, 2015 and 2014, the Increase relating to current year tax positions included a total of $132 million,$127 million and $56 million, respectively, in taxes related to the interpretation of tax law and double tax treatyagreements by competent tax authorities.
At December 31, 2016, the Company expected the resolution, within the next twelve months, of uncertain taxpositions related to pending court cases amounting to $9 million for taxes, penalties and interest. Otherwise, theCompany had not identified any other significant changes which were considered reasonably possible to occur withinthe next twelve months.
At December 31, 2016, the earliest significant open tax years that remained subject to examination were thefollowing:
Region YearEurope 2011The Americas 2013Asia, Middle East & Africa 2007

F-47
Note 17 Employee benefits
The Company operates defined benefit pension plans, defined contribution pension plans, and terminationindemnity plans, in accordance with local regulations and practices. These plans cover a large portion of the Company semployees and provide benefits to employees in the event of death, disability, retirement, or termination of employment.Certain of these plans are multi-employer plans. The Company also operates other postretirement benefit plans includingpostretirement health care benefits and other employee-related benefits for active employees including long-serviceaward plans. The measurement date used for the Company s employee benefit plans is December 31. The fundingpolicies of the Company s plans are consistent with the local government and tax requirements.
The Company recognizes in its Consolidated Balance Sheets the funded status of its defined benefit pensionplans, postretirement plans, and other employee-related benefits measured as the difference between the fair value of theplan assets and the benefit obligation.
Obligations and funded status of the plans
The change in benefit obligation, change in fair value of plan assets, and funded status recognized in theConsolidated Balance Sheets were as follows:
2016 2015 2016 2015Defined pension Other postretirement
($ in millions) benefits benefitsBenefit obligations at January 1, 11,224 12,355 178 245Service cost 249 267 1 1Interest cost 280 305 6 8Contributions by plan participants 74 76Benefit payments (596) (614) (11) (15)Benefit obligations of businesses acquired (divested) (26)Actuarial (gain) loss 375 (469) (17) (31)Plan amendments and other (76) (141) (10) (27)Exchange rate differences (608) (555) (3)Benefit obligation at December 31, 10,896 11,224 147 178Fair value of plan assets at January 1, 9,743 10,465Actual return on plan assets 659 (8)Contributions by employer 270 243 11 15Contributions by plan participants 74 76Benefit payments (596) (614) (11) (15)Plan amendments and other (133)Exchange rate differences (524) (419)Fair value of plan assets at December 31, 9,493 9,743Funded status underfunded (1,403) (1,481) (147) (178)

F-48
The amounts recognized in "Accumulated other comprehensive loss" and "Noncontrolling interests" were:
December 31,
2016 2015 2014 2016 2015 2014Defined pension Other postretirement
($ in millions) benefits benefitsNet actuarial (loss) gain (2,237) (2,383) (2,765) 10 (8) (39)Prior service credit 108 127 2 31 33 16Amount recognized in OCI(1) and NCI(2) (2,129) (2,256) (2,763) 41 25 (23)Taxes associated with amount recognized
in OCI and NCI 487 512 652Amount recognized in OCI and NCI, net of tax(3) (1,642) (1,744) (2,111) 41 25 (23)
(1) OCI represent other comprehensive(2) NCI represents(3) NCI, net of tax, amounted to $0 million, $0 million and $(3) million at December 31, 2016, 2015 and 2014, respectively.
In addition, the following amounts were recognized in the Company's Consolidated Balance Sheets:
December 31,2016 2015 2016 2015
Defined pension Other postretirement($ in millions) benefits benefitsOverfunded plans 68 42Underfunded plans current (16) (18) (13) (14)Underfunded plans non-current (1,455) (1,505) (134) (164)Funded status - underfunded (1,403) (1,481) (147) (178)
December 31,($ in millions) 2016 2015Non-current assetsOverfunded pension plans 68 42Other employee-related benefits 22 26Prepaid pension and other employee benefits 90 68
December 31,($ in millions) 2016 2015Current liabilitiesUnderfunded pension plans (16) (18)Underfunded other postretirement benefit plans (13) (14)Other employee-related benefits (30) (34)Pension and other employee benefits (see Note 13) (59) (66)
December 31,($ in millions) 2016 2015Non-current liabilitiesUnderfunded pension plans (1,455) (1,505)Underfunded other postretirement benefit plans (134) (164)Other employee-related benefits (245) (255)Pension and other employee benefits (1,834) (1,924)

F-49
The funded status, calculated using the projected benefit obligation (PBO) and fair value of plan assets, forpension plans with a PBO in excess of fair value of plan assets (underfunded) or fair value of plan assets in excess ofPBO (overfunded), respectively, was:
December 31,2016 2015
($ in millions) PBO Assets Difference PBO Assets DifferencePBO exceeds assets 9,892 8,420 (1,472) 10,413 8,890 (1,523)Assets exceed PBO 1,004 1,073 69 811 853 42Total 10,896 9,493 (1,403) 11,224 9,743 (1,481)
The accumulated benefit obligation (ABO) for all defined benefit pension plans was $10,612 million and$10,924 million at December 31, 2016 and 2015, respectively. The funded status, calculated using the ABO and fairvalue of plan assets for pension plans with ABO in excess of fair value of plan assets (underfunded) or fair value of planassets in excess of ABO (overfunded), respectively, was:
December 31,2016 2015
($ in millions) ABO Assets Difference ABO Assets DifferenceABO exceeds assets 9,612 8,406 (1,206) 8,781 7,496 (1,285)Assets exceed ABO 1,000 1,087 87 2,143 2,247 104Total 10,612 9,493 (1,119) 10,924 9,743 (1,181)
All of the Company's other postretirement benefit plans are unfunded.
Components of net periodic benefit cost
Net periodic benefit cost consisted of the following:
2016 2015 2014 2016 2015 2014Defined pension Other postretirement
($ in millions) benefits benefitsService cost 249 267 243 1 1 1Interest cost 280 305 409 6 8 10Expected return on plan assets (402) (456) (481)Amortization of prior service cost (credit) 40 38 27 (12) (9) (9)Amortization of net actuarial loss 85 112 102 1Curtailments, settlements and special termination benefits 41 20 1Net periodic benefit cost 293 286 301 (5) 1 2
The net actuarial loss and prior service cost for defined pension benefits estimated to be amortized from other comprehensive into net periodic benefit cost in 2017 is $87 million and $35 million,
respectively.
The net prior service credit for other postretirement benefits estimated to be amortized fromother comprehensive into net periodic benefit cost in 2017 is $5 million. There is no significant actuarial gain orloss to be amortized in 2017.

F-50
Assumptions
The following weighted-average assumptions were used to determine benefit obligations:
December 31,
2016 2015 2016 2015Defined pension Other postretirement
(in %) benefits benefitsDiscount rate 2.3 2.6 3.3 3.6Rate of compensation increase 1.7 1.5Rate of pension increase 1.0 0.9
The discount rate assumptions are based upon AA-rated corporate bonds. In those countries with sufficientliquidity in corporate bonds, the Company used the current market long-term corporate bond yields and matched thebond duration with the average duration of the pension liabilities. In those countries where the liquidity of the AA-ratedcorporate bonds was deemed to be insufficient, the Company determined the discount rate by adding the credit spreadderived from an AA corporate bond index in another relevant liquid market, as adjusted for interest rate differentials, tothe domestic government bond curve or interest rate swap curve.
The following weighted-average assumptions were used to determine the periodic benefit
2016 2015 2014 2016 2015 2014Defined pension Other postretirement
(in %) benefits benefitsDiscount rate 2.6 2.6 3.6 3.6 3.5 4.2Expected long-term rate of return on plan assets 4.3 4.6 4.6Rate of compensation increase 1.5 1.7 1.8
The long-term rate of return on plan is derived for each benefit plan by considering theexpected future long-term return assumption for each individual asset class. A single long-term return assumption is thenderived for each plan based upon the target asset allocation.
The Company maintains other postretirement benefit plans, which are generally contributory withcontributions adjusted annually. The assumptions used were:
December 31,
2016 2015Health care cost trend rate assumed for next year 7.3% 7.7%Rate to which the trend rate is assumed to decline (the ultimate trend rate) 5.0% 5.0%Year that the rate reaches the ultimate trend rate 2028 2028
A one-percentage-point change in assumed health care cost trend rates would have the following effects atDecember 31, 2016:
1-percentage-point
($ in millions) Increase DecreaseEffect on total of service and interest cost 1Effect on postretirement benefit obligation 9 (8)
Plan assets
deriving from a limited number of these countries.
The pension plans are typically funded by regular contributions from employees and the Company. These plansare typically administered by boards of trustees (which include Company representatives) whose primary responsibilitiesinclude ensuring that the plans meet their liabilities through contributions and investment returns. The boards of trusteeshave the responsibility for making key investment strategy decisions within a risk-controlled framework.

F-51
The pension plan assets are invested in diversified portfolios that are managed by third-party asset managers, in
approved by the boards of trustees.
Plan assets are generally segregated from those of the Company and invested with the aim of meeting the
The boards of trustees manage the assets of the pension plans in a risk-controlled manner and assess the risksembedded in the pension plans through asset/liability management studies. Asset/liability management studies typicallytake place every three years. However, the risks of the plans are monitored on an ongoing basis.
to maximize the long-term returns of plan assets within specified riskparameters, while considering the future liabilities and liquidity needs of the individual plans. Risk measures taken intoaccount include the funding ratio of the plan, the likelihood of extraordinary cash contributions being required, the riskembedded in each individual asset class, and the plan asset portfolio as a whole.
whiweighted-average basis is as follows:
(in %) TargetAsset classEquity 22Fixed income 59Real estate 12Other 7
100
The actual asset allocations of the plans are in line with the target asset allocations.
Equity assets primarily include investments in large-cap and mid-cap publicly traded companies. Fixed incomeassets primarily include corporate bonds of companies from diverse industries and government bonds. Both fixedincome and equity assets are invested either via funds or directly in segregated investment mandates, and include anallocation to emerging markets. Real estate consists primarily of direct investments in real estate in Switzerland held in
reflects a variety of investment strategies.
Based on the above global asset allocation and the fair values of the plan assets, the expected long-term returnon assets at December 31, 2016, is 4.2 percent. The Company and the local boards of trustees regularly review theinvestment performance of the asset classes and individual asset managers. Due to the diversified nature of theinvestments, the Company is of the opinion that no significant concentration of risks exists in its pension fund assets.
The Company does not expect any plan assets to be returned to the employer during 2017.
At December 31, 2016 and 2015, plan assets include ABB8 million and $9 million, respectively.

F-52
For further
2.
December 31, 2016Total
($ in millions) Level 1 Level 2 Level 3 fair valueAsset classEquity
Equity securities 244 244Mutual funds/commingled funds 1,610 1,610Emerging market mutual funds/commingled funds 337 337
Fixed incomeGovernment and corporate securities 449 909 1,358Government and corporate mutual funds/commingled funds 3,446 3,446Emerging market bonds mutual funds/commingled funds 692 692
Real estate 33 1,116 1,149Insurance contracts 99 99Cash and short-term investments 260 104 364Private equity 114 114Hedge funds 13 13Commodities 67 67Total 953 7,297 1,243 9,493
December 31, 2015Total
($ in millions) Level 1 Level 2 Level 3 fair valueAsset classEquity
Equity securities 364 364Mutual funds/commingled funds 1,633 1,633Emerging market mutual funds/commingled funds 328 328
Fixed incomeGovernment and corporate securities 587 949 1,536Government and corporate mutual funds/commingled funds 3,257 3,257Emerging market bonds mutual funds/commingled funds 669 669
Real estate 74 1,106 1,180Insurance contracts 121 121Cash and short-term investments 160 219 379Private equity 123 123Hedge funds 94 94Commodities 59 59Total 1,111 7,309 1,323 9,743

F-53
The following table represents the movements of those asset categories whose fair values use significantunobservable inputs (Level 3):
Private Hedge Real Total($ in millions) equity funds estate Level 3Balance at January 1, 2015 136 93 842 1,071Return on plan assets
Assets still held at December 31, 2015 (9) 1 54 46Assets sold during the year 20 (1) (1) 18
Purchases (sales) (24) 215 191Exchange rate differences 1 (4) (3)Balance at December 31, 2015 123 94 1,106 1,323Return on plan assets
Assets still held at December 31, 2016 (9) 82 73Assets sold during the year 15 (4) 11
Purchases (sales) (13) (77) (1) (91)Transfers into Level 3 1 (3) (2)Exchange rate differences (3) (68) (71)Balance at December 31, 2016 114 13 1,116 1,243
Real estate properties, which are primarily located in Switzerland, are valued under the income approach usingthe discounted cash flow method, by which the market value of a property is determined as the total of all projectedfuture earnings discounted to the valuation date. The discount rates are determined for each property individuallyaccording to the location and specific use, and by considering initial yields of comparable markettransactions.
Private equity investments include investments in partnerships and related funds. Such investments consist ofpublicly traded and privately held securities. Publicly traded securities that are quoted in inactive markets are valuedusing available quotes and adjusted for liquidity restrictions. Privately held securities are valued taking into accountvarious factors, such as the most recent financing involving unrelated new investors, earnings multiple analyses usingcomparable companies and discounted cash flow analyses.
Hedge funds are not normally exchange-traded and the shares of the funds cannot be redeemed daily.Depending on the fund structure, the fair values are derived through modeling techniques based on the values of theunderlying assets adjusted to reflect liquidity and transferability restrictions.
Contributions
Employer contributions were as follows:
2016 2015 2016 2015Defined pension Other postretirement
($ in millions) benefits benefitsTotal contributions to defined benefit pension and
other postretirement benefit plans 270 243 11 15Of which, discretionary contributions to defined benefit pension plans 15 31
In 2016 and 2015, total contributions included non-cash contributions totaling $52 million and $22 million,respectively, of available-for-sale debt securities to certain of the pension plans.
The Company expects to contribute approximately $193 million, including $12 million in discretionarycontributions, to its defined benefit pension plans in 2017. These discretionary contributions are expected to be non-cashcontributions. The Company expects to contribute approximately $13 million to its other postretirement benefit plans in2017.

F-54
The Company also contributes to a number of defined contribution plans. The aggregate expense for theseplans was $210 million, $218 million and $236 million in 2016, 2015 and 2014, respectively. Contributions tomulti-employer plans were not significant in 2016, 2015 and 2014.
Estimated future benefit payments
The expected future cash flows to be paid by the plans in respect of pension and otherpostretirement benefit plans at December 31, 2016, are as follows:
Defined Otherpension postretirement
($ in millions) benefits benefits2017 593 132018 598 132019 578 132020 585 122021 563 12Years 2022 - 2026 2,718 51
Note 18 Share-based payment arrangements
The Company has three principal share-based payment plans, as more fully described in the respective sectionsbelow. Compensation cost for equity-settled awards is recorded in Total cost of sales and in Selling, general andadministrative expenses and totaled $54 million, $61 million and $73 million in 2016, 2015 and 2014, respectively.Compensation cost for cash-settled awards is recorded in Selling, general and administrative expenses and is disclosedin the WARs , LTIP and Other share-based payments sections of this note. The total tax benefit recognized in2016, 2015 and 2014 was not significant.
At December 31, 2016, the Company had the ability to issue up to 94 million new shares out of contingentcapital in connection with share-based payment arrangements. In addition, 29 million shares (of the 76 million sharesheld by the Company as treasury stock at December 31, 2016) could be used to settle share-based payment arrangements(the remaining shares of treasury stock are held for cancellation see Note 19).
As the primary trading market for the shares of ABB Ltd is the SIX Swiss Exchange (on which the shares aretraded in Swiss francs) and substantially all the share-based payment arrangements with employees are based on theSwiss franc share or have strike prices set in Swiss francs, certain data disclosed below related to the instruments grantedunder share-based payment arrangements are presented in Swiss francs.
MIP
Under the MIP, the Company offers options and cash-settled WARs to key employees for no consideration.
The options granted under the MIP allow participants to purchase shares of ABB Ltd at predetermined prices.Participants may sell the options rather than exercise the right to purchase shares. Equivalent warrants are listed by athird-party bank on the SIX Swiss Exchange, which facilitates pricing and transferability of instruments granted underthis plan. The options entitle the holder to request that the third-party bank purchase such options at the market price ofequivalent listed warrants related to that MIP launch. If the participant elects to sell the options, the instruments willthereafter be held by a third party and, consequently, the Company s obligation to deliver shares will be toward this thirdparty. Each WAR gives the participant the right to receive, in cash, the market price of an equivalent listed warrant onthe date of exercise of the WAR. Participants may exercise or sell options and exercise WARs after the vesting period,which is three years from the date of grant. Vesting restrictions can be waived in certain circumstances such as death ordisability. All options and WARs expire six years from the date of grant.
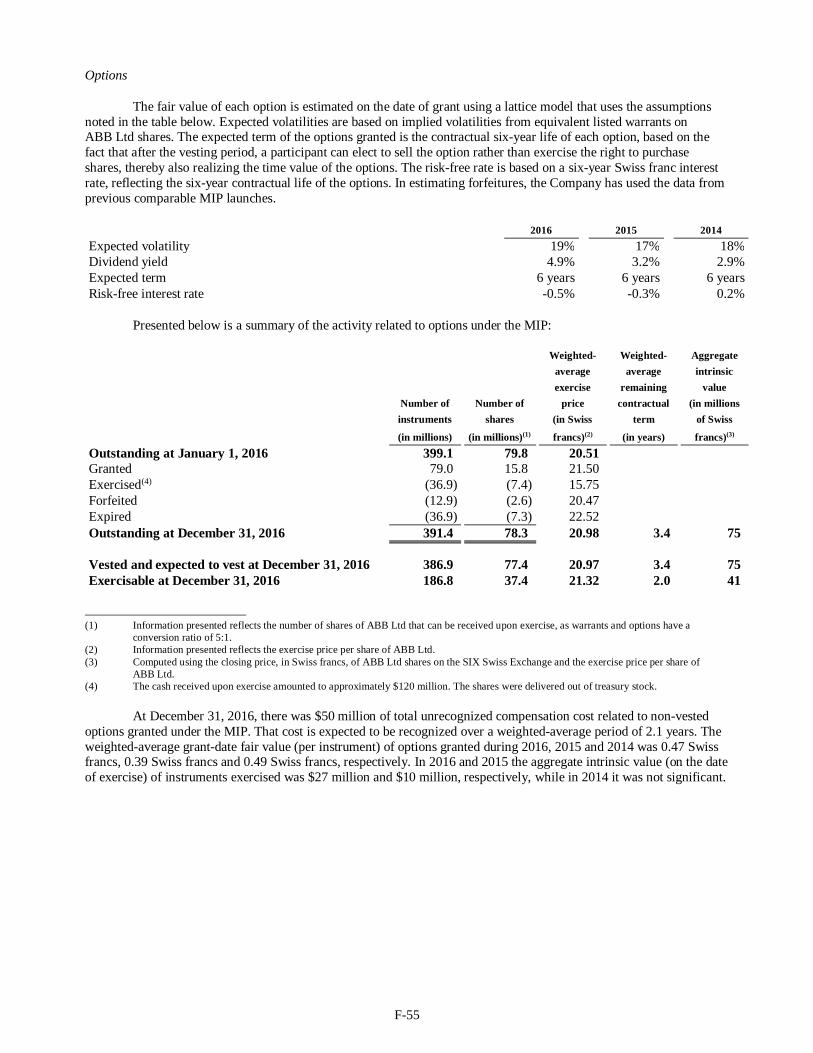
F-55
Options
The fair value of each option is estimated on the date of grant using a lattice model that uses the assumptionsnoted in the table below. Expected volatilities are based on implied volatilities from equivalent listed warrants onABB Ltd shares. The expected term of the options granted is the contractual six-year life of each option, based on thefact that after the vesting period, a participant can elect to sell the option rather than exercise the right to purchaseshares, thereby also realizing the time value of the options. The risk-free rate is based on a six-year Swiss franc interestrate, reflecting the six-year contractual life of the options. In estimating forfeitures, the Company has used the data fromprevious comparable MIP launches.
2016 2015 2014Expected volatility 19% 17% 18%Dividend yield 4.9% 3.2% 2.9%Expected term 6 years 6 years 6 yearsRisk-free interest rate -0.5% -0.3% 0.2%
Presented below is a summary of the activity related to options under the MIP:
Weighted- Weighted- Aggregateaverage average intrinsicexercise remaining value
Number of Number of price contractual (in millionsinstruments shares (in Swiss term of Swiss
(in millions) (in millions)(1) francs)(2) (in years) francs)(3)
Outstanding at January 1, 2016 399.1 79.8 20.51Granted 79.0 15.8 21.50Exercised(4) (36.9) (7.4) 15.75Forfeited (12.9) (2.6) 20.47Expired (36.9) (7.3) 22.52Outstanding at December 31, 2016 391.4 78.3 20.98 3.4 75
Vested and expected to vest at December 31, 2016 386.9 77.4 20.97 3.4 75Exercisable at December 31, 2016 186.8 37.4 21.32 2.0 41
(1) Information presented reflects the number of shares of ABB Ltd that can be received upon exercise, as warrants and options have aconversion ratio of 5:1.
(2) Information presented reflects the exercise price per share of ABB Ltd.(3) Computed using the closing price, in Swiss francs, of ABB Ltd shares on the SIX Swiss Exchange and the exercise price per share of
ABB Ltd.(4) The cash received upon exercise amounted to approximately $120 million. The shares were delivered out of treasury stock.
At December 31, 2016, there was $50 million of total unrecognized compensation cost related to non-vestedoptions granted under the MIP. That cost is expected to be recognized over a weighted-average period of 2.1 years. Theweighted-average grant-date fair value (per instrument) of options granted during 2016, 2015 and 2014 was 0.47 Swissfrancs, 0.39 Swiss francs and 0.49 Swiss francs, respectively. In 2016 and 2015 the aggregate intrinsic value (on the dateof exercise) of instruments exercised was $27 million and $10 million, respectively, while in 2014 it was not significant.
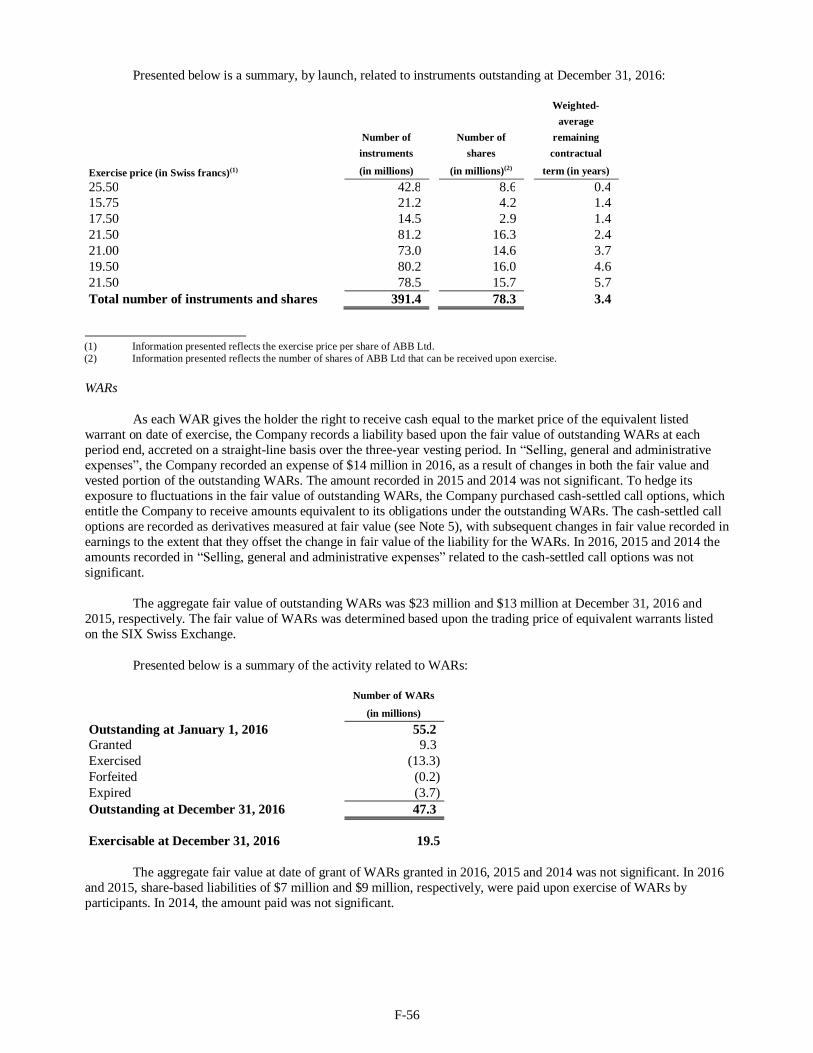
F-56
Presented below is a summary, by launch, related to instruments outstanding at December 31, 2016:
Weighted-average
Number of Number of remaininginstruments shares contractual
Exercise price (in Swiss francs)(1) (in millions) (in millions)(2) term (in years)25.50 42.8 8.6 0.415.75 21.2 4.2 1.417.50 14.5 2.9 1.421.50 81.2 16.3 2.421.00 73.0 14.6 3.719.50 80.2 16.0 4.621.50 78.5 15.7 5.7Total number of instruments and shares 391.4 78.3 3.4
(1) Information presented reflects the exercise price per share of ABB Ltd.(2) Information presented reflects the number of shares of ABB Ltd that can be received upon exercise.
WARs
As each WAR gives the holder the right to receive cash equal to the market price of the equivalent listedwarrant on date of exercise, the Company records a liability based upon the fair value of outstanding WARs at eachperiod end, accreted on a straight-line basis over the three-year vesting period. In general and administrative
the Company recorded an expense of $14 million in 2016, as a result of changes in both the fair value andvested portion of the outstanding WARs. The amount recorded in 2015 and 2014 was not significant. To hedge itsexposure to fluctuations in the fair value of outstanding WARs, the Company purchased cash-settled call options, whichentitle the Company to receive amounts equivalent to its obligations under the outstanding WARs. The cash-settled calloptions are recorded as derivatives measured at fair value (see Note 5), with subsequent changes in fair value recorded inearnings to the extent that they offset the change in fair value of the liability for the WARs. In 2016, 2015 and 2014 theamounts recorded in general and administrative related to the cash-settled call options was notsignificant.
The aggregate fair value of outstanding WARs was $23 million and $13 million at December 31, 2016 and2015, respectively. The fair value of WARs was determined based upon the trading price of equivalent warrants listedon the SIX Swiss Exchange.
Presented below is a summary of the activity related to WARs:
Number of WARs
(in millions)Outstanding at January 1, 2016 55.2Granted 9.3Exercised (13.3)Forfeited (0.2)Expired (3.7)Outstanding at December 31, 2016 47.3
Exercisable at December 31, 2016 19.5
The aggregate fair value at date of grant of WARs granted in 2016, 2015 and 2014 was not significant. In 2016and 2015, share-based liabilities of $7 million and $9 million, respectively, were paid upon exercise of WARs byparticipants. In 2014, the amount paid was not significant.

F-57
ESAP
The employee share acquisition plan (ESAP) is an employee stock-option plan with a savings feature.Employees save over a twelve-month period, by way of regular payroll deductions. At the end of the savings period,employees choose whether to exercise their stock options using their savings plus interest, if any, to buy ABB Ltd shares(American Depositary Shares (ADS) in the case of employees in the United States and Canada each ADS representingone registered share of the Company) at the exercise price set at the grant date, or have their savings returned with anyinterest. The savings are accumulated in bank accounts held by a third-party trustee on behalf of the participants andearn interest, where applicable. Employees can withdraw from the ESAP at any time during the savings period and willbe entitled to a refund of their accumulated savings.
The fair value of each option is estimated on the date of grant using the same option valuation model asdescribed under the MIP, using the assumptions noted in the table below. The expected term of the option granted hasbeen determined to be the contractual one-year life of each option, at the end of which the options vest and theparticipants are required to decide whether to exercise their options or have their savings returned with interest. Therisk-free rate is based on one-year Swiss franc interest rates, reflecting the one-year contractual life of the options. Inestimating forfeitures, the Company has used the data from previous ESAP launches.
2016 2015 2014Expected volatility 20% 20% 18%Dividend yield 3.7% 3.9% 3.1%Expected term 1 year 1 year 1 yearRisk-free interest rate -0.7% -0.8% -0.1%
Presented below is a summary of activity under the ESAP:
Weighted- Weighted- Aggregateaverage average intrinsicexercise remaining value
Number of price contractual (in millionsshares (in Swiss term of Swiss
(in millions)(1) francs)(2) (in years) francs)(2)(3)
Outstanding at January 1, 2016 3.7 18.78Granted 3.4 20.12Forfeited (0.2) 18.84Exercised(4) (2.6) 18.78Not exercised (savings returned plus interest) (0.9) 18.78Outstanding at December 31, 2016 3.4 20.12 0.8 4.7
Vested and expected to vest at December 31, 2016 3.3 20.12 0.8 4.5Exercisable at December 31, 2016
(1) Includes shares represented by ADS.(2) Information presented for ADS is based on equivalent Swiss franc denominated awards.(3) Computed using the closing price, in Swiss francs, of ABB Ltd shares on the SIX Swiss Exchange and the exercise price of each option in
Swiss francs.(4) The cash received upon exercise was approximately $50 million and the corresponding tax benefit was not significant. The shares were
delivered out of treasury stock.
The exercise prices per ABB Ltd share and per ADS of 20.12 Swiss francs and $20.52, respectively, for the2016 grant, 18.78 Swiss francs and $19.10, respectively, for the 2015 grant, and 20.97 Swiss francs and $21.81,respectively, for the 2014 grant were determined using the closing price of the ABB Ltd share on the SIX SwissExchange and ADS on the New York Stock Exchange on the respective grant dates.
At December 31, 2016, the total unrecognized compensation cost related to non-vested options granted underthe ESAP was not significant. The weighted-average grant-date fair value (per option) of options granted during 2016,2015 and 2014 was 1.24 Swiss francs, 1.07 Swiss francs and 1.19 Swiss francs, respectively. The total intrinsic value(on the date of exercise) of options exercised in 2016, 2015 and 2014 was not significant.

F-58
LTIP
The Company has a long-term incentive plan (LTIP) for members of its Executive Committee and selectedother senior executives (Eligible Participants), as defined in the terms of the LTIP. The LTIP involves annualconditional grants of the stock to such Eligible Participants that are subject to certain conditions.
The 2016 and 2015 LTIP launches are each composed of two performance components: (i) a component whichis based on the achievement of a consolidated net income threshold and (ii) a component which is based on the
earnings per share performance. The 2014 launch under the LTIP is composed of two components: (i) aperformance component based on the earnings per share performance and (ii) a retention component.
For shares to vest under the threshold net income component of the 2016 and 2015 LTIP launches, the consolidated net income has to reach a certain level set by the Board of Directors at the launch of the LTIP.
The shares will not vest if this threshold is not achieved and will vest at 100 percent if this threshold is equaled orexceeded. In addition, the Eligible Participant has to fulfill the service condition as defined in the terms and conditionsof the LTIP.
For the earnings per share performance component of the 2016, 2015 and 2014 LTIP launches, the actualnumber of shares that will vest at a future date is dependent on (i) the weighted cumulative earnings pershare performance over three financial years, beginning with the year of launch, and (ii) the fulfillment of the servicecondition as defined in the terms and conditions of the LTIP. The cumulative earnings per share performance isweighted as follows: 33 percent of the first result, 67 percent of the second result and 100 percent of thethird result. The actual number of shares that ultimately vest will vary depending on the weighted cumulativeearnings per share outcome, interpolated between a lower threshold (no shares vest) and an upper threshold (the numberof shares vesting is capped at 200 percent of the conditional grant).
Under the retention component of the 2014 LTIP launch, each Eligible Participant was conditionally granted anindividually defined maximum number of shares which fully vest at the end of the respective vesting periods (if theparticipant remains an Eligible Participant until the end of such period).
Under the threshold net income component of the 2016 and 2015 LTIP launches, an Eligible Participantreceives 70 percent of the shares that have vested in the form of shares and 30 percent of the value of the shares thathave vested in cash, with the possibility to elect to also receive the 30 percent portion in shares rather than in cash. Forthe 2016 and 2015 LTIP launches, under the earnings per share performance component, an Eligible Participant receives70 percent of the shares that have vested in the form of shares and 30 percent of the value of the shares that have vestedin cash, with the possibility to elect to also receive the 30 percent portion in shares rather than in cash, while for the2014 LTIP launch an Eligible Participant receives, in cash, 100 percent of the value of the shares that have vested.Under the retention component of the 2014 LTIP launch, an Eligible Participant receives 70 percent of the shares thathave vested in the form of shares and 30 percent of the value of the shares that have vested in cash, with the possibilityto elect to also receive the 30 percent portion in shares rather than in cash.

F-59
Presented below is a summary of activity under the LTIP:
Number of Shares Conditionally GrantedEquity & Weighted-Cash or averagechoice of grant-date
100% Equity Only Cash fair valueSettlement(1) Settlement(2) Total per share
(in millions) (in millions) (in millions) (Swiss francs)Nonvested at January 1, 2016 2.1 0.7 2.8 20.96Granted 1.0 1.0 20.77Vested (0.5) (0.2) (0.7) 20.93Forfeited (0.2) (0.2) 20.95Nonvested at December 31, 2016 2.6 0.3 2.9 20.89
(1) Shares that, subject to vesting, the Eligible Participant can elect to receive 100 percent in the form of shares.(2) Shares that, subject to vesting, the Eligible Participant can only receive in cash.
Equity-settled awards are recorded in the stock and additional paid-in component of equity, with compensation cost recorded in general and administrative over the vesting
period (which is from grant date to the end of the vesting period) based on the grant-date fair value of the shares.Cash-settled awards are recorded as a liability, remeasured at fair value at each reporting date for the percentage vested,with changes in the liability recorded in general and administrative expense
At December 31, 2016, there was $19 million of total unrecognized compensation cost related to equity-settledawards under the LTIP. That cost is expected to be recognized over a weighted-average period of 2 years. Thecompensation cost recorded in 2016, 2015 and 2014 for cash-settled awards was not significant.
The aggregate fair value, at the dates of grant, of shares granted in 2016, 2015 and 2014 was $22 million,$23 million and $22 million, respectively. The total grant-date fair value of shares that vested during 2016, 2015 and2014 was $15 million, $12 million and $15 million, respectively. The weighted-average grant-date fair value (per share)of shares granted during 2016, 2015 and 2014 was 20.77 Swiss francs, 21.54 Swiss francs and 20.35 Swiss francs,respectively.
For the net income threshold component of the 2016 and 2015 LTIP launches, the fair value of the grantedshares is based on the probability of reaching the threshold as well as on the market price of the ABB Ltd share at grantdate for equity-settled awards and at each reporting date for cash-settled awards. For the earnings per share componentof the LTIP launches, the fair value of granted shares is based on the market price of the ABB Ltd share at grant date forequity-settled awards and at each reporting date for cash-settled awards, as well as the probable outcome of the earningsper share achievement that would result in the vesting of the highest number of shares, as computed using a Monte Carlosimulation model. The main inputs to this model are the and external financial revenue growthrates and Operational EBITA margin expectations. For the retention component under the 2014 LTIP launch, the fairvalue of granted shares for equity-settled awards is based on the market price of the ABB Ltd share on grant date and thefair value of granted shares for cash-settled awards is based on the market price of the ABB Ltd share at each reportingdate.
Other share-based payments
The Company has other minor share-based payment arrangements with certain employees. The compensationcost related to these arrangements in 2016, 2015 and 2014 was not significant.
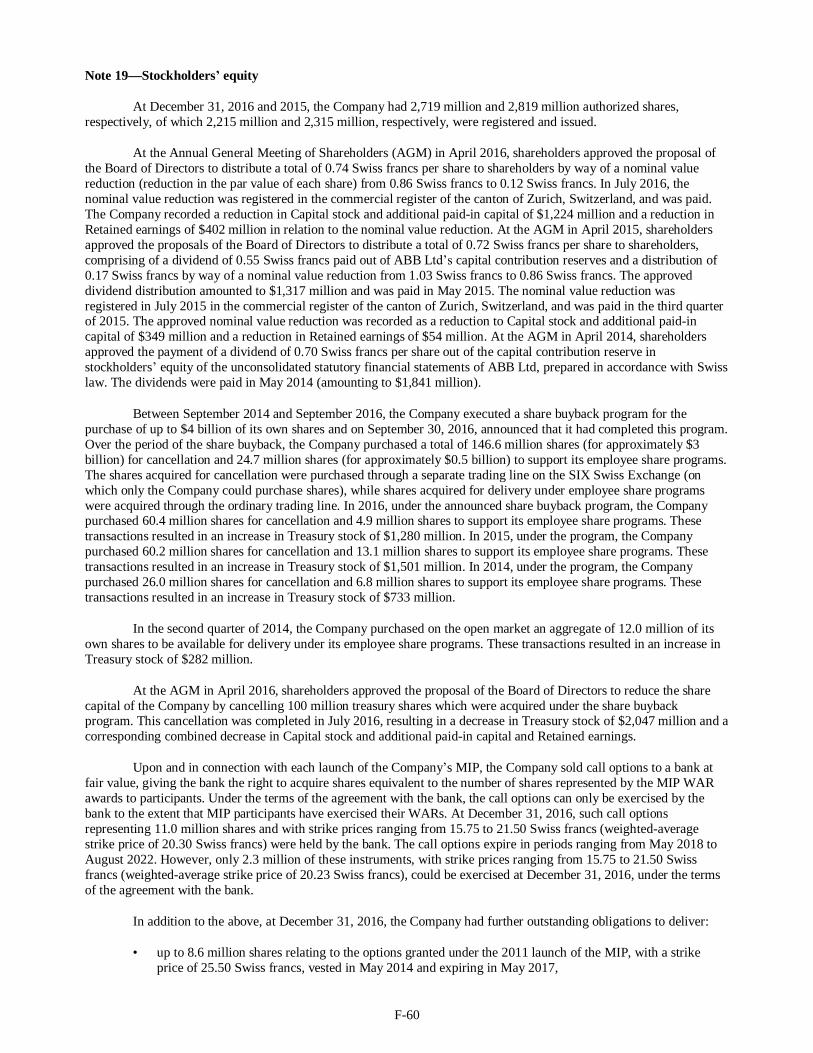
F-60
Note 19 Stockholders equity
At December 31, 2016 and 2015, the Company had 2,719 million and 2,819 million authorized shares,respectively, of which 2,215 million and 2,315 million, respectively, were registered and issued.
At the Annual General Meeting of Shareholders (AGM) in April 2016, shareholders approved the proposal ofthe Board of Directors to distribute a total of 0.74 Swiss francs per share to shareholders by way of a nominal valuereduction (reduction in the par value of each share) from 0.86 Swiss francs to 0.12 Swiss francs. In July 2016, thenominal value reduction was registered in the commercial register of the canton of Zurich, Switzerland, and was paid.The Company recorded a reduction in Capital stock and additional paid-in capital of $1,224 million and a reduction inRetained earnings of $402 million in relation to the nominal value reduction. At the AGM in April 2015, shareholdersapproved the proposals of the Board of Directors to distribute a total of 0.72 Swiss francs per share to shareholders,comprising of a dividend of 0.55 Swiss francs paid out of ABB capital contribution reserves and a distribution of0.17 Swiss francs by way of a nominal value reduction from 1.03 Swiss francs to 0.86 Swiss francs. The approveddividend distribution amounted to $1,317 million and was paid in May 2015. The nominal value reduction wasregistered in July 2015 in the commercial register of the canton of Zurich, Switzerland, and was paid in the third quarterof 2015. The approved nominal value reduction was recorded as a reduction to Capital stock and additional paid-incapital of $349 million and a reduction in Retained earnings of $54 million. At the AGM in April 2014, shareholdersapproved the payment of a dividend of 0.70 Swiss francs per share out of the capital contribution reserve instockholders equity of the unconsolidated statutory financial statements of ABB Ltd, prepared in accordance with Swisslaw. The dividends were paid in May 2014 (amounting to $1,841 million).
Between September 2014 and September 2016, the Company executed a share buyback program for thepurchase of up to $4 billion of its own shares and on September 30, 2016, announced that it had completed this program.Over the period of the share buyback, the Company purchased a total of 146.6 million shares (for approximately $3billion) for cancellation and 24.7 million shares (for approximately $0.5 billion) to support its employee share programs.The shares acquired for cancellation were purchased through a separate trading line on the SIX Swiss Exchange (onwhich only the Company could purchase shares), while shares acquired for delivery under employee share programswere acquired through the ordinary trading line. In 2016, under the announced share buyback program, the Companypurchased 60.4 million shares for cancellation and 4.9 million shares to support its employee share programs. Thesetransactions resulted in an increase in Treasury stock of $1,280 million. In 2015, under the program, the Companypurchased 60.2 million shares for cancellation and 13.1 million shares to support its employee share programs. Thesetransactions resulted in an increase in Treasury stock of $1,501 million. In 2014, under the program, the Companypurchased 26.0 million shares for cancellation and 6.8 million shares to support its employee share programs. Thesetransactions resulted in an increase in Treasury stock of $733 million.
In the second quarter of 2014, the Company purchased on the open market an aggregate of 12.0 million of itsown shares to be available for delivery under its employee share programs. These transactions resulted in an increase inTreasury stock of $282 million.
At the AGM in April 2016, shareholders approved the proposal of the Board of Directors to reduce the sharecapital of the Company by cancelling 100 million treasury shares which were acquired under the share buybackprogram. This cancellation was completed in July 2016, resulting in a decrease in Treasury stock of $2,047 million and acorresponding combined decrease in Capital stock and additional paid-in capital and Retained earnings.
Upon and in connection with each launch of the Company s MIP, the Company sold call options to a bank atfair value, giving the bank the right to acquire shares equivalent to the number of shares represented by the MIP WARawards to participants. Under the terms of the agreement with the bank, the call options can only be exercised by thebank to the extent that MIP participants have exercised their WARs. At December 31, 2016, such call optionsrepresenting 11.0 million shares and with strike prices ranging from 15.75 to 21.50 Swiss francs (weighted-averagestrike price of 20.30 Swiss francs) were held by the bank. The call options expire in periods ranging from May 2018 toAugust 2022. However, only 2.3 million of these instruments, with strike prices ranging from 15.75 to 21.50 Swissfrancs (weighted-average strike price of 20.23 Swiss francs), could be exercised at December 31, 2016, under the termsof the agreement with the bank.
In addition to the above, at December 31, 2016, the Company had further outstanding obligations to deliver:
up to 8.6 million shares relating to the options granted under the 2011 launch of the MIP, with a strikeprice of 25.50 Swiss francs, vested in May 2014 and expiring in May 2017,

F-61
up to 7.1 million shares relating to the options granted under the 2012 launches of the MIP, with aweighted-average strike price of 16.46 Swiss francs, vested in May 2015 and expiring in May 2018,
up to 16.3 million shares relating to the options granted under the 2013 launch of the MIP, with a strikeprice of 21.50 Swiss francs, vested in May 2016 and expiring in May 2019,
up to 14.6 million shares relating to the options granted under the 2014 launch of the MIP, with a strikeprice of 21.00 Swiss francs, vesting in August 2017 and expiring in August 2020,
up to 16.0 million shares relating to the options granted under the 2015 launch of the MIP, with a strikeprice of 19.50 Swiss francs, vesting in August 2018 and expiring in August 2021,
up to 15.7 million shares relating to the options granted under the 2016 launch of the MIP, with a strikeprice of 21.50 Swiss francs, vesting in August 2019 and expiring in August 2022,
up to 3.4 million shares relating to the ESAP, vesting and expiring in October 2017,
up to 3.6 million shares to Eligible Participants under the 2016, 2015 and 2014 launches of the LTIP,vesting and expiring in June 2019, June 2018 and August 2017, respectively, and
less than 1 million shares in connection with certain other share-based payment arrangements withemployees.
See Note 18 for a description of the above share-based payment arrangements.
In 2016, 2015 and 2014, the Company delivered 8.9 million, 5.3 million and 1.3 million shares, respectively,out of treasury stock, for options exercised in relation to the MIP. In addition, in 2016 the Company delivered 2.6million shares from treasury stock under the ESAP. In 2015 and 2014 the number of shares delivered under the ESAPwas not significant.
Amounts available to be distributed as dividends to the stockholders of ABB Ltd are based on the requirementsof Swiss law and ABB Ltd s Articles of Incorporation, and are determined based on amounts presented in theunconsolidated financial statements of ABB Ltd, prepared in accordance with Swiss law. At December 31, 2016, thetotal unconsolidated stockholders equity of ABB Ltd was 9,029 million Swiss francs ($8,840 million), including266 million Swiss francs ($260 million) representing share capital, 10,283 million Swiss francs ($10,068 million)representing reserves and 1,520 million Swiss francs ($1,488 million) representing a reduction of equity for own shares(treasury stock). Of the reserves, 1,520 million Swiss francs ($1,488 million) relating to own shares and 53 millionSwiss francs ($52 million) representing 20 percent of share capital, are restricted and not available for distribution.
In February 2017, the Company announced that a proposal will be put to the 2017 AGM for approval by theshareholders to distribute 0.76 Swiss francs per share to shareholders.
Note 20 Earnings per share
Basic earnings per share is calculated by dividing income by the weighted-average number of sharesoutstanding during the year. Diluted earnings per share is calculated by dividing income by the weighted-averagenumber of shares outstanding during the year, assuming that all potentially dilutive securities were exercised, if dilutive.Potentially dilutive securities comprise outstanding written call options and outstanding options and shares grantedsubject to certain conditions under the Company s share-based payment arrangements. In 2016, 2015 and 2014,outstanding securities representing a maximum of 87 million, 78 million and 59 million shares, respectively, wereexcluded from the calculation of diluted earnings per share as their inclusion would have been anti-dilutive.
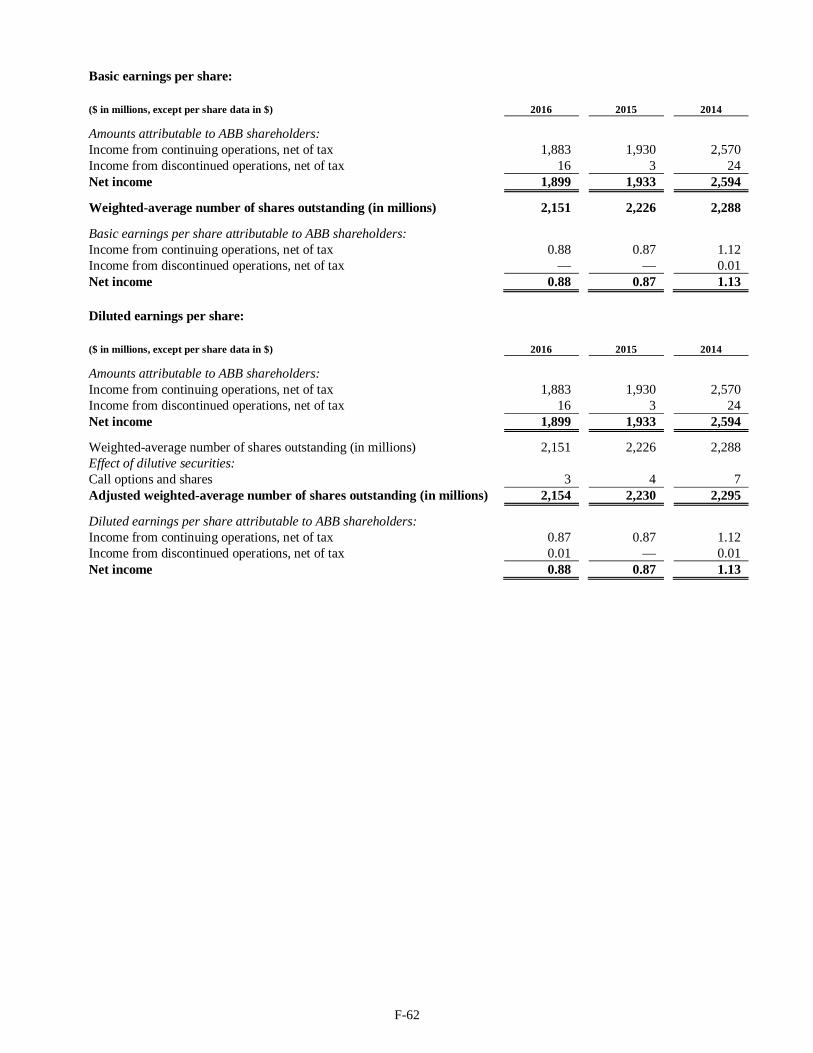
F-62
Basic earnings per share:
($ in millions, except per share data in $) 2016 2015 2014
Amounts attributable to ABB shareholders:Income from continuing operations, net of tax 1,883 1,930 2,570Income from discontinued operations, net of tax 16 3 24Net income 1,899 1,933 2,594
Weighted-average number of shares outstanding (in millions) 2,151 2,226 2,288
Basic earnings per share attributable to ABB shareholders:Income from continuing operations, net of tax 0.88 0.87 1.12Income from discontinued operations, net of tax 0.01Net income 0.88 0.87 1.13
Diluted earnings per share:
($ in millions, except per share data in $) 2016 2015 2014
Amounts attributable to ABB shareholders:Income from continuing operations, net of tax 1,883 1,930 2,570Income from discontinued operations, net of tax 16 3 24Net income 1,899 1,933 2,594
Weighted-average number of shares outstanding (in millions) 2,151 2,226 2,288Effect of dilutive securities:Call options and shares 3 4 7Adjusted weighted-average number of shares outstanding (in millions) 2,154 2,230 2,295
Diluted earnings per share attributable to ABB shareholders:Income from continuing operations, net of tax 0.87 0.87 1.12Income from discontinued operations, net of tax 0.01 0.01Net income 0.88 0.87 1.13

F-63
Note 21 Other comprehensive income
The following table includes amounts recorded within Total other comprehensive income (loss) including therelated income tax effects.
2016 2015 2014Before Tax Net of Before Tax Net of Before Tax Net of
($ in millions) tax effect tax tax effect tax tax effect taxForeign currency translation adjustments:Net change during the year (462) (12) (474) (1,105) 47 (1,058) (1,691) 11 (1,680)Available-for-sale securities:Net unrealized gains (losses) arising
during the year (8) 1 (7) (14) 5 (9)Reclassification adjustments for net
(gains) losses included in net income 1 1 21 (6) 15Net change during the year (7) 1 (6) 7 (1) 6Pension and other postretirement plans:Prior service (costs) credits arising
during the year (46) 6 (40) 113 (25) 88 (5) 2 (3)Net actuarial gains (losses) arising
during the year 38 6 44 285 (75) 210 (826) 212 (614)Amortization of prior service cost included
in net income 28 (2) 26 29 (3) 26 18 (1) 17Amortization of net actuarial loss included
in net income 85 (23) 62 113 (31) 82 102 (21) 81Net losses from pension settlements
included in net income 37 (11) 26 15 (6) 9 (3) 1 (2)Net change during the year 142 (24) 118 555 (140) 415 (714) 193 (521)Cash flow hedge derivatives:Net gains (losses) arising during the year 21 (5) 16 (26) 6 (20) (65) 13 (52)Reclassification adjustments for net (gains)
losses included in net income (7) 1 (6) 39 (9) 30 10 (1) 9Net change during the year 14 (4) 10 13 (3) 10 (55) 12 (43)Total other comprehensive income (loss) (306) (40) (346) (544) (95) (639) (2,453) 215 (2,238)
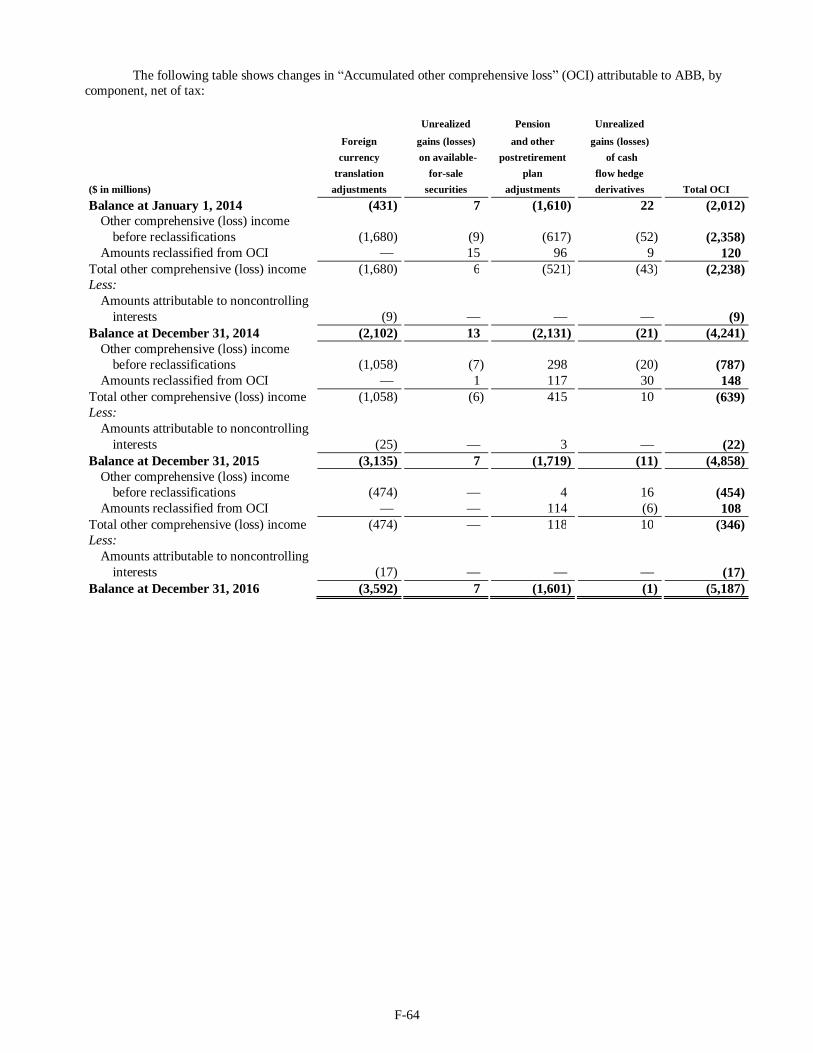
F-64
The following table shows changes in Accumulated other comprehensive loss (OCI) attributable to ABB, bycomponent, net of tax:
Unrealized Pension Unrealized
Foreign gains (losses) and other gains (losses)currency on available- postretirement of cash
translation for-sale plan flow hedge($ in millions) adjustments securities adjustments derivatives Total OCIBalance at January 1, 2014 (431) 7 (1,610) 22 (2,012)
Other comprehensive (loss) incomebefore reclassifications (1,680) (9) (617) (52) (2,358)
Amounts reclassified from OCI 15 96 9 120Total other comprehensive (loss) income (1,680) 6 (521) (43) (2,238)Less:
Amounts attributable to noncontrollinginterests (9) (9)
Balance at December 31, 2014 (2,102) 13 (2,131) (21) (4,241)Other comprehensive (loss) income
before reclassifications (1,058) (7) 298 (20) (787)Amounts reclassified from OCI 1 117 30 148
Total other comprehensive (loss) income (1,058) (6) 415 10 (639)Less:
Amounts attributable to noncontrollinginterests (25) 3 (22)
Balance at December 31, 2015 (3,135) 7 (1,719) (11) (4,858)Other comprehensive (loss) income
before reclassifications (474) 4 16 (454)Amounts reclassified from OCI 114 (6) 108
Total other comprehensive (loss) income (474) 118 10 (346)Less:
Amounts attributable to noncontrollinginterests (17) (17)
Balance at December 31, 2016 (3,592) 7 (1,601) (1) (5,187)
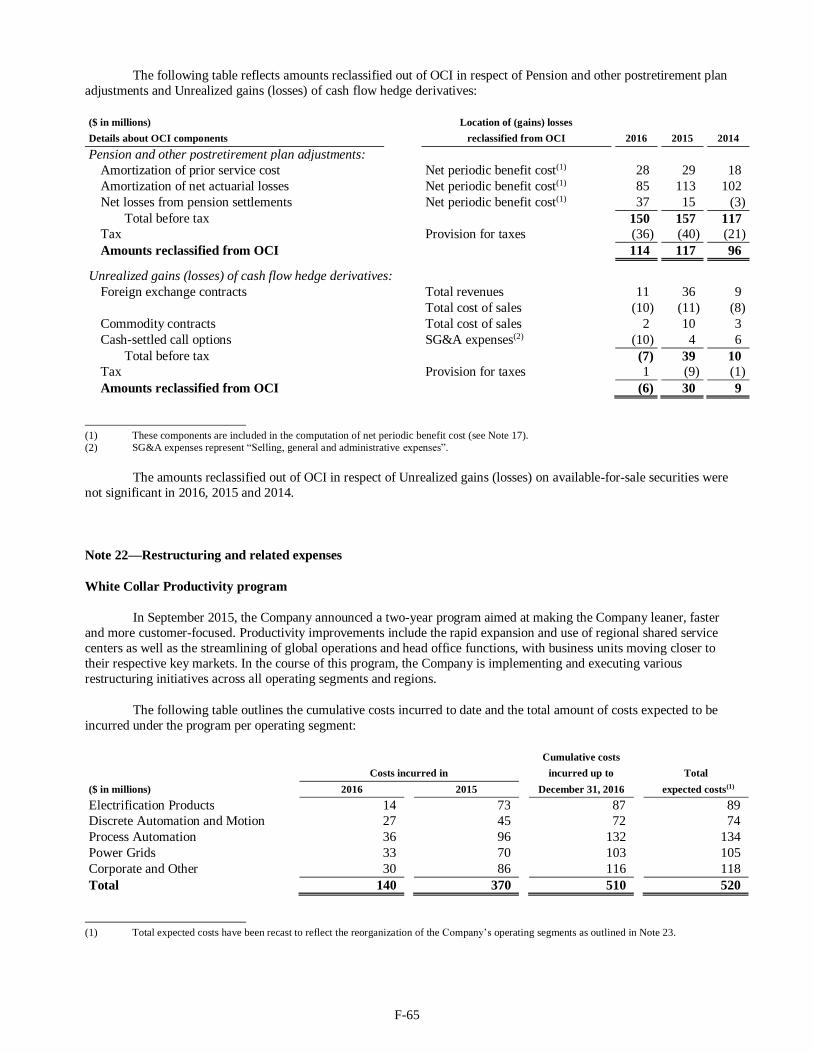
F-65
The following table reflects amounts reclassified out of OCI in respect of Pension and other postretirement planadjustments and Unrealized gains (losses) of cash flow hedge derivatives:
($ in millions) Location of (gains) lossesDetails about OCI components reclassified from OCI 2016 2015 2014Pension and other postretirement plan adjustments:
Amortization of prior service cost Net periodic benefit cost(1) 28 29 18Amortization of net actuarial losses Net periodic benefit cost(1) 85 113 102Net losses from pension settlements Net periodic benefit cost(1) 37 15 (3)
Total before tax 150 157 117Tax Provision for taxes (36) (40) (21)Amounts reclassified from OCI 114 117 96
Unrealized gains (losses) of cash flow hedge derivatives:Foreign exchange contracts Total revenues 11 36 9
Total cost of sales (10) (11) (8)Commodity contracts Total cost of sales 2 10 3Cash-settled call options SG&A expenses(2) (10) 4 6
Total before tax (7) 39 10Tax Provision for taxes 1 (9) (1)Amounts reclassified from OCI (6) 30 9
(1) These components are included in the computation of net periodic benefit cost (see Note 17).(2) SG&A expenses represent general and administrative
The amounts reclassified out of OCI in respect of Unrealized gains (losses) on available-for-sale securities werenot significant in 2016, 2015 and 2014.
Note 22 Restructuring and related expenses
White Collar Productivity program
In September 2015, the Company announced a two-year program aimed at making the Company leaner, fasterand more customer-focused. Productivity improvements include the rapid expansion and use of regional shared servicecenters as well as the streamlining of global operations and head office functions, with business units moving closer totheir respective key markets. In the course of this program, the Company is implementing and executing variousrestructuring initiatives across all operating segments and regions.
The following table outlines the cumulative costs incurred to date and the total amount of costs expected to beincurred under the program per operating segment:
Cumulative costsCosts incurred in incurred up to Total
($ in millions) 2016 2015 December 31, 2016 expected costs(1)
Electrification Products 14 73 87 89Discrete Automation and Motion 27 45 72 74Process Automation 36 96 132 134Power Grids 33 70 103 105Corporate and Other 30 86 116 118Total 140 370 510 520
(1) Total expected costs have been recast to reflect the reorganization of the operating segments as outlined in Note 23.
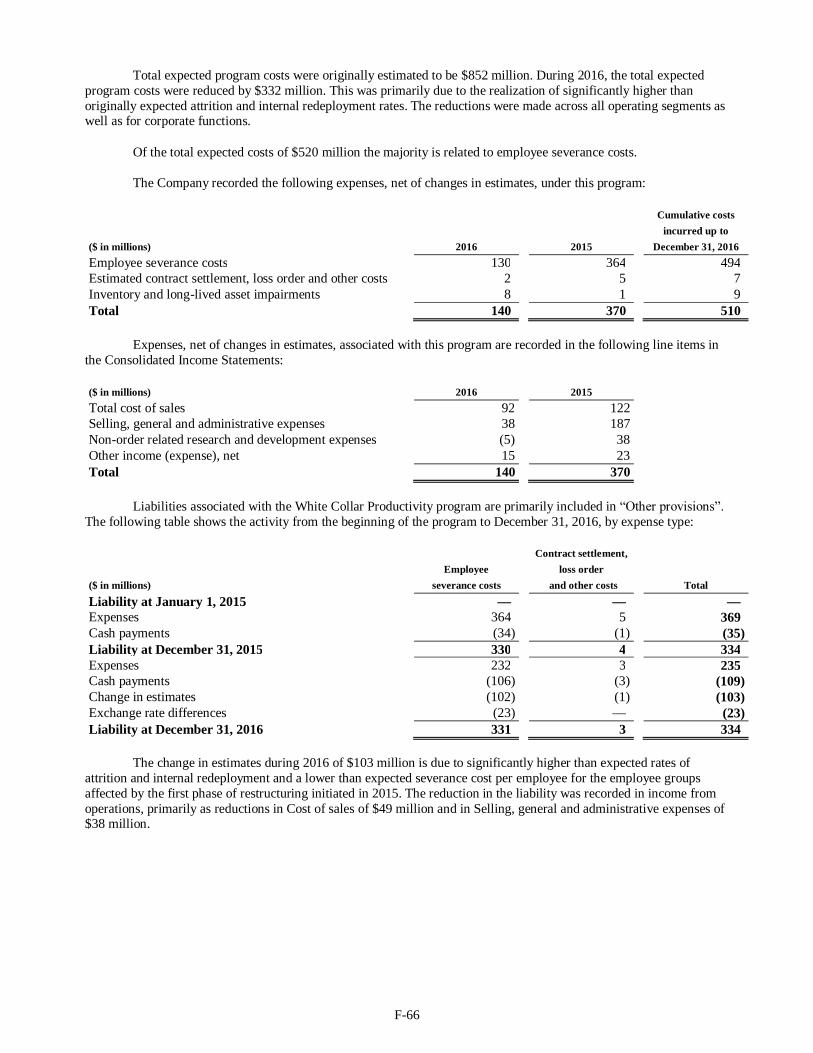
F-66
Total expected program costs were originally estimated to be $852 million. During 2016, the total expectedprogram costs were reduced by $332 million. This was primarily due to the realization of significantly higher thanoriginally expected attrition and internal redeployment rates. The reductions were made across all operating segments aswell as for corporate functions.
Of the total expected costs of $520 million the majority is related to employee severance costs.
The Company recorded the following expenses, net of changes in estimates, under this program:
Cumulative costsincurred up to
($ in millions) 2016 2015 December 31, 2016Employee severance costs 130 364 494Estimated contract settlement, loss order and other costs 2 5 7Inventory and long-lived asset impairments 8 1 9Total 140 370 510
Expenses, net of changes in estimates, associated with this program are recorded in the following line items inthe Consolidated Income Statements:
($ in millions) 2016 2015Total cost of sales 92 122Selling, general and administrative expenses 38 187Non-order related research and development expenses (5) 38Other income (expense), net 15 23Total 140 370
Liabilities associated with the White Collar Productivity program are primarily included inThe following table shows the activity from the beginning of the program to December 31, 2016, by expense type:
Contract settlement,Employee loss order
($ in millions) severance costs and other costs TotalLiability at January 1, 2015Expenses 364 5 369Cash payments (34) (1) (35)Liability at December 31, 2015 330 4 334Expenses 232 3 235Cash payments (106) (3) (109)Change in estimates (102) (1) (103)Exchange rate differences (23) (23)Liability at December 31, 2016 331 3 334
The change in estimates during 2016 of $103 million is due to significantly higher than expected rates ofattrition and internal redeployment and a lower than expected severance cost per employee for the employee groupsaffected by the first phase of restructuring initiated in 2015. The reduction in the liability was recorded in income fromoperations, primarily as reductions in Cost of sales of $49 million and in Selling, general and administrative expenses of$38 million.

F-67
Other restructuring-related activities
In 2016, 2015 and 2014, the Company executed various other restructuring-related activities and incurredcharges of $171 million, $256 million and $235 million, respectively, which were primarily recorded in cost of
($ in millions) 2016 2015 2014Employee severance costs 90 207 177Estimated contract settlement, loss order and other costs 40 27 31Inventory and long-lived asset impairments 41 22 27Total 171 256 235
At December 31, 2016 and 2015, the balance of other restructuring-related liabilities is primarily included inOther provisions .
Change in estimates
In addition to the change in estimate of $103 million relating to the White Collar Productivity program, afurther $46 million was recorded as a change in estimate to reduce liabilities associated with the otherrestructuring-related activities mainly due to changes in the planned scope of these activities. This was recorded inincome from operations, primarily as reductions in Cost of sales. The combined total change in estimates during 2016 of$149 million resulted in an increase in earnings per share (basic and diluted) of $0.05 for 2016.
Note 23 Operating segment and geographic data
The Chief Operating Decision Maker (CODM) is the Chief Executive Officer. The CODM allocates resourcesto and assesses the performance of each operating segment using the information outlined below. Theoperating segments consist of Electrification Products, Discrete Automation and Motion, Process Automation and PowerGrids. The remaining operations of the Company are included in Corporate and Other.
Effective January 1, 2016, the Company reorganized its operating segments with the aim of delivering morecustomer value in a better, more focused way from its combined power and automation offering. The new ElectrificationProducts segment includes the business of the former Low Voltage Products segment and the Medium Voltage Productsbusiness from the former Power Products segment. The Process Automation segment has been expanded to include theDistributed Control Systems business from the former Power Systems segment, while the remaining businesses of theformer Power Products and Power Systems segments were combined to form the new Power Grids segment. There wereno significant changes to the Discrete Automation and Motion segment.
In addition, commencing in 2016, the Company changed its method of allocating income taxes to its operatingsegments whereby tax assets are primarily accounted for in Corporate and Other. As a result, certain amounts relating tocurrent and deferred tax assets previously reported within the total segment assets of each individual operating segmenthave been allocated to Corporate and Other.
The segment information for 2015 and 2014, and at December 31, 2015 and 2014, has been recast to reflectthese organizational and allocation changes.
A description of the types of products and services provided by each reportable segment is as follows:
Electrification Products: manufactures and sells products and services including low- and medium-voltageswitchgear (air and gas insulated), breakers, switches, control products, DIN rail components, automationand distribution enclosures, wiring accessories and installation material for many kinds of applications.
Discrete Automation and Motion: manufactures and sells motors, generators, variable speed drives, robotsand robotics, solar inverters, wind converters, rectifiers, excitation systems, power quality and protectionsolutions, electric vehicle fast charging infrastructure, components and subsystems for railways, andrelated services for a wide range of applications in discrete automation, process industries, transportationand utilities.

F-68
Process Automation: develops and sells control and plant optimization systems, automation products andsolutions, including instrumentation, as well as industry-specific application knowledge and services forthe oil, gas and petrochemicals, metals and minerals, marine and turbocharging, pulp and paper, chemicaland pharmaceuticals, and power industries.
Power Grids: supplies power and automation products, systems, and service and software solutions forpower generation, transmission and distribution to utility, industry, transportation and infrastructurecustomers. These offerings address evolving grid developments which include the integration ofrenewables, network control, digital substations, microgrids and asset management. The segment alsomanufactures a wide range of power, distribution and traction transformers, an array of high-voltageproducts, including circuit breakers, switchgear, capacitors and power transmission systems.
Corporate and Other: includes headquarters, central research and development, the real estateactivities, Group Treasury Operations, historical operating activities of certain divested businesses, andother minor business activities.
The Company evaluates the profitability of its segments based on Operational EBITA. In 2016, the Companymodified the definition of its measure of segment profit to also exclude changes in estimates relating to opening balancesheets of acquired businesses (changes in pre-acquisition estimates) and non-operational pension cost, which comprises:(a) interest cost, (b) expected return on plan assets, (c) amortization of prior service cost (credit), (d) amortization of netactuarial loss, and (e) curtailments, settlements and special termination benefits.
After these revisions, Operational EBITA represents Income from operations excluding: (i) amortizationexpense on intangibles arising upon acquisitions (acquisition-related amortization), (ii) restructuring and restructuring-related expenses, (iii) non-operational pension cost, (iv) changes in pre-acquisition estimates, (v) gains and losses fromsale of businesses, acquisition-related expenses and certain non-operational items, as well as (vi) foreignexchange/commodity timing differences in income from operations consisting of: (a) unrealized gains and losses onderivatives (foreign exchange, commodities, embedded derivatives), (b) realized gains and losses on derivatives wherethe underlying hedged transaction has not yet been realized, and (c) unrealized foreign exchange movements onreceivables/payables (and related assets/liabilities).
The CODM primarily reviews the results of each segment on a basis that is before the elimination of profitsmade on inventory sales between segments. Segment results below are presented before these eliminations, with a totaldeduction for intersegment profits to arrive at the Company s consolidated Operational EBITA. Intersegment sales andtransfers are accounted for as if the sales and transfers were to third parties, at current market prices.
The following tables present segment revenues, Operational EBITA, the reconciliations of consolidatedOperational EBITA to income from continuing operations before taxes, as well as depreciation and amortization, andcapital expenditures for 2016, 2015 and 2014, as well as total assets at December 31, 2016, 2015 and 2014.
2016Third-party Intersegment Total
($ in millions) revenues revenues revenuesElectrification Products 8,744 548 9,292Discrete Automation and Motion 8,169 545 8,714Process Automation 6,448 150 6,598Power Grids 10,408 567 10,975Corporate and Other 59 1,553 1,612Intersegment elimination (3,363) (3,363)Consolidated 33,828 33,828

F-69
2015Third-party Intersegment Total
($ in millions) revenues revenues revenuesElectrification Products 8,932 615 9,547Discrete Automation and Motion 8,492 635 9,127Process Automation 7,104 120 7,224Power Grids 10,876 745 11,621Corporate and Other 77 1,459 1,536Intersegment elimination (3,574) (3,574)Consolidated 35,481 35,481
2014Third-party Intersegment Total
($ in millions) revenues revenues revenuesElectrification Products 9,826 746 10,572Discrete Automation and Motion 9,296 846 10,142Process Automation 8,490 128 8,618Power Grids 11,533 985 12,518Corporate and Other 685 1,652 2,337Intersegment elimination (4,357) (4,357)Consolidated 39,830 39,830
($ in millions) 2016 2015 2014Operational EBITA:
Electrification Products 1,528 1,561 1,739Discrete Automation and Motion 1,195 1,295 1,595Process Automation 824 863 1,045Power Grids 1,021 877 607Corporate and Other and Intersegment elimination (377) (387) (452)
Consolidated Operational EBITA 4,191 4,209 4,534Acquisition-related amortization (279) (310) (380)Restructuring and restructuring-related expenses(1) (543) (674) (235)Non-operational pension cost(2) (38) (19) (59)Changes in pre-acquisition estimates(2) (131) (21)Gains and losses on sale of businesses, acquisition-related expenses
and certain non-operational items (173) (120) 482Foreign exchange/commodity timing differences in income from operations:
Unrealized gains and losses on derivatives where the underlying hedgedtransaction has not yet been realized (65) 67 (223)
Realized gains and losses on derivatives where the underlying hedgedtransaction has not yet been realized (5) (68) (42)
Unrealized foreign exchange movements on receivables/payables (and related assets/liabilities) 30 (15) 101
Income from operations 2,987 3,049 4,178Interest and dividend income 73 77 80Interest and other finance expense (261) (286) (362)Income from continuing operations before taxes 2,799 2,840 3,896
(1) Amounts also include the incremental implementation costs in relation to the White Collar Productivity program.(2) As described above, in 2016, the Company modified the definition of its measure of segment profit to also exclude changes in pre-
acquisition estimates and non-operational pension cost. Amounts presented for 2015 and 2014 have been adjusted to conform to thenew definition.

F-70
Depreciation and Total assets(1)
amortization Capital expenditure(1) at December 31,($ in millions) 2016 2015 2014 2016 2015 2014 2016 2015 2014Electrification Products 305 316 341 200 210 248 9,523 9,474 10,552Discrete Automation and Motion 292 295 309 128 145 192 8,465 9,223 10,131Process Automation 74 79 90 51 56 47 4,153 4,662 5,200Power Grids 266 280 336 203 191 242 8,980 9,422 10,632Corporate and Other 198 190 229 249 274 297 8,378 8,575 8,337Consolidated 1,135 1,160 1,305 831 876 1,026 39,499 41,356 44,852
(1) Capital expenditure and Total assets are after intersegment eliminations and therefore reflect third-party activities only.
Geographic information
Geographic information for revenues and long-lived assets was as follows:
Long-livedassets at
Revenues December 31,($ in millions) 2016 2015 2014 2016 2015Europe 11,315 11,602 13,745 2,768 3,253The Americas 9,741 10,554 11,490 1,100 1,113Asia, Middle East and Africa 12,772 13,325 14,595 875 910Total 33,828 35,481 39,830 4,743 5,276
Revenues by geography reflect the location of the customer. Approximately 19 percent, 20 percent and19 percent of the Company s total revenues in 2016, 2015 and 2014, respectively, came from customers in the UnitedStates. Approximately 13 percent of the Company s total revenues in 2016, 2015 and 2014, respectively, were generatedfrom customers in China. In 2016, 2015 and 2014, more than 98 percent of the Company s total revenues weregenerated from customers outside Switzerland.
Long-lived assets represent Property, plant and equipment, net and are shown by location of the assets. AtDecember 31, 2016, approximately 17 percent, 17 percent and 10 percent of the Company s long-lived assets werelocated in Switzerland, the U.S. and Sweden, respectively. At December 31, 2015, approximately 16 percent werelocated in each of Switzerland, the U.S. and Sweden.
The Company does not segregate revenues derived from transactions with external customers for each type orgroup of products and services. Accordingly, it is not practicable for the Company to present revenues from externalcustomers by product and service type.
Realignment of segments
On October 4, 2016, the Company announced a planned change in the composition of the business portfolio ofits four segments. Effective January 1, 2017, the scope of the Electrification Products segment has been expanded toinclude the electric vehicle charging, solar, and power quality businesses from the Discrete Automation and Motionsegment.
In addition, the Discrete Automation and Motion segment has been renamed the Robotics and Motion segmentwhile the Process Automation segment has been renamed the Industrial Automation segment.

Exhibit 12.1
CERTIFICATION
I, Ulrich Spiesshofer, certify that:
1. I have reviewed this Annual Report on Form 20-F of ABB Ltd;
2. Based on my knowledge, this report does not contain any untrue statement of a material fact or omit to state amaterial fact necessary to make the statements made, in light of the circumstances under which such statementswere made, not misleading with respect to the period covered by this report;
3. Based on my knowledge, the financial statements, and other financial information included in this report, fairlypresent in all material respects the financial condition, results of operations and cash flows of the Company asof, and for, the periods presented in this report;
4. The Company s other certifying officer and I are responsible for establishing and maintaining disclosurecontrols and procedures (as defined in Exchange Act Rules 13a-15(e) and 15d-15(e)) and internal control overfinancial reporting (as defined in Exchange Act Rules 13a-15(f) and 15d-15(f)) for the Company and have:
a. Designed such disclosure controls and procedures, or caused such disclosure controls and proceduresto be designed under our supervision, to ensure that material information relating to the Company,including its consolidated subsidiaries, is made known to us by others within those entities,particularly during the period in which this report is being prepared;
b. Designed such internal control over financial reporting, or caused such internal control over financialreporting to be designed under our supervision, to provide reasonable assurance regarding thereliability of financial reporting and the preparation of financial statements for external purposes inaccordance with generally accepted accounting principles;
c. Evaluated the effectiveness of the Company s disclosure controls and procedures and presented in thisreport our conclusions about the effectiveness of the disclosure controls and procedures, as of the endof the period covered by this report based on such evaluation; and
d. Disclosed in this report any change in the Company s internal control over financial reporting thatoccurred during the period covered by the annual report that has materially affected, or is reasonablylikely to materially affect, the Company s internal control over financial reporting; and
5. The Company s other certifying officer and I have disclosed, based on our most recent evaluation of internalcontrol over financial reporting, to the Company s auditors and the audit committee of the Company s board ofdirectors (or persons performing the equivalent functions):
a. All significant deficiencies and material weaknesses in the design or operation of internal control overfinancial reporting which are reasonably likely to adversely affect the Company s ability to record,process, summarize and report financial information; and
b. Any fraud, whether or not material, that involves management or other employees who have asignificant role in the Company s internal control over financial reporting.
Dated: March 10, 2017
By: /s/ ULRICH SPIESSHOFERUlrich SpiesshoferChief Executive Officer(principal executive officer)
Exhibit 12.2
CERTIFICATION
I, Eric Elzvik, certify that:
1. I have reviewed this Annual Report on Form 20-F of ABB Ltd;
2. Based on my knowledge, this report does not contain any untrue statement of a material fact or omit to state amaterial fact necessary to make the statements made, in light of the circumstances under which such statementswere made, not misleading with respect to the period covered by this report;
3. Based on my knowledge, the financial statements, and other financial information included in this report, fairlypresent in all material respects the financial condition, results of operations and cash flows of the Company asof, and for, the periods presented in this report;
4. The Company s other certifying officer and I are responsible for establishing and maintaining disclosurecontrols and procedures (as defined in Exchange Act Rules 13a-15(e) and 15d-15(e)) and internal control overfinancial reporting (as defined in Exchange Act Rules 13a-15(f) and 15d-15(f)) for the Company and have:
a. Designed such disclosure controls and procedures, or caused such disclosure controls and proceduresto be designed under our supervision, to ensure that material information relating to the Company,including its consolidated subsidiaries, is made known to us by others within those entities,particularly during the period in which this report is being prepared;
b. Designed such internal control over financial reporting, or caused such internal control over financialreporting to be designed under our supervision, to provide reasonable assurance regarding thereliability of financial reporting and the preparation of financial statements for external purposes inaccordance with generally accepted accounting principles;
c. Evaluated the effectiveness of the Company s disclosure controls and procedures and presented in thisreport our conclusions about the effectiveness of the disclosure controls and procedures, as of the endof the period covered by this report based on such evaluation; and
d. Disclosed in this report any change in the Company s internal control over financial reporting thatoccurred during the period covered by the annual report that has materially affected, or is reasonablylikely to materially affect, the Company s internal control over financial reporting; and
5. The Company s other certifying officer and I have disclosed, based on our most recent evaluation of internalcontrol over financial reporting, to the Company s auditors and the audit committee of the Company s board ofdirectors (or persons performing the equivalent functions):
a. All significant deficiencies and material weaknesses in the design or operation of internal control overfinancial reporting which are reasonably likely to adversely affect the Company s ability to record,process, summarize and report financial information; and
b. Any fraud, whether or not material, that involves management or other employees who have asignificant role in the Company s internal control over financial reporting.
Dated: March 10, 2017 By: /s/ ERIC ELZVIKEric ElzvikChief Financial Officer(principal financial officer)

Exhibit 13.1
CERTIFICATION OF THE CHIEF EXECUTIVE OFFICER OF ABB LTD, PURSUANT TOSECTION 18 U.S.C. SECTION 1350,
AS ADOPTED PURSUANT TOSECTION 906 OF THE SARBANES-OXLEY ACT OF 2002
In connection with the Annual Report on Form 20-F for the fiscal year ended December 31, 2016 of ABB Ltd(the Company ) as filed with the U.S. Securities and Exchange Commission (the Commission ) on the date hereof(the Report ) and pursuant to 18 U.S.C. §1350, as adopted pursuant to Section 906 of the Sarbanes-Oxley Act of 2002,I, Ulrich Spiesshofer, Chief Executive Officer of the Company, certify, that, to my knowledge:
(1) the Report fully complies with the requirements of Section 13(a) or 15(d) of the SecuritiesExchange Act of 1934, as amended; and
(2) the information contained in the Report fairly presents, in all material respects, the financialcondition and results of operations of the Company.
Dated: March 10, 2017
By: /s/ ULRICH SPIESSHOFERUlrich SpiesshoferChief Executive Officer(principal executive officer)

Exhibit 13.2
CERTIFICATION OF CHIEF FINANCIAL OFFICER OF ABB LTD, PURSUANT TO18 U.S.C. SECTION 1350,
AS ADOPTED PURSUANT TOSECTION 906 OF THE SARBANES-OXLEY ACT OF 2002
In connection with the Annual Report on Form 20-F for the fiscal year ended December 31, 2016 of ABB Ltd(the Company ) as filed with the U.S. Securities and Exchange Commission (the Commission ) on the date hereof(the Report ) and pursuant to 18 U.S.C. §1350, as adopted pursuant to Section 906 of the Sarbanes-Oxley Act of 2002,I, Eric Elzvik, Chief Financial Officer of the Company, certify, that, to my knowledge:
(1) the Report fully complies with the requirements of Section 13(a) or 15(d) of the SecuritiesExchange Act of 1934, as amended; and
(2) the information contained in the Report fairly presents, in all material respects, the financialcondition and results of operations of the Company.
Dated: March 10, 2017
By: /s/ ERIC ELZVIKEric ElzvikChief Financial Officer(principal financial officer)