United States Relations of Native and Exotic Agriculture
48
D E P A R TMENT OF AGRIC U L T U R E United States Department of Agriculture Forest Service Pacific Northwest Research Station Research Paper PNW-RP-589 October 2012 Relations of Native and Exotic Species 5 Years After Clearcutting With and Without Herbicide and Logging Debris Treatments David H. Peter and Timothy B. Harrington
Transcript of United States Relations of Native and Exotic Agriculture

DEPAR TMENT OF AGRICULT URE
United States Department of Agriculture
Forest Service
Pacific Northwest Research Station
Research PaperPNW-RP-589
October 2012
Relations of Native and Exotic Species 5 Years After Clearcutting With and Without Herbicide and Logging Debris TreatmentsDavid H. Peter and Timothy B. Harrington

The Forest Service of the U.S. Department of Agriculture is dedicated to the principle of multiple use management of the Nation’s forest resources for sustained yields of wood, wa-ter, forage, wildlife, and recreation. Through forestry research, cooperation with the States and private forest owners, and management of the national forests and national grasslands, it strives—as directed by Congress—to provide increasingly greater service to a growing Nation.The U.S. Department of Agriculture (USDA) prohibits discrimination in all its programs and activities on the basis of race, color, national origin, sex, religion, age, disability, sexual ori-entation, marital status, family status, status as a parent (in education and training programs and activities), because all or part of an individual’s income is derived from any public assis-tance program, or retaliation. (Not all prohibited bases apply to all programs or activities).If you require this information in alternative format (Braille, large print, audiotape, etc.), con-tact the USDA’s TARGET Center at (202) 720-2600 (Voice or TDD).If you require information about this program, activity, or facility in a language other than English, contact the agency office responsible for the program or activity, or any USDA office.To file a complaint alleging discrimination, write USDA, Director, Office of Civil Rights, 1400 Independence Avenue, S.W., Washington, D.C. 20250-9410, or call toll free, (866) 632-9992 (Voice). TDD users can contact USDA through local relay or the Federal relay at (800) 877-8339 (TDD) or (866) 377-8642 (relay voice users). You may use USDA Program Discrimination Complaint Forms AD-3027 or AD-3027s (Spanish) which can be found at: http://www.ascr.usda.gov/complaint_filing_cust.html or upon request from a local Forest Service office. USDA is an equal opportunity provider and employer.
Pesticide Precautionary StatementThis publication reports research involving pesticides. It does not contain recommendations for their use, nor does it imply that the uses discussed here have been registered. All uses of pesticides must be registered by appropriate state or federal agencies, or both, before they can be recommended.
CAUTION: Pesticides can be injurious to humans, domestic animals, desirable plants, and fish or other wildlife—if they are not handled or applied properly. Use all pesticides selectively and carefully. Follow recommended practices for the disposal of surplus pesticides and pesticide containers.
AuthorsDavid H. Peter is an ecologist and Timothy B. Harrington is a research forester, Forestry Sciences Laboratory, 3625 93rd Avenue SW, Olympia, WA 98512-9193.
Cover: Photos show the three sites at 5 years of age. The Molalla site is on top, Matlock in the middle, and Fall River on the bottom.
AbstractPeter, David H.; Harrington, Timothy B. 2012. Relations of native and exotic
species 5 years after clearcutting with and without herbicide and logging debris treatments. Res. Pap. PNW-RP-589. Portland, OR: U.S. Department of Agriculture, Forest Service, Pacific Northwest Research Station. 37 p.
To increase timber production and manage other forest resource values, some land managers have undertaken logging debris and vegetation control treatments after forest harvest. We explored the roles of clearcutting on plant community composition and structure at three sites where logging debris was dispersed, piled, or removed and vegetation was annually treated or not treated with herbicides for 5 years. Without vegetation control, a competitive relation was identified between exotic and native ruderal (i.e., disturbance-associated) species. When exotic ruderal cover changed by 4 percent, native ruderal cover changed by 10 percent in the opposite direction. This relation was independent of site, but site was important in determining the overall dominance of ruderals. Five annual vegetation control treatments increased Douglas-fir (Pseudotsuga menziesii (Mirb.) Franco) growth, but decreased richness and cover of other species at the rate of one species per 10 percent reduction in cover. Debris treatment effects were small and found on only one site.
Keywords: Clearcut, invasive species, exotic species, community diversity, community structure.
SummaryClearcutting of Pacific Northwest (USA) forests results in conversion of the understory plant community from dominance by shade-tolerant native species to dominance by a mixture of native and exotic ruderal (i.e., disturbance-associated) species. To increase timber production and manage for other resource values, some land managers have undertaken subsequent logging debris and vegetation control treatments. We explored the roles of clearcutting with and without logging debris and vegetation control treatments on plant community composition and structure at three sites with different plant communities and productivity. Logging debris was dispersed, piled, or removed. Vegetation was annually treated or not treated with herbicides for 5 years. Without vegetation control, a competitive relation was identi-fied between exotic and native ruderal species in which a 4 percent change in exotic ruderal cover was associated with an opposite 10 percent change in native ruderal cover. This relation was independent of site, but site was important in determining the overall dominance of ruderals. Vegetation control increased Douglas-fir (Pseu-dotsuga menziesii (Mirb.) Franco) growth, while it decreased cover and richness of other species. Richness declined at the rate of one species per 10 percent reduction in cover regardless of site, stand history, or treatment protocol. Nonmetric multi-dimensional scaling ordination suggested that, although the untreated plant com-munities were floristically distinct at age 5 years, communities receiving similar herbicide treatments become more alike after treatment. Debris treatment effects were small and found only on the least productive site.

Contents1 Introduction
2 Materials and Methods
2 Study Sites
3 Study Design
5 Field Procedures
7 Analysis
9 Results
9 Species Composition and Diversity
12 Relations Among Native and Exotic Species Groups
12 Canopy Cover and Productivity
12 Relation of Richness to Total Cover
14 Discussion
14 Community Structure and Composition
17 Debris Treatments
17 Vegetation Control
21 Conclusions
21 Acknowledgments
22 English Equivalents
22 References
27 Appendix

This Page Left Blank Intentionally

1
Relations of Native and Exotic Species 5 Years After Clearcutting With and Without Herbicide and Logging Debris Treatments
IntroductionOwing to their high levels of light and nutrient availability, early seral communities in the Pacific Northwest are dominated by ruderals (i.e., plant species associated with disturbance) soon after harvesting, but with some surviving residual forest understory species. The residual forest understory species are “stress tolerant” (sensu Grime 1977) in that they tolerate the low levels of light and nutrients typical of later seral communities while surviving in the understory of the predisturbance forest. Thus, while some late-successional species such as western hemlock (Tsuga heterophylla (Raf.) Sarg.) may enter the stand much later (relay floristics model), early seral communities in the Pacific Northwest follow an initial floristics model (Egler 1954) in the beginning. Following establishment of the ruderals, succes-sion in these communities is largely driven by canopy development of Douglas-fir (Pseudotsuga menziesii (Mirb.) Franco var. menziesii) or other conifers, but the rate of succession and the community composition are affected by site productivity and silvicultural management activities.
Ruderal communities in the maritime Pacific Northwest (USA) have been invaded by many exotic (invasive nonnative) plant species. However, very little is currently known about the competitive relation that exists between these exotic spe-cies and native species. Invasive exotic species can alter hydrologic, nutrient, and disturbance regimes (Mack et al. 2000) and may threaten native species (Wilcove et al. 1998). However, exotic species are not always a threat to native plants (Davis 2003), and uncertainty regarding the roles of exotic species in ecosystems hinders our ability to know how or even whether to attempt native community restoration.
Soon after forest harvesting, forest managers may engage in site preparations to benefit planted trees. Thus, early community assembly that was initiated by tree harvesting may be interrupted by a series of disturbances including logging debris treatment and vegetation control for which there are few natural analogues. Because organic matter provides a protective barrier against soil disturbance and influences nutrient cycling (Smethurst and Nambiar 1990), soil moisture, and temperature (Devine and Harrington 2007, Roberts et al. 2005), the recruitment and survival of postharvest species could be affected by debris treatments. Most forestry stud-ies have found only small changes in species diversity and composition of ground layer vegetation with operational use of herbicides (Boyd et al. 1995, Haeussler et al. 2002). For example, in the Pacific Northwest, Stein (1995) found that a single glyphosate application caused a shift toward ruderal species with little effect on diversity. However, we wondered what effect more rigorous herbicide regimes would have on early community composition and structure.
2
research paper pnw-rp-589
Because wood products are often not the only and sometimes not the most important output desired, land managers need knowledge about the effects of silvicultural treatments on entire plant communities. Thus, we evaluated the rela-tions between native and exotic species in three forest productivity studies that were initiated by clearcutting. Subsequent vegetation control with herbicides and logging debris manipulations were designed to promote Douglas-fir growth in some areas and not others. We examined these sites 5 years after clearcutting. Some of the veg-etation control treatments were more stringent than what are typically used in forest management, although no more stringent than are sometimes used for management of road or power line rights-of-way.
We asked how exotic and native floras interact following clearcutting in the Pacific Northwest. We were also interested in how postclearcutting logging debris and vegetation control treatments further affect plant diversity and composition of the community. To this end, we studied three operational studies having similar treatments in western Washington and Oregon. Although it is recognized that disturbance increases opportunities for ruderal species, we asked if the relation of native and exotic ruderals to the residual forest species was similar, and what the relation of the two ruderal groups was to each other. We hypothesized that if exotic species abundance increased as a result of postclearcutting vegetation control or logging debris treatments, there would be a decrease in native species abundance. Similarly, but more generally, we hypothesized that an increase in ruderal species would be accompanied by a decrease in residual species.
Materials and MethodsStudy SitesOur study sites (Matlock, Molalla, and Fall River) were located in the Western Hemlock Zone (Franklin and Dyrness 1988) of western Washington and Oregon. These sites were managed for timber production and initially supported uniformly stocked stands of 40- to 70-year-old Douglas-fir. At Matlock and Molalla, some trees were removed before clearcutting (in a low thinning in 1993 at Molalla and by removal of damaged trees after a 1996 ice storm at Matlock). Each stand was clearcut (in spring 2003 at Matlock and Molalla and spring 1999 at Fall River) and planted with Douglas-fir seedlings (plug+1 stock planted in early 2004 at Matlock and Molalla on a 3-m grid; 2+0 stock planted in March 2000 at Fall River on a 2.5-m grid). Each site was fenced to prevent ungulate browsing of the planted seedlings.
The Matlock site is on nearly level glacial outwash at about 35 m elevation 25 km west of Shelton, Washington. The soil is deep, somewhat excessively
We asked how exotic and native floras interact following clearcutting in the Pacific Northwest. We were also interested in how postclearcutting logging debris and vegetation control treatments further affect plant diversity and composition of the community.
3
Relations of Native and Exotic Species 5 Years After Clearcutting With and Without Herbicide and Logging Debris Treatments
drained, very gravelly loamy sand in the Grove Series with 55 to 75 percent coarse fragments (Dystric Xerorthent; USDA NRCS 2009a). The water-holding capacity of the top 60 cm of soil averaged 55 mm, and the total nitrogen (N) content averaged 3300 kg/ha in the year following forest harvesting (Devine et al. 2011). The average annual precipitation is 2413 mm (USDA NRCS 2000b). The primary plant associa-tion of the Matlock site is the Tsuga heterophylla/Gaultheria shallon plant associa-tion with some occurrences of the Tsuga heterophylla/Gaultheria shallon-Mahonia nervosa association (Henderson et al. 1989).
The Molalla site is on a gently rolling ridge and upper west-facing slope (0 to 30 percent slope) between 500 and 570 m elevation about 24 km northeast of Molalla, Oregon. The soil is a deep, well-drained cobbly loam of the Kinney Series derived from igneous tuffaceous agglomerate with 25 to 35 percent coarse frag-ments (Andic Dystrudept; USDA NRCS Soil Surv. Staff 2009). The water-holding capacity of the top 60 cm of soil averaged 142 mm, and the total N content averaged 7220 kg/ha in the year following forest harvesting (Devine et al. 2011). The aver-age annual precipitation is 1829 mm (USDA NRCS 2009b). The Molalla site has the most topographic variability and correspondingly the most plant associations. The four Molalla plant associations in order of importance are Tsuga heterophylla/Mahonia nervosa/Polystichum munitum, Tsuga heterophylla/Mahonia nervosa-Gaultheria shallon, Tsuga heterophylla/Polystichum munitum-Oxalis oregana, and Tsuga heterophylla/Polystichum munitum (Halverson et al. 1986).
The Fall River site is located 33 km west-northwest of Chehalis, Washington, on a gentle (<15 percent), west-facing slope at 335 m elevation. The soil is a uni-form, very deep, well-drained, silty clay loam to silty clay of the Boistfort Series derived from volcanic ash and deeply weathered basalt (Typic Fulvudand; USDA NRCS 2009a). The water-holding capacity of the top 60 cm averaged 174 mm, and the total N content averaged 10 188 kg/ha in the year following forest harvesting (Devine et al. 2011). The average annual precipitation is 2159 mm (USDA NRCS 2009b). The main plant association of the Fall River site is Tsuga heterophylla/Polystichum munitum-Oxalis oregana (Henderson et al. 1989).
Study DesignWe used a randomized complete block design. At Matlock and Molalla, six treat-ments were replicated four times as a factorial combination of three logging-debris treatments by two vegetation-control treatments. Each treatment was randomly assigned to four 50- by 60-m (0.3-ha) plots, providing a total of 24 plots per site. Blocking was based on aspect (Molalla) and proximity to logging roads (Matlock
4
research paper pnw-rp-589
and Molalla)—a surrogate for frequency of machine traffic. Machine traffic associated with shovel yarding and the logging debris treatments (described below) at Matlock and Molalla was confined to designated trails placed at 20-m intervals lengthwise through the plots.
At Fall River there were eight replications of three treatments for a total of 24 plots (Ares et al. 2007). Each Fall River treatment was randomly assigned to two 30- by 85-m (0.26-ha) treatment plots in each of four blocks. Blocking was based on preharvest Douglas-fir volume. All of the plots had similar gentle slopes and west exposures. For this study, we looked at only 3 of the 12 treatments conducted at Fall River (Ares et al. 2007).
Treatment No. Description1 Logging debris dispersed without vegetation control: removal of
merchantable logs to a 10- (at Fall River) or 12.7-cm diameter (at Matlock and Molalla) top with retention of logging debris in place (Matlock and Molalla: four plots per site; Fall River: eight plots).
2 Logging debris piled without vegetation control (piled/no vegetation control): removal of merchantable logs and moving of logging de-bris <12.7-cm diameter into piles 3 to 4 m in diameter (Matlock and Molalla: four plots per site).
3 Logging debris removed without vegetation control: removal of aboveground portion of trees (boles, branches, and foliage >5-cm diameter) (Matlock and Molalla: four plots per site).
4 Logging debris dispersed with vegetation control: same as treatment 1, but with five annual herbicide treatments to reduce abundance of competing vegetation (described below) (Matlock and Molalla: four plots per site; Fall River: eight plots).
5 Logging debris piled with vegetation control: same as treatment 2, but with five annual herbicide treatments to reduce abundance of competing vegetation (described below) (Matlock and Molalla: four plots per site).
6 Logging debris removed with vegetation control treatment: same as treatment 3, but with five annual herbicide treatments to reduce abundance of competing vegetation (described below). This treat-ment occurred at all three sites, but at Fall River, all debris > 0.6-cm diameter was removed (Matlock and Molalla: four plots per site; Fall River: eight plots).
Piling and removing of debris resulted in additional mechanically induced soil disturbance. Where debris was dispersed, there was significantly less exposure of mineral soil (2 to 3 percent of the total area) than where it was piled or removed (4 to 6 percent of the total area) (Harrington and Schoenholtz 2010). The debris piles were about 3 m in diameter and 1 m high. There were 105 piles per hectare at Matlock and 60 piles per hectare at Molalla (Harrington and Schoenholtz 2010).

5
Relations of Native and Exotic Species 5 Years After Clearcutting With and Without Herbicide and Logging Debris Treatments
In addition to reducing competition with Douglas-fir seedlings, a goal of the herbicide treatments at Matlock and Molalla was to reduce cover of herbaceous and woody vegetation to < 20 percent and thereby provide experimental conditions for quantifying debris effects on Douglas-fir growth independent of vegetation abundance. To this end, an initial vegetation control treatment was applied to all plots in late summer 2003 to reduce woody vegetation prior to planting of Douglas-fir (table 1). Annual herbicide treatments were applied in the fall or spring of 2003 through 2008 to the designated vegetation control plots to reduce abundance of herbaceous and woody vegetation (Harrington and Schoenholtz 2010). Douglas-fir was the only species that was deliberately not sprayed. At Matlock, three additional herbicide treatments were applied to all plots to specifically reduce abundance of Scotch broom (Cytisus scoparius (L.) Link). These directed applications of triclopyr were made to individual broom plants to minimize effects on other vegetation and eliminated most of the Scotch broom at Matlock. This highly competitive, exotic shrub reproduced prolifically from seed stored in the soil (Bossard 1993) that was probably introduced during the 1998 salvage harvest.
At Fall River, where the goal was to eliminate all vegetation other than the planted trees, vegetation control was achieved by one preplanting herbicide applica-tion (dispersed/no vegetation control treatment excepted) and five annual applica-tions of preemergent herbicides in the spring with spot applications of postemergent herbicides as needed (table 1). Herbicides differed by year at all three sites to control selected species as they became dominant and to prevent the development of resistance in any of the species of competing vegetation. Both broadcast and spot treatments were used to ensure that the desired level of control was achieved.
Field ProceduresCircular 176.6-m2 (7.5-m-radius) vegetation sample plots were located in the center of treatment plots at Matlock and Molalla and centered 35 m from the west edge of each treatment plot at Fall River. Vegetation measurements were made in year 5 in July (Fall River: 2004, Matlock and Molalla: 2008). Vegetation assessment followed protocols for reconnaissance plots of the USFS Pacific Northwest Region, Area 1 Ecology Program (Henderson et al. 1989). Plant cover was ocularly estimated for all vascular species except Douglas-fir. Douglas-fir cover was calculated from the product of mean cover per tree (based on two crown diameter measurements of each tree taken at right angles) and the total count of trees on the plot. Ten system-atically selected trees per plot were measured at Fall River. All trees on the plot were measured at Matlock and Molalla. Each measured tree was also measured for height.
6
research paper pnw-rp-589
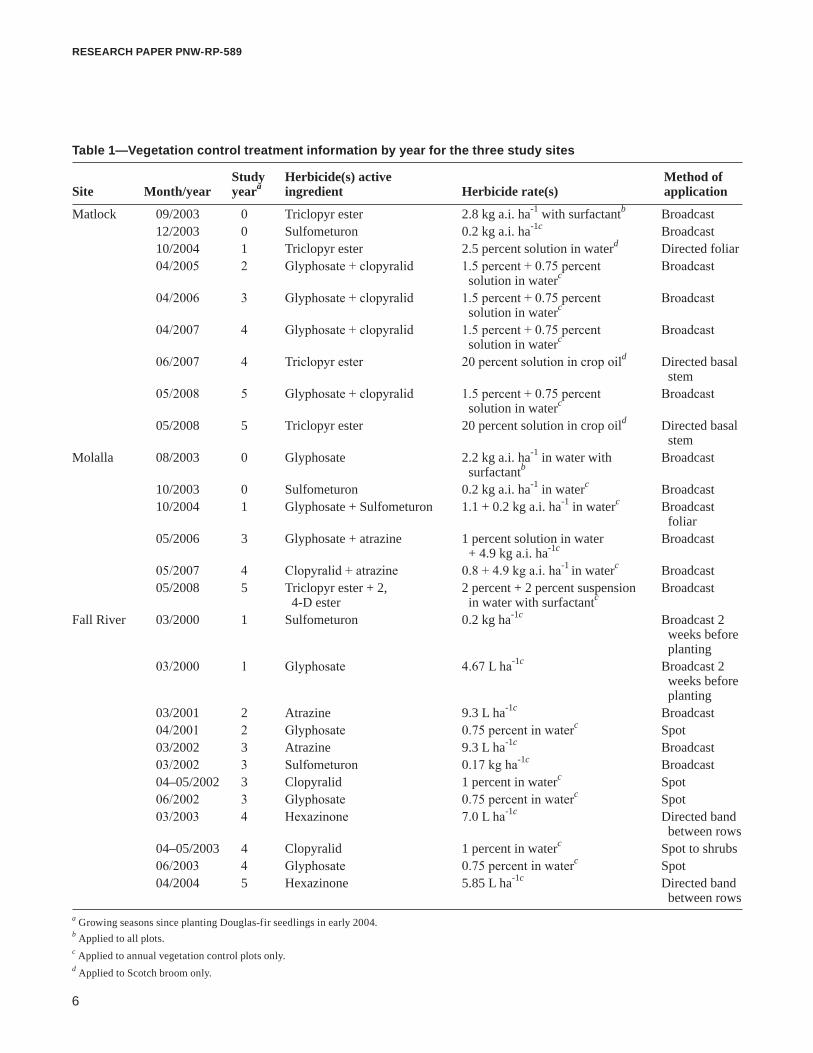
Table 1—Vegetation control treatment information by year for the three study sites
Study Herbicide(s) active Method of Site Month/year yeara ingredient Herbicide rate(s) application
Matlock 09/2003 0 Triclopyr ester 2.8 kg a.i. ha-1 with surfactantb Broadcast 12/2003 0 Sulfometuron 0.2 kg a.i. ha-1c Broadcast 10/2004 1 Triclopyr ester 2.5 percent solution in waterd Directed foliar 04/2005 2 Glyphosate + clopyralid 1.5 percent + 0.75 percent Broadcast solution in waterc
04/2006 3 Glyphosate + clopyralid 1.5 percent + 0.75 percent Broadcast solution in waterc
04/2007 4 Glyphosate + clopyralid 1.5 percent + 0.75 percent Broadcast solution in waterc
06/2007 4 Triclopyr ester 20 percent solution in crop oild Directed basal stem 05/2008 5 Glyphosate + clopyralid 1.5 percent + 0.75 percent Broadcast solution in waterc
05/2008 5 Triclopyr ester 20 percent solution in crop oild Directed basal stemMolalla 08/2003 0 Glyphosate 2.2 kg a.i. ha-1 in water with Broadcast surfactantb
10/2003 0 Sulfometuron 0.2 kg a.i. ha-1 in waterc Broadcast 10/2004 1 Glyphosate + Sulfometuron 1.1 + 0.2 kg a.i. ha-1 in waterc Broadcast foliar 05/2006 3 Glyphosate + atrazine 1 percent solution in water Broadcast + 4.9 kg a.i. ha-1c
05/2007 4 Clopyralid + atrazine 0.8 + 4.9 kg a.i. ha-1 in waterc Broadcast 05/2008 5 Triclopyr ester + 2, 2 percent + 2 percent suspension Broadcast 4-D ester in water with surfactantc
Fall River 03/2000 1 Sulfometuron 0.2 kg ha-1c Broadcast 2 weeks before planting 03/2000 1 Glyphosate 4.67 L ha-1c Broadcast 2 weeks before planting 03/2001 2 Atrazine 9.3 L ha-1c Broadcast 04/2001 2 Glyphosate 0.75 percent in waterc Spot 03/2002 3 Atrazine 9.3 L ha-1c Broadcast 03/2002 3 Sulfometuron 0.17 kg ha-1c Broadcast 04–05/2002 3 Clopyralid 1 percent in waterc Spot 06/2002 3 Glyphosate 0.75 percent in waterc Spot 03/2003 4 Hexazinone 7.0 L ha-1c Directed band between rows 04–05/2003 4 Clopyralid 1 percent in waterc Spot to shrubs 06/2003 4 Glyphosate 0.75 percent in waterc Spot 04/2004 5 Hexazinone 5.85 L ha-1c Directed band between rowsa Growing seasons since planting Douglas-fir seedlings in early 2004.b Applied to all plots.c Applied to annual vegetation control plots only.d Applied to Scotch broom only.

7
Relations of Native and Exotic Species 5 Years After Clearcutting With and Without Herbicide and Logging Debris Treatments
AnalysisWe analyzed site and treatment effects on diversity (species richness, Simpson, Shannon, and evenness indexes) and canopy cover of plants in three species groups or in total. The three species groups were exotic ruderal (ER), native ruderal (NR), and native residual forest (RF) species. Ruderal species respond favorably to distur-bances such as overstory removal and perform poorly in dense shade. Exotics (as contrasted with natives) are species that are now naturalized but were not originally present in the Pacific Northwest and were introduced in conjunction with the spreading of old-world culture into the area. Most exotic species come from Europe or Asia. Most NR species are perennials, whereas most ER species are annuals, biennials, or short-lived perennials. Residual forest species are native shade-tolerant species typically associated with interior forest settings and are generally long-lived perennials. Many of these species regenerated from residual stumps, rhizomes, or roots in the clearcut environment. For analyses of canopy cover, individual species’ canopy covers were summed for each species group (i.e., ER, NR, RF, and total understory) by plot.
We used PC-Ord computer software (McCune and Mefford 1999) to calculate several indicators of species diversity per 176.6-m2 plot (i.e., species richness, Simpson, Shannon, and evenness indexes). Richness is expressed as the number of vascular plant species on a plot by species group (ER, NR, RF) or as an overall total (all species on a 176.6-m2 plot regardless of group).
Community composition—
To examine plant community floristics before and after treatment, we used PC-Ord to conduct two nonmetric multidimensional scaling (NMS) ordinations (McCune and Mefford 1999) (table 2). One ordination included only plots that had not re-ceived vegetation control (n = 32). A second ordination included only plots that received vegetation control (n = 40). The response variables were estimated canopy covers for all understory species. We set the PC-Ord NMS autopilot for thorough-ness, specified use of the Sorensen distance measure, and otherwise used default
Table 2—Nonmetric multidimensional scaling model performance for the two ordinations described in the texta
Final Number of
Data set Stress Instability Iterations Plots Species
No vegetation control 13.5 <0.00001 74 32 116Vegetation control 10.3 0.007 500 40 90a Douglas-fir was not included in these ordinations.
We analyzed site and treatment effects on diversity and canopy cover of plants in three species groups or in total. The three species groups were exotic ruderal (ER), native ruderal (NR), and native residual forest (RF) species.

8
research paper pnw-rp-589
settings. Default settings included 6 axes, 400 (maximum) iterations, random start-ing coordinates, reduction in dimensionality of 1 at each cycle with a 0.2 step length (rate of movement toward minimum stress), random number of seeds, 40 runs with real data, 50 runs with randomized data, and a stability criterion of 0.000010 standard deviations in stress over the last 15 iterations. We superimposed on our ordinations joint plots (McCune and Mefford 1999) of 5-year tree height and crown width (measures of productivity) and seven measures of diversity including number of NR, ER, and RF species; total richness; Shannon’s index; Simpson’s index; and evenness. Joint plots show the direction (angle) and strength (line length) of rela-tions of variables to the ordination scores (correlations). The lines of the joint plots emanate from the centroid of all the species data used in the ordination.
Analysis of variance (diversity and canopy cover)— We used analysis of variance (ANOVA) to test the hypothesis that the ordination centroids of the three sites were not distinct on each axis of each ordination. We an-alyzed site-specific effects in canopy cover and diversity variables with two factor mixed-model ANOVA (SAS PROC MIXED) (SAS Institute Inc. 2003) to evaluate debris and vegetation control treatments (fixed effects), blocking (random effect), and treatment interactions within each site.
Cover relations among the species groups— We used linear regression to test for differences among sites in the cover relations of NR and native RF species versus ER species. For each relation, plot values were pooled across sites for each of the debris treatments without vegetation control (n = 8, 12, and 12 for Fall River, Matlock, and Molalla, respectively). Indicator variables were specified to test for differences in slopes and intercepts among sites using the extra-sums-of-squares approach (Neter et al. 1989). Stepwise regression in PROC Reg was used to compare a full model with reduced models having common inter-cepts, slopes, or both (SAS 2003).
Relation of richness to total cover— We used linear regression to test for site differences in the relation of richness to total understory cover. Total understory cover (summed over all species except Douglas-fir) was used as the measure of intensity of vegetation control as well as an indicator of site productivity. Plot values of richness, pooled across sites for each of the debris treatments with and without vegetation control (n = 24 for each site), were regressed against associated plot values for total understory cover. The extra-sums-of-squares approach was used similarly as described above to test for differences in slopes and intercepts among sites for each relation (Neter et al. 1989).

9
Relations of Native and Exotic Species 5 Years After Clearcutting With and Without Herbicide and Logging Debris Treatments
ResultsSpecies Composition and DiversityOver all plots regardless of treatment at each site (n = 24 per site), we found 82 spe-cies at Matlock, 91 species at Molalla, and 52 species at Fall River. On the debris- dispersed treatment plots where no herbicide was used, we found 80 species at Mat-lock (n = 4), 89 species at Molalla (n = 4), and 49 species at Fall River (n = 8). Thus, Fall River was the least diverse site, Molalla had a few more species than Matlock, and nearly all species at each site were found in the debris-dispersed plots.
The dominant species differed among the treatments that lacked vegetation control. At Matlock, the three most abundant species were oxeye daisy (Leucanthe-mum vulgare Lam.; 28 percent cover), hairy cat’s ear (Hypochaeris radicata L.; 27 percent), and Douglas-fir (8 percent). The most abundant species at Molalla were California blackberry (Rubus ursinus Cham. & Schltdl.; 55 percent cover), velvet grass (Holcus lanatus L.; 27 percent), and Douglas-fir (12 percent). At Fall River, the most abundant species were Douglas-fir (53 percent), hairy cat’s ear (34 per-cent), and velvet grass (27 percent). The vegetation control treatments were mostly dominated by the same species, but with much lower covers except for Douglas-fir, which had higher cover.
Our NMS ordinations separated the three sites floristically (fig. 1). Overall NMS model performance is provided in table 2 and correlation values (tau) for each variable in the joint plots with each axis are given in table 3. Without vegetation control, the average location of points from any two sites on either axis was signifi-cantly different with the exception of Molalla and Fall River on axis 1. However, with vegetation control, all possible site comparisons were significantly different. The community floristic affinities are further indicated by the unique sharing of 10 species between Fall River and Molalla, but only 3 species were uniquely shared between Fall River and Matlock. However, Matlock and Molalla had 32 species uniquely in common, suggesting even closer affinities between these sites. There were no clear patterns in our ordinations attributable to debris treatments except for the partial separation of debris removed versus debris dispersed plots at Fall River where vegetation control was used (fig. 1b).
The joint plot in figure 1 (correlation values presented in table 3) suggests that two indicators of productivity (crown width and tree height) correlate with the floristic differences that separate the three sites in the ordination. Thus, Fall River and Molalla (with the largest tree sizes) are separated on axis 1 from Matlock with the smallest tree size (fig. 1a). Molalla is further separated from the other sites by higher NR species diversity as is Matlock by higher ER species diversity. Figure 1b shows that the more severely herbicide treated Fall River community separates

10
research paper pnw-rp-589
Table 3—Correlation (tau) of each productivity and diversity indicator with each ordination axis
No vegetation Vegetation control controlAxis 1 2 1 2Crown width -0.47 -0.26 -0.48 -0.43Tree height -0.59 -0.12 -0.55 -0.37Richness 0.26 0.33 0.62 0.34Evenness index 0.24 0.06 0.67 0.32Shannon index 0.30 0.23 0.70 0.28Simpson index 0.22 0.09 0.69 0.33Exotic ruderal count 0.52 0.04 0.53 0.39Native ruderal count -0.01 0.56 0.55 0.51Residual forest count 0.07 -0.21 0.58 0.19
from the Matlock and Molalla communities on the basis of lower diversity, which is inversely correlated with tree size.
Our data suggest that debris treatments have only modest effects on diversity and little if any effect on Douglas-fir productivity as measured by 5-year height and canopy cover growth (table 4). No debris treatment effect was found for any richness or diversity index at Molalla. The Matlock Shannon index was higher for the debris-piled treatment than for the debris-removed treatment. At Fall River
Figure 1—Nonmetric multidimensional scaling ordinations by treatment type at Matlock (M), Molalla (m), and Fall River (F) for (a) plots without vegetation control and (b) plots with vegetation control. Superimposed are joint plots showing the direction (angle) and strength (line length) of relations of tree size and species diversity measures to the ordination scores. Included are Douglas-fir height (ht), Douglas-fir crown width (cw), number of native ruderal (NR) species, number of exotic ruderal (ER) species, number of residual forest (RF) species, total richness (ri), Shannon’s index (Sh), Simpson’s index (Si), and evenness (ev). In “a,” Simpson’s index, and exotic ruderal (er) count fall on the same angle but are different lengths. Similarly, evenness and Si fall on another line. Douglas-fir was not included in these ordinations.
A. Plots without vegetation control B. Plots with vegetation control
Debris treatments have only modest effects on diversity and little if any effect on Douglas-fir productivity.

11
Relations of Native and Exotic Species 5 Years After Clearcutting With and Without Herbicide and Logging Debris Treatments
Table 4—Mean 5-year treatment cover and diversity index values with P-values for comparisons that were significantly different (α = 0.05)a b c
Matlock VC x LDD LDP LDR Debris P NVC VC VC P Debris Pn 8 8 8 12 12
Douglas-fir height 195.3 170.6 175.3 163.7 197.1 0.00 Douglas-fir cover 13.3 10.4 10.7 7.7 15.2 0.00 Exotic ruderal cover 38.8 45.9 57.2 0.04* 79.8 14.9 0.00 Native ruderal cover 23.2 13.1 13.2 19.8 13.2 Residual forest cover 30.5 19.4 14.1 <0.01** 22.0 20.7 Total understory cover 92.5 78.4 84.5 121.5 48.8 0.00 Exotic ruderal richness 7.8 8.6 8.1 10.0 6.3 0.00 Native ruderal richness 9.0 8.5 8.0 9.8 7.2 0.01 Residual forest richness 13.6 12.4 11.4 12.7 12.3 Evenness index 0.7 0.7 0.7 0.7 0.7 0.05Shannon index 2.4 2.5 2.2 0.04*** 2.4 2.3 0.01Simpson index 0.9 0.9 0.8 0.8 0.8
Molalla
n 8 8 8 12 12
Douglas-fir height 227.4 323.1 227.2 217.3 240.5 0.05 Douglas-fir cover 13.3 15.3 13.8 12.4 15.9 0.01 Exotic ruderal cover 39.6 33.7 40.3 54.2 21.5 0.01 Native ruderal cover 56.3 55.2 57.3 89.3 23.2 0.00 Residual forest cover 21.7 22.7 23.9 32.0 13.5 0.00 Total understory cover 117.6 111.6 121.5 175.6 58.3 0.00 Exotic ruderal richness 6.3 6.3 6.5 7.0 5.7 Native ruderal richness 11.4 11.6 11.0 15.1 7.6 0.00 Residual forest richness 8.9 9.8 8.4 10.7 7.3 0.00 Evenness index 0.6 0.7 0.6 0.6 0.7 Shannon index 2.1 2.2 2.1 2.3 2.0 0.00 Simpson index 0.8 0.8 0.8 0.8 0.8
Fall River
n 16 0 8 8 16
Douglas-fir height 323.9 344.8 310.4 341.1 0.00 Douglas-fir cover 62.5 70.6 53.1 71.3 0.00 Exotic ruderal cover 33.0 2.9 64.8 2.0 0.00 Native ruderal cover 25.5 1.0 50.6 0.7 0.00 Residual forest cover 14.7 1.0 28.1 1.2 0.00 Total understory cover 73.1 4.9 143.5 3.9 0.00 Exotic ruderal richness 4.1 2.5 5.8 2.5 0.00 Native ruderal richness 4.3 2.5 6.9 2.1 0.00 Residual forest richness 8.4 5.0 11.5 5.2 0.00 Evenness index 0.4 0.1 0.03 0.6 0.1 0.00 Shannon index 1.1 0.3 0.04 2.0 0.3 0.00 Simpson index 0.4 0.1 0.01 0.8 0.1 0.00 a Where three values are compared (as in the case of debris treatments), mean separations according to Tukey Honestly Significant Difference tests (α = 0.05) are provided at the end of the table.b Douglas-fir is not included in the richness values.c LDD = logging debris dispersed, LDP = logging debris piled, LDR = logging debris removed, NVC = no vegetation control, and VC = vegetation control.Note: * LDD < LDR, ** LDD > (LDR = LDP), *** LDP > LDR.

12
research paper pnw-rp-589
the Evenness, Shannon and Simpson indexes were higher for the debris-dispersed treatment than for the debris-removed treatment. Thus, removal of organic matter sometimes decreased diversity, but never increased it.
Herbicide treatments decreased diversity while increasing Douglas-fir growth (table 4). All indicators of richness and diversity decreased significantly at Fall River. Matlock ruderal richness (exotic and native) decreased, but at Molalla native species richness (ruderal and RF) decreased. At Matlock, none of the diversity indexes changed (evenness, Shannon, Simpson), but at Molalla the Shannon index decreased.
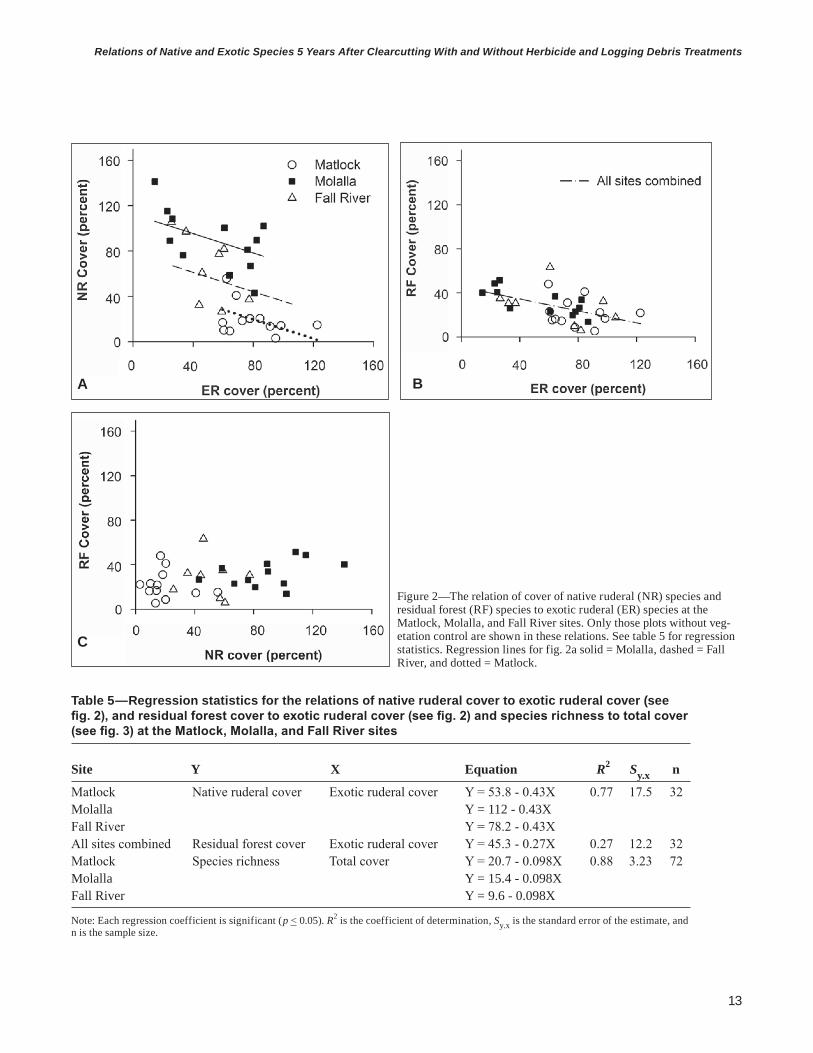
Relations Among Native and Exotic Species GroupsIn the absence of vegetation control, there was a strong negative relation (R2 = 0.77; P < 0.01, slope = -0.43) between NR cover and ER cover suggesting that species in these two groups have overlapping resource requirements resulting in competition (fig. 2, table 5). Intercepts, but not slopes, differed among sites for the NR and ER relation (fig. 2a), but a common intercept and slope were found for all three sites in the relation of RF cover and ER cover (fig. 2b). A weaker relation (R2 = 0.27; P < 0.01, slope = -0.27) between RF cover and ER cover suggests that ER species compete with RF species to a lesser extent than with NR species. Conversely, a lack of a relation between RF cover and NR cover suggests little interaction at age 5 between these two groups (fig. 2c).
Canopy Cover and ProductivityDouglas-fir cover and height were greater with than without vegetation control at all three sites (table 4). At Matlock ER cover was higher where logging debris was removed than where it had been dispersed. Also, RF species cover was significantly higher where logging debris was dispersed than where it had been piled or removed at Matlock. No such relation was found among debris treatments at Molalla, and owing to experimental design differences, this comparison could not be made at Fall River. On debris-dispersed plots without vegetation control, Douglas-fir height and canopy cover were greatest at Fall River and least at Matlock (table 4).
Relation of Richness to Total CoverOver all plots with or without vegetation control, richness had a strong, positive linear relation with total understory cover (R2 = 0.88, P < 0.01; fig. 3). Although the site determined the overall level of richness (regression intercepts differed signifi-cantly among sites), the rate of species loss owing to vegetation control (regression slope) was independent of site, herbicides used, and application protocols that were
Exotic ruderal species compete with residual forest species to a lesser extent than with native ruderal species. A lack of a relation between residual forest cover and native ruderal cover suggests little interaction at age 5 between these two groups.
13
Relations of Native and Exotic Species 5 Years After Clearcutting With and Without Herbicide and Logging Debris Treatments
A B
C
Figure 2—The relation of cover of native ruderal (NR) species and residual forest (RF) species to exotic ruderal (ER) species at the Matlock, Molalla, and Fall River sites. Only those plots without veg-etation control are shown in these relations. See table 5 for regression statistics. Regression lines for fig. 2a solid = Molalla, dashed = Fall River, and dotted = Matlock.
Table 5—Regression statistics for the relations of native ruderal cover to exotic ruderal cover (see fig. 2), and residual forest cover to exotic ruderal cover (see fig. 2) and species richness to total cover (see fig. 3) at the Matlock, Molalla, and Fall River sites
Site Y X Equation R2 Sy.x n
Matlock Native ruderal cover Exotic ruderal cover Y = 53.8 - 0.43X 0.77 17.5 32Molalla Y = 112 - 0.43XFall River Y = 78.2 - 0.43XAll sites combined Residual forest cover Exotic ruderal cover Y = 45.3 - 0.27X 0.27 12.2 32Matlock Species richness Total cover Y = 20.7 - 0.098X 0.88 3.23 72Molalla Y = 15.4 - 0.098XFall River Y = 9.6 - 0.098X
Note: Each regression coefficient is significant (p < 0.05). R2 is the coefficient of determination, Sy.x is the standard error of the estimate, and n is the sample size.

14
research paper pnw-rp-589
used. Species loss was proportional to the amount of total understory canopy cover remaining after treatment (approximately one species lost for each 10 percent reduc-tion of cover).
DiscussionCommunity Structure and CompositionOur three Western Hemlock Zone (Franklin and Dyrness 1988) sites had distinctive environments, floras, and levels of productivity. Indicator species (Halverson et al. 1986, Henderson et al. 1989) and our ordinations floristically separate each site from the others, but suggest closer floristic affinities between Matlock and Molalla than between either of these sites and Fall River. However, based on the ordinations, Molalla and Fall River are floristically more similar than are Matlock and Fall River. The joint plot suggests that high NR diversity helps to distinguish Molalla from Matlock and Fall River while high ER diversity helps to distinguish Matlock from the Molalla and Fall River communities.
The balance of evidence suggests a site productivity gradient of Matlock < Molalla < Fall River, which follows the observed ranking in soil water and N avail-ability among the three sites. Matlock had the highest precipitation, but also the lowest soil water-holding capacity and the lowest soil N. Fall River had the highest soil N, as well as a very deep clay-loam soil providing the largest soil water-holding
Figure 3—The relation of richness to total understory cover for combined plots with and without vegetation control at three study sites. Douglas-fir was not included in either rich-ness or cover as it was deliberately not treated with herbicide. See table 5 for regression statistics. Regression lines: dotted = Matlock, solid = Molalla, and dashed = Fall River.

15
Relations of Native and Exotic Species 5 Years After Clearcutting With and Without Herbicide and Logging Debris Treatments
Table 6—Comparison of means and standard deviations (SD) for Douglas-fir height, cover, and plant community diversity indicators for logging debris dispersed without vegetation control plots at the three sites
Matlock Molalla Fall River n 4 4 8 Mean SD Mean SD Mean SD
Douglas-fir height (cm) 169 20.6 219 9.3 310 16.0Douglas-fir cover 8.5 0.8 11.4 2.2 53.1 5.3Exotic ruderal cover 69.7 11.3 58.6 30.7 64.8 30.4Native ruderal cover 27.9 18.6 87.9 42.7 50.6 16.3Residual forest cover 33.8 14.2 28.2 8.2 28.1 17.9Exotic ruderal richness 10.3 1.7 6.8 1.5 5.8 1.4Native ruderal richness 10.8 2.6 15.8 3.2 6.9 1.5Residual forest richness 14.8 2.1 10.5 2.4 11.5 3.1Richness (w/o Douglas-fir) 35.8 6.0 33.0 3.7 24.1 2.9Evenness index 0.7 0.03 0.6 0.03 0.6 0.03Shannon index 2.6 0.16 2.2 0.16 2.0 0.13Simpson index 0.9 0.02 0.8 0.02 0.8 0.02
capacity. Site index values (King 1966) from the preharvest stands suggest Fall River is the most productive site (Fall River 41 to 43 m) (Terry et al. 2001), but do not distinguish between Matlock and Molalla (both 36 m) (Harrington and Schoen-holtz 2010). However, published site index (McArdle and Meyer 1930, base 100 years) values for the plant associations present on these sites are 38 m for Matlock, 43 m for Molalla, and 54 m for Fall River (Halverson et al. 1986, Henderson et al. 1989). Also, the mean 5-year postharvest Douglas-fir tree heights and covers were least at Matlock and greatest at Fall River.
Trends in species richness approximated the inverse of the productivity gradient as suggested by the Intermediate Disturbance Hypothesis (Huston 1979). Although total richness was greatest at Molalla, richness per unit of canopy cover was great-est at Matlock (least productive) and least at Fall River (most productive) with or without vegetation control (fig. 3). Also, all three diversity indexes were apparently higher on debris-dispersed plots at Matlock than the other two sites, and total richness was lowest at Fall River (table 6). Exotic species were especially important contributors to the diversity at Matlock.
The negative relation of ER and RF species covers contrasts with the lack of a relation between NR and RF covers, suggesting that ER and NR species groups are not only functionally different but have fundamentally different relations to RF species as a result. In general, ruderal species (native or exotic) rapidly occupy space not already occupied by RF species during early succession. The more RF cover surviving the disturbance, the less ruderal cover and thus an inverse relation
16
research paper pnw-rp-589
develops. However, chronosequence data from Fall River clearly show ER species establishing dominance more quickly than NR species (Peter and Harrington 2009). The rapid occupancy of open space by ER species obscures what might otherwise have been a similar relation of NR to RF species in the past before the invasion of ER species. Thus, in the past, a negative relation of NR and RF species probably developed, albeit more slowly. The ability of ER species to more rapidly occupy these sites than NR species is key to their invasion success and the reason for the current obscure relation of NR and RF species. Native ruderal species appear to invade and grow more slowly, gradually taking space left as shorter lived ER species senesce. Thus, NR cover shows little relation to RF cover at this point in succession.
The inverse relation between NR and ER cover suggests niche overlap and com-petition. Regardless of site, a change of 4 percent cover of ER species was accompa-nied by an opposite change of 10 percent cover of NR species. However, there was apparently no consistent dominance of one group by the other, and, to our knowl-edge, no localized extinction has resulted, suggesting that our communities are not species saturated. Antos and Halpern (1997) found lower root-to-shoot ratios of invading annuals (including some ER species) than in NR perennials like fireweed (Chamerion angustifolium (L.) Holub). Greater belowground resource allocation of NR species suggests a strategy of superior competitiveness for soil resources, but at the expense of rapid reproductive capacity and capture of aboveground growing space and thus a difference in their niche space relative to ER species. Apparently, niche overlap of these groups is sufficient for NR species to have lost some growing space to ER species; however, they appear to differ enough in habitat requirements that coexistence is possible provided species in both groups have access to the site.
Differences in site characteristics or land use history determined the repre-sentation of ruderals. Based on productivity, Fall River might have been expected to have the greatest total ruderal cover; however, Douglas-fir attains dominance so rapidly on this site that light and root competition partly suppressed the ruderal plants by age 5 years, suggesting that high productivity compresses the window of availability of suitable habitat for ruderal species. Higher richness of ER species at Matlock and the inverse relation of NR to ER species suggests that Matlock is more susceptible to invasion by ER species than the other sites. This may result from a slower rise in dominance of trees, a slower rate of colonization by NRs owing to their more conservative reproductive strategy, and to the slow recovery rate of RF species.
A change of 4 percent cover of exotic ruderal species was accompanied by an opposite change of 10 percent cover of native ruderal species. Niche overlap of these groups is sufficient for native ruderal species to have lost some growing space to exotic ruderal species; however, they appear to differ enough in habitat requirements that coexistence is possible.

17
Relations of Native and Exotic Species 5 Years After Clearcutting With and Without Herbicide and Logging Debris Treatments
Debris TreatmentsGround disturbance, disruption of the litter layer, and top damage to perennial native plants associated with logging debris removal and piling likely favored fast-growing ERs at the expense of native species. Differences in cover among debris treatments were significant at Matlock (ER species: debris dispersed < debris removed; RF species: debris dispersed > debris removed or piled). Scotch broom also increased where debris was removed at Matlock relative to where debris was dispersed (Harrington and Schoenholtz 2010). Ground disturbance also promoted ER species invasion elsewhere (Marshall and Buckley 2008, Sumners and Archibald 2007). However, at Molalla and Fall River, the debris treatments had little effect on abundance of the species groups, similar to some other studies where organic matter removal caused only small changes in soil carbon and N (Powers 2004, Sanchez et al. 2006), microbial communities (Busse et al. 2006), species richness (Alban et al 1994, Hauesler et al. 1999) and conifer growth (Fleming et al. 2006). We suggest that the low N content and water-holding capacity of soil at Matlock slowed recovery or increased mortality of damaged RF species making more and longer lasting openings available to invasive exotic species. This also accounts for Matlock’s higher ER cover in the debris-removed treatment compared to the debris-dispersed treatment.
Vegetation ControlSimilar to other studies involving high rates or repeated applications of herbicides (Pitt et al. 2004, Wilkins et al. 1993), our vegetation control treatments increased tree growth but caused a loss of diversity and plant cover. The more extreme Fall River vegetation control treatments clearly overwhelmed all species groups unlike the Matlock or Molalla treatments, but even at these sites, cover and diversity were lost. The similarity of the richness response to loss of cover at all three sites regard-less of substantial differences in flora, productivity, and treatments (one species lost for each 10 percent reduction in cover) suggests robustness for this relationship in Pacific Northwest forests.
Concern over Scotch broom competition with planted Douglas-fir at Matlock prompted an effort to control the broom with individual-plant applications of triclopyr in years 1, 4, and 5 on all plots (Harrington and Schoenholtz 2010). Obser-vations by the authors and others (Wearne and Morgan 2004) indicate that Scotch broom commonly attains high densities that suppress species diversity. Scotch broom would likely turn the predominantly herbaceous-to-tree-dominated succes-sion at Matlock (potentially at the other sites too), into a shrub-to-tree-dominated succession while delaying the time required for Douglas-fir to attain dominance.
18
research paper pnw-rp-589
The extra control measures prevented excessive loss of diversity and tree mortality (Harrington and Schoenholtz 2010), and thwarted a potential change in successional state. Scotch broom was present at the other sites, but did not achieve high levels of dominance there owing to differences in previous stand history, aggressiveness of previous control efforts, and possibly differences in soil N. Controlling this shrub at Matlock provided a more favorable comparison of the remaining, mostly her-baceous ruderal communities. However, it is important to recognize the potential of this and some other species such as red alder (Alnus rubra Bong.) for changing the outcome of this study and succession in general with severe consequences to the timber crop. Red alder has the potential to be an aggressive competitor at Molalla and Fall River, but probably not at Matlock because of limited soil water availability.
Plant community composition at Matlock and Molalla, but not Fall River, became more similar (shown by ordination) after vegetation control owing to dif-ferential reductions in ruderal richness and dominance. The ER richness at Matlock and the NR richness at Molalla (and both groups at Fall River) were reduced significantly, thus there does not appear to be any tendency of either group toward greater herbicide resistance. While Matlock and Molalla vegetation became more similar, herbicide treatment decreased their similarity to Fall River. Reduction of richness and diversity indexes at Fall River with vegetation control indicates that representation of the fewer remaining species became more unequal. Exotic ruder-als, although much diminished on vegetation control plots, had more than twice the cover of native RF species and four times that of the NRs suggesting a superior ability to colonize and grow between herbicide applications.
The Intermediate Disturbance Hypothesis (IDH) predicts that an optimal frequency and intensity of disturbance produces the highest diversity for a given community (Connell 1978, Grime 1973). This theory is mainly premised on two observations: (1) highly competitive species suppress less competitive species, and (2) disturbance may injure or kill highly competitive species as much or more than others, thus reducing the advantage that they have. Thus, when the forest overstory is removed, the understory is released and space is made available for invaders. Damage done to the understory vegetation during timber harvest and site prepara-tion (e.g., debris treatments) creates space for ruderal invasion but rarely eliminates the original understory flora, resulting in an increase in diversity. This was the case for the plots that did not receive vegetation control. Although we do not have preharvest data for our stands, casual observation of adjacent intact forest and species lists accumulated for mature and old-growth stands of the plant associations we identified (Halverson et al. 1986, Henderson et al. 1989) strongly suggest that

19
Relations of Native and Exotic Species 5 Years After Clearcutting With and Without Herbicide and Logging Debris Treatments
diversity increased after forest harvesting at all three of our sites wherever vegeta-tion control was not used. Thus, harvesting and debris treatments by themselves tend to promote community diversity and thus do not greatly exceed the optimal level of disturbance predicted by the IDH.
Foresters typically plant vigorous seedlings of a highly competitive tree species (e.g., Douglas-fir) often with vegetation control treatments. This allows the planted trees to achieve dominance more rapidly than during natural succession, thereby reducing the time that the community spends in a diverse early successional state over what would naturally occur. The inverse relation of productivity and diversity among our sites suggests that tree growth, even by year 5, may be reducing commu-nity diversity at Fall River but not at Matlock. This is also suggested by the relation of tree size to community composition in the ordination joint plots and is suggested in the findings of Peter and Harrington (2009). Thus, when intermediate levels of disturbance stop, or when a single species is allowed to escape the effects of distur-bance and grow to dominance, the IDH predicts that species diversity will decline. The resulting condition that develops in forests has been refered to as the stem-exclusion stage (Oliver 1980) and is widely recognized as having low diversity. It is therefore especially important in systems managed on short timber rotations to understand how silvicultural treatments affect ephemeral developing understory communities where most of the diversity of the developing forest resides.
The vegetation control treatments were effective in accelerating Douglas-fir dominance. Douglas-fir responded to reduced competition by growing faster, and at Matlock with higher survival (Harrington and Schoenholtz 2010). The magnitude of the effect (34 percent increase in crown area) in the productive and predominantly herbaceous community at Fall River was notable; however, Douglas-fir benefited from vegetation control most at Matlock (56 percent increase in crown area). Even so, owing to lower productivity, it will be years before Douglas-fir at Matlock achieves the level of dominance expressed at Fall River in year 5, which means that early successional diversity will be expressed for a longer period of time at this site. However, by accelerating Douglas-fir dominance, ruderal species will be suppressed more rapidly with potential landscape-level implications for ruderal diversity and wildlife habitat quality where these practices are widespread.
Our annual herbicide treatments reduced richness of three different plant com-munities at the rate of one species per 10 percent loss of canopy cover regardless of site or treatment differences, suggesting a degree of generality for this relation. As expected, the more intensive Fall River treatments suppressed diversity and cover more than the Matlock or Molalla treatments, but at the same rate relative to
Our annual herbicide treatments reduced richness of three different plant communities at the rate of one species per 10 percent loss of canopy cover regardless of site or treatment differences, suggesting a degree of generality for this relation.
20
research paper pnw-rp-589
canopy cover. In the context of the IDH, the powerful effects of herbicide applica-tions pushed the community beyond an “intermediate” level of disturbance and thus compromised diversity.
Although herbicides have few natural analogues, like other disturbances they create new growing space, which is colonized by ruderals. Therefore, we expect that ruderals, especially ERs will increase upon cessation of herbicide treatments. While our research does not indicate what effect more typical single applications of herbicides would have on diversity, Stein (1995) found a compositional shift toward more ruderal species and little effect on diversity with a single application of glyphosate. Stein (1995), however, did not identify all taxa to species, so loss of rare species might have been overlooked. Peter and Harrington (2009) found that a single treatment at Fall River decreased richness in the year of application while further annual applications prevented recovery. Elsewhere, few effects of vegetation control with herbicides on diversity have been reported (Boyd et al. 1995, Haeussler et al. 2002). However, these and most other forestry herbicide studies monitored diversity years after treatment, unlike ours, which monitored diversity during the first growing season following treatment. The lesson from these other studies appears to be that diversity does recover in time. We plan to continue monitoring these sites in the future to measure recovery of diversity and composition in the absence of further treatments.
The RF species group was somewhat tolerant of the herbicide control measures used. Over all three sites, vegetation control treatments reduced RF species cover and richness proportionately less than that of ruderal species. Residual forest spe-cies are mostly stress tolerators (Grime 1977) that cope with intense shade and root competition from the dominant arboreal overstory as succession proceeds. Many RF species have a large root (and rhizome)/shoot ratio, compared to ruderals (Antos and Halpern 1997, Lezberg et al. 1999), which is common for stress-tolerant plants (Chapin 1980) and an important strategy for surviving unpredictable top loss (Iwasa and Kubo 1997). The large underground investment in root and rhizome tissue, and the ability to regrow from these organs, allows many forest species to survive a variety of disturbances (Halpern 1988). We believe that these characteristics reduce the susceptibility of RF species to herbicides by reducing the proportion of tissue available for herbicide absorption compared to the total plant biomass (relative to most ruderals), resulting in a lower dose received. However, their ability to avoid herbicide injury was largely overcome at Fall River by more frequent applications, and therefore a higher dose, of herbicides.

21
Relations of Native and Exotic Species 5 Years After Clearcutting With and Without Herbicide and Logging Debris Treatments
ConclusionsAlthough ER and NR species have considerable niche overlap, ER species are more successful at initially occupying disturbed sites. While the response of NR species to ER species cover was independent of site or stand history, the overall ruderal representation was not. We believe that the kind and quantity of the original forest understory together with the level of damage incurred during harvest operations and the time sites are open and available (owing to differences in site productivity) are largely responsible for differences in the overall ruderal representation after clearcutting. Because ER species rapidly invade space not occupied by RF species, minimizing damage to the forest understory should decrease ER colonization. Intensive debris removal, which also involves ground disturbance further encour-aged ER establishment on our least productive site. But the lack of such an effect on our other sites suggests that this kind of activity has less impact than clearcutting on ruderal representation. The ability of ERs to rapidly invade after herbicide treat-ments suggests that limiting such activity would favor native species. Early suc-cessional species diversity is partly an expression of site potential because species richness is inversely proportional to site productivity (Huston 1979), but the degree of species saturation may also be important. Intensive vegetation control measures aimed at increasing tree productivity reduced richness at the rate of one species per 10 percent understory canopy cover reduction regardless of site or treatment dif-ferences. Understory dominance relations were also changed because of a superior ability of ERs to colonize and grow between herbicide treatments and less herbicide susceptibility of RF species compared to ruderals.
AcknowledgmentsThe authors acknowledge the generous support of Green Diamond Resource Company, Port Blakely Tree Farms, L.P., and Weyerhaeuser Company, which manage the Matlock, Molalla, and Fall River sites, respectively, for providing land as well as logistical and technical support for this project. This study is partially a product of the Sustainable Forestry Component of Agenda 2020, a joint effort of the U.S. Department of Agriculture (USDA), Forest Service, Research and Develop-ment Program (R&D) and the American Forest and Paper Association. Funds were provided by the USDA Forest Service R&D, Washington office. We also thank our many crew members for their diligent and exacting work in data collection, and Connie Harrington and Tom Terry for their assistance with the work at Fall River.
Although exotic ruderal and native ruderal species have considerable niche overlap, exotic ruderal species are more successful at initially occupying disturbed sites.

22
research paper pnw-rp-589
English EquivalentsWhen you know: Multiply by: To find:
Millimeters (mm) 0.0394 InchesCentimeters (cm) .394 InchesMeters (m) 3.28 FeetKilometers (km) .621 MilesHectares (ha) 2.47 AcresKilograms (kg) 2.205 PoundsKilograms per hectare (kg/ha) .893 Pounds per acre
ReferencesAlban, D.H.; Host, G.E.; Elioff, J.D.; Shadis, D. 1994. Soil and vegetation
response to soil compaction and forest floor removal after aspen harvesting. Res. Pap. RP-NC-315. St. Paul, MN: U.S. Department of Agriculture, Forest Service, North Central Forest Experiment Station. 11 p.
Antos, J.A.; Halpern, C.B. 1997. Root system differences among species: implications for early successional changes in forest of western Oregon. American Midland Naturalist. 138: 97–108.
Ares, A.; Terry, T.A.; Piatek, K.B.; Harrison, R.B.; Miller, R.E.; Flaming, B.L.; Licata, C.W.; Strahm, B.D.; Harrington, C.A.; Meade, R.; Anderson, H.W.; Brodie, L.C.; Kraft, J.M. 2007. The Fall River Long-Term Site Productivity Study in coastal Washington: site characteristics, methods, and biomass and carbon and N stores before and after harvest. Gen. Tech. Rep. PNW-GTR-691. Portland, OR: U.S. Department of Agriculture, Forest Service, Pacific Northwest Research Station. 85 p.
Bossard, C.C. 1993. Seed germination in the exotic shrub Cytisus scoparius (Scotch broom) in California. Madrono. 40: 47–61.
Boyd, R.S.; Freeman, J.D.; Miller, J.H.; Edwards, M.B. 1995. Forest herbicide influences on floristic diversity seven years after broadcast pine release treatments in central Georgia, USA. New Forests. 10: 17–37.
Busse, M.D.; Beattie, S.E.; Powers, R.F.; Sanchez, F.G.; Tiarks, A.E. 2006. Microbial community responses in forest mineral soil to compaction, organic matter removal, and vegetation control. Canadian Journal of Forest Research. 36: 577–588.
Chapin, F.S. 1980. The mineral nutrition of wild plants. Annual Review of Ecology and Systematics. 11: 233–260.

23
Relations of Native and Exotic Species 5 Years After Clearcutting With and Without Herbicide and Logging Debris Treatments
Connell, J.H. 1978. Diversity in tropical rain forests and coral reefs. Science. 199: 1302–1310.
Davis, M.A. 2003. Biotic globalization: Does competition from introduced species threaten biodiversity? BioScience. 53: 481–489.
Devine, W.D.; Harrington, C.A. 2007. Influence of harvest residues and vegetation on microsite soil and air temperatures in a young conifer plantation. Agricultural and Forest Meteorology. 145: 125–138.
Devine, W.D.; Harrington, T.B.; Terry, T.A.; Harrison, R.B.; Slesak, R.A.; Peter, D.H.; Harrington, C.A.; Shilling, C.J.; Schoenholtz, S.H. 2011. Five-year vegetation control effects on aboveground biomass and N content and allocation in Douglas-fir plantations on three contrasting sites. Forest Ecology and Management. 262: 2187–2198.
Egler, F. 1954. Vegetation science concepts I. Initial floristic composition, a factor in old-field vegetation development. Vegetatio. 4: 412–417.
Fleming, R.L.; Powers, R.F.; Foster, N.W.; Kranabetter, J.M.; Scott, D.A.; Ponder, F., Jr.; Berch, S.; Chapman, W.K.; Kabzems, R.D.; Ludovici, K.H.; Morris, D.M.; Page-Dumroese, D.S.; Sanborn, P.T.; Sanchez, F.G.; Stone, D.M.; Tiarks, A.E. 2006. Effects of organic matter removal, soil compaction, and vegetation control on 5-year seedling performance: a regional comparison of Long-Term Soil Productivity sites. Canadian Journal of Forest Research. 36: 529–550.
Franklin, J.F.; Dyrness, C.T. 1988. Natural vegetation of Oregon and Washington. Corvallis, OR: Oregon State University Press: 452 p.
Grime, J.P. 1973. Competitive exclusion in herbaceous vegetation. Nature. 242: 344–347.
Grime, J.P. 1977. Evidence for the existence of three primary strategies in plants and its relevance to ecological and evolutionary theory. American Naturalist. 111: 1169–1194.
Haeussler, S.; Bedford, L.; Leduc, A.; Bergeron, Y.; Kranabetter, J.M. 2002. Silvicultural disturbance severity and plant communities of the southern Canadian boreal forest. Silva Fennica. 36: 307–327.
Haeussler, S.; Kranabetter, M.; Sanborn, P.; Chapman, B.; Berch, S. 1999. Second year response of plant communities; The SBS Long-term Soil Productivity Study. Note #LTSPS-01. Smithers, BC: B.C. Ministry of Forests, Prince Rupert Forest Region. 4 p.

24
research paper pnw-rp-589
Halpern, C.B. 1988. Early successional pathways and the resistance and resiliance of forest communities. Ecology. 69: 1703–1715.
Halverson, N.M.; Topik, C.; Vickle, R.V. 1986. Plant association and management guide for the western hemlock zone, Mt. Hood National Forest. R6-ECOL-Tech.-Pap. 232A-1986. Portland, OR: U.S. Department of Agriculture, Forest Service, Pacific Northwest Region. 111 p.
Harrington, T.B.; Schoenholtz, S.H. 2010. Effects of logging debris treatments on five-year development of competing vegetation and planted Douglas-fir. Canadian Journal of Forest Research. 40: 500–510.
Henderson, J.A.; Peter, D.H.; Lesher, R.D.; Shaw, D.C. 1989. Forested plant associations of the Olympic National Forest. R6-ECOL-Tech.-Pap. 001-88. Portland, OR: U.S. Department of Agriculture, Forest Service. Pacific Northwest Region. 502 p.
Huston, M. 1979. A general hypothesis of species diversity. American Naturalist. 113: 81–101.
Iwasa, Y.; Kubo, T. 1997. Optimal size of storage for recovery after unpredictable disturbances. Evolutionary Ecology. 11: 41–65.
King, J.E. 1966. Site index curves for Douglas-fir in the Pacific Northwest. Weyerhaeuser Forestry Paper No. 8. Centralia, WA: Weyerhaeuser Company, Weyerhaeuser Forestry Research Center. 49 p.
Lezberg, A.L.; Antos, J.A.; Halpern, C.B. 1999. Belowground traits of herbaceous species in young coniferous forests of the Olympic Peninsula, Washington. Canadian Journal of Botany. 77: 936–943.
Mack, R.N.; Simberloff, D.; Lonsdale, W.M.; Evans, H.; Clout, M.; Bazzaz, F.A. 2000. Biotic invasions: causes, epidemiology, global consequences, and control. Ecological Applications. 10: 689–710.
Marshall, J.; Buckley, D. 2008. Influence of litter removal and mineral soil disturbance on the spread of an invasive grass in a central hardwood forest. Biological Invasions. 10: 531–538.
McArdle, R.E.; Meyer, W.H. 1930. The yield of Douglas-fir in the Pacific Northwest. Tech. Bull. 201. Washington, DC: U.S. Department of Agriculture. 64 p.
McCune, B.; Mefford, M.J. 1999. PC-ORD. Multivariate analysis of ecological data, Version 4. Gleneden Beach, OR: MjM Software Design. 237 p.

25
Relations of Native and Exotic Species 5 Years After Clearcutting With and Without Herbicide and Logging Debris Treatments
Neter, J.; Wasserman, W.; Kutner, M.H. 1989. Applied linear regression models. 2nd ed. Homewood, IL: Richard D. Irwin, Inc. 667 p.
Oliver, C.D. 1980. Forest development in North America following major disturbances. Forest Ecology and Management. 3: 153–168.
Peter, D.H.; Harrington, C. 2009. Six years of plant community development after clearcut harvesting in western Washington. Canadian Journal of Forest Research. 39: 308–319.
Pitt, D.G.; Wagner, R.G.; Towhill, W.D. 2004. Ten years of vegetation succession following ground-applied release treatments in young black spruce plantations. Northern Journal of Applied Forestry. 21: 123–134.
Powers, R.F.; Sanchez, F.G.; Scott, D.A.; Page-Dumroese, D. 2004. The North American Long-Term Soil Productivity Experiment: coast-to-coast findings from the first decade. In: Shepperd, W.D.; Eskew, L.G., eds. Proceedings of the national silviculture workshop: silviculture in special places. Fort Collins, CO: U.S. Department of Agriculture, Forest Service, Rocky Mountain Research Station: 191–206.
Roberts, S.D.; Harrington, C.A.; Terry, T.A. 2005. Harvest residue and competing vegetation affect soil moisture, soil temperature, N availability, and Douglas-fir seedling growth. Forest Ecology and Management. 205: 333–350.
Sanchez, F.G.; Tiarks, A.E.; Kranabetter, J.M.; Page-Dumroese, D.S.; Powers, R.R.; Sanborn, P.T.; Chapman, W.K. 2006. Effects of organic matter removal and soil compaction on fifth-year mineral soil carbon and N contents for sites across the United States and Canada. Canadian Journal of Forest Research. 36: 565–576.
SAS Institute Inc. 2003. SAS System for Windows, v 9.1. Cary, NC.
Smethurst, P.J.; Nambiar, E.K.S. 1990. Distribution of carbon and nutrients and fluxes of mineral nitrogen after clear-felling a Pinus radiata plantation. Canadian Journal of Forest Research. 20: 1490–1497.
Stein, W.I. 1995. Ten-year development of Douglas-fir and associated vegetation after different site preparation on Coast Range clearcuts. Res. Pap. PNW-RP-473. Portland, OR: U.S. Department of Agriculture, Forest Service, Pacific Northwest Research Station. 115 p.
Sumners, W.H.; Archibold, O.W. 2007. Exotic plant species in the southern boreal forest of Saskatchewan. Forest Ecology and Management. 251: 156–163.

26
research paper pnw-rp-589
Terry, T.A.; Harrison, R.B.; Harrington, C.A. 2001. Fall River Long-Term Site Productivity study: objectives and design. Forestry Research Technical Note LTSP Paper No. 01-1. Federal Way, WA: Weyerhaeuser Company, Western Timberlands R&D. 10 p.
U.S. Department of Agriculture, Natural Resources Conservation Service. 2009a. Official soil series descriptions. http://soils.usda.gov/technical/classification/osd/index.html. (22 January 2009).
U.S. Department of Agriculture, Natural Resources Conservation Service. 2009b. Parameter-elevation Regressions on Independent Slopes Model (PRISM). http://www.wcc.nrcs.usda.gov/water/climate/prism/prism.html. (5 April 2009).
Wearne, L.J.; Morgan, J.W. 2004. Community-level changes in Australian subalpine vegetation following invasion by the non-native shrub Cytisus scoparius. Journal of Vegetation Science. 15: 595–604.
Wilcove, D.S.; Rothstein, D.; Dubow, J.; Phillips, A.; Losos, E. 1998. Quantifying threats to imperiled species in the United States. BioScience. 48: 607–615.
Wilkins, R.N.; Marion, W.R.; Neary, D.G.; Tanner, G.W. 1993. Vascular plant community dynamics following hexazinone site preparation in the lower Coastal Plain. Canadian Journal of Forest Research. 23: 2216–2229.
27
Relations of Native and Exotic Species 5 Years After Clearcutting With and Without Herbicide and Logging Debris Treatments
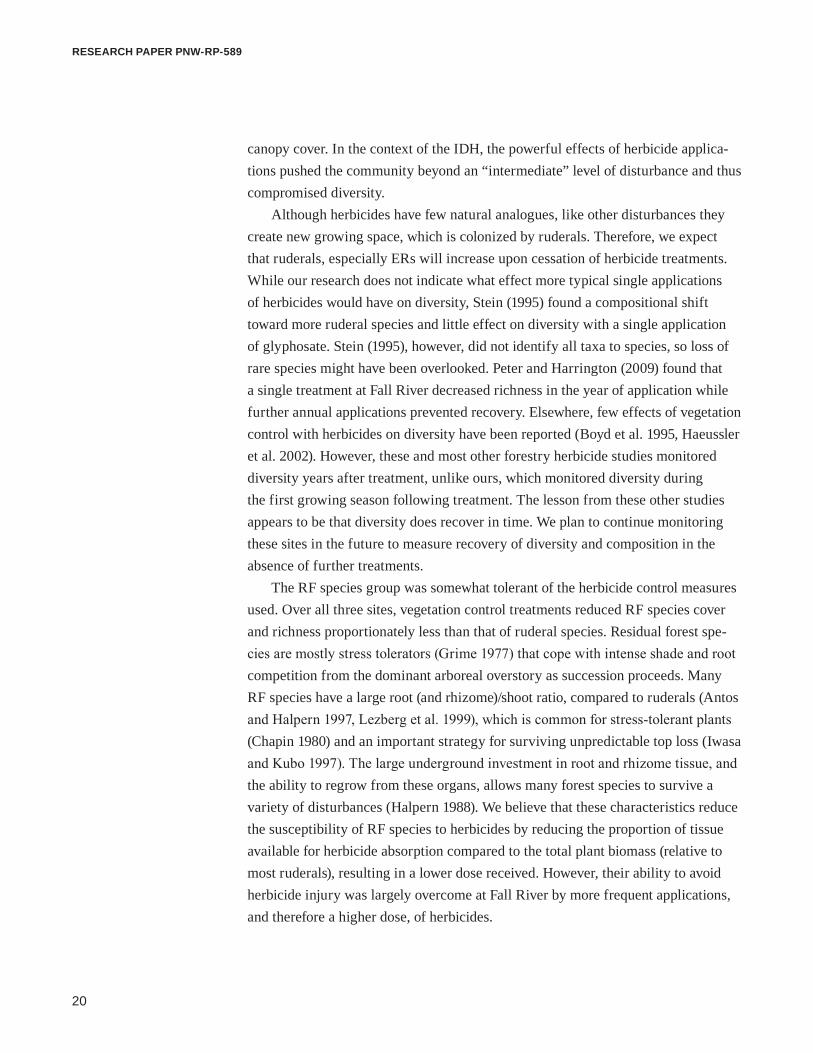
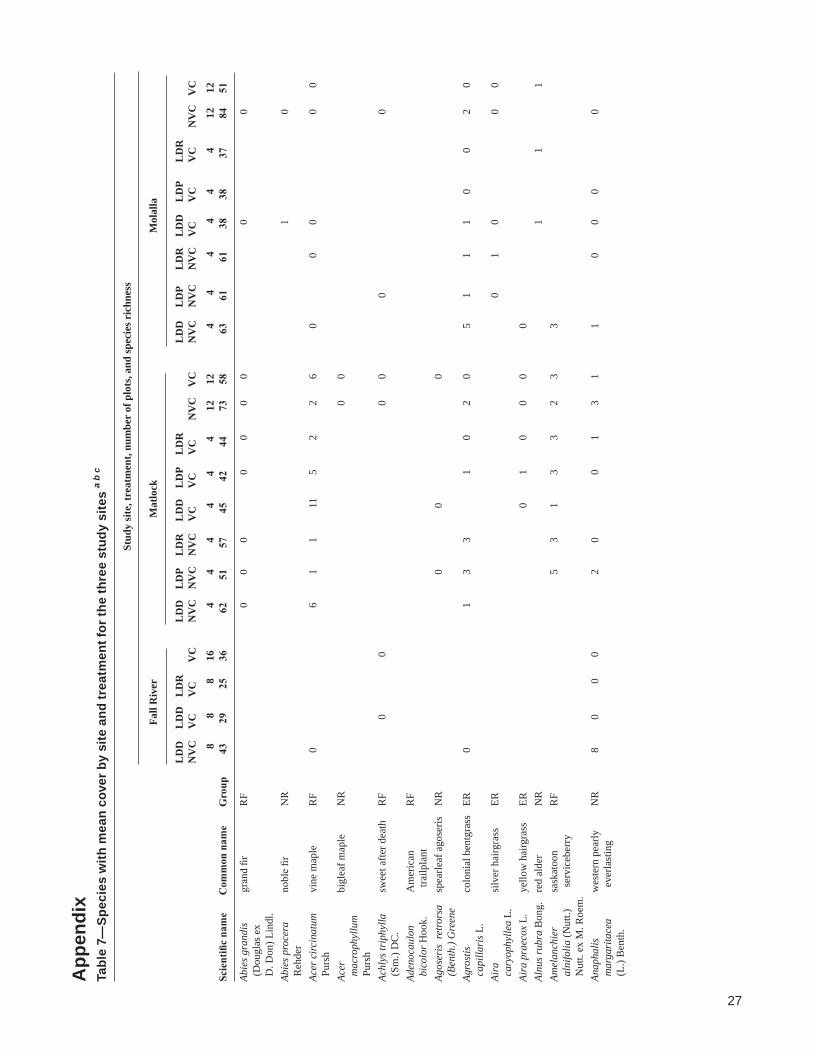
App
endi
xTa
ble
7—Sp
ecie
s w
ith m
ean
cove
r by
site
and
trea
tmen
t for
the
thre
e st
udy
site
s a
b c
Stud
y si
te, t
reat
men
t, nu
mbe
r of
plo
ts, a
nd sp
ecie
s ric
hnes
s
Fa
ll R
iver
M
atlo
ck
Mol
alla
L
DD
L
DD
L
DR
LD
D
LD
P L
DR
L
DD
L
DP
LD
R
LD
D
LD
P L
DR
L
DD
L
DP
LD
R
N
VC
V
C
VC
V
C
NV
C
NV
C
NV
C
VC
V
C
VC
N
VC
V
C
NV
C
NV
C
NV
C
VC
V
C
VC
N
VC
V
C
8
8 8
16
4 4
4 4
4 4
12
12
4 4
4 4
4 4
12
12
Scie
ntifi
c na
me
Com
mon
nam
e G
roup
43
29
25
36
62
51
57
45
42
44
73
58
63
61
61
38
38
37
84
51
Abie
s gra
ndis
gr
and
fir
RF
0 0
0
0 0
0 0
0
0
(D
ougl
as e
x D
. Don
) Lin
dl.
Abie
s pro
cera
no
ble
fir
NR
1
0
Reh
der
Acer
circ
inat
um
vine
map
le
RF
0
6 1
1 11
5
2 2
6 0
0
0
0
0 P
ursh
Acer
bi
glea
f map
le
NR
0
0
mac
roph
yllu
m
Pur
shAc
hlys
trip
hylla
sw
eet a
fter d
eath
R
F
0
0
0
0
0
0
(
Sm.)
DC
.Ad
enoc
aulo
n A
mer
ican
R
F
b
icol
or H
ook.
t
railp
lant
Agos
eris
ret
rors
a sp
earle
af a
gose
ris
NR
0
0
0
(
Bent
h.) G
reen
eAg
rost
is
colo
nial
ben
tgra
ss
ER
0
1 3
3
1 0
2 0
5 1
1 1
0 0
2 0
cap
illar
is L
.Ai
ra
silv
er h
airg
rass
ER
0 1
0
0
0 c
aryo
phyl
lea
L.Ai
ra p
raec
ox L
. ye
llow
hai
r gra
ss
ER
0
1 0
0 0
0
Al
nus r
ubra
Bon
g.
red
alde
r N
R
1
1
1
Amel
anch
ier
sask
atoo
n R
F
5 3
1 3
3 2
3 3
a
lnifo
lia (N
utt.)
s
ervi
cebe
rry
Nut
t. ex
M. R
oem
.An
apha
lis
wes
tern
pea
rly
NR
8
0 0
0
2 0
0
1 3
1 1
0
0 0
0
m
arga
rita
cea
eve
rlast
ing
(L.
) Ben
th.

28
research paper pnw-rp-589
Tabl
e 7—
Spec
ies
with
mea
n co
ver b
y si
te a
nd tr
eatm
ent f
or th
e th
ree
stud
y si
tes
a b
c (con
tinue
d)
Stud
y si
te, t
reat
men
t, nu
mbe
r of
plo
ts, a
nd sp
ecie
s ric
hnes
s
Fa
ll R
iver
M
atlo
ck
Mol
alla
L
DD
L
DD
L
DR
LD
D
LD
P L
DR
L
DD
L
DP
LD
R
LD
D
LD
P L
DR
L
DD
L
DP
LD
R
N
VC
V
C
VC
V
C
NV
C
NV
C
NV
C
VC
V
C
VC
N
VC
V
C
NV
C
NV
C
NV
C
VC
V
C
VC
N
VC
V
C
8
8 8
16
4 4
4 4
4 4
12
12
4 4
4 4
4 4
12
12
Scie
ntifi
c na
me
Com
mon
nam
e G
roup
43
29
25
36
62
51
57
45
42
44
73
58
63
61
61
38
38
37
84
51
Anth
oxan
thum
sw
eet v
erna
lgra
ss
ER
8 2
10
0
7
0
0
0
o
dora
tum
L.
Apoc
ynum
sp
read
ing
dogb
ane
NR
1
0
0 0
0 a
ndro
saem
ifoliu
m L
.At
hyri
um filix-
suba
rctic
lady
fern
R
F 0
0
0
f
emin
a (L
.) R
oth
ssp
. cyc
loso
rum
R
upr.)
C. C
hr.
Blec
hnum
spic
ant
deer
fern
R
F 0
(L.
) Sm
.Br
omus
iner
mis
sm
ooth
bro
me
ER
0
0
Ley
ss.
Brom
us L
. br
ome
NR
0
0
0
Brom
us pacificus
Paci
fic b
rom
e N
R
0
0
She
arBr
omus
vul
gari
s C
olum
bia
brom
e N
R
2 2
1
2
(H
ook.
) She
arC
ampa
nula
pa
le b
ellfl
ower
N
R
0
0
0 1
0
0
0 0
sco
uler
i H
ook.
ex
A. D
C.
Car
ex d
ewey
ana
Dew
ey se
dge
RF
0
0 0
0
Sch
wei
n.C
arex
hen
ders
onii
Hen
ders
on’s
sedg
e N
R
0
0 0
0
0
L.H
. Bai
ley
Car
ex ro
ssii
Boo
tt R
oss’
sedg
e N
R
0
0 0
0
0 0
0
0 1
0 0
0 0
Cer
astiu
m
field
chi
ckw
eed
NR
0
0
a
rven
se L
.C
eras
tium
bi
g ch
ickw
eed
ER
1
0 0
0
0 0
0
0 0
0 0
0 0
fon
tanu
m
Bau
mg.
ssp.
v
ulga
re (H
artm
.) G
reut
er &
Bur
det

29
Relations of Native and Exotic Species 5 Years After Clearcutting With and Without Herbicide and Logging Debris Treatments
Tabl
e 7—
Spec
ies
with
mea
n co
ver b
y si
te a
nd tr
eatm
ent f
or th
e th
ree
stud
y si
tes
a b
c (con
tinue
d)
Stud
y si
te, t
reat
men
t, nu
mbe
r of
plo
ts, a
nd sp
ecie
s ric
hnes
s
Fa
ll R
iver
M
atlo
ck
Mol
alla
L
DD
L
DD
L
DR
LD
D
LD
P L
DR
L
DD
L
DP
LD
R
LD
D
LD
P L
DR
L
DD
L
DP
LD
R
N
VC
V
C
VC
V
C
NV
C
NV
C
NV
C
VC
V
C
VC
N
VC
V
C
NV
C
NV
C
NV
C
VC
V
C
VC
N
VC
V
C
8
8 8
16
4 4
4 4
4 4
12
12
4 4
4 4
4 4
12
12
Scie
ntifi
c na
me
Com
mon
nam
e G
roup
43
29
25
36
62
51
57
45
42
44
73
58
63
61
61
38
38
37
84
51
Cha
mer
ion
firew
eed
NR
25
0
0 0
4
2 0
1 3
0 2
1 1
1 4
0
2 0
ang
ustif
oliu
m (L
.)
Hol
ubC
irsi
um a
rven
se
Can
ada
this
tle
ER
0
0 0
0
0
0 0
0
0 0
(L.
) Sco
p.C
irsi
um v
ulga
re
bull
this
tle
ER
0
0
0
0
0
(Sa
vi) T
en.
Cla
yton
ia si
biri
ca
Sibe
rian
RF
0
0
1 1
1
0 0
1 0
L. v
ar. s
ibir
ica
spr
ingb
eaut
yC
linop
odiu
m
yerb
a bu
ena
RF
0
0
0
1
0
dou
glas
ii (
Ben
th.)
Kun
tze
Col
lom
ia
varia
blel
eaf
NR
0
0 0
0
0 0
0 0
0 h
eter
ophy
lla
col
lom
ia
Dou
glas
ex
Hoo
k.C
ornu
s bu
nchb
erry
R
F
0 0
0 0
can
aden
sis L
. d
ogw
ood
Cor
nus n
utta
llii
Paci
fic
RF
1
0
Aud
ubon
ex
dog
woo
d T
orr.
& A
. Gra
yC
oryl
us c
ornu
ta
Cal
iforn
ia
RF
1
0 0
0 0
0
Mar
sh. v
ar.
haz
elnu
t c
alifo
rnic
a (
A. D
C.)
Shar
pC
repi
s cap
illar
is
smoo
th
ER
3
5 12
2
2 2
7 2
1
0
3 2
1 0
2 (
L.) W
allr.
h
awks
bear
dC
ytis
us sc
opar
ius
Scot
ch b
room
ER
0 1
0 0
0 0
1 0
0
0
(
L.) L
ink
Dac
tylis
. or
char
dgra
ss
ER
1
0
0
0
glo
mer
ata
L.D
anth
onia
spic
ata
pove
rty
NR
0 0
0 0
0
0 0
(
L.) P
. Bea
uv.
oat
gras
s e
x R
oem
. &
Sch
ult.
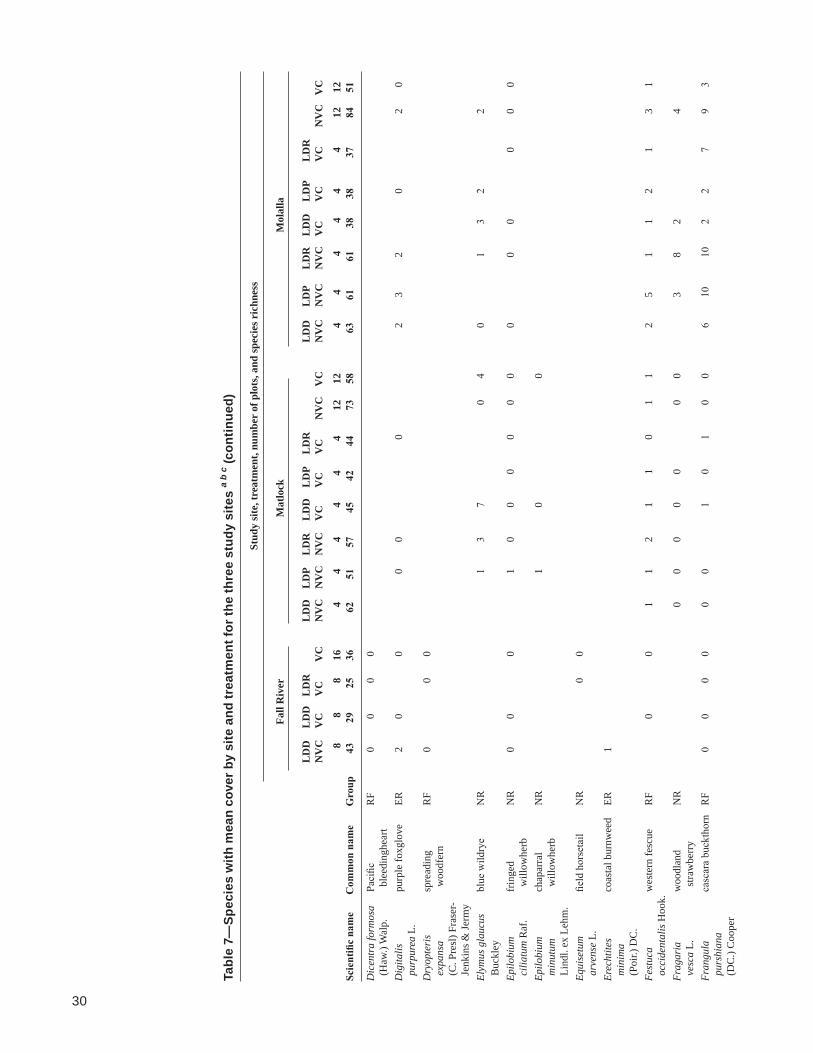
30
research paper pnw-rp-589
Tabl
e 7—
Spec
ies
with
mea
n co
ver b
y si
te a
nd tr
eatm
ent f
or th
e th
ree
stud
y si
tes
a b
c (con
tinue
d)
Stud
y si
te, t
reat
men
t, nu
mbe
r of
plo
ts, a
nd sp
ecie
s ric
hnes
s
Fa
ll R
iver
M
atlo
ck
Mol
alla
L
DD
L
DD
L
DR
LD
D
LD
P L
DR
L
DD
L
DP
LD
R
LD
D
LD
P L
DR
L
DD
L
DP
LD
R
N
VC
V
C
VC
V
C
NV
C
NV
C
NV
C
VC
V
C
VC
N
VC
V
C
NV
C
NV
C
NV
C
VC
V
C
VC
N
VC
V
C
8
8 8
16
4 4
4 4
4 4
12
12
4 4
4 4
4 4
12
12
Scie
ntifi
c na
me
Com
mon
nam
e G
roup
43
29
25
36
62
51
57
45
42
44
73
58
63
61
61
38
38
37
84
51
Dic
entr
a fo
rmos
a Pa
cific
R
F 0
0 0
0
(
Haw
.) W
alp.
b
leed
ingh
eart
Dig
italis
pu
rple
foxg
love
ER
2
0
0
0 0
0
2
3 2
0
2
0 p
urpu
rea
L.D
ryop
teri
s sp
read
ing
RF
0
0 0
exp
ansa
w
oodf
ern
(C
. Pre
sl) F
rase
r- J
enki
ns &
Jerm
yEl
ymus
gla
ucus
bl
ue w
ildry
e N
R
1
3 7
0 4
0
1 3
2
2
Buc
kley
Epilo
bium
fr
inge
d N
R
0 0
0
1
0 0
0 0
0 0
0
0 0
0
0 0
cili
atum
Raf
. w
illow
herb
Epilo
bium
ch
apar
ral
NR
1
0
0
m
inut
um
will
owhe
rb
Lin
dl. e
x Le
hm.
Equi
setu
m
field
hor
seta
il N
R
0 0
arv
ense
L.
Erec
htite
s co
asta
l bur
nwee
d ER
1
m
inim
a (
Poir.
) DC
.Fe
stuc
a w
este
rn fe
scue
R
F
0
0 1
1 2
1 1
0 1
1 2
5 1
1 2
1 3
1 o
ccid
enta
lis H
ook.
Frag
aria
w
oodl
and
NR
0
0 0
0 0
0
0
3 8
2
4
v
esca
L.
stra
wbe
rry
Fran
gula
ca
scar
a bu
ckth
orn
RF
0 0
0 0
0 0
1
0 1
0 0
6 10
10
2
2 7
9 3
pur
shia
na
(D
C.)
Coo
per
31
Relations of Native and Exotic Species 5 Years After Clearcutting With and Without Herbicide and Logging Debris Treatments
Tabl
e 7—
Spec
ies
with
mea
n co
ver b
y si
te a
nd tr
eatm
ent f
or th
e th
ree
stud
y si
tes
a b
c (con
tinue
d)
Stud
y si
te, t
reat
men
t, nu
mbe
r of
plo
ts, a
nd sp
ecie
s ric
hnes
s
Fa
ll R
iver
M
atlo
ck
Mol
alla
L
DD
L
DD
L
DR
LD
D
LD
P L
DR
L
DD
L
DP
LD
R
LD
D
LD
P L
DR
L
DD
L
DP
LD
R
N
VC
V
C
VC
V
C
NV
C
NV
C
NV
C
VC
V
C
VC
N
VC
V
C
NV
C
NV
C
NV
C
VC
V
C
VC
N
VC
V
C
8
8 8
16
4 4
4 4
4 4
12
12
4 4
4 4
4 4
12
12
Scie
ntifi
c na
me
Com
mon
nam
e G
roup
43
29
25
36
62
51
57
45
42
44
73
58
63
61
61
38
38
37
84
51
Gal
ium
st
icky
will
y N
R
0 0
0 0
0 0
0 4
1 0
0 2
apa
rine
L.
Gal
ium
triflorum
frag
rant
bed
stra
w
RF
0 0
0 0
0 0
0 0
2 2
3 0
0 0
2 0
Mic
hx.
Gau
lther
ia
sala
l R
F
7
4 2
9 6
3 4
6 12
11
12
11
4
3 11
6
sha
llon
Purs
hG
eran
ium
C
arol
ina
NR
0
0
c
arol
inia
num
L.
ger
aniu
mH
iera
cium
w
hite
haw
kwee
d N
R
2
0 0
0
0 0
0
albiflorum
Hoo
k.H
olcu
s lan
atus
L.
com
mon
ER
27
0
0 0
3 8
2 0
1 0
4 0
31
13
38
11
14
15
27
13
v
elve
tgra
ssH
olod
iscu
s oc
eans
pray
R
F
0
0 0
0
0 0
0
0 2
1
d
isco
lor (
Purs
h)
Max
im.
Hyp
eric
um
com
mon
ER
0
0 0
0
0 0
0 0
0 p
erfo
ratu
m L
. S
t. Jo
hnsw
ort
Hyp
ocha
eris
ha
iry c
at’s
ear
ER
34
1
3 2
28
26
28
4 10
12
27
9
2 1
0 1
5 1
1 2
rad
icat
a L.
Ilex
aqui
foliu
m L
. En
glis
h ho
ly
EF
0 0
0 1
0 0
Iris
tena
x D
ougl
as
toug
hlea
f iris
N
R
0
0 0
1 2
2 0
0
1 0
ex
Lind
l.Ju
ncus
tenu
is
pove
rty ru
sh
NR
0
0
Will
d.La
psan
a co
mm
on
ER
0
0
0 0
com
mun
is L
. ni
pple
wor
tLe
ucan
them
um
oxey
e da
isy
ER
25
23
35
1 4
3 28
3
17
25
17
5 3
2 20
3
vul
gare
Lam
.Li
gust
icum
ce
llery
leaf
N
R
0
0
0
api
ifoliu
m (N
utt.
lic
oric
e-ro
ot
ex
Torr.
& A
. G
ray)
A. G
ray
Liliu
m
Col
umbi
a lil
y N
R
0 0
0
0 0
0 0
c
olum
bian
um
Lei
chtli
n
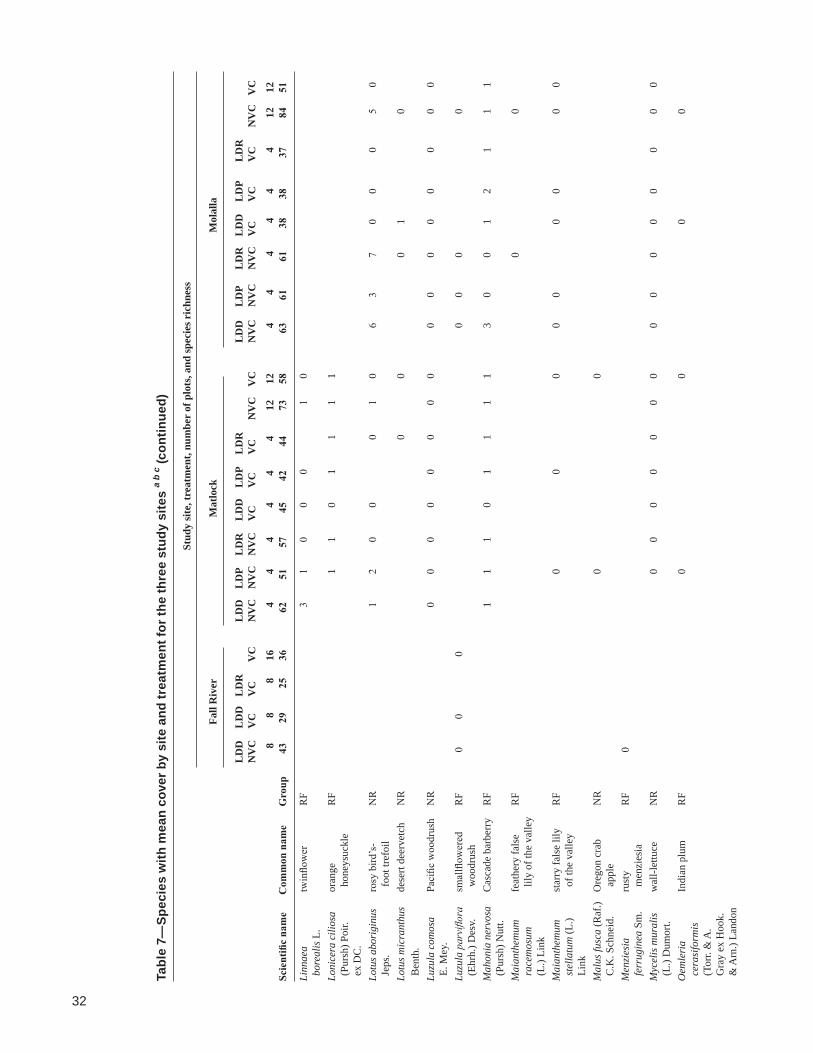
32
research paper pnw-rp-589
Tabl
e 7—
Spec
ies
with
mea
n co
ver b
y si
te a
nd tr
eatm
ent f
or th
e th
ree
stud
y si
tes
a b
c (con
tinue
d)
Stud
y si
te, t
reat
men
t, nu
mbe
r of
plo
ts, a
nd sp
ecie
s ric
hnes
s
Fa
ll R
iver
M
atlo
ck
Mol
alla
L
DD
L
DD
L
DR
LD
D
LD
P L
DR
L
DD
L
DP
LD
R
LD
D
LD
P L
DR
L
DD
L
DP
LD
R
N
VC
V
C
VC
V
C
NV
C
NV
C
NV
C
VC
V
C
VC
N
VC
V
C
NV
C
NV
C
NV
C
VC
V
C
VC
N
VC
V
C
8
8 8
16
4 4
4 4
4 4
12
12
4 4
4 4
4 4
12
12
Scie
ntifi
c na
me
Com
mon
nam
e G
roup
43
29
25
36
62
51
57
45
42
44
73
58
63
61
61
38
38
37
84
51
Linn
aea
twin
flow
er
RF
3 1
0 0
0
1 0
b
orea
lis L
.Lo
nice
ra c
ilios
a or
ange
R
F
1 1
0 1
1 1
1
(
Purs
h) P
oir.
hon
eysu
ckle
e
x D
C.
Lotu
s abo
rigi
nus
rosy
bird
’s-
NR
1
2 0
0
0 1
0 6
3 7
0 0
0 5
0 J
eps.
foo
t tre
foil
Lotu
s mic
rant
hus
dese
rt de
erve
tch
NR
0
0
0
1
0
B
enth
.Lu
zula
com
osa
Paci
fic w
oodr
ush
NR
0
0 0
0 0
0 0
0 0
0 0
0 0
0 0
0 E
. Mey
.Lu
zula
parviflora
smal
lflow
ered
R
F 0
0
0
0
0 0
0
(
Ehrh
.) D
esv.
w
oodr
ush
Mah
onia
ner
vosa
C
asca
de b
arbe
rry
RF
1 1
1 0
1 1
1 1
3 0
0 1
2 1
1 1
(Pu
rsh)
Nut
t.M
aian
them
um
feat
hery
fals
e R
F
0
0
r
acem
osum
l
ily o
f the
val
ley
(L.
) Lin
kM
aian
them
um
star
ry fa
lse
lily
RF
0
0
0
0 0
0
0
0 0
ste
llatu
m (L
.) o
f the
val
ley
Lin
kM
alus
fusc
a (R
af.)
Ore
gon
crab
N
R
0
0
C.K
. Sch
neid
. a
pple
Men
zies
ia
rust
y R
F 0
f
erru
gine
a Sm
. m
enzi
esia
Myc
elis
mur
alis
w
all-l
ettu
ce
NR
0 0
0 0
0 0
0 0
0 0
0 0
0 0
0 (
L.) D
umor
t.O
emle
ria
Indi
an p
lum
R
F
0
0
0
0
c
eras
iform
is
(To
rr. &
A.
Gra
y ex
Hoo
k.
& A
rn.)
Land
on

33
Relations of Native and Exotic Species 5 Years After Clearcutting With and Without Herbicide and Logging Debris Treatments
Tabl
e 7—
Spec
ies
with
mea
n co
ver b
y si
te a
nd tr
eatm
ent f
or th
e th
ree
stud
y si
tes
a b
c (con
tinue
d)
Stud
y si
te, t
reat
men
t, nu
mbe
r of
plo
ts, a
nd sp
ecie
s ric
hnes
s
Fa
ll R
iver
M
atlo
ck
Mol
alla
L
DD
L
DD
L
DR
LD
D
LD
P L
DR
L
DD
L
DP
LD
R
LD
D
LD
P L
DR
L
DD
L
DP
LD
R
N
VC
V
C
VC
V
C
NV
C
NV
C
NV
C
VC
V
C
VC
N
VC
V
C
NV
C
NV
C
NV
C
VC
V
C
VC
N
VC
V
C
8
8 8
16
4 4
4 4
4 4
12
12
4 4
4 4
4 4
12
12
Scie
ntifi
c na
me
Com
mon
nam
e G
roup
43
29
25
36
62
51
57
45
42
44
73
58
63
61
61
38
38
37
84
51
Opl
opan
ax
devi
lscl
ub
RF
0 0
hor
ridu
s (Sm
.) M
iq.
Osm
orhi
za
swee
t cic
ely
RF
0
0
0 0
0
0
0 0
ber
tero
i DC
.O
xalis
ore
gana
re
dwoo
d-so
rrel
R
F 14
1
0 1
0 1
0
Nut
t.Pe
tasi
tes f
rigi
dus
arct
ic sw
eet
NR
1
0
(
L.) F
r. va
r. c
olts
foot
p
alm
atus
(Aito
n)
Cro
nqui
stPh
acel
ia h
asta
ta
silv
erle
af
NR
0 0
0
D
ougl
as e
x p
hace
lia
Leh
m.
Poa
com
pres
sa L
. C
anad
a N
R
0 1
0 1
2 0
1 1
b
lueg
rass
Poa
prat
ensi
s L.
Ken
tuck
y N
R
0
0
0
0 0
b
lueg
rass
Poly
stic
hum
w
este
rn
RF
2 0
0
0 1
0 1
0 0
0 0
1 2
4 1
2 1
2 1
mun
itum
s
wor
dfer
n (
Kau
lf.)
C. P
resl
Pros
arte
s sm
ithii
larg
eflow
er
RF
0 0
0 0
0
0 0
1 0
0 0
(Hoo
k.) U
tech
, f
airy
bells
S
hinw
ari &
K
awan
oPr
unel
la.
com
mon
N
R
1
1 2
0 0
2
0
0
0
v
ulga
ris L
. s
elfh
eal
Prun
us
swee
t che
rry
EF
0
0
avi
um (L
.) L.
Prun
us
bitte
r che
rry
NR
0
0
0
1 1
0 0
0 0
1 0
1 1
4 1
0 2
0 e
mar
gina
ta
(D
ougl
as
ex
Hoo
k.)
D. D
ietr.

34
research paper pnw-rp-589
Tabl
e 7—
Spec
ies
with
mea
n co
ver b
y si
te a
nd tr
eatm
ent f
or th
e th
ree
stud
y si
tes
a b
c (con
tinue
d)
Stud
y si
te, t
reat
men
t, nu
mbe
r of
plo
ts, a
nd sp
ecie
s ric
hnes
s
Fa
ll R
iver
M
atlo
ck
Mol
alla
L
DD
L
DD
L
DR
LD
D
LD
P L
DR
L
DD
L
DP
LD
R
LD
D
LD
P L
DR
L
DD
L
DP
LD
R
N
VC
V
C
VC
V
C
NV
C
NV
C
NV
C
VC
V
C
VC
N
VC
V
C
NV
C
NV
C
NV
C
VC
V
C
VC
N
VC
V
C
8
8 8
16
4 4
4 4
4 4
12
12
4 4
4 4
4 4
12
12
Scie
ntifi
c na
me
Com
mon
nam
e G
roup
43
29
25
36
62
51
57
45
42
44
73
58
63
61
61
38
38
37
84
51
Pseu
dogn
apha
lium
Wrig
ht’s
N
R
0
0
can
esce
ns
cud
wee
d (
DC
.) W
.A.
Web
er ss
p.
the
rmal
e (
E.E.
Nel
son)
K
arte
szPs
eudo
tsug
a D
ougl
as-fi
r N
R
53
72
71
71
9 8
7 18
13
15
8
15
11
12
14
15
18
14
12
16
men
zies
ii (
Mirb
.) F
ranc
oPt
erid
ium
w
este
rn
NR
2
0
0 6
4 1
7 1
7 4
5 16
10
4
1 1
2 10
1
aqu
ilinu
m
bra
cken
fern
(L.)
Kuh
nRa
nunc
ulus
. w
este
rn
NR
0
0
1
0
o
ccid
enta
lis
but
terc
up
Nut
t.Ri
bes
redfl
ower
N
R
0
0
0
1
0
san
guin
eum
c
urra
nt
Pur
shRo
sa
dwar
f ros
e R
F
0
0 0
0
0 0
0
0
g
ymno
carp
a N
utt.
Rubu
s H
imal
ayan
ER
0 1
0
a
rmen
iacu
s b
lack
berr
y F
ocke
Rubu
s cu
tleaf
ER
1
0
0
0
0
1 0
1
0 0
0 l
acin
iatu
s b
lack
berr
y W
illd.

35
Relations of Native and Exotic Species 5 Years After Clearcutting With and Without Herbicide and Logging Debris Treatments
Tabl
e 7—
Spec
ies
with
mea
n co
ver b
y si
te a
nd tr
eatm
ent f
or th
e th
ree
stud
y si
tes
a b
c (con
tinue
d)
Stud
y si
te, t
reat
men
t, nu
mbe
r of
plo
ts, a
nd sp
ecie
s ric
hnes
s
Fa
ll R
iver
M
atlo
ck
Mol
alla
L
DD
L
DD
L
DR
LD
D
LD
P L
DR
L
DD
L
DP
LD
R
LD
D
LD
P L
DR
L
DD
L
DP
LD
R
N
VC
V
C
VC
V
C
NV
C
NV
C
NV
C
VC
V
C
VC
N
VC
V
C
NV
C
NV
C
NV
C
VC
V
C
VC
N
VC
V
C
8
8 8
16
4 4
4 4
4 4
12
12
4 4
4 4
4 4
12
12
Scie
ntifi
c na
me
Com
mon
nam
e G
roup
43
29
25
36
62
51
57
45
42
44
73
58
63
61
61
38
38
37
84
51
Rubu
s
whi
teba
rk
NR
0
1
0 1
0
0 1
0 l
euco
derm
is
ras
pber
ry
Dou
glas
e
x To
rr. &
A
. Gra
yRu
bus
thim
bleb
erry
N
R
0
0
0 0
1
1
parviflorus
Nut
t.Ru
bus
salm
onbe
rry
RF
1 0
0 0
spe
ctab
ilis
Pur
shRu
bus u
rsin
us
Cal
iforn
ia
NR
12
0
1 0
9 5
1 9
2 3
5 5
53
59
55
18
12
24
55
18
Cha
m. &
b
lack
berr
y S
chltd
l.Ru
mex
co
mm
on
ER
0 0
1
0
0 0
0
0
ace
tose
lla L
. s
heep
sorr
elSa
lix sc
oule
rian
a Sc
oule
r’s
NR
1
B
arra
tt w
illow
e
x H
ook.
Sam
bucu
s re
d el
derb
erry
R
F 4
0 0
0
1 0
0
0 0
0
0 1
1
r
acem
osa
L.Se
neci
o st
inki
ng w
illie
ER
0
0
0
0 0
0
j
acob
aea
L.Se
neci
o w
oodl
and
ER
0 0
0 0
1
4 5
0
3
0
0
0 0
syl
vatic
us L
. r
agw
ort
Stac
hys
Mex
ican
N
R
1
mex
ican
a B
enth
. h
edge
nettl
eSt
ella
ria
long
stal
k N
R
0
0
0
0
lon
gipe
s s
tarw
ort
Gol
die

36
research paper pnw-rp-589
Tabl
e 7—
Spec
ies
with
mea
n co
ver b
y si
te a
nd tr
eatm
ent f
or th
e th
ree
stud
y si
tes
a b
c (con
tinue
d)
Stud
y si
te, t
reat
men
t, nu
mbe
r of
plo
ts, a
nd sp
ecie
s ric
hnes
s
Fa
ll R
iver
M
atlo
ck
Mol
alla
L
DD
L
DD
L
DR
LD
D
LD
P L
DR
L
DD
L
DP
LD
R
LD
D
LD
P L
DR
L
DD
L
DP
LD
R
N
VC
V
C
VC
V
C
NV
C
NV
C
NV
C
VC
V
C
VC
N
VC
V
C
NV
C
NV
C
NV
C
VC
V
C
VC
N
VC
V
C
8
8 8
16
4 4
4 4
4 4
12
12
4 4
4 4
4 4
12
12
Scie
ntifi
c na
me
Com
mon
nam
e G
roup
43
29
25
36
62
51
57
45
42
44
73
58
63
61
61
38
38
37
84
51
Sym
phor
icar
pos
com
mon
R
F
5
2
a
lbus
(L.)
sno
wbe
rry
S.F
. Bla
keSy
mph
oric
arpo
s tra
iling
R
F
3 4
6 1
2 3
4 2
h
espe
rius
s
now
berr
y G
.N. J
ones
Ther
mop
sis
mou
ntai
n N
R
0
0
0 0
mon
tana
Nut
t. g
olde
nban
ner
Thuj
a pl
icat
a w
este
rn re
dced
ar
RF
0
0
Don
n ex
D. D
onTr
ient
alis
st
arflo
wer
R
F 0
0
0
0 0
0 0
0 0
0 0
0
0 0
0
b
orea
lis R
af.
Trifo
lium
repe
ns L
. w
hite
clo
ver
ER
Tr
illiu
m o
vatu
m
Paci
fic tr
illiu
m
RF
0
0
0 0
0 0
0
0
0
0
Pur
shTr
iset
um
tall
trise
tum
N
R
0
0
can
esce
ns
Buc
kley
Tsug
a w
este
rn h
emlo
ck
RF
0 0
0 0
0 0
0 0
0 0
0 0
het
erop
hylla
(
Raf
.) Sa
rg.
unkn
own
herb
un
know
n he
rb
ER
0
0
Vacc
iniu
m.
oval
-leaf
R
F
o
valif
oliu
m S
m.
blu
eber
ryVa
ccin
ium
. re
d hu
ckle
berr
y R
F 0
0 0
0 0
0 0
0 0
0 0
0 1
1 2
0 0
0 1
0 p
arvi
foliu
m S
m.
Vanc
ouve
ria
whi
te in
side
out
RF
1 0
0 0
hex
andr
a (H
ook.
) fl
ower
C
. Mor
ren
&
Dec
ne.

37
Relations of Native and Exotic Species 5 Years After Clearcutting With and Without Herbicide and Logging Debris Treatments
Tabl
e 7—
Spec
ies
with
mea
n co
ver b
y si
te a
nd tr
eatm
ent f
or th
e th
ree
stud
y si
tes
a b
c (con
tinue
d)
Stud
y si
te, t
reat
men
t, nu
mbe
r of
plo
ts, a
nd sp
ecie
s ric
hnes
s
Fa
ll R
iver
M
atlo
ck
Mol
alla
L
DD
L
DD
L
DR
LD
D
LD
P L
DR
L
DD
L
DP
LD
R
LD
D
LD
P L
DR
L
DD
L
DP
LD
R
N
VC
V
C
VC
V
C
NV
C
NV
C
NV
C
VC
V
C
VC
N
VC
V
C
NV
C
NV
C
NV
C
VC
V
C
VC
N
VC
V
C
8
8 8
16
4 4
4 4
4 4
12
12
4 4
4 4
4 4
12
12
Scie
ntifi
c na
me
Com
mon
nam
e G
roup
43
29
25
36
62
51
57
45
42
44
73
58
63
61
61
38
38
37
84
51
Vero
nica
. ge
rman
der
ER
0
1 1
1 1
1 1
1 1
cha
mae
drys
L
spe
edw
ell
Vici
a am
eric
ana
Am
eric
an v
etch
N
R
0
1 0
0
0 0
Muh
l. ex
Will
d.Vi
cia
nigr
ican
s gi
ant v
etch
N
R
1 0
0
0
Hoo
k. &
Arn
. s
sp. g
igan
tea
(H
ook.
) Las
sette
r &
C.R
. Gun
n.Vi
ola
ever
gree
n vi
olet
R
F 3
0 0
0
0 0
0
0 0
0 0
0
0 0
0
0 s
empe
rvire
ns
Gre
ene
a Val
ues s
how
n as
“0”
are
pos
itive
val
ues s
mal
ler t
han
1 pe
rcen
t.b LD
D =
logg
ing
debr
is d
ispe
rsed
, LD
R =
logg
ing
debr
is re
mov
ed, L
DP
= lo
ggin
g de
bris
pile
d, V
C =
veg
etat
ion
cont
rol,
NV
C =
no
vege
tatio
n co
ntro
l.c C
olum
ns la
belle
d si
mpl
y “V
C”
or “
NV
C”
inco
rpor
ate
all d
ebri
s tre
atm
ents
eith
er re
ceiv
ing
or n
ot re
ceiv
ing
vege
tatio
n co
ntro
l res
pect
ivel
y. F
or F
all R
iver
onl
y; L
DD
= N
VC
.

This Page Left Blank Intentionally

This Page Left Blank Intentionally

This Page Left Blank Intentionally
Pacific Northwest Research Station
Web site http://www.fs.fed.us/pnwTelephone (503) 808-2592Publication requests (503) 808-2138FAX (503) 808-2130E-mail [email protected] address Publications Distribution PacificNorthwestResearchStation P.O. Box 3890 Portland,OR97208-3890

U.S. Department of Agriculture Pacific Northwest Research Station 333 SW First Avenue P.O. Box 3890 Portland, OR 97208-3890
Official Business Penalty for Private Use, $300