UNITED STATES OF AMERICA BEFORE THE FEDERAL … Filings to FERC DL... · LIGHT-LOAD CASE STUDY OF...
37
1 UNITED STATES OF AMERICA BEFORE THE FEDERAL ENERGY REGULATORY COMMISSION North American Electric Reliability Corporation ) ) Docket No. RM13-11-000 INFORMATIONAL FILING OF THE NORTH AMERICAN ELECTRIC RELIABILITY CORPORATION REGARDING THE LIGHT-LOAD CASE STUDY OF THE EASTERN INTERCONNECTION The North American Electric Reliability Corporation (“NERC”) hereby submits this informational filing (“Informational Filing”) to the Federal Energy Regulatory Commission (“Commission”) as directed in this proceeding in Order No. 794. 1 In Order No. 794, the Commission-approved Reliability Standard BAL-003-1 (Frequency Response and Frequency Bias Setting) and directed NERC “to submit the results of the Eastern Interconnection Reliability Assessment Group’s light-load case, using actual turbine governor response data. Additionally, the Commission direct[ed] NERC to submit a recommendation on whether further actions are warranted …. Further, the report should discuss any appropriate changes to the Interconnection Frequency Response Obligation ….” 2 The 2017 Frequency Response of the Eastern Interconnection during Light Load Conditions report (“EI Report”), attached hereto as Attachment 1, addresses the Commission’s directive and demonstrates that the Interconnection Frequency Response Obligation (“IFRO”) is adequate during light load conditions. The EI Report states that, “Based on NERC’s analysis, the Interconnection Frequency Response Obligation (IFRO) under Reliability Standard BAL-003-1.1 for the Eastern Interconnection is 1 Frequency Response and Frequency Bias Setting Reliability Standard, Order No. 794, 146 FERC ¶ 61,024 (2014). 2 Id. at P 84 (Order No. 794 included additional directives regarding an informational filing due July 1, 2018. NERC continues to evaluate frequency response issues in anticipation of the 2018 filing).
Transcript of UNITED STATES OF AMERICA BEFORE THE FEDERAL … Filings to FERC DL... · LIGHT-LOAD CASE STUDY OF...
1
UNITED STATES OF AMERICA BEFORE THE
FEDERAL ENERGY REGULATORY COMMISSION
North American Electric Reliability Corporation
) )
Docket No. RM13-11-000
INFORMATIONAL FILING OF THE NORTH AMERICAN ELECTRIC RELIABILITY CORPORATION REGARDING THE
LIGHT-LOAD CASE STUDY OF THE EASTERN INTERCONNECTION
The North American Electric Reliability Corporation (“NERC”) hereby submits this
informational filing (“Informational Filing”) to the Federal Energy Regulatory Commission
(“Commission”) as directed in this proceeding in Order No. 794.1 In Order No. 794, the
Commission-approved Reliability Standard BAL-003-1 (Frequency Response and Frequency
Bias Setting) and directed NERC “to submit the results of the Eastern Interconnection Reliability
Assessment Group’s light-load case, using actual turbine governor response data. Additionally,
the Commission direct[ed] NERC to submit a recommendation on whether further actions are
warranted …. Further, the report should discuss any appropriate changes to the Interconnection
Frequency Response Obligation ….”2 The 2017 Frequency Response of the Eastern
Interconnection during Light Load Conditions report (“EI Report”), attached hereto as
Attachment 1, addresses the Commission’s directive and demonstrates that the Interconnection
Frequency Response Obligation (“IFRO”) is adequate during light load conditions. The EI
Report states that, “Based on NERC’s analysis, the Interconnection Frequency Response
Obligation (IFRO) under Reliability Standard BAL-003-1.1 for the Eastern Interconnection is
1 Frequency Response and Frequency Bias Setting Reliability Standard, Order No. 794, 146 FERC ¶ 61,024 (2014). 2 Id. at P 84 (Order No. 794 included additional directives regarding an informational filing due July 1, 2018. NERC continues to evaluate frequency response issues in anticipation of the 2018 filing).

2
adequate during light-load conditions. As a result, NERC finds no impending need for
immediate action but recommends that the ERO Enterprise continue its efforts to improve
dynamic modeling for studying frequency response, and continue its analyses of frequency
response-related matters.”3
I. NOTICES AND COMMUNICATIONS
Notices and communications regarding this filing may be addressed to the following:4
Shamai Elstein* Senior Counsel Candice Castaneda* Counsel North American Electric Reliability
Corporation 1325 G Street, N.W., Suite 600 Washington, DC 20005 (202) 400-3000 [email protected] [email protected]
John Moura* Director of Reliability Assessment and System Analysis North American Electric Reliability Corporation 3353 Peachtree Road, N.E. Suite 600, North Tower Atlanta, GA 30326 (404) 446-9731 [email protected] Howard Gugel* Director of Standards North American Electric Reliability
Corporation 3353 Peachtree Road, N.E. Suite 600, North Tower Atlanta, GA 30326 (404) 446-2560 [email protected]
3 2017 Frequency Response of the Eastern Interconnection during Light Load Conditions report. 4 Persons to be included on the Commission’s service list are identified by an asterisk. NERC respectfully requests a waiver of Rule 203 of the Commission’s regulations, 18 C.F.R. § 385.203 (2016), to allow the inclusion of more than two persons on the service list in this proceeding.
3
II. CONCLUSION
Wherefore, as demonstrated in the EI Report, the IFRO is adequate during light load
conditions and no further immediate action is recommended as a result of the study apart from
NERC’s continued analysis of frequency response related matters. NERC respectfully requests
that the Commission accept this informational filing as compliant with the Commission’s
directive in Order No. 794.
Respectfully submitted,
/s/ Candice Castaneda Shamai Elstein Senior Counsel Candice Castaneda Counsel North American Electric Reliability Corporation 1325 G Street, N.W., Suite 600 Washington, DC 20005 (202) 400-3000 [email protected] [email protected] Counsel for the North American Electric Reliability Corporation
Date: June 30, 2017
cc: Official service list in Docket No. RM13-11-000

CERTIFICATE OF SERVICE
I hereby certify that I have served a copy of the foregoing document upon all parties
listed on the official service list compiled by the Secretary in this proceeding. Dated at
Washington, D.C. this 30th day of June 2017.
/s/ Candice Castaneda
Candice Castaneda Counsel North American Electric Reliability Corporation 1325 G Street, N.W., Suite 600 Washington, DC 20005 (202) 400-3000 [email protected] Counsel for the North American Electric Reliability Corporation

Attachment 1

NERC | Report Title | Report Date I
2017 Frequency Response of the Eastern Interconnection during Light Load Conditions
June 30, 2017

NERC | 2017 Frequency Response of the Eastern Interconnection during Light Load Conditions | June 30, 2017 ii
Table of Contents
Table of Contents ....................................................................................................................................................... ii
Preface ....................................................................................................................................................................... iii
Introduction ............................................................................................................................................................... iv
Executive Summary ................................................................................................................................................... vi
Key Findings and Recommendations ..................................................................................................................... vi
Chapter 1: Study Approach and Methods ..................................................................................................................1
Study Steps .............................................................................................................................................................2
Data Preparation .....................................................................................................................................................2
Unit Classification ...................................................................................................................................................3
Chapter 2: Frequency Response Modeling ................................................................................................................4
Governor Models ....................................................................................................................................................4
Governor Modeling Summary ................................................................................................................................6
Chapter 3: Model Validation and Base Case Benchmarking ......................................................................................8
Rockport August 4, 2007, Event and 2017-LL Case Benchmarking. ....................................................................9
Calvert Cliffs April 7, 2015 DC Event and 2017-LL Case Benchmarking ........................................................... 10
Millstone May 25, 2014, Event and 2017-LL Case Benchmarking ................................................................... 11
Benchmarking Findings and Recommendations .............................................................................................. 13
Chapter 4: Evaluation of 2017 Operating Year IFRO ............................................................................................... 14
IFRO Evaluation Method ...................................................................................................................................... 14
IFRO Evaluation Findings and Recommendations ............................................................................................... 18
Chapter 5: Frequency Response Resiliency Analysis ............................................................................................... 19
IFRO Resiliency Analysis Findings and Recommendations ............................................................................... 20
Appendix A: Base Case Headroom Analysis ............................................................................................................ 21
Frequency Response Headroom Analysis ............................................................................................................ 21
Key Definitions ..................................................................................................................................................... 21
Appendix B: Governor Deadband Modeling ........................................................................................................... 24
Deadband Modeling ............................................................................................................................................ 24
NERC | 2017 Frequency Response of the Eastern Interconnection during Light Load Conditions | June 30, 2017 iii
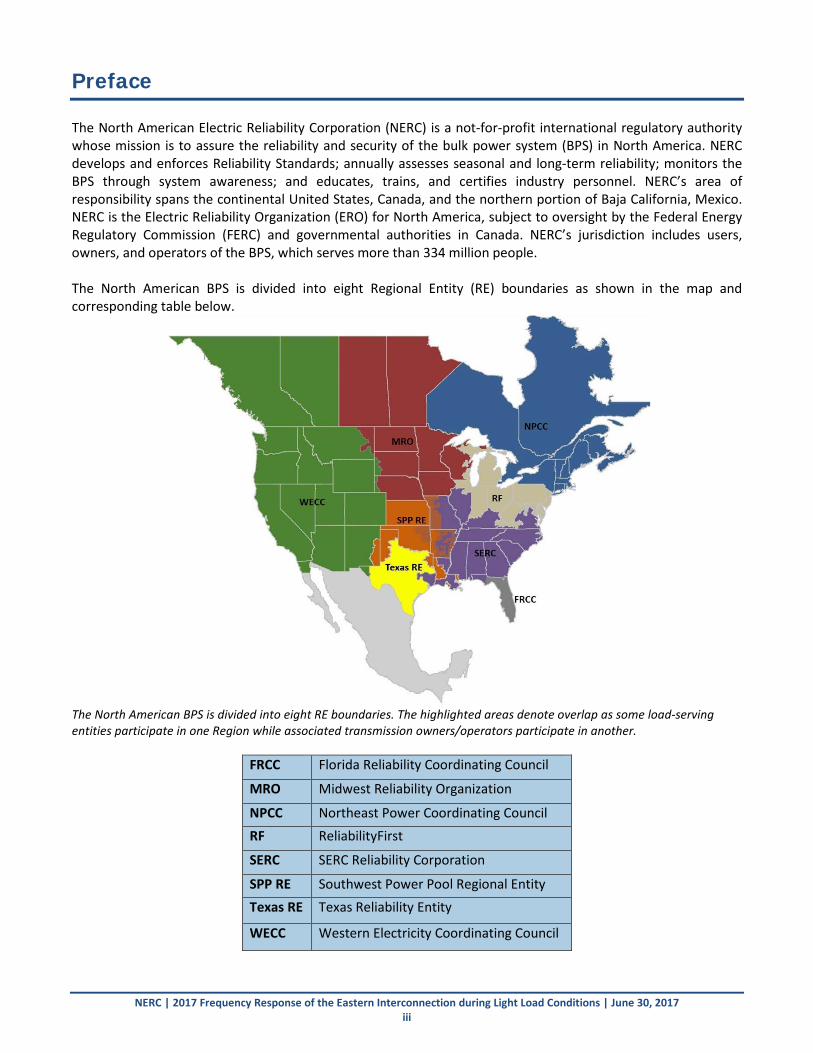
Preface The North American Electric Reliability Corporation (NERC) is a not-for-profit international regulatory authority whose mission is to assure the reliability and security of the bulk power system (BPS) in North America. NERC develops and enforces Reliability Standards; annually assesses seasonal and long-term reliability; monitors the BPS through system awareness; and educates, trains, and certifies industry personnel. NERC’s area of responsibility spans the continental United States, Canada, and the northern portion of Baja California, Mexico. NERC is the Electric Reliability Organization (ERO) for North America, subject to oversight by the Federal Energy Regulatory Commission (FERC) and governmental authorities in Canada. NERC’s jurisdiction includes users, owners, and operators of the BPS, which serves more than 334 million people. The North American BPS is divided into eight Regional Entity (RE) boundaries as shown in the map and corresponding table below.
The North American BPS is divided into eight RE boundaries. The highlighted areas denote overlap as some load-serving entities participate in one Region while associated transmission owners/operators participate in another.
FRCC Florida Reliability Coordinating Council
MRO Midwest Reliability Organization
NPCC Northeast Power Coordinating Council RF ReliabilityFirst
SERC SERC Reliability Corporation
SPP RE Southwest Power Pool Regional Entity Texas RE Texas Reliability Entity
WECC Western Electricity Coordinating Council

NERC | 2017 Frequency Response of the Eastern Interconnection during Light Load Conditions | June 30, 2017 iv
Introduction The North American bulk power system (BPS) is a complex system with thousands of interconnected elements that must be operated within a specific frequency range to continuously maintain the balance between generation and load. This is accomplished by ensuring that adequate resources are available to respond to expected (e.g., load changes) and unexpected (e.g., generation trip) imbalances that cause system frequency to deviate from the target (or scheduled) frequency of 60 Hz. Restoring frequency to its scheduled value in a timely manner during the unexpected imbalances is a critical requirement to maintain reliability. The BPS must be flexible enough to reliably operate under a variety of scenarios that require a resource mix with certain capabilities to provide ancillary services. While the decline in Frequency Response has lessened in recent years and improvement has been observed in the Eastern Interconnection, it is important that industry and regulators understand the growing complexities of frequency control and are ready with comprehensive strategies to stay ahead of any potential problems. System planning and operations experts are anticipating higher penetrations of inverter-based resources (e.g., wind and solar) that are electronically coupled to the grid. This presents new technical challenges, including a potential reduction of frequency-responsive resources, lower system inertia levels, and greater frequency variability. These challenges are driven by several factors, including 1) the economic dispatch of least cost renewable resources, 2) an evolution of inverter technology and capabilities to provide essential reliability services, and 3) these resources are asynchronously connected to the BPS. Renewable resources are generally dispatched at maximum available power output (i.e., based on wind speed or solar irradiance) due to low variable costs. Operating at maximum power output with no headroom (Pmax ≈ Pgen) eliminates the ability of these resources to support grid frequency when an imbalance of generation and load occurs (known as an under-frequency event). New technologies (e.g., storage, inverter based power electronics, and demand response) can all contribute to Frequency Response; however, a combination of policies, incentives, and interconnection requirements in the future need further refinement to ensure the appropriate mechanisms are in place to ensure reliability. This document provides an update on NERC’s assessment of primary frequency response (PFR) for the Eastern Interconnection and responds to FERC Order No. 794 as described in the executive summary. The fundamentals of PFR are fully described in NERC’s 2012 Frequency Response Initiative Report: The Reliability Role of Frequency Response.1 PFR has been identified by NERC’s Operating Committee (OC) and Planning Committee (PC) as an essential reliability service (ERS) that will be affected by the changing grid characteristics of the BPS. PFR is defined as:2
• Actions from uncontrolled (natural) sources in response to changes in frequency: rotational inertia (H) response from resources and load response from frequency dependent loads (e.g., motors). In addition, it can come from Primary Frequency Control.
• Primary frequency control: A subset of PFR actions provided by prime mover governors in an interconnection to arrest and stabilize frequency in response to frequency deviations. Primary frequency control comes from local control systems.
1 NERC. (2012). Frequency Response Initiative Report. Retrieved from http://www.nerc.com/docs/pc/FRI_Report_10-30-12_Master_w-appendices.pdf. 2 Reliability Guideline Primary Frequency Control. (2015, December 15). Retrieved June 29, 2017, from http://www.nerc.com/comm/OC/Reliability%20Guideline%20DL/Primary_Frequency_Control_final.pdf.
Introduction
NERC | 2017 Frequency Response of the Eastern Interconnection during Light Load Conditions | June 30, 2017 v
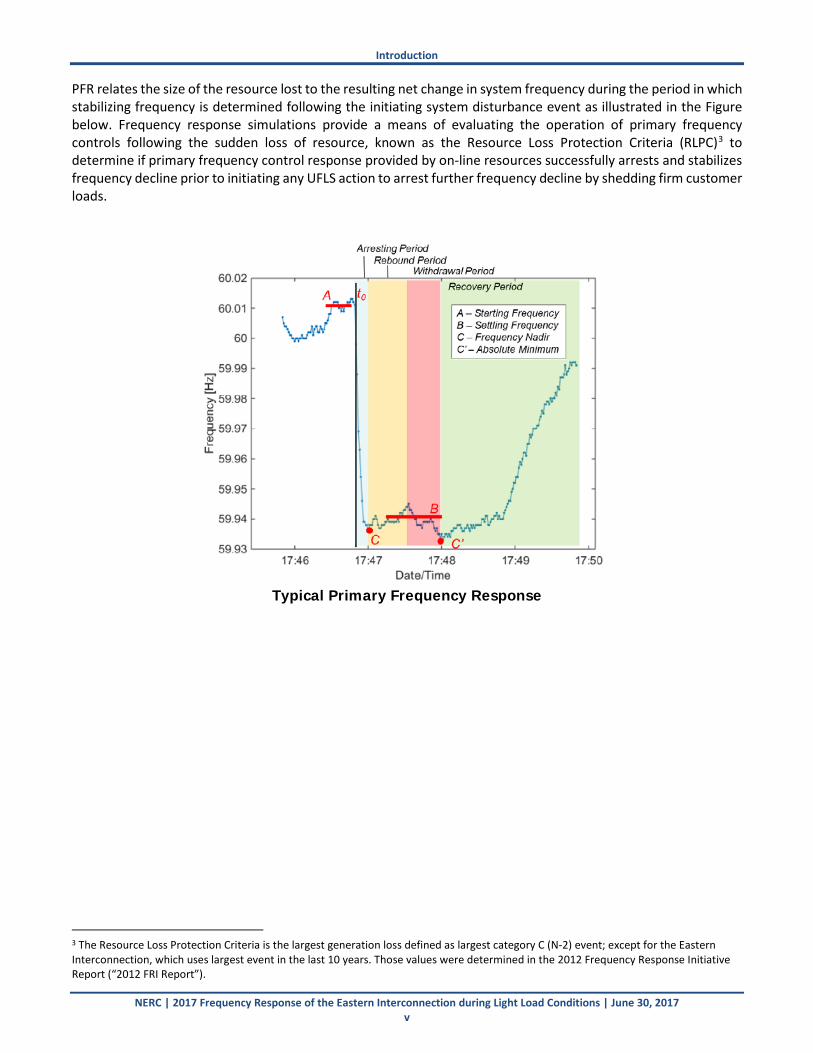
PFR relates the size of the resource lost to the resulting net change in system frequency during the period in which stabilizing frequency is determined following the initiating system disturbance event as illustrated in the Figure below. Frequency response simulations provide a means of evaluating the operation of primary frequency controls following the sudden loss of resource, known as the Resource Loss Protection Criteria (RLPC)3 to determine if primary frequency control response provided by on-line resources successfully arrests and stabilizes frequency decline prior to initiating any UFLS action to arrest further frequency decline by shedding firm customer loads.
Typical Primary Frequency Response
3 The Resource Loss Protection Criteria is the largest generation loss defined as largest category C (N-2) event; except for the Eastern Interconnection, which uses largest event in the last 10 years. Those values were determined in the 2012 Frequency Response Initiative Report (“2012 FRI Report”).

NERC | 2017 Frequency Response of the Eastern Interconnection during Light Load Conditions | June 30, 2017 vi
Executive Summary This report documents NERC’s evaluation of the frequency response modeling of the Eastern Interconnection (EI) to satisfy the directive set forth in Federal Energy Regulatory Commission (FERC or Commission) Order No. 794. That order directed that, no later than 15 months after implementation of Reliability Standard BAL-003-1, NERC submit an informational filing that “addresses the results and recommendations of a light load case study of the Eastern Interconnection using actual turbine governor response data.”4 As stated in the Order:
“…the Commission directs NERC to submit the results of the ERAG’s light-load case, using actual turbine governor response data. Additionally, the Commission directs NERC to submit a recommendation on whether further actions are warranted no later than 15 months after implementation of the Final Rule. Further, the report should discuss any appropriate changes to the Interconnection Frequency Response Obligation warranted by this study.”5
The analysis used a 2017 light load dynamics base case prepared specifically for this frequency response study by using the 2016 data provided by the Eastern Interconnection Reliability Assessment Group (ERAG)/Multiregional Modeling Working Group (MMWG). This report addresses the Commission’s directive in Order No. 794 and was prepared using actual turbine governor response data, discussed in more depth below. Based on NERC’s analysis, the Interconnection Frequency Response Obligation (IFRO) under Reliability Standard BAL-003-1.1 for the Eastern Interconnection is adequate during light-load conditions. As a result, NERC finds no impending need for immediate action but recommends that the ERO Enterprise continue its efforts to improve dynamic modeling for studying frequency response, and continue its analyses of frequency response-related matters. Key findings and recommendations from the study are examined in this report and summarized in this executive summary. Key Findings and Recommendations The following are the key findings of this study.
• Finding 1: Benchmarking of the 2017-LL dynamics case shows significant improvement in the data quality and fidelity of the case from those present in dynamics cases at the start of the Frequency Response Initiative in 2010. However, the case still exhibits more frequency response than actually exists during the rebound period of the response and does not yet accurately reflect response withdrawal, which is still exhibited in the Eastern Interconnection. NERC believes that the model validation and tuning of the dynamics models associated with Standard MOD-033 will further improve the light load dynamics case fidelity. Automatic generation control (AGC), remedial action schemes, generator protection and controls, and outer-loop plant controls should be considered to capture mid-term dynamics behavior. Mid-term dynamics analysis encompasses time periods beyond those normally used for transient stability analyses.
Recommendation 1: NERC should continue to:
o Improve the data quality of models for conventional generation
o Improve models of wind and inverter-based resources
o Advance dynamics model validation methods and tuning models to actual system response
o Refine the process to identify larger frequency response events and capture high-speed system performance data for use in model validation
4 Frequency Response and Frequency Bias Setting Reliability Standard, Order No. 794, 146 FERC ¶ 61,024, at P 3 (2014). 5 Ibid., 84.

Executive Summary
NERC | 2017 Frequency Response of the Eastern Interconnection during Light Load Conditions | June 30, 2017 vii
o Work directly with software vendors to improve dynamics models of new technologies such as inverter-based resources and wind generation
o Work directly with software vendors to model plant outer-loop controls that can cause frequency response withdrawal and the capability to mimic the early stages of automatic generator control (AGC)
o Evaluate frequency response performance of the Eastern Interconnection from a forward-looking perspective for the study year 2021 Light Load Case due to the changing resource mix and the implementation of environmental regulation. This forward-looking study for the Eastern Interconnection is scheduled to be released at the end of the third quarter 2017
o Advance understanding and modeling of mid-term dynamic system behaviors that can have significant effects on overall frequency response performance.
• Finding 2: This analysis is the first validation of the light load base case for the recommended IFRO of the Eastern Interconnection that uses actual governor data obtained from the Generator Owners and operators through a number of surveys. NERC further completed a detailed review of governor models being used in the dynamics cases. Recommendations on changes to governor models and detailed setting data were provided to the ERAG/MMWG for incorporation in the 2016 Series of the 2017-LL dynamics base case.
Previous IFRO validations in the 2012 Frequency Response Initiative (FRI) Report and subsequent Frequency Response Annual Analyses had to be performed with a dynamics case modified to contain only generic governor models.
Two conclusions can be drawn from this analysis:
o The 1,015 MW/0.1 HZ IFRO prescribed for the 2017 Operating Year is validated to be adequate to maintain reliability of the Eastern Interconnection for the current Resource Loss Protection Criteria (RLPC) of 4,500 MW under the modeled light load conditions. The resultant nadir for that case is 59.564 Hz, about 64 mHz above the 59.5 Hz Under-Frequency Load shedding (UFLS) set point.
o The frequency responsiveness modeled in the 2017-LL case would have to be reduced by over 85 percent to reduce the response to the level of performance prescribed by the IFRO. This reflects the existence of sufficient margin in projected system performance versus the IFRO.
Recommendation 2a: NERC should continue working with ERAG/MMWG to annually create light load dynamics cases with actual governor data, validated against governor performance during system frequency events.
Recommendation 2b: NERC should annually validate the recommended Eastern Interconnection IFRO in the Frequency Response Annual Analysis using those dynamic light load cases.
• Finding 3: The Eastern Interconnection is resilient to large losses of generation resources. That is due to its size, its considerable load response, and the frequency responsiveness of the current generation fleet. The resiliency test verifies the order of magnitude of resource loss that would be required to drop interconnection frequency close to the 59.5 Hz UFLS setting. The resiliency analysis found the nadir to be at 59.6 Hz6 for a modeled near-simultaneous resource loss of 12,200 MW.
Recommendation 3: The resiliency test should be used as a benchmark of the current generation
resource fleet in the NERC’s current forward-looking study of future Eastern Interconnection Frequency Response performance due to the projected changes in resource mix. That analysis focuses on projected resources using a 2021 Frequency Responsive Light Load Case.
6 100 mHz above the 59.5 Hz UFLS set point.

NERC | 2017 Frequency Response of the Eastern Interconnection during Light Load Conditions | June 30, 2017 1
Chapter 1: Study Approach and Methods The frequency response study performed an analysis of the Eastern Interconnection using the ERAG/MMWG 2016 series 2017-LL Base Case containing actual turbine governor response setting data collected from GOs and GOPs. This data was organized according to governor type and provided in a format compatible with the dynamic analysis software presently used by most Eastern Interconnection Planning Coordinators. Each turbine governor was classified according to its frequency response as having: 1) squelched frequency response (withdrawal) 2) frequency responsive or 3) nonresponsive. This data was then used to create a 2017-LL frequency responsive base case for the Eastern Interconnection. Each study step is defined in more detail in Figure 1.1. A key aspect of this study was the benchmarking of the base case using model validation techniques. A significant amount of modeling improvements were made over several years before the beginning of this study. Base case model validation and detailed scrutiny of dynamics models of generation (e.g., governor models) played a major role in the improvements to the 2017-LL base case. The purpose of model validation is evaluate the data quality and fidelity (ability to closely mimic actual system performance) to determine how closely the model measures to actual system performance. The primary means of validating a particular base case is to modify key parameters to recreate system conditions for a specific system disturbance. The practical power system conditions for the selected event should be similar to the conditions that the case is intended to represent. Generation dispatch, loads, network configuration, and operational characteristics of the case are adjusted to match the conditions that actually existed at that time. The simulation results are compared to the actual measurements of the power system that were taken during the event. Beyond the need for validation of the steady-state behavior of the base case, it is crucial that the dynamics behavior of the system be validated as well. In that process, the behavior and parameters of the models of individual system components in the case are compared to measured behavior during an actual system event. Models to be validated and tuned include generation (including exciters, governors, power system stabilizers, current compensators, etc.), dynamic system control devices (e.g., static VAR compensators (SVCs)), flexible ac transmission system (FACTS) devices, dc terminal equipment and their controls, and dynamic loads (e.g., motors and discharge lighting). In the benchmarking done for this study, the dynamic performance of the 2017-LL Frequency Response Base Case was compared against three significant Eastern Interconnection frequency events. In this study, the analysis concentrated on comparing system frequency response behavior of the case to the actual behavior of the interconnection during those events.
Chapter 1: Study Approach and Methods
NERC | 2017 Frequency Response of the Eastern Interconnection during Light Load Conditions | June 30, 2017 2
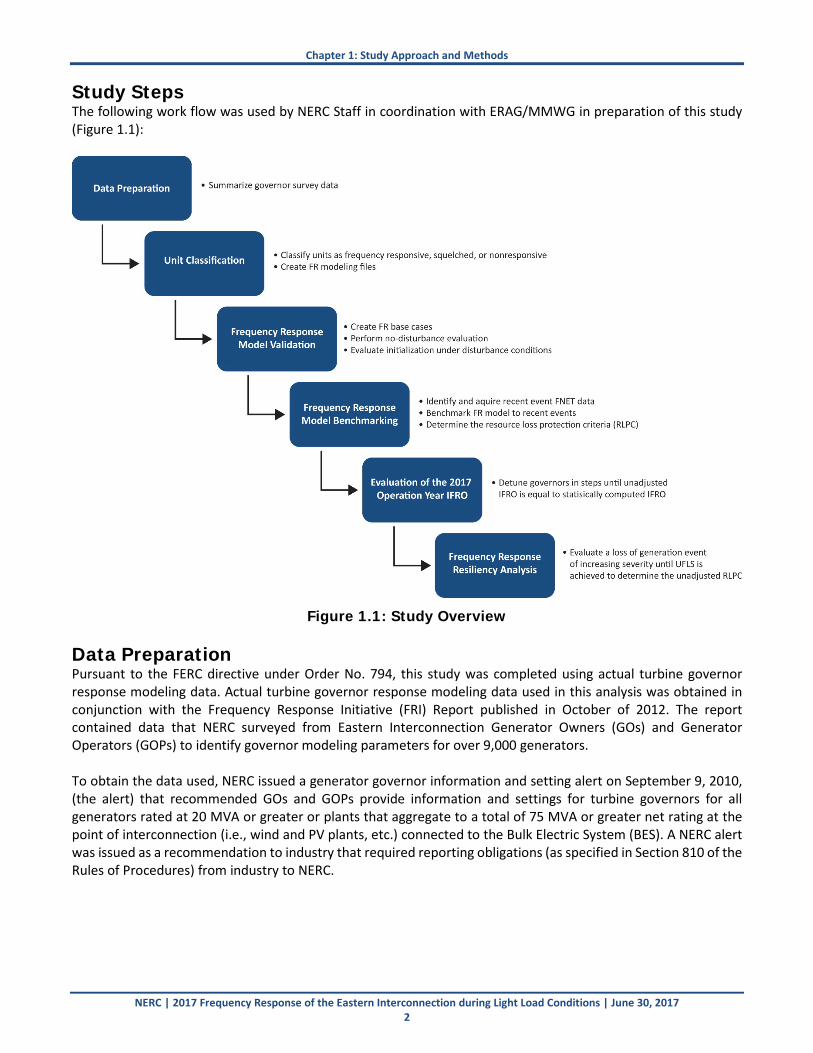
Study Steps The following work flow was used by NERC Staff in coordination with ERAG/MMWG in preparation of this study (Figure 1.1):
Figure 1.1: Study Overview
Data Preparation Pursuant to the FERC directive under Order No. 794, this study was completed using actual turbine governor response modeling data. Actual turbine governor response modeling data used in this analysis was obtained in conjunction with the Frequency Response Initiative (FRI) Report published in October of 2012. The report contained data that NERC surveyed from Eastern Interconnection Generator Owners (GOs) and Generator Operators (GOPs) to identify governor modeling parameters for over 9,000 generators. To obtain the data used, NERC issued a generator governor information and setting alert on September 9, 2010, (the alert) that recommended GOs and GOPs provide information and settings for turbine governors for all generators rated at 20 MVA or greater or plants that aggregate to a total of 75 MVA or greater net rating at the point of interconnection (i.e., wind and PV plants, etc.) connected to the Bulk Electric System (BES). A NERC alert was issued as a recommendation to industry that required reporting obligations (as specified in Section 810 of the Rules of Procedures) from industry to NERC.

Chapter 1: Study Approach and Methods
NERC | 2017 Frequency Response of the Eastern Interconnection during Light Load Conditions | June 30, 2017 3
The 2010 generator survey requested three types of information to capture the following unit-specific frequency responsive information:7
• Policies on installation and maintenance, testing procedures, and testing regularity for governors
• Unit-specific characteristics and governor settings
• Unit-specific performance information for a recent, single event. NERC sent the survey and instructions to 799 GOs and 748 GOPs in North America
A similar but conventional survey (not through the Alert Process) was conducted in 2013. From the survey results, and several years of detailed review of governor models being used in the dynamics cases, recommendations on changes to governor models and detailed setting data were provided to the ERAG/MMWG to be incorporated in the case building process. This data was further summarized and complied into dynamic data files to create the 2016 Series ERAG/MMWG 2017-LL Frequency Responsive Case. The governor survey has been updated annually by the ERAG/MMWG by contacting entities that did not respond to the original surveys. With those annual updates, the ERAG/MMWG was able to further improve the quality of the frequency responsive cases in each successive series of cases. Unit Classification Each individual generating unit was assigned one of the following three possible classifications of governor response:
• Fully Responsive: The plant power output is fully sensitive to grid frequency in accordance with the primary control action of the governor with other plant control elements supporting the action of the governor.
• Frequency Response Withdrawal (also referred to as squelched): The power output is adjusted by the governor but the adjustment is overridden by the supervising action of a plant load controller that returns plant output to a scheduled value within 10–20 seconds. For several models, squelching was modeled using a proportional–integral–derivative controller (PID controller), which has a control loop feedback mechanism (controller) that continuously calculates an error as the difference between a desired set point and a measured process variable. The error is used to provide a correction based on proportional, integral, and derivative terms, respectively (sometimes denoted P, I, and D).
• Nonresponsive: The power output changes minimally in the first few seconds after the disturbance. DYNAMICS BASE CASE DISCLAIMER: The 2017-LL dynamics Frequency Response Base Case is not a planning case. This assessment is based on an evaluation of frequency response using computer simulations to represent real conditions. Dispatch assumptions are made around units that would be on-line at the time of a low-load situation, and that dispatch may impact the ability of the system to provide FR.
7 Ibid.
NERC | 2017 Frequency Response of the Eastern Interconnection during Light Load Conditions | June 30, 2017 4
Chapter 2: Frequency Response Modeling The governor modeling in the 2017-LL Base Case includes the latest available frequency responsive models, settings, and governor data. The development of a Frequency Responsive Base Case is also a coordinated effort with the Plant-level Control and Protection Modeling Task Force (PCPMTF) and NERC efforts to improve the quality of MMWG Base Case plant modeling.8 NERC performed a detailed examination of all of the governor models in the case, and NERC suggested replacing outdated governor models where appropriate with up-to-date versions. NERC also suggested changes to model parameters that were suspect.
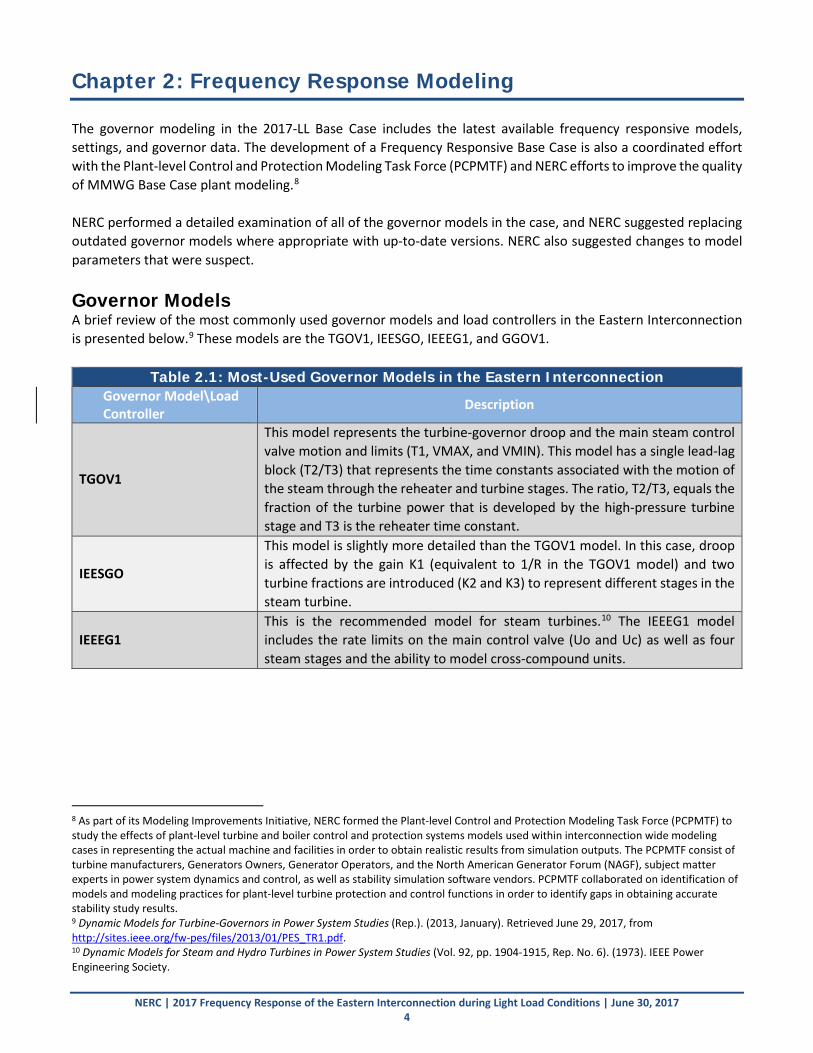
Governor Models A brief review of the most commonly used governor models and load controllers in the Eastern Interconnection is presented below.9 These models are the TGOV1, IEESGO, IEEEG1, and GGOV1.
Table 2.1: Most-Used Governor Models in the Eastern Interconnection Governor Model\Load Controller
Description
TGOV1
This model represents the turbine-governor droop and the main steam control valve motion and limits (T1, VMAX, and VMIN). This model has a single lead-lag block (T2/T3) that represents the time constants associated with the motion of the steam through the reheater and turbine stages. The ratio, T2/T3, equals the fraction of the turbine power that is developed by the high-pressure turbine stage and T3 is the reheater time constant.
IEESGO
This model is slightly more detailed than the TGOV1 model. In this case, droop is affected by the gain K1 (equivalent to 1/R in the TGOV1 model) and two turbine fractions are introduced (K2 and K3) to represent different stages in the steam turbine.
IEEEG1 This is the recommended model for steam turbines.10 The IEEEG1 model includes the rate limits on the main control valve (Uo and Uc) as well as four steam stages and the ability to model cross-compound units.
8 As part of its Modeling Improvements Initiative, NERC formed the Plant-level Control and Protection Modeling Task Force (PCPMTF) to study the effects of plant-level turbine and boiler control and protection systems models used within interconnection wide modeling cases in representing the actual machine and facilities in order to obtain realistic results from simulation outputs. The PCPMTF consist of turbine manufacturers, Generators Owners, Generator Operators, and the North American Generator Forum (NAGF), subject matter experts in power system dynamics and control, as well as stability simulation software vendors. PCPMTF collaborated on identification of models and modeling practices for plant-level turbine protection and control functions in order to identify gaps in obtaining accurate stability study results. 9 Dynamic Models for Turbine-Governors in Power System Studies (Rep.). (2013, January). Retrieved June 29, 2017, from http://sites.ieee.org/fw-pes/files/2013/01/PES_TR1.pdf. 10 Dynamic Models for Steam and Hydro Turbines in Power System Studies (Vol. 92, pp. 1904-1915, Rep. No. 6). (1973). IEEE Power Engineering Society.

Chapter 2: Frequency Response Modeling
NERC | 2017 Frequency Response of the Eastern Interconnection during Light Load Conditions | June 30, 2017 5
Table 2.1: Most-Used Governor Models in the Eastern Interconnection Governor Model\Load Controller Description
LCBF1
This model was developed in the WECC for use with this and other turbine models. The LCFB1 model is a simple representation of an outer-loop MW controller. This model has been shown to be effective in capturing the behavior of large steam turbine generators that are operated on outer-loop MW control. LCFB1 model can be used with any turbine-governor model, including the IEEEG1 and the TGOV5 models. The IEEEG1 model, in combination with the LCFB1 model can be used for large interconnected grid simulations when looking at relatively small frequency deviations (i.e., in the range of +/- 0.5 percent change in frequency).11 The LCBF1 model is needed to represent outer-loop, plant-level controls that return the plant output to a load reference value for the time frame being studied.
GGOV1
This model was developed as a general purpose turbine-governor model to be used for dynamic simulation studies.12 The model enforces the maximum output limit by controlling load levels between 70 and 100 percent through acceleration and temperature limit controllers. The temperature limit controller is one of several that can override the simple speed/power governor function; it is singled out for consideration because it is important in grid studies.
TGOV3 The TGOV3 model is the IEEEG1 model augmented with the addition of a simple representation of the intercept valve actuator (T5) and the intercept valve fast-closing characteristics (TI, TA, TB, and TC). The nonlinear valve position versus steam flow characteristics is also represented in this model.
In this study, most of the governors are set to a common droop setting of five percent while a few are set at other values. This is a relatively standard speed regulation setting for turbine governors for synchronous generating resources.13 A five percent change in speed (0.05*3,600 = 180 RPM) will result in the turbine governor moving valve positions across its full capability range (e.g., 100 percent).
11 Power System Dynamic Performance Committee, Power System Stability Subcommittee and Task force on Turbine-Governor Modelling, "Dynamic Models for Turbine-Governors in Power System Studies," PESTRI , Jan 2013. 12 Ibid. 13 2012 FRI Report.

Chapter 2: Frequency Response Modeling
NERC | 2017 Frequency Response of the Eastern Interconnection during Light Load Conditions | June 30, 2017 6
Governor Modeling Summary A total of 9,007 generation units are modeled explicitly in the 2017-LL Base Case. There are 3,619 units dispatched on-line and the remaining 5,488 units are off-line in the case. For the on-line generation, 62 percent of the dispatched generators (2,640) are modeled without governors and are therefore non-frequency responsive. The remaining 38 percent of the on-line dispatched generators (979) are frequency responsive as shown in Figure 2.1.
Figure 2.1: Frequency Responsive Modeling Summary
Figure 2.2 summarizes the governor modeling for the on-line dispatched generation capacity by governor type and groupings for similar types of governors in each category. These groupings are: IEEEG1 includes 143 IEEEG1s, 29 IEEEG2s, and 19 IEEEG3s; TGOV1 includes 137 TGOV1s, 3 TGOV2s, and 1 TGOV3. Governors with very small percentages not explicitly shown are grouped with one of the other categories below.
Figure 2.2: 2017-LL Dispatched Generation by Governor Type
Table 2.1 further summarize the governor modeling for the on-line dispatched generation and the corresponding available capacity in MW.

Chapter 2: Frequency Response Modeling
NERC | 2017 Frequency Response of the Eastern Interconnection during Light Load Conditions | June 30, 2017 7
Table 2.1: Frequency Response On-line Governor Modeling (MW) by Type
Governors Total Dispatched PGen (MW)
Total Headroom PGen (MW) Squelched MW
CRCMGV 5,177 3,753 0
GAST2A 8,229 887 0
GEWTT1 223 829 0
GGOV1 6,698 3,002 0
HYGOV 11,270 2,362 0
IEEEG1 30,903 14,834 14,694
IEESGO 21,564 6,921 9,590
PIDGOV 816 188 0
TGOV1 30,611 14,143 11,164
WSIEG1 8,872 3,155 1,074 Total Frequency Response
Gen. (MW) 124,362 50,074 36,522
Total Gen. w/No GOV 205,428
Total Gen. (MW) 329,790 Only about 38 percent of the total generation modeled in the case is modeled as being frequency responsive. At the light-load level modeling in the 2017-LL case, about 35 percent of the frequency responsive capacity that is on-line is not fully loaded, providing about 50,000 MW of “headroom” to allow response to frequency events. Additional detail on the generation composition and its modeling are available in Appendices A and B.
NERC | 2017 Frequency Response of the Eastern Interconnection during Light Load Conditions | June 30, 2017 8
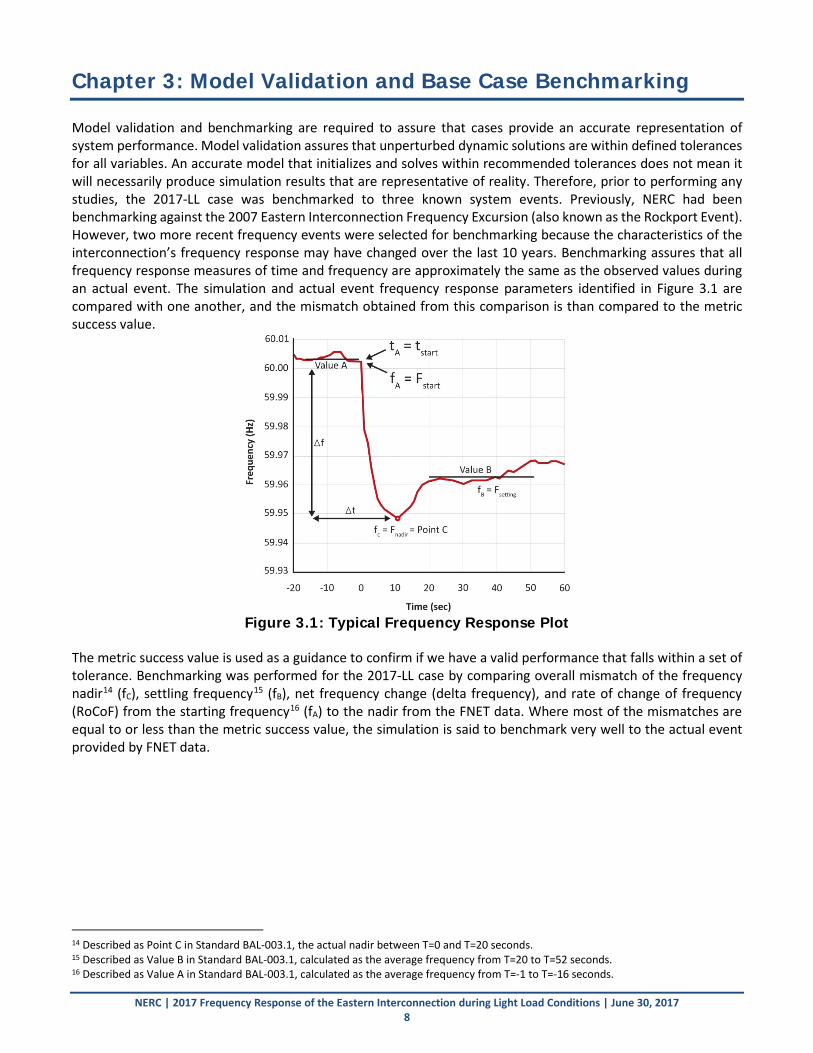
Chapter 3: Model Validation and Base Case Benchmarking Model validation and benchmarking are required to assure that cases provide an accurate representation of system performance. Model validation assures that unperturbed dynamic solutions are within defined tolerances for all variables. An accurate model that initializes and solves within recommended tolerances does not mean it will necessarily produce simulation results that are representative of reality. Therefore, prior to performing any studies, the 2017-LL case was benchmarked to three known system events. Previously, NERC had been benchmarking against the 2007 Eastern Interconnection Frequency Excursion (also known as the Rockport Event). However, two more recent frequency events were selected for benchmarking because the characteristics of the interconnection’s frequency response may have changed over the last 10 years. Benchmarking assures that all frequency response measures of time and frequency are approximately the same as the observed values during an actual event. The simulation and actual event frequency response parameters identified in Figure 3.1 are compared with one another, and the mismatch obtained from this comparison is than compared to the metric success value.
Figure 3.1: Typical Frequency Response Plot
The metric success value is used as a guidance to confirm if we have a valid performance that falls within a set of tolerance. Benchmarking was performed for the 2017-LL case by comparing overall mismatch of the frequency nadir14 (fC), settling frequency15 (fB), net frequency change (delta frequency), and rate of change of frequency (RoCoF) from the starting frequency16 (fA) to the nadir from the FNET data. Where most of the mismatches are equal to or less than the metric success value, the simulation is said to benchmark very well to the actual event provided by FNET data.
14 Described as Point C in Standard BAL-003.1, the actual nadir between T=0 and T=20 seconds. 15 Described as Value B in Standard BAL-003.1, calculated as the average frequency from T=20 to T=52 seconds. 16 Described as Value A in Standard BAL-003.1, calculated as the average frequency from T=-1 to T=-16 seconds.

Chapter 3: Model Validation and Base Case Benchmarking
NERC | 2017 Frequency Response of the Eastern Interconnection during Light Load Conditions | June 30, 2017 9
For purposes of this analysis, RoCoF is defined as:
𝑅𝑅𝑅𝑅𝑅𝑅𝑅𝑅𝑅𝑅 =∆𝑓𝑓∆𝑡𝑡
Where: • RoCoF is the Rate of Change of Frequency • Δf is the Change in frequency from the starting frequency (fA or Value A) to the nadir (fC or Point C) • Δt is the Time in seconds from tstart (tA or T=0) to the time of the nadir (tC)
The three frequency events used for benchmarking are listed below. Tables have been constructed to summarize the benchmarking results for each of the following frequency events for the 2017-LL Case.
• May 25, 2014: Millstone 2 (870 MW) and Millstone 3 (1,233 MW loss)
• April 7, 2015: Calvert Cliffs 1 & 2 tripped at 1,779 MW loss)
• August 4, 2007: Eastern Interconnection Frequency Excursion(also known as the Rockport event) (4,457 MW loss )
Rockport August 4, 2007, Event and 2017-LL Case Benchmarking. Figure 3.2 and Table 3.1 document the benchmarking for the 2017-LL case and shows that it meets most of the success metric values. The settling Value B is above the settling point for the Rockport Event due to improvements in the operation of generation in the Eastern Interconnection and to a very small extent it is impacted by load response modeling.
Figure 3.2: Eastern Interconnection August 4, 2007, Frequency Benchmark 2017-LL

Chapter 3: Model Validation and Base Case Benchmarking
NERC | 2017 Frequency Response of the Eastern Interconnection during Light Load Conditions | June 30, 2017 10
Table 3.1: Rockport August 4, 2007, Benchmark (AEP)
FNET(Grid/Eye) Measurement
PSS/E Base Case Mismatch Metric
Success Value Starting Frequency fA (Hz) (Value A) 60.069 60.069 0.000 0.01
Starting Time tA 0.0 0.0 0.000 0.100
Frequency nadir fc (Hz) (Point C) 59.880 59.880 0.000 0.010
Time of nadir tC 10.2 7.8 2.442 1.000
Settling frequency fB (Hz) (Value B) 59.880 59.914 -0.034 0.010
Settling Time tB 30.0 30.0 0.000 1.000
Delta Frequency (mHz/s) 189.000 189.000 0.000 5.000
Rate of Change of Frequency RoCoF (mHz/s) 18.529 24.362 -5.833 ±10.000
Frequency Response Measure (FRM) (MW/0.1Hz) 3,546.1 4,644.0 -1,097.0 N/A
Calvert Cliffs April 7, 2015 DC Event and 2017-LL Case Benchmarking Figure 3.3 and Table 3.2 document the benchmarking for the 2017-LL case and show that it sufficiently benchmarks to the loss of Calvert Cliffs April 7, 2015, DC event. The RoCoF for the Calvert Cliffs event does not meet some of the success metrics due to details of the actual outage that are difficult to mimic in the 2017 system model. Even so, the 2017-LL Model provides a more conservative estimate of the RoCoF.

Chapter 3: Model Validation and Base Case Benchmarking
NERC | 2017 Frequency Response of the Eastern Interconnection during Light Load Conditions | June 30, 2017 11
Figure 3.3: Calvert Cliffs April 7, 2015 Event FNET Benchmark (PJM) 2017-LL
Table 3.2: Calvert Cliffs April 7, 2015, Benchmark (PJM)
FNET(Grid/Eye) Measurement
PSS/E Base Case Mismatch Metric
Success Value Starting Frequency fA (Hz) (Value A) 59.999 59.993 0.006 0.010
Starting Time tA 15.0 14.975 0.025 0.100
Frequency nadir fc (Hz) (Point C) 59.945 59.923 0.022 0.010
Time of nadir tC 25.9 21.6 4.300 1.000
Settling frequency fB (Hz) (Value B) 59.934 59.931 0.003 0.010
Settling Time tB 40.0 40.0 0.000 1.000
Delta Frequency (mHz/s) 53.400 70.400 -17.000 5.000
Rate of Change of frequency RoCoF (mHz/s) 4.904 10.626 -5.723 ±10.000
Frequency Response Measure (FRM) (MW/0.1Hz) 2,869.4 2,578.3 291.1 N/A
Millstone May 25, 2014, Event and 2017-LL Case Benchmarking Figure 3.4 and Table 3.3 document the benchmarking for the Base Case and shows that it meets most of the success metrics. The settling Value B is above the settling point for the Millstone Event due to improvements in

Chapter 3: Model Validation and Base Case Benchmarking
NERC | 2017 Frequency Response of the Eastern Interconnection during Light Load Conditions | June 30, 2017 12
the operation of generation in the Eastern Interconnection and to a very small extent due to frequency response load modeling.
Figure 3.4: Millstone May 25, 2014, Event FNET Benchmark 2017
Table 3.3: Millstone May 25, 2014 Benchmark (ISO-NE)
. FNET(Grid/Eye) Measurement
PSS/E Base Case Mismatch
Metric Success Value
Starting Frequency fA (Hz) (Value A) 59.974 59.974 0.000 0.010
Starting Time tA 0.0 0.000 0.000 0.100
Frequency nadir fc (Hz) (Point C) 59.907 59.910 -0.003 0.010
Time of Nadir tC 5.9 4.429 1.471 1.000
Settling frequency fB (Hz) (Value B) 59.915 59.930 -0.015 0.010
Settling Time tB 20.0 19.770 0.230 1.000
Delta Frequency (mHz/s) 67.000 64.000 3.000 5.000
Rate of Change of Frequency RoCoF (mHz/s) 11.356 14.450 -3.094 ±10.000
Frequency Response Measure (FRM) (MW/0.1Hz) 2,163.2 2,802.3 -639.1 N/A

Chapter 3: Model Validation and Base Case Benchmarking
NERC | 2017 Frequency Response of the Eastern Interconnection during Light Load Conditions | June 30, 2017 13
Benchmarking Findings and Recommendations
Finding 1: Benchmarking of the 2017-LL dynamics case shows significant improvement in the data quality and fidelity of the case from those present in dynamics cases at the start of the Frequency Response Initiative in 2010. However, the case still exhibits more frequency response than actually exists during the rebound period of the response and does not yet accurately reflect response withdrawal, which is still exhibited in the Eastern Interconnection. NERC believes that the model validation and tuning of the dynamics models associated with Standard MOD-033 will further improve the light load dynamics case fidelity.
Automatic generation control (AGC), remedial action schemes, generator protection and controls, and outer-loop plant controls should be considered to capture mid-term dynamics behavior. Mid-term dynamics analysis encompasses time periods beyond those normally used for transient stability analyses.
Recommendation 1: NERC should continue to:
• Improve the data quality of models for conventional generation
• Improve models of wind and inverter-based resources
• Advance dynamics model validation methods and tuning models to actual system response
• Refine the process to identify larger frequency response events and capture high-speed system performance data for use in model validation
• Work directly with software vendors to improve dynamics models of new technologies such as inverter-based resources and wind generation
• Work directly with software vendors to model plant outer-loop controls that can cause frequency response withdrawal and the capability to mimic the early stages of automatic generator control (AGC)
• Evaluate frequency response performance of the Eastern Interconnection from a forward-looking perspective for the study year 2021 Light Load Case due to the changing resource mix and the implementation of environmental regulation. This forward-looking study for the Eastern Interconnection is scheduled to be released at the end of the third quarter 2017
• Advance understanding and modeling of mid-term dynamic system behaviors that can have significant effects on overall frequency response performance.

NERC | 2017 Frequency Response of the Eastern Interconnection during Light Load Conditions | June 30, 2017 14
Chapter 4: Evaluation of 2017 Operating Year IFRO This study performed an evaluation of the 2017 IFRO for the Eastern Interconnection determined in the 2016 Frequency Response Annual Analysis (FRAA) against the new 2017-LL Base Case. The purpose of this analysis is to determine that if the prescribed IFRO is met, the response will be adequate to prevent activation of the 59.5 Hz Under-Frequency Load Shedding (UFLS) settings17 of the Eastern Interconnection. UFLS is intended to be a safety net to prevent system collapse from severe contingencies and is thus the only criteria considered in this evaluation. Conceptually, it is assumed that this safety net will not be violated for any expected generation loss event. The following IFRO formula used for this analysis omits all adjustments during the evaluation of the 2017-LL IFRO.
Where:
• DFBase is the base delta frequency.
• FStart is the starting frequency determined by the statistical analysis. The starting frequency for the calculation of IFRO is the frequency calculated at five percent of the lower tail of samples from the statistical analysis.
• UFLS is the highest trip set point for the Eastern Interconnection.
• MDF is the maximum allowable delta frequency
• RLPC is the resource loss protection criteria
• IFRO is the interconnection frequency response obligation. IFRO Evaluation Method The method used for performing this evaluation was to detune18 the governor performance in the 2017-LL base case in successive steps until it matched the 2017 Operating Year IFRO of 1,015 MW/0.1 Hz for loss of the RLPC of 4,500 MW. For this study, detuning was accomplished by disabling governors. The resulting nadir was than compared to 59.5Hz UFLS which is the Eastern Interconnection UFLS set point. For the 2017-LL case, this was achieved after 85 percent of frequency responsive generators were detuned (switched off-line) as shown in the Detune #5 scenario of Table 3.3. The Tables 4.1–4.3 and Figures 4.1–4.3 describe each detune steps labeled as Detune #3–Detune #5. Detuning stages #1 and #2 were omitted from this report because it was clear that the UFLS was not approached with these initials stages. We begin to observe significant change in the nadir starting with detune #3 as shown in Figure 4.1 and Table 4.1
17 The highest UFLS set point in the Eastern Interconnection is 59.7 Hz in FRCC, while the prevalent highest set point in the rest of that interconnection is 59.5 Hz. The FRCC 59.7 Hz first UFLS step is based on internal stability concerns and preventing the Florida peninsula from separation from the rest of the interconnection. The FRCC concluded that the IFRO starting point of 59.5 Hz for the Eastern Interconnection is acceptable in that it imposes no greater risk of UFLS operation for an interconnection resource loss event than for an internal FRCC event. 18 Detuning is a process of removing or reducing the frequency response capability for a given generation resource by changing the associated governor frequency response parameters, or by disabling the governor.

Chapter 4: Evaluation of 2017 Operating Year IFRO
NERC | 2017 Frequency Response of the Eastern Interconnection during Light Load Conditions | June 30, 2017 15
Table 4.1: Detune #3 (MW of Frequency Responsive Generation Removed)
Detuned Governors
Detuned Responsive Gen MW by Gov Type
Percent of Total Gen Dispatched in Case
IEEEG1 30,903 24.8% PIDGOV 816 0.7% TGOV1 30,611 24.6%
Detune #3 62,330 50.1%
Figure 4.1: Plot for Detune #3 Scenario

Chapter 4: Evaluation of 2017 Operating Year IFRO
NERC | 2017 Frequency Response of the Eastern Interconnection during Light Load Conditions | June 30, 2017 16
Table 4.2: Detune #4 (MW of Frequency Responsive Generation Removed)
Detune Governors
Detuned Responsive Gen MW by Gov Type
Percent of Total Gen Dispatched in Case
GGOV1 6,698.0 5.4%
IEEEG1 30,903 24.8%
IEESGO 21,564 17.3%
PIDGOV 816 0.7%
TGOV1 30,611 24.6%
Detune #4 90,592 72.8%
Figure 4.2: Plot for Detune #4 Scenario

Chapter 4: Evaluation of 2017 Operating Year IFRO
NERC | 2017 Frequency Response of the Eastern Interconnection during Light Load Conditions | June 30, 2017 17
Table 4.3: Detune #5 (MW of Frequency Response Generation Removed) Detuned
Governors Detuned Responsive Gen
MW by Gov Type Percent of Total Gen Dispatched in Case
CRCMGV 5,177 4.2%
GAST2A 3,014 2.4%
GGOV1 6,698 5.4%
IEEEG1 30,903 24.8%
IEESGO 21,564 17.3%
PIDGOV 816 0.7%
TGOV1 30,611 24.6%
WSIEG1 8,872 7.1%
Summary 107,655 86.5%
Figure 4.3: Plot for Detune #5 Scenario

Chapter 4: Evaluation of 2017 Operating Year IFRO
NERC | 2017 Frequency Response of the Eastern Interconnection during Light Load Conditions | June 30, 2017 18
IFRO Evaluation Findings and Recommendations Finding 2: This analysis is the first validation of the recommended IFRO of the Eastern Interconnection using actual governor data in the light load base case. This was the result of incorporating actual governor response data and modeling parameters obtained from the generator owners and operators through a number of surveys, and NERC’s detailed review of governor models being used in the dynamics cases. Recommendations on changes to governor models and detailed setting data were provided to the ERAG/MMWG to be incorporated in the building process for the 2017-LL Light Load dynamics base case. Previous IFRO validations in the 2012 FRI report and subsequent Frequency Response Annual Analyses had to be performed with a dynamics case modified to contain only generic governor models. Two conclusions can be drawn from this analysis:
a. The 1,015 MW/0.1 HZ IFRO prescribed for the 2017 Operating Year is validated to be adequate to maintain reliability of the Eastern Interconnection for the RLPC of 4,500 under the modeled light load conditions. The resultant nadir for that case is 59.564 Hz, about 64 mHz above the 59.5 Hz UFLS set point.
b. The frequency responsiveness modeled in the 2017-LL case would have to be reduced by over 85 percent to reduce the response to the level of performance prescribed by the IFRO. This reflects the existence of sufficient margin in projected system performance versus the IFRO.
Recommendation 2a: NERC should continue working with ERAG/MMWG to annually create light load dynamics cases with actual governor data, validated against governor performance during system frequency events. Recommendation 2b: NERC should annually validate the recommended Eastern Interconnection IFRO in the Frequency Response Annual Analysis reports using those dynamic light load cases.
NERC | 2017 Frequency Response of the Eastern Interconnection during Light Load Conditions | June 30, 2017 19
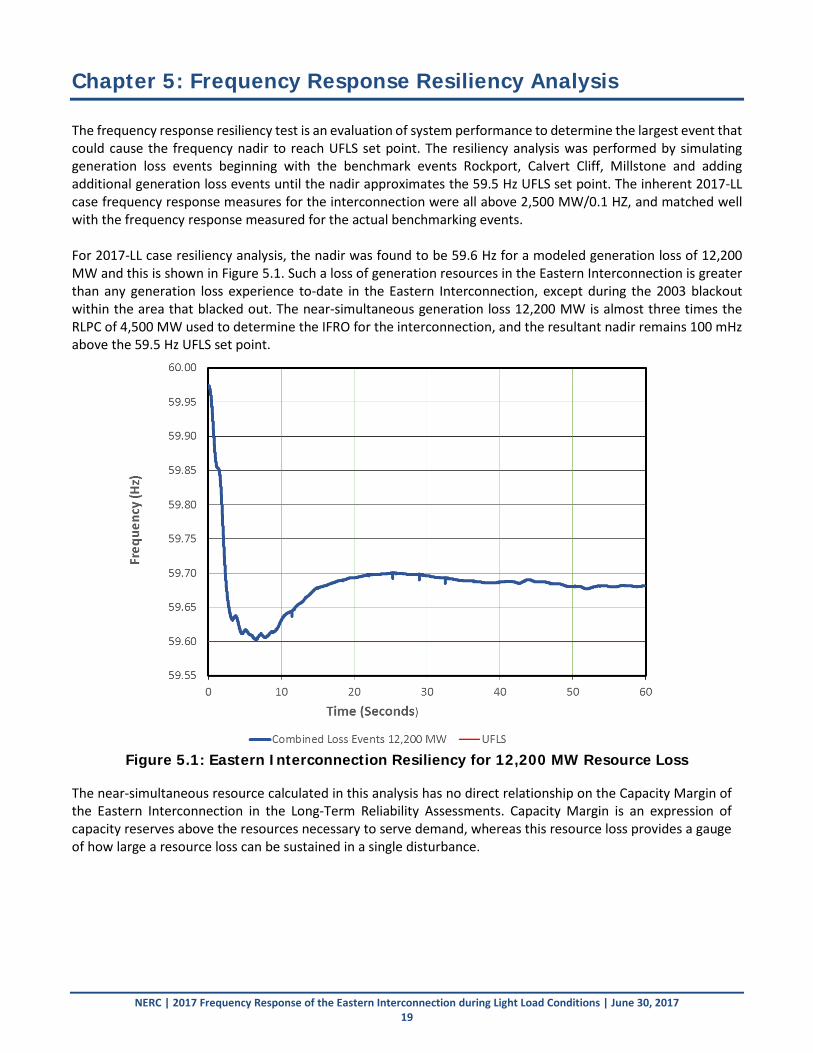
Chapter 5: Frequency Response Resiliency Analysis The frequency response resiliency test is an evaluation of system performance to determine the largest event that could cause the frequency nadir to reach UFLS set point. The resiliency analysis was performed by simulating generation loss events beginning with the benchmark events Rockport, Calvert Cliff, Millstone and adding additional generation loss events until the nadir approximates the 59.5 Hz UFLS set point. The inherent 2017-LL case frequency response measures for the interconnection were all above 2,500 MW/0.1 HZ, and matched well with the frequency response measured for the actual benchmarking events. For 2017-LL case resiliency analysis, the nadir was found to be 59.6 Hz for a modeled generation loss of 12,200 MW and this is shown in Figure 5.1. Such a loss of generation resources in the Eastern Interconnection is greater than any generation loss experience to-date in the Eastern Interconnection, except during the 2003 blackout within the area that blacked out. The near-simultaneous generation loss 12,200 MW is almost three times the RLPC of 4,500 MW used to determine the IFRO for the interconnection, and the resultant nadir remains 100 mHz above the 59.5 Hz UFLS set point.
Figure 5.1: Eastern Interconnection Resiliency for 12,200 MW Resource Loss
The near-simultaneous resource calculated in this analysis has no direct relationship on the Capacity Margin of the Eastern Interconnection in the Long-Term Reliability Assessments. Capacity Margin is an expression of capacity reserves above the resources necessary to serve demand, whereas this resource loss provides a gauge of how large a resource loss can be sustained in a single disturbance.
Chapter 5: Frequency Response Resiliency Analysis
NERC | 2017 Frequency Response of the Eastern Interconnection during Light Load Conditions | June 30, 2017 20
IFRO Resiliency Analysis Findings and Recommendations Finding 3: The Eastern Interconnection is resilient to large losses of generation resources. That is due to its size, its considerable load response, and the frequency responsiveness of the current generation fleet. The resiliency test verifies the order of magnitude of resource loss that would be required to drop interconnection frequency close to the 59.5 Hz UFLS setting. The resiliency analysis found the nadir to be at 59.6 Hz19 for a modeled near-simultaneous resource loss of 12,200 MW. Recommendation 3: The resiliency test should be used as a benchmark of the current generation resource fleet in the NERC’s current forward-looking study of future Eastern Interconnection frequency response performance due to the projected changes in resource mix. That analysis focuses on projected resources using a 2021 Light Load Case.
19 100 mHz above the 59.5 Hz UFLS set point.

NERC | 2017 Frequency Response of the Eastern Interconnection during Light Load Conditions | June 30, 2017 21
Appendix A: Base Case Headroom Analysis Frequency Response Headroom Analysis Droop and available headroom (Pmax – Pgen) for dispatched generation will determine generator frequency responsiveness. Headroom allows a generator to instantaneously increase its output to respond to system disturbances. Where there is no headroom (Pmax ≈ Pgen), there is no Frequency response even if the governors are set to respond. Key Definitions The headroom definition is illustrated in Figure A.1.
• Pmax: Maximum power output capability
• Pgen: Portion of maximum power output dispatched
• Pmin: Minimum power output capability
• Headroom: The difference between the maximum available power (Pmax) and the dispatched power output (Pgen).
Figure A.1: Dispatched Generation Headroom
Droop is the amount of speed (or frequency) change that is necessary to cause the main prime mover control mechanism to move from fully closed to fully open. In general, the percent movement of the main prime mover control mechanism can be calculated as the speed change (in percent) divided by the per unit droop.20 A governor tuned with speed droop will open the control valve a specified amount for a given disturbance. This is accomplished by using feedback from the main prime mover control mechanism (valve, gate, servomotor, etc.) If a one percent change in speed occurs, the main control mechanism must move enough to cause the feedback through the droop element to cancel this speed change. Thus, for a one percent speed change, the percent movement of the main control mechanism will be the reciprocal of the droop (i.e. if the droop is five percent the
20 WECC Tutorial on Speed Governors, February 1998; Principal Investigators: Hoa D. Vu & J. C. Agee

Appendix A: Base Case Headroom Analysis
NERC | 2017 Frequency Response of the Eastern Interconnection during Light Load Conditions | June 30, 2017 22
movement will be (1/.05) = 20). Most governors for frequency responsive generation in the 2017-LL case have a five percent droop setting. Figures A.2–A.5 document the distribution of headroom for the 2017-LL Frequency Response Case.
Figure A.2: 2017-LL Headroom Distribution Percent by Governor Type
Figure A.3: Headroom by Governor Type (MW)
Appendix A: Base Case Headroom Analysis
NERC | 2017 Frequency Response of the Eastern Interconnection during Light Load Conditions | June 30, 2017 23
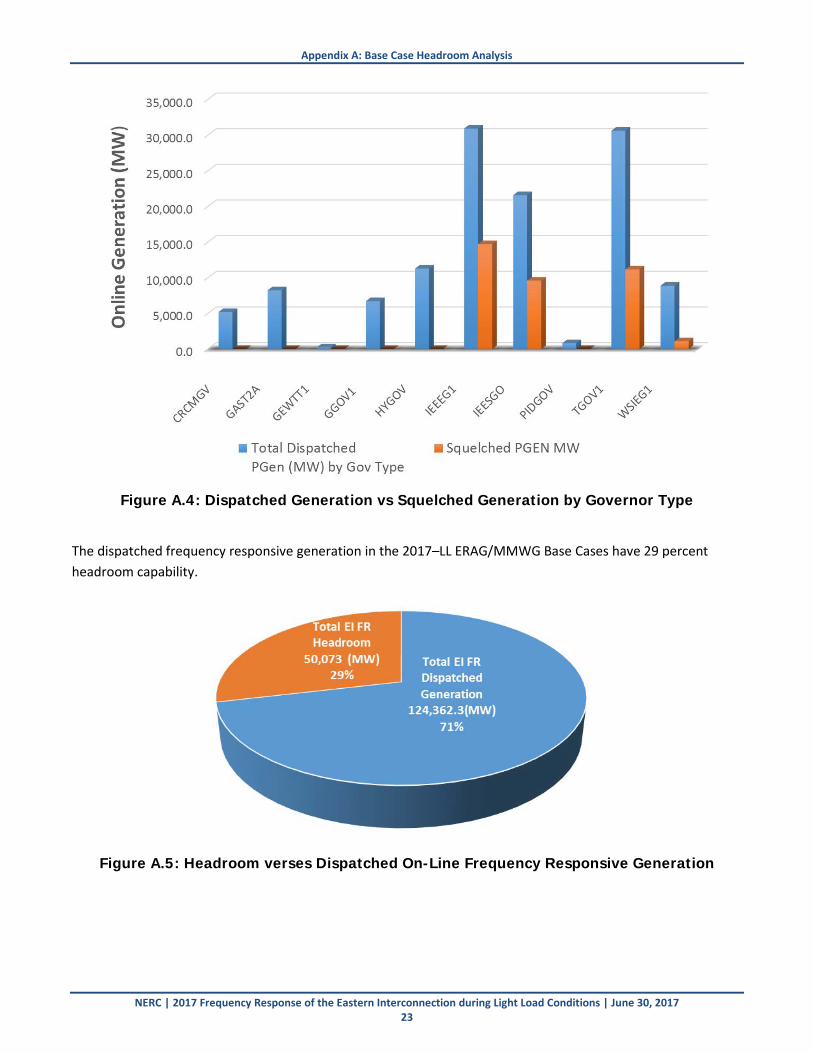
Figure A.4: Dispatched Generation vs Squelched Generation by Governor Type
The dispatched frequency responsive generation in the 2017–LL ERAG/MMWG Base Cases have 29 percent headroom capability.
Figure A.5: Headroom verses Dispatched On-Line Frequency Responsive Generation

NERC | 2017 Frequency Response of the Eastern Interconnection during Light Load Conditions | June 30, 2017 24
Appendix B: Governor Deadband Modeling This appendix describes the deadband modeling required for governors to more accurately capture frequency response. Deadband Modeling Normal power system operations are characterized by continuous load variations that result in constant frequency variations on the power system. In the absence of a major disturbance, these variations are innocuous; however, the response to the small frequency variations can cause wear and tear in steam boilers and turbines. The application of a deadband controller eliminates the system response to frequency deviations that do not exceed a predefined value. With the use of a controller associated with certain deadband, the frequency response may be affected and thus the stability of the power system can be affected.21 One of the key frequency response modeling parameters is the governor deadband. The governor deadband setting establishes a minimum frequency deviation that must be exceeded before the governor will act. Frequency deviations that are less than the setting will not cause the governor to act. Deadband settings not to exceed +/- 0.036 Hz are recommended in the NERC Primary Frequency Control Guideline. Presently, there is no deadband modeling for the most used PSS/E models; however, PSS/E does provide deadband governor modeling for a limited number of models. These PSS/E governors with deadband model two types of intentional deadbands.22 Deadbands will be added to speed signal for some of the turbine-governor (TG) models in PSS®E library.
• Type 1: There is no offset in the output. Once the operation is outside the deadband, the input is passed straight through. Type 1 db1, db2, and epsilon (eps) are defined as shown in Figure B.1. PSLF’s dead band model uses the parameter “eps” in a different way (i.e., to represent the hysteresis).
• Type 2: The output is offset by the deadband. Once operation is outside of the deadband, the output starts from zero and then proportionally increases with the input. For Type 2 db1, db2 are defined as shown in Figure B.2.
Type 1:
if x>db2, y= (eps/db2)*x if x<db1, y= (eps/db1)*x y=0 if db1<X<db2
21 Gefei Kou, Penn Markham, Stanton Hadley, Tom King, and Yilu Liu. Impact of Governor Deadband on Frequency Response of the U.S. Eastern Interconnection: IEEE Transactions on Smart Grid, Vol. 7, No. 3, May 2016. 22 Siemens Power Technologies International Proposed Deadband Modeling for PSS/E Governor Models, August 8, 2016

Appendix B: Governor Deadband Modeling
NERC | 2017 Frequency Response of the Eastern Interconnection during Light Load Conditions | June 30, 2017 25
Figure B.1: Type 1 with No Offset – Input Is Passed Through
Type 2:
y = x-db2 (x>db2) y = x-db1 (x<db1) y = 0 (db1<x<db2)
Figure B.2: Type 2 with No Offset by the Deadband