United States Nuclear Regulatory Commission Official ... · Jupiter, Fl ida 33458 James L nd sen,...
81
United States Nuclear Regulatory Commission Official Hearing Exhibit In the Matter of: FLORIDA POWER & LIGHT COMPANY (Turkey Point Nuclear Generating, Units 3 and 4) ASLBP #: 15-935-02-LA-BD01 Docket #: 05000250 & 05000251 Exhibit #: Identified: Admitted: Withdrawn: Rejected: Stricken: Other: FPL-021-00-BD01 1/4/2016 1/4/2016
Transcript of United States Nuclear Regulatory Commission Official ... · Jupiter, Fl ida 33458 James L nd sen,...

United States Nuclear Regulatory Commission Official Hearing Exhibit In the Matter of: FLORIDA POWER & LIGHT COMPANY
(Turkey Point Nuclear Generating, Units 3 and 4)
ASLBP #: 15-935-02-LA-BD01 Docket #: 05000250 & 05000251 Exhibit #: Identified: Admitted: Withdrawn: Rejected: Stricken:
Other:
FPL-021-00-BD01 1/4/20161/4/2016
SXH09K7
Typewritten Text
FPL-021
SXH09K7
Typewritten Text
SXH09K7
Typewritten Text
SXH09K7
Typewritten Text
SXH09K7
Typewritten Text

"/Vd~f - p lJ I
?\J.Z
?\J3
INTERNAL COPY WITH PHOTOGRAPHS
WELL COMPLETION REPORT
FOR FLORIDAN AQUIFER WELLS PW-1, PW-3, AND PW-4
FPL TURKEY POINT EXPANSION PROJECT (UNIT 5)
HOMESTEAD, FLORIDA
prepared for:
Florida Lakes Power Partners, LLC. and Florida Power & Light Company
9700 SW. 344 TH Street Homestead Florida 33035
JUNE 2006
prepared by:
}LA Geosciences, Inc. i931 Commerce Lane, Suite 3
Jupiter, Fl ida 33458
James L nd sen, . ., JLA Geosciences, Inc. State of Flori a icensed Professional Geologist #1103

JLA Geosciences, Inc. HYDROGEOLOGIC CONSULT Al'rrs
June 7, 2006
Dale F. Woltman, P.E. Project M<1nager Florida Lakes Power Pa11ners, LLC. 1 1401 Lamar A venue Overland Park, KS 66211
Re: FPL Turkey Point Expansion Project (Unit 5)
1931 Commerce L<me, Suite 3 Jupiter, Florida 33-JSB
( 361) '7 46-0228 (ax (561) 746-0119
Floridan Aquifer \Veils P\V-1, P\V-3 and PW-4 Completion Report
Dear Mr. Woltman:
We are pleased to submit thineen ( 13) copies of the Well Completion Report for Floridan Aquifer Wells PW-1. PW -3 and PW -4 for the FPL Turkey Point Expansion Project (Unit 5). This repott summarizes the construction and testing results of the three Floridan Aquifer water supply wells and one Biscayne Aquifer observation well. Additionally, the repoJ1 includes the data, analyses and results of the 72 hour Floridan Aquifer performance test (APT) that was perf01med at the project site.
It has been a pleasure working \>Vith you and the Turkey Point Expansion Project team. If we can do anything further to assist you, please callus.
JLtVjla En cis.

LETTER OF TRANSMITTAL ................................................................................... i
TABLE OF CONTENTS ......................................................................................... ii
LIST OF FIGURES ................................................................................................. iv
LIST OF TABLES ................................................................................................... iv
SECTION 1.0 INTRODUCTION ............................................................................. 1
SECTION 2.0 WELL CONSTRUCTION AND TESTING ....................................... 2
2.1 Construction of Biscayne Aquifer Well OBS-1 ................................ 2
2.2 Construction of Wells PW-3, PW-4, and PW-1 .............................. 3
2.3 Drilling Water Quality Testing ......................................................... 9
2.4 Drilling Flow Testing ....................................................................... 9
2.5 Well Acidization ............................................................................ 1 0
2.6 Well Development. ........................................................................ 13
2.7 Pumping Tests .............................................................................. 14
2.7.1 Step Drawdown Testing ....................................................... 14
2.7.2 Upper Floridan Aquifer Performance Test ........................... 14
2. 7.3 Determination of Aquifer Properties ..................................... 17
2.7.4 Aquifer Properties Summary ................................................ 20
2.8 Geophysical Logging .................................................................... 22
2.9 Video Logs .................................................................................... 23
2.9.1 PW~3 Video .......................................................................... 24
2.9.2 PW-4 Video .......................................................................... 24
2.9.3 PW-1 Video .......................................................................... 24
SECTION 3.0 HYDROGEOLOGY ....................................................................... 25
3.1 Biscayne Aquifer ........................................................................... 25
ii
TABLE OF CONTENTS (continued) PAGE
3.2 Intermediate Confining Unit .......................................................... 26
3.3 Floridan Aquifer System ............................................................... 27
3.4 Floridan Aquifer Head Pressures .................................................. 28
SECTION 4.0 FLORIDAN AQUIFER WATER QUALITY ..................................... 28
SECTION 5.0 CONCLUSIONS ............................................................................ 31
5.1 Conclusions .................................................................................. 31
SECTION 6.0 REFERENCES .............................................................................. 34
APPENDICES
A. AQUIFER PERFORMANCE TEST RESULTS AND DATA
B. SFWMD PW-3 CEMENT GROUTING REPORT
C. GEOPHYSICIAL LOGS
D. LITHOLOGIC LOGS
E. DIVERSIFIED DRILLING CORPORATION WELL COMPLETION REPORTS
F. VIDEO LOGS
G. DIVERSIFIED DRILLLING CORPORATION PLUMBNESS AND ALIGNMENT TEST RESULTS
H. LABORATORY REPORTS OF WATER QUALITY ANALYSES
iii
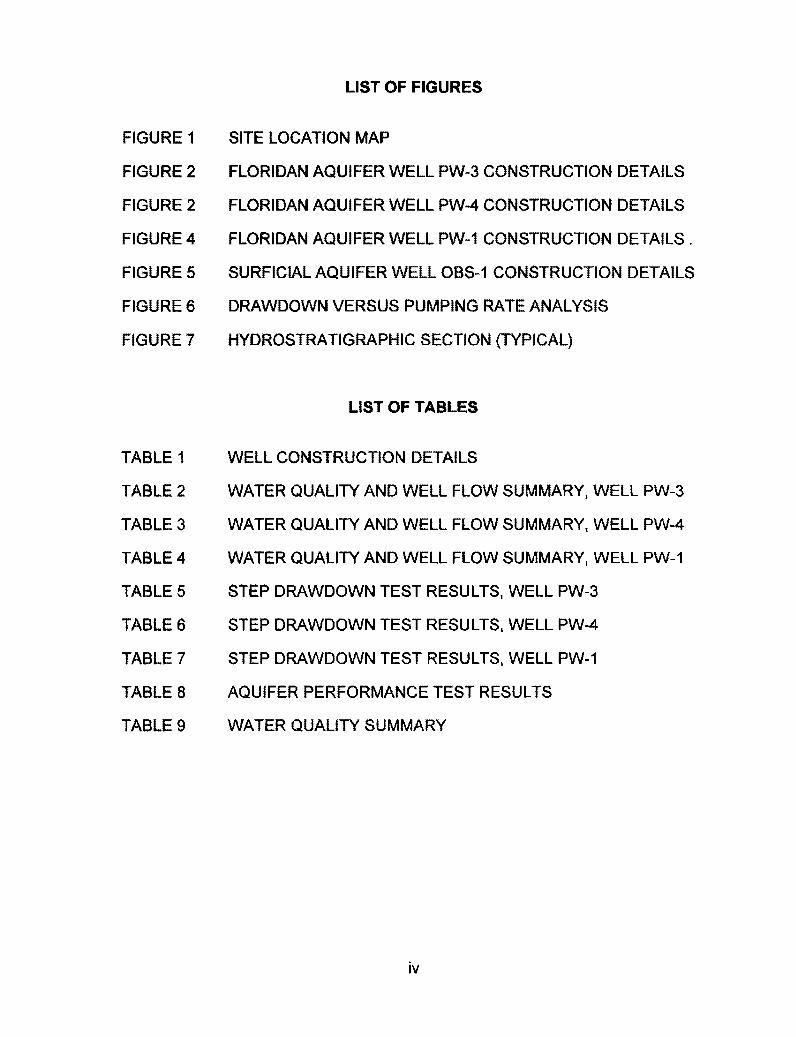
FIGURE 1
FIGURE 2
FIGURE 2
FIGURE4
FIGURE 5
FIGURES
FIGURE 7
TABLE 1
TABLE 2
TABLE 3
TABLE 4
TABLE 5
TABLE 6
TABLE 7
TABLE 8
TABLE 9
LIST OF FIGURES
SITE LOCATION MAP
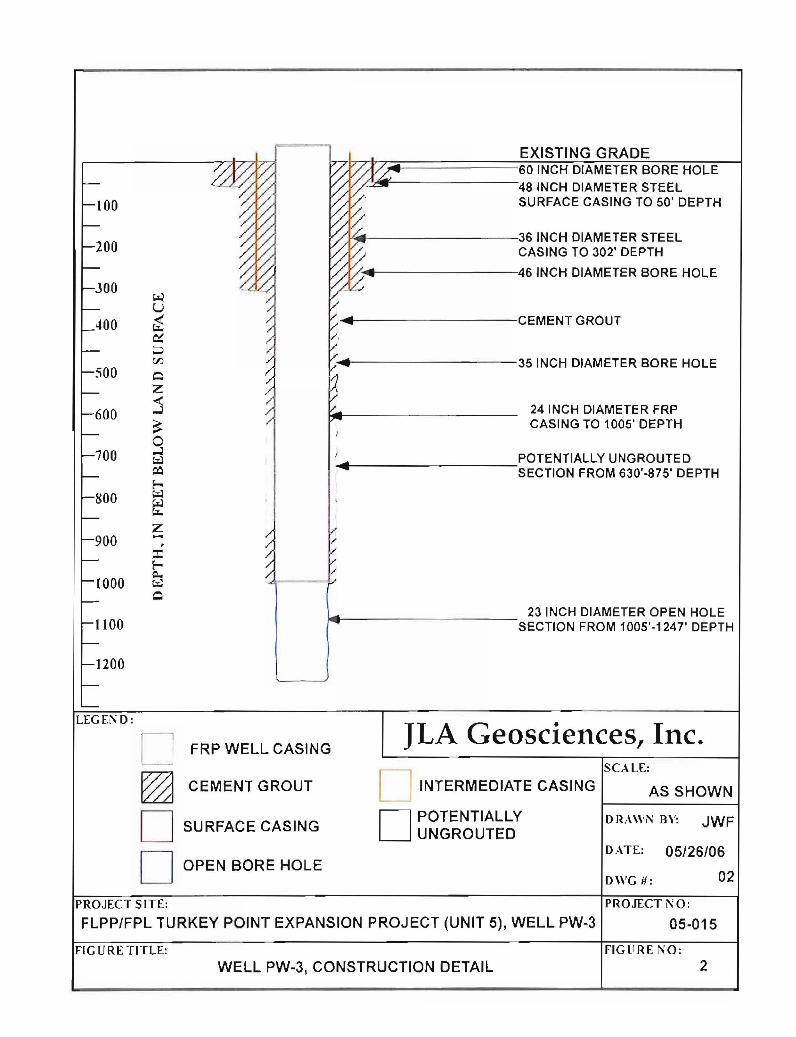
FLORIDAN AQUIFER WELL PW-3 CONSTRUCTION DETAILS
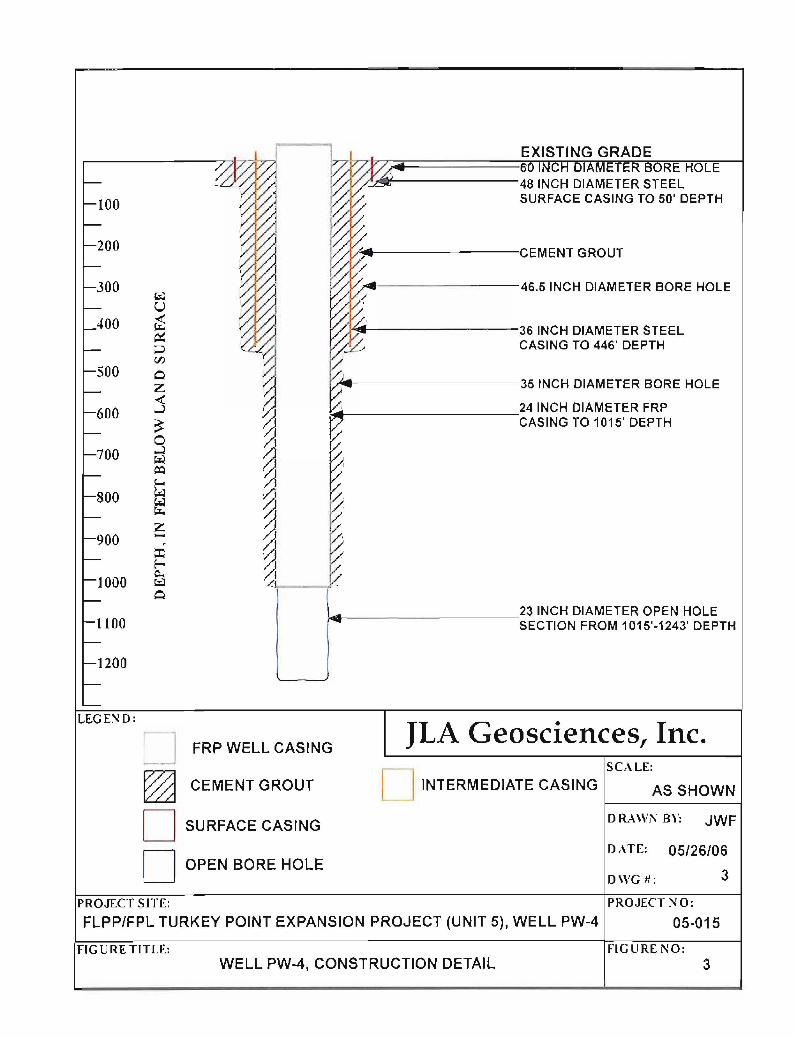
FLORIDAN AQUIFER WELL PW-4 CONSTRUCTION DETAILS
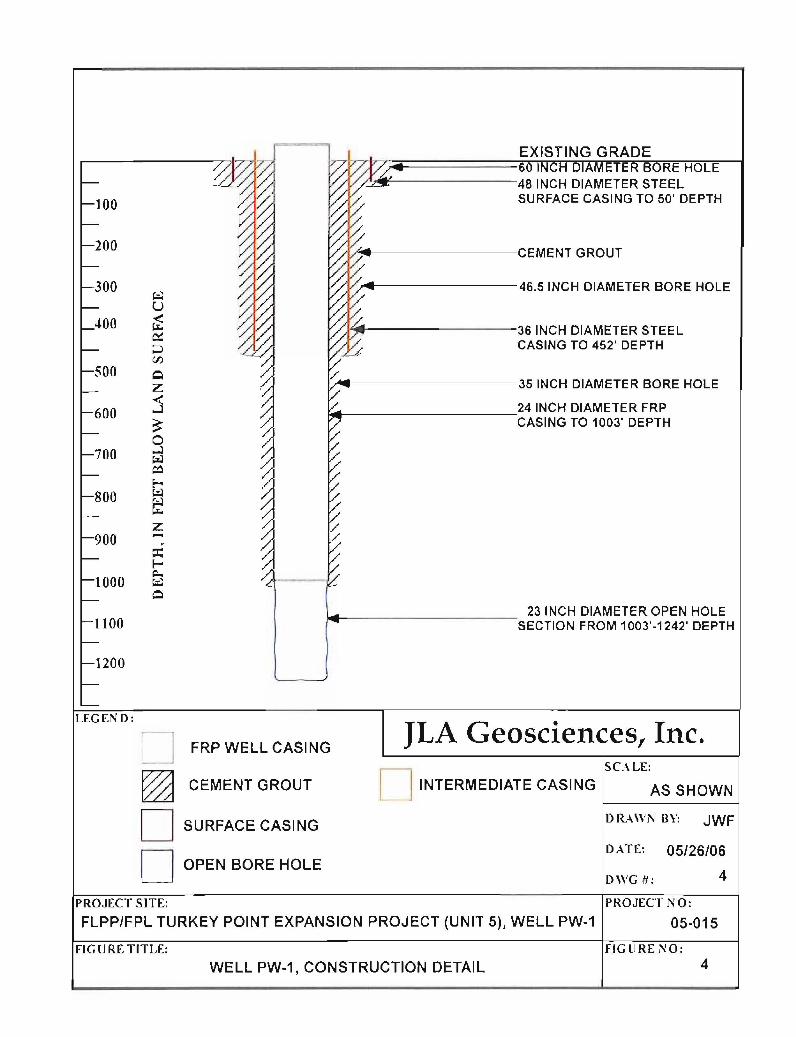
FLORIDAN AQUIFER WELL PW-1 CONSTRUCTION DETAILS.
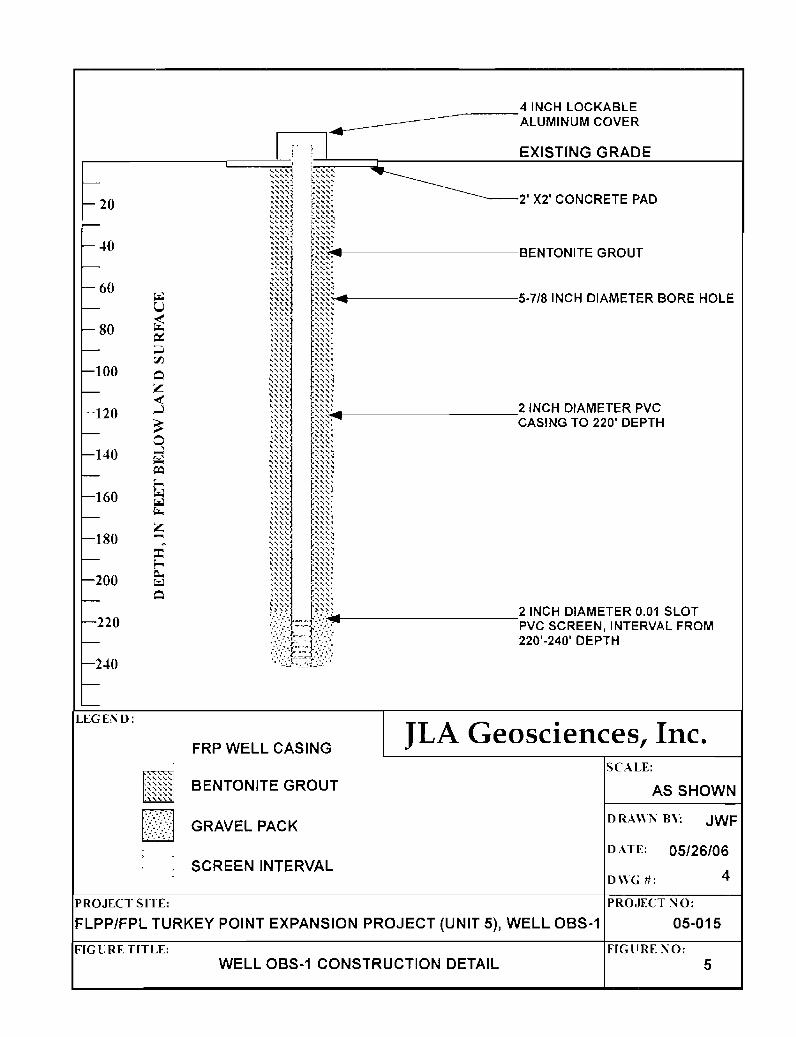
SURFICIAL AQUIFER WELL OBS-1 CONSTRUCTION DETAILS
DRAWDOWN VERSUS PUMPING RATE ANALYSIS
HYDROSTRA TIGRAPHIC SECTION (TYPICAL)
LIST OF TABLES
WELL CONSTRUCTION DETAILS
WATER QUALITY AND WELL FLOW SUMMARY, WELL PW-3
WATER QUALITY AND WELL FLOW SUMMARY, WELL PW-4
WATER QUALITY AND WELL FLOW SUMMARY, WELL PW-1
STEP DRAWDOWN TEST RESULTS, WELL PW-3
STEP DRAWDOWN TEST RESULTS, WELL PW-4
STEP DRAWDOWN TEST RESULTS, WELL PW-1
AQUIFER PERFORMANCE TEST RESULTS
WATER QUALITY SUMMARY
iv

JLA Geosciences, Inc.
1.0 INTRODUCTION
JlA Geosciences, Inc. {JLA) was contracted by Florida Lakes Power Partners {FLPP)
to provide hydrogeologic consulting services associated with the construction of three
(3) water supply wells completed in the Upper Floridan Aquifer. The scope of
services provided by JlA included: coordination with the well contractor and FLPP;
providing field construction observation, logging, sampling, measurement and testing
services; interpreting the hydrogeologic, water quality and geophysical data; and
making recommendations as to the depths of boreholes, well casings, completion
intervals, acid treatment procedures. JLA also assisted FLPP in providing
verifications that the contractor complied with the intent of specifications to achieve
the stated goals of the project.
This report documents the water well construction and testing scope of work that was
subcontracted by FLPP to complete three Upper Floridan Aquifer production wells
identified as PW-1, PW-3 and PW-4, and Biscayne Aquifer observation well OBS-1
for Florida Power and Light Company (FPL). The wells are located at the FPL Turkey
Point Plant, 9700 SW 3441h Street, Homestead, Florida. The project site is shown on
the project location map provided as Figure 1.
The project included construction and testing of three, 24-inch diameter Fiberglass
Reinforced Plastics (FRP) well casings completed to depths to approximately 1,003-
feet to 1,015-feet below land surface (BLS); open hole completion intervals to a
maximum depth of 1 ,246-feet and construction of one 2-inch schedule 80 PVC
Biscayne Aquifer monitoring well completed to 240-feet BLS. The Floridan Aquifer
underlying the Turkey Point Expansion Project (Unit 5) site turned out to be
sufficiently productive to provide the per-well design flow rate of 4,500 gallons per
minute (gpm), and exceeded the design expectations in terms of water quality.
Florida Lakes Power Partners, LLC. 1 FPL Turkey Point
Expansion Project (Unit 5)
JLA Geosciences, Inc.
All four wells were constructed by Diversified Drilling Corporation, Tampa, Florida
(DOC). Construction observation, field geologic testing and sample collection, and
water quality testing were performed by JLA, based out of the Jupiter, Florida office.
DOC complied with the technical specifications as outlined in the contract documents
and the standards of the American Water Works Association for Deep Wells (A WWA
A 1 00-90) as referenced in the specifications. Well construction began in July 2005
with well PW-3 and was completed in May 2006 with the completion of well PW-1.
2.0 WELL CONSTRUCTION AND TESTING
FLPP and JLA performed on-site observation during rotary drilling of pilot holes,
geophysical logging, casing installations, casing grouting, reverse air drilling of
completion intervals, acid treatment, pump development and pump testing. The well
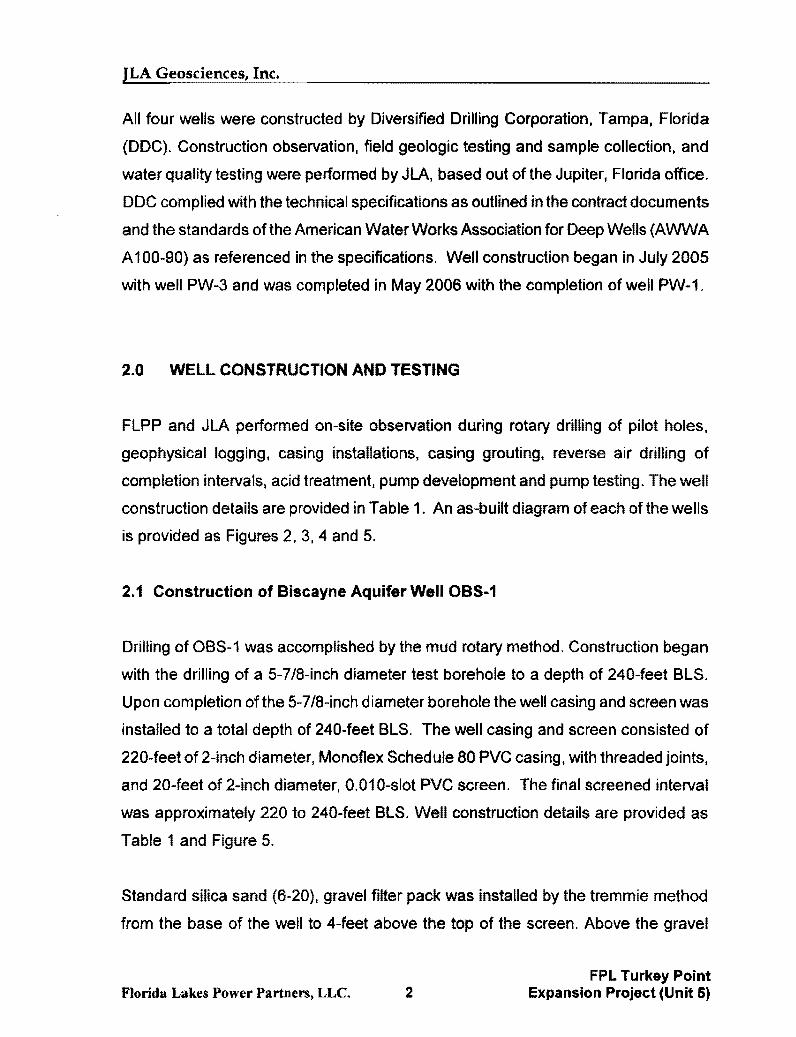
construction details are provided in Table 1. An as-built diagram of each of the wells
is provided as Figures 2, 3, 4 and 5.
2.1 Construction of Biscayne Aquifer Well OBS-1
Drilling of OBS-1 was accomplished by the mud rotary method. Construction began
with the drilling of a 5-7/8-inch diameter test borehole to a depth of 240-feet BLS.
Upon completion of the 5-7/8-inch diameter borehole the well casing and screen was
installed to a total depth of 240-feet BLS. The well casing and screen consisted of
220-feet of 2-inch diameter, Monoflex Schedule 80 PVC casing, with threaded joints,
and 20-feet of 2-inch diameter, 0.010-slot PVC screen. The final screened interval
was approximately 220 to 240-feet BLS. Well construction details are provided as
Table 1 and Figure 5.
Standard silica sand (6-20), gravel filter pack was installed by the tremmie method
from the base of the well to 4-feet above the top of the screen. Above the gravel
Florida Lakes Power Partners, LLC. 2 FPL Turkey Point
Expansion Project (Unit 5)
JLA Geosciences, Inc.
pack, the well annulus was grouted by tremmie method using Bentonite chip sealant,
from the top of the gravel pack to land surface.
After grouting, a one-inch PVC air line was inserted into the well casing, through
which air was injected into the well to the depth of the screen to develop the well by
air-jetting. The well was developed for approximately 4 hours by the air-jetting
method.
The well was completed with an above ground PVC riser and lockable cap, protected
by a 4-inch diameter steel outer casing with lockable aluminum cover, set within a 2' x
2' concrete pad. The casing riser extends two feet above land surface.
2.2 Construction of Floridan Aquifer Wells PW-3, PW-4 and PW-1
By contract, DOC was responsible for all aspects of the Turkey Point well
construction and performed aU of the construction elements with the exception of the
60-inch diameter borehole drilling for the 48-inch diameter surface casing. DOC
subcontracted the 60-inch diameter borehole to R.W. Harris, Inc., Clearwater, Florida.
R.W. Harris augered a 60-inch diameter borehole which was advanced to a depth of
approximately 50-feet below land surface (BLS). Lithologic samples were collected
from the augering tool that was repeatedly retracted to remove cuttings. The
borehole was supported with the use of bentonite drilling fluid. Following auger
drilling, 50-feet of 48-inch, 0.375-inch thick butt welded steel casing, was installed by
DOC into the nominal 60-inch diameter borehole. Upon completion of the casing
installation, the annular space was grouted using a bentonite mixture of API class B
Portland cement. The cement was allowed to harden 24 hours before drilling was
resumed.
Initial drilling of the cement plug was performed using the mud rotary method with a
46.5-inch diameter reaming bit assembly with a nominal11 7/8-inch diameter lead bit.
Florida Lakes Power Partnerst LLC. 3 FPL Turkey Point
Expansion Project (Unit 5)
JLA Geosciences, Inc.
Upon completion of drilling the cement plug, the tools were removed from the hole to
continue with pilot hole drilling. A pilot hole was advanced from the surface using the
mud rotary method with an 11 7/8-inch diameter bit. Lithologic samples of the
penetrated strata were collected from the circulating mud. JLA prepared a field
lithologic log for the well. Pilot-hole drilling continued until a suitable competent
limestone was encountered in the Upper Floridan Aquifer. The drilled depths of the
11 7/8-inch diameter pilot holes ranged from 1,046-feet to 1 ,049-feet BLS. Drilling
fluid circulation was lost while drilling the PW-4 pilot hole at 123-feet BLS. DOC
drilled "Blind" until drilling fluid circulation was fully regained at 455-feet BLS. After
the pilot hole was completed, drilling fluid was circulated to clear the hole of cuttings.
Geophysical logging (SP, dual induction logs, gamma ray and caliper log) was then
performed by MV Geophysical Services, Inc. of Fort Myers, Florida (MVGS) as
described in Section 2.8. Electronic copies of geophysical logs are provided in
Appendix C.
Based on the analysis of the lithologic samples (drill cuttings) and the geophysical
logs from each well site, DOC recommended casing setting depths for the
intermediate casing (36-inch diameter steel casing) and the 24-inch diameter FRP
casing.
Following acceptance of the casing setting depth recommendation, DOC reamed the
pilot hole to 46.5 inches in diameter, below the recommended casing setting depth to
facilitate installation of the 36-inch diameter intermediate casing. Hole reaming was
performed using the mud rotary method, a 46.5-inch reaming bit assembly with a
nominal 12 3/4-inch diameter lead bit. Upon reaching total depth, drilling fluid
circulation continued until the mud was clear of cuttings and the borehole was ready
to accept installation of casing. After circulating the drilled cuttings and conditioning
the drilling fluid, the driller removed the drilling tools and MVGS conducted caliper
logging on the borehole. Caliper logging of the initial46.5-inch reamed borehole of
wells PW-4 and PW-1 indicated that each borehole would not accept casing
Florida Lakes Power Partners, LLC. 4 FPL Turkey Point
Expansion Project (Unit 5)

JLA Geosciences, Inc.
installation. Well PW-4 reamed borehole was approximately 80-feet too shallow, and
the PW-1 borehole had excessive mud cake reducing the effective diameter of the
hole. DDC continued to ream and perform additional caliper logs until the 46.5-inch
borehole for wells PW-4 and PW-1 met the specification for casing installation. The
intermediate casing string, which consisted of 36-inch diameter, 0.375-inch thick butt
welded steel casing, was installed into the nominal 46.5-inch diameter borehole to
depths of 304-feet BLS in PW-3, 450-feet BLS in PW-4 and 452-feet BLS in PW-1.
Centering guides were welded to the outside of the casing at the base of the casing,
1 0-feet above the casing base, and at subsequent 40-feet intervals. The guides
position the casing in the center of the borehole to allow a more uniform grout job.
Upon completion of the casing installation, the annular space was pressure grouted
using API Class B Portland cement. The initial grouting stage was performed using
the through-casing, pressure grouting method. Neat cement was used to grout the
lowermost 1 00-feet of annulus in order to obtain maximum strength near the base of
the casing; subsequent grouting stages consisted of a 3% bentonite mixture.
Following the initial pressure grouting stage, the depth of grout was determined in the
annular space by using tubing (tremmie) which was lowered until a hard top of grout
was measured. Subsequent grouting stages were performed by the "tremmie
method" which consisted of pumping slurry under pressure through the tremmie to fill
the annular space between the casing and borehole. Grouting was conducted in
stages and continued until the annular space was completely filled with cement. Heat
logging was performed by MVGS on wells PW-4 and PW-1 to corroborate DOC
physical grout tag depths in the annular space. Following cementing, the well was
given 24-hour cement curing rest period before drilling operations resumed.
The final casing string consisted of 24-inch diameter retained bell and spigot FRP
manufactured by Ershigs, Inc. (Ershigs) Bellingham, WA Each bell and spigot
connection is sealed with two a-rings and retained using a steel retaining ring. The
casing type was chosen because of its ability to resist corrosion in the hydrogen
sulfide rich brackish water environment of the Upper Floridan Aquifer. The casing
Florida Lakes Power Partners, LLC. 5 FPL Turkey Point
Expansion Project (Unit 5)
JLA Geosciences, Inc.
string for each well consisted of one cut to length piece of 24-inch FRP casing at the
base of the well casing, a 1 0-feet prefabricated flanged piece of 24-inch FRP casing
at the top, and the required number of 40-feet sections of 24-inch FRP casing to
reach the selected casing depth for each well (see Table 1 ).
The FRP casings were installed to 1,003-feet BLS in PW-1 and PW-3, and 1,015-feet
BLS in PW-4. The primary objective in selecting these casing depths was to enable
the wells, when completed, to efficiently produce the specified quantity of water at the
design withdrawal rate and, if possible, optimize for water quality. In addition to
meeting this goal, the selected interval had to be composed of a competent limestone
formation to minimize borehole erosion and the subsequent contribution of sand and
suspended solids. The interval that was selected as most desirable for open
completion of the well was a limestone flow zone sequence located within the Avon
Park Formation in the Eocene Group. The completion interval depth was almost
identical in each of the three wells; this is correlated in the lithologic and geophysical
logs. PW-4 was slightly deeper, part due to a higher site elevation.
Cementing the FRP casing into place was conducted in stages to minimize grouting
stress caused by the heat of hydration and potential differential pressures. Upon
completion of the casing installation, the annular space was pressure grouted using
API Class B Portland cement. The initial grouting stage consisted of 1 00-feet of neat
cement in order to obtain maximum strength near the base of the casing; subsequent
grouting stages consisted of Class B Portland cement with an added 3% bentonite
mixture. The top of the initial grouting stage was confirmed by temperature logging
conducted by MVGS. The remaining cement lifts were pumped into the casing
annulus using the tremmie method as described for the intermediate casing sting
grouting. After each lift of cement had hardened, the cement fill depth was measured
manually by tagging the top of grout with the tremmie pipe. Grouting continued until
the annular space was completely filled with cement. Following cementing, the well
was given 24-hour cement curing rest period before drilling operations resumed.
Florida Lakes Power Partners, LLC. 6 FPL Turkey Point
Expansion Project (Unit 5)

JLA Geosciences, Inc.
PW-3 included four (4) grouting stages to completely fill the annular space between
the casing and borehole; PW-4 required six (6) stages; PW-1 required five (5)
grouting stages.
In well PW-3, DOC was unable to lower the tremmie pipe below 630-feet following the
initial pressure grouting stage. This left a section of FRP casing potentially not
grouted between 875-feet to 630-feet BLS. A complete description of this
construction detail and submittal to the South Florida Water Management District
(SFWMD) is provided in Appendix B. The SFWMD concurred with DOC's conclusion
that the well meets the SFWMD criteria for construction of wells. The
correspondence from SFWMD is also provided in Appendix B.
Fallowing FRP casing grouting, DOC mobilized a formation water solids management
system consisting of 3 to 5, 21,400 gallon capacity "frac" tanks, pumps, piping and
appurtenances. The solids management system utilized a "best management
practices" approach to reducing the suspended solids content in the drilling water
prior to discharge. Residual bentonite drilling fluid within the FRP casing was
circulated out of the casing and properly disposed prior to drilling. Potable water was
used to displace the drilling fluid in the casing. The solids management setup was a
closed system that prevented the brackish Floridan Aquifer water from being
discharged to the ground surface at the site. Additionally, each well site had a
secondary containment system, installed prior to rig and mud system mobilization that
consisted of an earthen berm overlain by polyethylene sheeting that enclosed the
drilling area.
DOC performed plumb ness and alignment tests (P&A) on the 24-inch FRP casing of
wells PW-3, PW-4 and PW-1. P&A testing was conducted to ensure that the 24-inch
casing plumbness and alignment complied with AWWA requirements. The P&A test
setup consisted of a 2.88-feet tall cylindrical spool/plumb suspended from an apex
located approximately 10-feet above and centered over the 24-inch FRP casing top.
Florida Lakes Power Partnerst LLC. 7 FPL Turkey Point
Expansion Project {Unit 5)
JLA Geosciences, Inc.
As the plumb was lowered into the FRP casing, measurements of its deviation from
the top of casing center were recorded with depth. Results of the DOC P&A tests
indicate the FRP casings are compliant. DOC's P&A test reports can be found in
Appendix G.
Using a nominal23-inch diameter reaming bit assembly, DOC drilled out the cement
plug and limestone of the Upper Floridan Aquifer to total depth of each well. The
total depths of the wells were between 1,242-feet (in PW-1) BLS and 1,246-feet (in
PW-3) BLS.
DDC initially attempted drilling in PW-3 using a nominal12-inch by 23-inch diameter
reaming bit but experienced problems removing cuttings, cement grout and metal
bearings. Following numerous unsuccessful attempts to vary the 12 by 23 inch bit
arrangement and attempts to recover the debris using junk baskets, DOC ultimately
switched to drilling with the 12-inch diameter bit alone. DOC was able to drill to total
depth but had to reenter the hole with a 16-inch by 23-inch bit to achieve the full
specified diameter of the borehole. JLA was on site during drilling to collect lithologic
samples, water quality samples, perform flow tests and perform field water quality
analyses. The water quality sampling and drilling flow testing programs are described
in Sections 2.3 and 2.4.
DOC repeated the process of drilling the PW-4 completion interval in two stages as
described above and was successful in this approach. The last well to be drilled was
PW-1 and DOC attempted to drill the completion interval in one pass. DDC chose the
16-inch by 23-inch bit for drilling and total depth was reached after 2 days of round
the clock drilling.
Upon reaching the total depth in each well, the driller cleared the borehole of drill
cuttings and performed geophysical logging as described in Section 2.8.
Florida Lakes Power Partners, LLC. 8 FPL Turkey Point
Expansion Project (Unit 5)
JLA Geosciences~ Inc.
2.3 Drilling Water Quality Testing
During reverse air drilling in the Floridan Aquifer, specific conductance, temperature,
pH and chloride concentration of the formation water were measured at regular
intervals. After allowing the appropriate lag time, water samples were collected from
the reverse air discharge after the bit drilled the desired sampling depth. The sample
lag time was calculated at the onset of drilling after each drill rod change. At
approximately every 10-feet during drilling, specific conductance and temperature of
the formation water was recorded. Additionally. after every 1 0-feet or significant
change in specific conductance, a water sample was collected for chloride analysis.
At every drill rod change additional water quality analysis was conducted on the water
from artesian well head flow. Water quality analysis of well head flow included
specific conductance, temperature, pH. chloride, hydrogen sulfide and total dissolved
iron. Chloride analysis was performed using a Hach titrator and Silver nitrate titrant.
A summary of the field water quality measurement performed during drilling of each
well is provided in Tables 2, 3 and 4.
At various intervals during reverse air drilling and following drilling to total depth,
water samples of the wellhead flow were collected for laboratory analyses. A
summary of the results is discussed in Section 4.0, Floridan Aquifer Water Quality.
2.4 Drilling Flow Testing
During reverse air drilling through the Floridan Aquifer, flow tests were performed to
evaluate the specific capacity of the penetrated open interval. The tests were
performed after every drill rod change (approximately every 30-feet). To perform the
test, a construction header was fitted to the flanged 36-inch diameter surface casing
and sealed to the drilling tools with a rubber stripping header. The construction well
head effectively sealed the well so that drilling could be done under artesian
conditions. The construction header was equipped with a valved, 12-inch diameter
Florida Lakes Power Partners. LLC. 9 FPL Turkey Point
Expansion Project (Unit 5)
JLA Geosciences, Inc.
flow port, a 2-inch port for adding brine "kill" water to stop the well from flowing, and a
3/4-i nch manometer fitting. A manometer tube was fitted to the construction header to
measure the potentiometric (static) water level, which reached as high as 49-feet
above land surface (ALS).
The flow rate was measured using both an in line flow meter (for higher flows) and a
volumetric calculation based on the fill rate of a 21,400 gallon frac-tank. The flow
meter was installed in the 12-inch diameter PVC line that discharged from the well
head to a series of 3 (PW-1 and PW-4) to 5 (PW-3) frac-tanks beginning with frac
tank number 1. Prior to the start of the flow test frac-tank number 1 was pumped
down to a predetermined level and then isolated from the remaining tanks using a
butterfly valve. The water level rise in frac-tank number 1 was measured over time to
determine flow rate. Water levels in the well were measured during the flow test and
compared to static, no-flow conditions measured at the beginning of each day and
after each test. Measurement of flow rate (Q) and draw down in the well (dh),
allowed calculation of specific capacity (Cs) of the well to be approximated using the
formula Cs = Q/dh (Freeze and Cherry, 1979).
Tables 2, 3 and 4 include a summary of the water quality data and calculated values
for specific capacity from flow tests conducted during advancement of the drill pipe
and immediately following completion of well drilling. Because the completion
intervals of wells PW-3 and PW-4 were drilled in two stages (described in Section
2.2), flow tests were duplicated for both the 12-inch diameter and 23-inch diameter
boreholes.
2.5 Well Acidization
Acid treatment was included in the specification to maximize the specific capacity of
each well prior to placing the wells into service. The treatment procedure called for
10,000 gallons of 32 percent hydrochloric acid to be pumped into the production
Florida Lakes Power Partners, LLC. 10 FPL Turkey Point
Expansion Project (Unit 5)
JLA Geosciences, Inc.
zone, increasing the permeability of the limestone in the immediate vicinity of the
borehole. Acid treatment has a proven track record of increasing the capacities of
wells completed in limestone formations. By increasing the specific capacity in a well,
the total dynamic head required of the pump at the design pumping rate is reduced
decreasing the horsepower needed and the energy consumption. Additionally, higher
capacity wells may reduce the need for future rehabilitation and/or the number of
future wells that will ultimately be needed.
All three wells were acidized to maximize specific capacities in each well. PW-3 was
acidized on November 161h, 2005; PW-4 was acidized twice, March 241
h and 251h,
2006; and PW-1 was acidized on March 3f1\ 2006. DDC provided a proportionally
lower quantity of a stronger acid (36%) so that the full shipment could be delivered in
two tanker truckloads. Following the PW-3 acid treatment, the procedure was
modified to significantly reduce the percentage of water added during and following
acid treatment. It was felt that excessive water added during acid treatment reduced
the effectiveness of the procedure. The procedure and the results are summarized
below.
PW-3 Acid Treatment
The acidization procedure for well PW-3 consisted of installing 1 ,050-feet of drop
tubing into the well and pumping 8,600 gallons of 36%, (22° Baume) hydrochloric acid
into the open interval at a rate of approximately 1 02 to 11 0 gpm, followed by enough
water to displace the tubing. While pumping the acid, water was simultaneously
pumped into the 200-feet of installed water injection line at a rate of 75 to 100 gpm.
During and after pumping, the wellhead was sealed and fitted with a pressure gage to
monitor pressure within the casing. A relief valve and gas discharge hose was in
place on the wellhead to vent off excess pressure in the well but it was not needed.
The pressure at the wellhead rose to a maximum of 21 psi. After completing the
procedure, DDC continued to pump water into the well to reduce the wellhead
Florida Lakes Power Partners, LLC. 11 FPL Turkey Point
Expansion Project (Unit 5)

JLA Geosciences, Inc.
pressure. The well remained undisturbed for approximately 12 hours until
development of the well was started.
To determine the effectiveness of the acid treatment at PW-3 a comparison is made
between the specific capacity at the same flow rate before and after acid treatment.
Prior to acid treatment the specific capacity was 75.9 gpm/ft at 2,800 gpm. The
specific capacity following acid treatment can be determined from the step drawdown
test results. At 2,800 gpm the specific capacity is extrapolated to be approximately
81 gpm/ft yielding an improvement of about 7%.
PW-4 and PW-1 Acid Treatment
The acidization procedure for wells PW-4 and PW-1 consisted of installing 1,050-feet
of drop tubing into each well, pumping approximately 8,600 gallons of 36%, (22°
Baume) hydrochloric acid into the open interval at a rate of approximately 150 gpm,
followed by enough water to displace the tubing. While pumping the acid water was
pumped into the 200-feet of installed water injection line at 50% of the initial acid
pumping rate, as determined prior to pumping acid. In wells PW-4 (stage 1 and 2)
and PW-1 the water pumping rate was reduced by 25% after 15 minutes of pumping
acid. PW-1 had water pumping rates reduced by an additional25% after 30 minutes
due to low well head pressures. During pumping. the wellhead was sealed and fitted
with a pressure gage to monitor pressure within the casing. A relief valve and gas
discharge hose was in place on the wellhead to vent off excess pressure in the well
but it was not needed. The pressure at the wellhead rose to a maximum of 30.5 psi
in well PW-4 and 22 psi in well PW-1. After completing the procedure, each well
remained undisturbed for approximately 12 hours until development of the well was
resumed.
Well PW-4 had the lowest pre-acid specific capacity of all of the wells. PW-4 had a
specific capacity of roughly half that of PW-3, which prompted JLA to recommend
and FLPP to implement a double acid treatment program. The measured pre-acid
Florida Lakes Power Partners, LLC. 12 FPL Turkey Point
Expansion Project (Unit 5)

JLA Geosciences~ Inc.
treatment specific capacity at approximately 1 ,450 gpm was 42.6 gpm/ft. Based on
the pumping test performed following acid treatment, the estimated specific capacity
at approximately 1,450 gpm is 81.3 gpm/ft. This represents a gain of 91 %.
The pre-acid treatment specific capacity of well PW-1 was measured to be 87.2
gpm/ft at 2,500 gpm. Following acid treatment, specific capacity increased to 131.3
gpm/ft at 2,500 gpm. This represents a 51 % increase due to acidization. The
acidization procedure utilized in wells PW-4 and PW-1 was more effective than the
procedure used in PW-3.
2.6 Well Development
Wells PW-3. PW-4 and PW-1 were developed using a 450 hp V-12 diesel-powered,
vertical turbine test pump equipped with a 16-inch diameter pump and 12-inch
diameter column pipe capable of pumping an estimated 6,500 gpm.
Formation water from all of the Floridan Aquifer wells was initially discharged to the
frac-tank system until pH and turbidity were acceptable to discharge formation water
directly to the outfall line. which flows into the cooling canal system.
The pump development protocol called for steady pumping at the maximum rate until
the discharge water was visibly free of solids and turbidity. Following the steady flow
period, the well was pumped intermittently with surge and rest periods. Development
progress was measured by performing Rossum sand testing and silt density index
(SOl) testing of the raw water. Additionally, the specific capacity of the well was
measured periodically during development to evaluate progress by improvement in
well performance. The specification required that development continue until the
discharge was free from suspended sediment. Development was considered
complete when the Rossum sand testing results were consistently at or below 1 ppm
at design flow rates of 4,500 gpm.
Florida Lakes Power Partners, LLC. 13 FPL Turkey Point
Expansion Project (Unit 5)
JLA Geosciences, Inc.
2.7 Pumping Tests
2.7.1 Step Drawdown Testing
Following acidization and well development, step drawdown tests were performed at
wells PW-3, PW-4 and PW-1 using the development pump and discharge setup. The
tests were completed to assess well yield and anticipated drawdown, and to aid in
final well pump selection. The flow rates for the test were measured with the use of
an in-line flow meter that was calibrated just prior to the start of the project. Prior to
starting the test, the static water level was measured with the use of an elevated
manometer tube. The four step rates were 2,300 gpm, 3,000 gpm, 3,800 gpm and
4,500 gpm. The design pumping rate for each well is 4,500 gpm. For the step
drawdown test, performed on wells PW-3 and PW-1, the pumping duration for steps
1, 2, 3, and 4 was 60 minutes, 90 minutes, 120 minutes, and 190 minutes,
respectively. At well PW-4, the pumping duration was 60 minutes for each ofthe four
steps. Water levels were measured in the well with an electronic water level data
logger at 0.5 minute intervals, and manually at intervals of 1 to 15 minutes for each
pumping rate. Field water quality samples including hydrogen sulfide, iron, pH,
temperature, turbidity, silt density index (SDI), sand content, specific conductance
and chloride were collected at the end of each step.
The step drawdown test results were used to estimate specific capacity values for
each well. Results of the Step Drawdown tests are provided in Tables 5, 6 and 7. A
chart showing drawdown versus pumping rate for all the wells is shown on Figure 6.
2.7.2 Upper Floridan Aquifer Performance Test
The aquifer performance test (APT) was completed in accordance with the APT Plan
approved by the South Florida Water Management District (SFWMD). The scope of
Florida Lakes Power Partners, LLC. 14 FPL Turkey Point
Expansion Project (Unit 5)
JLA Geosciences, Inc.
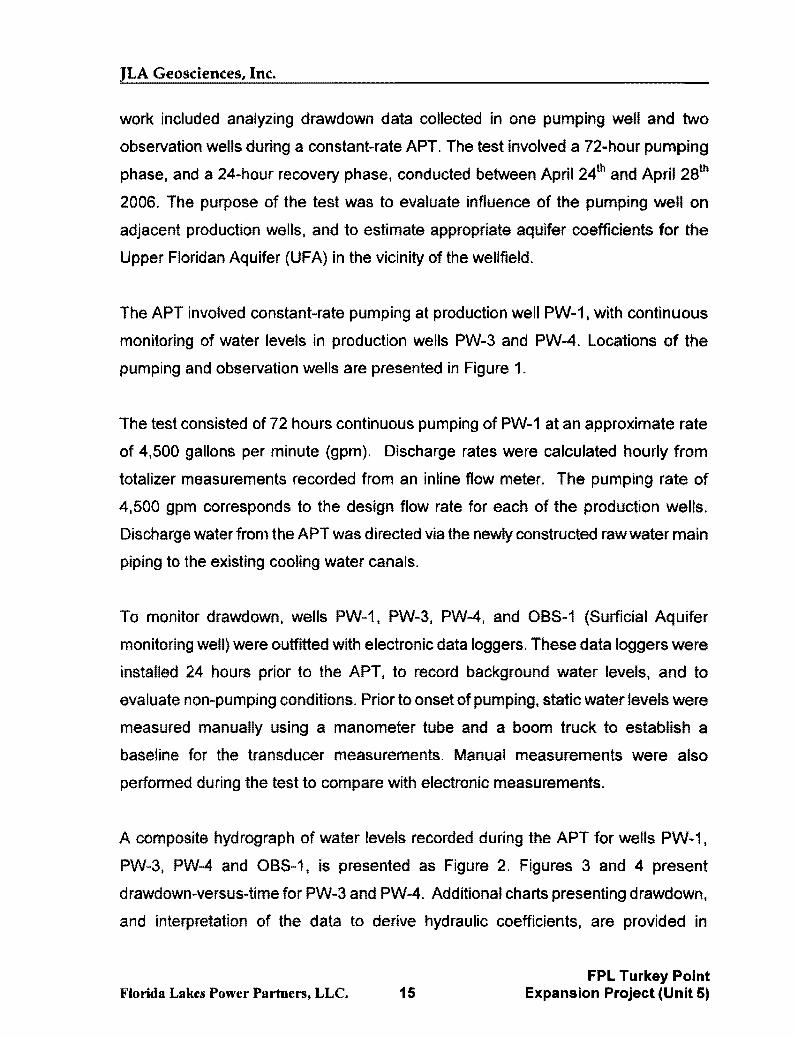
work included analyzing drawdown data collected in one pumping well and two
observation wells during a constant-rate APT. The test involved a 72-hour pumping
phase, and a 24-hour recovery phase, conducted between April241h and April 28th
2006. The purpose of the test was to evaluate influence of the pumping well on
adjacent production wells, and to estimate appropriate aquifer coefficients for the
Upper Floridan Aquifer (UFA) in the vicinity of the wellfield.
The APT involved constant-rate pumping at production well PW-1, with continuous
monitoring of water levels in production wells PW-3 and PW-4. Locations of the
pumping and observation wells are presented in Figure 1.
The test consisted of 72 hours continuous pumping of PW-1 at an approximate rate
of 4,500 gallons per minute (gpm). Discharge rates were calculated hourly from
totalizer measurements recorded from an inline flow meter. The pumping rate of
4,500 gpm corresponds to the design flow rate for each of the production wells.
Discharge water from the APT was directed via the newly constructed raw water main
piping to the existing cooling water canals.
To monitor drawdown. wells PW-1, PW-3, PW-4, and OBS-1 (Surficial Aquifer
monitoring well) were outfitted with electronic data loggers. These data loggers were
installed 24 hours prior to the APT, to record background water levels, and to
evaluate non-pumping conditions. Prior to onset of pumping, static water levels were
measured manually using a manometer tube and a boom truck to establish a
baseline for the transducer measurements. Manual measurements were also
performed during the test to compare with electronic measurements.
A composite hydrograph of water levels recorded during the APT for wells PW-1,
PW-3, PW-4 and OBS-1, is presented as Figure 2. Figures 3 and 4 present
drawdown-versus-time for PW-3 and PW-4. Additional charts presenting drawdown,
and interpretation of the data to derive hydraulic coefficients, are provided in
Florida Lakes Power Partners, LLC. 15 FPL Turkey Point
Expansion Project (Unit 5)
JLA Geosciences, Inc.
Appendix A
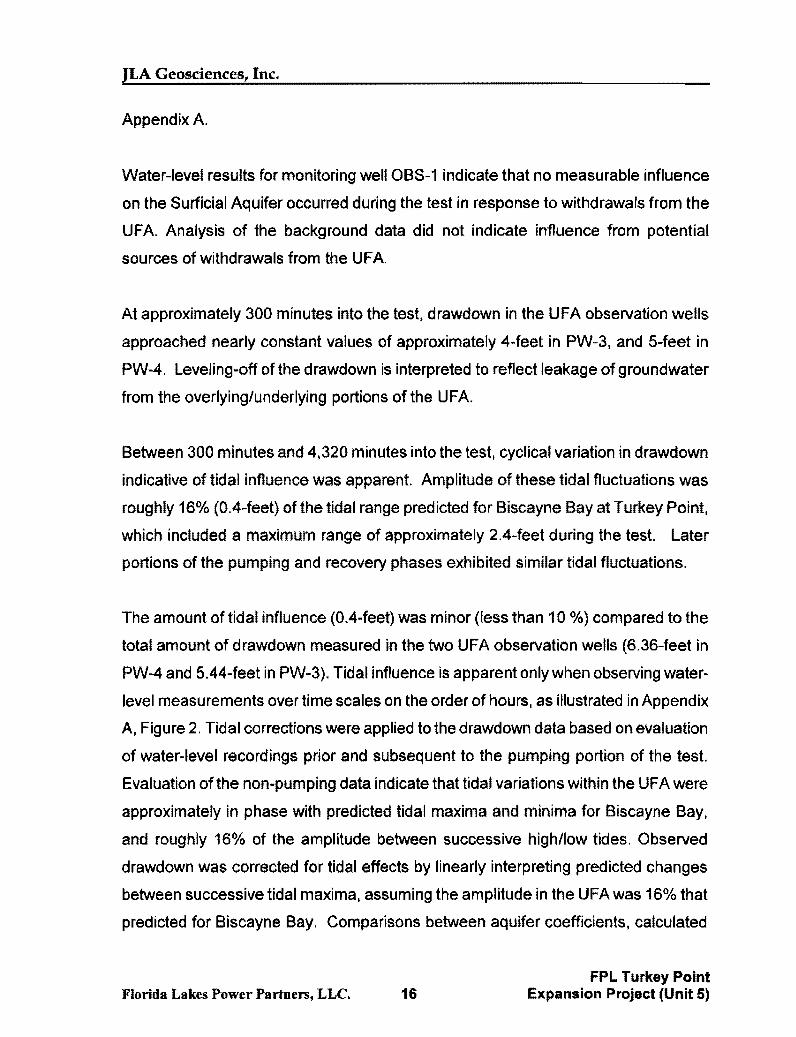
Water-level results for monitoring well OBS-1 indicate that no measurable influence
on the Surficial Aquifer occurred during the test in response to withdrawals from the
UFA. Analysis of the background data did not indicate influence from potential
sources of withdrawals from the UFA
At approximately 300 minutes into the test, drawdown in the UFA observation wells
approached nearly constant values of approximately 4Mfeet in PW-3, and 5-feet in
PW-4. Leveling-off of the drawdown is interpreted to reflect leakage of groundwater
from the overlying/underlying portions of the UFA.
Between 300 minutes and 4,320 minutes into the test, cyclical variation in drawdown
indicative of tidal influence was apparent. Amplitude of these tidal fluctuations was
roughly 16% (0.4-feet) of the tidal range predicted for Biscayne Bay at Turkey Point,
which included a maximum range of approximately 2.4-feet during the test. Later
portions of the pumping and recovery phases exhibited similar tidal fluctuations.
The amount of tidal influence (0.4-feet) was minor (less than 10 %) compared to the
total amount of drawdown measured in the two UFA observation wells (6.36-feet in
PW-4 and 5.44-feet in PW-3). Tidal influence Is apparent only when observing water
level measurements over time scales on the order of hours, as illustrated in Appendix
A, Figure 2. Tidal corrections were applied to the drawdown data based on evaluation
of water-level recordings prior and subsequent to the pumping portion of the test.
Evaluation of the non-pumping data indicate that tidal variations within the UF A were
approximately in phase with predicted tidal maxima and minima for Biscayne Bay,
and roughly 16% of the amplitude between successive high/low tides. Observed
drawdown was corrected for tidal effects by linearly interpreting predicted changes
between successive tidal maxima, assuming the amplitude in the UFAwas 16% that
predicted for Biscayne Bay. Comparisons between aquifer coefficients, calculated
Florida Lakes Power Partners, LLC. 16 FPL Turkey Point
Expansion Project (Unit 5)
JLA Geosciences, Inc.
with or without tidal corrections applied, indicate minor differences, as described in
more detail below.
2.7.3 Determination of Aquifer Properties
Calculation of aquifer properties was performed using standard methodologies. This
included the Hantush-Jacob (1955) and Hantush (1960) methods for leaky confined
aquifers, and the Cooper-Jacob (1946) method for confined aquifers. Analyses were
performed via manual graphical approaches as well as with the Aqtesolve® computer
program. Recovery data were analyzed by interpreting a straight-line plot of residual
drawdown versus the ratio of elapsed time since pumping began over elapsed time
since pumping ceased. The Theis ( 1935) curve-matching approach was not utilized
to evaluate aquifer properties because the observed data suggests the site did not
conform to the required conditions of a non-leaky confined aquifer system. A major
assumption by the Theis (1935) methodology is that all the water pumped is removed
from storage within the aquifer. This is not the case in the UFA, because of leakage
from confining units above and/or below the production zone.
Properties determined by the aquifer testing are defined as follows:
Transmissivity (T)- The measure of the rate at which water may be transmitted
through a unit width of the saturated thickness of the aquifer under a unit hydraulic
gradient;
Storativity or storage coefficient (S) - The volume of water that can be
withdrawn or injected into an aquifer per unit surface area per unit change in head. S
of a confined aquifer is typically small (0.001 or less); and
Leakance -A quantitative estimate of water that passes through semi-confining
beds (in the case of the FAS, limestone beds) above and below the well completion
Florida Lakes Power Partners, LLC. 17 FPL Turkey Point
Expansion Project (Unit 5)
JLA Geosciences, Inc.
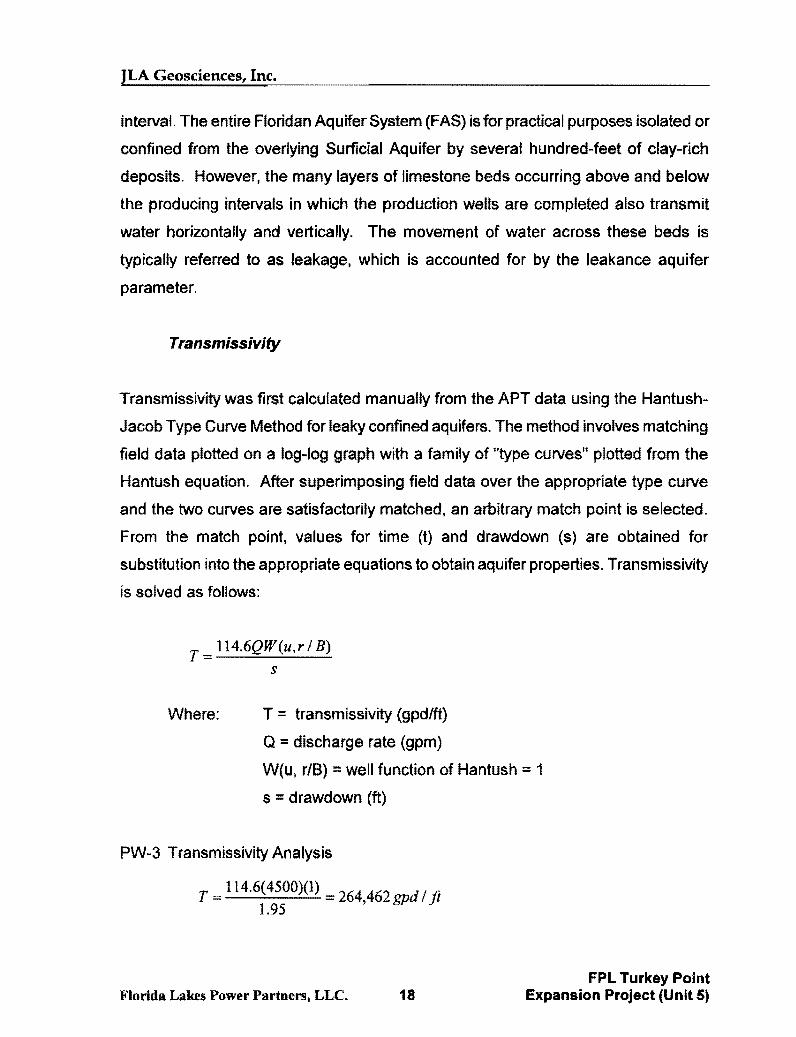
interval. The entire Floridan Aquifer System (FAS) is for practical purposes isolated or
confined from the overlying Surficial Aquifer by several hundred-feet of clay-rich
deposits. However, the many layers of limestone beds occurring above and below
the producing intervals in which the production wells are completed also transmit
water horizontally and vertically. The movement of water across these beds is
typically referred to as leakage, which is accounted for by the leakance aquifer
parameter.
Transmissivity
Transmissivity was first calculated manually from the APT data using the Hantush
Jacob Type Curve Method for leaky confined aquifers. The method involves matching
field data plotted on a log-log graph with a family of "type curves~~ plotted from the
Hantush equation. After superimposing field data over the appropriate type curve
and the two curves are satisfactorily matched, an arbitrary match point is selected.
From the match point, values for time (t) and drawdown (s) are obtained for
substitution into the appropriate equations to obtain aquifer properties. Transmissivity
is solved as follows:
T = 114.6QW(u,r I B)
s
Where: T = transmissivity (gpd/ft)
Q =discharge rate (gpm)
W(u, r/B) =well function of Hantush::: 1
s = drawdown (ft)
PW-3 Transmissivity Analysis
T = 114.6(4500)(1) = 264 462 d lft 1.95 ' gp
Florida Lakes Power Partners, LLC. 18 FPL Turkey Point
Expansion Project (Unit 5)

JLA Geosciences, Inc.
PW-4 Transmissivity Analysis
T = 114.6( 4500)(1) = 224 217 d 1ft 2.3 ' ~
Storativity
From the above results, storativity was then calculated as follows:
Where: S = storativity
r = distance from pumping well (ft)
t =time (days)
u, r/8 = well function from Hantush-Jacob curve
PW-3 Storativity Analysis
PW-4 Storativity Analysis
S 224,217 *I* .009/ ).2xl0-4 1.87 /18502
Florida Lalres Power Partners, LLC. 19 FPL Turkey Point
Expansion Project (Unit 5)
JLA Geosciences, Inc.
Leakance
From the above results, leakance was calculated as follows:
Where: K'/b' = leakance in gpd/fe
r = distance from pumping well (ft)
T =transmissivity (gpd/ft)
PW-3 leakance Analysis
K'l, = 264.462(0.3)2 =0.0025 gpd I ft3 lb (3,100)2
PW-4 Leakance Analysis
K'/1 = 224,217(0.3)2 = 0.0059 gpd I ft3 lb (1,850)2
Additional estimates of these aquifer coefficients were derived using the Aqtesolve®
program, as well as manual evaluation of the recovery data. A summary of the
calculated aquifer properties is provided in Table 8.
2.7.4 Aquifer Properties Summary
Drawdown data from observation wells are considered optimal for estimating aquifer
properties of transmissivity and storage, while recovery data are typically utilized in
the absence of suitable drawdown data, or for single-well APTs. The drawdown data
Florida Lakes Power Partners, LLC. 20 FPL Turkey Point
Expansion Project (Unit 5)

JLA Geosciences, Inc.
from PW-3 and PW-4 appear to be of high quality, and therefore have been applied
as the preferred data available for calculating aquifer properties.
Results presented in Table 8 indicate that different values for aquifer coefficients are
calculated depending on the methods used in the analyses. These differences likely
reflect contrasting assumptions involved with each technique, as well as subtleties
inherent in the interpretation of matches between observed and computed data. For
example, the Cooper-Jacob methodology assumes a confined aquifer with no
leakage; the Hantush method assumes an aquifer with leakage derived from storage
within the confining beds; and the Hantush-Jacob method assumes an aquifer with
leakage derived from flow within or across confining beds, but not from confining-bed
storage.
Results presented in Table 8 indicate that aquifer transmissivity values determined by
the Hantush-Jacob and Hantush methodologies are slightly lower than those
estimated using alternative approaches. A prime reason for the slightly lower T values
for these approaches is that they account for leakage, whereas the other approaches
do not.
Closest agreement between observed data and theoretical type curves is indicated
for the Hantush-Jacob solution, which applies to leaky confined aquifers.
Consequently, aquifer parameters derived from this approach appear representative
of hydraulic properties that may be used for various applications such as groundwater
flow modeling.
Averaged values of aquifer properties determined by the Hantush-Jacob method,
presented in Table 8, are summarized as follows:
Florida Lakes Power Partners, LLC. 21 FPL Turkey Point
Expansion Project (Unit 5)

JLA Geosciences, Inc.
From the APT
Aquifer Parameter APT Results
Transmissivity 244,000 gpd/ft
Storativity 2.0 X 10⁻⁴
Leakance 5.0 X 10 -3gpd/ft3
The transmissivity results are consistent with the relatively high specific capacities
measured in the new production wells. The transmissivity and storativity values also
fall within the range of values reported in the literature for the UFA. The leakance
values derived from the APT also appear to be within the range expected for a well
completed within a portion of the UFA.
Appendix A, Figures 5 through 8 illustrate the influence of tides on aquifer coefficients
derived from the APT analysis, by comparing a tidal-corrected data set for each
observation well, with one not corrected for tidal influence. Results are presented for
the Hantush-Jacob solution, which as described previously corresponds to the
approach resulting in optimal agreement between observed drawdown and applicable
type curves. Evaluation of aquifer coefficients calculated using corrected versus
uncorrected data, indicate virtually identical results, suggesting minimal influence by
tides on the interpretation of the APT data.
2.8 Geophysical Logging
Geophysical logs were performed in the pilot hole and/or reamed hole at each stage
of well construction. The logs were used to aid in the decision-making and data
gathering process to determine hole dimensions, casing setting depths, geologic
formation characteristics, water quality, flow zone and aquifer characteristics. After
completion of pilot hole drilling into the top of the Floridan Aquifer, a suite of
Florida Lakes Power Partners, LLC. 22 FPL Turkey Point
Expansion Project (Unit 5)

JLA Geosciences, Inc.
geophysical logs was performed. This suite of logs included: dual induction and fluid
resistivity logs; self potential (SP} and natural gamma ray and were run by MV
Geophysical Services in each well. A caliper log was performed after the pilot hole
had been reamed before intermediate and FRP casing installation. Heat trace
temperature logs were run after each of the first three grouting stages for both the
Intermediate and FRP casings in wells PW-4 and PW-1. The last suite of
geophysical logs was conducted after completion of drilling the open interval, and
included dual induction and fluid resistivity logs; self potential, natural gamma,
temperature, caliper and flow. Geophysical, video, flow and caliper logging was
performed on each well by MV Geophysical Service. A JLA hydrogeologist observed
logging runs. Electronic copies of the geophysical logs for each well are included in
Appendix C.
The fluid flow logs revealed the presence of several zones of enhanced production in
each of the 3 wells extending downward from approximately 1 , 020 to 1,040-feet B LS,
1,150 to 1 ,204-feet BLS and 1 ,225 to 1,231-feet BLS with a combined thickness of
about 80-feet. The geophysical logs were performed under flowing conditions.
2.9 Video Logs
Following the completion of each well, MV Geophysical Services performed a down
hole video. The videos were performed under flowing and/or non-flowing conditions.
In each of the video logs indications of flow were evident in the 1,020 to 1 ,040-feet
BLS, 1,150 to 1,204-feet BLS and 1,225 to 1,231-feet BLS intervals with little
evidence of flow below 1,231-feet. Evidence of cement grout was generally limited to
the area at and just below the base of the 24-inch casing and the casing in each well
appeared to be in good condition following completion of the wells. With respect to
the casing condition following construction, all three wells had very minor construction
related damage to the inner wall of the fiberglass casing associated with the drilling
tools. The damage consisted of scrapes and shallow gouges estimated to be at the
Florida Lakes Power Partners, LLC. 23 FPL Turkey Point
Expansion Project (Unit 5)
JLA Geosciences, Inc.
most 1/8 inch in depth. This type of damage is unavoidable when constructing wells
with non ferrous casings. The minor damage that was visible in the video surveys is
considered typical and will not affect the long term use of the wells. Several areas of
solution cavities and vertical fractures could be seen in the flow zone intervals of
each well. A brief summary of each video including casing depths is provided below.
DVD copies of the video logs are provided in Appendix F.
2.9.1 PW-3 Video
The video log of well PW-3 was performed on February 10, 2006 following
completion of the well. This log indicated that the base of the 24-inch FRP casing was
at 1,005-feet BLS and that the casing was in good condition .. The depth indicated
was slightly deeper than previously measured (1 ,003-feet} and it is likely that the
depth indicator was less accurate than previous measurements. There was no visible
evidence that the casing was damaged or leaking due to the grouting issue
(discussed in Section 2.2 and Appendix B) between 875 to 630-feet BLS.
2.9.2 PW-4 Video
The video log of well PW-4 was performed on May 5, 2006 following completion of
the well. This log indicated that the base of the 24-inch FRP casing was at 1,017 -feet
BLS and that the casing was in good condition from top to bottom. As was the case in
PW-3, the depth indicated was slightly deeper than previously measured (1 ,015-feet).
The open hole section of well PW-4 was showed several zones of large vuggs and
smooth borehole walls due to the double acidization procedure.
2.9.3 PW-1 Video
The video log of well PW-1 was performed on May 6, 2006 following completion of
the well. This log indicated that the base of the 24-inch FRP casing was at 1, 003-feet
Florida Lakes Power Partners, LLC. 24 FPL Turkey Point
Expansion Project (Unit 5)
JLA Geosciences, Inc.
BLS and that the casing was in good condition from top to bottom. The open-hole
section was very clean with very minor amounts of dislodged material visible. The
PW-1 video also confirmed that a section of 1·inch diameter, schedule 40 and 80
PVC pipe was lodged into the borehole between 1,006-feet to 924-feet BLS below
the base of casing. The total length of the PVC pipe was 1 00-feet. DOC performed
calculations to substantiate leaving the PVC pipe in the well and JLA concurred that
leaving the pipe in the well would do no long term harm to the well or pumping facility.
3.0 HYDROGEOLOGY
Southeastern Miami/Dade County has two aquifer systems, the unconfined Biscayne
Aquifer/Surficial Aquifer System and the Floridan Aquifer System. The drilling phase
of the project penetrated these aquifers to a depth of 1,247-feet. A JLA geologist
was present during key phases of the drilling to collect lithologic samples and log the
geologic formation materials encountered. Lithologic logs of each well are provided
in Appendix D. A hydrostratigraphic section showing the typical lithologies, aquifers
and formation names encountered during drilling is provided as Figure 7.
3.1 Biscayne Aquifer
In the study area, descending from land surface, the Biscayne Aquifer System
formations include the Miami Limestone/Oolite, Anastasia/Fort Thompson, (all
Pleistocene Age) and upper portions of the Tamiami (Pliocene to Miocene Age)(Fish
and Stewart, 1991).
In the study area, the Miami Formation is approximately 30-feet thick and composed
of white to pale orange, dissolutioned limestone. Regionally, the Miami Limestone
overlies the limestone units of the Fort Thompson formation and/or possibly of the
similar aged Anastasia or Key Largo Formations. These formations make up the
Florida Lakes Power Partners, LLC. 25 FPL Turkey Point
Expansion Project (Unit 5)

JLA Geosciences, Inc.
producing zone of the Biscayne aquifer. In the study area, the Miami Limestone
overlays the limestone units of the Fort Thompson Formation.
Regionally the units that underlie the Fort Thompson are the Tamiami Formation
(Pliocene to Miocene age} and/or the formations of the Hawthorn Group (Miocene
age). In the study area the Tamiami Formation is approximately 155-feet thick,
extending to a depth of 225-feet BLS. Tamiami lithologies consist of sandy
limestone, calcareous sandstone, shells and sand. With depth, these units undergo
a downward fining trend and ultimately become the underlying confinement of the
Biscayne Aquifer. The basal confining unit of the Biscayne Aquifer occurs at
approximately 225-feet beneath the site. From this depth, interbedded clay,
limestone, and sandstone marl predominate. The Biscayne Aquifer is saline
underlying the site.
3.2 Intermediate Confining Unit
The intermediate confining unit consists of the relatively impermeable calcareous
clays and silts of the Hawthorn Group. The Miocene to late Oligocene aged
Hawthorn sediments consist of dense, olive gray clayey unlithified limemud, fine to
very fine quartz and phosphate sand and silt. Also present are beds of shelly/sandy
limestone within the upper and lower reaches of the unit. The thickness of the
intermediate confining unit is approximately 730-feet, which extends to a depth of
910-feet beneath the site. The predominantly clayey upper section of the unit is
known as the Peace River Formation. The phosphatic limemuds and sandy
phosphatic limestones that underlie the Peace River are of the Arcadia Formation.
These occur to a depth of 91 0-feet BLS and although they are part of the Hawthorn
Group, the permeable beds are considered part of the Floridan Aquifer and may
produce considerable amounts of water.
Florida Lakes Power Partners, LLC. 26 FPL Turkey Point
Expansion Project (Unit 5)
JLA Geosciences, Inc.
3.3 Floridan Aquifer System
The Floridan Aquifer System, a confined aquifer. underlies the intermediate confining
unit. The brackish upper portion. having total dissolved solids concentrations less
than 5,240 mg/1, is called the upper Floridan Aquifer (Reese, 1994}. The entire
thickness of the upper Floridan was not penetrated during drilling. The upper
Floridan is predominantly composed of interbedded limestone and dolomite of early
Oligocene to middle Eocene age. In the study area, two primary rock units comprise
the upper Floridan Aquifer System. From approximately 91 0-feet beneath the site. in
descending order, these units are the Basal Hawthorne Unit (late Oligocene
age)/Suwannee Limestone (early Oligocene age) and Avon Park limestone (middle
Eocene age) (Reese, 1994, 2000). The uppermost rock unit was cased off by the
final casing string because of poor consolidation.
The maximum depth that was penetrated during drilling was 1,247-feet BLS. The
lithology approaching the terminus of the well consisted of interbedded,
microcrystalline limestone and dolomite.
The producing zones within the Floridan aquifer can generally be referred to as "flow
zones". A flow zone is typically a thin sequence of highly solutioned rock where
water, flowing within the aquifer, is concentrated. Numerous thin flow zones may
contribute water to the open interval of a well and often times a high percentage of
the water produced by the well comes from one or two thin flow zones.
Based on the lithologic logs, geophysical logs and wellhead flow data, the most
productive flow zones occurred between approximately 1,020-feet and 1,230-feet
BLS. These depths correspond to the same highly productive zones of the Avon Park
Limestone found in wells PW·3. PW-4 and PW-1.
Florida Lakes Power Partners, LLC. 27 FPL Turkey Point
Expansion Project (Unit 5)

JLA Geosciences, Inc.
Because the flow zones are typically separated from each other by continuous
sequences of low permeability strata, water quality may vary significantly with depth.
Water quality decreases with depth as was found in similar wells drilled south of the
well field at Key Largo.
3.4 Floridan Aquifer Head Pressures
Prior to performing step drawdown testing, static water levels were measured in each
of the Floridan Aquifer Wells. Water levels were physically measured using a
manometer tube and measuring tape. Additionally, each of the wells was fitted with a
pressure transducer and data logger to measure and record water levels before,
during and after pump testing of each well. FLPP field staff performed surveying of
the well casings. Water levels and land surface elevations have been referenced to
NGVD 1929 and are summarized below:
Well Land Surface Elevation Static Water Level Elevation
(Feet NGVD) (Feet NGVD) I Date
PW-1 +6.0 + 49.8/ Apr. 24, 2006
PWR +2.65 + 49.4 I Apr. 24, 2006
PW-4 +6.5 + 49.5 I Apr. 24, 2006
The 0.4-feet difference in water levels is attributable to tidally influenced water level
fluctuation in the aquifer visible during the APT. To determine seasonal water level
fluctuations, longer term water level monitoring (at least one year duration) must be
performed. The amount of tidal fluctuation during the APT was about 0.4-feet.
4.0 FLORIDAN AQUIFER WATER QUALITY
There were three main elements of the water quality sampling program implemented
during construction of the Floridan Aquifer wells. A summary of the program
Florida Lakes Power Partners, LLC. 28 FPL Turkey Point
Expansion Project (Unit 5)
JLA Geosciences~ Inc.
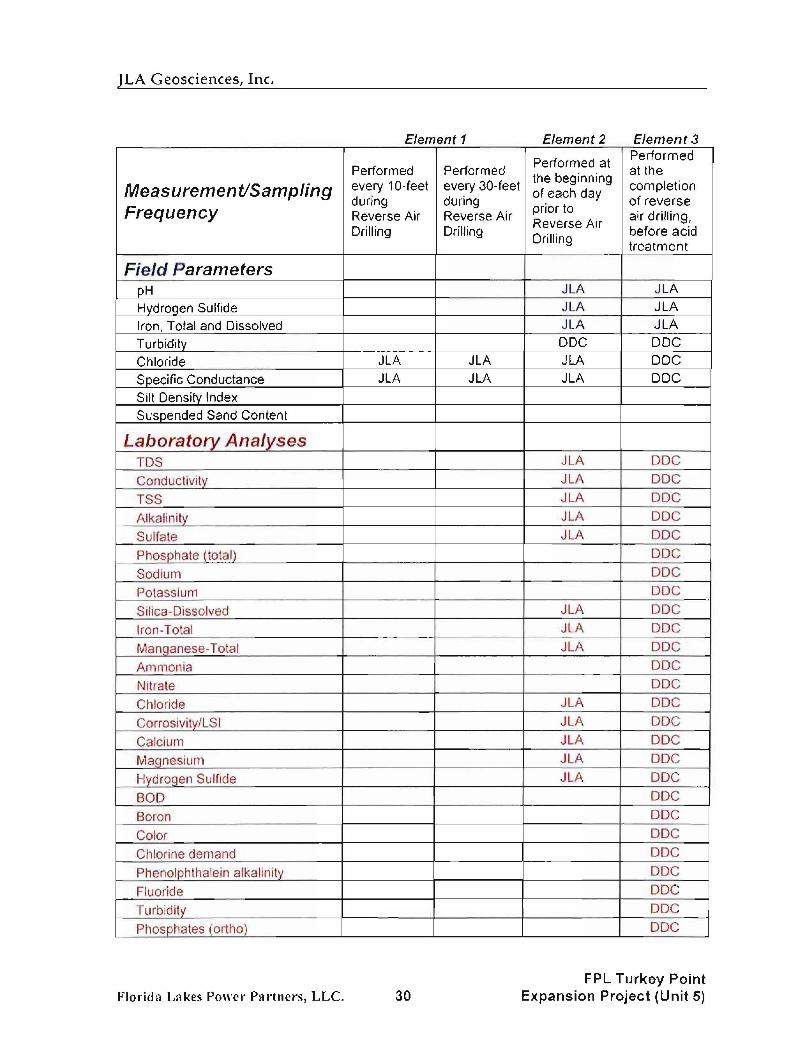
elements is provided on the following page. The first element included the
measurement field parameters in water samples collected during drilling of the
completion interval. The drilling water quality program was described in detail in
Section 2.3, Drilling Water Quality Testing. The first element enabled the project
team to monitor water quality almost continuously and in real time so that the
completion depth of the well would be based on water quality concerns as well as
capacity. The second element provided engineering design staff a more
comprehensive set of water quality analyses during drilling of the completion interval.
The samples were collected following an extended period of Floridan Aquifer artesian
flow (generally overnight) to obtain a water samples for laboratory analysis. The
parameters identified in the analyses were considered critical to the number of cycles
of concentration for the cooling water. By reducing the concentration of the critical
parameters (identified in Element 2 above). the cooling water system could be run
more efficiently saving capital, operational and maintenance costs and water. Copies
of the certified analytical laboratory reports are provided in Appendix H.
The third element identified in the water sampling program included a comprehensive
set of water quality analyses performed by a certified analytical laboratory. The water
samples were the responsibility of DDC under its subcontract agreement to FLPP.
The third element included all of the parameters of the prior two elements. JLA
assisted DDC with the field measurements and the subcontracted laboratory were
Elab, Inc., Ormond Beach, Florida, and KSA Environmental Laboratory, Miramar,
Florida. Copies of the certified analytical laboratory reports are provided in Appendix
H.
Field water quality measurements, identified in Element 1 above are summarized in
Tables 2, 3 and 4. Additional field water quality measurements including hydrogen
sulfide (H2S), iron, pH, temperature, turbidity, silt density index (SDI), sand content,
specific conductance and chloride were performed during pump tests on each well.
Florida Lakes Power Partners, LLC. 29 FPL Turkey Point
Expansion Project (Unit 5)
JLA Geosciences, Inc.
Element 1
Performed Performed
Measurement/Sampling every 1 0-feet every 30-feet during during
Frequency Reverse Air Reverse Air Drilling Drilling
Field Parameters pH HydroQen Sulfide Iron. Total and Dissolved Turbidity Chloride JLA JLA
Specific Conductance JLA JLA
Silt Density Index Suspended Sand Content
Laboratory Analyses TDS Conductivity
TSS
Alkalinity
Sulfate
Phosphate (total)
Sodium
Potassium
Silica-Dissolved
Iron-Total Manganese-Total
Ammonia
Nitrate
Chloride
Corrosivity/LSI
Calcium
MaQneslum Hydrogen Sulfide
BOD
Boron
Color
Cl1lorine demand
Phenolphthalein alkal inity
Fluoride
Turbidity
Phosphates (ortho)
Florida Lakes Power Pa~·tners, LLC. 30
Element 2 Element3
Performed at Performed at the the beginning completion
of each day of reverse prior to air drilling, Reverse Air
Drilling before acid treatment
JLA JLA JLA JLA JLA JLA DOC DOC JLA DOC JLA DOC
JLA DOC
JLA DOC
JLA DOC
JLA DOC
JLA DOC
DOC
DOC
DOC
JLA DOC
JLA DOC
JLA DOC
DOC
DOC
JLA DOC
JLA DOC
JLA DOC
JLA DOC
JLA DOC
DOC
DOC
DOC
DOC
DOC
DOC
DOC
DOC
FPL Turkey Point Expansion Project (Unit 5)

JLA Geosciences~ Inc.
The water quality data are summarized on Tables 5, 6 and 7. Laboratory data for
each well are summarized on Table 9.
5.0 CONCLUSIONS
5.1 Conclusions
The following conclusions are made based on results of the drilling and testing
conducted during wellfield construction.
1. Floridan Aquifer production wells, PW-1, PW-3 and PW-4 were constructed
for the FLPP/FPL Turkey Point Expansion Project (Unit 5) between July 2005
and May 2006. The well completion depths are summarized as follows:
Well FRP 24" Dia. Casing Total Depth of
Depth (feet BLSJ Completion (feet BLSJ
PW-1 1,003-feet 1,242-feet
PW-3 1,003-feet 1,246-feet
PW-4 1,015-feet 1,243-feet
2. At design the design pumping rate of 4,500 gpm the specific capacities of the
Floridan Aquifer production wells, when pumped for the durations specified
herein, are summarized as follows:
Well Design Pumping Rate
PW-1 4,500 gpm
PW-3 4,500 gpm
PW-4 4,500 gpm
Florida Lakes Power Partners, LLC. 31
Specific Capacity
102.6 gpm/ft
70.3 gpm/ft
46.7 gpm/ft
FPL Turkey Point Expansion Project (Unit 5)

JLA Geosciences, Inc.
3. The averaged aquifer properties that were determined in the analysis of the
aquifer performance test are summarized as follows:
Aquifer Parameter
Transmissivity
Storativity
Leakance
APT Results
244,000 gpd/ft
2.0x10⁻⁴
5.0 X 10 -3gpd/ft3
4. Acid treatment was highly effective in wells PW-4 and PW-1 with 91 percent
and 56 percent improvement in capacity respectively. PW-4 was treated
twice. PW-3 only showed a modest gain of 7 percent. The primary reason for
the increased effectiveness in PW-4 and PW-1 was that PW-4 was acid
treated twice and that less water was added during acid pumping.
5. The chloride concentration in the groundwater sample collected from each
well after pump testing was approximately 1,020 mg/1 for PW-3, 1,170 mg/1 for
PW-4, and 990 mg/1 for PW-1.
6. Total hydrogen sulfide concentration in the water from each of the three wells
was consistently 1.0 ppm. The laboratory reported lower concentrations of
H2S however because the parameter is highly volatile, the field method is
more reliable.
7. Rossum Sand test results for each well can be expected to be at or below a
value of 1.0 ppm when pumped at the design flow rate of 4,500 gpm.
Temporary higher concentrations of sand can be expected upon startup of the
well.
Florida Lakes Power Partners, LLC. 32 FPL Turkey Point
Expansion Project (Unit 5)
JLA Geosciences, Inc.
8. During testing, the static head measured in each of the three wens was +49.4-
feet NGVD for PW-3; + 49.5-feet NGVD for PW-4; + 49.8-feet NGVD for PW-
1. These measurements were determined by both physical measurement and
with the use of a pressure transducer and data logger. Elevations were
surveyed by FLPP.
9. Tidal fluctuation in the Floridan Aquifer was determined to be 0.4-feet.
10. The flow entering the wells is produced from flow zones in a 205-feet thick
sequence of dolomite and limestone beds in the Avon Park Limestone. Based
on the flow logs and video logs, the most productive flow zones were
encountered at an upper depth of 1 ,020-feet in the wells.
Florida Lakes Power Partners, LLC. 33 FPL Turkey Point
Expansion Project (Unit 5)
JLA Geosciences, Inc.
6.0 REFERENCES
Cooper, H.H., Jr., 1963. Type curves for non steady radial flow in an infinite leaky
artesian aquifer, et al. U.S. Geological Survey Water Supply Paper 1545-C, p.
C48-C55.
Fish, J.E., and Stewart, M., 1991, Hydrogeology of the surficial aquifer system, Dade
County, Florida, U.S. Geological Survey, Water Resources Investigations
Report 90-41 08.
Freeze, RA., and J.A. Cherry. 1979. Groundwater. Prentice-Hall, Inc., Englewood,
N.J. 604 pp.
Hantush, M.S., and Jacob, C. E., 1954. Analysis of data from pumping test in leaky
aquifers. Am. Geophys. Union Trans. v. 35, no. 6, p. 917-936.
Hantush, M.S., 1960. Modification of the theory of leaky aquifers, Jour. of Geophys.
Res., val. 65, no. 11, pp. 3713-3725.
Hantush, M.S .• 1961a. Drawdown around a partially penetrating well, Jour, of the
Hyd. Dev., Proc. Of the Am. Soc. Of Civil Eng., val. 87, no. HY4, pp. 83-98.
Hantush, M.S., 1961 b. Aquifer tests on partially penetrating wells. Jour, of the Hyd.
Dev., Proc. Of the Am. Soc. Of Civil Eng., val. 87, no. HYS, pp. 171-194.
Lichtler, W.F. 1960. Geology and Ground-Water Resources of Martin County,
Florida. U.S. Geological Survey Report of Investigations No. 23.
Miller, W. L. 1980. Geologic Aspects of the Surficial Aquifer in the Upper East Coast
Planning Area, Southeast Florida. U.S. Geological Survey Open File Report
80-586, 2 Sheets.

Nealon, D., Shih, G., Trost, S., and others 1987. Martin County Water Resource
Assessment, Martin, Florida. South Florida Water Management District,
Resource Planning Department
Parker, G.G., G.E. Ferguson, S.K. Love and others. 1955. Water resources of
Southeastern Florida. U.S. Geological Survey Supply Paper 1255.
Reese, R.S. 1994. Hydrogeology and Distribution of Salinity in the Floridan Aquifer,
Southeaster Florida. U.S. Geological Survey Water Resources Investigations
Report 94-4010.
Reese, R.S., S.J. Memberg. 2000. Hydrogeology and the Distribution of Salinity in
the Floridan Aquifer System, Palm Beach County, Florida. U.S. Geological
Survey Water Resources Investigations Report 99-4061.
Theis, C.V., 1935. The relationship between the lowering of the piezometric surface
and the rate and duration of discharge of a well using groundwater storage,
Am. Geophys. Union Trans., val. 16, pp. 519-524.

FIGURES
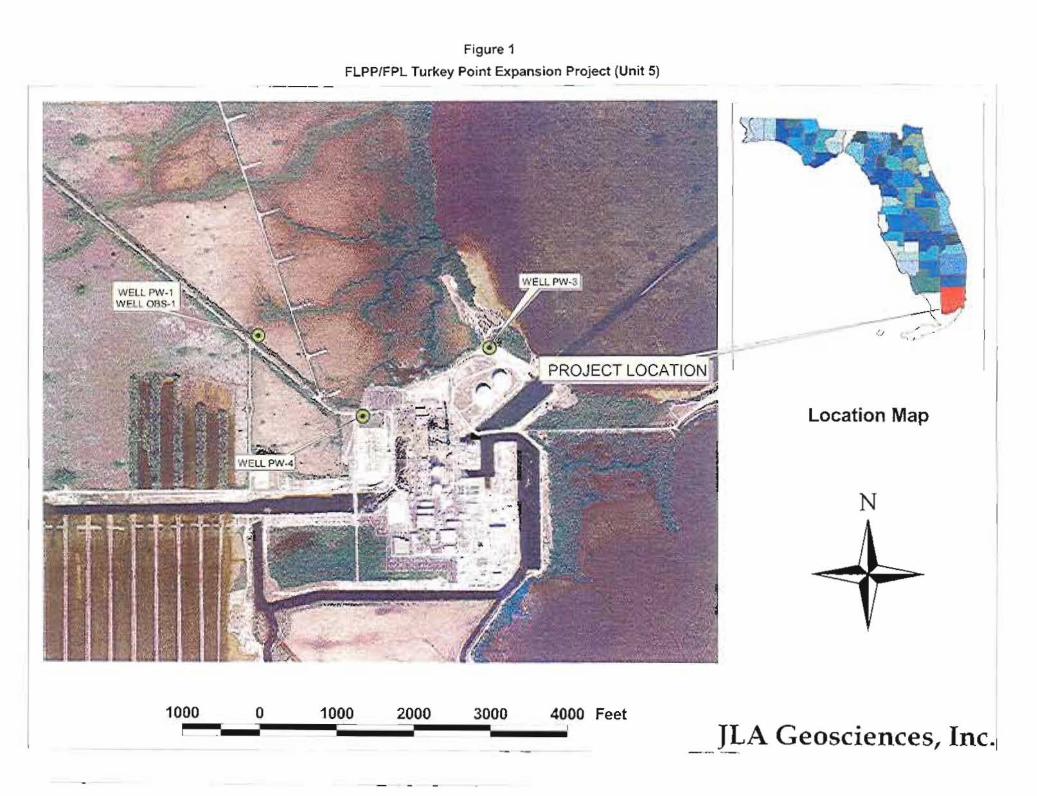
Figure 1
FLPP/FPL Turkey Po int Expansion Project (Unit 5)
Location Map
N
1000 0 1000 2000 3000 4000 Feet
JLA Geosciences, Inc.1
1--
r-tOO 1--
r-200 ~
r--JOO ~
I-- u _400 ~
~ - :::l
rJ)
-500 c - z
< -600 ..J
- ~ 0
-700 ~ t;:J
r-- co r
~soo I:;J
~ - z -900 -'
:I: - r -IOoo Q.,
~ Q -
-1100 --1200 --
LEGEI\ D: !
L_j
~ D D
EXISTING GRADE 1// %/j~ 60 INCH DIAMETER BORE HOLE ~:/:~~------48 INCH DIAMETER STEEL ~:/· SURFACE CASING TO 50' DEPTH
~~~ ~ ;7 36 INCH DIAMETER STEEL [/; '/: CASING TO 302' DEPTH
~~ // • ._.· ,..------ --46 INCH DIAMETER BORE HOLE
0~ /' )...,.~t---------CEMENT GROUT / .
~ /_..,._t-- ----- -35 INCH DIAMETER BORE HOLE
3 /_ -
I
241NCH DIAMETER FRP CASING TO 1005' DEPTH
POTENTIALLY UNGROUTED ..,._I----------SECTION FROM 630'-875' DEPTH
- 231NCH DIAMETER OPEN HOLE ioii-1--- - - -----SECTION FROM 1005'-1247' DEPTH
FRP WELL CASING JLA Geosciences, Inc.
CEMENT GROUT SCALE: L J INTERMEDIATE CASING AS SHOWN
SURFACE CASING D POTENTIALLY DRAW~' BY: JWF UNGROUTED
DATE: 05/26/06 OPEN BORE HOLE
02 DWG #:
PROJECT SIT£: PROJECT i\0:
FLPP/FPL TURKEY POINT EXPANSION PROJECT (UNIT 5), WELL PW-3 05-015
FIGURETITLE: riGllREi\0:
WELL PW-3, CONSTRUCTION DETAIL 2
~ u ~ IX ;:I (/)
Q z «t: ..J
~ :s 0 ..J !/ . ~ Q:l ~ ~
~ ~ z. r· ' ::r: ~ F-c.. r ~ Q
~ ~ -
L_j FRP WELL CASING
~ CEMENT GROUT
D SURFACE CASING
D OPEN BORE HOLE
~
EXISTING GRADE 60 INCH DIAMETER BORE HOLE
~------48 INCH DIAMETER STEEL SURFACE CASING TO 50' DEPTH
CEMENT GROUT
46.51NCH DIAMETER BORE HOLE
36 INCH DIAMETER STEEL CASING TO 446' DEPTH
351NCH DIAMETER BORE HOLE
241NCH DIAMETER FRP CASING TO 1015' DEPTH
231NCH DIAMETER OPEN HOLE SECTION FROM 1015'-1243' DEPTH
JLA Geosciences, Inc. SCALE: L ] INTERMEDIATE CASING f-------...,
AS SHOWN
0 ATE: 05/26/06
0\\'G #: 3
PROJECT SIT£: PROJECT NO:
FLPP/FPL TURKEY POINT EXPANSION PROJECT (UNIT 5), WELL PW-4 05-015
FIGURETITLE: FIGURENO: WELL PW-4, CONSTRUCTION DETAIL 3
EXISTING GRADE 60 INCH DIAMETER BORE HOLE
/"AI"-------481NCH DIAMETER STEEL SURFACE CASING TO 50' DEPTH
..4--------46.5 INCH DIAMETER BORE HOLE
J~-------36 INCH DIAMETER STEEL CASING TO 452' DEPTH
.....---------35 INCH DIAMETER BORE HOLE
241NCH DIAMETER FRP r-.---------CASING TO 1003' DEPTH
ll FRP WELL CASING
~ CEMENT GROUT
D SURFACE CASING
D OPEN BORE HOLE
231NCH DIAMETER OPEN HOLE SECTION FROM 1 003'-1242' DEPTH
JLA Geosciences, Inc.
n SCALE:
J INTERMEDIATE CASING AS SHOWN
DRAWN ll\': JWF
DATE: 05/26/06
DWG #: 4
PROJECT SITE: PROJECT NO:
FLPP/FPL TURKEY POINT EXPANSION PROJECT (UNIT 5), WELL PW-1 05-015
FIGUR£TITLE: FJGUR£;'\0:
WELL PW-1, CONSTRUCTION DETAIL 4
f--
1-20 ~
--40 ~
-60 ~
-80 -
-100 -
-120 -
-140 -
-160 -
-180 -
-200 -
-220 -
-240 -
-u:c E~ o:
~ u :< ~ 0::: ;;. 'J:;
Q ;l: -<(. ...J
~ 0 ....J ,_, -co r-. ~ ~ {;r..
z ..... ~
:I: f-< 0.. '-l Q
I r· '
~~~~1 ... .... .... \. ~. ............ 1 ~~~~~ ............ 1 ................ ( ............... ~ ~~~~i ~~~~{ ~~~~i
t I ' ~ ................ ~.... ............. ~ ............. ~ ............ ~ ;& ........... , I~'\, 'lo, .... •
t~~~~ ~.,. ...... , .. ............. ., l. ........... .., ~... .............. l.\. ...........
(~~~~
____ 4 INCH LOCKABLE ALUMINUM COVER
EXISTING GRADE
- -2' X2' CONCRETE PAD
..,, ....... vt ~ ,, .... ~~~~] f~~ .... ~ ~----------BENTONITE GROUT
" .......... f~::::~:
!...\."'-' ·'"'' .... \. """· l'.'\.\."' , . ..,.'\.\. ""I ~~~~~ -'""' '\'\.'\.'
'''' ''"''" ~ ~---------5-7/8 INCH DIAMETER BORE HOLE "'"' , ......... ''''· '''"' ""f
,,,, .,,,, t"'' .. , ..... , ............ ~ ............. ~m: ,, ... , .. , ........ ... ....... ........... ....... , . .. , ........ ... ...... ~
~, ...... '''" ................. ... .... , .. ,, .... , ( ........ , .. ,, ...... ~'''"1 ,,,, '''"~ '" ...... ... ...........
............. , ...... ,~ , ... , ... (,,, .. lo..'-'\.'- t~~~~ ~o.,,,,
'""'l ~~~~~ .... "''" . _,...,, (,, .......... "'"" ~~~~:
2 INCH DIAMETER PVC ._ __________ CASING TO 220' DEPTH
.. ,,,~ ~~~~~ E~~~~ , ........... t"'''"' ................ .... ........ ....... , .... , ........ ..: ............. t ............... ...... _ ....... ~ .... , ...... ................ t .............. ............. !. ............ ............... t'"' ............... ... ........ ~ ............ .............. J ............. ~~~~= ............. ........... ... ....... ........... c .......... ........... ~ ......... ~ ............ ... ......... ............ ~ ........... ~~~~1
.......... 1 . ............ ~"'·' ............ ( ......... ..,
...... , ... ... ...... ·~ ............ L-..-.., .. ~... ......... r~~~~ ............. .. , ...... ~~~~= ........... ........... . .......... ........... ......... '\." .. , ........ ~~~~~ "'''-,,,... f''''
':'tfJ';'t . ..e-----------2 INCH DIAMETER 0.01 SLOT
PVC SCREEN, INTERVAL FROM 220'-240' DEPTH
FRP WELL CASING JLA Geosciences, Inc.
SCALE:
BENTONITE GROUT AS SHOWN
t:\:::{~.::;:j GRAVEL PACK DRAWl\" BY: JWF
DATE:
SCREEN INTERVAL DWG #:
05/26/06
4
PROJECT SIT£: PROJECT ~0:
FLPP/FPL TURKEY POINT EXPANSION PROJECT (UNIT 5), WELL OBS-1 05-015
FIGt:RE TITLE: FIG LIRE \"0: WELL OBS-1 CONSTRUCTION DETAIL 5
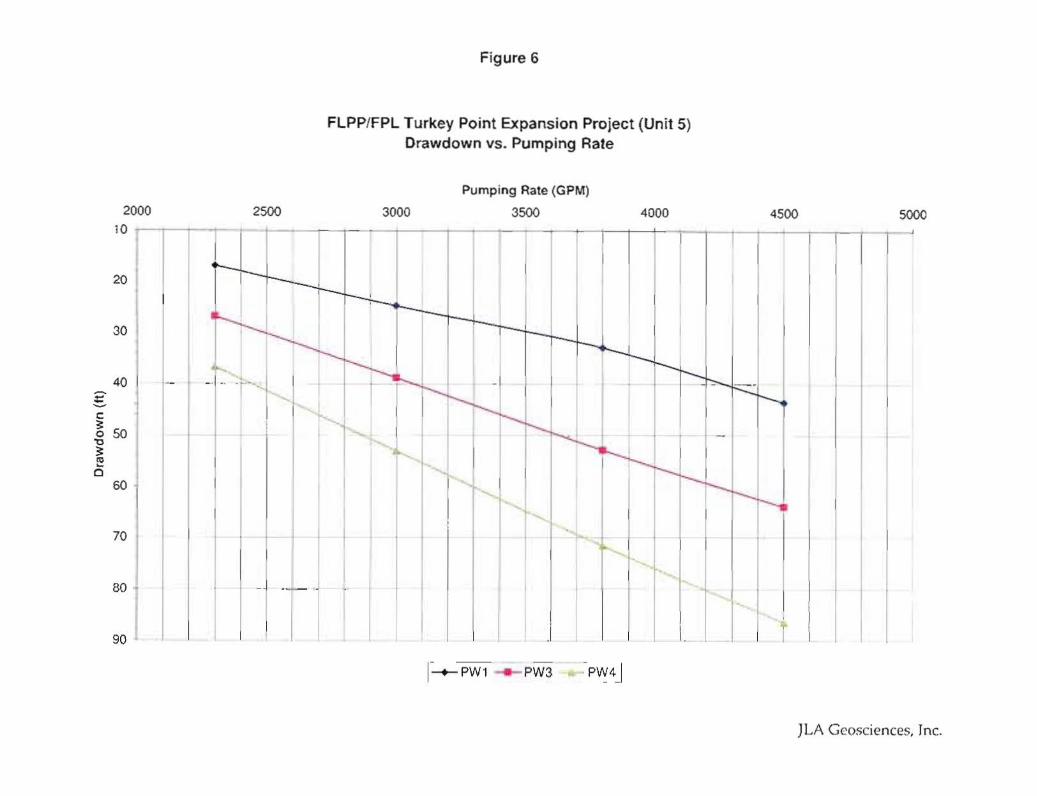
2000 10
20
30
70
80 .
90
2500
Figure 6
FLPP/FPL Turkey Point Expansion Project (Unit 5) Drawdown vs. Pumping Rate
3000
Pumping Rate (GPM)
3500
PW3
4000 4500 5000
)LA Geosciences, Jnc.

GEOPHYSICAL LOGS WELL CONSTRUCTION
lr...aMMJI. X·Y FLOW PW OBS 1 RESISTIVITY CALIPER PW-1 PW-3 -4 -LOG OG LOG
~--~~--------+-----4---------~---+,_-------t~L~~--------t---~~~~~~~ ~~
DEPTH ~~b~ LITHOLOGY AQUIFER FORMATION
I~
t-1QQ-1 . ..1..,.1..,,
VUGGY LIMESTONE
[~ ~
1------t,-~· LIMESTONE ~ AND
BISCAYNEJ SURFICIAL AQUIFER SYSTEM
MIAMI
?KEY LARGO?
FORT THOMPSON
TAMIAMI
F~ SHELL
t-'100· .41~=~·· ----~---~----.~
I~ I~ · 1":..:._. -. I
{ I .
r~E:~ • ' I
CLAY, GREEN/ DENSE
I f-soo ~~
~.::;; S INTERBEDDED 1··:-~"" SAND, 1-~-.-=. SHELL, ~60 ~·::.:. llMEMUD,
1----+r..·.:::-~:i Ll MESTON E
~ t-700
~801
I=· t;~~
~ 1----
..... ~.;:~. r.=....:
PEACE RIVER
r---- --
INTER· ' MEDIATE ....... ~ ..... ''"'
,~ ... ·~ BEDS
ARCADIA
a. :::> 0 0::: :. (!)
z I
0::: ( 0 I
J: .....
~ ' J: ·~
'· (
I
I . '·
~90C ':'"":. 1,.......+-- ---+----- ._ ____ __ - - .... ..
w.~:
r1100- m
1
LIMESTONE, MEDIUM TO HARD,
DOLOMITE
UPPER FLORIDAN AQUIFER
SUWANNEE )
AVON PARK
~· ·.--
C.. I ,' I ::J I o , 0::: 1
C> · w , z w (.)
.. __ .
1 r
' . t
. l
I . j \ I . ~ ~
:·
-
..
i ; · \ ?.
I . {
1-
.. l ,· I·· . ' ·-~ I "
' • ,
t . •' .
I
I • I '
0 : ~
------- _____ l ______ ~ w~~-~. _' - j = ~ -~ -J , __ 1··- -
___ ... . -
···-· . ..
LEGEND: D. WELL CASING li OPENJNTERVAL § SCREENINTERVAL ~ LIMESTONE
~ SHELLHASH ~ DOLOMITE JLA Geosciences, Inc.
§ t::::
§ CLAY/UMEMUD D SAND/SANDSTONE
' I BISCAYNE AQUIFER L] CONFINING UNIT l . FLORIDAN AQUIFER DRAWN BY: JWF DATE:OS-20-06 SCALE: AS SHOWN
PROJECT SITE: FLPP/FPL TURKEY POINT,EXPANSION PROJECT (UNITS) PROJECT NO: 05-015
FIGURE TITLE: HYDROSTRATIGRAPHIC SECTION {TYPICAL) FIGURE NO: 7

TABLES

'
'
' WELL
NUMBER
' 1~.;-t-:\)\
II PW-1 " "
ii PW-3
PW-4
OBS-1
Abbreviations:
fl - Feet DIA - Diameter ln. -Inches
TABLE 1
WELL CONSTRUCTION DETAILS
FLPP/FPL TURKEY POINT EXPANSION PROJECT (UNIT 5) PRODUCTION WELLS PW-1, PW-3, PW-4 AND OBSERVATION WELL OBS-1
TOTAL DEPTH SURFACE CASING
(fl.) ' TYPE DIA. DEPTH
(ln.) (fl.)
1242 Steel 48 50
1248 Steel 48 50
1243 Steel 48 50
240 NIA NIA NIA
I CASING DETAILS
INTERMEDIATE CASING
TYPE DIA. ~n.)
Steel 36
Steel 38
Steel 36
NIA NIA
DEPTH (ft.)
452
305
450
NIA
NIA PVC
FINAL CASING '
TYPE DIA. DEPTH DIA. (ln.) (fl.) (ln.)
FRP 24 1003 23
FRP 24 1003 23
FRP 24 1015 23
PVC 2 220 2
- Not Applicable - Poly V!fiYi Chloride
OPEN HOLE COMPLETION
DEPTH INT. (ft.)
1003-1242
1003-1248
1015-1243
220-240*
- -Depth interval is 0.0010 sJot schedule 80 PVC well screen.
II
' ' ' '
'
' '
FRP • Fiberglass Reinforced Piping INT. -Interval
JLA Geosciences, Inc.
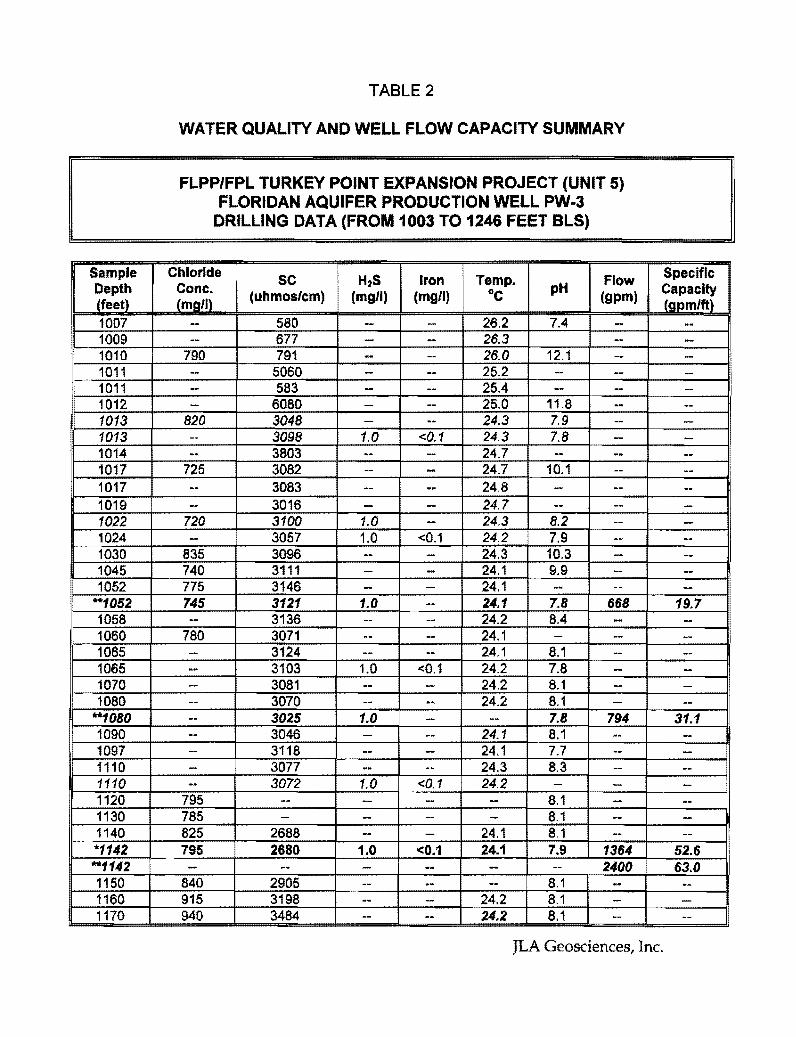
Sample Depth (feet)
1007 1009 1010 1011 1011 1012 1013 1013 1014 1017 1017 1019 1022 1024 1030 1045
**1052
1058d 1060 1065 1065 1070 1080
**1080 1090 1097 1110 1110 1120 1130 1140 *1142 *"1142 1150 1160 1170
TABLE 2
WATER QUALITY AND WELL FLOW CAPACITY SUMMARY
FLPP/FPL TURKEY POINT EXPANSION PROJECT (UNIT 5) FLORIDAN AQUIFER PRODUCTION WELL PW-3
DRILLING DATA (FROM 1003 TO 1246 FEET BLS)
Chloride sc H2S Iron Temp. Flow Cone.
(uhmos/cm) (mg/1) (mg/1) oc pH (gpm) (mgll)
-- 580 - - 26.2 7.4 ---- 677 - -- 26.3 t-= 790 791 -- - 26.0 12.1 -- 5060 -- -- 25.2 -- ---- 583 -- -- 25.4 -- --- 6080 - -- 25.0 11.8 --
820 3048 - -- I 24.3 7.9 ---- 3098 1.0 <0.1 24. .8 --- 3803 -- -- 24.7 -- --
725 3082 -- - 24.7 10.1 ---- 3083 -- -- 24.8 - ---- 3016 - - 24.7 -- --
720 3100 1.0 - 24.3 8.2 -- 3057 1.0 <0.1 24.2 7.9 --
835 3096 -- -- 24.3 10.3 --740 3111 - -- 24.1 9.9 --775 3146 -- - 24.1 -- --745 3121 1.0 -- 24.1 7.8 668 -- 3136 -- -- 24.2 8.4 -
780 3071 -- -- 24.1 - ---- 3124 -- -- 24.1 8.1 ---- 3103 1.0 <0.1 24.2 7.8 ---- 3081 -- - 24.2 8.1 --- 3070 -- -- 24.2 8.1 --- 3025 1.0 -- -- 7.8 794 -- 3046 - -- .1 8.1 ---- 3118 -- - 24.1 7.7 ---- 3077 -- -- 24.3 8.3 ---- 3072 1.0 <0.1 24.2 - -
795 -- - -- - 8.1 ! -785 - - -- - 8.1 --825 2688 -- - 24.1 8.1 --795 2680 1.0 <0.1 24.1 7.9 1364 - -- -- -- - -- 2400
840 2905 -- -- -- 8.1 --915 3198 -- -- :Et±8.1 --940 3484 -- -- 8.1 --
Specific Capacity (gpmlft}
-----------------------------
19. ---------
31.1 ---------
52.6 63.0
------
JLA Geosciences, Inc.

Sample Depth jfut) *1172 **1172 1180 1190 1200 *1203 **1203 1210 1220 1230 *1234 *1234 **1234 **1234 1240 1247
I *1247 **1247
Notes:
mg/1
sc umhosJcm oc gpm gpm/ft
* ....
TABLE 2 (continued)
WATER QUALITY AND WELL FLOW CAPACITY SUMMARY
FLPP/FPL TURKEY POINT EXPANSION PROJECT (UNIT 5) FLORIDAN AQUIFER PRODUCTION WELL PW-3
DRILLING DATA (FROM 1003 TO 1246 FEET BLS)
Chloride Specific sc H2S Iron Temp. Flow Cone. (uhmoslcm) (mg/1) (mg/1) oc pH
(gpm) Capacity (mg/1)
765
-1040 1090 1060 no --
1130 1215 1260 815 855 --
1305 1295 890 970
3082 1.0 <0.1 24.1 7.9 1538 -- -- -- -- - 2400
3135 -- -- 24.2 7.8 -3691 -- -- 4.2 7.8 --3749 -- - 24.1 7.9 -3131 1.0 <0.1 24.1 7.9 1437
- - -- -- -- 2700 3407 -- -- 24.0 7.9 -4572 -- - 24.0 8 -4646 -- .. 4.0 8 -3581 -- .. 24.0 7.9 1249 - 1.0 <0.1 -- -- 1850 -- -- - -- -- 1470 -· - -- -- -- 2400
4852 -- -- Hr 7.9 -4868 -- ·- .1 8 --3578 1.0 <0.1 .0 7.8 1515 3697 1.0 <0.1 24.0 7.8 2800
milligrams per liter, chloride concentration determined by the mercuric nitrate titration method Specific Conductance micromhos per centimeter related to 25.0 oc degrees Celsius gallons per minute
(gpm/ft)
79.9 64.2
----
66.2 73.6 .. ---
58.5
68.09 73.1 66.0
-77.5 75.9
gallons per minute per fool of drawdown, measured using a measuring tape and manometer tube measured during drilling of 12" borehole measured during drilling of 23" borehole
JLA Geosciences, Inc.
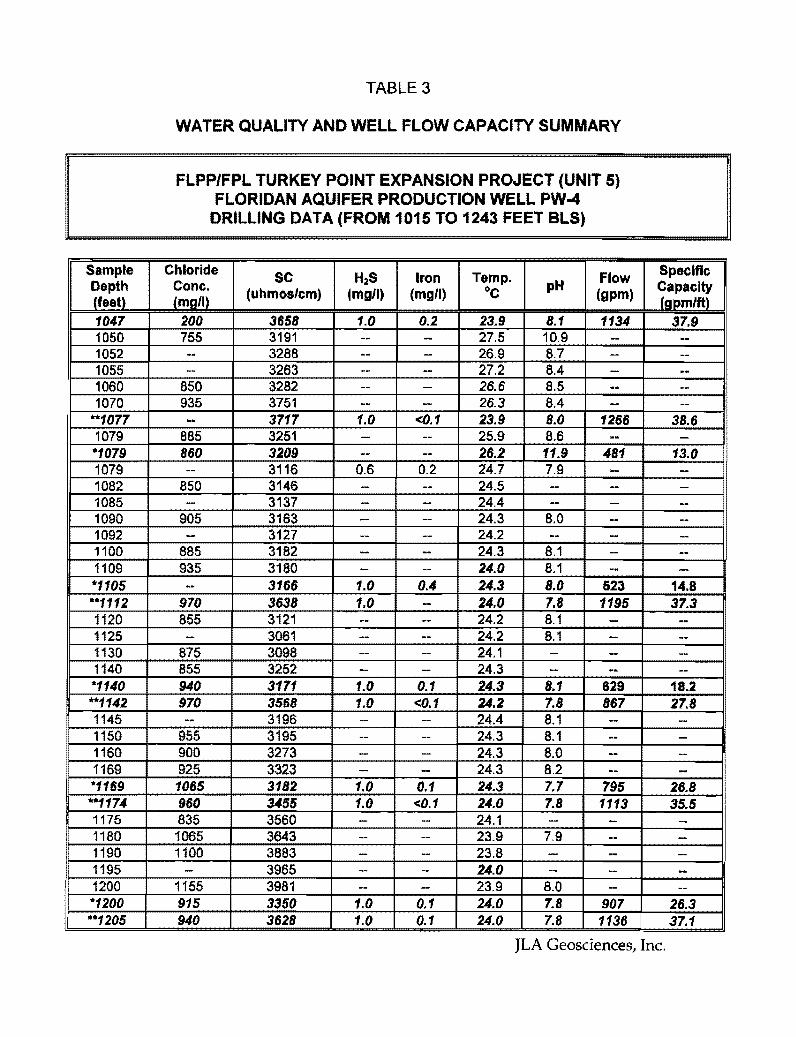
TABLE 3
WATER QUALITY AND WELL FLOW CAPACITY SUMMARY
FLPP/FPL TURKEY POINT EXPANSION PROJECT (UNIT 5) FLORIDAN AQUIFER PRODUCTION WELL PW-4
DRILLING DATA (FROM 1015 TO 1243 FEET BLS)
Sample sc H2S Iron Temp. Flow Depth (uhmos/cm) ~mg/1) (mg/1) oc pH
(gpm) feet 1047 3658 1.0 0.2 23.9 8.1 1134 1050 3191 27.5 10.9 1052 3288 26.9 8.7 1055 3263 27.2 8.4 1060 850 3282 26.6 8.5 1070 935 3751 26.3 8.4
**1077 3717 1.0 <0.1 23.9 8.0 1266 38.6 1079 885 3251 25.9 8.6
860 3209 26.2 11.9 481 13.0 3116 0.6 0.2 24.7 7.9
850 3146 24.5 3137 24.4
905 24.3 8.0 24.2 24.3 8.1 24.0 8.1 24.3 8.0 523 14.8 24.0 7.8 1195 37.3 24.2 8.1 24.2 8.1 24.1 24.3
0.1 24.3 8.1 629 18.2 <0.1 24.2 7.8 867 27.8
24.4 8.1 24.3 8.1 24.3 8.0 24.3 8.2 24.3 7.7 795 28.8 24.0 7.8 1113 35.5 24.1 23.9 7.9 23.8 24.0
1155 23.9 8.0 915 1.0 0.1 24.0 7.8 907 26.3
**1205 940 1.0 0.1 24.0 7.8 1136 37.1
JLA Geosciences, Inc.

Sample Depth {feet) 1210 1215 1220 1232 *1232 -1236 1240
-1242
Notes:
mg/1
sc umhos/cm ac gpm gpm/ft
*
TABLE 3 (continued)
WATER QUALITY AND WELL FLOW CAPACITY SUMMARY
FLPP/FPL TURKEY POINT EXPANSION PROJECT (UNIT 5) FLORIDAN AQUIFER PRODUCTION WELL PW-4
DRILLING DATA (FROM 1015 TO 1243 FEET BLS)
Chloride Specific sc H2S Iron Temp. Flow Cone. (uhmos/cm) (mg/1) (mg/1) oc pH
(gpm) Capacity (mgll) 1130
-1310 1310 950 1040 1405 1030
4168 - - 23.8 - -4185 - - 23.7 - -4629 - - 23.8 -- -4700 -- - 23.8 -- -3564 1.0 0.3 24.0 7.6 1200 3805 1.0 <0.1 24.0 7.8 1410 4783 -- -- 23.8 -- --3669 1.0 0.1 24.0 7.8 1462
milligrams per liter, chloride concentration determined by the mercuric nitrate titration method Specific Conductance micromhos per centimeter related to 25.0 oc degrees Celsius gallons per minute
(gpmlft) -----
36.4 42.3
--42.8
gallons per minute per foot of drawdown, measured using a measuring tape and manometer tube measured during drilling of 12" borehole measured during drilling of 23" borehole
JLA Geosciences} Inc.
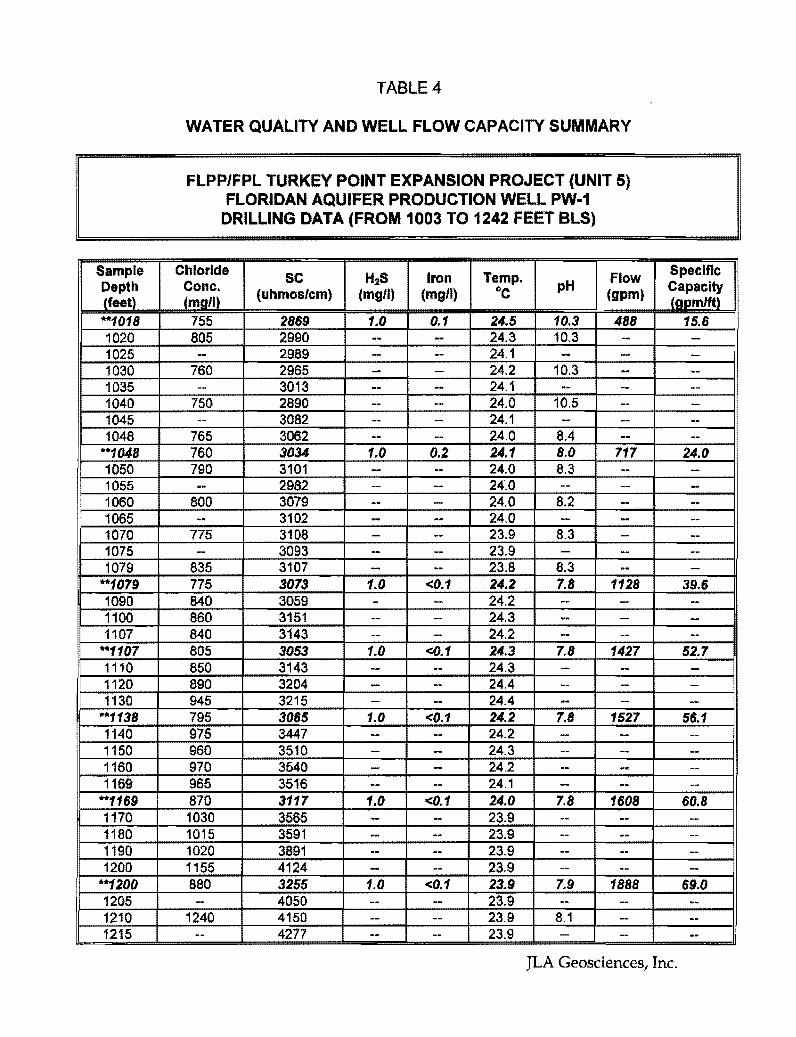
TABLE4
WATER QUALITY AND WELL FLOW CAPACITY SUMMARY
FLPP/FPL TURKEY POINT EXPANSION PROJECT (UNIT 5) FLORIDAN AQUIFER PRODUCTION WELL PW-1
DRILLING DATA (FROM 1003 TO 1242 FEET BLS)
Sample Chloride sc H2S Iron Temp. Flow Specific
Depth Cone. (uhmos/cm) (mg/1) (mg/1) oc pH
(gpm) Capacity (feet) (mg/1) (gpmlft) -1018 755 2869 1.0 0.1 24.5 10.3 488 15.6 1020 805 2990 -- -- 24.3 10.3 -- -1025 -- 2989 -- -- 24.1 -- -- -1030 760 2965 - - .2 10.3 - --
35 -- 3013 -- - 24.1 -- - --1040 750 2890 -- -- 24.0= 10.5 -- -1045 -- 3082 -- -- 24.1 - -- --1048 765 3062 -- -- 24.0 8.4 -- --
**1048 760 3034 1.0 0.2 24.1
~~0 I ~7 24.0
1050 790 3101 - -- 24.0 -1055 -- 2982 - - 24.0 -1060 800 3079 -- - 24.0 8.2 - --1065 -- 3102 -- -- 24.0 - -- --1070 775 3108 -- -- 23.9 8.3 - --1075 -- 93 --
- I J - -- --
1079 835 3107 - 8.3 -- --1079 7 3073 1.0 7.8 1128 39.6 1090 840 3059 - -- -- --1100 860 3151 -- -- - --1107 840 3143 -- -- 24.2 -- -- --
**1107 805 3053 1.0 <0.1 24.3 7.8 1427 52.7 1110 850 3143 - -- 24.3 - -- --1120 890 3204 -- -- 24.4 - -- --1130 945 3215 -- - 24.4 -- -- -
"*1138 795 3065 ! 1.0 <0.1 24.2 7.8 1527 56.1 1140 975 3447 -- -- 24.2 -- - --1150 960 3510 - -- 24.3 -- - --1160 970 3540 - -- 24.2 -- -- ~ 1169 965 3516 -- -- 24.1 - -- --
"1169 870 3117 1.0 <0.1 24.0 7.8 1608 60.8 1170 1030 3565 -- - 23.9 -- -- --1180 1015 3591 -- -- 23.9 -- -- -1190 1020 3891 -- -- 23.9 -- -- --1200 1155 4124 - -- 23.9 -- -- --.. 1200 880 3255 1.0 <0.1 23.9 7.9 1888 69.0 1205 -- 4050 -- -- 23.9 -- -- --1210 1240 4150 -- -- 23.9¥- -- --1215 -- 4277 -- -- 23.9 - -- --
JLA Geosciences, Inc.

Sample Depth (feet) 1220 1225 1230 1232
**1232 1235 1240 1242
**1242 **1242
Notes:
mg/1
sc umhos/cm oc gpm gpmlft
" **
TABLE 4 (continued)
WATER QUALITY AND WELL FLOW CAPACITY SUMMARY
FLPP/FPL TURKEY POINT EXPANSION PROJECT (UNIT 5) FLORIDAN AQUIFER PRODUCTION WELL PW-1
DRILLING DATA (FROM 1003 TO 1244 FEET BLS)
Chloride Cone. (mg/1) 1170 -
1220 1240 840 -
1325 1550 955 1020
sc H2S Iron Temp. Flow Specific
(uhmos/cm) ~mg/1) (mg/1} oc pH ~gpm)
Capacity Jspm/ftl
4261 -- -- 23.9 8.1 -- ·-4392 -- -- 23.9 -- ·- --4395 -- -- 23.8 8.2 -- --4537 -- -- 23.6 8.2 - --3336 1.0 <0.1 23.9 8.0 1977 76.3 4817 - - 23.8 -- - --4828 - - 23.8 .. -- --4832 -- - 23.8 7.9 -- --3419 1.0 <0.1 23.8 8.0 2110 79.3 3378 1.0 0.2 24.1 7.6 2266 79.0
milligrams per liter, chloride concentration detennined by the mercuric nitrate titration method Specific Conductance micromhos per centimeter related to 25.0 oc degrees Celsius gallons per minute gallons per minute per foot of drawdown, measured using a measuring tape and manometer tube measured during drilling of 12» borehole measured during drilling of 23• borehole
JLA Geosciences, Inc.

TABLE 5
STEP DRAWDOWN TEST RESULTS
TURKEY POINT EXPANSION PROJECT (UNIT 5) FLORIDAN AQUIFER PRODUCTION WELL PW-3
WELL: PW-3 TEST DATE: 12/08/05 STATIC WATER LEVEL: Referenced starting head, +49.66 feet NGVD.
DRAWDOWN DATA
Pumping Pumping Water Level Drawdown Rate (gpm) Duration (min) (ft. NGVD) (feet)
2300 60 +22.8 26.9
3000 90 +10.9 38.8
3800 120 -3.3 52.9
4500 150 -14.4 64.0
WATER QUALITY DATA
Pumping Total Pumping Sand Turbidity Rate
(gpm) Duration (ppm) (ntu)
(min)
2300 60 0.05 2.04
3000 90 0.17 1.61
3800 120 0.25 2.18
4500 150 0.83 1.89
Notes: NGVD- National Geodetic Vertical Datum (1929) gpm - gallons per minute mg/1- milligrams per liter umhos/cm- microsiemens (micromhos) per em ppm - parts per million SDI- Silt Density Index ntu -nephelometric turbidity units NA- not available Pumping water levels rounded to nearest tenth.
Total Hydrogen Dissolved Iron Sulfide Chloride
(ppm) (ppm) (mg/l)
0.25 1.0 980
0.15 1.0 985
0.15 1.0 1020
0.1 1.0 1095
Specific Cap. (gpm/ft)
85.5
77.3
71.8
70.3
Specific Conductance
(uS/em)
3679
3695
3718
3729
JLA Geosciences, Inc.

TABLE 6
STEP DRAWDOWN TEST RESULTS
FLPP/FPL TURKEY POINT EXPANSION PROJECT (UNIT 5) FLORIDAN AQUIFER PRODUCTION WELL PW-4
WELL: PW4 TEST DATE: 4/13/2006 STATIC WATER LEVEL: Referenced starting head! +49.33 feet NGVD.
DRAWDOWN DATA
Pumping Pumping Water Level Drawdo Rate {gpm) Duration (min} (ft. NGVD) (feet)
2300 60 12.6 36.8
3000 60 -3.7 53.0
3800 60 -22.3 71.6
4500 60 -37.1 86.4
4500* 240 47.0 96.3
WATER QUALITY DATA
Pumping Total Pumping Sand Turbidity Rate
(gpm) Duration (ppm) (ntu) (min}
2300 60 ~0.53 3000 60 0.17 0.64
3800 60 0.71 0.47
4500 60 2.2 0.75
Notes: NGVD- National Geodetic Vertical Datum (1929) gpm - gallons per minute mg/1- milligrams per liter umhos/cs- micromhos per centimeter related to 25.0 °C ppm- parts per million SOl - Silt Density Index ntu- nephelometric turbidity units Pumping water levels rounded to nearest tenth. * - From Development
Total Hydrogen Dissolved Iron Sulfide Chloride
(ppm) (ppm) (mg/1)
0.1 1.0 1020
0.1 1.0 1105
< 0.1 1.0 1120
< 0.1 1.0 11 .
Specific Cap. {gpm/ft)
62.6
56.6
53.0
52.1
46.7
Specific Conductance (umhos/cm}
3518
3650
3726
3781
JLA Geosciences, Inc.

TABLE 7
STEP DRAWDOWN TEST RESULTS
FLPP/FPL TURKEY POINT EXPANSION PROJECT (UNIT 5) FLORIDAN AQUIFER PRODUCTION WELL PW-1
WELL: PW-1 TEST DATE: 4/22/2006 STATIC WATER LEVEL: Referenced starting head, +49.17 feet NGVD.
DRAWDOWN DATA
Pumping Pumping Water Level Drawdown Rate (gpm) Duration (min} (ft. NGVD} (feet)
2300 60 32.3 16.9
3000 90 24.4 24.8
3800 120 16.2 33.0
4500 150 5.3 43.9
WATER QUALITY DATA
Pumping Total Pumping Sand Turbidity Rate
(gpm) Duration (ppm) (ntu) (min)
2300 60 0.17 1.14
3000 90 0.17 0.01
3800 120 0.25 0.19
4500 150 1.91 0.09
Notes: NGVD- National Geodetic Vertical Datum (1929) gpm - gallons per minute mg/1- milligrams per liter umhos/cm- micromhos per centimeter related to 25.0 °C ppm - parts per million SDI- Silt Density Index ntu- nephelometric turbidity units NA - not available Pumping water levels rounded to nearest tenth.
Total Hydrogen Dissolved Iron Sulfide Chloride
{ppm) {ppm) {mg/1)
< 0.1 0.9 895
< 0.1 0.9 935
< 0.1 0.9 960
< 0.1 0.9 990
Specific Cap. (gpm/ft}
136.3
121.2
115.2
102.6
Specific Conductance (umhos/cm)
3189
3374
3400
3465
JLA Geosciences, Inc.

PUMPING DISTANCE WELL MAXIMUM FROM TEST
NO. RATE DRAWOOWN PRODUCTION (gpm) WELL (ft.)
PW-1 4500 45.04 0
PW-3 - 5A4 3100
PW-4 .. 6.36 1850
AVERAGE
Abbreliiations:
'
...
feel gallons per milll.lte
SQioOOns deriVed with Aqtesolve® Software Solutions defived Manually Anafysi$ does not etllrutate !eakace Ana!ysit does not calculate stomge
... _. --
265,000
' 223,000 "
' 244,000 " '
.•. Solution deJMI.Id: Manually from Hantush-Jaoob* numbers .
TABLES
AQUIFER PERFORMANCE TEST RESULTS
FLPPIFI'l. TURKEY POINT EXPANSION PROJECT (UNlT 5)
PRODUcnON WELLS PW~'f, PW~3, AND PW-4
PW·1 PUMPING WELl
TRAN$Mt$$MTY {gpdlft) II STORAGi; COEFACJENT
ANALYSIS METHOD
Joeob ROC"""'l' II. c .. ,... Hantush c ..... Straight li HIOU!sh Hantttsh Hllntll$fl", Jacob*"
... _.. Jacob*, ....
_ .. Lin_..., ..... ,:: Jacob'" J~W!>b""' - Jacob", ...
~--. ....
" .. .. - .. .. ,, - .. -- --- 238,000 288,000 357,000 296,000 ': 0.0002 0.0002 0.0001 0.0002
224,000 227,000 298,000 305,000 296,000 ;; 0.0003 0.0003 i 0.0003 0.0003 "
244,000 232,500 293,000 331,000 296,000 0.0002 0.0002 0.0002 0.0003
' : lEAKAHCE (gpdfft.3J
'
.... •• lj -·i Straight :, Hantuah " Jacob""" Jacob"" : Unv""'" ..... '' . ''
' -- " - ' .. ' ' '
0.0002 0.003 0.003
0.0002 0.007 0.006 '
0.0002 0.005 0.005
JLA Geosciences, Inc.
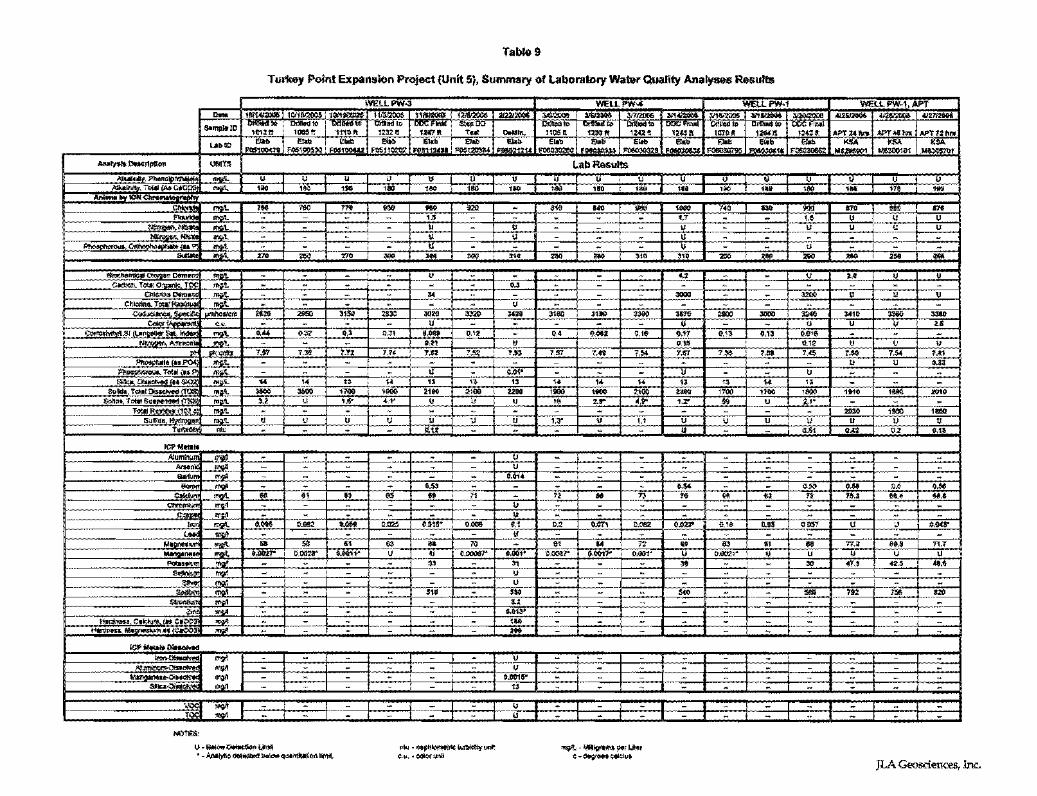
Tabkl9
Turkey Point Expansion Project (Unit 5), Summary Of Laboratory Water Quality Analyses Results
~~~~~~ uoo~~~~~ ' ~ "'"'
~
~
Nl'l11ltS:
U-Boi""~U'!WI • -I\Nil)lle--<p<o>dul!:""l..,... '"""""''"-~¢ •· • OOiono\11
"'9't Ylll\;l'li!M '"'' ut•• t-~..,"'"'
' '
APPENDIX A
AQUIFER PERFORMANCE TEST RESULTS AND DATA
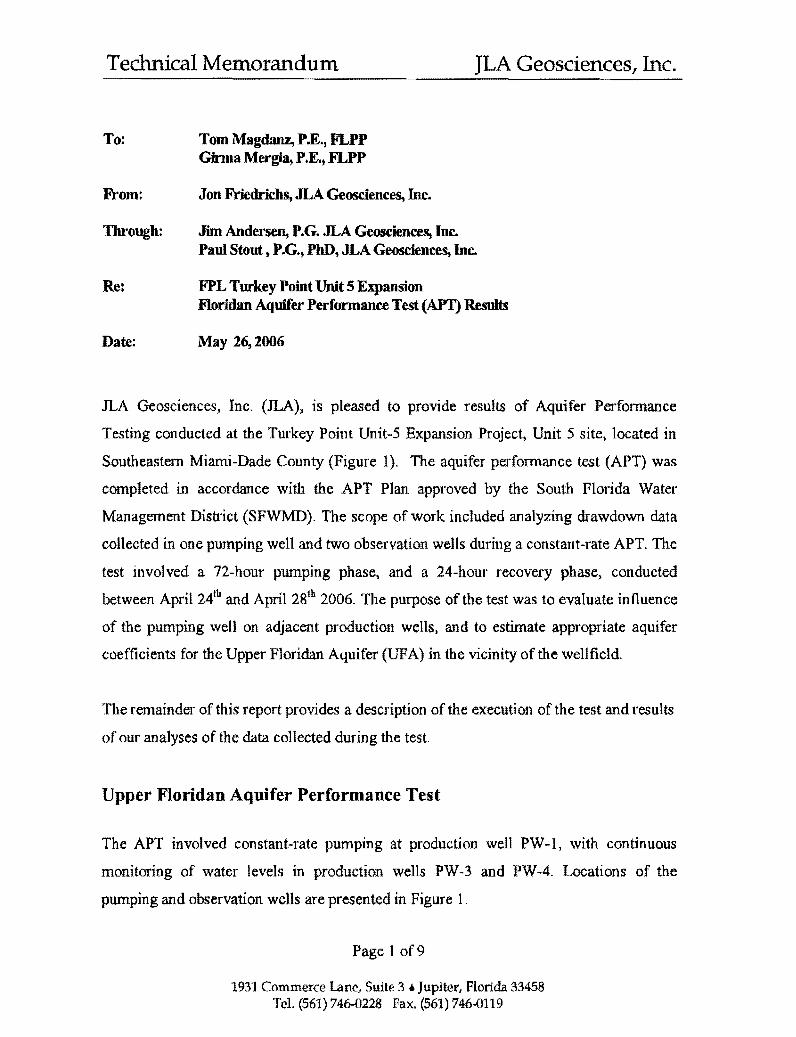
Technical Memorandum JLA Geosciences, Inc.
To:
From:
Through:
Re:
Date:
Tom Magdanz, P.E., FLPP Ginna Mergia, P.E., FLPP
Jon Friedrichs, JLA Geosciences, Inc.
Jim Andersen, P.G. JLA Geosciences, Inc. Paul Stout t P.G., PhD, JLA Geosciences, Inc.
FPL Turkey Point Unit 5 Expansion Floridan Aquifer Perfonnance Test(AP'I) Results
May 26,2006
JLA Geosciences, Inc. (JLA), is pleased to provide results of Aquifer Performance
Testing conducted at the Turkey Point Unit-5 Expansion Project, Unit 5 site, located in
Southeastem Miami-Dade County (Figure 1). The aquifer performance test (APT) was
completed in accordance with the APT Plan approved by the South Florida Water
Management District (SFWMD). The scope of work included analyzing drawdown data
collected in one pumping well and two observation wells during a constant-rate APT. The
test involved a 72-hour pumping phase, and a 24-hour recovery phase, conducted
between April 24th and April 281h 2006. The purpose of the test was to evaluate influence
of the pumping well on adjacent production wells, and to estimate appropriate aquifer
coefficients for the Upper Floridan Aquifer (UFA) in the vicinity of the wellfield.
The remainder of this report provides a description of the execution of the test and results
of our analyses of the data collected during the test
Upper Floridan Aquifer Performance Test
The APT involved constant-rate pumping at production well PW-1, with continuous
monitoring of water levels in production wells PW-3 and PW-4. Locations of the
pumping and observation wells are presented in Figure 1.
Page 1 of9
1931 Commerce lane, Suite 3 • Jupiter, Florida 33458 Tel. (561) 746-0228 Fax. (561) 746-0119

Technical Memorandum JLA Geosciences, Inc.
The test consisted of 72 hours continuous pumping of PW -1 at an approximate rate of
4,500 gallons per minute (gpm). Discharge rates were calculated hourly from totalizer
measurements recorded from an inline flow meter. The pumping rate of 4,500 gpm
corresponds to the design flow rate for each of the production wells. Discharge water
from the APT was directed via the newly constructed raw water main piping to the
existing cooling water canals.
To monitor drawdown, wells PW-1, PW-3, PW-4, and OBS-1 (Surficial Aquifer
monitoring well) were outfitted with electronic data loggers. These data loggers were
installed 24 hours prior to the APT, to record background water levels, and to evaluate
non-pumping conditions. Prior to onset of pumping, static water levels were measured
manually using a manometer tube and a boom truck to establish a baseline for the
transducer measurements. Manual measurements were also performed during the test to
compare with electronic measurements.
A composite hydrograph of water levels recorded during the APT for wells PW -1, PW -3,
PW-4 and OBS-1, is presented as Figure 2. Figures 3 and 4 present drawdown-versus
time for PW-3 and PW-4. Additional charts presenting drawdown, and interpretation of
the data to derive hydraulic coefficients, are provided in the attached Excel file (APT
Data.XLS)
Water-level results for monitoring well OBS-1 indicate that no measurable influence on
the Surficial Aquifer occurred during the test in response to withdrawals from the UF A.
Analysis of the background data did not indicate influence from potential sources of
withdrawals fi-om or injection into the UF A.
At approximately 300 minutes into the test, draw down in the UF A observation wells
approached nearly constant values of approximately 4 feet in PW·3, and 5 feet in PW-4.
Page 2 of9
1931 Commerce lane, Suite 3 • Jupiter, Aorida 33458 Tel. (561) 746-0228 Fax. (561) 746-0119
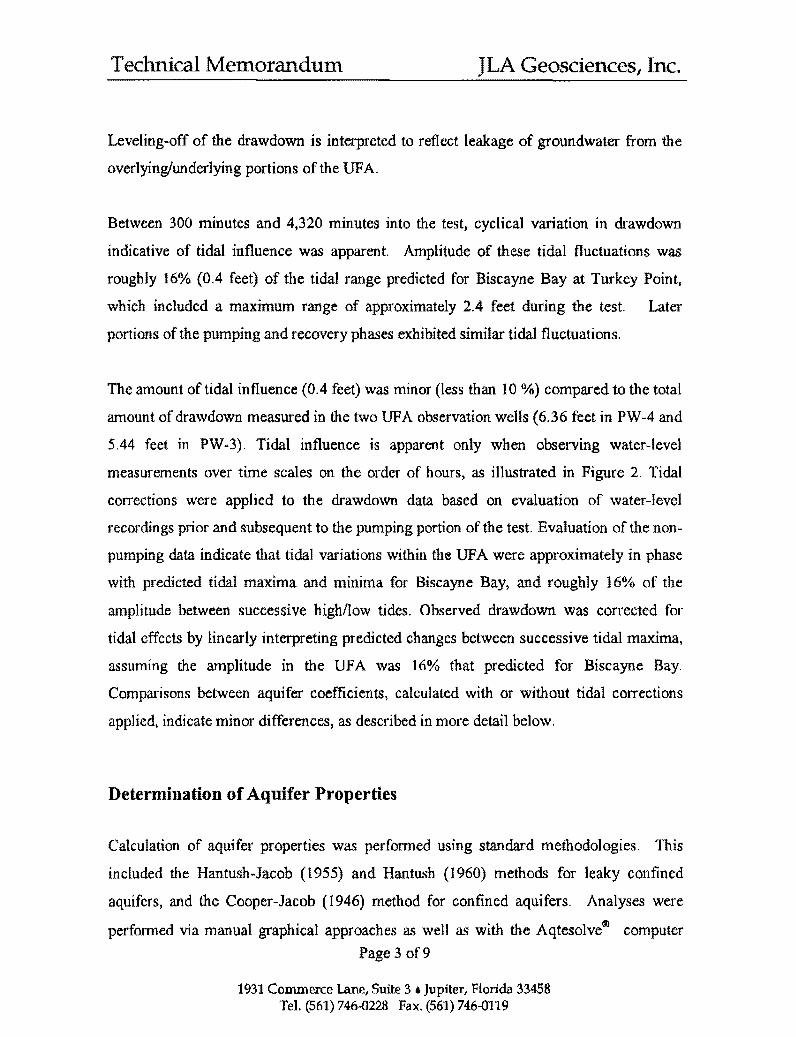
Technical Memorandum JLA Geosciences, Inc.
Leveling-off of the drawdown is interpreted to reflect leakage of groundwater from the
overlying/underlying portions of the UF A.
Between 300 minutes and 4,320 minutes into the test, cyclical variation in drawdown
indicative of tidal influence was apparent. Amplitude of these tidal fluctuations was
roughly 16% (0.4 feet) of the tidal range predicted for Biscayne Bay at Turkey Point,
which included a maximum range of approximately 2.4 feet during the test. Later
portions of the pumping and recovery phases exhibited similar tidal fluctuations.
The amount of tidal influence (0.4 feet) was minor (less than 10 %) compared to the total
amount of drawdown measured in the two UFA observation wells (6.36 feet in PW-4 and
5.44 feet in PW~3). Tidal influence is apparent only when observing water-level
measurements over time scales on the order of hours, as illustrated in Figure 2. Tidal
corrections were applied to the drawdown data based on evaluation of water-level
recordings prior and subsequent to the pumping portion of the test. Evaluation of the non
pumping data indicate that tidal variations within the UF A were approximately in phase
with predicted tidal maxima and minima for Biscayne Bay, and roughly 16% of the
amplitude between successive high/low tides. Observed drawdown was corrected for
tidal effects by linearly interpreting predicted changes between successive tidal maxima,
assuming the amplitude in the UF A was 16% that predicted for Biscayne Bay.
Comparisons between aquifer coefficients, calculated with or without tidal corrections
applied, indicate minor differences, as described in more detail below.
Determination of Aquifer Properties
Calculation of aquifer properties was performed using standard methodologies. This
included the Hantush-Jacob (1955) and Hantush (1960) methods for leaky confined
aquifers, and the Cooper-Jacob (1946) method for confined aquifers. Analyses were
performed via manual graphical approaches as well as with the Aqtesolvem computer
Page 3 of9
1931 Commerce Lane, Suite 3 • Jupiter, Florida 33458 Tel. (561) 746-0228 Fax. (561) 746..0119
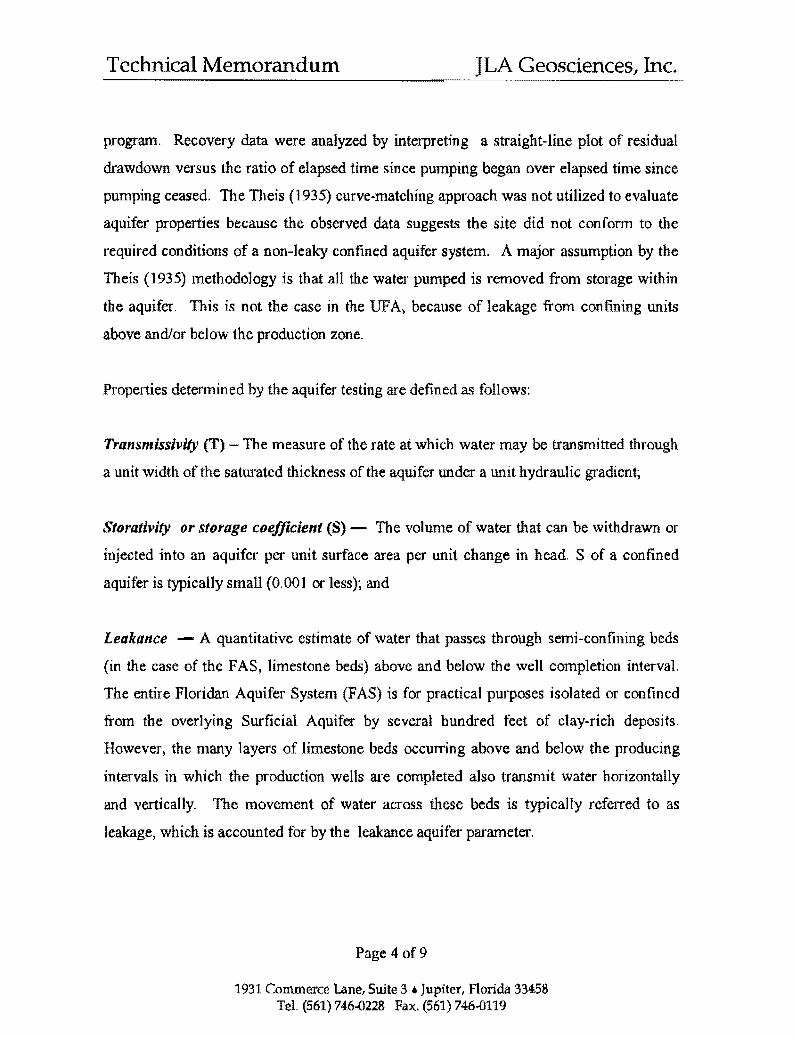
Technical Memorandum JLA Geosciences, Inc.
program. Recovery data were analyzed by interpreting a straight-line plot of residual
drawdown versus the ratio of elapsed time since pumping began over elapsed time since
pumping ceased. The Theis (1935) curve-matching approach was not utilized to evaluate
aquifer properties because the observed data suggests the site did not conform to the
required conditions of a non-leaky confined aquifer system. A major assumption by the
Theis (1935) methodology is that all the water pumped is removed from storage within
the aquifer. This is not the case in the UFA, because of leakage from confining units
above and/or below the production zone.
Properties determined by the aquifer testing are defined as follows:
Transmissivity (T) - The measure of the rate at which water may be transmitted through
a unit width of the saturated thickness of the aquifer under a unit hydraulic gradient;
Storativity or storage coefficient {S) - The volume of water that can be withdrawn or
injected into an aquifer per unit surface area per unit change in head. S of a confined
aquifer is typically small {0.001 or less); and
Leakance - A quantitative estimate of water that passes through semi-confining beds
(in the case of the F AS, limestone beds) above and below the well completion interval.
The entire Floridan Aquifer System (FAS) is for practical purposes isolated or confined
from the overlying Surficial Aquifer by several hundred feet of clay-rich deposits.
However) the many layers of limestone beds occurring above and below the producing
intervals in which the production wells are completed also transmit water horizontally
and vertically. The movement of water across these beds is typically refetTed to as
leakage, which is accounted for by the leakance aquifer parameter.
Page 4 of9
1931 Commerce Lane, Suite 3 • Jupiter, Florida 33458 Tel. (561) 746-0228 Fax. (561) 746-0119

Technical Memorandum JLA Geosciences, Inc.
Transmissivity
Transmissivity was first calculated manually from the APT data using the Hantush-Jacob
Type Curve Method for leaky confined aquifers. The method involves matching field
data plotted on a log-log graph with a family of 11 type curves It plotted from the Hantush
equation. After superimposing field data over the appropriate type curve and the two
curves are satisfactorily matched, an arbitrary match point is selected. From the match
point, values for time (t) and drawdown (s) are obtained for substitution into the
appropriate equations to obtain aquifer properties. Transmissivity is solved as follows:
T = 114.6QW(u,rl B) s
Where: T = transmissivity (gpdlft)
Q =discharge rate (gpm)
W(u, r/B) =well function of Hantush = 1
s = draw down ( ft)
PW-3 Transmissivity Analysis
T = 114.6( 4500)(1) == 264 462 d I ft 1.95 ' gp
PW-4 Transmissivity Analysis
T = 114·6~~00)(I) = 224~217 gpd I ft
Storativity
From the above results, storativity was then calculated as follows:
Page 5 of9
1931 Commerce Lane, Suite 3 • Jupiter, Florida 33458 Tel. (561) 746-0228 Fax. (561) 746-0119
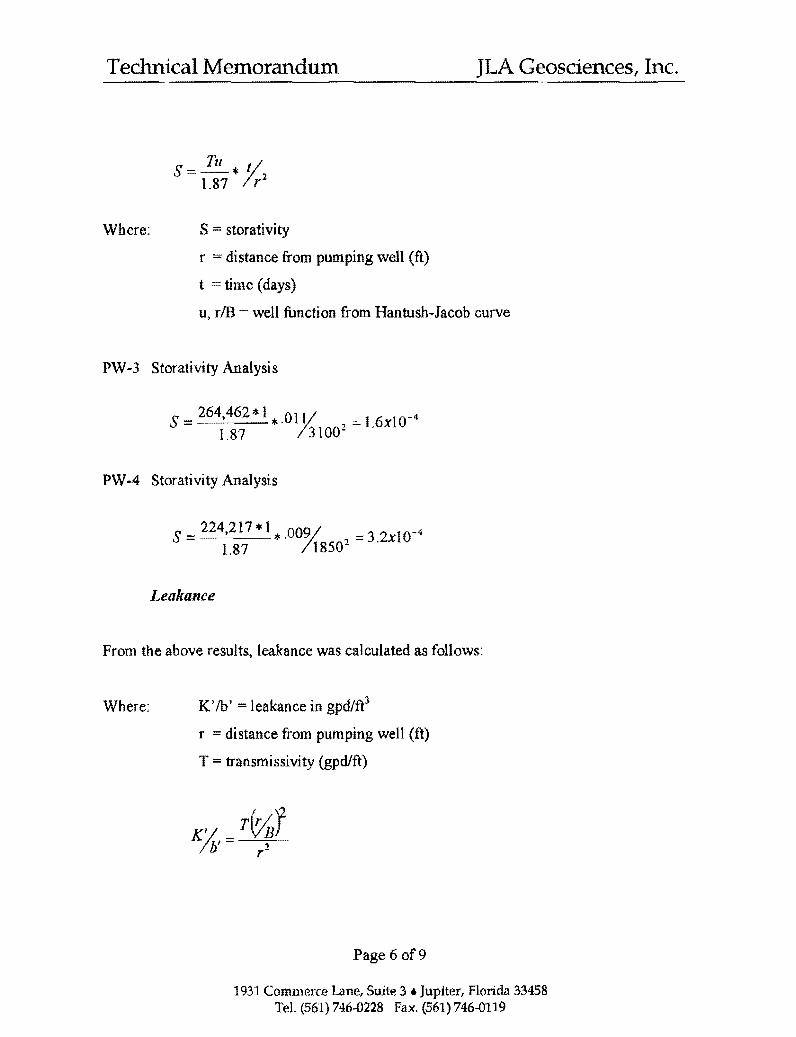
Technical Memorandum JLA Geosciences, Inc.
Where:
S Tu * t/ 1.87 /r 2
S = storativity
r = distance from pumping well (ft)
t time (days)
u, riB = well function from Hantush-Jacob curve
PW-3 Storativity Analysis
S = 264,462* l * .Ol J/ , = 1.6x10⁻⁴
1.87 /3Ioo-
PW-4 Storativity Analysis
S = 224,217 *I* .009/ = 3_2x10-4
1.87 /18502
Leakance
From the above results, leakance was calculated as follows:
Where: K' /b' = leakance in gpd/ft3
r = distance from pumping well (ft)
T = transmissivity (gpd/ft)
Page 6 of9
1931 Commerce Lane, Suite 3 • Jupiter, Florida 33458 Tel. (561) 746-0228 Fax. (561) 746-0119

Technical Memorandum JLA Geosciences, Inc.
PW-3 Leakance Analysis
K~' 1 _ 264,462(0.3)2
/b 0.0025 gpd I jt 3
b' - (3,100 )2
PW-4 Leakance Analysis
K' I,= 224,217(0.3 )2 = 0.0059 gpd I /13 lb (1,850)2
Additional estimates of these aquifer coefficients were derived using the Aqtesolve®
program, as well as manual evaluation of the recovery data. A summary of the calculated
aquifer properties is provided in Table 1.
Aquifer Properties Summary
Drawdown data from observation wells are considered optimal for estimating aquifer
properties of transmissivity and storage, while recovery data are typically utilized in the
absence of suitable drawdown data, or for single-well APTs. The drawdown data from
PW·3 and PW-4 appear to be of high quality, and therefore have been applied as the
preferred data available for calculating aquifer properties.
Results presented in Table 1 indicate that different values for aquifer coefficients are
calculated depending on the methods used in the analyses. These differences likely reflect
contrasting assumptions involved with each technique, as well as subtleties inherent in
the interpretation of matches between observed and computed data. For example, the
CooperwJacob methodology assumes a confined aquifer with no leakage; the Hantush Page 7 of9
1931 Commerce lane, Suite 3 • Jupiter, Florida 33458 Tel. (561) 746...()228 Fax. (561) 746-0119

TeChrrical11ernoranduD1 JLA Geosciences, Inc.
method assumes an aquifer with leakage derived from storage within the confining beds;
and the Hantush-Jacob method assumes an aquifer with leakage derived from flow within
or across confining beds, but not from confining-bed storage.
Results presented in Table 1 indicate that aquifer transmissivity values detennined by the
Hantush-Jacob and Hantush methodologies are slightly lower than those estimated using
alternative approaches. A prime reason for the slightly lower T values for these
approaches is that they account for leakage, whereas the other approaches do not
Closest agreement between observed data and theoretical type curves is indicated for the
Hantush-Jacob solution, which applies to leaky confined aquifers. Consequently, aquifer
parameters derived from this approach appear representative of hydraulic properties that
may be used for various applications such as groundwater flow modeling.
Averaged values of aquifer properties detennined by the Hantush-Jacob method,
presented in Table 1, are summarized as follows:
From the APT
Aquifer Parameter APT Results
Transmissivity 244,000 gpdlft
Storativity 2.0 X 10⁻⁴
Leakance
The transmissivity results are consistent with the relatively high specific capacities
measured in the new production wells. The transmissivity and storativity values also faii
within the range of values reported in the literature for the UFA. The leakance values
Page 8 of9
1931 Commerce lane, Suite 3 • Jupiter, Florida 33458 Tel (561) 746-0228 Fax. (561) 746-0119
Technical Memorandum JLA Geosciences, Inc.
derived from the APT also appear to be within the range expected for a well completed
within a pot1ion of the UFA.
Figures 5 through 8 illustrate the influence of tides on aquifer coefficients derived from
the APT analysis, by comparing a tidal-corrected data set for each observation well, with
one not corrected for tidal influence. Results are presented for the Hantush-Jacob
solution, which as described previously corresponds to the approach resulting in optimal
agreement between observed drawdown and applicable type curves. Evaluation of aquifer
coefficients calculated using corrected versus uncorrected data, indicate virtually
identical results, suggesting minimal influence by tides on the interpretation of the APT
data.
JLA appreciates the opportunity to provide you with our professional services. Please
feel free to contact either of the undersigned if you have any questions regarding this
work
Respectfully submitted,
JLA Geosciences, Inc.
Jon Friedrichs Staff Hydrogeologist
James L. Andersen, P.G. Principal Hydrogeologist
Page 9 of9
1931 Commerce Lane, Suite 3 • Jupiter, Florida 33458 Tel. (561) 746-0228 Fax. (561) 746-0119

WELL NO.
PW·l ' ' '
PW-3 '
i PW-4 '
' '
ft.;; gpm"'
...
PUll ..... DISTANCE
RATE MAXIMUM FROM TEST
(gpm) DRAWDOWN PRODUC110N
WELL (ft.)
45.04 0
.. 5.44 3100
.. 6.36 1850
AVERAGE
lee! gallons l)(lr m1nute
So!u!rons derr.ed wllh AqWso!vd Sct:ware SoMkms derived Manually Analys!s does Nl calculate 1esi<ace A~is does 001: cak:Jial:e storage
Hantush ....,.,. -
'
265,000
223,000.
244,000
SolutiOn d!frlved Marwally fro::n HanhJth·Jacotr' numbers.
TABLE 1
AQUIFER PERFORMANCE TEST RESULTS
FLPPIFPL TURKEY POINT EXPANSlON PROJECT (UNIT 5)
PRODUCTION WELLS PW~1, PW~3t ANI) PW·4
PW .. 1 PUMPING WELL
" TRANSMISSIVIT'f (gpdttt) STORAGE CCEFFICIENT
ANAL. VSIS METHOD
...... " ........ co..., Stn•lghl :: H.antl.l$h Hantu&h tluntush~, Cooper Jacot.•• Hanti.ISh' .b(ll)b', ... S:tra!ght LIM'\.,.," Ja<ob' Jacob'' ... Jilcob\ ....
Ul\f'~', ... ... .. .. .. .. - .. .. .. . . -
264,000 238,000 288,000 357,000 296.000 0.0002 0.0002 0.0001 0.{)002
224,000 227,00(} 298,000 305,000 296,000 0.0003 0.0003 0.0003 0.0003
244,000 232,500 293,000 331,000 296.000 0.0002 0.0002 0.0002 0.0003
" ::L.EAKANCE (gpdlfl3):
'
i ' ...... " '
" Hantush lfantush : Stralglll Jae b'"' ,.,.,. Une",'" :: 0 . .
- .. . .
0.0002 0.003 0.003
0.0002 0.001 0.006
0.0002 0.005 0.005

Figure 1
FLPP/FPL Turkey Point Expansion Project (Unit 5)
... : ,.
Location Map
N
1000
JLA Geosciences, Inc.1
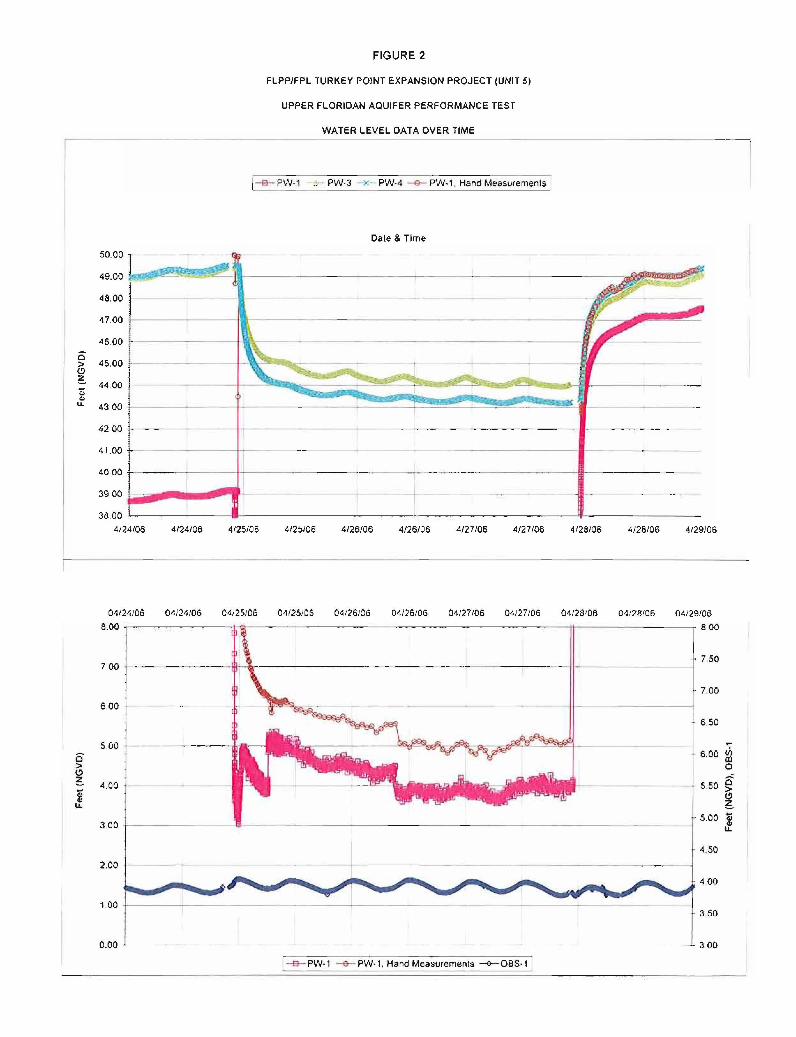
FIGURE 2
FLPPIFPL TURKEY POINT EXPANSION PROJECT {UNITS)
UPPER FLORIDAN AQUIFER PERFORMANCE TEST
WATER LEVEL DATA OVER TIME
1-e- PW-1 .;. · PW-3 · PW-4 -e- PW-1. Hand Measurements
Dale & Time
50.00 I 49.00
48.00
47.00
46.00
0 45.00 >
(!)
~ 44.00 o; ., u. 43 00
4200 J _ _ I
------1---------------- - - ·-··----------- - - ---- --.-· - -- .
41.00 i 40 00 j --- - ----- ----------------------11!-39 00 ~ 38.00
4124106 4124/06 4125/06 4125106 4/26/06 4/26/06 4/27106 4/27106 4128/06 4/28106 4129106
04/24106 04124/05 04.'25106 04125106 04126106 04/261015 04/27106 04/27106 04128'06 04/28'06 04129/06
8.00 .,------ ---- Tii:r--- -------- - - ----------- - -t!------ - - - --, 8 00
7 50
7.00
6.00
6.50
5.00 JJ 0 6.00 Ill
> 0 (!)
~ 4_00 5 50 0 > i (!)
u. ~ 5.00 ~
3 00 "' u.
4.50
2.00
4 00
1 00 .3 50
0.00 3.00
-e-PW- 1 -e- PW-1, Hand Measurements ~OBS-1

10.000
1.000
:; ::::.. c ~ 0
'"0 ~ ~ .._
0
0.100
0.1
FIGURE 3
FLPP/FPL TURKEY POINT EXPANSION PROJECT (UNIT 5), UPPER FLORIDAN AQUIFER PERFORMANCE TEST Well PW-3, Orawdown vs. Elapsed Time
I -~ -I~ ~
-I I i I
1
- ~= - [,
10
l-
Elapsed Time (min)
1-+- PW-3;
_j-- -1 -- I
I I
I i
1 I
100 1000
1-
10000
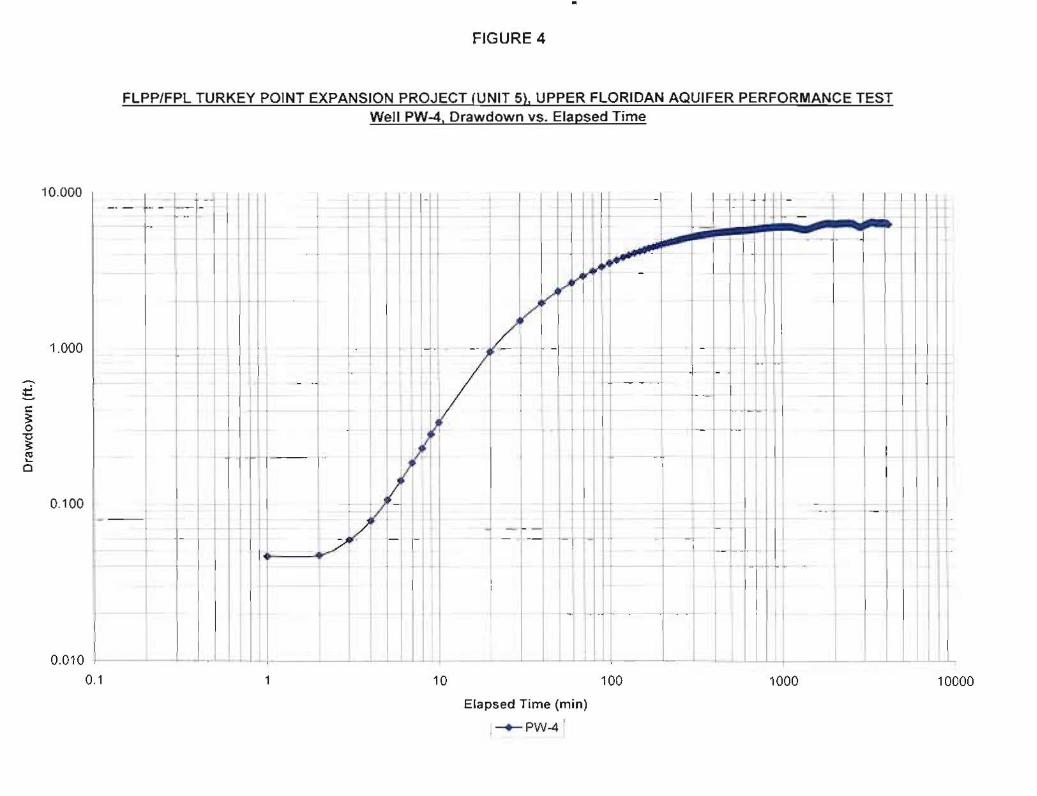
-~ c: 3: 0 "0 3: ~ '-0
10.000
1.000
0.100
FIGURE 4
FLPP/FPL TURKEY POINT EXPANSION PROJECT (UNIT 5), UPPER FLORIDAN AQUIFER PERFORMANCE TEST Well PW-4, Drawdown vs. Elapsed Time
··- ·--- - I
I 1 J l . 1 i ll.--
f -
--- -I r I ~ ·
1. ._ I l .. ··--.
1 ,- ,- , ..
I - - - I -
1 - -- · -· '
I .T . i ..
I
,, _ j_
0.010 . 0.1 10 100 1000
Elapsed Time (min)
_._ PW-4'
I L
10000
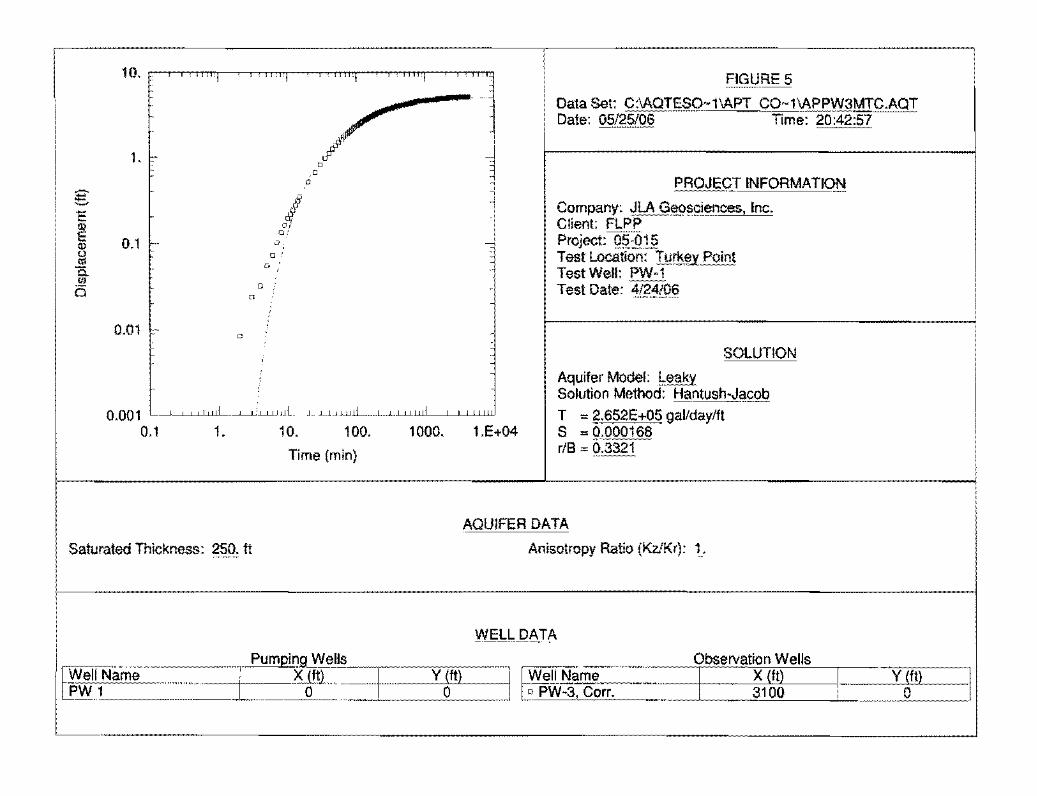
'
I I 1.1 I I IIi.! 11111
1. '
l o:
0.1
om ··
IIi
. l
FIGURE 5
Data Set: C:\AQTE$0•1\APT C0·1\APPW3MTC.AQT Date: os/g§/()6 ··············· Time'20:42:57 ~
PROJEQT INFORMATION
Company: ~LA G@$9J~!)Ces, Inc. Client: FLPP Project: Q!LQ15 Test Location: Tur!!.~J! Point Test Well: PW·1 Test Date: 4.@.~6
SOLUTION
Aquifer Model: beaky
Q.QQ1 L-~~.uL.-.-.-J ........... l.LW.J.JJJl .I J ___ I_JJ .. I..I.!L. •••. I ••• J...LLiwL~~-'.WJ
Solution Method: Hantush·Jqgob T = g.652E+05 gal/day/It
0.1 1. 10. 100. 1000. s = Q.Q00168
Time (min) r/8 = Q.3321
AQUIFER DATA
Saturated Thickness: 250. It Anisotropy Ratio (KzJKr): 1.
WELL DATA
:_··~_t_ "tftJ ~ :.-l---'-v*6fl"--l --1. . -_-...J+I:.-:.-:.-~_,.~c.\_1"'(o'*ft,._o-:::_-:::_-:::_j1_.~--_,_\if(ft'L.) ~-1 I Gwpw".I .. I.1.Nami'- mm Pumpi~g~ells ··.·.·.·.·_-11 ~--ow __ PeWil.[3~c"o··,~,·. ==---.··.·... Observation Wells -~ ... 1

10, r ' ' FIGURE 6 ' .... ' - Data Set: C:\AQTES0-1\Af>LC0-1\Af'Jf'\1>14C.AQT / Date: 05125106 Time: 20:40:03
c ? 0
0
' 0 '
- 1. • .j PROJEQT INFORMI\JIOI\! ~
,,
' ' 4 Company: ~-LA Geosciences~ Inc. 1:: ' ' ' ' • 4 Client: FLPP "' ' ' E . 4
' ' ' Project: Q~:Q1§ "' ' 4 ' 0 il 0 Test Location: Turkey _ _P.Qj[!t . . Ci q Test Well: PW·t ,;a • Test Date: 4i24i06 0
0.1 - Cl' -. ' . 0 c
' ' 0
' ,.
' SOLUTION
f
·- ......... _ ' Aquifer Model: Leaky '
' Solution Method: Hantush-Jacob
' O.D1 ' c .-.L-.LL.l.LL-:.~ ' -----"----------L T = g,2~.E:t.OS gaUdaylft
1. 10. 100. 1000. 1 .E+04 s = 0.0003095
Time (min) riB= 0.3085 ' ' ' '
AQUIFER DATA
Saturated Thickness: 250. It Anisotropy Ratio (Kz!Kr): 1.
WELL DATA
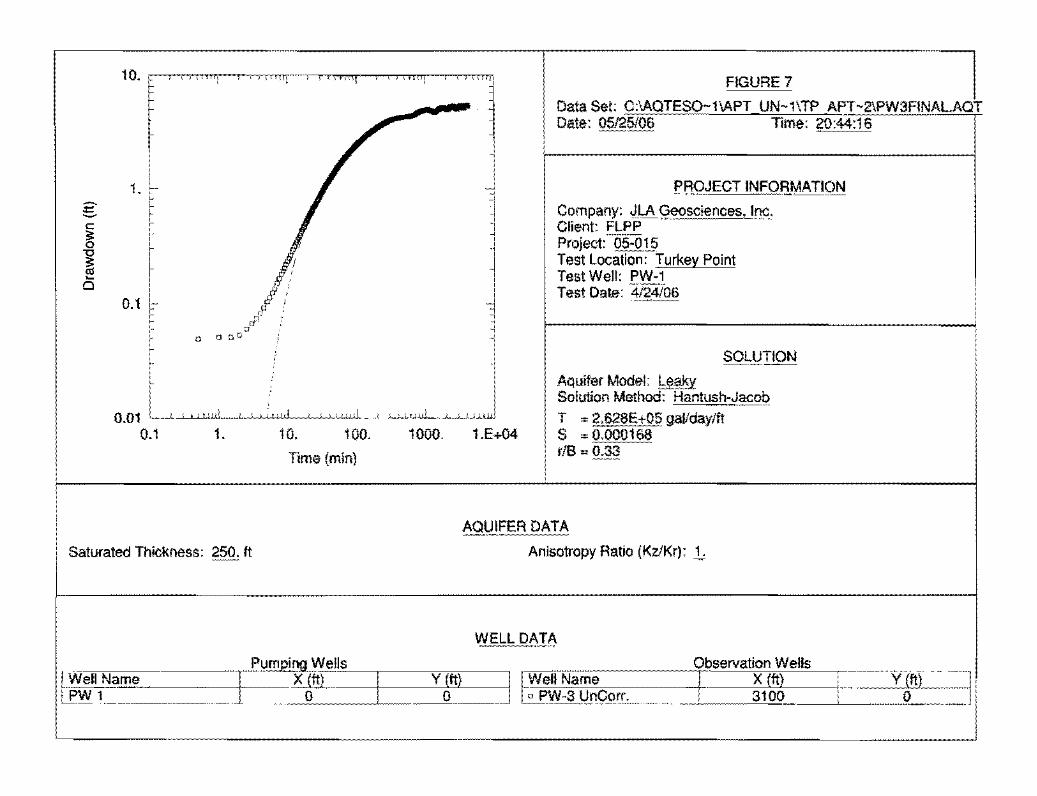
10. ' e
~ 1. ,_
= . - ' c -' ;; ' 0 '
" • '
~ ' f - ' 0 ' ' ' 0.1 ' ,. --.
1. 10. 100.
Tlme (min)
Saturated Thickness: 250. ft
, , ,, , I
__,-~ I
FIGURE7 ...... l Data Set: C:\AQTES0-1\APT UN-1\TP APT-2\PW3FINAL.AQT Date: 05125106 Time: go:44:16
: : r-------------------------~
' ., ' .,
~ ·•
j cl -
1000. t.E+04
I'FIQJECT INFO!lMATION
Company: ~-LA q~sciences. lqc;. Client: FLPP Project: 55-o !§ Test Location: Turkey Point Test Well: f'W-_1 Test Date: 4/?4106
Aquifer Model: Le<jl<y Solution Method: Hantush-Jacob T = gal/day/It s = riB=
AQUIFER DATA
Anisotropy Ratio (Kz/Kr): 1_,
WELL DATA
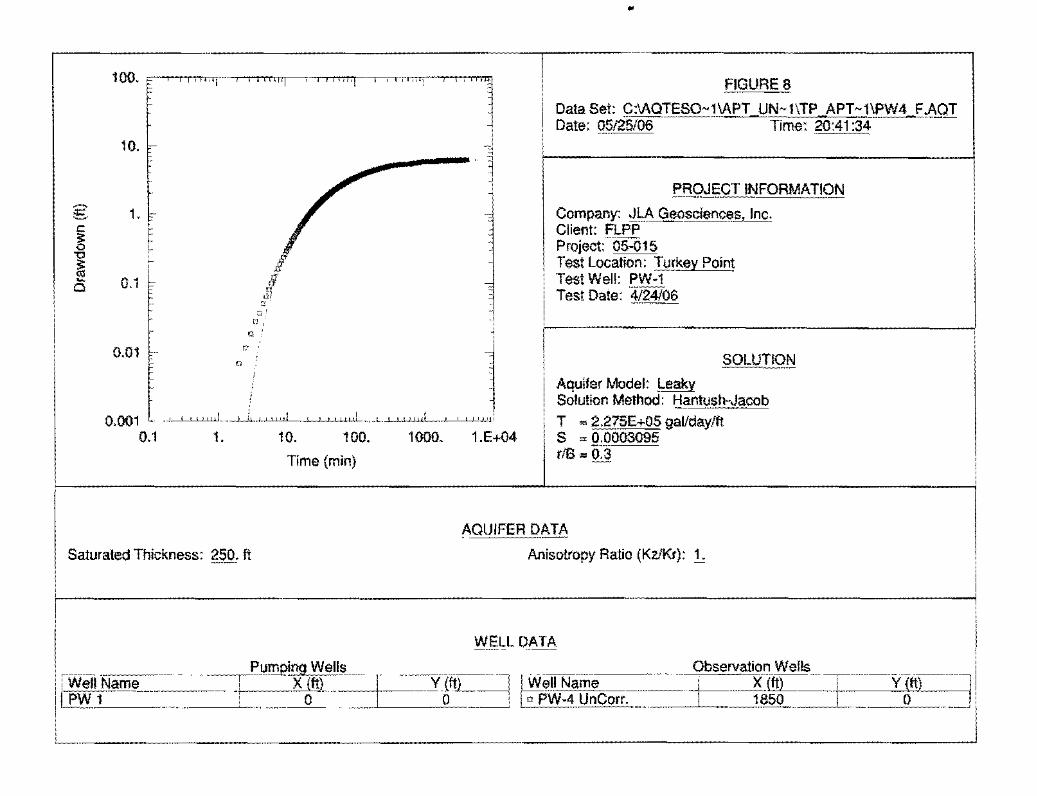
10.
-E 1. c ' ~ r ,, 0 c 'C
~ ' - 0.1 0
u'
0.01
0.001 o. 1 1.
Saturated Thickness: ~50. It
10. 100.
Time (min)
1000. 1 .E+04
•
FIGURES
Data Set: C:IAQTES0·11APT UN-1\TP APT-1\PW4 F.AQT Date: ost25!os ____ .. Time: 20:41 :34 .... - ... ·--
f>RgJt;CT 11\jFORMATION
Company: JhA Geoscien~~ Inc~ Client: FLPP Project: '()5=015 Test Locali<)n: Tu!~ey Poin! Test Well: PW-1 Test Date: 4L241jl6
Aquifer Model: ~eaky Solution Method: f:lantu_sh-Jacob T ~ 2.275E+05 gal/day!lt s = 0.0003095 riB. o:3
AQUIFER DATA
Anisotropy Ratio (Kz!Kr): L
WELL DATA
-'l~itl- ''' l I ~;~~4·~~c0ri~~:- m t~ati~lr~T =-YA!Q:=::l i '
-' .. ----------------------------------'