United States Country Team Report Third NTA Workshop Honolulu, Hawaii January 20, 2006.
40
United States Country Team Report Third NTA Workshop Honolulu, Hawaii January 20, 2006
-
Upload
reynold-porter -
Category
Documents
-
view
215 -
download
0
Transcript of United States Country Team Report Third NTA Workshop Honolulu, Hawaii January 20, 2006.

United States Country Team Report
Third NTA Workshop
Honolulu, Hawaii
January 20, 2006

Team members
• Pablo Comelatto
• Avi Ebenstein
• Ron Lee
• Tim Miller
• Eric Shiff
• Gretchen Stockmayer

Accomplishments
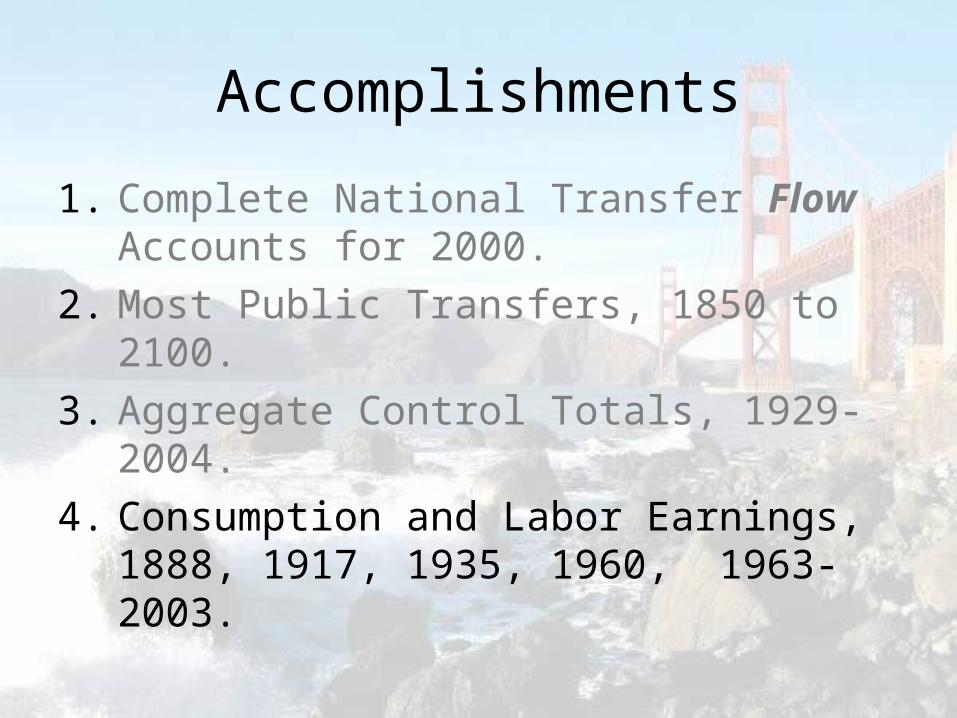
1. Complete National Transfer Flow Accounts for 2000.
2. Most Public Transfers, 1850 to 2100.
3. Aggregate Control Totals, 1929-2004.
4. Consumption and Labor Earnings, 1888, 1917, 1935, 1960, 1963-2003.
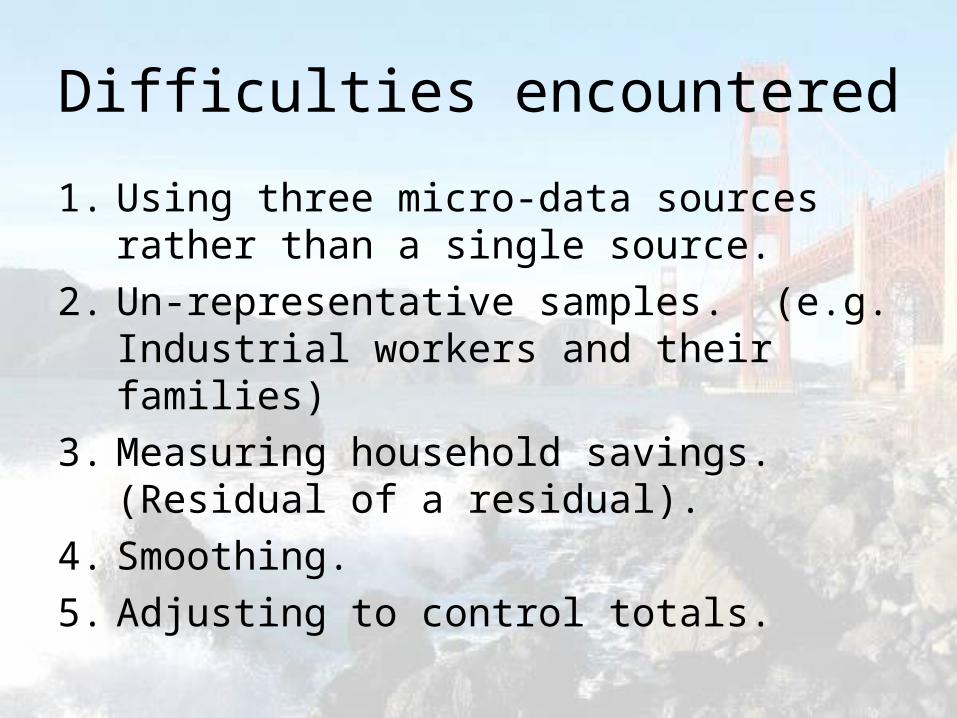
Difficulties encountered
1. Using three micro-data sources rather than a single source.
2. Un-representative samples. (e.g. Industrial workers and their families)
3. Measuring household savings. (Residual of a residual).
4. Smoothing.
5. Adjusting to control totals.
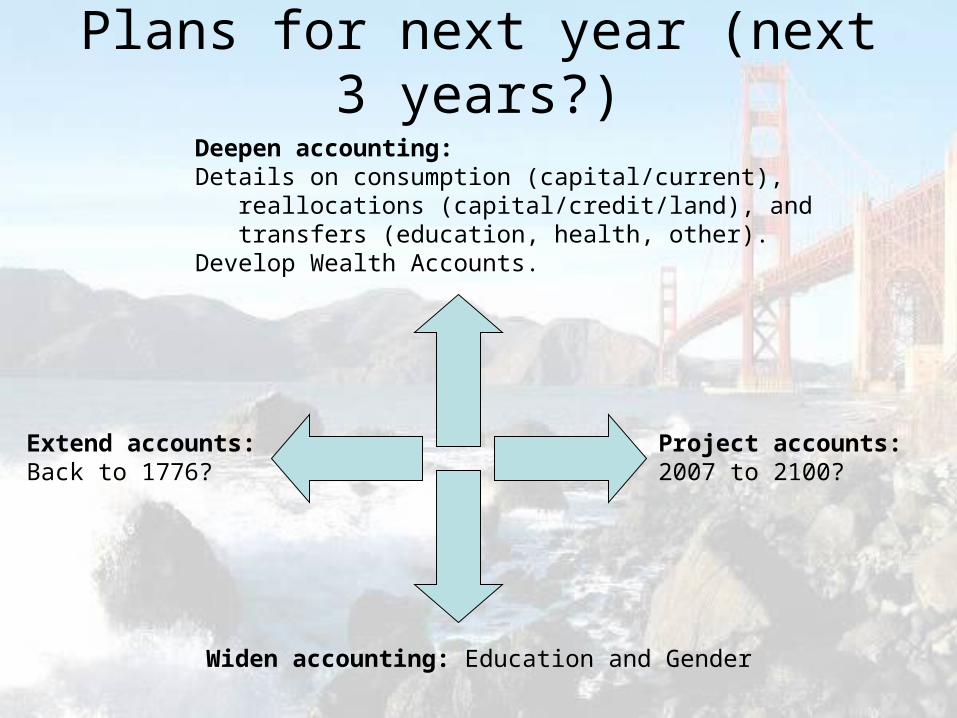
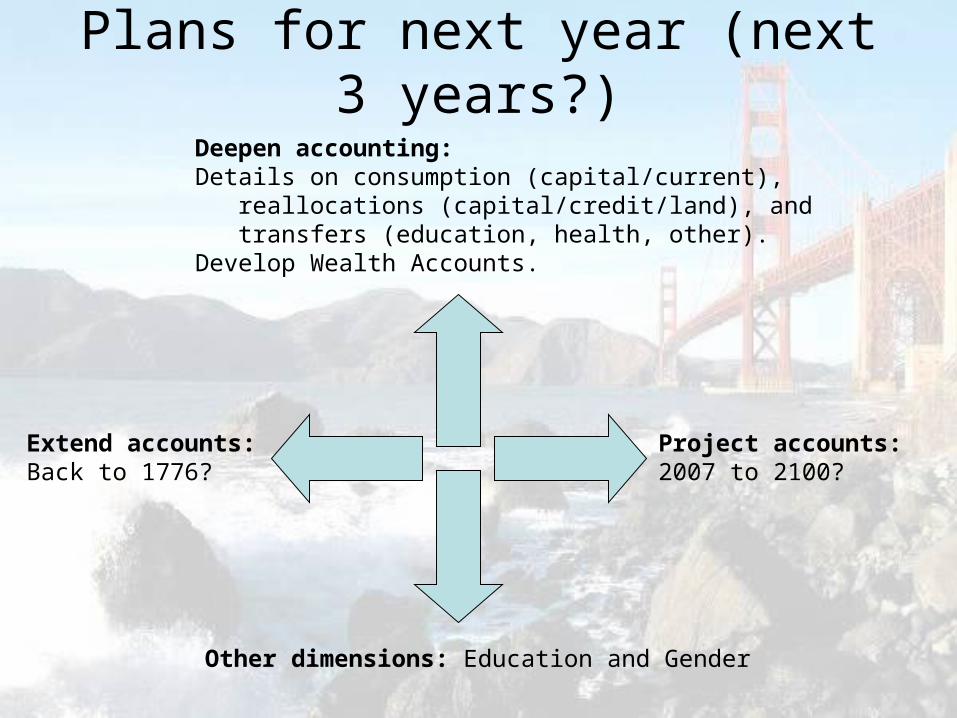
Plans for next year (next 3 years?)
Deepen accounting:Details on consumption (capital/current), reallocations (capital/credit/land), and transfers (education, health, other).Develop Wealth Accounts.
Project accounts:2007 to 2100?
Widen accounting: Education and Gender
Extend accounts:Back to 1776?

Accomplishments
1. Complete National Transfer Flow Accounts for 2000.
2. Most Public Transfers, 1850 to 2100.
3. Aggregate Control Totals, 1929-2004.
4. Consumption and Labor Earnings, 1888, 1917, 1935, 1960, 1963-2003.

0 20 40 60 80
10
20
30
40
50
60
70
80
Inflow of Resources, US 2000
Age
$ 0
00
s

0 20 40 60 80
10
20
30
40
50
60
70
80
Outflow of Resources, US 2000
Age
$ 0
00
s

0 20 40 60 80
0
20
40
60
80
Inflow of Resources, US 2000
Age
$ 0
00
s
Labor Income Public TransfersPrivate Transfers
Assets
Composition of Per-Capita Inflow of Resources By Age
0 20 40 60 80
0
20
40
60
80
Outflow of Resources, US 2000
Age
$ 0
00
s
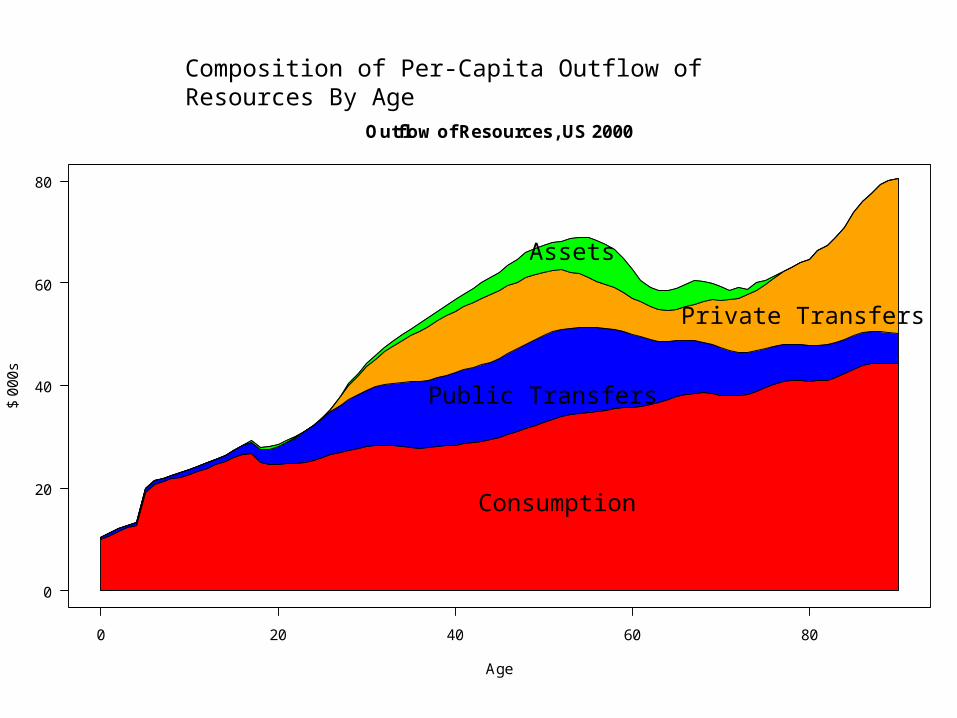
Consumption
Public Transfers
Private Transfers
Assets
Composition of Per-Capita Outflow of Resources By Age

0
10
20
30
40
50
0
10
20
30
40
50
0 20 40 60 80
-20
-10
0
10
20
30
40
0 20 40 60 80 0 20 40 60 80
0
10
20
30
40
50
0
10
20
30
40
50
0 20 40 60 80
-20
-10
0
10
20
30
40
Inflo
wO
utflo
wN
et
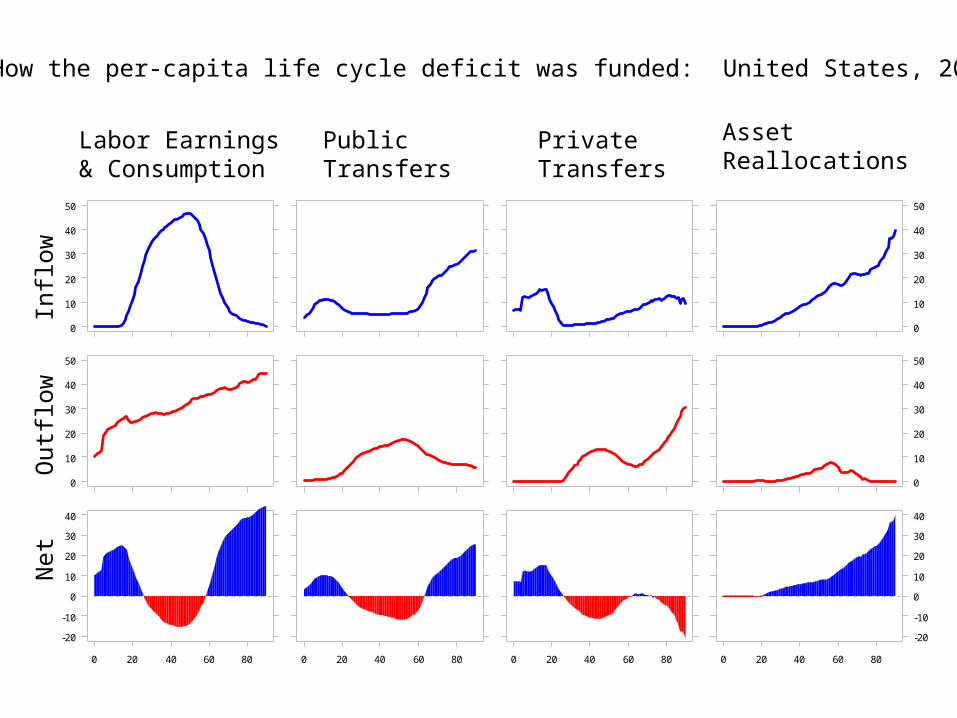
PublicTransfers
PrivateTransfers
AssetReallocations
Labor Earnings& Consumption
How the per-capita life cycle deficit was funded: United States, 2000
0
10
20
30
40
50
0
10
20
30
40
50
0 20 40 60 80
-20
-10
0
10
20
30
40
0 20 40 60 80 0 20 40 60 80
0
10
20
30
40
50
0
10
20
30
40
50
0 20 40 60 80
-20
-10
0
10
20
30
40
Inflo
wO
utflo
wN
et
PublicTransfers
PrivateTransfers
AssetReallocations
Labor Earnings& Consumption
How the per-capita life cycle deficit was funded: United States, 2000

0 20 40 60 80
0
50
100
150
200
250
Inflow of Resources, US 2000
Age
$ b
illio
ns
Labor Income
AssetsPublic Transfers
Composition of Aggregate Inflow of Resources By Age
0 20 40 60 80
0
50
100
150
200
250
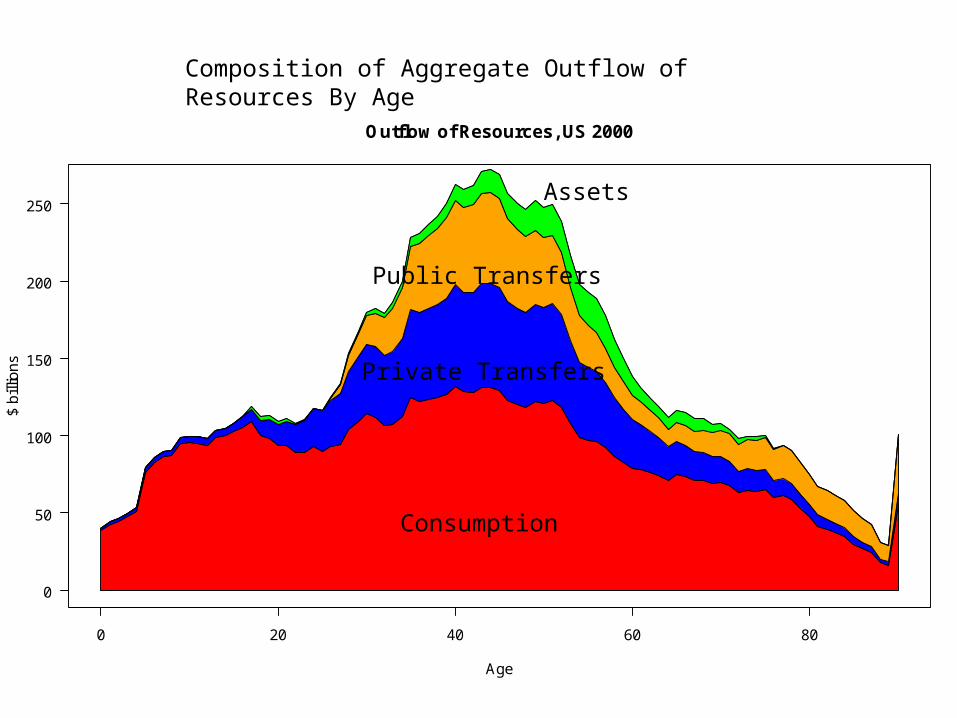
Outflow of Resources, US 2000
Age
$ b
illio
ns
Consumption
Private Transfers
Public Transfers
Assets
Composition of Aggregate Outflow of Resources By Age

Inflo
wO
utflo
wN
et
PublicTransfers
PrivateTransfers
AssetReallocations
Labor Earnings& Consumption
How the aggregate life cycle deficit was funded: United States, 2000
0
50
100
150
200
0
50
100
150
200
0 20 40 60 80
-100
-50
0
50
100
0 20 40 60 80 0 20 40 60 80
0
50
100
150
200
0
50
100
150
200
0 20 40 60 80
-100
-50
0
50
100

Accomplishments
1. Complete National Transfer Flow Accounts for 2000.
2. Most Public Transfers, 1850 to 2100.
3. Aggregate Control Totals, 1929-2004.
4. Consumption and Labor Earnings, 1888, 1917, 1935, 1960, 1963-2003.

Accomplishments
1. Complete National Transfer Flow Accounts for 2000.
2. Most Public Transfers, 1850 to 2100.
3. Aggregate Control Totals, 1929-2004.
4. Consumption and Labor Earnings, 1888, 1917, 1935, 1960, 1963-2003.
1940 1960 1980 2000
20
30
40
50
Year
Pe
rce
nt
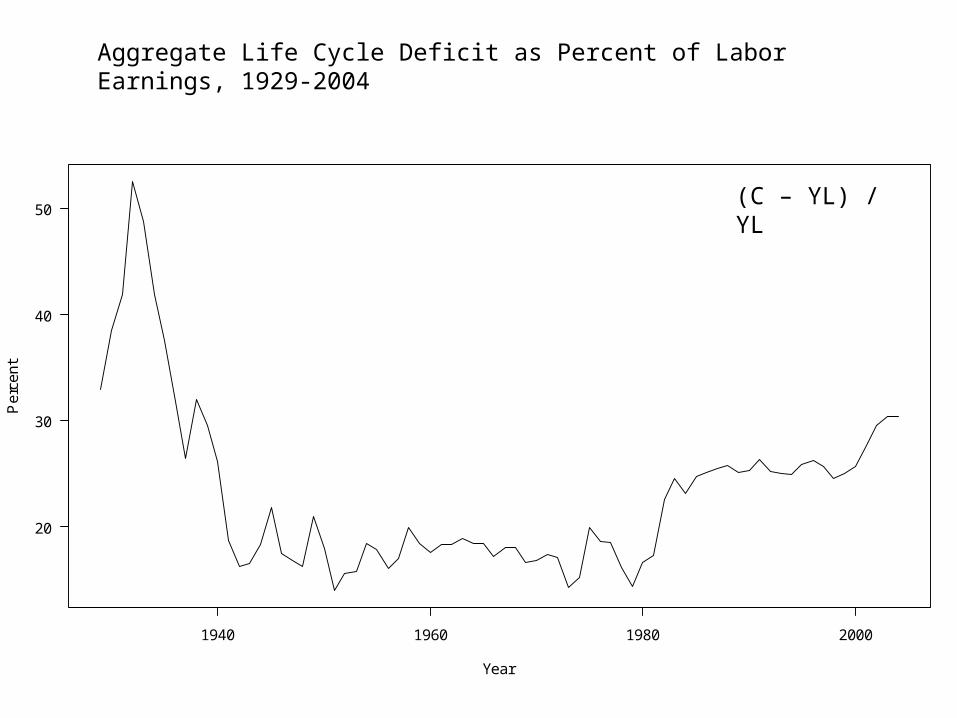
Aggregate Life Cycle Deficit as Percent of Labor Earnings, 1929-2004
(C – YL) / YL
Accomplishments
1. Complete National Transfer Flow Accounts for 2000.
2. Most Public Transfers, 1850 to 2100.
3. Aggregate Control Totals, 1929-2004.
4. Consumption and Labor Earnings, 1888, 1917, 1935, 1960, 1963-2003.

02,
000
4,00
06,
000
Fre
quen
cy
010
020
030
0$
0 5 10 15 20 25 30 35 40 45 50 55 60 65 70 75 80 85 90
Labor Income Other Inc Consumption Health Frequency
Source: Consumer Expenditure Survey. Health spending is for 'sickness and death'
Age YLE 35 Age C 26 Totals in Thousands YLE 5094 KY 390 C 4802
United States - 1888Smoothed Income and Consumption by Age
05,
000
10,0
0015
,000
Fre
quen
cy
020
040
060
080
0$
0 5 10 15 20 25 30 35 40 45 50 55 60 65 70 75 80 85 90
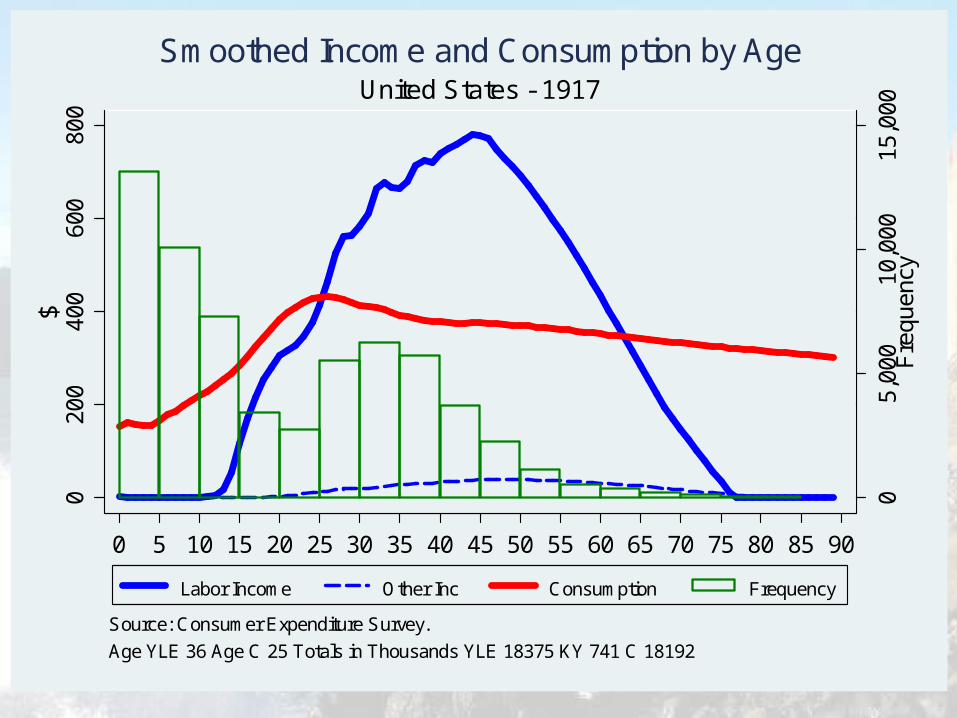
Labor Income Other Inc Consumption Frequency
Source: Consumer Expenditure Survey.
Age YLE 36 Age C 25 Totals in Thousands YLE 18375 KY 741 C 18192
United States - 1917Smoothed Income and Consumption by Age

050
01,
000
1,50
02,
000
2,50
0F
requ
ency
020
040
060
080
0$
0 5 10 15 20 25 30 35 40 45 50 55 60 65 70 75 80 85 90
Labor Inc Other Inc Cons Health Education Frequency
Source: Consumer Expenditure Survey.
Age YLE 43 Age C 32 Totals in Thousands YLE 7370 KY 360 C 9631
United States - 1935Smoothed Income and Consumption by Age
01,
000
2,00
03,
000
4,00
05,
000
Fre
quen
cy
01,
000
2,00
03,
000
4,00
0$
0 5 10 15 20 25 30 35 40 45 50 55 60 65 70 75 80 85 90
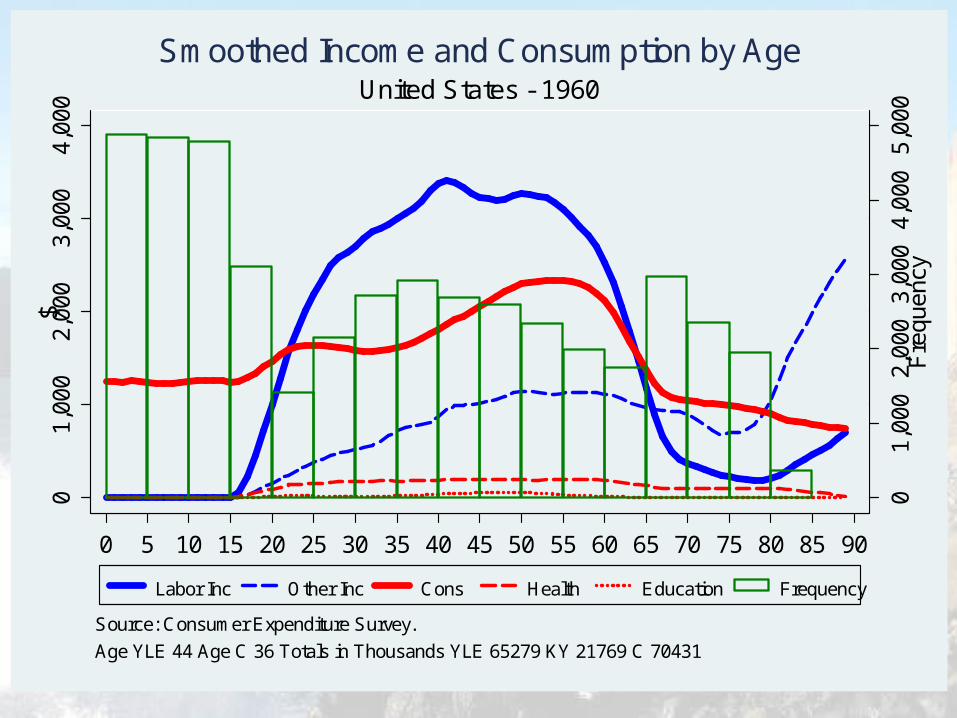
Labor Inc Other Inc Cons Health Education Frequency
Source: Consumer Expenditure Survey.
Age YLE 44 Age C 36 Totals in Thousands YLE 65279 KY 21769 C 70431
United States - 1960Smoothed Income and Consumption by Age
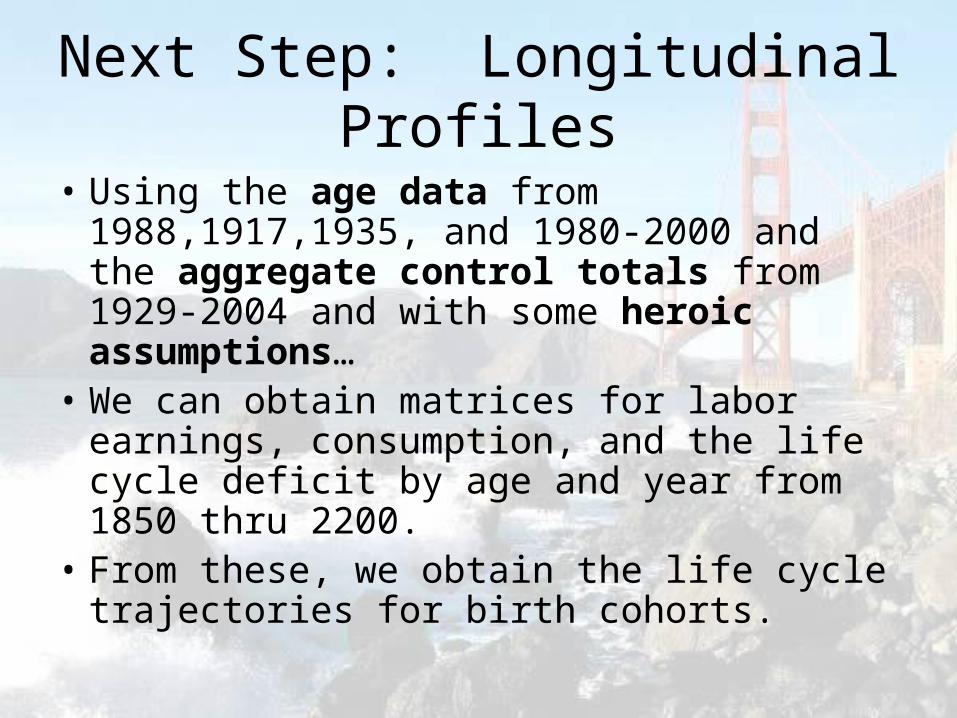
Next Step: Longitudinal Profiles
• Using the age data from 1988,1917,1935, and 1980-2000 and the aggregate control totals from 1929-2004 and with some heroic assumptions…
• We can obtain matrices for labor earnings, consumption, and the life cycle deficit by age and year from 1850 thru 2200.
• From these, we obtain the life cycle trajectories for birth cohorts.

Warning
These are preliminary results. We cut a few corners in getting the data ready. Best viewed as an example of what we’re going to be doing (more carefully).

0 20 40 60 80
-10
00
-50
00
50
01
00
01
50
0
Per-capita Life Cycle Deficit in 1850
Age
Ye
ar
20
00
do
llars
Ages 25 to 62

0 20 40 60 80
-20
00
0-1
00
00
01
00
00
20
00
03
00
00
Per-Capita Life Cycle Deficit in 2000
Age
Ye
ar
20
00
do
llars
Age 24 to 59
0 20 40 60 80
-0.4
-0.2
0.0
0.2
0.4
0.6
0.8
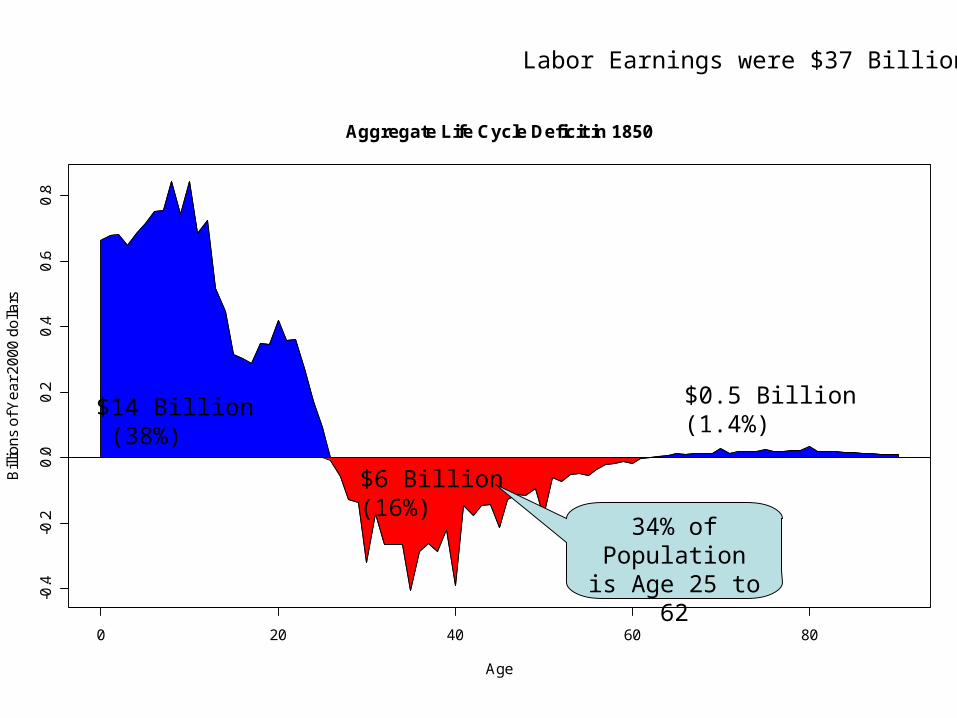
Aggregate Life Cycle Deficit in 1850
Age
Bill
ion
s o
f Ye
ar
20
00
do
llars
$14 Billion (38%)
$6 Billion(16%)
$0.5 Billion(1.4%)
Labor Earnings were $37 Billion
34% of Population is Age 25 to 62

0 20 40 60 80
-50
05
0
Aggregate Life Cycle Deficit in 2000
Age
Bill
ion
s o
f Ye
ar
20
00
do
llars
$1.4 Trillion(22%)
Labor earnings were $6.6 Trillion
$1.0 Trillion(17%)
$1.9 Trillion(30%)
50% of Population is Age 24 to 59

0 20 40 60 80 100
05
00
01
00
00
15
00
0
Consumption and Labor Earnings, 1850 Birth Cohort
Age
Am
ou
nt i
n 2
00
0 d
olla
rs

0 20 40 60 80 100
01
00
00
20
00
03
00
00
40
00
0
Consumption and Labor Earnings, 1900 Birth Cohort
Age
Am
ou
nt i
n 2
00
0 d
olla
rs
0 20 40 60 80 100
02
00
00
40
00
06
00
00
80
00
0
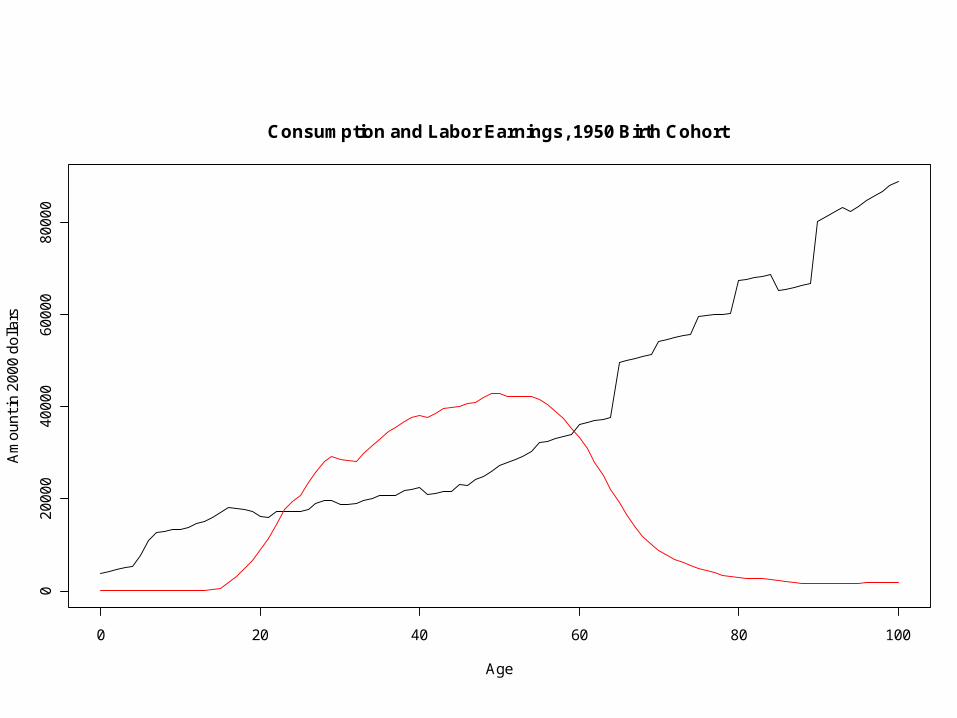
Consumption and Labor Earnings, 1950 Birth Cohort
Age
Am
ou
nt i
n 2
00
0 d
olla
rs

0 20 40 60 80 100
05
00
00
10
00
00
15
00
00
Consumption and Labor Earnings, 2000 Birth Cohort
Age
Am
ou
nt i
n 2
00
0 d
olla
rs
0 20 40 60 80 100
-10
00
00
10
00
02
00
00
30
00
04
00
00
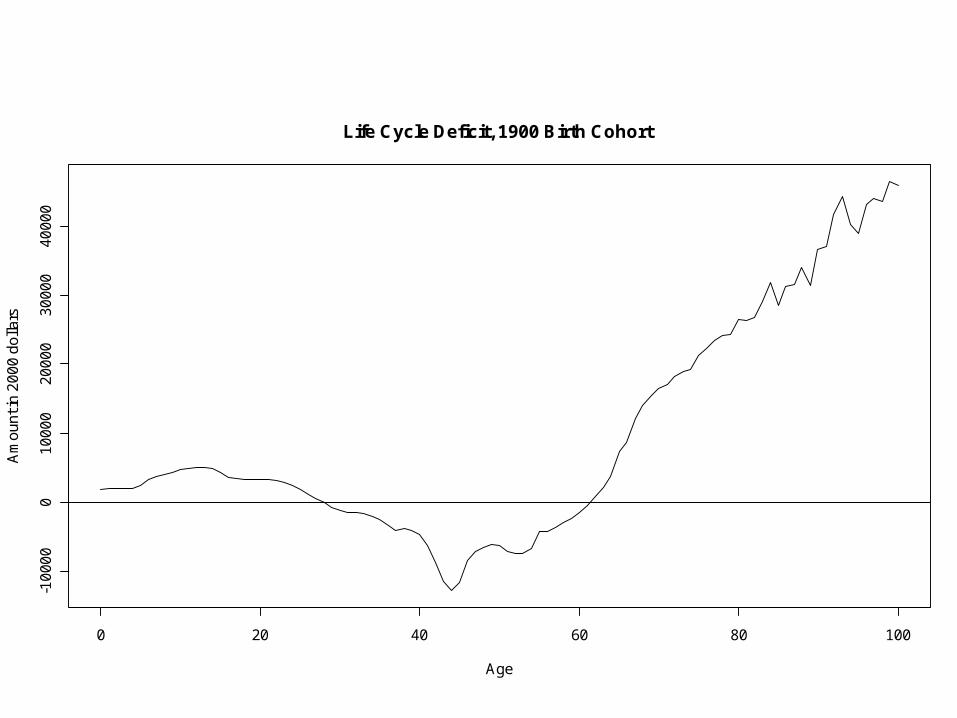
Life Cycle Deficit, 1900 Birth Cohort
Age
Am
ou
nt i
n 2
00
0 d
olla
rs
0 20 40 60 80 100
-15
00
0-1
00
00
-50
00
05
00
0
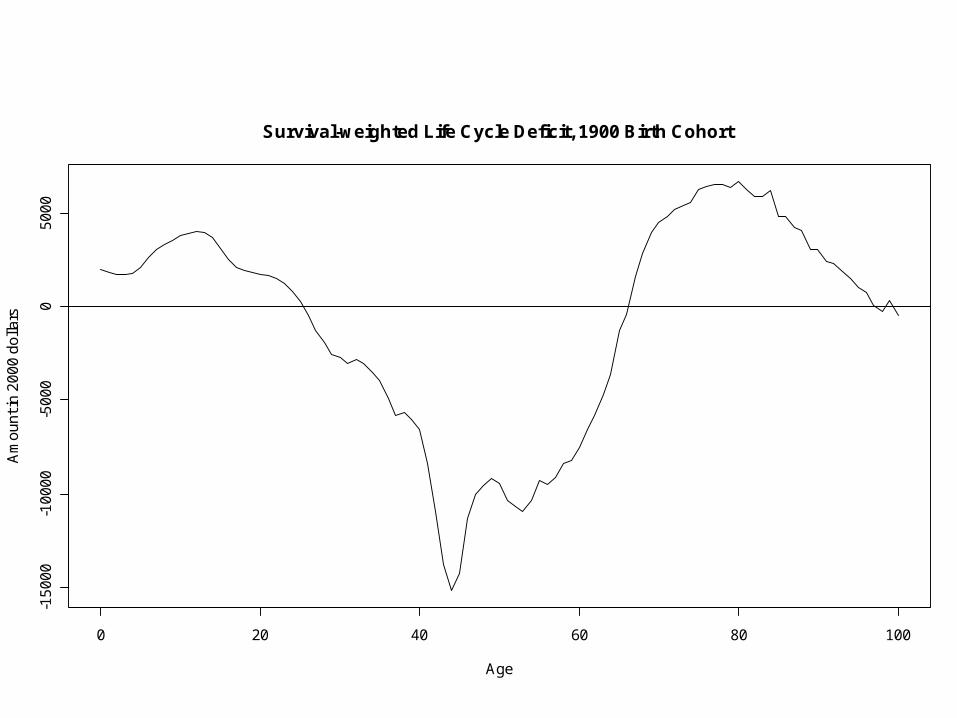
Survival-weighted Life Cycle Deficit, 1900 Birth Cohort
Age
Am
ou
nt i
n 2
00
0 d
olla
rs

0 20 40 60 80 100
-10
-50
51
0
Survival-weighted Life Cycle Deficit by Birth Cohort
Age
Pe
rce
nt o
f Life
time
Ea
rnin
gs
Born 1850Born 1900Born 1950Born 2000
1850 1900 1950 2000 2050
1.3
01
.35
1.4
01
.45
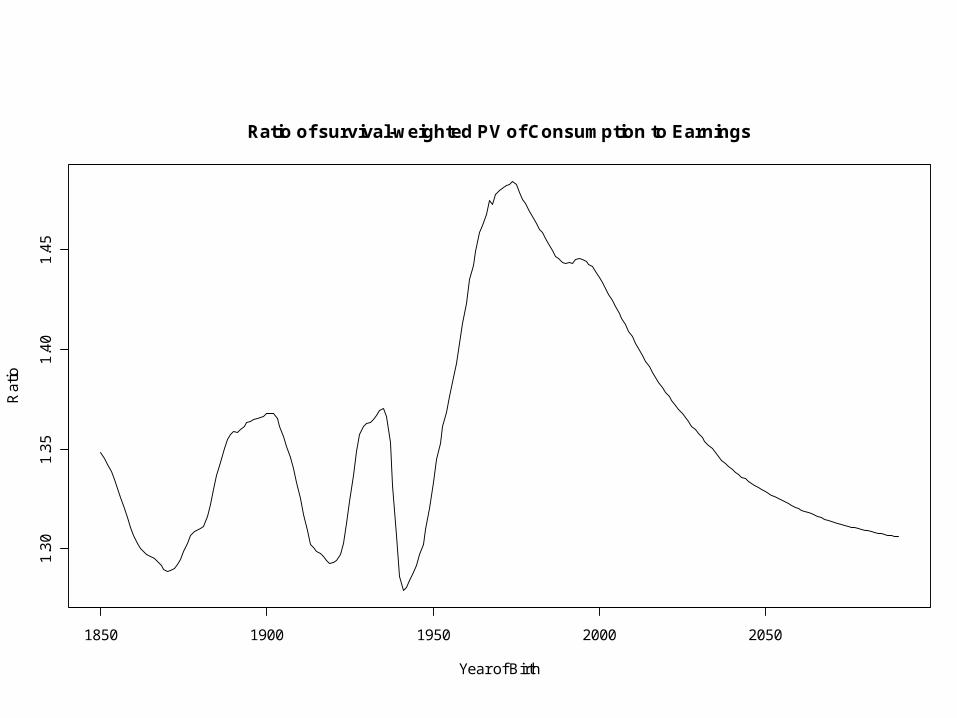
Ratio of survival-weighted PV of Consumption to Earnings
Year of Birth
Ra
tio

Difficulties encountered
1. Using three micro-data sources rather than a single source.
2. Un-representative samples. (e.g. Industrial workers and their families)
3. Assigning educational expenditures.
4. Measuring household savings. (Residual of a residual).
5. Measuring the capital stock.
Plans for next year (next 3 years?)
Deepen accounting:Details on consumption (capital/current), reallocations (capital/credit/land), and transfers (education, health, other).Develop Wealth Accounts.
Project accounts:2007 to 2100?
Other dimensions: Education and Gender
Extend accounts:Back to 1776?


![[PPT]ALOHA FROM HAWAII - WordPress.com · Web view* HONOLULU - HARBOUR HONOLULU - AIRPORT HONOLULU IOLANI PALACE - HONOLULU ROYAL GUARD KAMEHAMEHA THE GREAT LAIE MORMON TEMPLE HONOLULU](https://static.fdocuments.in/doc/165x107/5af655b67f8b9a5b1e8effdc/pptaloha-from-hawaii-view-honolulu-harbour-honolulu-airport-honolulu-iolani.jpg)