United Republic of Tanzania - who.int · in Tanzania, 2009 pharmaceutical personnel per 1,000 pop...
30
1 Country Data Profile on the Pharmaceutical Situation in the Southern African Development Community (SADC) United Republic of Tanzania This document is not a formal publication of WHO and does not necessarily represent the decisions or the stated policy of the Organization.
Transcript of United Republic of Tanzania - who.int · in Tanzania, 2009 pharmaceutical personnel per 1,000 pop...

1
Country Data Profile on the Pharmaceutical Situation in the Southern African Development Community (SADC)
United Republic of Tanzania
This document is not a formal publication of WHO and does not necessarily represent the decisions or the stated policy of the Organization.

2
Outline of the Profile
Country UNITED REPUBLIC OF TANZANIA
Name of Coordinator/Principal
Respondent
Rose Shija
Position EDM/NPO
E-mail address [email protected]
Tel number 255 22 2113005
Date Submitted 5 October 2009
Name of Endorser Dr Margaret Evelyn Mhando
Position of Endorser Director of Hospital Services
Methodology …………………………………..……………….….…p. 3
Part 1- Health and Demographic Data…………………………….. p. 4
Part 2- Health Services……………………………………….….. .....p. 6
Part 3- Policy and Regulatory Framework…………………………p. 8
Part 4- Financing…………………………………………………......p. 13
Part 5- Patents……………………………………………………......p. 17
Part 6- Supply…………………………………………………...……p. 18
Part 7- Selection and Rational Use of Medicines…………………..p. 25
Part 8- Household data…………………………………………...….p. 30

3
Methodology
The SADC Pharmaceutical Business Plan 2007-2013 aims at ensuring availability of essential medicines, including African traditional medicines, in order to reduce disease burden in countries. Within this context, the United Republic of Tanzania has collaborated with WHO in the collection and analysis of data on it's pharmaceutical situation. This information will be used as a baseline before embarking on the implementation of the Pharmaceutical Business Plan, and will be used: to take stock of the pharmaceutical situation and identify areas in need of strengthening and support; to compare results with those of other countries fostering a sharing of experiences and enabling identification of strengths and opportunities for cooperation; and to measure over time the impact of the support provided by the SADC Secretariat, WHO and other partners.
A questionnaire on pharmaceutical policies and structures was developed by WHO based on previous tools elaborated by the organization and other leading partners such as the Medicines Transparency Alliance. To facilitate the work at country level, the questionnaire was filled in at central level by WHO with data available from global sources (e.g. WHO Statistical System) as well as with specific information available within the Essential Medicines Department of WHO. This included not only the WHO 2007 Level I Survey, but also country-specific assessments such as the level II facility survey1, the WHO/HAI pricing surveys2 etc. After being populated, the questionnaire was sent to the United Republic of Tanzania so that public officials could review and correct the filled data and, where possible, complete the missing data fields. A local consultant was recruited to facilitate the process and collect information from key agencies (Department of Pharmaceuticals, Central Medical Store, etc.). The names of respondents to each section were registered, in case follow-up was needed; the source of each data was also included in the questionnaire as a guarantee of the quality of the information and can be seen in the last column on each table. A senior official in the Ministry of Health has confirmed the accuracy of the information and provided permission for its publication on SADC and WHO web sites.
1 WHO Operational package for assessing, monitoring and evaluating country pharmaceutical situations. Guide for
coordinators and data collectors. Geneva, World Health Organization, 2007. 2 WHO, Health Action International, Measuring medicine prices, availability, affordability and price components 2
nd
edition, Geneva, World Health Organization, 2008.
4
PART 1- HEALTH and DEMOGRAPHIC DATA
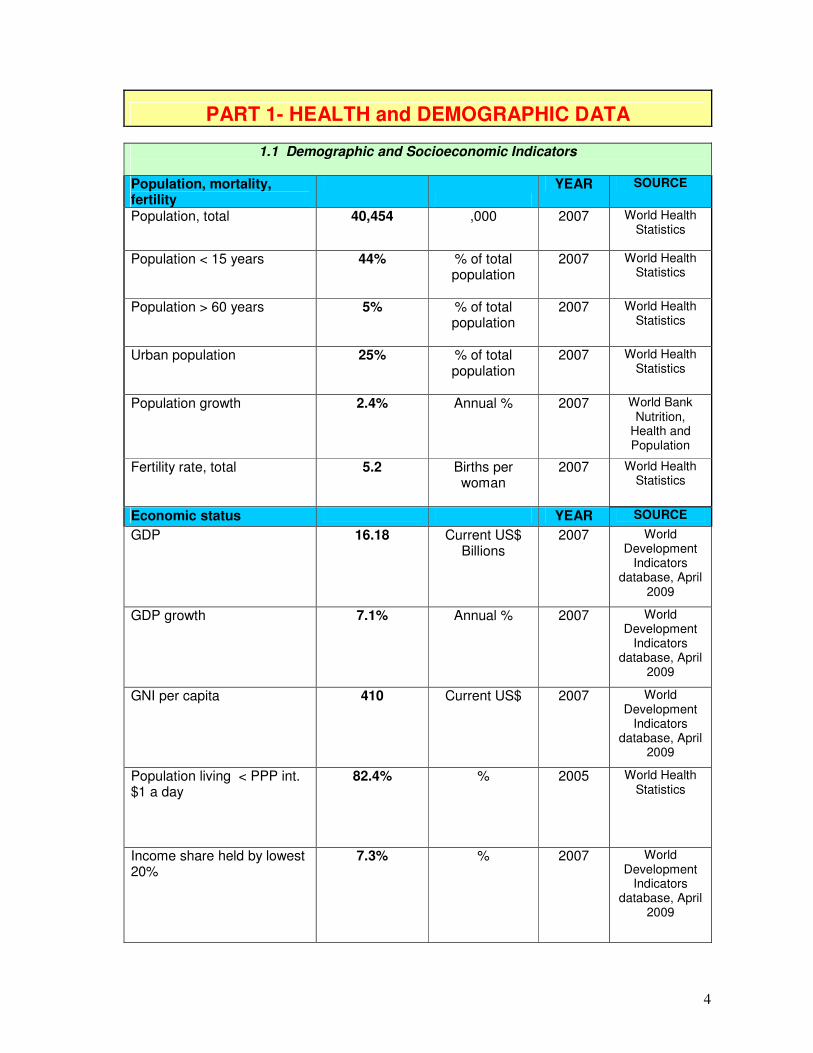
1.1 Demographic and Socioeconomic Indicators
Population, mortality, fertility
YEAR SOURCE
Population, total 40,454 ,000 2007 World Health Statistics
Population < 15 years
44% % of total population
2007 World Health Statistics
Population > 60 years
5% % of total population
2007 World Health Statistics
Urban population
25% % of total population
2007 World Health Statistics
Population growth
2.4% Annual % 2007 World Bank Nutrition,
Health and Population
Fertility rate, total
5.2 Births per woman
2007 World Health Statistics
Economic status YEAR SOURCE
GDP
16.18 Current US$ Billions
2007 World Development
Indicators database, April
2009
GDP growth 7.1% Annual % 2007 World Development
Indicators database, April
2009
GNI per capita 410 Current US$ 2007 World Development
Indicators database, April
2009
Population living < PPP int. $1 a day
82.4% % 2005 World Health Statistics
Income share held by lowest 20%
7.3% % 2007 World Development
Indicators database, April
2009

5
Education and literacy YEAR SOURCE
Adult literacy rate, 15+ years 72.3% % of total population
2000-2007
World Health Statistics
Primary school enrolment rate, males
98.0% % of male population
2006 WHOSIS
Primary school enrolment rate, females
97.0% % of female population
2006 WHOSIS
1.2 Mortality and Causes of Death
Life expectancy and mortality YEAR SOURCE
Life expectancy at birth (both sexes)
52 Years 2007 World Health Statistics
Adult mortality rate (both sexes, 15 to 60 years)
472 /1,000 population
2007 World Health Statistics
Maternal mortality ratio 578 /100,000 live births
2004/5 Demographic and Health
survey
Neonatal mortality rate 29 /1,000 live births
2007 United Republic of Tanzania HIV Malaria
Indicator Survey,
2007/2008
Infant mortality rate (between birth and age 1)
58 /1,000 live births
2007 United Republic of Tanzania HIV Malaria
Indicator Survey,
2007/2008
Under 5 mortality rate 91 /1,000 live births
2007 United Republic of Tanzania HIV Malaria
Indicator Survey,
2007/2008

6
PART 2- HEALTH SERVICES
2.1 Health Expenditures
Overall health expenditures YEAR SOURCE
Total annual expenditure on health
910,584,707 US$ average exchange rate
2006 NHA
Total annual per capita expenditure on health
23 US$ average exchange rate
2006 World Health Statistics
Health expenditures as percent of GDP
6.4% % of gross domestic product
2006 World Health Statistics
Government expenditure on health as % of total government budget
13.7% % of total government
budget
2006 World Health Statistics
Government annual expenditure on health
525,900,905
US$ average exchange rate
2006 NHA
Health expenditures by source YEAR SOURCE
Annual per capita government expenditure on health
13 US$ average exchange rate
2006 World Health Statistics
Government annual expenditure on health as % of total
57.8% % of total expenditure on
health
2006 World Health Statistics
Social security expenditure as % of government on health
0.9% % of government
expenditure on health
2006 World Health Statistics
Annual per capita private expenditure on health
9.7 US$ average exchange rate
2006 CALCULATED from World
Health Statistics
Private expenditure as % of total health expenditure
42.2% % of total expenditure on
health
2006 World Health Statistics
Private out-of-pocket expenditure as % of private health expenditure
54.3% % of private expenditure on
health
2006 World Health Statistics
Premiums for private prepaid health plans as % of total private health expenditure
7.7% % of private expenditure on
health
2006 World Health Statistics
Population covered by national, social, or private health insurance or other sickness funds
Less than 10% % of total population
2009 National Health
Insurance Fund

7
2.2 Health Personnel and Infrastructure
Personnel YEAR SOURCE
Total number of physicians 4,143 Total number
2009 Registrar, Medical Council of
Tanganyika
Physicians per 1,000 population
0.10 per 1,000 pop 2002 Registrar, Medical Council of
Tanganyika
Total number of nursing and midwifery personnel
23,168 Total number 2009 Tanzania National Nurses and midwives
council
Nursing and midwifery personnel per 1,000 population
0.57 per 1,000 pop 2002 Tanzania National Nurses and midwives
council
Total number of pharmaceutical personnel3
1,423 Total number 2009 Assessment of the HR for the
pharmaceutical sector in Tanzania, 2009
pharmaceutical personnel per 1,000 pop
0.04 per 1,000 pop 2009 Assessment of the HR for the
pharmaceutical sector in Tanzania, 2009
Total number of pharmacists4
639 Total number 2009 Assessment of the HR for the
pharmaceutical sector in Tanzania, 2009
Total number of pharmaceutical technicians and assistants5
784 Total number 2008 Assessment of the HR for the
pharmaceutical sector in Tanzania, 2009
Number of newly registered pharmacists in the previous year
46 Total number
Facilities YEAR SOURCE
Hospitals 212 Total number 2009 MOHSW, 2009
Hospital beds 11 /10,000 population
2007 World Bank Nutrition, Health and Population
Primary health care units and centres
5,406 Total number 2009 MOHSW, 2009
Licensed pharmacies 1,036 Total number 2009 Assessment of the HR for the
pharmaceutical sector in Tanzania, 2009
3 Pharmaceutical personnel include pharmacists, pharmaceutical assistants, pharmaceutical technicians and related
occupations. 4 Pharmacists store, preserve, compound, test and dispense medicinal products and counsel on the proper use and
adverse effects of drugs and medicines following prescriptions issued by medical doctors and other health
professionals. They contribute to researching, preparing, prescribing and monitoring medicinal therapies for
optimizing human health. 5 Pharmaceutical technicians and assistants perform a variety of tasks associated with dispensing medicinal
products under the guidance of a pharmacist or other health professional.

8
PART 3- POLICY and REGULATORY FRAMEWORK
3.1 Policy Framework
INDICATOR YEAR SOURCE National Health Policy exists (NHP) Yes Yes/No WHO level I
-If yes, year of the most recent document
2006 Year WHO level I
National Medicines Policy official document exists
Yes Yes/No 1991. WHO level I
-If yes, year of the most recent document
1991/2008 Year (2008 for Zanzibar)
EDMNPO
-If no, draft NMP document exists Yes Yes/No 2009 Mainland
EDMNPO
-If exists, NMP is integrated into NHP
Yes Yes/No WHO level I
National Medicines Policy Implementation Plan exists
Yes Yes/No WHO level I
-If yes, year of the most recent document
1992/20086 Year 2009 WHO level I
Traditional Medicine Policy exists Yes Yes/No EDMNPO
If yes, year of the most updated document
2000/2008 Year EDMNPO
3.2 Regulatory Framework
YEAR SOURCE Legal provision exists establishing the powers and responsibility of a Medicine Regulatory Authority (MRA)
Yes Yes/No 2003 WHO level I
Formal Medicines Regulatory Authority exists
Yes Yes/No 2007 WHO level I
-If yes, Medicines Regulatory Authority is an independent agency
Yes Yes/No 2003 TFDA
-If yes, number of regulatory staff 143 Number TFDA
-Medicines Regulatory Authority is funded from regular budget from the government
Yes Yes/No 2007 WHO level I
-Medicines Regulatory Authority is funded from fees from registration of medicines
Yes Yes/No 2007 WHO level I
6 Draft is available for mainland (2009). National Medicines Policy for Zanzibar is dated 2008.

9
Legal provisions exist for market authorization
Yes Yes/No 2007 WHO level I
WHO Certification Scheme may be part of the marketing authorization process
Yes Yes/No 2007 WHO level I
Regulatory agency has website Yes Yes/No 2007 WHO level I
-If yes, please provide URL address
www.tfda.or.tz
Address 2003 TFDA
The Regulatory Authority has a computerized information management system to store and retrieve information on registration, inspections, etc.
Yes Yes/No 2008 TFDA
3.3 Medicines Regulatory Authority Involvement in Harmonization initiatives (e.g. countries in SADC have recently established a shared network for posting medicines regulatory information)
YEAR SOURCE Regulatory Authority or MoH is actively involved in regional harmonization initiatives
Yes Yes/No 2007 WHO level I
-If yes, Regulatory Authority is actively involved in regional initiatives for the harmonization of registration of pharmaceuticals
Yes Yes/No 2009 TFDA
-If yes, Regulatory Authority is actively involved in regional initiatives for the harmonization of regulation on Clinical Trials
Yes Yes/No 2009 TFDA
-If yes, Regulatory Authority is actively involved in regional initiatives for the harmonization of laws to combat counterfeits
Yes Yes/No 2009 TFDA
-If yes, Regulatory Authority is actively involved in regional initiatives for the harmonization of Good Manufacturing Practices
Yes Yes/No 2009 TFDA
10
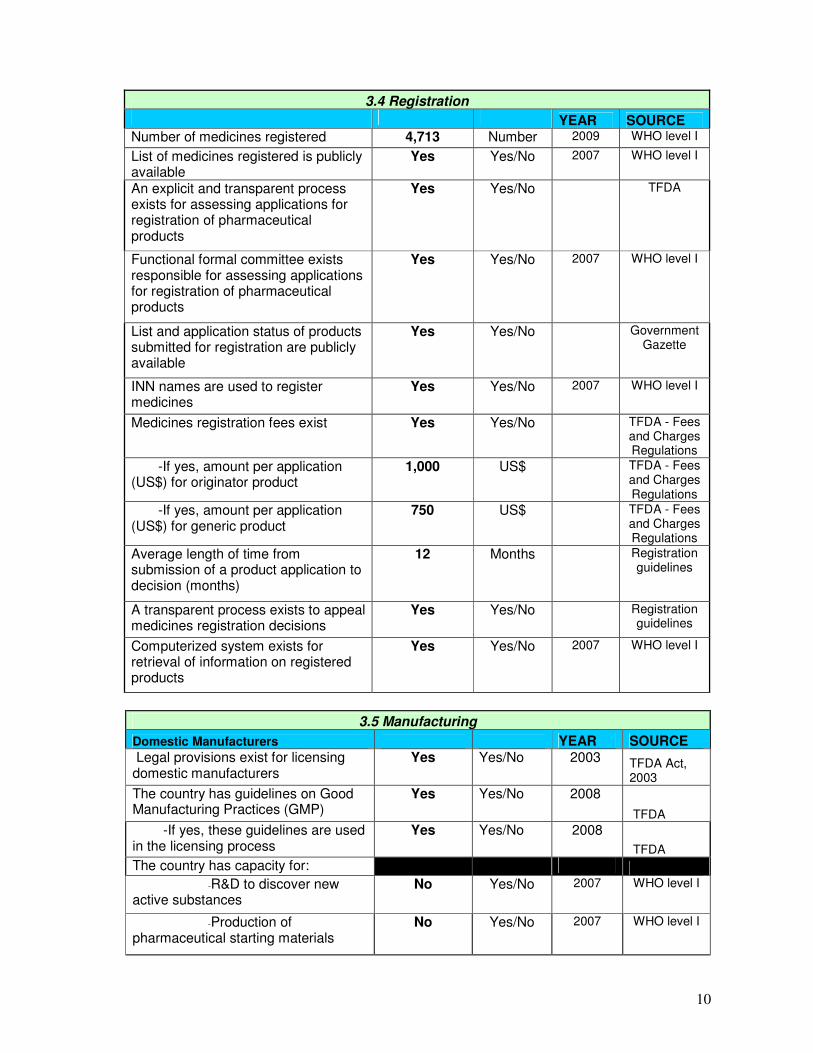
3.4 Registration YEAR SOURCE Number of medicines registered 4,713 Number 2009 WHO level I
List of medicines registered is publicly available
Yes Yes/No 2007 WHO level I
An explicit and transparent process exists for assessing applications for registration of pharmaceutical products
Yes Yes/No TFDA
Functional formal committee exists responsible for assessing applications for registration of pharmaceutical products
Yes Yes/No 2007 WHO level I
List and application status of products submitted for registration are publicly available
Yes Yes/No Government Gazette
INN names are used to register medicines
Yes Yes/No 2007 WHO level I
Medicines registration fees exist Yes Yes/No TFDA - Fees and Charges Regulations
-If yes, amount per application (US$) for originator product
1,000 US$ TFDA - Fees and Charges Regulations
-If yes, amount per application (US$) for generic product
750 US$ TFDA - Fees and Charges Regulations
Average length of time from submission of a product application to decision (months)
12 Months Registration guidelines
A transparent process exists to appeal medicines registration decisions
Yes Yes/No Registration guidelines
Computerized system exists for retrieval of information on registered products
Yes Yes/No 2007 WHO level I
3.5 Manufacturing
Domestic Manufacturers YEAR SOURCE Legal provisions exist for licensing domestic manufacturers
Yes Yes/No 2003 TFDA Act, 2003
The country has guidelines on Good Manufacturing Practices (GMP)
Yes Yes/No 2008
TFDA
-If yes, these guidelines are used in the licensing process
Yes Yes/No 2008
TFDA
The country has capacity for:
-R&D to discover new active substances
No Yes/No 2007 WHO level I
-Production of pharmaceutical starting materials
No Yes/No 2007 WHO level I

11
-Formulation from pharmaceutical starting material
Yes Yes/No 2007 WHO level I
-Repackaging of finished dosage forms
No Yes/No 2007 WHO level I
Number of domestic manufacturers 7 Number 2009 TFDA
Number of GMP compliant domestic manufacturers
2 Number 2009 TFDA
Multinational manufacturers and importers
YEAR SOURCE
Legal provisions exist for licensing multinational manufacturers that produce medicines locally
Yes Yes/No 2003 The Tanzania
Food, Drugs and
Cosmetics Act No 1,
2003
Number of multinational pharmaceutical companies with a local subsidiary
- Number
Number of multinational pharmaceutical companies producing medicines locally
None Number TFDA
Legal provisions exist for licensing importers
Yes Yes/No 2007 WHO level I
3.6 Quality Control
YEAR SOURCE Legal provisions exist to inspect premises and collect samples
Yes Yes/No 2007 WHO level I
Legal provisions exist for detecting and combating counterfeit medicines
Yes Yes/No 2007 WHO level I
Samples are tested for post-marketing surveillance
Yes Yes/No 2007 WHO level I
List is publicly available giving detailed results of quality testing in past year
No Yes/No EDMNPO
Legal provisions exist to ensure quality control of imported medicines
Yes Yes/No 2007 WHO level I
Legal provisions exist for the recall and disposal of defective products
Yes Yes/No 2007 WHO level I

12
3.7 Pharmacovigilance
YEAR SOURCE Legal provisions exist for monitoring adverse drug reactions (ADRs) on a routine basis
Yes Yes/No 2003 TFDC Act, 2003
ADRs are monitored Yes Yes/No 2007 WHO level I
-If yes, ADRs are monitored at
-Central level Yes Yes/No 2007 WHO level I
-Regional level Yes Yes/No 2007 WHO level I
-Local health facilities Yes Yes/No 2007 WHO level I
-If yes, ADRs are reported to the WHO Collaborating Centre for International Drug Monitoring
Yes Yes/No 2003 TFDA
3.8 Medicines Advertising and Promotion Legal and regulatory provisions YEAR SOURCE Legal provisions exist to control the promotion and/or advertising of medicines
Yes Yes/No 2003 TFDA
Who is responsible for regulating promotion and/or advertising of medicines
Government Government/Industry/Co-Regulation
2007 TFDA
Direct advertising of prescription medicines to the public is prohibited
Yes Yes/No 2003 TFDA
Regulatory pre-approval is required for medicines advertisements and/or promotional materials
Yes Yes/No 2007 WHO level I
Guidelines exist for advertising and promotion of non-prescription medicines
Yes Yes/No TFDA
Regulatory committee exists for controlling medicines advertising and promotion
No Yes/No TFDA
-If yes, members must declare conflicts of interest
Yes/No
Code of conduct YEAR SOURCE
A national code of conduct exists concerning advertising and promotion of medicines by pharmaceutical manufacturers
Yes Yes/No TFDA
-If yes, adherence to the code is voluntary
Yes Yes/No TFDA
A national code of conduct for doctors exists to regulate their relationship with manufacture sales representatives
No Yes/No TFDA

13
PART 4 - FINANCING
4.1 Medicines Expenditure
YEAR SOURCE Total medicines expenditure (US$)
57,000,000 US$ current exchange rates
2008/09 MOHSW
Medicines expenditure as a % of GDP
% of GDP MOHSW
Medicines expenditure as a % of Health Expenditure
32% % of total health expenditure
2009/10 MOHSW
Total public expenditure on medicines (US$)
37,900,000 US$ current exchange rates
2008/09 MOHSW
MoH annual budget for medicines (US$)
US$ current exchange rates
Total private expenditure on medicines (US$)
US$ current exchange rates
4.2 Health Insurance and Free Care
YEAR SOURCE National Health Insurance (NHI) or Social Health Insurance (SHI) exists
Yes Yes/No 2007 WHO level I
-If yes, NHI/SHI provides at least partial medicines coverage
Yes Yes/No 2007 WHO level I
Proportion of the population covered by NHI or SHI
Less than 10%
% of the population
2009 NHIF
Existence of public programmes providing free medicines
Yes Yes/No 2007 WHO level I
-If yes, medicines are available free-of-charge for:
-Patients who cannot afford them
Yes Yes/No 2007 WHO level I
-Children under 5 Yes Yes/No 2007 WHO level I

14
-Older children No Yes/No 2007 WHO level I
-Pregnant women Yes Yes/No 2007 WHO level I
-Elderly persons Yes Yes/No 2007 WHO level I
-If yes, the following types of medicines are free:
-All No Yes/No 2007 WHO level I
-Malaria medicines No Yes/No 2007 WHO level I
-Tuberculosis medicines Yes Yes/No 2007 WHO level I
-Sexually transmitted diseases medicines
Yes Yes/No 2007 WHO level I
-HIV/AIDS medicines Yes Yes/No 2007 WHO level I
At least one vaccine Yes Yes/No 2007 WHO level I
4.3 Patients Fees and Copayments
YEAR SOURCE Inpatients pay a fee for medicines in public hospitals
Yes Yes/No 2009 MOHSW
Registration/consultation fees are common in public health facilities
Yes Yes/No 2007 WHO level I
Fixed dispensing fees are common for outpatients in public primary health-care facilities
No Yes/No 2009 MOHSW
Outpatients pay varying amounts for medicines in public primary health- care facilities
Yes Yes/No 2009 MOHSW
Medicines copayments are used to pay salaries of public health-care workers
No Yes/No 2007 WHO level I

15
4.4 Pricing Regulation
Price Control for the private sector YEAR SOURCE Legal or regulatory provisions exist for setting:
- Manufacturer's selling price
No Yes/No 2009
- Maximum wholesale mark-up
No Yes/No 2007 WHO level I
- Maximum retail mark-up
No Yes/No 2007 WHO level I
- Maximum retail price (exit price)
No Yes/No 2009 EDMNPO
Legal or regulatory provisions for controlling medicines prices vary for different types of medicines
No Yes/No 2009 EDMNPO
Government runs an active national medicines price monitoring system for retail prices
No Yes/No 2007 WHO level I
Retail medicines price information is made publicly accessible according to existing regulation
No Yes/No 2007 WHO level I
4.5 Results of WHO/HAI Pricing Survey
YEAR SOURCE Median Price Ratio of originator brand products to international reference prices for a basket of key medicines PUBLIC SECTOR PROCUREMENT
N/A Median Price Ratio
2005 WHO/HAI Pricing Survey
Median Price Ratio of lowest-priced generics to international reference prices for a basket of key medicines PUBLIC SECTOR PROCUREMENT
0.7 Median Price Ratio
2005 WHO/HAI Pricing Survey
Median Price Ratio of originator brand products to international reference prices for a basket of key medicines PUBLIC SECTOR PATIENT PRICE
N/A Median Price Ratio
2005 WHO/HAI Pricing Survey
Median Price Ratio of lowest-priced generics to international reference prices for a basket of key medicines PUBLIC SECTOR PATIENT PRICE
1.3 Median Price Ratio
2005 WHO/HAI Pricing Survey
Median Price Ratio of originator brand products to international reference prices for a basket of key medicines PRIVATE SECTOR PATIENT PRICE
18.8 Median Price Ratio
2005 WHO/HAI Pricing Survey
Median Price Ratio of lowest-priced generics to international reference prices for a basket of key medicines PRIVATE SECTOR PATIENT PRICE
2.7 Median Price Ratio
2005 WHO/HAI Pricing Survey
16
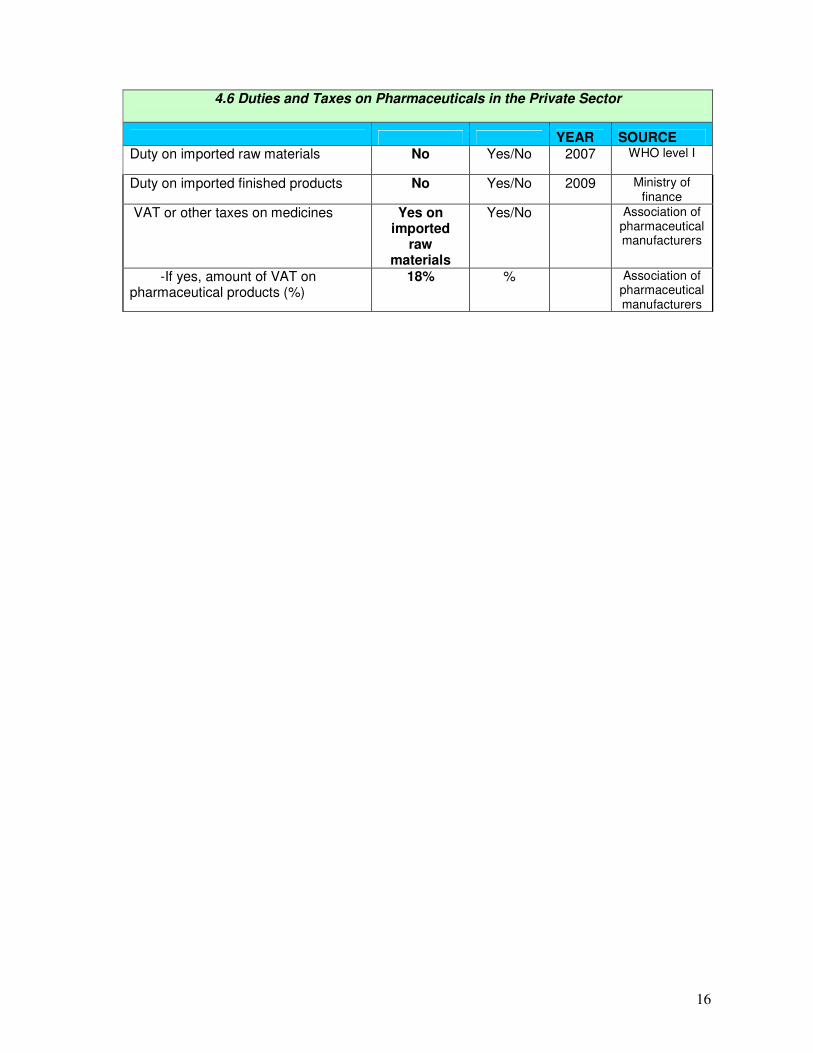
4.6 Duties and Taxes on Pharmaceuticals in the Private Sector
YEAR SOURCE Duty on imported raw materials No Yes/No 2007 WHO level I
Duty on imported finished products No Yes/No 2009 Ministry of finance
VAT or other taxes on medicines Yes on imported
raw materials
Yes/No Association of pharmaceutical manufacturers
-If yes, amount of VAT on pharmaceutical products (%)
18% % Association of pharmaceutical manufacturers

17
PART 5 - PATENTS
5.1 Medicines Patent Laws
YEAR SOURCE Country is a member of the World Trade Organization
Yes Yes/No
Patents are granted on pharmaceutical products by a National Patent Office
Yes Yes/No 2007 WHO level I
List of patented medicines is available No Yes/No TFDA
National legislation has been modified to implement the TRIPS Agreement
No Yes/No 2007 WHO level I
-If yes, the transitional period has been extended per Doha Declaration
No Yes/No 2007 WHO level I
-If yes, TRIPS flexibilities have been incorporated into legislation
No Yes/No 2007 WHO level I
-If TRIPS flexibilities have been incorporated, they are:
-Compulsory licensing provisions No Yes/No 2007 WHO level I
-Government use No Yes/No 2007 WHO level I
-Parallel importing provisions No Yes/No 2007 WHO level I
-Bolar exception No Yes/No 2007 WHO level I

18
PART 6 - SUPPLY
6.1 Procurement
YEAR SOURCE Is there a written public sector procurement strategy?
Yes Yes/No 2004 Public procurement ACT 2004
-If yes, in what year was it approved?
Yes 2004 Public procurement ACT 2004
Are there provisions giving priority in public procurement to goods produced by domestic manufacturers?
Yes Yes/No 2004 Public procurement ACT 2004
Are there provisions giving priority in public procurement to goods produced by manufacturers from SADC countries?
No Yes/No
Do the public sector procurement regulations apply to pharmaceutical procurement?
Yes Yes/No 2004 Public procurement ACT 2004
How many people are working full-time only on procurement of pharmaceuticals for the public sector?
Yes 5 2009
Directorate of Finance and
Administration, MSD
There is a tender board/committee overseeing public procurement of medicines
Yes Yes/No 2007 WHO level I
-If yes, the key functions of the procurement office and those of the tender committee are clearly separated
Yes Yes/No 2007 WHO level I
Public procurement is limited to medicines on the national EML
Yes Yes/No 2007 WHO level I
WHO-prequalification system is used to identify suppliers for ARVs, TB, ATM and RHR
Yes Yes/No 2007 WHO Level I
WHO certification system is used to identify suppliers
Yes Yes/No 2007 MSD TENDER DOCUMENTS
A functioning process exists to ensure the quality of other products procured
Yes Yes/No QUALITY CONTROL
SECTION, MSD
-If yes, this process includes prequalification of products and suppliers
Yes Yes/No 1993 QUALITY CONTROL
SECTION, MSD

19
-If yes, explicit criteria and procedures exist for prequalification of suppliers
Yes Yes/No TFDA GUIDELINES & PPRA
REQUIREMENTS
-If yes, a list of prequalified suppliers and products is publicly available
Yes Yes/No TFDC ACT 2003
How many people are working full-time on quality assurance for procurement?
4 2009 Directorate of Finance and
Administration, MSD
Percentage of public sector procurement expenditures in last year awarded by:
-National competitive tenders
10% % of total value
2007 WHO level I
-International competitive tenders
80% % of total value
2007 WHO level I
-Negotiation % of total value
-Direct purchasing % of total value
Public sector tenders are publicly available
Yes Yes/No MSD WEBSITE, NEWSPAPAERS
and PPRA WEBSITE
Public sector awards are publicly available
Yes Yes/No MSD WEBSITE, NEWSPAPAERS
and PPRA WEBSITE
Public sector tenders use an e-procurement system
No Yes/No
A written code of conduct exists governing the behaviour of public procurement agencies in their interactions with sales representatives(not applicable) and wholesalers
Yes
Yes/No 2007 PPRA BIDDING DOCUMENT
List of samples tested during the procurement process and results of quality testing is available
Yes Yes/No QUALITY CONTROL
SECTION,MSD
Public sector procurement is centralized at the national level
Yes Yes/No 2007 WHO level I
Is there a capacity building strategy for procurement and supply management?
Yes Yes/No 2007 MSD STARERGIC MEDIUM TERM
PLAN 2007-2013
-If yes, when was it finalized?
Yes 2008 MSD STARERGIC MEDIUM TERM
PLAN 2007-20013
-If yes, what period does it cover?
2007-2013 2007-2013 MSD STARERGIC MEDIUM TERM
PLAN 2007-20013

20
6.2 Procurement Budget. (Please insert currency in the 3rd column).
CURRENCY YEAR SOURCE Total value of medicines procured in the public sector in the previous year
80,471,640.70 USD 2008/2009 MSD
Public procurement expenditure on products from national manufacturers in the previous year (if available)
4,989,892.40 USD 2008/2009 MSD
Public procurement expenditure on products from SADC manufacturers in the previous year (if available)
NOT APPLICABLE
Public procurement expenditure on products on the EML in the previous year (if available)
13,370,871.50 USD 2008/2009 MSD
6.3 Data on Top 50 Products by Value Procured in the Public Sector YEAR of DATA
Product Unit Volume Price Total value (please specify currency)
Country of supplier
Amoxycillin Caps 250mg 1000T 120000 15.550 1,866,000.00 Tanzania
Erythromycin 250 mg Tabs 1000T 35620 17.37 618,719.40 Tanzania
Cloxacillin 250 mg Caps 1000T 33000 14.900 491,700.00 Tanzania
Quinine Tabs 300mg 1000T 13000 37.750 490,750.00 Tanzania
Paracetamol 500 mg Tabs 1000T 160000 2.540 406,400.00 Tanzania
Chloramphenicol 250 mg Caps 1000T 26000 13.680 355,680.00 Tanzania
Rabies vaccine USP (potency of rabies antigen< 2.5 IU/dose 1 vial 48000 6.300
302,400.00 (EURO) France
Acetylsalicycylic acid 300 mg Tabs 1000T 134,000 1.980 265,320.00 Tanzania
Amoxycyline granules 125mg/5ml ,100ml 24P 32500 7.160 232,700.00 Tanzania
Hyoscine N-Butyl Bromide 10 MG Tabs 500T 28000 7.992 223,776.00 India

21
(EURO)
Cresol saponated liquid 50% 5Lts 12000 14.840 178,080.00 Tanzania
Amoxycillin Trihydrate + Clavulanic Potassium 500mg +125mg Tabs 15P 44000 1.720
75,680.00 India
Ciprofloxacin 500mg Tabs 100T 40000 1.760 70,400.00 Tanzania
Methylated spirit liquid 70% 5Lts 9600 7.200 69,120.00 Tanzania
Mebendazole Tabs 100mg 1000T 20000 2.751 55,020.00 Tanzania
Glipizide 5 mg Tabs 100T 2400 20.000 48,000.00 India
Ketoconazole 200 mg Tabs 100T 16000 2.800 44,800.00 Tanzania
Vitamin B Complex Tabs 1000T 25000 1.750 43,750.00 Tanzania
Phenobarbital 100 mg Tabs 1000T 8000 5.220 41,760.00 Tanzania
Metronidazole injection 5mg/ml,100ml 10 vials 23000 1.800 41,400.00 India
Prednisolone 5mg Tabs 1000T 7700 5.200 40,040.00 Tanzania
Aminophylline 100mg 1000T 13,200 2.680 35,376.00 India
Diclofenac 50mg Tabs 100T 82000 0.400 32,800.00 Tanzania
Hydrocortisone pdr f injection 100mg 10 vials 15605 2.100 32,770.50 India
Phenobarbital 30 mg Tabs 1000T 15000 1.990 29,850.00 Tanzania
Bendrofluazide Tabs 5mg 1000T 9600 2.890 27,744.00 Tanzania
Fluconazole 150 mg Tabs 100T 9600 2.880 27,648.00 Tanzania
Potassium chloride injection 7.45% 10 vials 500 50.00 25,000.00 Greece
Salbutamol aerosol inhalation 0.1mg/Inhaler 20gm 17600 1.230
21,648.00 India
Ascorbic Acid Tabs 100mg 1000T 4800 4.500 21,600.00 Tanzania
Diclofenac sodium injection 25mg/ml 10 amps 39000 0.54 21,060.00 India
Captopril 25 mg Tabs 100T 12000 1.690 20,280.00 Cyprus
Folic acid 5 mg Tabs 1000T 18200 0.990 18,018.00 Tanzania
Salbutamol Tabs 4mg 1000T 7800 2.000 15,600.00 Tanzania
Tramadol 50 mg Cap 100T 3400 4.532 15,408.80 India
Betamethasone cream 0.1% ,15gm 12P 4400 3.240 14,256.00 India
Nystatin susp 100,000 IU/ML 30ML 36000 0.370 13,320.00 Kenya
Phenytoin 100 mg Tabs 1000T 4600 2.850 13,110.00 India
Chlorpheniramine 4mg Tabs 1000T 18000 0.671 12,078.00 Tanzania
Chlopromazine 25 mg Tabs 500T 8200 1.386 11,365.20 (EURO) India
Metformin 500 mg Tabs 100T 8700 1.220 10,614.00 India
Clotrimazole Pessary with applicator 100mg 6P 57000 0.180
10,260.00 Kenya

22
Magnesium Trisilicate Compd 1000T 23500 0.42 9,870.00 Tanzania
Carbamazepine Tabs 200mg 500T 3000 3.150 9,450.00 (EURO) India
Tinidazole 500mg Tabs 100T 4500 1.990 8,955.00 Tanzania
Carbimazole 5 mg Tabs 100T 3400 2.530 8,602.00 (EURO) Cyprus
Nifedipine Retard 20 mg Tabs 100T 14200 0.600 8,520.00 India
Bisacodyl Tablets 5mg 200T 2800 2.920 8,176.00 Cyprus
Ranitidine 150mg Tabs 500T 7900 0.900 7,110.00 India
Simvastatin 20 mg Tabs 100 2800 2.100 5,880.00 India
Benzhexol 5 mg Tabs 100T 3400 1.640 5,576.00 (EURO) Cyprus
6.4 Procurement Price of Medicines on the WHO/HAI Global List
To calculate the UNIT PRICE please divide the price of the pack by the pack size (e.g. 28, 500, and 100). For example, a pack of 500 amoxycillim 500 mg/caps costing US$ 23.8 would have a unit price of 23.8 /500, that is a per unit price of US$ 0.048.
For Year: Medicine, Strength, Formulation UNIT price
for Originator
UNIT price for lowest
priced generic
Amitryptyline 25 mg Cap/tab 0.0108 Amoxicillin 500 mg Cap/tab 0.01555 Atenolol 50 mg Cap/tab 0.006 Captopril 25 mg Cap/tab 0.0169 Ceftriaxone 1 g/ vial Injection 0.3 Ciprofloxacin 500 mg Cap/tab 0.0176 Co-trimoxazole 80 + 40 mg/ml Susp. 0.00275/ML Diazepam 5 mg Cap/tab 0.00079 Diclofenac 50 mg Cap/tab 0.004 Glibenclamide 5 mg Cap/tab 0.0045 Omeprazole 20 mg Cap/tab 0.0061 Paracetamol 24 mg/ml Susp. 0.0022/ML Salbutamol 0.1mg/dose Inhaler 0.0615 Simvastatin 20 mg Cap/tab 0.023

23
6.5 Distribution
Distributors7 YEAR SOURCE There are national guidelines on Good Distribution Practices (GDP)
No, but draft available
2009
Yes/No 2009 TFDA
There a list of all GDP compliant distributors
No Yes/No TFDA
CMS YEAR SOURCE Software tools are available for planning medicines supply
Yes Yes/No MSD
Software tools are available for management of medicines supply (procurement tracking, expenditure tracking, stock levels)
Yes Yes/No MSD
Data on months of stock on hand is routinely reported to managers
Yes Yes/No MSD
TOP 5 distributors by market value (Top 5 Manufacturers) Name of distributor Sales by Value
YEAR SOURCE
Shelys PharmaceuticalsTz
24% of Total
2008/2009
MSD
Keko Pharmaceuticals-Tz
11.87% of Total
2008/2009
Medopharm-India
1.83 % of Total
2008/2009
MSD
Zenufa Laboratories-Tz
1.15% of Total
2008/2009
MSD
Elys Chemicals-Kenya
0.4% of Total
2008/2009
MSD
7 For the purpose of this profile, distributors deliver medicines on behalf of others and do not carry any risk for stock
lost or expired.

24
6.6 Wholesale Market Characteristics8
YEAR SOURCE Legal provisions exist for licensing wholesalers
Yes Yes/No 2003 TFDA
Number of wholesalers in market
243 Number 2009 TFDA
Number of GDP compliant wholesalers in market
- Number
List of GDP compliant wholesalers is publicly available
No Yes/No
TOP 5 wholesalers by market value
Name of wholesaler Sales by Value
YEAR SOURCE
Nufaika Distributors 290,096,754,518.4
4 % of Total 2007
TFDA
Phillips Distributors 188,112,705,926.4
7 % of Total 2007
TFDA
Salama Pharmaceuticals 101,855,764,195.7
8 % of Total 2007
TFDA
K&C Trading Company 8,497,030,522.60 % of Total 2007 TFDA
J. D Pharmacy LTD 7,529,444,285.14 % of Total 2007 TFDA
8 Wholesalers own the products that they sell/distribute and carry the risk for stock lost or expired.

25
PART 7- SELECTION and RATIONAL USE of MEDICINES
7.1 National Structures
YEAR SOURCE National standard treatment guidelines (STGs) for major conditions are produced by the MoH
Yes Yes/No 2009 WHO NPO
-If yes, year of last update of national STGs
2007/2009 Year 2009 WHO NPO
National essential medicines list (EML) exists
Yes Yes/No 2009 WHO NPO
-If yes, number of medicine formulations on the national EML
number
-If yes, year of last update of EML
2007 Year 2009 WHO NPO
-If yes, process for selecting medicines on the EML is publicly available
Yes Yes/No
There is a committee for the selection of products on the national EML
Yes Yes/No 2007 WHO level I
-If yes, conflict of interest declarations are required from members on national EML committee
No Yes/No WHO NPO
There are explicit criteria for selecting medicines for national EML
No Yes/No WHO NPO
National medicines formulary manual exists
Yes Yes/No 2007 WHO level I
-If yes, national medicines formulary manual is limited to essential medicines
No Yes/No 2007 WHO level I
-If yes, year of last update of national medicines formulary manual
2006 Year 2007 WHO level I
National STGs for paediatric conditions exist
No, but IMCI
guidelines available
Yes/No 2009 WHO NPO
-If yes, year of last update of national paediatric STGs
Year
EML used in public insurance reimbursement
Yes Yes/No 2007 WHO level I
Rational use national audit done in the last two years
No Yes/No 2007 WHO level I
% of public health facilities with EML (mean)- Survey data
%
% of public health facilities with STGs (mean)- Survey data
20% % 2002 WHO Level II

26
Public education campaigns about rational medicines use have been conducted by MoH, NGOs or academia in the previous two years
No Yes/No 2002 WHO Level II
A national programme or committee involving government, civil society, and professional bodies exists to monitor and promote rational use of medicines
No Yes/No 2007 WHO level I
A national strategy exists to contain antimicrobial resistance
No Yes/No 2007 WHO level I
-If yes, date of last update of the strategy
Year
A national reference laboratory has responsibility for coordinating epidemiological surveillance of antimicrobial resistance
No Yes/No 2007 WHO level I
A public or independently funded national medicines information centre provides information on medicines to consumers
No Yes/No 2007 WHO level I
Legal provisions exist for the control of narcotics, psychotropic substances, and precursors
Yes Yes/No 2007 WHO level I
The country is a signatory to the International Conventions on the Control of Narcotics, Psychotropic Substances and Precursors
Yes Yes/No 2007 WHO level I
7.2 Prescribing
YEAR SOURCE Legal provisions exist to govern the licensing and prescribing practices of prescribers
Yes Yes/No 2007 WHO level I
-The following types of health workers are legally allowed to prescribe
-Nurses No Yes/No MOHSW
-Midwives No Yes/No MOHSW
-Community health workers No Yes/No MOHSW
-Pharmacists No Yes/No MOHSW
Prescribers are legally allowed to dispense
No Yes/No MOHSW
Prescribers in the public sector dispense medicines
Yes Yes/No 2007 WHO level I
Prescribers in the private sector dispense medicines
Yes Yes/No 2007 WHO level I

27
The basic medical training curriculum includes components on:
- Use of the national EML Yes Yes/No 2007 WHO level I
- Use of national STGs Yes Yes/No 2007 WHO level I
- Problem-based pharmacotherapy Yes Yes/No 2007 WHO level I
- Good practices in prescribing Yes Yes/No 2007 WHO level I
The basic nursing training curriculum includes components on:
- Use of the national EML Yes Yes/No 2007 WHO level I
- Use of national STGs Yes Yes/No 2007 WHO level I
- Problem-based pharmacotherapy No Yes/No 2007 WHO level I
- Good practices in prescribing No Yes/No 2007 WHO level I
The basic training curriculum for paramedical staff includes components on:
- Use of the national EML No Yes/No 2007 WHO level I
- Use of national STGs No Yes/No 2007 WHO level I
- Problem-based pharmacotherapy No Yes/No 2007 WHO level I
- Good practices in prescribing No Yes/No 2007 WHO level I
Regulations exist requiring hospitals to organize/develop Drug and Therapeutics Committees (DTCs)
No Yes/No 2007 WHO level I
Mandatory, non-commercially funded continuing education that includes use of medicines is required for doctors
No Yes/No 2007 WHO level I
A public or independently funded national medicines information centre exists that provides information on demand to prescribers
No Yes/No 2007 WHO level I
Prescribing by generic name is obligatory in:
-Public sector Yes Yes/No 2007 WHO level I
-Private sector No Yes/No 2007 WHO level I
Incentives exist to encourage prescribing of generic medicines in public health facilities
No Yes/No WHO NPO
Incentives exist to encourage prescribing of generic medicines in private health facilities
No Yes/No WHO NPO

28
INRUD prescribing indicators YEAR SOURCE
Number of medicines prescribed per patient contact in public health facilities (mean)
1.8 number 2002 WHO Level II
% of patients receiving antibiotics (mean) 42% % 2002 WHO Level II
% of patients receiving injections (mean) 14% % 2002 WHO Level II
% of drugs prescribed that are in the EML (mean)
98.5% % 2002 WHO Level II
Diarrhoea in children treated with ORS (%)
82% % 2002 WHO Level II
Non-pneumonia ARIs treated with antibiotics (%)
90% % 2002 WHO Level II
7.3 Dispensing
YEAR SOURCE Legal provisions exist to govern licensing and practice of pharmacy
Yes Yes/No
2007 WHO level I
A professional association code of conduct exists governing professional behaviour of pharmacists
Yes Yes/No
2008 Pharmacy Council
The basic pharmacist training curriculum includes components on
-Use of the national EML Yes Yes/No
2007 WHO level I
-Use of national STGs No Yes/No
2007 WHO level I
-Problem-based pharmacotherapy No Yes/No
2007 WHO level I
-Good practices in prescribing No Yes/No
2007 WHO level I
Mandatory, non-commercially funded continuing education that includes use of medicines is required for pharmacists
No Yes/No
2007 WHO level I
A public or independently funded national medicines information centre exists that provides information on demand to dispensers
No Yes/No
2007 WHO level I
Substitution of generic equivalents is permitted for:
-Public sector dispensers Yes Yes/No
2007 WHO level I
-Private sector dispensers Yes Yes/No
2007 WHO level I
Incentives exist to encourage dispensing of generic medicines in:
-Public pharmacies No Yes/No
2007 WHO level I
-Private pharmacies No Yes/No
2007 WHO level I

29
Antibiotics are sold over-the-counter without a prescription
Yes Yes/No
2007 WHO level I
Injections are sold over-the-counter without a prescription
Yes Yes/No
2007 WHO level I
Narcotics are sold over-the-counter without a prescription
No Yes/No
2009
Tranquillisers are sold over-the-counter without a prescription
No Yes/No
2009
INRUD dispensing indicators YEAR SOURCE
% of prescribed drugs dispensed to patients (mean)
%
Percentage of medicines adequately labelled in public health facilities (mean)
76% % 2002 WHO Level II
Percentage of patients knowing correct dosage in public health facilities (mean)
80% % 2002 WHO Level II

30
PART 8 - HOUSEHOLD DATA
8.1 Data from Household surveys YEAR SOURCE Adults with acute conditions taking all medicines prescribed
%
Adults with acute conditions not taking all medicines because they cannot afford them
%
Adults with acute conditions not taking all medicines because they cannot find them
%
Adults (from poor households) with acute conditions taking all medicines prescribed
%
Adults (from poor households) with acute conditions not taking all medicines because they cannot afford them
%
Adults with chronic conditions taking all medicines prescribed
%
Adults with chronic conditions not taking all medicines because they cannot afford them
%
Adults with chronic conditions not taking all medicines because they cannot find them
%
Adults (from poor households) with chronic conditions taking all medicines prescribed
%
Adults (from poor households) with chronic conditions not taking all medicines because they cannot afford them
%
Children with acute conditions taking all medicines prescribed
%
Children with acute conditions not taking all medicines because they cannot afford them
%
Children with acute conditions not taking all medicines because they cannot find them
%
Children (from poor households) with acute conditions taking all medicines prescribed
%
Children (from poor households) with acute conditions not taking all medicines because they cannot afford them %


![Arte pop [pop art]](https://static.fdocuments.in/doc/165x107/558d408ad8b42aa44f8b4706/arte-pop-pop-art.jpg)