United Nations - · PDF fileUnited Nations ECONOMIC AND SOCIAL ... FTSE Bursa Malaysia...
186
1 United Nations
-
Upload
trinhtuyen -
Category
Documents
-
view
216 -
download
0
Transcript of United Nations - · PDF fileUnited Nations ECONOMIC AND SOCIAL ... FTSE Bursa Malaysia...
1United Nations
1
ASIA-PACIFIC ECONOMIESAFTER THE GLOBAL FINANCIAL CRISIS:
LESSONS LEARNED AND THE WAY FORWARD
Edited by Alberto E. Isgut
United Nations
ECONOMIC AND SOCIAL COMMISSIONFOR ASIA AND THE PACIFIC

2ii
United Nations publication Sales No. E.13.II.F.5Copyright © United Nations 2014All rights reserved Printed in BangkokApril 2014 – 1,000ISBN: 978-92-1-120663-0eISBN: 978-92-1-054115-2ST/ESCAP/2672
For further information on this publication, please contact:
DirectorMacroeconomic Policy and Development DivisionESCAPRajadamnern Nok AvenueBangkok 10200, Th ailandTel: (66-2) 288-1623Fax: (66-2) 288-3007e-mail: [email protected]
Th e designations employed and the presentation of the material in this publication do not imply the expression of any opinion whatsoever on the part of the Secretariat of the United Nations concerning the legal status of any country, territory, city or area, or of its authorities, or concerning the delimitation of its frontiers or boundaries. Where the designation “country” or “area” appears, it covers countries, territories, cities or areas.
Bibliographical and other references have, wherever possible, been verifi ed. Th e United Nations bears no responsibility for the availability or functioning of URLs outside the Organization’s control.
Th e views, opinions, fi gures and estimates set forth in this publication are the responsibility of the authors, and should not necessarily be considered as refl ecting the views or carrying the endorsement of the United Nations or institutions with which the authors are affi liated with. Any errors are the responsibility of the authors. Mention of fi rm names and commercial products does not imply the endorsement of the United Nations.
Th is publication has been issued without formal editing.

3iii
Contents
List of fi gures .................................................................................................... iv
List of tables ...................................................................................................... v
Abbreviations ................................................................................................... vii
List of contributors .......................................................................................... viii
Foreword ........................................................................................................... ix
Preface ............................................................................................................... xii
Introduction .................................................................................................... 1Alberto E. Isgut
Chapter 1: Bangladesh .................................................................................... 11Mustafa K. Mujeri
Chapter 2: China ............................................................................................. 49Yide Qiao
Chapter 3: Indonesia ...................................................................................... 69Mohamad Ikhsan and Cicilia A. Harun
Chapter 4: Malaysia ........................................................................................ 89Mahani Zainal Abidin
Chapter 5: Pacifi c Island Developing Economies ....................................... 113Biman C. Prasad and Rohit Kishore
Chapter 6: Pakistan ......................................................................................... 125Rashid Amjad and Musleh ud Din
Chapter 7: Republic of Korea ........................................................................ 133Kyungsoo Kim
Chapter 8: Th ailand ........................................................................................ 147Boonchai Charassangsomboon and Pisit Puapan
References ......................................................................................................... 165

4iv
List of fi guresIntroductionA. Exchange rates during the Asian fi nancial crisis and the global
fi nancial crisis ........................................................................................................... 7
Chapter 11.1. Annual growth rate of exports ............................................................................201.2. Foreign exchange reserves ...................................................................................211.3. Transmission channels of impact of the global fi nancial crisis ....................221.4. Year-on-year growth rate of exports ..................................................................241.5. Year-on-year growth rate of imports .................................................................251.6. Major sources of remittance infl ows to Bangladesh, 2009 ............................261.7. Year-on-year growth of outfl ows of Bangladeshi migrant workers .............271.8. Year-on-year growth of remittance infl ows......................................................27
Chapter 22.1. Exports, as a percentage of the GDP .................................................................502.2. Share of manufactured and primary goods in total exports .........................512.3. Shares of investment and consumption in GDP .............................................522.4. GDP growth ...........................................................................................................552.5. Timeline of QE1 and QE2 ...................................................................................552.6. Infl ation rate, January 2008 to December 2012 ...............................................562.7. General trade versus feed processing trade ......................................................572.8. Th e pattern of the trade balance .........................................................................582.9. Th e export rebound in China aft er the global fi nancial crisis ......................602.10. Current account balance 2001-2012 ..................................................................62
Chapter 44.1. Evolution of key commodity prices during the crisis period .......................934.2. Exports and imports of Malaysia during the global crisis .............................944.3. Exports to major trade partners during the global crisis ..............................954.4. FTSE Bursa Malaysia composite index .............................................................96
Chapter 77.1. Non-core liabilities of the banking sector in the Republic of Korea .........1397.2. Foreign exchange swap arrangements and maturity transformation .......140

5v
Chapter 88.1. Transmission mechanism of stimulus package 1 (SP1) ...............................1578.2. Transmission mechanism of tax measures .....................................................1588.3. Transmission mechanism of credit measures through SFIs .......................1598.4. Total eff ect of SP1 on GDP growth ..................................................................1598.5. Transmission mechanism in SP2 to GDP growth ........................................160
List of tablesIntroductionA. Real GDP during the Asian fi nancial crisis and the global fi nancial crisis ..... 2B. Growth rates before and during the Asian fi nancial crisis and the
global fi nancial crisis ............................................................................................... 3
Chapter 11.1. Economic growth in Bangladesh .......................................................................131.2. Selected macroeconomic indicators of the Bangladeshi economy .............141.3. Changes in economic structure, 1981-2010 .....................................................151.4. Contribution of diff erent sectors to incremental GDP ..................................151.5. Social development in Bangladesh: a South Asian perspective ...................171.6. Recent changes in poverty and inequality ........................................................191.7. Infl ows of foreign direct investment to Bangladesh, 2000-2010 ..................231.8. Quarterly growth of major manufacturing exports, 2009 .............................241.9. Loss of incremental employment due to the global crisis .............................291.10. Impact of the global crisis on selected Millennium Development Goals .....311.11. Goals and instruments for addressing the social impact of
economic downturns ...........................................................................................42
Chapter 22.1. Growth rates of imports and exports, September 2008 to December 2009..54
Chapter 33.1. Evolving crisis responses in Indonesia since the 1998 Asian fi nancial crisis ....76
Chapter 44.1. Impact of the 2008-2009 global crisis on growth in Malaysia ......................904.2. FDI infl ows into Malaysia ....................................................................................92

6
4.3. Consumption growth during the crisis period ...............................................924.4. Non-performing loans .........................................................................................964.5. Retrenchment of workers from 1 October 2008 to 13 May 2009 ................97
Chapter 55.1. Characteristics of the Pacifi c Island States, 2008 ...........................................1145.2. Financial sector indicators .................................................................................1165.3. Monetary policy frameworks in Pacifi c Island countries ............................1175.4. Remittances infl ows as a percentage of GDP in selected Pacifi c
Island economies, 2004 to 2009 ........................................................................1185.5. Trade and tariff revenues ...................................................................................120
Chapter 66.1. Economic performance of Pakistan ................................................................126
Chapter 77.1. Flow of foreign exchange funds ........................................................................137
vi

7vii
AbbreviationsAMRO ASEAN+3 Macroeconomic Research Offi ceASEAN Association of Southeast Asian NationsASEAN+3 ASEAN + China, Japan, Republic of KoreaASEAN-5 Brunei Darussalam, Indonesia, Malaysia, Singapore and Th ailandCGE computable general equilibriumCMIM Chiang Mai Initiative MultilateralizationDBK domestic bankFBB Foreign bank branchFDI foreign direct investmentFES foreign exchange swapFR foreign exchange reservesFX foreign exchangeFY fi scal yearG-20 Group of TwentyGDP gross domestic productGLC Government-linked companies GNI gross national incomeGSP Generalized System of PreferencesGST General Sales TaxHDI human development indexIMF International Monetary FundLNG liquefi ed natural gasMMC mature market countriesNEM New Economic ModelNPL non-performing loansOECD Organisation for Economic Co-operation and DevelopmentPACER Pacifi c Agreement on Closer Economic RelationsPIDM Perbadanan Insurans Deposit MalaysiaQE quantitative easingRMB renminbiRRR required reserve ratioSIFIs systemically important fi nancial institutionsSMEs small and medium-sized enterprisesSOE State-owned enterpriseSP stimulus packageSRR Statutory Reserve RequirementVAT value added taxWCM wholesale credit marketWTO World Trade Organization

8viii
List of contributors
Mahani Zainal Abidin is former Chief Executive of the Institute of Strategic and International Studies (ISIS), Malaysia.
Rashid Amjad is Vice-Chancellor of the Pakistan Institute of Development Economics, Islamabad, Pakistan.
Boonchai Charassangsomboon is Executive Director of the Macroeconomic Policy Bureau, Fiscal Policy Offi ce, Ministry of Finance, Th ailand.
Musleh ud Din is Joint Director of the Pakistan Institute of Development Economics, Islamabad, Pakistan.
Cicilia Anggadewi Harun is a Financial Economist at the Bank of Indonesia.
Mohamad Ikhsan is Professor of Economics at the University of Indonesia and Special Advisor to the Vice-President of Indonesia, Indonesia.
Kyungsoo Kim is Professor of Economics at Sungkyunkwan University, Seoul, the Republic of Korea.
Rohit Kishore is a former Senior Lecturer at the School of Accounting and Finance, Faculty of Business and Economics, University of the South Pacifi c, Suva, Fiji.
Mustafa Kamal Mujeri is Director-General of the Bangladesh Institute of Development Studies, Dhaka, Bangladesh.
Biman Chand Prasad is Professor of Economics and Chair of the Oceania Development Network at the University of the South Pacifi c, Suva, Fiji.
Pisit Puapan is Director of the Macroeconomic Analysis Division, Ministry of Finance, Th ailand.
Yide Qiao is Secretary-General of the Shanghai Development Research Foundation, Shanghai, China.

9
Foreword
There is an intriguing disjuncture between the impact of the 1997 Asian fi nancial crisis and that of the 2008 global fi nancial
crisis on the export-oriented economies of the Asia-Pacifi c region. In stark contrast to the earlier crisis, which saw the partial collapse
of some regional banking sectors, a balance of payments crunch, and deep contractions in leading regional economies, such as Indonesia, Malaysia, and the Republic of Korea, most Asia-Pacifi c developing economies weathered the 2008 fi nancial turbulence relatively successfully.
Developing Asia-Pacifi c also recovered quickly, and subsequently maintained satisfactory levels of economic growth. Yet, at the same time, many Western industrialised countries suff ered the worst levels of economic hardship in more than sixty years.
Th e people of Asia and the Pacifi c have been repeatedly exposed to both simultaneous and successive natural and economic shocks. Given the importance of protecting and extending Asia-Pacifi c’s hard-won development gains, it is clear that building resilience to multiple shocks is one of the most pressing challenges facing the region.
Th is then poses a number of key questions. Why were the countries of Asia and the Pacifi c signifi cantly less aff ected by the 2008 fi nancial crisis? What economic policies and institutional reforms contributed to this resilience? And, without positing any one-size-fi ts-all prescriptions, what lessons, if any, can be drawn for other countries from the measures adopted?
Th is book is a compilation of essays by distinguished experts and policy-makers from selected Asia-Pacifi c economies, providing a variety of
ix

10
perspectives about the impacts of, responses to, and lessons learned from the global fi nancial crisis, by the countries of the region.
Th ese views refl ect discussions during a series of high-level policy dialogues organized by the United Nations Economic and Social Commission for Asia and the Pacifi c (ESCAP) – the regional development arm of the United Nations, in collaboration with central banks and Ministries of Finance and Planning of the countries in the region.
Most evident from these essays, is the importance of ensuring that governments generate and preserve the necessary policy and fi scal space to protect economic growth, employment, and development, especially in times of crisis. Th is enables the pursuit of countercyclical monetary and fi scal policies, including by establishing universal social safety nets to support vulnerable communities from the worst impacts.
Similarly, there is a critical need for countries to preserve stability in the foreign exchange market, and in the fi nancial system as a whole. Large foreign exchange reserves and careful regulation of capital fl ows were important factors for many Asia-Pacifi c countries in reducing the potential disruption of capital fl ow volatility during the recent crisis. Nevertheless, individual countries accumulating large precautionary foreign exchange reserves has social opportunity costs, and hence strengthened regional mechanisms are crucial for addressing shared vulnerability to fi nancial crises.
An overarching message from these essays, and from the experiences of the countries of Asia and the Pacifi c, is that economic growth should be protected from the impact of such shocks not as an end in itself, but to support wider sustainable development goals – improving the welfare of all the people of Asia and the Pacifi c.
Th is country-led perspective echoes ESCAP’s work on the macroeconomics of resilience, which advocates for a less mechanical interpretation of macroeconomic prudence. While maintaining short-run stability, countries should be guided by the goals of long-term economic development and poverty reduction.
ESCAP provides a forum for its member States to discuss ways to enhance regional cooperation in support of sustainability and social equity. Th e aim of this book is to disseminate ideas and exchanges generated by policy-makers and experts from ESCAP’s member States. Th e analyses and
x

11
recommendations developed in these pages are an important contribution to the ongoing regional dialogue about building Asia-Pacifi c resilience to the crises of the future.
Shamshad AkhtarUnder-Secretary-General of the United Nations &Executive Secretary, United Nations Economic and Social Commission for Asia and the Pacifi c
xi

12
Preface
Shortly aft er the onset of the global fi nancial crisis, the Economic and Social Commission for Asia and the Pacifi c (ESCAP)
organized a series of high-level policy dialogues to discuss how countries in the region responded to the crisis and to exchange ideas on how to strengthen their resilience to future crises. Th e fi rst policy dialogue, “Strengthening the Response to the global Financial Crisis in the Asia-Pacifi c: Th e Role of Monetary, Fiscal and External Debt Policies”, took place in Dhaka, Bangladesh, in July 2009 and counted with the participation of high-level offi cials from the ministries of fi nance and central banks of 17 Asia-Pacifi c countries. Subsequent policy dialogues took place in Th imphu, Bhutan, in December 2009; Phnom Penh, Cambodia, in June 2010; Manila, Philippines, in September 2011; Nadi, Fiji, in October 2012; Yogyakarta, Indonesia, in May 2013; and Almaty, Kazakhstan, in August 2013. Th e majority of the policy dialogues were organized in partnership with the central banks of the host countries.
Th e series of policy dialogues provided opportunities for the sharing of experiences and ideas on how Asia-Pacifi c countries responded to the global fi nancial crisis and how they could bolster their defenses against future crises. A unique aspect of the series is that it considered fi scal and monetary policies in an integrated manner and provided a forum for dialogues among policymakers and experts specialized in each of these areas. Other related policy areas, such as external debt management (Dhaka and Th imphu), strategies to boost competitiveness (Phnom Penh), perspectives on the G20 agenda (Manila), energy security (Nadi), infrastructure fi nancing (Yogyakarta and Almaty), were included in response to specifi c requests from ESCAP partner organizations.
xii

13
As countries in the region transitioned from crisis response in 2009 to recovery in 2010 and beyond, the nature of the policy dialogues changed, focusing less on the responses to the crisis and more on extracting policy lessons for the future and on longer term issues. Th e Manila policy dialogue had a special focus on country experiences and a number of its participants were requested to prepare and present country essays. A selection of these essays, which were subsequently revised and updated over 2012 and 2013, are published in the present volume. Th e timing of the preparation and revision of these essays, just a few years aft er the global fi nancial crisis of 2008-2009 provided authors with enough perspective and data to properly evaluate the responses of countries to the crisis and to extract lessons for the future.
Th is project would not have been possible without the support and leadership of Nagesh Kumar, former Director of the Macroeconomic Policy and Development Division of ESCAP, and Aynul Hasan, Chief of the Division’s Development Policy Section. Ramkishen Rajan provided initial suggestions for improvement for the country essays included in this volume. Valuable feedback and suggestions for improvement for the introduction received from Anisuzzaman Chowdhury, current Director of the Division, from Aynul Hasan, and from the authors of the country essays are gratefully acknowledged. Achara Jantarasaengaram, Kiatkanid Pongpanich, Pannipa Ongwisedpaiboon, Patchara Arunsuwannakorn, Woranut Sompitayanurak and Zheng Jian provided invaluable support in many tasks required for the preparation of the manuscript and interacting with the printer.
Th is volume is dedicated to the memory of Dato’ Mahani Zainal Abidin, former Director-General of the Institute of Strategic and International Studies (ISIS) of Malaysia, who passed away on 23 June 2013. Dr. Mahani was a dear colleague and friend who attended many ESCAP meetings and hosted the launch of the Economic and Social Survey of Asia and the Pacifi c in Kuala Lumpur on several occasions. Even though she did not have the chance to review and update the essay on macroeconomic policies in Malaysia she prepared for the Manila policy dialogue, her essay is of such high quality that we decided to publish it posthumously, aft er consulting with her colleagues at ISIS, and with minimum editing. We are sure that readers of this volume will benefi t from this important contribution to policy debates on the future of macroeconomic policies in Malaysia and the Asia-Pacifi c region at large.
xiii

14

1
IntroductionAlberto E. Isgut
Although the global fi nancial crisis of 2008-2009 was the worst economic crisis in over 60 years for many industrial countries, most Asian and Pacifi c developing countries weathered it quite successfully. Th e resilience of the region is somewhat puzzling at fi rst sight. In an increasingly globalized world, are not economic shocks supposed to be transmitted faster and farther than ever before? And should not the largest shock in decades aff ecting the central fi nancial centres of the world cause substantial ripple eff ects? Yet, even those Asian and Pacifi c countries that were most exposed to drops in imports from the Western industrial countries and suff ered signifi cant drops in economic activity in 2009 recovered briskly in 2010. Furthermore, in contrast to the Asian fi nancial crisis of 1997-1998, no country in the region experienced a collapse of its banking sector or a balance of payments crisis.
Th e purpose of the book is to explain why countries in the region were signifi cantly less aff ected by the crisis than the world’s most advanced economies of Europe and the United States of America, and what the main lessons are from their experience for building resilience to future crises. Th e majority of the essays collected in this volume are revised and updated versions of papers presented by experts from the region at a conference organized by the Economic and Social Commission for Asia and the Pacifi c and held in Manila in September 2011.
Th e authors of country essays were asked whether the view that the impacts of the global fi nancial crisis were signifi cantly less severe than

2
Introduction
those of previous crises, including the Asian fi nancial crisis of 1997-1998, is correct, and – if it is correct – what were the main sources of resilience of their economies. Th ey were also asked what economic policies should be reinforced to respond more eff ectively to future crises, and what reforms at the institutional and policy-making level would be the most necessary. Th e answers to these questions provided a rich material that makes up the content of the present book.
While, as we discuss below, there are many similarities in the impacts and responses to the crises, the country essays are representative of the region’s diversity in terms of policy goals and frameworks. Th is diversity suggests that when it comes to discussing economic policies in the region it is not the case that “one size fi ts all”, which makes collections of country studies such as this a valuable contribution to observers and analysts interested in the economics of Asia and the Pacifi c.
Table A. Real GDP during the Asian fi nancial crisis and the global fi nancial crisis
Country1997 1998 1999 2000 2001 2008 2009 2010 2011 2012
Bangladesh 100 105 111 117 123 100 106 113 120 127China 100 108 116 126 136 100 109 121 132 142Indonesia 100 87 88 92 95 100 105 111 118 126Malaysia 100 93 98 107 108 100 99 106 111 117Pakistan 100 103 107 111 113 100 104 107 111 115Republic of Korea 100 93 102 111 115 100 100 107 111 113Thailand 100 90 94 98 100 100 98 105 105 112
GDP index (1997=100) GDP index (2008=100)
Th e diversity of experiences across countries in the region is clear from table A. Although it broadly supports the view that Asian and Pacifi c countries were less aff ected by the global fi nancial crisis of 2008-2009 in comparison with the Asian fi nancial crisis of 1997-1998, the table shows that the degree to which countries were aff ected by both crises varies considerably. Of the seven countries shown in the table, only two suff ered contractions of their GDPs in 2009, Malaysia and Th ailand, and such contractions were
Source: Author’s calculations using data from World Development Indicators database.Note: Figures expressed in per cent. Calculations based on the GDP at 1995/96 prices.

3
Country1992-1996 1997-2001 2003-2007 2008-2012
BangladeshChinaIndonesiaMalaysiaPakistanRepublic of KoreaThailand
4.712.07.79.73.77.78.1
5.28.0
-1.21.83.23.60.0
6.312.15.66.06.04.75.3
6.29.25.94.03.53.02.9
Average annual growth rates (per cent)
Alberto E. Isgut
relatively small, of around 2 percentage points. But in 1998 four of the seven countries suff ered deeper contractions, ranging from 7 per cent for the Republic of Korea to 13 per cent for Indonesia. In addition, Malaysia and Th ailand recovered briskly from the crisis with large rebounds of their GDPs in 2010, which contrast with the protracted recoveries of Indonesia and Th ailand from the Asian fi nancial crisis.
Th e table also shows that three of the seven countries, Bangladesh, China and Pakistan, continued growing throughout both crises, although at slightly higher rates in the aft ermath of the global fi nancial crisis compared to the aft ermath of the Asian fi nancial crisis (table B). In the case of China, the impact of the crises was to slow down the country’s rate of growth, by 4 percentage points during the Asian fi nancial crisis and by 3 percentage points during the global fi nancial crisis. Pakistan also experienced an important slowdown during the global fi nancial crisis with its growth rate cut from 6 per cent to 3.5 per cent, but Bangladesh continued growing at similar rates during both crises. Th e Republic of Korea is an exception to the assessment that Asian and Pacifi c countries performed better in the aft ermath of the global fi nancial crisis than in the aft ermath of the Asian fi nancial crisis. Although the country’s GDP did not contract in 2009, its rate of growth over 2008-2012 was lower than over 1997-2001.
Table B. Growth rates before and during the Asian fi nancial crisis and the global fi nancial crisis
Source: Author’s calculations using data from World Development Indicators database.
In addition to its diff erential impacts on GDP growth rates across countries, the global fi nancial crisis brought to the fore country-specifi c

4
Introduction
vulnerabilities and strengths, as well as policy issues, that deserve further attention in future. Th e brief overview of the book chapters below highlights specifi c areas of concern for each country. Although Bangladesh’s growth rate was not aff ected by the global fi nancial crisis, its ripple eff ects slowed down the pace of progress on poverty reduction and social development. Th is experience highlights the need to strengthen safety nets and to ensure that poverty reduction and key social development gains are not reversed. Th e chapter suggests that instituting employment and labour market programmes within the framework of a basic social fl oor may be useful for that purpose, but strong institutional capacities are required to implement such policies eff ectively. China’s policy responses to the global fi nancial crisis, the United States quantitative easing policies and the euro area sovereign debt crises were eff ective, but the country still has enormous policy challenges in its transition from a centrally planned economy to a market-based economy. Th ese challenges include reducing the Governments’ intervention in the economy, narrowing the widening gap between the rich and the poor, the increasing Governments’ expenditures in improving people’s livelihoods and speeding up the reform of the fi nancial system. Indonesia’s policy reforms in the aft ermath of the Asian fi nancial crisis of 1997-1998 helped the country weather the global fi nancial crisis relatively well 10 years later. When the new crisis hit, the Government had enough fi scal and monetary policy space to act decisively by providing liquidity to the fi nancial market, relaxing regulations for fi nancial institutions to weather the liquidity squeeze, and providing fi scal stimulus to the economy. Policy challenges to the country going forward include reducing the potential negative impact of capital infl ows and meeting G-20 standards of fi nancial sector reforms. Malaysia’s resilience to the global fi nancial crisis is partly due, as was the case of Indonesia, to policies implemented in the aft ermath of the Asian fi nancial crisis of 1997-1998, such as adopting a more cautious stance on fi nancial globalization and strengthening the fi nancial sector. Other factors include the implementation of a massive fi scal stimulus package, the expansion of the China’s demand for imports and the good health of fi nancial sectors in other countries of region. Th e country’s short-term challenges include reducing the fi scal defi cit, rationalizing subsidies and managing
5
Alberto E. Isgut
infl ationary pressures. In the medium- to long-term, Malaysia needs to overcome its “middle-income trap” of slow growth of GDP per capita and a low investment rates. Th e Pacifi c island countries were aff ected indirectly by the global fi nancial crisis through trade, capital fl ows and volatility of fuel and food prices. Remittances fell but not drastically, as the Australian and New Zealand economies remained strong, and the number of tourists declined slightly in 2008 and 2009 but bounced back in 2010. However, the impact of the crisis was felt more strongly by the poor, who were aff ected due to infl ation resulting from high fuel and food prices. Th e global fi nancial crisis of 2008-2009 exacerbated Pakistan’s macroeconomic diffi culties associated to the global food and fuel price hikes of the previous years, with current account and fi scal defi cits rising sharply and economic growth slowing down markedly. In spite of contractionary macroeconomic policies adopted under the IMF programme, macroeconomic stability remained elusive, not least because of poor policy coordination. A three-pronged strategy to move the economy out of this maelstrom focuses on prudent macroeconomic management, structural reforms, and growth-enhancing public investments. Aft er the collapse of Lehman Brothers, the Republic of Korea, a small open economy with deep international fi nancial linkages, experienced a sudden stop in the massive capital infl ows it had been receiving prior to the crisis. Th e chapter discusses the channels of transmission from capital infl ows to expansion of credit and liquidity in the Korean Government and explains why even a very large accumulation of foreign exchange reserves could be insuffi cient to protect the economy from the impacts of a reversal in capital infl ows. It argues for the need to implement macroprudential policies and describes the recent experience of the Republic of Korea with such policies. Th e resilience of the Th ai economy to the global fi nancial crisis was due to its high level of international reserves and to the existence of enough fi scal space to pursue expansionary fi scal policy in response to the crisis. An eff ective supervision and good management practices in the banking sector contributed to a low rate of non-performing loans and a high capital base. However, three years aft er the global fi nancial crisis, the Th ai economy was hit again, this time by devastating fl oods that caused the GDP to contract steeply in the 4th quarter of 2011. Th is second crisis highlighted the need to
6
Introduction
improve emergency and crisis resolution planning and to invest in physical and social infrastructure to mitigate the impacts of future natural disasters. Among the many important lessons that emerge from the country analyses included in this book, the following two should be highlighted: (a) the need to preserve stability in the foreign exchange market and in the fi nancial system, which are increasingly interrelated; (b) having enough policy space to pursue decisive countercyclical monetary and fi scal policies in the event of a sudden downturn in economic activity, including by setting up social safety nets to support specifi c segments of the population hit by a crisis. With respect to the need to preserve stability in the foreign exchange market, it is worth remembering that the currencies of Indonesia, Malaysia, Republic of Korea and Th ailand collapsed during the Asian fi nancial crisis. Th e Malaysian ringgit lost 40 per cent of its value, the Th ai baht and the Korean won lost 50 per cent and the Indonesian rupiah more than 80 per cent (fi gure A). Although these currencies recovered somewhat aft er the crisis, by the end of 2000 they were signifi cantly lower than before the crisis. In contrast, during the global fi nancial crisis, the Malaysian ringgit and the Th ai baht dropped only 13 per cent compared to before the crisis. Although the Indonesian rupiah dropped a little more, 23 per cent, these three currencies recovered all the lost ground during 2010. Th e Republic of Korea won experienced a larger devaluation during the global fi nancial crisis, of about 40 per cent, but it recovered half of that loss in value during 2011. Collapses of exchange rates are disruptive for many reasons. First, by increasing dramatically the prices of tradables, they simultaneously push up the infl ation rate and depress the domestic demand for importables and exportables, leading to stagfl ation. At the same time, if corporations, banks or the Government have debts in foreign currencies, the domestic currency cost of servicing those debts will also increase dramatically, leading to insolvency, bankruptcies, and the need for Governments to bailout fi nancial institutions to minimize disruptions in the availability of credit, which could cause even more widespread damage throughout the domestic economy.

7
0
20
40
60
80
100
120
US$ per domestic currency unit (Index January 1997=100)
1997 1998 1999 2000 0
20
40
60
80
100
120
2008 2009 2010 2011
US$ per domestic currency unit (Index January 2008=100)
Pakistani rupee
Korean won
Thai baht
Indonesian rupiah
Chinese yuan
Malaysian ringgit Chinese yuan
Indonesian rupiah
Thai baht
Pakistani rupee
Malaysian ringgit
Korean won
Alberto E. Isgut
Figure A. Exchange rates during the Asian fi nancial crisis and the global fi nancial crisis
Th e dramatic experiences with exchange rates collapses of Indonesia, Malaysia, and Th ailand during the Asian fi nancial crisis led these countries to accumulate vast levels of foreign exchange reserves and to implement prudential fi nancial regulations. By the time the global fi nancial crisis occurred, these countries’ banking systems were well-capitalized and with low levels of non-performing loans, and the central banks had enough policy space to intervene in foreign exchange markets and soft en the decline in value of their currencies. Th e problem of foreign-currency liabilities in the fi nancial system, however, continued to aff ect the Republic of Korea during the global fi nancial crisis. Although the economy remained resilient during the crisis, without experiencing a contraction, the sudden stop in capital infl ows led a large drop in the value of the won and the subsequent implementation of macroprudential policies to reduce the risk of similar episodes in future. To be sure, other way of minimizing the risks of capital outfl ows during a crisis is through restrictions to the movement of capital fl ows in and out of the country. Malaysia’s controls to capital outfl ows during the Asian fi nancial crisis were considered eff ective to stabilize the ringgit and facilitate
Source: Author’s calculations based on data from Pacifi c Exchange Rate Service. Available from www.fx.sauder.ubc.ca.

8
Introduction
the country’s recovery. Also, the fi nancial sectors of Bangladesh, China and Pakistan are still mostly insulated from the global fi nancial market, implying that the main channel of transmission of the crisis to these countries was through the current account of the balance of payments. An important diff erence between the Asian fi nancial crisis and the global fi nancial crisis was the pro-active and eff ective response of the monetary and fi scal authorities in such countries as China, Indonesia, Malaysia, the Republic of Korea and Th ailand in the latter crisis. While the central banks of these countries lowered their policy rates aggressively between the collapse of Lehman Brothers and the beginning of 2009, their Governments announced fi scal stimulus packages to contain the adverse impacts of the crisis as soon as possible. However, the implementation of such pro-active responses required policy space, which not all countries in the region had at the time of the global fi nancial crisis. At the time of the global fi nancial crisis, Pakistan was receiving fi nancial support from the International Monetary Fund under a pro-cyclical policy package that required the country to tighten its monetary policy and to reduce its fi scal defi cit. An important component of counter-cyclical fi scal policies is setting up social safety nets to protect workers aff ected by downturns. During the global fi nancial crisis, workers in export industries were the most aff ected, as the cases of Bangladesh and Malaysia illustrate. Th e need to generate and preserve policy space for Governments to protect economic growth, employment and development in the event of crises is the single most important lesson transpiring the essays contained in this book. Th e occurrence of crises is uncertain, but their likelihood could and should be assessed by policymakers as a fi rst step towards building resilience and minimizing their adverse impacts. Th e main policy failure in the Asian fi nancial crisis of 1997-1998 was to expose economies to sudden reversals in capital infl ows which eventually led to the depletion of foreign exchange reserves, uncontrollable devaluations of domestic currencies and the serious fi nancial and economic consequences described in some of the chapters of this book. Th e large accumulation of foreign exchange reserves in most countries in the region and the maintenance of tight regulations on capital fl ows in some of them were the keys to minimizing the disruptive eff ects of sudden reversals of capital infl ows preserving exchange rate stability during the global fi nancial crisis of 2008-2009. To be sure, large accumulations of foreign exchange reserves have high opportunity costs (Rodrik, 2006; Cruz

9
1 In addition, it has been claimed that tight regulations on capital fl ows may adversely aff ect the devel-opment of domestic fi nancial systems and the availability of credit to domestic fi rms. See, for example, Forbes (2007) for the case of Chile. However, the generality of this claim is questionable. For instance, Chinn and Ito (2005) showed that fi nancial openness contributes to equity market development only when a threshold level of general development of legal systems and institutions has been attained, which has been confi rmed by Klein and Olivei (2008) and Eichengreen and others (2011). Also, Aizenman (2005) found that countries that fi nanced their capital formation with a higher share of domestic savings grew faster over the period 1970-2000.
Alberto E. Isgut
and Walters, 2008).1 However, these costs should be balanced against the potentially much more serious costs of a balance of payments crisis and an uncontrolled devaluation of the domestic currency. In future, Governments of the region should continue assessing carefully the likelihood of various crises and have in place measures to protect their economies if a crisis occurs. However, Governments should also evaluate the effi cacy and costs of such measures and consider ways to improve them. In the area of preserving exchange rate stability, collective fi nancial safety nets, such as the Chiang Mai Initiative Multilateralization, could play a larger role in future. In this area, as the chapter on the Republic of Korea suggests, it is particularly important to identify the channels and players through which infl ows of foreign exchange are transformed into expansions of credit in domestic currency in order to set up proper regulatory measures. Exchanges of experiences in the area of regulation of capital fl ows among countries of the region with diff erent levels of fi nancial development could be extremely useful for the identifi cation of best practices and to support policymakers in improving the design and execution of policies in this area. In addition, as discussed in many chapters of this book, it is critical to strengthen prudential regulations to preserve the stability of the fi nancial system. Financial instability, which could be described as cycles of excessive expansion of credit followed by borrowers’ insolvency, could cause serious threats to fi nancial institutions and lead to onerous government bailouts — as the United States subprime mortgage crisis attests. Financial instability could be a consequence of large capital infl ows to an economy, as discussed in the chapter on the Republic of Korea, but it can also originate in the domestic economy, for example as a consequence of excessive lending for real estate development. In light of the extremely disruptive impacts of domestic fi nancial crises on economic activity and the potentially huge fi scal costs of rescuing failed fi nancial institutions, the importance of implementing

10
Introduction
eff ective prudential fi nancial regulations cannot be overstated. Th is is another important area where regional cooperation in capacity-building and for the identifi cation of best practices could be very useful. While preserving stability of the exchange rate and the fi nancial system are very important policy objectives, the chapters of this book also discuss extensively how Governments responded to crises using counter-cyclical macroeconomic policies. In this regard, the ability of many countries of the region to design and speedily implement large stimulus packages is remarkable and stands in sharp contrast to the experience of the same countries during the Asian fi nancial crisis of 1997-1998. Similarly, central banks of the region acted fast and in a coordinated fashion to aggressively lower their policy rates. Looking forward, it is critical for Governments of the region to be able to respond in a similarly eff ective manner to future crises which, as discussed in the chapters on Indonesia and Th ailand, could also be caused by natural disasters. A fi nal message of the book is the need for Governments to preserve important medium- to long-term developmental goals. Ultimately, a major reason for protecting economies from the impacts of crises is to avoid losses in hard-earned progress in the creation of employment and business opportunities, the reduction of poverty, and the improvement in the social conditions of the majority of the population. As pointed out in the chapter on Bangladesh, the impact of economic downturns usually falls disproportionately on the poor, not only in terms of economic distress and deterioration of poverty situations but also through the worsening of key social development indicators, such as school attendance of children and nutritional status of the household members, especially children and women. As a result, the need for policy responses in the event of a crisis to aim at preventing the deterioration of the living conditions of the weaker and vulnerable sections of society cannot be overemphasized.

11
Chapter 1
BangladeshMustafa K. Mujeri
Th e powerful forces of globalization have made economies across the world so closely connected with each other that diffi culties in some of them are very likely to have adverse impacts on other economies. As is well known, the global fi nancial crisis which originated in the United States housing market in 2007 engulfed the world economy within a short period of time. Th e fi nancial crisis and the consequent economic recession quickly aff ected almost all economies of the world, though in varying degrees. Although the developed industrial economies were the fi rst victims, the crisis transmitted to the emerging and developing economies by 2008. Th e year 2009 experienced the fi rst contraction of the global economy in the post World War II era and the severe recession continued well into 2010. Th e developing economies were impacted through the fi nance, trade, and investment channels. Although the Bangladeshi economy showed considerable resilience against fi nancial and real economy vulnerabilities of the global crisis and the eff ects of the crisis were hardly visible until the last quarter of 2008, the situation started to change as the advanced economies entered into a deeper recessionary phase by the end of 2008. As the Bangladeshi economy started to slow down, the country’s growth and other macroeconomic projections were revised downwards. A major concern for Bangladesh was the social impact of the slowdown especially on poverty, health, education, and other critical social development outcomes. Although Bangladesh was not severely aff ected by the global fi nancial crisis of 2008, a number of its export sectors suff ered. Th e Government’s response was to adopt a stimulus package for assisting those sectors. However,

12
Bangladesh
the size of the package was rather small compared with the size of the economy because of the country’s limited fi scal and policy space for accommodating the necessary increases in expenditures and for implementing the relevant programmes. In this context, it is also important to recognize that the global fi nancial crisis hit Bangladesh – a primarily import-dependent economy – while the country was still suff ering from the consequences of persistently high fuel and food prices. Th is chapter examines the experience of Bangladesh in the wake of the economic crisis of 2008 with the aim of drawing policy implications and measures that the country should undertake to protect the economy from the adverse consequences of any such future events. Besides considering the macroeconomic consequences of the crisis, the chapter focuses on social dimensions such as employment and poverty. Th e purpose is to identify the broad elements of a possible post-crisis agenda to cope with external shocks in future and to sustain the country’s development eff orts.
Structure and performance of the Bangladeshi economy Th e degree to which developing countries were aff ected by the global fi nancial crisis depended on the structure of their economies and the extent of their integration into the global economy (Verick and Islam, 2010). Th e economy of Bangladesh is relatively small and characterized by a high population density, a low resource base, and recurrent natural disasters. Th e country’s population was estimated at nearly 150 million in 2011; thus the country’s population density exceeds 1,000 persons per sq. km. – one of the highest in the world. Moreover, an important share of the country’s area is submerged by monsoon fl oods every year, and devastating fl oods including tidal surges and cyclones occur frequently. Despite these formidable constraints, Bangladesh has performed well, especially in recent years, showing that a country can achieve signifi cant human and social development even at relatively low levels of income (Mujeri, 2003; Mujeri and Sen, 2006; Sen and others, 2007). Although the overall growth performance of Bangladesh over the past three decades has not been spectacular, there has been an acceleration in growth, from 3.7 per cent in the 1980s, to 4.8 per cent in the 1990s, 5.4 per cent over 2001-2005 and 6.2 per cent over 2006-2010 (table 1.1). Th e fi gures indicate that the country has also made good progress in increasing its per

13
1981-1990 1991-2000 2001-2005 2006-2010 2011 2012 2013
GDP 3.7 4.8 5.4 6.2 6.7 6.2 6.0
Population 2.2 1.7 1.4 1.3 2.5 1.3 1.3
Per capita GDP 1.5 3.1 4.0 4.9 4.1 5.0 4.7
Average annual growth rates (per cent)
Mustafa K. Mujeri
capita income particularly over 2006-2010, when its growth rate accelerated to almost 5 per cent per year. Th e higher growth of per capita GDP of the period has come from a combination of increased economic growth and reduced population growth. Th e country’s early demographic transition is remarkable, given its relatively low level of development. However, while the acceleration in GDP growth attained by Bangladesh has been signifi cant, a growth rate of around 6 per cent per annum is not particularly high from an Asian perspective.
Table 1.1. Economic growth in Bangladesh
Th e values of the determinants of growth have also changed favourably during the period. Th e growth in GDP was supported by rising rates of investment and domestic savings, which increased by more than 2 percentage points between 1998-2000 and 2008-2010 (table 1.2). With the adoption of a private sector-led development strategy, the relative role of the private sector has also been increasing and private investment now accounts for nearly three-fourths of the total yearly investment in the country. Th e economy has become more open, with the share of merchandise trade (exports and imports) in GDP increasing from less than 30 per cent in 1998-2000 to nearly 40 per cent in 2008-2010.
Sources: Bangladesh Bureau of Statistics (2000 and 2001); Bangladesh, Ministry of Finance (2011).Note: Average annual percentage growth rates for each period.

14
Bangladesh
Table 1.2. Selected macroeconomic indicators of the Bangladeshi economy
Sources: Bangladesh Bureau of Statistics (2000 and 2001), Bangladesh, Ministry of Finance (2011).Note: All the indicators except CPI infl ation are expressed as percentages of the GDP. CPI infl ation is the average annual growth rate in the Consumer Price Index in per cent.
As for the structure of production, all three economic sectors (agriculture, industry and services) contributed to accelerating the GDP growth (table 1.3). Th e annual growth rate of agricultural value added increased by 2.1 percentage points, from 2.3 per cent in the 1980s to 4.4 per cent during 2007-2010, whereas the rates of growth of industry and services increase, respectively, by 1.2 percentage points and 3.1 percentage points. Th e structure of the economy also witnessed signifi cant changes. Th e share of agriculture in GDP declined to 20 per cent in 2010 from 33 per cent in 1980. Th e share of industry correspondingly increased from 17 per cent in 1980 to 30 per cent in 2010, due mainly to the impressive performance of manufacturing exports and construction activities, and the share of the services sector remained unchanged at around 50 per cent.
1981-1983 1998-2000 2001-2003 2004-2006 2008-2010
Gross investment 17.5 22.1 23.2 24.5 24.3Gross domestic savings 11.7 17.7 18.3 20.0 20.2Gross national savings 17.6 22.4 23.6 25.9 29.9Exports 5.4 11.8 13.0 15.0 17.1Imports 15.2 17.5 18.8 21.6 22.8Total revenue 6.6 9.0 10.1 10.7 11.3Tax revenue 5.3 7.3 8.0 8.6 9.0Total public expenditure 11.4 13.7 14.8 14.8 16.2Overall budget balance -6.8 -4.7 -4.6 -4.2 -4.2Current account balance -3.8 -0.5 -0.4 0.1 2.4CPI inflation 11.0 6.2 3.0 6.5 8.0
Three-year averages

15
1981-1990 1991-1996 1997-2006 2007-2010AgricultureIndustryServicesGDP
2.35.83.73.8
1.67.54.14.4
3.68.76.25.5
4.47.06.86.2
1980 1990 1997 2010AgricultureIndustryServicesGDP
33.217.149.7
100.0
29.520.849.7
100.0
25.925.049.1
100.0
20.329.949.8
100.0
A. Average annual growth rates
B. Share in GDP
1980-1990 1990-2000 2001-2010
Agriculture 21.1 18.8 12.9Industry 29.2 34.2 34.4Services 49.7 47.0 52.7Total 100.0 100.0 100.0
Mustafa K. Mujeri
Table 1.3. Changes in economic structure, 1981-2010
In addition to the growth rate, the relative contribution to the incremental value added is an important indicator of the sectoral performance and their underlying dynamism. To illustrate this, the share of the absolute contribution of each sector to the incremental GDP over diff erent sub-periods is presented in table 1.4. During the 1980s the services sector contributed nearly 50 per cent to the incremental GDP while the contribution of industry was 29 per cent and that of agriculture was 21 per cent. Over the years, the share of agriculture to incremental value added consistently declined and, between 2001 and 2010, it fell to 13 per cent while corresponding shares of industry and services increased, respectively, from 29 to 34 per cent and from 50 to 53 per cent.
Table 1.4. Contribution of diff erent sectors to incremental GDP
Sources: Bangladesh Bureau of Statistics (2000 and 2001); Bangladesh, Ministry of Finance (2011).Note: Figures expressed in per cent. Calculations based on the GDP at 1995/96 prices.
Sources: Bangladesh Bureau of Statistics (2000 and 2001); Bangladesh, Ministry of Finance (2011).Note: Figures expressed in per cent.
16
Bangladesh
Major reforms in economic policies Since the mid-1970s, Bangladesh started to reverse its regime of restricted and State-controlled policy by adopting neo-liberal policies to create an open and private sector-led economy and a liberal trade regime. Th ese reforms signifi cantly infl uenced the country’s socio-economic performance by changing the underlying allocative and distributive policies and shift ing the sectoral allocation of resources and the ownership pattern of productive factors. Th e reforms were implemented rapidly in the trade sector, resulting in signifi cant reduction in tariff and non-tariff barriers. Th e principal aim of these reforms was to liberalize the external trade and foreign exchange regimes and to rationalize the trade regime by lowering tariff rates, phasing out quantitative restrictions, streamlining import procedures, and introducing tax reforms and export promotion measures. Th e deregulation in the industrial sector was slow and it generated mixed outcomes. Although a dynamic and export-oriented readymade garments sector emerged, other sectors, with the exception of the pharmaceutical industry, were unable to benefi t, partly because they continued facing substantial fi nancial and infrastructural bottlenecks. Th e process of deregulation in agriculture covered the liberalization of the fertilizer and irrigation equipment markets, reforms in the public food grain distribution system, and a restructuring of subsidies on modern inputs. Th e overall impact of these policies on agricultural production and productivity was highly positive.
Social and human development Social and human development is both intrinsic to the defi nition of what constitutes a good standard of living and instrumental to economic development. Education, in particular, is a powerful vehicle for improving awareness on health issues and the uptake of preventive health practices. Eff ective government policies to mitigate the impact of preventable diseases, to protect the poor from insurmountable costs of health care, and to ensure access to aff ordable, essential, high-quality health care and education are key to increase the stock of human capital and facilitate long-term economic growth.

17
Bangladesh India Pakistan Nepal Sri Lanka South Asia
Total fertility rate1975 6.8 5.1 7.0 6.3 3.9 5.42011 2.2 2.5 3.2 2.6 2.2 2.6Percentage change -67.6 -51.0 -54.3 -58.7 -43.6 -51.9
Life expectancy at birth 1970 44.2 49.1 49.2 42.1 64.5 49.02011 68.9 65.4 65.4 68.8 74.9 65.9Percentage change 55.9 33.2 32.9 63.4 16.1 34.5
Under-five mortality rate 1970 239.0 206.0 183.0 234.0 100.0 207.02009 52.0 66.0 87.0 48.0 15.0 69.0Percentage change -78.2 -68.0 -52.5 -79.5 -85.0 -66.7
Adult literacy rate1995 38.1 52.0 37.8 27.5 90.3 …2010 55.9 62.8 55.5 59.1 90.6 62.8Percentage change 46.7 20.8 46.8 114.9 0.3 …
Mustafa K. Mujeri
Th e human development index (HDI) closely shadows the targets that all countries have endorsed as the Millennium Development Goals to be achieved by the year 2015. Th e HDI value of Bangladesh rose to 0.50 in 2011 from 0.30 in 1990 (UNDP, 2011). Notwithstanding the relatively slow economic growth, Bangladesh’s progress in human development has been fast and stands out in the context of South Asia. Although the level of social deprivations is still high in Bangladesh, the country has made clear progress in several areas, such as in reducing fertility, bringing down child mortality and improving life expectancy. Bangladesh’s progress in most areas has been higher than the average progress recorded by South Asia (table 1.5). Although economic growth is the major tool for fi ghting poverty and “growth is a powerful ally of the poor, not their enemy”, the issue is complex since the impact of economic growth on the rate of poverty reduction depends on the nature, strength, and other characteristics of the links that exist between economic growth and poverty. Moreover, these links are notdirect, as they can be decomposed into the relationship between economic
Table 1.5. Social development in Bangladesh: a South Asian perspective
Source: United Nations Development Programme, Human Development Report (New York, various years).

18
Bangladesh
growth and the distribution of income and the relationship between the distribution of income and poverty. One obvious conclusion that follows from the above is that the eff ectiveness with which economic growth translates into poverty reduction depends on initial conditions, such as the initial income distribution, the stage of development, and other socio-economic characteristics of a country. In particular, the degree of inequality determines the strength of the poverty-elasticity of economic growth.2
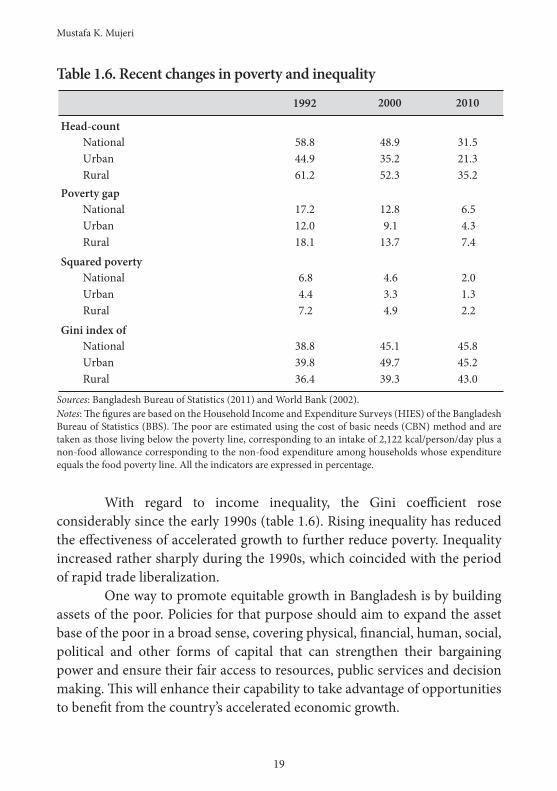
During the 1980s, the incidence of poverty declined at a very slow rate in Bangladesh, with substantial variation over diff erent sub-periods and between rural and urban areas, but the higher per capita real GDP growth had a salutary eff ect on the poverty situation in the 1990s. Between 1992 and 2010, the national head-count poverty index declined from 59 per cent to 32 per cent (table 1.6). Th is faster pace has largely been due to higher growth of consumption during the period. Th e annual Household Income and Expenditure Surveys-based real per capita consumption expenditure growth at the national level increased from only 0.6 per cent during the period 1984 and 1992 to nearly 2 per cent between 1992 and 2010. A declining trend can also be observed for other poverty measures, such as the poverty gap index and the squared poverty gap index. Th e data show that progress in reducing the head-count index was faster in the urban areas. Th e rural areas, on the other hand, displayed a faster progress in reducing the depth and the severity of poverty, as captured by the poverty gap and the squared poverty gap indices respectively. Around one-third of the poor in Bangladesh live in “extreme poverty”, a group that includes the elderly poor, disabled people, destitute persons, socially marginalized ethnic groups, and those engaged in dying occupations. Th e lives of the extreme poor are characterized by multiple and overlapping vulnerabilities, including long duration in poverty, oft en spanning generations, adverse interplays between the vulnerable ecology and chronic social disadvantages, high levels of consumption shortfalls, and food insecurity.
2 Th is brings out the importance of identifying specifi c policy measures that can improve or at least arrest the deterioration of income inequality without adversely aff ecting economic growth. Th e potential impact on economic growth of simultaneous policies to improve income distribution is diffi cult to predict a priori, in view of the complexity of the relationships. Th e empirical evidence from East Asian countries shows that countries with less initial inequality were able to realise higher growth but inequality also in-creased with growth. (Birdsall and others, 1995; Feng, 2011).
19
1992 2000 2010
Head-count National 58.8 48.9 31.5Urban 44.9 35.2 21.3Rural 61.2 52.3 35.2
Poverty gap National 17.2 12.8 6.5Urban 12.0 9.1 4.3Rural 18.1 13.7 7.4
Squared poverty National 6.8 4.6 2.0Urban 4.4 3.3 1.3Rural 7.2 4.9 2.2
Gini index of National 38.8 45.1 45.8Urban 39.8 49.7 45.2Rural 36.4 39.3 43.0
Mustafa K. Mujeri
Table 1.6. Recent changes in poverty and inequality
With regard to income inequality, the Gini coeffi cient rose considerably since the early 1990s (table 1.6). Rising inequality has reduced the eff ectiveness of accelerated growth to further reduce poverty. Inequality increased rather sharply during the 1990s, which coincided with the period of rapid trade liberalization. One way to promote equitable growth in Bangladesh is by building assets of the poor. Policies for that purpose should aim to expand the asset base of the poor in a broad sense, covering physical, fi nancial, human, social, political and other forms of capital that can strengthen their bargaining power and ensure their fair access to resources, public services and decision making. Th is will enhance their capability to take advantage of opportunities to benefi t from the country’s accelerated economic growth.
Sources: Bangladesh Bureau of Statistics (2011) and World Bank (2002).Notes: Th e fi gures are based on the Household Income and Expenditure Surveys (HIES) of the Bangladesh Bureau of Statistics (BBS). Th e poor are estimated using the cost of basic needs (CBN) method and are taken as those living below the poverty line, corresponding to an intake of 2,122 kcal/person/day plus a non-food allowance corresponding to the non-food expenditure among households whose expenditure equals the food poverty line. All the indicators are expressed in percentage.

20
0
10
20
30
40
00-01 02-03 01-02 03-04 04-05 05-06 06-07 07-08 08-09 09-10 10-11 11-12 Fiscal year
Per cent
Bangladesh
Impacts of the global fi nancial crisis Next we turn to variables that are indicators of the strength of the economy to withstand external economic shocks such as exports, foreign exchange reserves, and external debt (Reinhart and Rogoff , 2009). In terms of external accounts, foreign exchange reserves and the debt situation, the economy of Bangladesh not only was doing well before the global fi nancial crisis started but also remained stable during the crisis period. During the years prior to the global fi nancial crisis of 2008-2009, Bangladesh attained a healthy rate of growth of exports (fi gure 1.1). Th e rate of growth peaked in the fi scal year (FY) 2005-2006 and somewhat declined before the crisis. However, there was a sharper decline in the growth of exports between FY 2007-2008 and FY 2009-2010. Th us, it seems that the global fi nancial crisis simply exacerbated a trend that was already evident before the crisis.
Figure 1.1. Annual growth rate of exports
As for foreign exchange reserves, there has been a sharp upward trend since FY 2005-2006 due mainly to a sharp upward trend in the growth of remittances (fi gure 1.2). Moreover, the reserves exceeded the minimum threshold of three months’ import bill since FY 2006-2007. It also crossed
Source: Bangladesh Bank (2011). Note: Exports in US$.

21
0
2
4
6
8
10
94-95 96-97 98-99 00-01 02-03 04-05 06-07 08-09 10-11
Billions of US$
Fiscal year
Mustafa K. Mujeri
the threshold of 10 per cent of GDP beginning that year. Th e country’s short-term debt has always been a small percentage of foreign exchange reserves as well. Th e country’s external debt situation is also sound. Th e total external debt as percentage of gross national income (GNI) has declined from over 30 per cent in the early 2000s to about 22 per cent in FY 2008-2009.
Figure 1.2. Foreign exchange reserves
Source: Bangladesh Bank (2011).
Th us, Bangladesh had reasonably sound and stable indicators as far as the resilience factors to withstand external economic shocks were concerned.
Transmission channels of the global fi nancial crisis to the Bangladeshi economy Th ere are several transmission channels through which the impact of the global fi nancial crisis may have aff ected the Bangladeshi economy (fi gure 1.3). Th ese can be conveniently grouped under two broad headings: (i) fi nancial channels and (ii) trade and remittances channels.

22
Global financial and economic crisis
Bangladesh economy
Trade Financial links: aid/FDI/capital flows
Real sector growth and macroeconomic outcomes Policy response and stimulus
package
Budgetary and macroeconomic
implications
Remittances
Social impact: job losses and rising unemployment; cuts in consumption, health care and education expenses; rising deprivations and vulnerabilities;
poverty and livelihood impact; effects on other social indicators
Real sector growth and macroeconomic outcomes Policy response and stimulus
package
Budgetary and macroeconomic
implications
Social impact: job losses and rising unemployment; cuts in consumption, health care and education expenses; rising deprivations and vulnerabilities;
poverty and livelihood impact; effects on other social indicators
Bangladesh
3 Bangladesh’s fi nancial system is dominated by commercial banks owning more than 95 per cent of total assets. Th e fi nancial system is hardly exposed to subprime products such as mortgage backed securi-ties and collateralised debt obligations and hence the chance of toxic asset exposure is non-existent.
Figure 1.3. Transmission channels of impact of the global fi nancial crisis
Source: Adapted from Ahmed and Mujeri (2009).
Bangladesh’s fi nancial sector maintains a good health due to past reforms, and it remains highly insulated from foreign markets. Th e fi nancial linkages of Bangladesh are limited because of the relatively underdeveloped nature of the country’s fi nancial markets.3 In the aft ermath of the global crisis, the country’s credit market continued operating normally, without any credit crunch, and providing adequate fl ows of credit to the real sector. Indeed, a major concern of the fi nancial market at that time was the low demand for bank credit as fi rms and consumers were forced to cut back investments and consumption in the face of slowing economic activities and limited demand.
Foreign capital infl ows to Bangladesh are small because the country’s capital market is not strongly linked to the global capital market. In 2009, foreign investment accounted for only 2.5 per cent of total market capitalization (Rahman and others, 2009). Bangladesh is neither a major destination of foreign direct investment (FDI) nor there exists any noticeable

23
( )
Year Amount
2000 5792002 3282003 350
2004 4602005 8452006 792
2007 6662008 1 0862009 7002010 913
( )
Year Amount
( )
Year Amount
Mustafa K. Mujeri
trend in the fl ows of FDI (table 1.7). Th ese fl ows exceeded US$ 1 billion in 2008, declined in 2009 due to drops in investment in the telecommunications and readymade garments sectors, and picked up again in 2010. Offi cial aid fl ows have also remained mostly unchanged, while external debt is low and reserves are comfortable. In addition, a reasonably high domestic savings rate of around 20 per cent of GDP provides added cushion.
Table 1.7. Infl ows of foreign direct investment to Bangladesh, 2000-2010
Bangladesh's capital account remains nonconvertible with few private transactions permitted. Th erefore, private debt transactions are limited and strictly monitored by the Bangladesh Bank. Capital fl ows take place mostly in terms of concessional lending and FDI, while portfolio investment fl ows are minimal. As a result, the fi nancial sector remains largely insulated from the risk of transmission of fi nancial crises from abroad. Trade and remittances linkages, on the other hand, provide important avenues through which global fi nancial shocks are transmitted to the Bangladeshi economy. For Bangladesh, the export sector is the most vital transmission channel through which the eff ects of the global recession are spread. Th e total exports from Bangladesh rose by nearly 16 per cent in FY 2007-2008, but they declined to 10 per cent in FY 2008-2009. As table 1.8 and fi gure 1.4 show, there was a marked decline in the growth rate of exports since October 2008 (see also Rahman and others, 2009; Islam and others, 2011).
Source: United Nations Conference on Trade and Development (2011).Note: Figures in million US$.

24
Table 1.8. Quarterly growth of major manufacturing exports, 2009
Figure 1.4. Year-on-year growth rate of exports
Two features contribute signifi cantly to the potential vulnerability of the exports sector: the high dominance of readymade garments, which represent over three quarters of total export earnings and the high reliance of the country’s exports on United States, the European Union and other developed country markets, which represent 87 per cent of the value of the country’s exports. Th e growth slowdown in the developed countries had
Sources: Bangladesh Bank (2010; 2011).Notes: Q1 is Jul-Sep 2008, Q2 is Oct-Dec 2008, Q3 is Jan-Mar 2009, and Q4 is Apr-Jun 2009. Figures expressed in per cent.
Commodities Share in total exports
Q1 Q2 Q3 Q4 FY2009 FY2008Woven garments 38.0 36.7 6.5 14.3 4.1 14.5 10.9Knitwear 41.3 52.0 4.7 10.8 3.7 16.2 21.5Frozen food 2.9 15.7 -24.3 -32.5 -21.0 -14.9 3.6Home textile 2.0 27.8 9.3 5.6 -9.1 7.6 13.4Jute goods 1.7 -4.3 -32.0 -18.3 -7.2 -15.4 -0.8Leather 1.1 -6.4 -50.2 -41.6 -46.8 -37.7 6.9All products 100.0 42.3 -1.6 6.0 -0.6 10.3 15.9
Export growth
-20
0
20
40
60
Jul Aug Sep Oct Nov Dec Jan Feb Mar Apr May Jun
Per cent
Month
Fiscal year 2007-2008
Fiscal year 2008-2009
Bangladesh
Source: Bangladesh Bank (2010). Note: Exports in US$.

25
-30
-20
-10
0
10
20
30
40
50
Jul Aug Sep Oct Nov Dec Jan Feb Mar Apr May Jun
Per cent
Month
Fiscal year 2007-2008
Fiscal year 2008-2009
Mustafa K. Mujeri
important implications on the demand for Bangladesh’s exports, especially for readymade garments. In addition, the sharp slowdown in global growth resulted in signifi cant declines in commodity prices, including food, oil, and metals. Th e net eff ect of global commodity price declines on Bangladesh, however, was complex, because the country benefi ted from the drop in oil and food prices (fi gure 1.5).
Figure 1.5. Year-on-year growth rate of imports
Another important channel of integration of the Bangladeshi economy into the global economy is international migration and remittances sent by the migrant workers. Remittances are the second most important source of foreign exchange earnings for Bangladesh aft er exports of ready made garments and continue to play a major role in the economy. Remittances were less aff ected by adverse growth prospects in developed economies since less than 30 per cent of the remittances originate in the United States, the European Union or other advanced countries. In fact, nearly 63 per cent of the remittances come from the Gulf region (fi gure 1.6).
Source: Bangladesh Bank (2010). Note: Imports in US$.

26
Figure 1.6. Major sources of remittance infl ows to Bangladesh, 2009
Source: Bangladesh Bank, Economic Data. Available from www.bangladesh-bank.org/econdata/index.php.
Nevertheless, since the countries that serve as major destinations for such workers, viz. those in the Middle East, Malaysia, and Singapore were adversely aff ected by the economic downturn, their demand for expatriate workers naturally fell. Th at in turn had a negative impact on the fl ow of migrant workers from the sending countries including Bangladesh. Th e number of migrant workers going abroad from Bangladesh declined from 981,000 in 2008 to 650,000 in 2009 and 427,000 in 2010. In fact, the monthly fi gures show a sharp decline aft er October 2009 and continuation of the declining trend throughout 2010 (fi gure 1.7). Th e sharp decline in the number of workers going abroad, however, was not refl ected in the fl ow of remittances which continued its upward trend (fi gure 1.8). Indeed, the remittances received in FY 2008-2009 rose to US$ 9.7 billion from US$ 7.9 billion in FY 2007-2008, and then increased to nearly US$ 11 billion in 2009-2010. Th e absence of any rigorous analysis on the determinants of the fl ow of remittances to Bangladesh, however, precludes drawing any defi nite conclusions regarding the factors that contributed to the growth of remittances despite the sharp decline in the outfl ow of migrant workers. Th ere is evidence, however, that the continued growth of remittances is related to the resilience of the non-oil GDP growth and a surge in the hiring of migrant workers from Bangladesh by the Gulf Coperation Council countries during 2006-2008 (IMF, 2010).
Saudi Arabia 29%
U.A.E 18%
U.K. 8%
Kuwait 10%
U.S.A. 16%
Qatar 4%
Oman 3%
Singapore 2%
Malaysia 3% Others
7%
Bangladesh

27
-100
-50
0
50
100
150
200
250
Jul Aug Sep Oct Nov Dec Jan Feb Mar Apr May
Per cent
Month
Fiscal year 2008-2009
Fiscal year 2007-2008
Figure 1.7. Year-on-year growth of outfl ows of Bangladeshi migrant workers
Source: Bangladesh Bank (2010 and 2011).
Figure 1.8. Year-on-year growth of remittance infl ows
Source: Bangladesh Bank (2010 and 2011).
Mustafa K. Mujeri
0
10
20
30
40
50
Jul Aug Sep Oct Nov Dec Jan Feb Mar Apr May Jun
Per cent
Month
Fiscal year 2007-2008
Fiscal year 2008-2009

28
Th e ripple eff ects of the external shocks were also transmitted to the labour markets. However, lack of up-to-date data makes it diffi cult to provide defi nite evidence of such eff ects. During the crisis, the labour market in Bangladesh seems to have undergone signifi cant quantity adjustments. Although open unemployment is not signifi cant mainly due to the defi nition and methodology adopted to measure it, the rate of open unemployment increased to 5.1 per cent in 2009 aft er remaining at around 4.2 per cent since 2000. But more alarmingly, the rate of underemployment, defi ned as the percentage of the labour force who works less than 35 hours per week and wish to work more than 35 hours per week, increased from 24.5 per cent in FY 2005-2006 to 28.7 per cent in FY 2008-2009. An earlier study also pointed towards quantity adjustment in terms of retrenchments and lay-off s (Rahman and others, 2009). One survey of enterpreneurs conducted during the period indicates that 8.3 per cent of them resorted to laying off workers and another 5.6 per cent closed down their production units altogether (Rahman and others, 2009). New recruitment in major export-oriented sectors also slowed down considerably.
Social impacts of global fi nancial crisis Th e slowdown in the growth of exports and remittances resulted in lower GDP growth which also had social implications. Th e most direct impact of economic slowdown due to the global fi nancial crisis is not only current job losses but also a contraction in future employment opportunities. Th e lower growth in exports is likely to lead to job cuts in the export industries and, consequently, on income loss of the workers. Th e decline in household income may trigger a host of changes in intra-household allocations of resources with implications on food security, nutrition, education, health care, as well as poverty dynamics and the intergenerational transmission of poverty. Table 1.9 shows that, as a result of the growth slowdown due to the global fi nancial crisis, the estimated losses in incremental employment were 0.1 million in 2009, 0.4 million in 2010, and 0.5 million in 2011. Th us the total loss of incremental employment in three years aft er which the global economy is expected to return to its normal growth path is 1 million, nearly 2 per cent of total employment in the base year.
Bangladesh

29
Fiscal year Employment without crisis
Employment with crisis
Loss of incremental employment
2008/09 6.5 52.9 52.82009/10 7.0 55.1 54.72010/11 7.2 57.5 57.0
0.10.40.5
5.76.16.7
with crisisGDP growth GDP
growth without crisis
Table 1.9. Loss of incremental employment due to the global crisis
It is likely that much of this job loss had taken place in industry and services, which represent 15 per cent and 37 per cent of total employment, respectively. Th e agriculture sector, with 48 per cent of total employment, grew robustly in the absence of natural calamities and other unexpected events during the period. Much of the lost employment was in the manufacturing sector, including leather, jute goods, readymade garments, and other export industries. However, considering the resilience that the Bangladeshi economy has shown, the direct employment eff ect was only partially visible in the short run, since the recession-hit industries coped with the crisis mostly by reducing prices rather than the volume of exports. Th e workers’ losses were mostly in terms of lower wages and decline in overtime income. Th e employment impact in the readymade garments sector in the short run was mainly in terms of loss in incremental employment, which now employs around 3.0 million people in more than 5,000 factories.4 Moreover, one million more unemployed persons in the economy means livelihood uncertainties for more than 5 million people in the current generation along with implications for future generations through the intergenerational transmission of poverty (inadequate food intake, low health care and education, and other key channels). Other major sectors
Mustafa K. Mujeri
4 Th e job loss in the readymade garments sector has many other social dimensions since 90 per cent of these workers are females and migrants from rural areas. Most of these workers are low-skilled and work for low wages. IOM (2010) shows that recent migrants, who migrated less than 5 years before, usually remit around 40 per cent of their income while migrants who have been around for a longer span of time remit 26 to 30 per cent of their incomes. Th is remitted money is mostly sent for family maintenance and for the education of younger family members. Th us, any downturn in the income of the apparel workers is more likely to generate long term adverse impacts on nutritional and human development indicators of rural households.
Source: Author’s calculations based on employment data from the Labour Force Survey 2005-06 assuming an employment-GDP elasticity of 0.59.Note: First two columns in per cent. Last three columns in millions.

30
5 Th e coeffi cient of variation, defi ned as the standard deviation divided by the mean, for the ratio of various infl ows to the GDP during the period 1980-2008, was 55 per cent for remittances, 138 per cent for FDI and 829 per cent for portfolio infl ows. For comparison, it was 48 per cent for exports and 45 per cent for aid. 6 It is estimated that an additional migrant worker from Bangladesh generates about US$ 816 of remit-tance income annually. See World Bank (2009).
which faced declines in exports due to the crisis included frozen food, leather and jute goods. Th e resulting production cuts hurt low-paid, low-skilled workers more, as they were the ones who lost jobs in larger proportions. Th e contraction in the shrimp sector, which employs around 1 million people, the majority of which are women, led to job losses in larger numbers for female unskilled workers, who have very limited alternative employment opportunities. As productive employment is the main conduit through which growth impacts poverty, the loss of employment by low-skilled workers is likely to aggravate the poverty situation. Similarly, remittances have been one of the key drivers of poverty reduction in Bangladesh. Th e infl ow of remittances in Bangladesh is considerably less volatile than FDI and portfolio fl ows.5 Th ere exists a strong positive correlation between remittance infl ows and household expenditures in the country. Households with migrant workers tend to have higher per capita expenditures compared to those without migrant workers, both on food and non-food items and on consumer durables. Households with migrant members also save a good amount of their remittance receipts. Th us a lower growth of remittances would tend to adversely aff ect the growth of household expenditure and lower household savings, aff ecting both current household welfare and their upward mobility. Although remittances continue to grow at present, their impact will diminish if demand in the migrant–destination countries remains unchanged.6 As such, a decline in the growth of remittance fl ows indicates potential income loss as well as multiplier eff ects of these losses in terms of investment in agriculture, education and non-food expenditures. Moreover, since there is a lag between labour migration and remittance receipts, the real impacts of the decline in the growth of out-migration are likely to be felt only in the longer term. It is well known that any reduction in income growth is likely to have an adverse impact on poverty and other Millennium Development Goals. One option for quantifying this impact is to use the elasticity of per capita GDP growth with and without crisis and calculate the gaps in the
Bangladesh

31
7 In the absence of country specifi c values for Bangladesh, the results use average “MDG elasticity” values for South Asia. See ESCAP, ADB and UNDP (2008). 8 One analysis indicates that the households paid a heavy cost for the economic downswing through mainly job losses, reduced incomes, and low cash commodity prices. Along with an estimated rise in un-employment by 10-15 per cent, household’s budget share spent on food increased by an average of 5 per cent due to food price infl ation, share on education decreased by about 20 per cent, and the share spent on health increased over a period of 12 months ending in March 2010. See Sanago (2010).
rate of progress in achieving selected targets. Th e results of such an exercise are presented in table 1.10.7 It can be seen that the rate of reduction in the proportion of population living in poverty declines by 0.5 percentage points in FY 2008-2009 due to slowdown in per capita GDP growth as a result of the crisis. Such reduction rates are higher in the next two years. Similar impacts can also be seen in the case of poverty gap ratio and the number of undernourished people. Although the impact on educational indicators is less, mortality indicators show greater susceptibility to slower income growth. Th ese results indicate that the global fi nancial crisis has made it more diffi cult for Bangladesh to achieve poverty reduction and other social development targets.8
Table 1.10. Impact of the global crisis on selected Millennium Development Goals
Mustafa K. Mujeri
Indicator 2005 Target in 20152008-09 2009-10 2010-11
Population living below the national poverty line
40.0 -0.52 -1.27 -1.02 29.4
Poverty gap ratio 9.0 -0.48 -1.16 -0.92 8.0Population undernourished 19.5 -0.30 -0.73 -0.58 13.8Net enrolment ratio in primary education, both sexes
87.2 0.03 0.08 0.06 100.0
Primary completion rate, both sexes 53.0 0.03 0.07 0.06 100.0
Under-5 mortality rate 62.0 -0.26 -0.64 -0.51 50.0
Infant mortality rate 45.0 -0.28 -0.68 -0.55 31.0
Maternal mortality ratio 290.0 -0.19 -0.45 -0.36 147.0
Gaps in achieving target (percentage points)
1.
2.3.4.
5.6.
7.
8.
Source: Ahmed and Mujeri (2009).Notes: Indicators 1-5 in per cent. Indicators 6-7 per 1,000 live births. Indicator 8 per 100,000 live births.

32
Th e table shows that although the impact of global fi nancial crisis was not as severe as in other developing countries, Bangladesh experienced an adverse impact of the crisis through reductions in exports, remittances, and economic growth, which aff ected social equity and poverty. Analytical results using a comparative static computable general equilibrium (CGE) modelling framework of the Bangladeshi economy also lend support to the above conclusions. Th e analysis focusing on readymade garment exports, which is the most prominent channel of transmission through which the shocks from the global slowdown were propagated, suggests that a decline in readymade garments exports reduces manufacturing growth and hence GDP growth (Raihan, 2010). More importantly, the welfare, real consumption and poverty impacts on households are negative with proportionately larger impact falling on the poorer households. A similar result is also found in the case of a decline in remittances as a result of global recession. Bangladesh, however, tried to cope with the crisis through appropriate adjustments in monetary policy supported by an expansionary fi scal policy stance focused on boosting domestic demand and promoting more competitive markets. Th e strategic thrust of the Government’s policy was on spending more on education, health care, social protection, and social safety nets, which not only helped boost domestic demand but also supported broader social objectives like inclusive growth and poverty reduction. Th ough in the short-run, the impacts of the global fi nancial crisis on Bangladesh seemed to be moderate, the long run impacts, especially on social indicators, are considered to be quite severe. More specifi cally, the slowdown in the growth rates of many macroeconomic fundamentals can stunt progress towards becoming a middle income country by 2021.
Policy response and stimulus packages In order to mitigate the possible adverse eff ects of the global fi nancial crisis, Bangladesh adopted a number of measures and policy adjustments. At the initial stage, the country’s strategy was to monitor the fi nancial situation, safeguard the country’s foreign exchange reserves, and ensure a smooth fl ow of fi nance for exports, imports and the productive sectors of the economy, especially agriculture and small and medium enterprises. Th e prudent monetary policy of the Bangladesh Bank ensured a good balance between the concerns of infl ation on the one hand and the provision of adequate liquidity
Bangladesh

33
to the fi nancial system on the other. In addition, measures were adopted to correct the short term debt yield curve and “plan for tomorrow” especially in terms of dampening infl ation expectations and ensuring price stability. Th e primary focus of the credit policy was to support the productive sectors to facilitate job creation and ensure improved functioning of the credit markets and payment systems. In April 2009, the fi rst package of explicit policy support, including fi scal and fi nancial measures, was announced, and a second package was included in the budget of FY 2009-2010. Th e basic objective of these measures was to safeguard the economy from the adverse eff ects of the global recession, particularly in the developed countries. Th e major goals were to maintain export growth through diff erent measures aimed at supporting export oriented industries and to ensure a sustained fl ow of remittances from abroad. Th e fi rst package was worth Tk. 34.2 billion or US$ 495 million, around 0.6 per cent of GDP of 2009, while the second package was worth Tk. 50 billion or US$ 724 million, about 0.8 per cent of GDP. In the absence of any assessment of the implementation of the stimulus packages mentioned above, it is diffi cult to identify the impact that the various measures had on the performance of the economy and on the extent to which the segments of the economy that were adversely aff ected by the global fi nancial crisis benefi ted from them. However, a few general observations may be made about the contents of the packages.9
First, it is claimed that the fi nancial part of the package has been implemented fully, which should have benefi ted the targeted sectors according to the design of the measures. However, the size of the fi scal part of the stimulus package was rather small in relation to the country’s GDP.10 Th us, it would be unrealistic to expect any major impact from such measures. But in designing its response, the Government placed more emphasis on the policy support measures vis-à-vis the fi scal measures. It would therefore be interesting to see if those measures were able to provide the needed support
Mustafa K. Mujeri
9 Th e points that follow draw heavily from Islam and others (2011). 10 While China’s stimulus package amounted to 13 per cent of the country’s GDP, Malaysia, the Philip-pines and Th ailand allocated 7.9 per cent, 3.7 per cent and 2.8 per cent respectively. At the other extreme, India and Viet Nam allocated 0.9 per cent and 0.3 per cent respectively of their GDP for their stimulus packages. See IILS (2009).

34
11 No rigorous analysis is available on the implementation and impact of the various measures adopted in response to the crisis. In order to derive lessons for the future, it would be important to undertake such an analysis.
to the economic activities that were adversely aff ected during the economic crisis.11
Second, the issue of employment does not seem to have received adequate attention in the Government’s policy response. Except for either the continuation or strengthening and restructuring of existing programmes of social safety nets, there was very little in the stimulus package to support the domestic labour market. Th ere was no provision for possible support to the workers who were retrenched from functioning enterprises or who lost jobs when enterprises went out of business. Most industries (even those in the formal sector) do not have any provision of severance pay; and nothing was done to introduce such provision for workers who may have lost jobs due to the adverse eff ects of the economic crisis. Th e issues of postponing retrenchment and of severance pay could have been linked to the augmented cash subsidy that was provided. Th ird, the stimulus package could have included components on investment in infrastructure. In the past, such components proved to be eff ective in creating productive employment directly and indirectly, through multiplier eff ects, and producing a “crowding in eff ect” for investment in other sectors of the economy. Fourth, the implementation of even minor measures, such as a food ration for workers in the readymade garments sector, appeared weak. Similarly, the exact nature and purpose of the Skill Development Fund was not defi ned, and how and to what extent it was implemented remains unclear. While such a fund could serve the general purpose of upgrading the level of skills of workers during periods of economic crisis, it could also be used to provide retraining and redeployment facilities for retrenched workers. Fift h, since such shocks are common in market oriented economies, it would be important to create preparedness for responding to them and to adopt a longer term approach rather than reactive measures. Timeliness and speed of response is especially important from the point of view of eff ectiveness of whatever measures are undertaken.
Bangladesh

35
Lessons and challenges As the Bangladesh experience shows, strong macroeconomic fundamentals are essential to shielding, at least partly, the adverse impacts of external shocks, especially in the short run. Th is also provides some breathing time to create necessary policy and fi scal space for protecting the real economy and addressing the social concerns. Despite the country’s resilience to the crisis, the current economic outlook of Bangladesh is not devoid of challenges. Th e most urgent concern is the high headline infl ation caused primarily by food price pressures fuelled recently by non-food price increases following administered fuel price hikes. Since mid-2010, considerable increase in energy and food prices, both domestically and globally, has exerted supply-side infl ationary pressure on the economy which has also led to adverse budgetary implications by raising subsidies on domestic food and energy prices. Although energy and food prices in the global market have receded somewhat in the recent months, the possibility of their further rise in future cannot be ruled out. Moreover, the economic recovery of the United States and the euro zone countries is rather uncertain, with continuing high levels of unemployment and sovereign debt crises clouding the global economy. In addition, rising food infl ation is a matter of concern especially in bringing overall infl ation down since this may have some spill over eff ect on non-food infl ation as well. Other pressures on infl ation are a strong domestic demand, high private sector credit growth, and rising consumer spending. Th us, there are multiple sources of demand-side pressures on infl ation, in addition to increases in fi scal spending and the infl ow of remittances. In the domestic economy, a good performance of the agriculture and manufacturing sectors would clearly help Bangladesh in bringing infl ation down from beyond its comfort level. However, Bangladesh Bank’s liquidity management has to face two major challenges: injections from high fi scal defi cits and how to limit domestic liquidity in the face of strong credit demand by the public and private sectors. Another major concern is whether the central bank’s current eff orts to maintain a stable economic environment is paying off . Central banks in most Asian countries seem to have opted to rely on a combination of stronger currencies and higher interest rates to temper a worsening infl ation problem. Along with raising interest rates, most countries are using currency appreciation to tackle infl ation. In the case of Bangladesh, however, the domestic currency (taka) continues to depreciate at the time of writing.
Mustafa K. Mujeri

36
Several factors have contributed to excessive liquidity expansion in the economy during the current fi scal year. It would therefore be appropriate for the central bank authorities to explore a combination of actions for managing the liquidity situation. In this respect, it would also be important to recognize that raising the policy rates is not likely to be very eff ective under the present situation. Th e experience of several countries in the region in using central bank policy rates and cash reserve ratio to contain domestic liquidity and infl ation indicates that such measures have been largely ineff ective in the present situation. If interest rates are raised, growth is likely to be sacrifi ced. But this would not have much impact on infl ation since supply-side factors are clearly not within monetary control. In such a situation, demand-side measures will pay little dividend with growth sacrifi ced needlessly. While the above may be true, it is important to recognize for policy purposes that although the root cause of current infl ation lies in the supply side, the way infl ation works is that, even if it has a supply side and/or external source, it starts to feed on itself aft er a point. At the present juncture, infl ation in Bangladesh seems to have reached such a situation. At this stage, Bangladesh Bank needs to give a clear signal and ensure that high infl ation does not enter into the medium/long term expectations of the economic agents. If relatively high infl ation is taken for granted, infl ation would become a vicious cycle of its own. It is true that the shocks came from outside the monetary system, but what the central bank can do is to use its tools to contain it and ensure that it does not become a permanent feature. With high food and oil prices in the global market, the issue of equity also comes to the forefront in terms of shouldering the burden of fi ghting globally generated infl ation by raising interest rates and reducing growth in less developed countries like Bangladesh vis-à-vis the policies of the developed countries. Th e success of the policy actions would require greater fi scal and monetary coordination to ensure clear recognition of the importance of the monetary policy stance and appropriate alignment of relevant policy parameters within the overall macroeconomic framework. In addition, bringing appropriate changes in the Government’s debt management strategy would be important to improve the balance between short and long term borrowing since any shift in the borrowing pattern has implications for the conduct of monetary policy.
Bangladesh

37
Although in the past Bangladesh Bank has managed to bring down infl ation without compromising economic growth, infl ation has probably become the most vexing problem for the policymakers at present. In the backdrop of the recent fi nancial crisis and worldwide depression followed by rising commodity prices, there exists now a great concern that infl ation could undermine economic growth in Bangladesh. Th is concern is certainly not misplaced, especially in view of the sustained increases in food prices over the past year. With rising incomes and population and deepening structural supply problems, food is likely to become more expensive in the world market. Similarly, with upward pressure on wages as a result of infl ation, the self-fulfi lling spiral will consequently feed into infl ation. Mujeri (2008) shows that the nominal wage in Bangladesh is in fact closely related to infl ation. With rapid urbanization, the number of the lower-middle income groups who live in urban areas is rising, and food infl ation is particularly severe for these groups. Th ere are very few options in the face of this “multi-faceted” infl ation that is causing problems in Bangladesh. Monetary tightening has almost reached a plateau, as any further tightening could severely undermine economic growth, which Bangladesh cannot aff ord. Th e build-up of foreign currency reserve also comes at a cost. Th e Bangladesh Bank, like central banks elsewhere, invests reserves in low-yielding debt with short-term maturities. Th is is primarily done to have adequate liquidity to provide eff ective and timely insurance in case of a liquidity squeeze. In addition, the fall in the value of United States dollar directly translates into a fall in the value of Bangladesh Bank’s reserves as a large part of the country’s foreign exchange holdings is dollar denominated. It is necessary to recognize that the current infl ationary scenario in Bangladesh is not unique. A signifi cant number of Asia’s developing countries are struggling to come to grips with rising infl ation. Th eoretically, the contradictions and solutions for countries such as Bangladesh are not hard to see but the gap between theory and practice is signifi cant.
Mustafa K. Mujeri

38
12 For example, Bangladesh Bank took steps for fulfi lling the Basel II norms of capital adequacy in a time bound manner. For details, see Bangladesh Bank (2008); Mujeri and Shahiduzzaman (2008).
Vulnerability and competitiveness One of the key aspects of economic policy of Bangladesh is to focus on accelerating growth-promoting structural reforms to reduce vulnerability and enhance competitiveness. Such reform priorities cover several areas, such as tax policy and administration, public fi nancial management, monetary and exchange operations, fi nancial sector, and the trade and investment regime. Th ese reforms are critical to bolster growth and reduce external vulnerability. Th ese are also fundamental to containing balance of payments pressure which would arise from import-intensive investments necessary to tackle power, transport, and other infrastructure bottlenecks in the short and medium terms. On the external front, despite impressive gains over the past decade, total exports were only 21 per cent of GDP in FY 2010-2011. Moreover, the exports remain highly concentrated, both in terms of products and destinations, which carries some risk. At present, although Bangladesh’s susceptibility to a global downturn appears limited, its reserve adequacy is low by most measures, which makes it increasingly vulnerable to external shocks (IMF, 2011a). Th is suggests signifi cant fi nancing and adjustment needs to reduce vulnerability. In addition, Bangladesh needs to assess the equilibrium levels of its current account and its currency appropriately to keep the real eff ective exchange rate and the current account balance in line with macroeconomic fundamentals.
Financial sector resilience For managing credit and liquidity risks in the fi nancial market and promoting healthy competition and effi cient performance, the Bangladesh Bank has been providing prudential guidelines and implementing reforms for ensuring proper fi nancial regulation and supervision in a regular manner.12 As a result, Bangladesh’s fi nancial sector remains largely immune to the global fi nancial sector turmoil. Moreover, capital controls in Bangladesh largely insulate the domestic economy from the risk of transmission of fi nancial crisis from abroad. Th e country’s fi nancial risks also remain low due
Bangladesh

39
13 Bangladesh’s fi nancial institutions are not exposed to complex fi nancial derivatives and synthetic securitization instruments. Th e banking system is mostly separated from international fi nancial markets, and does not have sophisticated fi nancial products. As such, the banking sector remained free from toxic derivatives and the off -balance sheet items comprised mostly basic swap contracts with no risk of sustain-ing unexpected losses. Moreover, with low level of external debt (about 30 per cent of GDP and consisting mostly of concessional loans from multilateral fi nancial institutions), strong foreign reserves, and low FDI, Bangladesh is not likely to face any perceptible asset quality problem and credit crunch in the event of any future external shocks. 14 Although economic recovery was achieved fairly quickly aft er the Asian economic crisis of 1997-98, labour markets in diff erent aff ected countries responded with a lag. Similarly, countries (for example Indonesia, Th ailand) took time to put their economies back to pre-crisis poverty reduction path. See Islam (2010); Reinhart and Rogoff (2009).
to relatively strong macroeconomic fundamentals, a good health of the fi nancial sector, and its limited exposure to foreign capital markets.13
In fact, the low level of global integration somewhat shielded the Bangladeshi economy from the global fi nancial crisis. In particular, the insulation of the country’s capital market and limited role of foreign portfolio investment, supported by relatively strong macroeconomic fundamentals and strengthened policy and management frameworks, ensured that the economy would be resilient to the global fi nancial crisis and resulting economic recession. Th e Bangladeshi experience points to the importance of prudent government intervention and careful regulation within the market determined incentive structures to avoid systemic distress caused by moral hazard and adverse selection in the pursuit of free fi nancial sector nostrums. Th e need is to ensure a liberalized, market-based, and eff ectively supervised and regulated fi nancial sector in Bangladesh. An important agenda for the purpose is to plug the gaps in regulatory and supervisory infrastructures and strengthen its regulatory regime in a comprehensive manner.
Creating the framework for a basic social fl oor Th e experience of Bangladesh shows that, while relatively strong and stable macroeconomic fundamentals are essential for facing challenges posed by an economic crisis, they are not adequate to address the adverse impacts on poverty, income distribution, and labour market of lower economic growth. Th e preparedness of an economy to address the adverse social eff ects of an economic crisis is also important. Th e lessons from Bangladesh demonstrate that the impact of a downturn is transmitted to livelihoods and living conditions, especially those of the poor, fairly quickly, while the benefi cial eff ects of recoveries take time to trickle down.14
Mustafa K. Mujeri

40
In addition, the impact of economic downturns usually falls disproportionately on the poor, not only in terms of economic distress and deterioration of poverty situations but also through the worsening of key social development indicators, such as school attendance of children and nutritional status of the household members, especially children and women (Ravallion, 2009). Hence, it is essential that these countries undertake measures directly aimed at preventing the deterioration of the living conditions of the weaker and vulnerable sections of society. At the macroeconomic level, such a basic social fl oor can also serve as a countercyclical policy response by providing a boost to aggregate demand, helping to maintain labour productivity, providing cushion in building human capital, and sustaining economic growth. In this context, the lessons from diff erent countries, including some in the developed world, indicate that the existence of automatic stabilizers in an economy can perform important roles during an economic downturn. Moreover, it becomes easier to support the poor when such instruments are already in operation in an economy. In such a situation, depending on the availability of fi scal space, it may be possible to strengthen such instruments, for instance by expanding the coverage and/or duration of unemployment benefi ts, or address social concerns through such programmes as employment guarantees, conditional cash transfers, and investments in rural infrastructure. A related issue is how to set goals if a country such as Bangladesh were to incorporate social dimensions more explicitly in response to an economic downturn. In this respect, the Social Protection Floor Initiative of the United Nations proposes the following major elements: Essential services - for example geographical and fi nancial access to essential services (such as water, sanitation, adequate nutrition, health and education, housing, and other services including life and asset saving information); and Essential social transfers - for example, social transfers (in cash and in kind) paid to the poor and vulnerable to provide a minimum income and health security. See ILO and WHO (2009). Th e International Labour Organization (ILO) defi nes the Basic Social Security Floor to include: (i) access to basic/essential health care benefi ts; (ii) income security for children at least at the poverty level through various family/child benefi ts; (iii) targeted income support to the poor and the unemployed in the active age group; and (iv) income security for the
Bangladesh

41
old and the disabled — at least at the poverty level — through pensions for old age, disability and survivors. While conceptually this can be part of a country’s social security architecture, in reality these may take the form of social assistance rather than social security benefi ts. In practice, it may be reasonable to assume that a country like Bangladesh would want to create a basic social fl oor below which the poor would not be allowed to fall. In such a fl oor, a few basic elements would be critical. First, automatic stabilizers such as unemployment benefi ts which could come into play in the event of an economic downturn causing increased unemployment. One mechanism would be to introduce special employment programmes, such as public works programmes. Second, introduce/strengthen severance pay and incentives for preserving jobs to minimize the adverse eff ects on the poor. Th ird, preserve and enhance investment in human development (especially in education and health) through various measures, for example conditional and universal cash transfers. Such instruments may be tailored to various goals that need to be pursued in a country (table 1.11). Th e policy instruments relevant for each of the above goals could include: (i) guaranteed employment programme with built-in unemployment benefi ts so that the programme can serve the purpose of an automatic stabilizer during economic downturns; (ii) measures to encourage job preservation; and (iii) investment in infrastructure, especially where labour based approaches can be applied. Introduction of severance pay would help mitigate the adverse eff ects on retrenched workers. For enhancing the employability of retrenched workers, the relevant instrument would be active labour market policies (that would include measures of retraining and redeployment). Relevant instruments for protecting investment in human capital would include programmes in the areas of health and education (for example, conditional and unconditional cash transfers and other targeted programmes).
Mustafa K. Mujeri

42
Table 1.11. Goals and instruments for addressing the social impact of economic downturns
Source: Adapted from Islam (2010).
In view of the limited fi scal space available to the Government in most low income countries like Bangladesh, one important concern is to meet the budgetary needs for implementing the package. It is important therefore to look at options for enhancing the fi scal and policy space needed for implementing the package for which the countries could explore several alternatives such as (a) increasing the effi ciency of utilization of existing resources; (b) raising additional domestic resources; (c) ensuring more effi cient utilization of remittances received from migrant workers; and (d) promoting public private partnership especially in infrastructure and in undertaking active labour market policies.15
Goals Possible instruments
Minimise adverse eff ects on employment (i) Automatic stabiliser in the form of unemployment benefi ts (e.g. schemes for guaranteed employment).
(ii) Incentives for job preservation.
(iii)Investment and adoption ofl abour based approaches in infrastructure.
Mitigate adverse eff ects of economic downturn on retrenched workers
Introduce severance pay
Enhance employability and redeployment of retrenched workers
Introduce active labour market policies
Protect investment in human capital Strengthen conditional and unconditional cash transfers with particular focus on education and skill training
15 In Bangladesh, the total cost of a package consisting of (i) a guaranteed employment programme with universal coverage of all poor households generating employment for 3.3 million persons per day and a built-in unemployment benefi t; (ii) scheme for subsidizing job preservation through work sharing; (iii) scheme for introducing active labour market policies including retraining and redeployment; and (iv) provision for an increase in public investment in infrastructure especially focusing on labour based ap-proaches and linked with the proposed guaranteed employment programme has been estimated at around Tk. 187 billion per year at 2009-2010 prices which is 2.6 per cent of the country’s GDP. However, if the proposed package is dovetailed into the existing programmes, then the incremental cost would be reduced to around 45 per cent of the above amount. For details, see Islam and others (2011).
Bangladesh

43
Th e lessons from Bangladesh points out that strong macroeconomic fundamentals alone are not adequate from the point of view of social dimensions of development. Th e macroeconomic strength may remain disconnected from the performance with regard to social dimensions like employment and poverty during a period of global fi nancial crisis. Th is suggests that greater attention to social dimensions is necessary for developing a post-crisis agenda for low income countries in order to ensure development with a social face and for strengthening capacity to respond to possible economic crisis in future. In this context, a package of employment and labour market programmes within the framework of a basic social fl oor may serve useful purposes for which it is not too diffi cult to create the necessary fi scal space even when using the country’s own resources if the country is prepared to make a serious eff ort to attain its revenue potential. While having appropriate policies are important, strong institutional capacity is required to implement the policies effi ciently and eff ectively. In addition, several counter measures may be considered for mitigating the adverse impact of fi nancial crisis. First, apart from increasing internal demand for stimulating growth, more inputs to livelihood protection especially for the poor and the disadvantaged households are necessary. For example, economic stimulus packages may be rolled out emphasising the eff orts to protect people’s livelihoods by directing support to diff erent areas such as education, health, housing, infrastructure, ecological protection, environmental remediation, and rural development. Second, adjustment in a macro-policy framework may be introduced such as tax rationalization, fi nancial market adjustments, price stabilization, and livelihood support to poor households. If necessary, subsidies may be raised for key public welfare sectors and communities in distress. Th ird, a proactive employment policy may be adopted especially by providing support to small and medium enterprises and service sectors. Th e Government may need to play the role of the driver of employment generation by raising public investment and giving incentives for self-employment and business start-up initiatives. For the purpose, the Government may expand occupational training opportunities for laid-off workers and rural workers, and provide job assistance for groups in diffi culties of employment and zero-employment families. Fourth, public services and social protection measures may be strengthened and expanded in order to support the provision of basic needs to the vulnerable households.
Mustafa K. Mujeri

44
Finally, more inputs should be given for poverty reduction along with strengthened implementation of village-based development and integrated approaches for poor areas. Th e obvious need would be to follow proactive fi scal and appropriate fi nancial policies, intensifi ed institutional reform, provide support for small and medium enterprises, improve social security system, increase support for low income households, and enhance implementation of poverty reduction policies. However, in view of the fact that the safety net coverage usually remains quite limited relative to the size of the total poor population in most low income countries like Bangladesh, the traditional programmes to specifi cally target the crisis-aff ected households may not be adequate, especially for those who might be better placed than the structurally poor households in terms of their endowments and access to economic opportunities. However, as the impacts of a crisis take hold, there may be a good case for extending or deepening certain types of existing programmes (for example public works programmes) in specifi c areas, regions, or sectors. Extending coverage among the urban poor, for instance, may address an important need given that the urban poor is likely to be one of key aff ected groups and the coverage of existing safety net programmes usually remains extremely low in urban areas.
Interface between fi scal and monetary policy Obviously, in a country like Bangladesh, both fi scal and monetary policy are essential components of overall macroeconomic policy and thus share the country’s common goals like a reasonable degree of macroeconomic stability, high economic growth, and rapid poverty reduction. All these objectives may not always be in harmony. A key challenge for policymakers is to ensure appropriate coordination of fi scal and monetary policy such that the policy focus remains relevant. In practice, the interface of fi scal and monetary policy may be analysed in the context of public debt, especially in terms of the choice of alternative modes of fi nancing of fi scal defi cit, such as bond fi nancing and money fi nancing, leaving aside the issue of foreign fi nancing. As is well known, fi scal defi cit can be fi nanced either through bond issuance or money creation. While bond fi nancing entails placement of government debt in
Bangladesh

45
fi nancial markets, either in domestic or foreign markets or both, money fi nancing involves changes in the monetary base due to changes in net central bank credit to Government. Furthermore, such fi nancing of the fi scal defi cit may be at market determined rates or at concessional rates, may be voluntary or non-voluntary, or may have other characteristics. Th e important issue is that each form of fi nancing fi scal defi cit has its specifi c consequences and hence implications for monetary policy. For example, the reliance on domestic credit has implications for credit availability for the private sector, interest rates, and the monetary base. On the other hand, reliance on foreign borrowing has implications for the management of the external sector. Non-voluntary fi nancing may crowd out the private sector. Th is shows that, in addition to the degree of monetization of fi scal defi cit, important concerns for fi scal-monetary policy interface cover issues relating to determining the desired fi nancing mix of fi scal defi cit that ensures macroeconomic stability. In this context, it is important to recognize that there exist many other channels of liquidity creation, other than monetization of government defi cit, such as expanding net foreign assets, conducting open market operations, and adopting other monetary instruments. Th ere are several channels which link the fi scal and fi nancial sectors in Bangladesh. Th ese include, for instance, the Government’s borrowing programme; guarantees extended by the Government; and the Government’s investment in the fi nancial sector. Of these, the borrowing programme of the Government is relatively large, both in gross and net terms. Th e banking sector holds majority of the outstanding stock of government securities. In addition, the scope of money fi nancing of defi cit vis-à-vis bond fi nancing also needs to be considered in assessing fi scal-fi nancial linkage. At the policy level, three important constraints on the operational autonomy need action in Bangladesh. First, continued fi scal dominance, including large temporary mismatches between receipts and expenditures of the Government warranting large involuntary fi nancing of credit needs of the Government by the Bangladesh Bank. Second, the dominance of State-owned fi nancial institutions and non-fi nancial public enterprises, which blurs the demarcation between funding of and funding by the Government vis-à-vis the public sector as a whole. Th ird, the relatively underdeveloped state of the fi nancial markets, which blunts the eff ectiveness of monetary policy.
Mustafa K. Mujeri

46
Bangladesh also needs to eff ectively face the “open economy trilemma” of trade-off s among open international fl ows of capital, eff ective monetary policy, and stable exchange rate. Under the present circumstances, fi scal empowerment appears to be essential for obvious reasons. Although the existing level of fi scal defi cit may be considered manageable, the space available for meeting unforeseen circumstances appears rather limited. More specifi cally, the nature of fi scal dominance does constrain the eff ectiveness of monetary policy to meet unforeseen contingencies, maintain price stability, and contain infl ation expectations. It also needs to be recognized that there is no ideal level of fi scal defi cit, and the critical factors are: How is it fi nanced and what is it used for? Th e fact, however, is that the fi scal policy determines the size of the debt and government debt provides the most critical link with monetary policy. On the other hand, the composition of debt is determined by the debt management policy. Th e monetary impact depends on who holds the debt and how the holding changes with policy and the consequent impact on aggregate demand. In a country like Bangladesh, the basic objective of interface of fi scal and monetary policy should be to achieve a balance between total social demand and supply for ensuring movement toward the common goals of social development. Th is requires not only aggregate balance of supply and demand, but also balance in the structure of supply and demand. Eff ective coordination of fi scal and monetary policy has a strong ability to regulate both the volume and the structure of supply and demand in the economy. In general, the focus of monetary policy adjustment is on aggregate balance while the focus of fi scal policy coordination is on the structure, so that the two need to complement each other in order to achieve a basic balance between total social demand and supply objectives. Coordination of the two policies should be conducive to development, measured not just by how fast output growth is achieved but, more importantly, by expansion of productive capacity, rise in economic effi ciency, and success in promoting balanced economic structure. In view of the complex nature of the interface, the coordination between fi scal and monetary policy has several dimensions. At the macro level, the issue is whether the specifi c fi scal-monetary policy mix, such as the level of the fi scal defi cit, the pattern of fi nancing, or the extent of monetization, is with the macroeconomic objectives being pursued. Similarly,
Bangladesh
47
it would be necessary to ensure that the operating procedures of fi scal and monetary authorities, including debt and cash management, are consistent and mutually reinforcing. While both fi scal and monetary policies need to support each other, it is also important to maintain their relative independence, especially to strengthen their regulatory eff ect. In general, monetary policy adjustment takes longer period and the adjustment process of fi scal policy is relatively short. Th e aim of policy adjustment should be to take full advantage of both sets of policies taking into account the health of the economy and the characteristics of specifi c macroeconomic situation.
Concluding remarks Although fl uctuations in economic activities are normal in market-based economies, the frequency and severity of such fl uctuations have increased in recent decades. It is important to identify the potential challenges and eff ective responses based on lessons learned from past experiences in order to adopt counter-cyclical measures to deal with economic downturns and bring the economy back to the path of sustained economic growth. Th is is especially relevant for Bangladesh since it belongs to the high exposure countries, and its fi scal capacity is limited to withstand the shocks of adverse external events. Bangladesh cannot be complacent and treat such experiences as a short-term aberration in its pursuit of market-based development paradigm. In this context, it is important to strengthen the country’s preparedness for undertaking counter-cyclical policies in response to such crisis and create necessary fi scal space and institutional capacity to face such events in future. Th e analysis of social impacts of global crisis in Bangladesh reveals that the global fi nancial crisis can adversely aff ect a country’s progress toward achieving poverty reduction and social development goals including the Millennium Development Goals. Th is highlights the need to re-launch more determined eff orts in achieving the stipulated goals. Th us the countries like Bangladesh face diffi cult and complex challenges. In these countries, along with providing stimuli to growth, the Governments must also make eff orts to strengthen safety nets and ensure that poverty reduction and key social development gains are not reversed. In such eff orts, while the Government is the key actor, a shared paradigm is necessary in which global and regional
Mustafa K. Mujeri
48
partnerships could foster technology diff usion and capacity building for inclusive and sustainable growth. Th is is the time for the developed countries to keep their commitments to share required resources for achieving the Millennium Development Goals from which the developed countries have as much to gain as the developing countries like Bangladesh.
Bangladesh

49
Chapter 2
ChinaYide Qiao
Th e objective of this chapter is to describe the impacts of the global fi nancial crisis on the Chinese economy and the country’s policy responses. Particular attention is paid to China’s unique growth characteristics and the challenges it faces aft er the crisis. Th e following sections provide background information on the characteristics of the economic growth pattern in China, investigate the impacts of the global fi nancial crisis on China, describe the Chinese policy response to the crisis, and analyse the challenges facing China in its transformation of growth patterns and economic structural adjustment.
Th e characteristics of economic growth in China Th e nature of the Chinese economy can be summarized as having two distinct features: developing and transitional. “Developing” refers to the fact that the country was poor when it started to implement reforms and open up its economy in 1978, and it is still not rich today despite being listed as the second largest economy in the world. Its gross domestic product (GDP) per capita is US$ 4,400, which is defi ned as upper-middle income by the World Bank. “Transitional” means that China has been, and still is, in the transitional stage of moving from a central planning economy to a market based one. Th e Government of China still owns hundreds of large companies in important industries, such as energy, telecommunication, mining and the like, while private businesses are playing an increasingly important role in terms of providing employment and tax revenue, and in contributing to economic growth. Some industries such as fi nance have been strictly regulated. Furthermore, the Government of China continues to play an important role in mobilizing and allocating resources to the areas it considers important.

50
An export oriented strategy has been adopted since the end of 1970s, following the same steps of “four small dragons” (Hong Kong, China; the Republic of Korea; Singapore; and Taiwan Province of China). It was based on utilizing the country’s large pool of low-cost and relatively educated labourers to create increasing capacity to meet the needs of the developed nations and the rest of the world. Th e country’s comparative advantage in labour-intensive products contributed to making exports the driving force of economic growth. Figure 2.1 shows that the ratio of the country’s exports to GDP increased since the early 1990s and that the increase was more rapid aft er 2001, when China entered the World Trade Organization (WTO) and its exports grew at more than 30 per cent per year. China overtook Germany as the largest exporter in the world in 2010, and its exports reached US$ 3.6 trillion in 2011. Th e fast growth in exports was accompanied by a change in the trade structure. Manufactured goods increased their share in total exports to 95 per cent in 2011 (fi gure 2.2).
Figure 2.1. Exports, as a percentage of GDP
0
5
10
15
20
25
30
35
40
1991 1993 1995 1997 1999 2001 2003 2005 2007 2009 2011
Per cent
Source: General Administration of Customs, obtained from CEIC Data Company Limited. Available from http://ceicdata.com.
China

51
Th e importance of exports to the economy is refl ected not only in its direct contribution to the GDP but also in an associated expansion of investment, which also contributes to increasing the GDP. Th at is the reason why China’s growth pattern is regarded as export-oriented, even when exports are not very high as a share of the GDP.
Figure 2.2. Share of manufactured and primary goods in total exports
Figure 2.3 shows the shares of investment and consumption in the GDP. Th e share of investment increased steadily to 48.6 per cent in 2010, while the share of total and household consumption decreased, respectively, to 47.4 per cent and 33.8 per cent of the GDP in 2010, which are very low even compared to other developing nations. Th ere are several reasons for this phenomenon. First, foreign demand leads to expansion of domestic capacity which requires investment in manufacturing and infrastructure. Second, as employment increases in manufacturing, rising family incomes push up domestic demand, which generate needs for more investment. Th ird, the savings rate in China of around 50 per cent of the GDP, one of the highest in the world, provides suffi cient funding for investment. And fi nally, the strong
0%
10%
20%
30%
40%
50%
60%
70%
80%
90%
100%
1991 1993 1995 1997 1999 2001 2003 2005 2007 2009 2011
Per cent
Export of manufactured goods/total export Export of primary goods/total export
Source: General Administration of Customs, obtained from CEIC Data Company Limited. Available from http://ceicdata.com.
Yide Qiao

52
administrative strength of the Government of China helped the country implement investment projects, particularly in the aft ermath of the global fi nancial crisis, even though heavy government intervention is not always benefi cial to the economy. It is not surprising that with a high savings rate and a low level of income the share of consumption went down steadily from more than 60 per cent in early 1990s to less than 50 per cent now. Th is does not mean that consumption has not increased. On the contrary, it did grow rapidly. Th e total retail sales of consumer goods – an indicator closely related to consumption – has grown around 15 per cent every year for many years. But as investment grew much faster than consumption, the share of consumption in the GDP shrank over time.
Figure 2.3. Share of investment and consumption in GDP
As we discuss below, the export-investment driven pattern of economic growth in China is related with the dimension and the size of negative impacts of the global fi nancial crisis.
30
35
40
45
50
55
60
65
1991 1993 1995 1997 1999 2001 2003 2005 2007 2009 2011
Per cent
Investment
Total consumption
Household Consumption
Source: National Bureau of Statistics, obtained from CEIC Data Company Limited. Available from http://ceicdata.com.
China

53
Th e impacts of the global fi nancial crisis At the fi rst stage of crisis starting from the collapse of the Lehman Brothers, fi nancial institutions in the developed nations were busy repairing their balance sheets resulting in an ensuing credit crunch and a slowdown in capital formation which in turn led to a stagnation of the advanced economies. With quantitative easing (QE) policies undertaken twice by the Federal Reserve in the United States, the developed economies were struggling to recover until the middle of 2011 when the euro sovereign debt crisis broke out in an unprecedented way. Th e second stage of the economic turmoil has shadowed the prospect of the recovery in these countries and the growth of other nations. Th e evolution of the crisis brought three waves of external shocks to the developing countries including China. A description of them will be detailed below.
Th e fi rst wave of shocks At the beginning of the crisis, observers and economists in China were primarily interested in the potential losses of Chinese investments in foreign fi nancial institutions and on the degree to which Chinese fi nancial institutions would be aff ected. But such losses were modest because Chinese investment and business abroad were still small, and domestic fi nancial institutions were not aff ected much because of the relatively closed nature of China’s fi nancial markets. However, the sudden drop in the number of orders received by Chinese exporters immediately aft er the debacle of Lehman Brothers made it clear that the Chinese economy would slow down. Table 2.1 shows that the growth rates of imports and exports became negative since October 2008. With foreign trade down, it was inevitable for economic growth to start declining. Th e GDP in the fi rst half of 2008 still grew robustly at 12 per cent, but growth went down to 9.6 per cent in the fourth quarter of that year and to 6.6 per cent in the fi rst quarter of 2009 (fi gure 2.4). As a result, employment was aff ected. Unemployment rates went up mostly among migrant workers from the countryside to the cities, but the unemployment rate among registered city residents changed little. According to statistics issued by the Ministry of Human Resources and Social Security, around 20 million migrant workers in the cities lost their jobs and went back
Yide Qiao

54
home in the countryside during the winter of 2008 and the spring of 2009. Th e ratio of jobs provided to the ones demanded declined from 0.98 in 2007 to 0.85 in the fourth quarter of 2008. Th us more people were looking for fewer jobs available at that time, a situation that policymakers were obviously concerned about.
Table 2.1. Growth rates of imports and exports, September 2008 to December 2009
Percentage change, year-on-year
Percentage change on previous month
Imports Exports Imports ExportsSep-08 20.9 21.3 0.8 1.2Oct-08 15.4 19.1 -13.1 -5.9Nov-08 -18.0 -2.2 -19.5 -10.4Dec-08 -21.3 -2.8 -3.6 -3.3Jan-09 -43.1 -17.5 -28.9 -18.6Feb-09 -23.8 -25.7 17.0 -28.3Mar-09 -24.9 -17.1 19.4 39.1Apr-09 -22.8 -22.6 9.9 1.8May-09 -24.8 -26.3 -4.4 -3.5Jun-09 -13.0 -21.4 15.7 7.6Jul-09 -14.9 -22.9 8.7 10.4Aug-09 -17.1 -23.1 -7.2 -1.6Sep-09 -3.8 -15.0 17.1 11.8Oct-09 -6.8 -13.7 -15.8 -4.5Nov-09 26.3 -1.2 9.0 2.6Dec-09 55.6 17.6 18.8 15.0
Source: General Administration of Customs, obtained from CEIC Data Company Limited. Available from http://ceicdata.com.
China

55
Yide Qiao
Figure 2.4. GDP growth
Th e second wave of shocks Figure 2.5 describes the timeline of QE1 and QE2 taken by the Federal Reserve to cope with the credit crunch and recession during the global fi nancial crisis. Th e Federal Reserve injected US$ 1 trillion of liquidity into the market through QE1, 3 months aft er the fall of Lehman Brothers, while a total amount of US$ 600 billion has been pumped into the market through QE2. Th ese two policy actions of the Federal Reserve, particularly the latter, resulted in huge spillovers to other nations through rising commodity prices and fl ows of hot money, which created high infl ationary pressures on the Chinese economy. Indeed, China’s infl ation rate steadily went up from around 3 per cent at the beginning of 2010 to 6.5 per cent in July of 2011, as seen in fi gure 2.6.
Figure 2.5. Timeline of QE1 and QE2
Source: Bankrate.com
0
2
4
6
8
10
12
Q1 Q2 Q3 Q4 Q1 Q2 Q3 Q4 Q1 Q2 Q3 Q4 Q1 Q2 Q3 Q4 Q1 Q2 Q3 Q4 2008 2009 2010 2011 2012
Per cent
Source: National Bureau of Statistics, obtained from CEIC Data Company Limited. Available from http://ceicdata.com.
2008 Financial crisisSeptember/October 2008
End of QE1March 31, 2010
QE1Nov. 25, 2008 - March 31, 2010
QE2Nov. 3, 2010 - June 30, 2011
End of QE2June 30, 2011

56
Th e third wave of shocks Th e downgrade of the credit rating of the United States sovereign debt, mainly due to a political deadlock, and the worsening of the euro sovereign debt crisis in the middle of 2011 signalled the beginning of the second stage of global fi nancial crisis. With an anaemic economic recovery in the United States and much of the eurozone going into a recession, the world economy seemed like it was on a downward spiral. China was not spared from this trend. Its GDP growth rate was 9.4 per cent in the third quarter of 2011, the lowest since the fi rst quarter of 2010. Th e growth rate of China’s exports also slowed down. Th e country’s trade surplus decreased 16 per cent in June-October 2011 compared to the same period in 2010. Th e cooling of the economy was also refl ected in a declining infl ation rate (fi gure 2.6).
Figure 2.6. Infl ation rate, January 2008 to December 2012
Source: National Bureau of Statistics, obtained from CEIC Data Company Limited. Available from http://ceicdata.com.
-2
0
2
4
6
8
Jan -08 Jul -08 Jan -09 Jul -09 Jan -10 Jul -10 Jan -11 Jul -11 Jan -12 Jul -12
Perc ent
China

57
Yide Qiao
Th e pattern of foreign trade changed during the global fi nancial crisis. China’s foreign trade can be divided into general trade, processing trade and others. General trade grew faster than processing trade during the global fi nancial crisis (fi gure 2.7). However, the trade surplus from processing trade steadily increased from US$ 221.7 billion in 2007 to US$ 351.6 billion in 2011 while the trade surplus from general trade declined from its peak in 2007 to a negative level in 2009 (fi gure 2.8). Th e trade balance of the other categories has been in defi cit. Th erefore, China’s trade surplus comes exclusively from processing trade. Th e reason for this phenomenon is that China needs to import large quantities of commodities annually, the prices of which increased steeply since 2009. In other words, the terms of trade in China has been worsening in recent years.
Figure 2.7. General trade versus feed processing trade
Source: Macroeconomic Information Network.
0
400
800
1,200
1,600
2,000
1995 1997 1999 2001 2003 2005 2007 2009 2011
Billions of US$
General trade
Feed processing

58
Figure 2.8. Th e pattern of the trade balance
Source: Macroeconomic Information Network.
Th e policy response of the Government of China China’s mechanisms and processes of decision making on economic aff airs played an important role in shaping the policies to deal with the impacts of the global fi nancial crisis. At the end of every year, the Central Committee of the Communist Party organizes an economic working meeting to decide a general position or main theme of economic policies for the next year. Th e Central Committee usually sends several teams to the provinces and lower administrative units to investigate specifi c issues it considers important. Sometimes the members of the Political Bureau themselves might head these teams. For example, Premier Wen Jiabao went to Wenzhou, Zhejiang Province in October 2011 to do a fi eld investigation on the diffi culties of small and private companies to fi nance their activities. Following fi eld investigations such as this, a team is usually assembled to prepare a draft policy proposal, which is subsequently sent to provincial governments for comments and suggestions. Two or three of the most senior offi cials from each province attend the economic working meetings of the Central Committee, and they
-100
0
100
200
300
400
1995 1997 1999 2001 2003 2005 2007 2009 2011
Billions of US$
General trade
Feed processing trade
China

59
Yide Qiao
subsequently deliver any decisions made to subordinate economic working meetings at the provincial level. Th us the policy decisions of the central Government can be carried out by Governments at diff erent levels. Table 2.2 summarizes the main information on the economic working meetings between 2008 and 2011. Th e outcomes of these meetings result in well-defi ned and carefully worded general positions of macroeconomic policy for the following year, which provide a solid guidance to maintain or change the policy direction as the national leaders expect. Oft en a minor change in the wording might signal a turning point in the policy direction. To relieve the negative eff ects brought by the fi rst wave of shocks of the global fi nancial crisis, the Government of China announced the famous 4 trillion yuan renminbi (RMB) stimulus package of October 2008. Th e central Government provided RMB 1.1 trillion from its own coff er while the provincial and local governments chipped in the rest. It was estimated that the total amount eventually reached RMB 10 trillion, including fi scal spending and borrowing from banks. A substantial part of the package consisted in investments in infrastructural projects, such as highway, high speed railways and electricity plants. Some of these projects were newly set up, while others were previously planned but not implemented yet. Th ese projects were the main contents of the “proactive fi scal policy” defi ned at the economic working meeting of the Central Committee of the Communist Party in 2008. A “moderately easy monetary policy” was also announced to combat the global fi nancial crisis. It consisted of fi ve consecutive cuts by the People’s Bank of China of the basic interest rate (one year lending rate) between September and December of 2008 and of a 200 basis points cut of the required reserve ratio (RRR) between June and December of 2008. Due to the swift action taken by the Government of China and the size of the stimulus package, China’s policy response to the crisis was successful in supporting economic activity. Th e growth rate of foreign trade from the third quarter of 2009 began to go up and has been back to pre-crisis patterns in 2010 and for most of 2011, bouncing from negative values in 2009 (fi gure 2.9). GDP growth experienced a “V” shaped recovery, bouncing back from 6.6 per cent in the fi rst quarter of 2009 to 11.9 per cent in the fi rst quarter of 2010 (fi gure 2.4).
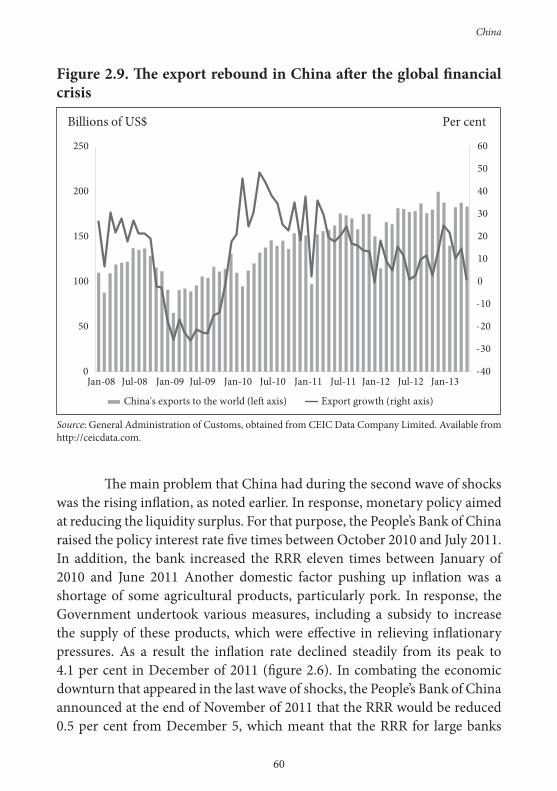
60
Figure 2.9. Th e export rebound in China aft er the global fi nancial crisis
Th e main problem that China had during the second wave of shocks was the rising infl ation, as noted earlier. In response, monetary policy aimed at reducing the liquidity surplus. For that purpose, the People’s Bank of China raised the policy interest rate fi ve times between October 2010 and July 2011. In addition, the bank increased the RRR eleven times between January of 2010 and June 2011 Another domestic factor pushing up infl ation was a shortage of some agricultural products, particularly pork. In response, the Government undertook various measures, including a subsidy to increase the supply of these products, which were eff ective in relieving infl ationary pressures. As a result the infl ation rate declined steadily from its peak to 4.1 per cent in December of 2011 (fi gure 2.6). In combating the economic downturn that appeared in the last wave of shocks, the People’s Bank of China announced at the end of November of 2011 that the RRR would be reduced 0.5 per cent from December 5, which meant that the RRR for large banks
-40
-30
-20
-10
0
10
20
30
40
50
60
0
50
100
150
200
250
Jan-08 Jul-08 Jan-09 Jul-09 Jan-10 Jul-10 Jan-11 Jul-11 Jan-12 Jul-12 Jan-13
Per cent Billions of US$
China's exports to the world (left axis)
Export growth (right axis)
Source: General Administration of Customs, obtained from CEIC Data Company Limited. Available from http://ceicdata.com.
China

61
Yide Qiao
will be 21 per cent while the corresponding rate for medium and small banks would be 17.5 per cent.
Th e challenge of transforming China’s economic growth pattern Th ere is general agreement that it is not easy for any policymaker to strike a good balance between dealing with current economic issues and making the necessary structural adjustments for the long run. While the Government of China managed to protect the economy from the impacts of the global fi nancial crisis, whether or not it has also made signifi cant progress in making structural adjustments is still unclear. More than a decade ago, the ruling party has advocated the necessity of making economic structural adjustments and transforming the growth pattern. Th e Twelft h Five-Year Plan that stared in 2011 emphasized the need “to make sure that new and outstanding progress achieved in scientifi c development and substantial progress obtained in the transformation of the model of economic development in the next fi ve years. It should insist that a strategic adjustment of economic structure become a main direction of accelerating transformation of the model of economic development… It is necessary to construct a long lasting mechanism to expand domestic demand and to promote transforming economic growth through more dependency on the coordination between consumption, investment and export.” (China, National Development and Reform Commission, 2011, p. 5). While some progress has been made in this regard, there are still a lot of challenges ahead left to be met. Particularly in 2011, the weakening of the overseas market due to the global fi nancial crisis dragging on and the rising labour costs have pushed Governments at all levels and the business community to turn their attention inward and to tap the potential of the domestic market. In fact, according to the Minister of National Development and Reform Commission, the contribution of domestic demand to economic growth reached 101 per cent in the fi rst three quarters in 2011 (Zhang, 2011). In particular, the contribution of the fi nal consumption to growth increased from 32.7 per cent to 47.9 per cent between the fi rst three quarters of 2010 and the fi rst three quarters of 2011, while the contribution of capital formation declined from 55.5 per cent to 53.4 per cent during the same period. On the other hand, the current account to GDP ratio declined from its peak of 9.7 per cent in 2007 to 3.9 per cent in 2010 and 1.8 per cent in 2011 (see fi gure

62
2.10). A caveat is that it is not clear whether these changes represent a turning point for future trends because they could also be explained by the reduction of foreign demand and worsening terms of trade.
Figure 2.10. Current account balance, 2001-2012
Challenge 1: reduce the Governments’ intervention in the economy Th e strength of the Government of China is a double-edged sword. While it can mobilize enough resources quickly to solve pressing issues as seen during this crisis, it can also crowd out private investments and ruin social activity and creative initiatives. Local governmental offi cials have strong motivation to channel investments for the sake of their promotion in the future, which could provide a platform for corruption, rent seeking and lower effi ciency. For example, during the global fi nancial crisis, local governments took advantage of the stimulus programmes to increase expenditures, particularly in construction projects, which resulted in large increases in
0
2
4
6
8
10
12
0
50
100
150
200
250
300
350
400
450
2001 2002 2003 2004 2005 2006 2007 2008 2009 2010 2011 2012
Percentage of GDP Billions of US$
Current account balance (left axis) Current account balance/GDP (right axis)
Source: State Administration of Foreign Exchange and National Bureau of Statistics, obtained from CEIC Data Company Limited. Available from http://ceicdata.com.
China

63
Yide Qiao
their levels of indebtedness. Th e total debt of local governments reached RMB 10.7 trillion by the end of 2010, and led to a rise in non-performing loans (China, National Audit Offi ce, 2011). Th e high level of expenditures of local governments is also a major reason why the ratio of investment/GDP has been so high. A related problem is the lack of transparency and overseeing of governmental spending, which is a major reason why people are dissatisfi ed with the functioning of Government, even if their living standards have been rising. Overall, there is still a long way to go to fulfi l the objective of transforming the Government’s focus from construction to the provision of services to the public.
Challenge 2: narrow the widening gap between the rich and the poor According to offi cial data by the National Bureau of Statistics, China’s Gini coeffi cient stood at 0.474 in 2012, showing a relatively large gap in income distribution.16 Th e increasing income gap is mainly due to the growing disparities between residents in the cities and in the countryside. Offi cial statistics show that the income gap between them was 3.33:1 in 2009, which would have been bigger if the calculation had taken into account diff erences in wealth. Narrowing the income gap is needed both for increasing social justice and for transformation the growth pattern. It is well known that the marginal propensity of consumption of the poor is higher than that of the rich. Th us, raising the income levels of the poor is an eff ective way to increase domestic consumption. Another reason for the high saving rate in China is the absence of a comprehensive social protection mechanism, which would make it imperative for families to save for their children’ education, the family’s medical care, or for retirement. To reduce these precautionary motives for saving, the Government of China should take measures to raise the income levels of ordinary people and the coverage of social benefi ts. To support income levels, 24 out of 31 provincial governments increased the minimum wage, with an average growth rate of 22 per cent in 2011. Another way to increase real incomes is through the tax system. Currently, most of China’s tax revenues come from indirect taxes, such as
16 Yang Lina, “Gini coeffi cient release highlights China's resolve to bridge wealth gap”, Xinhuanet, 21 January 2013. Available from http://news.xinhuanet.com/english/china/2013-01/21/c_132116852.htm.

64
turnover business taxes, which are regressive. If more tax revenues come from direct taxes such as corporate income taxes and taxes on natural resources, the incomes of ordinary people actually will be raised. As for individual income taxes, the deduction level was raised from RMB 2,000 to RMB 3,500 per month since September 2011. However, this applied only for salaries and there is still room to adopt the same policy for other incomes. According to the 2010 census almost 50 per cent of the population lives in cities. But not all urban dwellers enjoy the same level of social benefi ts. Urban dwellers are divided into residents with population registration and migrant workers from the countryside without registration. Migrant workers cannot get the same benefi ts as city residents. For example, they can only obtain limited or no retirement benefi ts, and their children are not allowed to take an entry exam for college in the cities they are working. Indeed, the barriers to get a population registration in the cities, particularly in the large ones, are practically insurmountable. It is a great challenge for the Government of China to pave the way to let his 220 million migrant workers totally integrate into the cities (China, National Committee of Population and Family Planning, 2011). Diff erences in wealth between farmers and urban residents are very large because of diff erences in land prices, which allow the Government to benefi t substantially. When a piece of land is to be used for construction, the Government has the right to buy it at a very low price by law, and subsequently it can sell it to a developer at market price, which is usually much higher. Th is situation has created many disputes with farmers living in city suburbs, whose land can be bought by the Government at low prices. To reduce these confl icts the Government of China has considered revising the laws to let farmers share part of benefi ts from the land sale.
Challenge 3: increase Government expenditure in people’s livelihoods Improving the structure of government spending and tilting it to improve people’s livelihoods is another area where the Government should take policy actions in order to complete the transformation of the growth pattern. Th e Government of China has already increased its spending in education, medical care and social security, but the increase has not been big enough and fast enough. For example, the education law formulated more than a decade ago stipulated that 4 per cent of GDP has to be spent
China
65
Yide Qiao
towards education each year, but unfortunately this goal was never attained. Th e reform on health and medical care started several years ago and made some progress to provide a minimum medical insurance to farmers, but the coverage and the subsidy are very limited. Although about 97 per cent of farmers are covered, the subsidy per person was only RMB 240 in 2012 (Chen, 2012).
Challenge 4: speed up the reform of fi nancial system Another major challenge China is facing today in transforming its growth pattern is to speed up the reform of its fi nancial system. Generally speaking, the fi nancial system in China is still rigid and less than effi cient in transforming savings into eff ective investments. Indirect fi nancing still occupies a higher share of total fi nancing than direct fi nancing, which means that banks dominate the fi nancial industry. Th e Government of China is the largest shareholder and, therefore, controls almost all of the large commercial banks listed in domestic and international stock markets. Although it is not always easy for small and medium enterprises (SMEs) everywhere to get a loan from a bank, the dominance of Government-controlled large banks in the banking industry has aggravated the diffi culties for SMEs in China. On the contrary, State-owned enterprises (SOEs) can easily get loans at low interest rates due to their fi nancial strength and political power. During the period of credit tightening in 2011, these SOEs borrowed money at low rates, and then made loans to SMEs at higher rates. Improvements in Chinese capital markets are very much needed. Th e bond market is less developed because the issuance of corporate bonds is strictly regulated, while no municipal bonds exist at all. Companies have to wait for a long periods of time, oft en years, to be approved from regulators to conduct an initial public off ering. However, like in the case of getting a bank loan, SOEs can get approval relatively easily. In addition, the fi nancing function of stock market is overemphasized compared to the interests of investors. Law violations such as frauds, cheatings and inside trading have occurred occasionally, hurting the reputation of the market and its performance. Th e performance of the Chinese stock market in 2011 was the second worse in the world (Index of Shanghai Stock Exchange – 21.68 per cent, Index of Shenzhen Stock Exchange – 28.41 per cent), although the Chinese economy has outpaced the rest of the world. With the new Chairman of the Security
66
Regulatory Commission, a respected banker, in place a while ago, it is hoped that the security market will be on a healthy road ahead. Since China began to reform its foreign exchange rate mechanism to take a managed fl oating system in July of 2005, the RMB has appreciated steadily. In its Report to Congress, the United States Department of the Treasury concluded that “from June 2010, when China moved off of its peg against the dollar, through 16 December 2011, the RMB appreciated by a total of 7.5 per cent against the dollar. Because infl ation in China has been higher than in the United States, the RMB has appreciated more rapidly against the dollar on a real, infl ation-adjusted, basis reaching nearly 12 per cent since June 2010 and nearly 40 per cent since China fi rst initiated currency reform in 2005” (United States Department of the Treasury, 2011, p. 18). Th ough the United States Congress still strongly criticized China for undervaluing the RMB, nobody will realistically expect the Government of China to abandon its principles of “progressive, manoeuvrability and initiative”, particularly at a time when the ratio of current account surplus to the GDP is well below 4 per cent. It is fair to say that the motivation behind continuing the reform of the foreign exchange regime will come less from pressures from outside than from demands of economic transformation inside. Th e Government of China should intervene less in the foreign exchange market and expand the band of daily fl uctuations, which are currently 0.5 per cent of both sides from the middle line. Th at way the foreign exchange rate will more accurately refl ect the real value of the RMB compared to other currencies, and it will better balance the interests of the tradable and nontradable sectors of the economy. A more fl exible foreign exchange regime will also pave the way for further opening up the capital account of the balance of payments. All of these reforms are preconditions for completing the internationalization of the RMB, which in turn is a very important step for China to become a real power.
Concluding remarks Because China is an export-investment driven economy with relatively closed fi nancial markets, the global fi nancial crisis aff ected the economy mainly through the trade and investment channels but not through volatile capital fl ow. China was the fi rst nation among the G20 to take quick actions to relieve the negative eff ects brought by the global fi nancial crisis. Th e
China

67
Yide Qiao
country’s policy responses were eff ective and successful, which contributed to help other nations, developed or developing, to stave off the negative impacts of the global fi nancial crisis. It is important for China to continue its eff orts to turn the current “soft landing” of its economy into sustainable and steady growth by pursuing its economic transformation. Th e challenges the country faces are tremendous, especially taking into account its population of nearly 1.3 trillion people. If China successfully deals with these challenges and transforms its growth pattern, it will move forward to become a high income country. Otherwise, it will inevitably fall down into the so-called “middle income trap”.

68

69
Chapter 3
IndonesiaMohamad Ikhsan and Cicilia A. Harun
An important lesson from the 2008-2009 global fi nancial crisis and its aft ermath is that the world economy is highly interdependent with multiple sources of growth and new powerful links, both between developed countries and developing countries and among developing countries. A new structure of the world economy is underway, and the crisis has obviously accelerated the change in the global economic landscape in which the developing countries have acquired greater importance in global economic growth and a greater share of the global economy. Nearly half of the growth today is created by the developing countries. By increasing their importance in the global economy, developing countries have a bigger role in determining the state of the global economy. Th e current recovery process will not follow a smooth path as uncertainties are increasing. Hence it is very important for developing countries to respond and navigate through the current turmoil because any crisis (for instance, the ongoing European economic crisis) has the potential to escalate and derail the recovery process in the developing world. Indonesia is an interesting case. It has experienced two severe crises, in the mid-1960s and 1997-1998, while it has successfully avoided two threatening episodes, the mid-1980s collapse in energy prices and the 2008-2009 global fi nancial crisis. As Basri and Hill (2010) have pointed out, this success relates to the quality and resilience of the country’s institutions, the Government’s economic management credentials and the adaptability of the business and household sectors.
70
Th is chapter discusses experiences, lessons learned and challenges faced by Indonesia in the recent crisis. Indonesia provides a unique situation, in which it was the country that suff ered the most during the Asian fi nancial crisis of 1997-1998 but was among the strongest in weathering the recent crisis. Th is chapter discusses what went wrong then and what went well in the recent crisis.
Indonesia and the economic crisis of 1997-1998 Since the late 1960s and with the notable exception of the Asian fi nancial crisis of 1997-98, Indonesia has generally been able to navigate relatively well through any economic crisis. As a result, Indonesia was one of the 13 countries in the world - identifi ed by the Growth Commission under the leadership of Nobel Laureate Mike Spence, which was able to maintain its economic growth at least at a 6+ per cent over 30 years (Growth Commission, 2008). Th e country’s progress in GDP growth was also refl ected in other social indicators such as the poverty rate. In the 1960s, about two thirds of Indonesia was living below the poverty line. Now only 11 per cent of Indonesian households are below the offi cial poverty line (Ikhsan, Rural poverty, forthcoming). During the Asian fi nancial crisis, Indonesia was the worst-aff ected country, with output contracting sharply and open unemployment and poverty increasing signifi cantly. Th is was largely due to the fact that during the Asian fi nancial crisis Indonesia experienced not only an economic crisis but also a political crisis and to some extent a social crisis as well. Th e political crisis – which eventually led to a transformation in the Indonesian political landscape from an authoritarian to a democratic regime – is the most important factor. Th e roots of the 1998 crisis started earlier in the middle of 1997 when severe “El Nino” weather hit the Indonesian agriculture sector. Agricultural production, particularly rice, was depleted and caused a hike in food prices which in turn translated into a sharp increase in the infl ation rate. Agricultural supply shocks reduced domestic demand through a decline in both rural sector incomes and the purchasing power of Indonesian households. As shown by Ikhsan (Labour market, forthcoming), the main factor in the signifi cant rise in poverty incidence since 1996 was El Nino – not the fi nancial crisis. But the weakening of domestic demand continued
Indonesia

71
when the fi nancial crisis hit the investment and the construction sector, a sector which most of the rural population depend upon as a supplementary source of income for their livelihoods. Th e other key cause of the crisis was capital fl ight, which was spurred by a confi dence crisis and a social crisis as some riots hit the Chinese minorities who are relatively dominant in the economy. Th e massive capital fl ight caused a sharp depreciation of the Indonesian rupiah. About 30 per cent of domestic banks’ outstanding loans were in foreign currencies and one-tenth of the loans were to the real sector (Ginting and Aji, forthcoming). Th us, the massive rupiah depreciation led to a collapse of the Indonesian banking sector which was then transmitted into the real economy, causing many domestic fi rms particularly property, construction and import substitution manufacturing to come to a halt. Compared to other aff ected Asian countries, the recovery of Indonesia’s economy was slow, as a result of the breakdown of economic institutions and the mismanagement of the crisis. As Basri and Hill (2010) stated: “the IMF ‘over-managed’ the crisis, by demanding fi scal austerity and excessive policy conditionality, in addition to displaying a lack of political sensitivity at key moments. Th e weakened power of President Soeharto along with his decision to form a relatively non credible cabinet made the policy management even worse (p.15).” Th e post Soeharto administrations – except during the administration of Abdurachman Wahid – managed the economy relatively well and took four important sets of actions (Ginting and Aji, forthcoming). First, the Government decided to recapitalize the banking sector to prevent the total collapse of this important economic institution. An adverse consequence of this policy was that the Government debt increased dramatically. Th e government debt to GDP ratio rose from 23 per cent before the crisis, in 1996, to above 100 per cent. To reduce the debt burden, a consistent fi scal consolidation was enacted by gradually reducing the budget defi cit from 2.4 per cent of GDP in 2001 to 0.1 per cent of GDP in 2008.Th is eff ort was driven by improved revenue collection, reduced subsidies, especially untargeted fuel and electricity subsidies, and lowered risk premiums and interest rates. Th is fi scal consolidation was supplemented by an eff ort to improve fi nancial management by replacing two Dutch-inherited budget laws with a series of new modern budget and treasury laws in 2003. Reduced budget defi cits along
Mohamad Ikhsan and Cicilia A. Harun

72
with accelerated economic growth and an appreciation of the rupiah resulted in a sharp decline of the government debt to GDP ratio to about 30 per cent in 2010. Th e second important reform milestone helped address the core problem, i.e. the fi nancial sector. Th e Government, through the Bank of Indonesia as the regulatory agency, introduced a new regulatory regime by focusing on risk-based supervision and consolidated supervision of groups of banks, rather than traditional monitoring of compliance with regulations by individual banks. Th e result was quite promising. Indonesia made progress in strengthening its supervision capacity, off -site monitoring, early warning systems, corporate governance, and responsibilities of boards of directors and management (Lindgren, 2006). Although the effi ciency of fi nancial intermediation still needs enhancement, the performance of the banking system continued to improve following a series of regulatory reforms and reforms to supervision practices introduced aft er the Asian fi nancial crisis. Th ird, infl ation surged to about 80 per cent at the peak of the Asian fi nancial crisis, but Bank Indonesia managed to restore infl ationary pressures to single digits in 2000. However, infl ationary pressures retuned again shortly thereaft er – partly because of fuel price policy adjustments in 2005 and 2008. To improve infl ation management, Bank Indonesia adopted an infl ation targeting framework in June 2005. Aft er experiencing double digit infl ation in 2005 and 2006, infl ation in Indonesia fell to 6.4 per cent in 2007, although the unexpected surge in international food and energy prices pushed domestic infl ation to 11 per cent at the end of 2008. Finally, the country’s external position continued to improve. Th e current account has been in surplus in recent years due to good export performance driven by high commodity prices and strong demand. Consistent with the positive current account position, international reserves holdings have increased sharply, to over US$ 65 billion in June 2008. As in other countries, precaution is the other important motive for accumulating reserves in Indonesia (Ruiz-Arranz and Milan, 2008). In addition, the rupiah has become more fl exible to changes in the economic fundamentals. Th is, together with increasing international reserves, has reduced the country’s vulnerabilities to external shocks.
Indonesia

73
Indonesia and the economic crisis of 2008-2009 As stated before, Indonesia weathered the 2008-2009 global fi nancial crisis relatively well. First, even though economic growth slowed down, it has remained positive at 4.5 per cent during 2009. Th e slowdown period was also limited to two quarters beginning in Q2 2009. Since then, economic growth recovered and remained stable around 6 per cent. Second, both poverty incidence and open unemployment have continued to fall. Th e incidence of poverty was down to 12.5 per cent in March 2011 compared to 14.1 per cent in 2008 while open unemployment fell to 7.4 per cent in February 2011 compared to 8.5 per cent in February 2008. Th ird, the balance of payments recorded a surplus generated by a record expansion of exports which was driven by both commodities expansion and a recovery in manufacturing exports. Th e surplus in the external balance resulted in an accumulation of foreign exchange reserves, which improved confi dence in fi nancial markets, particularly in the foreign exchange market. In the past, Indonesian FOREX market was excessively sensitive to news and shocks. Now, those sensitivities have reduced signifi cantly, allowing the Bank of Indonesia to conduct sterilization policies more smoothly. Comparing indonesia’s experiences during these two crises, several distinctive factors can be identifi ed as sources of Indonesian resilience during the global fi nancial crisis. Th ey range from macroeconomic management to microeconomic fundamentals. Th e regional economic environment also contributed to Indonesia’s resilience during the global fi nancial crisis. First, from a macromanagement point of view, Indonesia enjoyed greater fl exibility to implement aggressive monetary and fi scal policies. Indonesia, like most other Southeast Asian countries, had implemented sound macroeconomic and fi scal policies for over a decade. As a result, the region had a relatively strong fi scal position and low debt levels that allowed Governments to implement larger fi scal stimulus measures. Th is situation is entirely the opposite of the 1998 Asian fi nancial crisis, where most countries were forced to respond to the crisis by adopting fi scal austerity and/or tight monetary policy. More importantly, East Asia is relatively competitive region with relatively skilled labour, very fl exible labour markets, and relatively adequate infrastructure in most countries. Such competitiveness is a favourable factor for economies to rebound in the face of economic crises because factors of
Mohamad Ikhsan and Cicilia A. Harun

74
production can be redeployed relatively quickly in response to changes in relative prices such as a large devaluation of the national currency. Th e Asian fi nancial crisis in 1997-1998 taught the countries the importance of a healthy fi nancial sector. As mentioned previously, a set of reforms had already been implemented to strengthen the fi nancial sector, and to better fi nance the economic sectors.
• When the crisis hit in 2008, most banks in Indonesia had a very low level of non-performing loans – a very diff erent situation compared to 1997-1998. And the condition of the banking sector continued to improve during 2009-2011. In fact, most of the Indonesian banks recorded massive profi ts in 2010 and were able to strengthen their capital base.
• Financial intermediaries and fi nancial markets improved and good corporate governance has been the rule. To make sure that good corporate governance is in place, as part of the economic reforms, the Government of Indonesia sold some of its shares in State-owned banks to capital markets. Th e Government also re-privatized bailed-out banks, the dominance of State-owned banks eroded, and competition in the banking sector gradually improved.
• Th e crises in 1997-98 created a larger Government and central bank debt market. Th is development has allowed the central bank to implement a more effi cient monetary policy. Th e government debt market can also provide a benchmark for the private debt market to become more effi cient.
• Th e accounting and auditing standards of intermediaries and borrowers improved. Investors are better informed. Th ere is also better information on small borrowers since Bank Indonesia established a public credit bureau in 2006. To improve better access to information, Bank Indonesia also encouraged the private sector to open a private credit bureau.
• Overall, prudent regulation and supervision from Bank Indonesia is much better than in the 1990s even though the Bank Century case reveals that more eff orts must be made to improve banking supervision.
• Banks in the region had little exposure to the United States or the European Union housing market.
Indonesia

75
Other distinctive diff erence between the two crisis periods is that households and fi rms were not over-borrowed during the global fi nancial crisis and thus were in a better position to sustain consumption and investment. Households’ savings-investment behavior in the current crisis is almost the opposite of the 1997-98 crisis. During the previous crisis, many countries faced overconsumption and investment through the bank and fi nancial sector channels, which led to a real appreciation of the exchange rate. In addition, in 1998 the level of reserves was relatively limited, at US$ 23 billion or only 50.6 per cent of short-term debt. In contrast, in 2008, the level of reserves reached US$ 51.6 billion or 140.2 per cent of short-term debt. Th e self-insurance practices adopted by Indonesia – and other Asian Countries – proved to be rewarding. Even though Indonesia lost about US$ 6 billion of its reserves in 2008, they quickly recovered. In May 2009 reserves went back to their pre-crisis levels of around US$ 57 billion, and they continued to pile up since then. Following the recovery in capital infl ows, the rupiah recovered much of the loss experienced during the market turmoil of late 2008 and early 2009, and it reached its pre-crisis value nine months aft er the global fi nancial crisis. China played a role in stimulating demand in the region. Intra-regional trade in Asia – led by China – went up from 32 per cent of total exports in 1995 to 50 per cent in 2008. Th erefore, proximity to China and China’s strong growth helped the region. In addition, rapid trade liberalization in the region improved market access, enlarged markets, attracted more investment and contributed to higher incomes in the region. To conclude, we summarize what Indonesia has done in response to the global fi nancial crisis using a public fi nance framework (Aizenmen and Pinto, 2011). Th e fi rst column in table 3.1 addresses the primary objectives of the crisis responses of Indonesia – and other emerging countries – which is consistent with all three generations of crisis frameworks. To address the fi rst generation of crisis response, which is related to public debt sustainability, Indonesia committed to adopt a sound fi scal policy by maintaining a sizeable primary fi scal surplus and improving the composition of expenditures and revenues. To fi nance necessary public investments, the Government plans to gradually reduce the energy subsidy and shift savings from the subsidy toward expanding fi nancing for public goods, including upgrading infrastructure.
Mohamad Ikhsan and Cicilia A. Harun

76
Goal Policies Comments
1. Maintain fi scal sustainability(First generation)
Raise primary fi scal surpluses since 2000 and continue at least until 2014
Some have criticised this approach since it is not able to address the infrastructure defi cit and other important public investment. Raising the primary surplus might be good in the short term but might not be good in the future because it reduces potential future growth and tax bases.
Improve the quality of spending by improving expenditure composition
Continue to strengten the revenues side by adopting tax and non tax administration reform
Strengthen fi scal institutions"
While the level of Indonesian debt is already low at below 30 per cent, maintaining some level of defi cit is still justifi able.
2. Insure against shift ing market sentiment and possible sudden stop and reversal(Second generation)
Build up foreign exchange reserves
No clear defi nition of “ideal” foreign reserves.
Optimal foreign reserve levels will depend clearly on the ability of Bank Indonesia to aff ect private debt, fl exibility of the exchange rate, and the extent of currency mismatches
Bank Indonesia has very signifi cant room to reduce the need to build up future reserves by improving reserve management."
Indonesia
Table 3.1. Evolving crisis responses in Indonesia since the 1998 Asian fi nancial crisis

77
Th e Government along with Bank Indonesia protected the vulnerability of the economy by self-insuring the economy against market sentiment and possible sudden stops by building up foreign reserves. Th e level of international reserves was US$ 110.1 billion or 6.3 months of import and government foreign debt payment at the end of 2011. Investor confi dence and positive market sentiments continued to build up despite slow progress in microeconomic reforms and potential problems of Bank Indonesia’s balance sheet. Finally, to prevent a recurrence of third generation type crisis – lowering contingent liabilities associated with the private sector which are related to the possibility of a bail-out, as happened during the 1998 Asian fi nancial crisis – the Government committed to a fl exible exchange rate regime and continues to strengthen fi nancial institutions. While the primarily focus is on the health of State-owned banks – which still control over 40 per cent of banking assets – since 2006 the Government expanded the scope of fi nancial reforms into non-fi nancial institutions. Although no signifi cant progress was made until recently, having a more diversifi ed fi nancial market is appealing not only to strengthen its resilience but also to improve its effi ciency.
Mohamad Ikhsan and Cicilia A. Harun
Goal Policies Comments3. Lower contingent liabilities associated with private sector(Th ird generation)
Maintain fl exible exchange rates
A fl exible exchange rate regime will reduce incentives for currency mismatches.
Monitor private external borrowing and currency mismatches
Strengthen fi nancial institutions
Potential contingent liabilities are still large since government still holds a majority of state banks which control 40 per cent of Indonesian banking assets
Government still distorts energy market prices including the electricity price. Sizeable contingent liabilities involved.
Table 3.1. Evolving crisis responses in Indonesia since the 1998 Asian fi nancial crisis (continued)

78
Th e crisis and the real sector Increasing confi dence in the real sector should be important in creating a good and sustainable investment climate. Th is said, the crisis in 1997-1998 had reduced the investment appetite of not only foreign investors but also the domestic banking system. Th e real sector has maintained positive growth since the crisis, and even weathering the crisis of 2007-2008. However, as recorded by Bank Indonesia in its annual report of the Indonesian economy of 2009, the real sector has also reduced its demand for fi nancing. In the past, the reliance of the fi nancial system for fi nancing has provided a bitter taste for the corporate sector during the Asian fi nancial crisis when banking liquidity vanished from the market. Self fi nancing in fact has played a major part in the development of the corporate sector. A Bank Indonesia survey in 2009 revealed that the share of internal fi nancing remained in the range of 60 per cent since aft er the crisis of 1997-1998, whereas the share of domestic bank loans was 21 per cent. Th e Gross Fixed Capital Formation approach also indicated that prior to the crisis, the share of bank loans reached 31.8 per cent, whereas internal fi nancing was just 12.4 per cent. Th e composition changed to 16.1 per cent for bank loans and 46 per cent for internal fi nancing in the 2008 period. Th e balance sheets of listed companies also revealed the use of liquid assets and retained earnings as sources of fi nancing, as refl ected by the decreasing share of inventory to total assets and increasing share of retained earnings to total assets. Th e ratio of banking credit to GDP in September 2011 is less than 30 per cent, with banking institutions taking almost 80 per cent of the entire fi nancial system. Th is is a signifi cantly lesser number compared to Malaysia and Singapore that already reached above 100 per cent. Th e reliance on self fi nancing was one of the reasons the corporate sector was relatively unhurt by the liquidity squeeze in the fi nancial market due to the global fi nancial crisis. Th is characteristic of the corporate sector will remain the strength of the real sector in facing the uncertainties from the global crisis nowadays. However, if this phenomenon sustains, and corporate sector continues to resort to its own balance sheet for growth, it will have limited capacity to accelerate its growth and contribute signifi cantly to the job creation and the productivity of the economy. Th e World Bank recorded a 12 per cent annual growth for Indonesian manufacturing sector within 1990-1996, which also contributed to one-third of the overall GDP growth. However since the crisis, between 2001 and
Indonesia

79
2010, manufacturing only grew below 5 per cent annually. Th e drop is due to the decline in the appetite for investment and lower domestic demand post the Asian fi nancial crisis. Th e resort to self fi nancing as mentioned above also contributed to the declining growth of manufacturing. Since the oil and gas manufacturing only counts for less than 8 per cent of the entire manufacturing sector (in 2010), it is good to concentrate on the non-oil-and-gas manufacturing. Th e sub-sector wood and wood products and sub-sector basic and fabricated metal are identifi ed as having negative average annual growth during 2001 and 2010. With the recovery and economic growth since the Asian fi nancial crisis, it is not surprising that the sub-sector within non-oil-and-gas manufacturing sector with the highest growth is vehicles, machinery and electronics due to the increase of purchasing power. Transportation and communication sector has also registered impressive growth rates between 2001 and 2010 with an average annual growth rate of above 12 per cent. Th e fl ow of foreign direct investment (FDI), especially in the form of relocation of factories with labour-intensive manufacturing activities into Indonesia, is projected to drive the manufacturing sector of Indonesia. Th is is mainly due to the increase of wages in China, which drives companies to relocate factories to Viet Nam and Indonesia that still off er lower wages. Recent data from Investment Coordinating Board of Indonesia suggests that there is an increase of 107 per cent year-on-year from realization of foreign investment in manufacturing activities, especially in textiles, leather good and footwear sub-sector as well as vehicles, machinery, and electronics sub-sector. Another driving force that can pick up the manufacturing activities in Indonesia is the strong domestic demand despite the declining growth in most other countries in the world. Th is is considered very important especially with the expectation of persistent low foreign demand for export of manufacturing products as a result of continued recession in the developed countries. Th e World Bank (2011) reported that the strong growth of domestic demand has contributed to the strong growth in basic metal, food, chemicals and automotive parts as the domestic market dominates demand in these industries. Until world demand recovers, since Indonesia only produced basic manufacturing goods, Indonesian manufacturing industry will continue to cater mostly the domestic market. Th erefore a breakthrough in the manufacturing industry is going to be needed to produce manufacturing
Mohamad Ikhsan and Cicilia A. Harun
80
products that involve high technology. With the comparative advantage in the labour market, Indonesia will have to produce export-worthy high-tech products in order to accelerate growth in manufacturing sub-sector. Th erefore, eff orts to encourage product research and development in the manufacturing industry are important.
Role of monetary and exchange rate policy Aft er the Asian fi nancial crisis of 1997-1998, Bank Indonesia was given independence with the enactment of Law No. 23/1999. Th e bank then holds sole authority on the monetary, banking and payment system. Since the crisis, the central bank implemented infl ation targeting and established the fi nancial stability wing. Th e crisis experience, especially with what happened in the banking system, has provided a lesson that monetary and fi nancial stability are two sides of a coin and that one cannot be established without the other. Aft er massive restructuring work was done to the banking system, Bank Indonesia focussed on prudential regulatory reform and adopting the international standards of Basel II. Th e fi nancial stability wing of the central bank started to run the macroprudential surveillance since 2003 to detect systemic risks as early as possible. Since the infl ation targeting was adopted in 2005 by the monetary authority (Bank Indonesia), interest rates has been lowered. With the improving fundamentals, aft er the managed fl oating rate was abandoned in August 1997, the exchange rate reached a steady state at around 9,000 rupiah per United States dollar. When the global crisis peaked with the global liquidity squeeze at the fi nal quarter of 2008, with the exception of a few banks, the banking institutions were able to weather the crisis. Non-performing loans (NPL) was below 5 per cent (gross NPL at 3.95 per cent), and average capital adequacy ratio (CAR) of 16 per cent as of August 2008. Indonesian banking institutions were not exposed to the subprime mortgage products and they had very little exposure to structured products. Th erefore, the banks did not experience a devaluation of asset prices. Nevertheless, the capital markets experienced a fi re sale mostly from foreign investors because of liquidity crunch. Th is caused government bond prices to decline. To overcome this situation, Bank Indonesia temporarily allowed banks to switch their government bonds from trading portfolio to hold-to-maturity so that they do not have to experience
Indonesia

81
the temporary devaluation of bond prices when they have to do valuation of their trading portfolio. With the decline of liquidity, to avoid panic behaviour of the depositors, the Deposit Insurance increased the limit of the amount of deposits that can be insured. To help the rupiah liquidity in the market during crisis, Bank Indonesia: (a) cut the overnight repo rate from BI Rate plus 300 basis points (bps) to BI Rate plus 100 bps, and adjust the deposit facility rate from BI Rate minus 200 bps to BI Rate minus 100 bps; (b) extend the window for fi ne tune operation from 1 to 14 days to 1 to 3 months; (c) simplify the calculation of rupiah reserve requirement to 7.5 per cent of the third party deposit; and also expand the defi nition of assets that can be pledged as collateral for discount window operation with Bank Indonesia. To help the liquidity of foreign exchange during the crisis, Bank Indonesia (a) extend the tenure of FX swap from maximum of 7 days to 1 month; (b) commit to supply forex to domestic fi rms through the banking system; (c) lower the reserve requirement for forex from 3 per cent to 1 per cent; and (d) lift the daily limit for short-term off shore debts. Th e withdrawal of liquidity also caused a signifi cant decline of international reserves during the fourth quarter of 2008 of almost 10 per cent. However, since then, Indonesia has doubled the amount of international reserves, equivalent to more than 6 months of import and foreign debt payments. Indonesia is joining the crisis countries in accumulating foreign reserves in order to build cushion to face future crises. Th e countries in the East Asian region have gained so much experience in dealing with severe economic crises that they are more than willing to unite to establish stability for the regional economy. Th e Chiang Mai Initiative (CMI) is one example. CMI is aimed to provide emergency balance of payment support. It was initiated with series of bilateral currency swap agreements among the nations, with the possibility of establishing a pool fund for the region to fi ght currency speculation. Th e CMI has since escalated to multilateral arrangements called CMI Multilateralization (CMIM).
Lessons from the fi nancial crisis What has the recent fi nancial crisis taught us? Th e fi rst lesson to draw is that fi nancial sector development including its integration to the global fi nancial system can be an important catalyst for economic development,
Mohamad Ikhsan and Cicilia A. Harun

82
but this should be done gradually aft er the necessary institutional changes are in place. We have learned from the previous crisis of the importance of developing adequate supervision systems that can keep pace with market development. Th e global fi nancial crisis has reminded us to keep a balance between real sector development and fi nancial sector development. Th e second lesson from the global fi nancial crisis is on the direction of economic development strategies in general. Th e crisis underscores the importance of keeping a balance between strong domestic demand and export promotion. Th e integration of the domestic economy and the global economy into global production chains should be part of our national development strategy. However, we should not forget to integrate our economy internally. Having a strong and effi cient domestic economy can enhance the competitiveness of our products in global markets. A third important lesson is that being proactive has really paid-off . One reason for the success of Indonesia in navigating this current crisis has been the preparedness of the Government. Th ey started to prepare for the crisis as the fi rst signs of turmoil emerged, allowing us to adjust some policies early on and before many of our neighbours. Th ey also took some risks in securing fi nancing for the budget as markets were asking for a premium on capital, which allowed us to aggressively use fi scal policy to counter the crisis. A fourth lesson is on the relationship between the food crisis and the fi nancial crisis. Incidentally, both the Asian fi nancial crisis in 1997 and the recent global fi nancial crisis were accompanied by food crisis. In 1997, the eff ects of El Nino depressed food and agricultural production in many countries including Indonesia and Philippines. As a result, the poverty rate increased signifi cantly. In 2008, food production per capita reached its highest level in Indonesian history. Indonesia attained, for the second time, self-suffi ciency in rice. Th e availability of suffi cient rice domestically helped to insulate Indonesia from the spikes in rice prices in early 2008. As a result, we were not only able to continue to record a declining trend in poverty, but also in unemployment. In conjunction with its social impact, we also learned that handling the impact of the crisis was easier because social safety nets were already in place and the Government was able to scale them up quickly as needed. Th e signifi cant impact of the Asian fi nancial crisis on poverty was partly caused by the unreadiness of social safety nets. In 2008, the situation was very diff erent.
Indonesia

83
Indonesia had put in place over the past few years strong foundations for a social safety net programme, ranging from food subsidy to cash transfers etc.
Challenges ahead Th e recent crisis experience has left many issues on the table. In the short run, Indonesia faces the challenge of increasing international confi dence in the economy to establish economic and fi nancial stability. Sound fundamentals and diversifi ed economic activities proved to be the strength of the Indonesian economy in weathering the crisis. Indonesia is among the emerging markets that have been benefi ciaries of capital fl ight from the developed countries. Th ere are several challenges faced by Indonesia both in the medium and long term. On the macroeconomic front, in the short run Indonesia has to deal with capital fl ows. Managing capital infl ows is quite challenging, particularly if the larger portion of the infl ow of capital is still in the form of portfolio investment. Th ere is a need to shift a portion of short-term investment into longer-term investment in the form of foreign direct investment (FDI). In the meantime, in order to avoid the risk of sudden reversal, Indonesia has to avoid bubble conditions by establishing more transparent fi nancial markets, and more diversifi ed fi nancial products. Th e country also needs to address the problem of infl ation. Even though in the recent period, Indonesia was able to cope with infl ation acceleration, Indonesia has struggled to keep infl ation at the level of its regional peers. Th e level of infl ation in Indonesia is the highest among the Association of South East Asian Nations (ASEAN)-5 countries. In addition, infl ation in Indonesia is considered to be more volatile. Th e average headline infl ation in 2006-2010 was recorded at around 6.8 per cent, lower than the 1996-2000 period (20.9 per cent) and the 2001-2005 period (10.2 per cent). Th is fi gure is even lower than that of the pre-crisis period in 1991-1995 (8.8 per cent). Looking at the components, it is clear that decreasing core infl ation has been the main contributor to the declining trend in headline infl ation aft er the Asian fi nancial crisis, whereas volatile food and administered components have still showed a higher degree of volatility. Despite infl ation targeting, in a number of occasions, infl ation has still exceeded Bank Indonesia’s target, due to volatile food prices and fuel price adjustments. Indonesia’s infl ation, being relatively higher than that of its trading partners, tends to produce real
Mohamad Ikhsan and Cicilia A. Harun

84
appreciation of the rupiah, reducing competitiveness of the tradable sectors over time. Several studies seem to suggest that the causes of the Indonesian infl ation diff erential vis-à-vis other countries in the region include various structural factors, such as strong infl ation inertia and political instability, combined with expansionary monetary policy and currency depreciation (IMF, 2006). As a consequence of the strong infl ation persistence, reducing infl ation requires maintaining a consistent monetary framework and asserting the credibility of the policy framework. Th is persistence of infl ation could imply that the convergence process to lower regional infl ation rates might be slow and costly in terms of economic growth. To reduce this cost and accelerate the convergence process, the central bank has an important role to play, building its credibility and thus aff ecting the formation of infl ation expectations. Aggressive supply side policy like eff orts to close the infrastructure gap could also address this problem of persistent infl ation. If the relatively high costs, particularly logistic costs in Indonesia, can be brought down, economic agents would change their beliefs that infl ation can still fall. Th us, it is obvious that infl ation targeting per se is not enough to address infl ation in Indonesia. It requires strong coordination between the monetary authority and the Government. Another challenge is how to make fi scal policy more eff ective. Historically, sound fi scal policy has become a policy culture among Indonesian policymakers including members of the parliament. In addition, the public fi nancial law limits the general government budget defi cit to 3 per cent of GDP. Typically, to eff ectively respond to a crisis, government spending needs to occur in a suffi ciently timely and sizeable manner. Th e experience in Indonesia including the current budget is that most of government expenditures are spent in the last quarter of the fi nancial year. In addition, the Government fails to spend as much as planned, particularly for infrastructure projects. Th e other problem of the government budget is the quality of spending. Almost 30 per cent of the spending goes toward an expensive fuel and electricity subsidy. Th e energy subsidy for 2011 alone amounted to around 6 per cent of GDP which is more than the allocation for capital spending. Should half of the energy subsidy be reallocated to well-performing line ministries like public works, the problem of infrastructure gap would be partly addressed. Th e main problem of budget allocation is
Indonesia

85
clearly not a technical one. Instead, it relates to the political spectrum faced by the Government during the democratic transition period. Indonesia has also experienced a serious problem in addressing the infrastructure gap. Aft er being neglected during the fi scal consolidation period, most infrastructure is in a poor condition both in terms of quantity and quality. Th e Government has put forward several special eff orts to address this issue. First, they increased the budget portion for infrastructure. However, since most of the spending was stuck in energy, the amount of (infrastructure) spending still remains far below the minimum needed. Second, realising that the Government on its own would not be able to provide adequate infrastructural-fi nancing, the Government made special eff orts to encourage public-private partnerships (PPPs) in the infrastructure sector. It started by demonopolising State enterprises by amending the laws which prohibit private sector participation. Most of the laws have been amended but in practice little progress has been made since many intermediate offi cials are still reluctant to allow private – particularly foreign – fi rms to realize their investment. In general, Indonesia must put forward continuous eff orts to create a better investment climate by improving the investment regulations, establishing better services to investors especially in licensing and taxation, and setting up a strong legal system to solve confl icts in business. Indonesia also needs to establish a credible capital market with diversifi ed fi nancial products and improved transparency, establish coordination among fi nancial authorities with the objective of strengthening the banking system, capital markets and other non-bank fi nancial activities (fi nancing and leasing companies, insurance, pension funds, mutual funds, pound shops), including increasing the role of the fi nancial system in contributing to sustainable development. In the medium-to-long-terms, Indonesia needs to formulate and implement strategies toward macroeconomic rebalancing for robust, inclusive and sustainable growth. Specifi cally, Indonesia has to pay special attention to the poor by devising the best policy for poverty alleviation as well as elimination of the poverty trap through better education. Indonesia has to intensify infrastructure development and maintenance in order to keep the momentum of economic growth. Indonesia’s geographical endowment also necessitates eff orts to improve connectivity inter- and intra-islands to
Mohamad Ikhsan and Cicilia A. Harun

86
reduce development gaps between the regions in Indonesia as a top priority. Th e contribution of the fi nancial system is also important, and Indonesia has already embarked on a national fi nancial inclusion programme to facilitate fi nancial broadening along with the objective of providing equal opportunities for the poor and/or those with no access to fi nancial services to increase living standards. Th is programme has to be done with special care as to minimize moral hazard problems that may potentially become systemic risks in the future. As a G-20 member, Indonesia is committed to comply with international standards within the framework of global fi nancial reform. Bank Indonesia and the Ministry of Finance have been participating actively in the international meetings on global fi nancial reform organized by the Bank for International Settlements and the International Monetary Fund. Th e most diffi cult part of policy management is how to overcome the democracy transition process. As mentioned before, Indonesia has conducted three major reforms in responding to the Asian fi nancial crisis in 1998 namely, economic reform, political reform from an authoritarian regime into a democracy and a big bang decentralization. Judging from the magnitude of the reforms, the current outcomes both in terms of macroeconomic and social indicators are considered as a success. However, the transition period has left Indonesian policymakers with several uncertainties when implementing policy (Ikhsan, 2007). Th e fi rst stem from the political transition to democratic Government. No clear majority has yet emerged and this is not expected until the political environment has matured — in another 10-15 years. Indonesia’s political fragmentation is likely to limit the capacity of the Government to implement the necessary but diffi cult policies particularly during the crisis period. Th e political fragmentation has cost the Government when they failed to pass one important law of fi nancial safety nets in 2009. Th e eff ectiveness of policy implementation is also hampered by the lack of (implementation) capacity of local governments. Th e country has undergone a big bang decentralization, moving from highly centralized to the other extreme (highly decentralized) in a very short period. Decentralization has changed the coordination, accountability and capacity of Government in terms of policy formulation, implementation and service delivery. Even though decentralization aims to improve the eff ectiveness of policy and service delivery, in reality, over 10 years since the implementation of decentralization, this has not been easy. Th e coordination is more diffi cult
Indonesia
87
because of multiple stakeholders and multiple axes along which coordination is needed, and at the same time we also face a situation with dispersed and multiple vertical and horizontal lines of accountability with relatively weak incentives (for local governments) to follow rules. On the other side, the capacity to implement at local levels is highly unequal and generally weak. Th e eff ectiveness of policy clearly depends also on the credibility of the Government and its policymakers. Building credibility is diffi cult when the foundation of trust is low. Th e issue of trust is particularly important in Indonesia. Not only do the local and central governments oft en not trust one another, but the people oft en do not trust the Government (and vice versa). Th is lack of trust seriously complicates policy formulation and implementation. Even when the rules are agreed upon, considerable misunderstanding takes place with regard to the notions of authority and responsibility. A specifi c challenge for the region is related to global fi nancial reform and the Group of 20 (G-20) agenda for strong, sustainable and balanced growth. Indonesia, along with the other countries in the region, is committed to increase regional and international cooperation in fi nancial surveillance and improved early warning systems for potential systemic risks. Th is can be done by strengthening regional cooperation in the platform of ASEAN and ASEAN+3, specifi cally in developing and expanding the CMIM arrangement. Given the increased integration of the fi nancial market in the region, there is a need to have a workable regional fi nancial stability framework. In addition, Indonesia can take advantage of its membership in the G-20 in order to push forward several issues related to establishing a level playing fi eld, cooperation in knowledge and information sharing within G-20 and other fora that can be done through meetings of the representatives of the Central Banks and Ministries of Finance. Establishing balance between the objectives of global fi nancial reform and economic growth is still important in the less-developed-to-poor countries, as global fi nancial reform may tend to put prudential measures as top priority while neglecting the need for fi nancing development. One size cannot fi t all. Reform has to be customized to the needs of each country. Concluding remarks One common lesson learned all over the world is that although fi nancial liberalization can be an important catalyst for economic
Mohamad Ikhsan and Cicilia A. Harun

88
development, the process should be done with prudential measures to avoid excessive risk taking and moral hazard behaviour. Th e recent crisis proved that even developed countries could still fail to address this concern and let systemic risk linger too long, causing major distress to the fi nancial system. With the current integration of the global fi nancial market, fi nancial distress in one country could be channelled immediately to other countries. While the current crisis originated in the United States and Europe, the general conditions in the Asia/Pacifi c region should not make countries in the region feel complacent. Indeed, in the second round of the 2007-2008 crisis, some countries in this region still suff ered from the decline of growth. As the East Asian region is becoming more integrated, more concerted eff orts in dealing with cross-border crises are highly recommended. Although in the short run, a country can benefi t by solely paying attention to restoring its own economic stability, we have learned from recent events – notably the eurozone crisis –that instability in one country can adversely infl uence the entire region. More cooperative arrangements in cross-border crisis prevention and resolution is urgently needed in the Asia-Pacifi c.
Indonesia

89
Chapter 4
MalaysiaMahani Zainal Abidin
Malaysia experienced two major economic upheavals in recent years: the global fi nancial crisis of 2008-2009 and the Asian fi nancial crisis of 1998. Th ey are quite diff erent, however, when we look at their respective causes, impacts and responses. Th e 2008-2009 crisis came from the developed countries, the United States and the European Union, its impact was transmitted through the real sector, and recovery was achieved by a large fi scal stimulus to boost the domestic economy. Th e 1998 crisis started in East Asia and it aff ected the fi nancial sector, which resulted in a severe contraction of the domestic economy. Malaysia’s response to the 1998 crisis was unconventional at that time – the country imposed capital controls, pegged the ringgit and expanded the domestic economy by lowering interest rates and introducing fi scal stimulus programmes. Malaysia successfully recovered from both crises, but the fi rst one was much more painful than the second one. Th e successful recoveries showed that Malaysia has resilience and that the policy measures implemented worked. However, it is important to compare the two experiences because of their diff erent context and response measures. In a way, the 1998 crisis prepared Malaysia for future upheavals – the country became more cautious on fi nancial globalization, particularly regarding short-term capital fl ows, and it strengthened signifi cantly its fi nancial sector. Looking at Malaysia’s experience from a broader regional perspective reveals that other Asian countries also recovered quickly due to massive fi scal stimulus injections, the expansion of Chinese and regional demand, and the good health of the regional countries’ fi nancial sectors. Moreover, East Asian countries did not face balance of payment problems; in fact they had strong trade surpluses.

90
Notwithstanding the rapid recovery from both crises, Malaysia has short-term and long-term challenges if it is to achieve its target of achieving developed country status by 2020. Since 2000, growth has been moderate, private investment has been low, and per capita income growth has been minimal. Th is has led many to characterize Malaysia as a country caught in a middle-income trap. In the short-term, reducing the fi scal defi cit, rationalizing subsidies and managing infl ationary pressure are priority tasks for the Government. But to address the country’s long-term challenges, the Malaysian Government launched the New Economic Model (NEM) in 2010. Th e NEM has three goals to be achieved by 2020: transforming Malaysia to a high-income country, attaining inclusive growth, and ensuring that growth is sustainable. Th e NEM recognizes that it has to fi nd a balance between an export-oriented strategy with extensive links to the global economy and a push to expand the domestic economy. Th is paper analyses the impacts of the 2008-2009 global crisis and Malaysia’s responses. It also summarizes the sources of Malaysia’s resilience in managing crisis and draws out lessons by comparing the experiences of 2008-2009 and 1998 crises. Th e paper concludes by discussing both immediate and longer-term issues that Malaysia needs to address if it is to regain its high-growth path.
Impact of the 2008-2009 crisis on Malaysia While the epicentre of the global fi nancial crisis of 2008-2009 laid in the United States, it brought enormous consequences for the world economy. Th e crash in global aggregate demand negatively impacted a number of sectors and markets in the Malaysian economy. Th e overall GDP growth rate of Malaysia fell to 0.2 per cent in the last quarter of 2008. In 2009 the economy entered a recession, with contractions of the GDP of 6.2 per cent, 3.9 per cent and 1.2 per cent, respectively, in the fi rst three quarters of the year (table 4.1).
Table 4.1. Impact of the 2008-2009 global crisis on growth in Malaysia
Source: ESCAP calculation based on IMF data, obtained from CEIC Data Company Limited. Available from http://ceicdata.com. Notes: Growth rates between one quarter and the previous quarter annualized and expressed in per cent. Data in constant price of 2000.
Q1 Q2 Q3 Q4 Q1 Q2 Q3 Q4 Q1 Q2 Q3 Q4Real GDP growth 5.7 5.9 6.8 7.5 7.5 6.7 5.1 0.2 -6.2 -3.9 -1.2 4.6
2007 2008 2009
Electronic production growth 0.1 -4.8 1.5 1.4 -0.1 4.7 -5.9 -20.1 -28.8 -26.9 -17.3 5.8
Malaysia

91
While in developed countries the impact of the crisis was initially felt on the fi nancial sector and later on the real economy, the opposite was true for Malaysia, where the real sector was the fi rst point of impact. Th e contraction in export demand as the developed markets were gripped by recession caused a steep drop in Malaysia’s highly export-dependent manufacturing sector. Of all the sectors of the Malaysian economy, manufacturing contracted the most, with declines in the GDP of 8.9 per cent in the fourth quarter of 2008, 17.9 per cent in the fi rst quarter of 2009 and 14.5 per cent in the second quarter. Overall, exports fell by 10.6 per cent in the fourth quarter of 2008 and 15.5 per cent in the fi rst quarter of 2009. Although the trade balance, measured by deducting imports from exports and dividing the balance with the total of exports and imports, improved to 15.6 per cent in the fi rst quarter of 2009 from 12.1 per cent in the fourth quarter of 2008, which is partly due to the high import content of the goods exported, the combined decline in exports and imports resulted in a severe recession in manufacturing. Th e largest manufacturing industry, i.e. electrical machinery, recorded the highest contraction because of its high dependence on exports. Also, its GDP started to drop earlier than that of other sectors, by 5.9 per cent and 20.1 per cent respectively in the last two quarters of 2008.
Investment and consumption Aggregate private investment started to fall at the end of 2008. Indicators such as investment in capital goods, machinery for industry and transport equipment, import of intermediate goods and manufacturing project approvals all pointed towards a decline in investment activities. Th e crisis has also had adverse implications for foreign direct investment fl ows, both inward and outward. Inward foreign direct investment had risen steadily over the period 2003-2007. However, because outward direct investment from Malaysia had risen faster than direct investment infl ows since 2003, Malaysia experienced a negative net direct foreign investment infl ow over the period 2006-2007 (table 4.2). FDI infl ows into Malaysia started to fall during the third quarter of 2008 and remained low throughout 2009. Th e prime sources of contraction were North America, Central and South America, and Northeast Asia. Infl ows from the United States fell from RM 1,100 million in the fi rst quarter of 2007 to RM 445 million in the fi rst quarter of 2009. Because of the decline in FDI infl ows
Mahani Zainal Abidin

92
from traditional sources, the Government sought infl ows from other, non-traditional sources. Given the growing cost diff erentials between Malaysia and late-comer countries, such as China and Viet Nam, attracting FDI into high value-added activities in the country would require the upgrading of its high-tech infrastructure.
Table 4.2. FDI infl ows into Malaysia
Th e rate of growth of fi nal consumption expenditures fell gradually over the whole of 2008, turned negative the fi rst quarter of 2009, and recovered slightly to 1.1 per cent in the second quarter. While public consumption slowed down to 3.4 per cent growth, private consumption fell by -0.8 per cent in the fi rst quarter of 2009 (table 4.3). Th e reason why public consumption slowed down rather than contracted was due to the execution of government expenditure already committed through the Ninth Malaysia Plan.
Table 4.3. Consumption growth during the crisis period
Source: ESCAP calculation based on Department of Statistics data, obtained from CEIC Data Company Limited. Available from http://ceicdata.com. Note: Growth rates between one quarter and the previous quarter annualized and expressed in per cent. Data in constant price of 2000.
Commodity prices Th e crisis also triggered a slump in commodity prices from their high in the fi rst half of 2008 (fi gure 4.1). As a result, the incomes of key sectors in
Source: Bank Negara Malaysia. Available from www.bnm.gov.my/index.php?ch=111&pg= 1016&ac=2&bb=bop. Note: Figures in billions of ringgit.
Q1 Q2 Q3 Q4 Q1 Q2 Q3 Q4 Q1 Q2 Q3 Q4FDI inflows into Malaysia
Net FDI
2.8 13.4 9.8 5.21 7.18 16.0 2.03 -0.81 0.43 1.14 2.58 -3.54
2.1 13.5 14.8 10.1 12.4 15.9 21.76 0.38 2.62 6.23 11.73 7.58
0.63 -0.11 -5.02 -4.84 -5.19 0.11 -19.73 -1.19 -2.19 -5.09 -9.15 -11.12
2007 2008 2009
Capital outflows fromMalaysia
Final consumption expenditure Private consumptionPublic consumption
Q1 Q2 Q3 Q4 Q1 Q2 Q3 Q411.2 8.6 7.7 6.3 -0.1 1.1 2.8 1.711.5 9.4 8.7 5.6 -0.8 0.4 1.1 1.5
10.0 5.3 3.5 8.6 3.4 4.2 10.4 2.5
2008 2009
Malaysia

93
the Malaysian economy, such as palm oil and petroleum, were aff ected. Prices of crude palm oil for local delivery and exports dropped sharply between the fi rst quarter of 2008 and the fourth quarter of 2008, but rose steeply over the fi rst and second quarters of 2009. Crude oil prices fell between the second quarter of 2008 and the fi rst quarter of 2009 before going up in the second quarter of 2009. Export prices of oil followed a slightly diff erent pattern, falling from the third quarter of 2008 and rising in the second quarter of 2009, while the prices of liquefi ed natural gas (LNG) fell from the fourth quarter of 2008 until the second quarter of 2009.
Figure 4.1. Evolution of key commodity prices during the crisis period
Th e sharp recovery in palm oil prices, driven primarily by the revival in GDP growth in China and India, augurs well for the Malaysian economy. However, the growing defi cit in net exports of gas suggests that this natural resource may soon be exhausted. Given that the cost of various government subsidies depend positively on oil and gas prices, the recovery of such prices is
Mahani Zainal Abidin
1 000
1 500
2 000
2 500
3 000
3 500
4 000
30
50
70
90
110
130
150
Jan-08 Apr-08 Apr-09 Oct-09Jul-08 Jul-09Oct-08 Jan-09
(MYR/ton)(US$/barrel)
Palm oil monthly average spot price (RH-axis)
Crude oil monthly average spot price
(LH-axis)
Source: Malaysia Palm Oil Board and Indonesia Directorate General of Oil and Gas, obtained from CEIC Data Company Limited. Available from http://ceicdata.com.
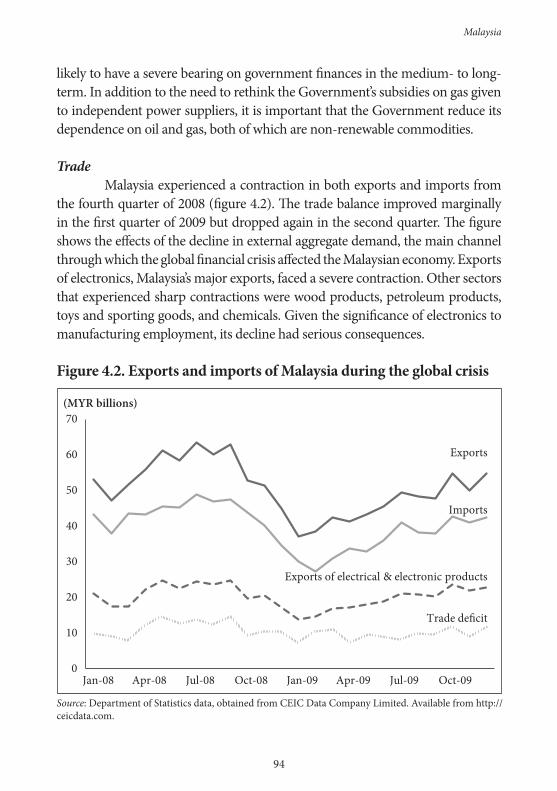
94
likely to have a severe bearing on government fi nances in the medium- to long-term. In addition to the need to rethink the Government’s subsidies on gas given to independent power suppliers, it is important that the Government reduce its dependence on oil and gas, both of which are non-renewable commodities.
Trade Malaysia experienced a contraction in both exports and imports from the fourth quarter of 2008 (fi gure 4.2). Th e trade balance improved marginally in the fi rst quarter of 2009 but dropped again in the second quarter. Th e fi gure shows the eff ects of the decline in external aggregate demand, the main channel through which the global fi nancial crisis aff ected the Malaysian economy. Exports of electronics, Malaysia’s major exports, faced a severe contraction. Other sectors that experienced sharp contractions were wood products, petroleum products, toys and sporting goods, and chemicals. Given the signifi cance of electronics to manufacturing employment, its decline had serious consequences.
Figure 4.2. Exports and imports of Malaysia during the global crisis
0
10
20
30
40
50
60
70
Jan-08 Apr-08 Jul-08 Oct-08 Jan-09 Apr-09 Jul-09 Oct-09
(MYR billions)
Exports
Imports
Trade deficit
Exports of electrical & electronic products
Malaysia
Source: Department of Statistics data, obtained from CEIC Data Company Limited. Available from http://ceicdata.com.
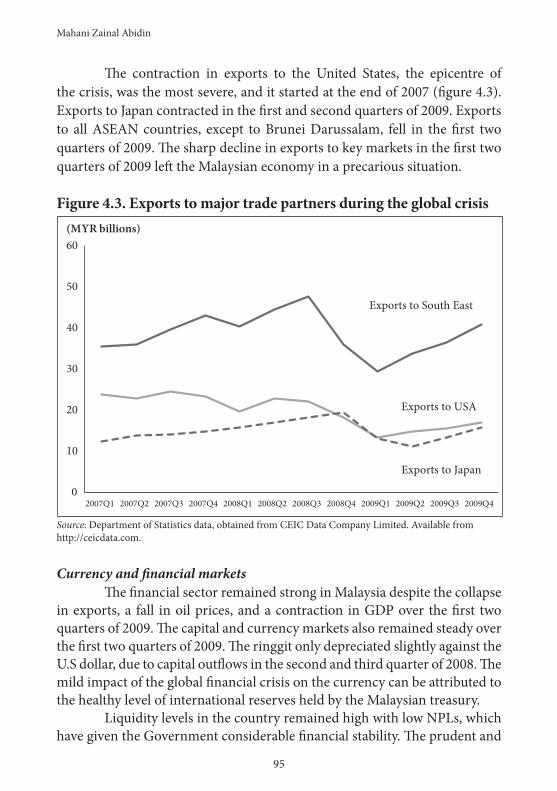
95
Th e contraction in exports to the United States, the epicentre of the crisis, was the most severe, and it started at the end of 2007 (fi gure 4.3). Exports to Japan contracted in the fi rst and second quarters of 2009. Exports to all ASEAN countries, except to Brunei Darussalam, fell in the fi rst two quarters of 2009. Th e sharp decline in exports to key markets in the fi rst two quarters of 2009 left the Malaysian economy in a precarious situation.
Figure 4.3. Exports to major trade partners during the global crisis
Source: Department of Statistics data, obtained from CEIC Data Company Limited. Available from http://ceicdata.com.
Currency and fi nancial markets Th e fi nancial sector remained strong in Malaysia despite the collapse in exports, a fall in oil prices, and a contraction in GDP over the fi rst two quarters of 2009. Th e capital and currency markets also remained steady over the fi rst two quarters of 2009. Th e ringgit only depreciated slightly against the U.S dollar, due to capital outfl ows in the second and third quarter of 2008. Th e mild impact of the global fi nancial crisis on the currency can be attributed to the healthy level of international reserves held by the Malaysian treasury. Liquidity levels in the country remained high with low NPLs, which have given the Government considerable fi nancial stability. Th e prudent and
Mahani Zainal Abidin
0
10
20
30
40
50
60
2007Q1 2007Q2 2007Q3 2007Q4 2008Q1 2008Q2 2008Q3 2008Q4 2009Q1 2009Q2 2009Q3 2009Q4
(MYR billions)
Exports to USA
Exports to Japan
Exports to South East

96
conservative regulations on investment banks and fi nance houses, which were designed to reduce NPLs following the 1997-98 Asian fi nancial crisis, were retained to good eff ect. Th e NPL over total loans ratio was rather low and fell continuously between 2007 and 2009, in spite of the global fi nancial crisis (table 4.4). Th is fi nancial stability off ered the Government the space to pursue expansionary policies to expand domestic demand. Despite the excellent NPL record achieved, the environment for investment nevertheless continued to deteriorate because of falling aggregate demand.
Table 4.4. Non-performing loans
Source: Bank Negara Malaysia, obtained from CEIC Data Company Limited. Available from http://ceicdata.com. Note: Figures expressed in per cent.
Figure 4.4. FTSE Bursa Malaysia composite index
Q1 Q2 Q3 Q4 Q1 Q2 Q3 Q4 Q1 Q2 Q3 Q4
NPL to total loans ratio
8.2 7.6 6.8 6.5 6.1 5.4 5.0 4.8 4.6 4.5 4.4 3.7
2007 2008 2009
Index
600
800
900
1 000
1 100
1 200
1 300
1 400
1 500
Oct-07 Jan-08 Apr-08 Jul-08 Oct-08 Jan-09 Apr-09 Jul-09 Oct-090
Source: Bursa Malaysia, obtained from CEIC Data Company Limited. Available from http://ceicdata.com.
Malaysia

97
Despite the ending of capital controls, regulations by the Finance Ministry have ensured that the contraction in aggregate demand arising from a collapse in exports did not trigger a bearish run on the stock market. As a result, Bursa Malaysia remained fairly steady in 2009, although the index fell almost continually between January 2008 and March 2009 (fi gure 4.4). News of the Malaysian economy entering a recession following a second quarter dip in GDP did not dampen the stock market – in fact the index grew strongly from May 2009.
Retrenchments and income With diminishing exports and GDP, layoff s and pay cuts took place (table 4.5). As a result, unemployment rate rose to 3.7 per cent in 2009 aft er a moderate rise from 3.2 per cent in 2007 to 3.3 per cent in 2008. Given its strong exposure to export markets, manufacturing was the worst hit sector. Between 2008 and 2009 manufacturing employment fell by 4.8 per cent, wages and salaries by 4.3 per cent and productivity by a large 14.8 per cent. Total retrenchments in manufacturing reported for 2008 and 2009 were double those of 2007.
Table 4.5. Retrenchment of workers from 1 October 2008 to 13 May 2009
Source: Ministry of Human Resources of Malaysia.
Measures to mitigate the negative eff ects Th e initial government reaction to the global fi nancial crisis was to relax monetary policy. Th e lowering of the overnight policy rate (OPR) from 3.5 per cent in 2007 to 2 per cent in February 2009 was done only aft er the full impact of the global crisis began to be felt in Malaysia. By that
Mahani Zainal Abidin
Type Local workers
Foreign workers Total
Permanent retrenchment 17 943 7 185 25 128Voluntary separation scheme (VSS) 7 601 870 8 471Temporaty lay-off 7 222 974 8 196Pay-cut 25 183 9 201 34 384Total 57 949 18 230 76 179

98
time, infl ationary pressures, which took place in the earlier part of 2008, had dissipated with the collapse of oil and other commodity prices. Th e reduction in the policy rate was accompanied by a 50 basis points lowering of the Statutory Reserve Requirement (SRR) to 3.5 per cent, to reduce the cost of intermediation. Th e Government also introduced a deposit insurance scheme run by Perbadanan Insurans Deposit Malaysia (PIDM), following the footsteps of other countries in the region that introduced guarantees for bank deposits to allay fears of a collapse of fi nancial institutions and to discourage capital outfl ows. Malaysia experienced large capital outfl ows from March until September 2008. As a result, as a pre-emptive measure, a full guarantee of all ringgit and foreign currency deposits in fi nancial institutions was implemented. Regulated by BNM, this guarantee was managed by PIDM and ran until December 2010. Th e Government unveiled two stimulus packages: the fi rst one (ESP 1), worth RM 7 billion (US$ 1.9 billion) or 1.04 per cent of the GDP, was launched in November 2008, and the second (ESP 2), which was RM 60 billion (US$ 16.2 billion) or 9 per cent of GDP, was launched in March 2009. ESP 1 was targeted to cover the year 2009, while ESP 2 was meant for 2009 as well as 2010. ESP 2 became necessary amidst heightened concerns that the economic deterioration was going to be very severe, as indicated by estimates from the IMF and World Bank, both of which had downgraded their world GDP forecast many times. Countries such as China and Japan had also anticipated a severe downturn and had introduced much larger stimulus packages. Nearly 43 per cent of Malaysia’s fi rst stimulus package was allocated to infrastructure projects such as the upgrading, repairs and maintenance of public amenities, including schools, hospitals, roads, dwelling quarters for police and armed forces, and police stations. It also covered the building of low-cost houses, public transport and high-speed broadband infrastructure. ESP 1 was funded by savings from a reduction in petrol subsidies, and aimed at ensuring the wellbeing of citizens, developing quality human capital, and strengthening national resilience. While projects related to these three goals varied in nature, they focused primarily on construction and infrastructure, transport, banking and fi nance, and education.
Malaysia

99
Th e second stimulus package was 8.5 times larger than the fi rst one, and almost half (48 per cent) of it, or RM 25 billion, was directed towards assisting the private sector through bank guarantees for small and medium enterprises. Another 32 per cent was allocated to infrastructure, but a substantial portion of this sum was for maintenance rather than for new spending on public facilities. Food, toll and fuel subsidies, support for low-cost housing and for retrenched workers took up 17 per cent of the spending, while the remaining 3 per cent went towards reducing unemployment and increasing job and training opportunities. Although RM 60 billion was announced for ESP 2, the actual spending in 2009 and 2010 was only about a sixth of that sum: RM 3 billion for tax incentives and RM 10 billion for strategic investments by the national sovereign wealth fund. ESP 2 focused on four main areas: reducing unemployment and increasing employment opportunities, easing the burden of citizens, assisting the private sector to face the crisis, and building capacity for the future. Th ese four goals overlap, and their implementation involves several ministries and/or agencies in most of the identifi ed projects. Th e focus of the fi rst goal was to curb the ripple eff ect of increasing unemployment by means of training and creating employment opportunities. Accordingly, the Government announced that it was working jointly with the private sector to create training and employment opportunities for 100,000 retrenched workers and unemployed graduates. In addition, 50,000 vacancies and 13,000 contract posts were open in the public sector. Other measures included providing welfare assistance to retrenched workers, extending opportunities for graduates to further their education at Masters and PhD levels, and introducing the graduate PROSPER scheme to develop young entrepreneurs. Th e second goal was to increase the disposable income of low- and middle-income households through subsidies to cancel out increases in the prices of daily food staples, measures to encourage home ownership, issue of Shariah-compliant Government Savings Bonds, and improvements in public infrastructure. Measures encompassed in the second goal also aimed at improving school facilities, providing micro-credit programmes for farmers and agro-based businesses in rural areas, improving facilities at day care centres for children and the elderly, as well as at women’s shelters, ensuring the welfare of retrenched workers through tax incentives, and providing incentives for banks to defer repayments of housing loans.
Mahani Zainal Abidin
100
Th e third goal focused on the business community, through initiatives such as the creation of the Working Capital Guarantee Scheme and the Industry Restructuring Loan Guarantee Scheme. Th e levy for the Human Resource Development Fund (HRDF) was reduced. A new organization, Danajamin National Berhad, was established to help private companies access the bond market to fi nance their activities. In the transport sector, measures include promoting the automotive sector through an auto-scrapping scheme and assisting the aviation industry through a rebate of 50 per cent on landing charges for all airlines. In addition, an accelerated capital allowance was introduced to encourage investment, and companies were allowed to carry back their losses to the immediate preceding year, which would postpone income tax payments and improve cash fl ows. Th e threshold for the windfall profi t levy on palm oil was increased. Tourism was promoted by diversifying tourism products, upgrading infrastructure, improving home-stay programmes, and approving work permits for skilled spouses under the Malaysia My Second Home Programme. Th e fourth goal refers to capacity building for the future and it covers investments, off -budget projects, the creative arts, and the eff ective management of government fi nancial resources. Specifi c measures on investment include more funds from Khazanah National Berhad for domestic investments in areas such as telecommunication, technology, tourism, agriculture and life sciences, as well as those in Iskandar Malaysia. Also covered are private fi nance initiative (PFI) projects in areas such as infrastructure and biotechnology. Other than the stimulus packages, the Government also implemented measures to restructure the economy and improve its competitiveness. Policy announcements include liberalizing 27 services sub-sectors, removing the 30 per cent Bumiputra participation quota in certain businesses and the 25 per cent Bumiputra requirement for listing purposes, and deregulation of the Foreign Investment Committee guidelines. In addition, the Government set up Ekuiti Nasional Berhad as a private equity fund to ensure meaningful and eff ective participation by Bumiputras. Th e Government also strengthened the country’s social safety net during the crisis. Th e allocation for the Malaysia Social Safety Net programme was raised from RM 350 million to RM 850 million in 2008. An important aspect of this social support programme is the Federal Welfare Aid given via
Malaysia

101
the Social Welfare Department under the Women, Family and Community Development Ministry. Th is programme was also revised and a new Social Safety Net Card was introduced in February 2009. Th e defi nition of hardcore poor, who are entitled to welfare aid, was revised from a household monthly income of less than RM 430 to RM 720 in Peninsular Malaysia, from RM 520 to RM 830 in Sarawak, and from RM 540 to RM 960 in Sabah. Th ese amounts serve as a guide or as the initial entry point for aid eligibility. Final approval depends on case-by-case checks by welfare offi cers who assess factors such as the living condition of the families, the number of children and dependants, age of the applicant or head of household, physical disabilities, and health conditions due to disease or illness.
Sources of resilience Malaysia’s response to the crisis has been conditioned by two previous events: the recession of 1985-86, which was initiated by a collapse in the prices of primary commodities, and the Asian fi nancial crisis of 1997-98, which began as a result of portfolio capital and currency movements. In many ways, the decade leading up to the latest crisis was characterized by eff orts to ensure that the economy would be able to withstand strong fi nancial shocks to the system. For an open economy like Malaysia, maintaining a fl exible exchange rate and monetary independence in the face of increasingly large capital fl ows is important. To better manage the surges in capital fl ows, which have become more prevalent, the range of market-based instruments for monetary policy operations has been increased. Given the rise in intra-regional trade and investment fl ows, greater importance has also been accorded to stability of the exchange rate against regional currencies. Policymakers have tended to err on the side of caution since the Asian fi nancial crisis, as evidenced by the large amount of excess savings and international reserves accumulated. While the Government did run continuous budget defi cits in the 2000s, these were juxtaposed by inordinately large balance of payments surpluses of up to 15 per cent of GDP. In the fi nancial sector, following the Asian fi nancial crisis, consistent eff orts have been taken to consolidate the banking sector through mergers and acquisitions and increased capitalization. Th e overcrowded banking sector, which had 58 fi nancial institutions, was consolidated into 10 banking groups with larger capital requirements. When the global fi nancial crisis
Mahani Zainal Abidin
102
fi nally manifested itself in late-2008, the balance sheets of Malaysia’s fi nancial institutions were one of the strongest, with low NPLs ratios and loan-deposit ratios well below 90 per cent. Th e level of capitalization of the Malaysian banking system remained high, with a risk-weighted capital ratio of 14.7 per cent at the end of December 2009 (end-2008: 12.6 per cent). In the Asian fi nancial crisis large amounts of volatile capital left the country through the combined loss of market confi dence and the activities of currency speculators, and Malaysia learned the lesson to accumulate large foreign reserves. It also took a more cautious approach to fi nancial liberalization and set out guidelines and plans in the Financial Sector Masterplan and Capital Market Masterplan, both introduced in 2001. At the time of the global fi nancial crisis the indebtedness of corporations and households relative to the value of fi nancial assets was falling rather than rising. Exposure to foreign loans was also kept to a minimum. Malaysia was very cautious about approving the use of complex, innovative, yet risky fi nancial instruments such as collateralized debt obligations. Th e exposure of the domestic banking system to sub-prime assets was thus limited. Th e prudential measures put in place not only strengthened corporate governance but also insulated Malaysia from over-leverage and over-exposure, which in turn helped to contain the negative eff ects of the global fi nancial crisis. Malaysia was fortunate to have entered the global fi nancial crisis with a signifi cant proportion of its economic growth contributed by domestic sources, particularly private consumption. Even though domestic demand did not adequately insulate the economy from recessionary eff ects, it did help blunt the force of the shocks to trade and investment. Private consumption turned out to be highly resilient, dropping the least among the components of aggregate demand. Imports of consumption goods fell by a mere 4 per cent in the fi rst quarter of 2009, while the food and beverages component actually rose overall by 11 per cent. Other private consumption indicators, such as revenues from the sales and service taxes, registered large increases in the fi rst quarter of 2009. In contrast, imports of investment goods declined by almost 8 per cent and intermediate goods imports fell by 35 per cent during that quarter. Th e crisis was thus felt by corporations and producers much more than households and consumers.
Malaysia

103
To Malaysia’s advantage, the country’s capacity and resilience in managing these sizeable and volatile fi nancial fl ows had been fortifi ed in a number of ways. First, the country’s economic fundamentals remained healthy and the fi nancial markets were more diversifi ed and developed. Th is has enhanced the ability of the fi nancial system to absorb capital infl ows and outfl ows, thereby minimizing disruptions while ensuring that the capital fl ows can be eff ectively intermediated. Second, the managed fl oat regime accorded the necessary fl exibility for the ringgit to adjust to changing conditions. Since exiting from the fi xed exchange rate regime, the managed fl oat regime has served the economy well by providing a good balance between fl exibility and stability. Th ird, the ability to manage domestic liquidity has also improved signifi cantly, supported by a wider range of instruments to conduct monetary operations and having in place better surveillance and information system. Th is ability to manage liquidity eff ectively meant that fi nancial fl ows have a limited impact on fi nancial intermediation and the level of economic activity, and that the risk of a build-up of large imbalances in the economy has been signifi cantly reduced. Over the years, Bank Negara Malaysia maintained a pre-emptive approach to monetary policy. Earlier in 2008, infl ation was on the rise due to the sharp and signifi cant increase in food and energy prices. Th e policy rate, however, was left unchanged because the Bank considered that the food and energy price increases were largely supply driven and that raising interest rates under these conditions would have had a limited impact in containing infl ation. More importantly, the Bank also assessed that the Asian economies would be aff ected by spillover eff ects from the global fi nancial crisis, given their strong trade links with the developed economies. In addition, given the high percentage of food and energy in total consumption, higher prices in these categories would be contractionary. While there were considerable uncertainties, the balance of risks was that growth would slow in the twelve-month period beginning in mid-2008. Th at was the main consideration in the decision to maintain interest rates despite expectations that the Bank was going to tightened monetary policy. Subsequently, as the global economy contracted, the Bank’s decision to maintain interest rates was not only justifi ed but also created appropriate initial monetary conditions to provide support to the domestic economy.
Mahani Zainal Abidin

104
Comparison with the 1997-1998 Asian fi nancial crisis Th e transmission of the impact of the 2008-2009 global fi nancial crisis to the Malaysian economy was diff erent from that of the Asian fi nancial crisis of 1998. Th is time, the transmission was through the real sector, namely exports, investment fl ows and prices of exports, while the channel of transmission of the 1998 crisis was through the fi nancial sector. Th is time the real sector was the fi rst point of impact, while the fi nancial sector was almost not aff ected. Although exports suff ered a massive collapse in 2008-2009, the economic decline was much smaller than in 1998, when exports increased substantially in ringgit terms because of the sharp depreciation. Th e sharp GDP contraction in 1998 was precipitated by large capital outfl ows, a large depreciation of the ringgit and troubled domestic fi nancial and business sectors. Th at time the priorities were to stabilize the exchange rate and reduce capital outfl ows, which resulted in the introduction of a pegged exchange rate and capital controls. With these measures in place, the domestic situation stabilized, allowing fi scal stimulus and a relaxed monetary policy to be implemented to boost domestic demand. Th e situation in 2008-2009 was diff erent because Malaysia had suffi cient reserves to support the ringgit amid large capital outfl ows and the fi nancial and business sectors were strong. As such, the policy response was targeted only at expanding domestic demand through fi scal stimulus and lowering interest rates. Th e two crises – the 1998 Asian and 2008-2009 global – had diff ering impacts on the Malaysian economy and provided some very useful and pertinent lessons. In the 1998 crisis the external shock had caused severe consequences for the Malaysian fi nancial sector whereas the export sector was only marginally touched. And in fact it led the recovery process. On the other hand, in the 2008-2009 global fi nancial crisis, the Malaysian fi nancial sector escaped the spillover eff ects of the collapse of the developed countries’ fi nancial sector. Likewise, the movement of the ringgit was very diff erent between the two crises – in 1998, the ringgit depreciated by 45 per cent causing massive damage to the economy, which prompted the imposition of capital control and the pegging of the ringgit. In contrast, the movement of the ringgit was mild in the 2008-2009 crisis. Th ere are several lessons from these crises:
• Th e health of the real sector in the major markets for Malaysia, the developed markets, has an important and immediate impact on
Malaysia

105
Malaysian exports. In this case the issue of competitiveness and the state of Malaysian export industries are secondary because the collapse in global demand will automatically result in a fall in demand for Malaysian exports and will lead to economic slowdown or even a recession.
• Because of Malaysia’s heavy dependence on exports, a revival from economic slowdown is very dependent on external demand, be it regional or global. Recovery by expanding domestic demand may not be as quick because measures such as public sector infrastructure investment or tax incentives will take time to produce the required results.
• Th e state of the domestic fi nancial sector is critical in determining its ability to withstand global shocks. If it is strong and well governed, the impact of external volatility will be manageable.
• Building safeguards is important to reassure domestic and foreign constituencies that the economic fundamentals are strong. In this regard, suffi ciently large international reserves, low short-term external debt and a realistic exchange rate are some of the fundamentals that maintain public and investors’ confi dence.
• It is important to diff erentiate between external shocks that aff ect short-term demand for exports and the long-term competitiveness and strength of the external sector. Th e state of the external sector is determined by the competitiveness of the export industries, the strength of the domestic fi nancial sector and the attractiveness of the investment climate. If the external sector is uncompetitive, medium- and long-term growth will be jeopardized because exports may not be able to be restored to their previous position aft er recovering from an external shock.
• Th e public sector fi nancial position was a major factor in stimulating domestic growth to off set declining external demand. With strong surplus or capability to mobilize funds, the public sector had to take a leading role to stimulate the domestic economy when the private sector was weak. However, having the funds alone is insuffi cient – the public sector must also act quickly for pump priming the economy. In 1998, the Malaysian public sector was in a better fi nancial position than in 2008, but due to political diff erences measures to stimulate
Mahani Zainal Abidin

106
the economy took longer to implement and could not prevent the economy from experiencing a sharp contraction.
Short-run challenges Th e two stimulus packages implemented during the 2008-2009 global fi nancial crisis caused the fi scal defi cit to balloon. Th e country’s fi scal defi cit was 4.8 per cent of the GDP in 2008 and 7.6 per cent in 2009. Th e New Economic Model (NEM) proposed by the National Economic Advisory Council (NEAC) urged that the fi scal defi cit should fall to near-balance by 2020. Apart from the stimulus packages, the rising fi scal defi cit had been caused by the increasing amount of subsidies for fuel and various price-controlled items. Globally, prices are constantly rising, making subsidies on price-controlled items more costly. Th e subsidies were meant to support vulnerable groups, but they benefi ted a wider group, including the well off . Th e large government outlay on subsidies – mostly funded by petroleum proceeds – is not sustainable. Th e retail price of essential goods and services in Malaysia does not refl ect market prices. Price controls and subsidies distort price signals resulting in overconsumption and waste. Th e private sector also became ever more reliant on government subsidies, which are numerous, complex and expensive to administer. Such support by the public sector to the private sector is not leading to innovation and high levels of private investment. As a result, domestic and foreign investors have a vested interest in maintaining low value-added production. Adding to that burden are the numerous tax incentives granted by the Government. While tax incentives are necessary measures to encourage private investment, they contribute to foregone tax revenues if used indiscriminately. Historically, Malaysia’s development expenditures depended greatly on revenues from natural resources. Export duties on tin, palm oil and rubber, for example, substantially fi nanced the early fi ve-year plans. From the mid-1970s, the contribution from oil and gas rose and now accounts for about 40 per cent of the total government revenue. Th e Government should reform its revenue sources. With the depletion of oil and gas reserves, a more diversifi ed tax base is needed to compensate for the expected future reduction in the share of revenue from these commodities. Th e tax base should be diversifi ed, among other ways, by implementing the goods and services tax. Revenue collection should also be strengthened by developing and implementing an eff ective technology-based revenue collection and management system.
Malaysia

107
Another major challenge for Malaysia is to revive private investment. Th e Asian fi nancial crisis of 1998 caused signifi cant outfl ows of foreign portfolio investment (FPI) and foreign direct investment (FDI), as well as a fall in overall investment. But during the decade following the Asian fi nancial crisis aggregate investment levels as percentage of the GDP continued to decline and private investment stagnated. Th e absence of private domestic investment is further evidenced by developments in the external accounts. In recent years, the balance of payments of Malaysia has seen persistent current account surpluses, which reached almost 18 per cent of GDP in 2008. While this current account surplus was largely off set by the accumulation of net foreign assets, there was also an increasing capital account outfl ow for fi nancing Malaysian investments abroad. Although FDI infl ows into Malaysia recovered reasonably well, this rebound has not translated into higher levels of aggregate investment. It has been highlighted that tax incentives, which have been Malaysia’s traditional measure to spur private investment, have grown in number, variety and complexity over time. Such subsidies are an obstacle to phasing out low value-added industries and services and boost domestic private investment in high value-added products and services. Th e heavy presence of Government and Government-linked companies (GLC) in some industries has discouraged private investment. In addition, cumbersome and lengthy bureaucratic procedures have aff ected both the cost of investing and the potential returns on investment. A persistent shortage of skills has also had an impact on investment.
Macroeconomic rebalancing and strategies for robust, inclusive and sustainable growth From 1990 to 1997, the Malaysian economy grew at an average annual rate of 8.1 per cent, compared to only 5.6 per cent from 2000 to 2010. Th is performance gave rise to the immediate and widespread comment that Malaysia’s growth had lagged and that growth is on a downward trend. Th e private sector’s role is much smaller now – in 1995 private investment expanded annually by 32.8 per cent compared to only 12.3 per cent in 2007. As Malaysia becomes a knowledge economy, its services sector is expected to play a bigger role in economic growth. Unfortunately this transformation is slow. Th e share of services in GDP increased only 2 percentage points between 1997 and 2007, to 53.6 per cent. Nevertheless, tourism and new services industries such as
Mahani Zainal Abidin

108
Islamic fi nance, education, health services, air transport and logistics have become signifi cant contributors to the national economy. Malaysia remains in the mid-level range of competitiveness benchmarking since 2000. Based on the World Economic Forum Competitiveness Index, out of 131 countries, Malaysia’s position declined from 29th in 2003 to 31st in 2004, improved to 19th in 2007 but slipped again to 21st in 2008. Some argue that Malaysia has not got back to its previous high growth path and is caught in the middle income country trap. Malaysia is facing strong competition at both ends of the scale: in the areas of its traditional strength and in new fi elds that can be the source of its future growth. Malaysia reached middle income country status in mid 1990s. Its economic structure is balanced: a well-developed manufacturing alongside a commercial agriculture sector and a potentially strong services sector. It is also a resource-rich country with oil, gas and primary commodities. Yet, Malaysia is still a low-wage, low-skill and resource-based economy. In the 1990s Malaysia was narrowing its economic gap with the Republic of Korea; Taiwan, Province of China; Hong Kong, China; and Singapore but unfortunately this gap has now become wider. Th is growing gap is particularly noticeable in the growth rate of per capita income, technological capabilities, human capital development and the creation of high value-added jobs. Malaysia’s annual real per capital income growth rate of 3.6 per cent (in 2000-2007) is lower than those of the Republic of Korea (4.7 per cent) and Singapore (4.3 per cent). A key challenge for the country is to secure a sustained high growth rate. Th e opposing trends of continuing with low-cost, low-skill activities and making little progress in transforming into a high-productivity economy will only produce low growth in the future. Is Malaysia in danger of not meeting its own target of being a developed country by 2020? Th e Government has launched the New Economic Model (NEM) in 2010 to propel Malaysia into the ranks of high income countries by 2020. Per capita income is expected to double from the present US$ 7,000 to US$ 15,000 by 2020. Th e other two goals of the NEM are inclusive and sustainable growth. In order to achieve these goals Malaysia needs to generate sustained high growth. In this regard, the sources of growth, human capital capacity, technology and the price system are among the keys factors that need to be addressed.
Malaysia
109
Unlike the 1998 crisis, the 2008-2009 global fi nancial crisis called into question Malaysia’s outward development strategies because of the gloomy prospects for trade growth as a result of the economic diffi culties of its two major markets – the United States and the European Union. Before the Asian fi nancial crisis, Malaysia was very positive about globalization and its close integration with the international economy. However, the recent crisis has demonstrated that a decline in global demand can make Malaysia vulnerable because of the country’s heavy reliance on global trade. Th erefore, improving and refocusing its outward-oriented development strategy can help Malaysia mitigate the impact of future external fi nancial crises on trade and bring sustained high growth. Th e country’s goals should be: (i) To have a balanced export structure. Presently Malaysia’s exports
come from three major groups – manufacturing, mining and primary commodities. In the past this structure produced a good counter balance: when one component suff ered a slowdown, the other groups grew quite well because they had diff erent consumers and demand cycles.
(ii) To accelerate the expansion of services exports. Malaysia has made good progress in promoting services exports – tourism is a major export earner and the Multimedia Super Corridor is focusing on IT and business off -shoring services. Other services exports that have been identifi ed are Islamic fi nance, health and education services and air passenger transport services.
(iii) To upgrade existing exports – both the manufacturing and primary commodity exports should be upgraded to incorporate higher value-added and innovation.
(iv) To diversify markets. Th is diversifi cation is important especially in view of the moderate growth prospects – and consequently of demand for imports – from the country’s traditional markets.
(v) To continuous improving the investment climate to attract FDI.
Notwithstanding the importance of outward orientation, it is imperative that Malaysia undergoes a macroeconomic rebalancing that expands domestic demand while at the same time improves its global competitiveness and links. Switching to domestic demand can only be a long-term strategy because
Mahani Zainal Abidin
110
Malaysia has to increase its domestic market and purchasing power fi rst before that strategy can be eff ective. Th e future prospects of the Malaysian economy will hinge on its own internal conditions. Strong macroeconomic fundamentals, such as low national and foreign debts, a sound fi scal position, low infl ation and unemployment, current account surpluses, high international competitiveness, capability for R&D and technological development and availability of skilled workers are key fundamental factors for growth. Enhancing human capital is certainly a move in the right direction, but this eff ort must go beyond education and has to be linked to labour market policies and to expected changes in the demand for labour. If the supply of human capital is not matched with industries’ needs, there will be unemployment, a trend that has already emerged, and under employment. Technology and innovations are fundamental catalysts for an economy moving up the value chain because they create high value-added. Many measures to acquire and develop technological capabilities and capacities have been introduced, but success is still limited. Fostering a culture of innovation is essential if competitiveness is to be sharpened. Malaysia needs to combine technology-driven and market-driven approaches to innovation to be ahead of other countries, lead in strategic technologies and quickly capture market shares in growth products and services. For this, the country should continue to invest in technology-driven innovations by supporting research in basic sciences as well as in R&D. At the same time, Malaysia should also acquire technologies and improve them to meet market demand. Th e price system is mired in subsidies, price controls, licensing requirements and quotas and it needs to be revised to refl ect the market signals. Price controls and subsidies began with the noble aim of supporting production and investment to promote domestic output and to alleviate the impact of price increases on the poor but they have allocated resources ineffi ciently and aff ected Malaysia’s competitiveness. It is also important to pursue an inclusive growth agenda. Malaysia has achieved signifi cant improvements with regard to poverty reduction. Th e incidence of absolute poverty was cut from about 50 per cent in 1970 to almost 20 per cent by 1987. All ethnic groups recorded progress in poverty reduction. Even with the slower growth following the Asian fi nancial crisis, the incidence of poverty continued to decline, reaching 3.6 per cent in 2007. Relative poverty,
Malaysia

111
however, rather than absolute poverty, is the challenge for Malaysia. Relative poverty in 2008 was 19 per cent, slightly higher than 15 years before. Recent data shows a growing gap between the rich and the poor. While overall income disparity lessened as measured by the Gini coeffi cient, from 0.459 in 1997 to 0.441 in 2007, the disparity seem to have increased over the past decade for certain groups and the disparity among the urban group remains high with no improvements in the last decade. Moreover, the results of household income surveys suggest that only the top 20 per cent of Malaysian income earners enjoyed income growth since 1990. On the other hand, average incomes of the bottom 40 per cent have grown the slowest, reaching an average of RM 1,222 in 2008. To address poverty and inequality issues that inhibit the achievement of inclusive growth, human capital development eff orts should be intensifi ed. Massive investments have been made in education and training, but a more targeted approach should be pursued. Education and training are essential to improve the job prospects of the poor and those in the rural areas, but disparity in the availability of quality education between rural and urban areas remains. Th erefore, access to quality training and skilling courses, especially in rural areas and marginalized urban centers should be increased. Th e training system must produce skills that meet the needs of industry. More technical and vocational schools should be built to cater for the non-academically inclined students. Training and skills development is key to expanding the talent base, as it allows workers to undergo continuous improvement, particularly those that may be displaced from low value-added jobs during the country’s economic transformation. Th e social safety net for the poor and the vulnerable must also be strengthened. Despite the various measures implemented during the global fi nancial crisis, several weaknesses remain. Subsidies for food, fuel, and other products comprise about 60 per cent of social protection spending in Malaysia in 2010. Yet these subsidies benefi t the well-off more than they benefi t the poor, because of their non-targeted nature. More importantly, workers are not protected, or at best are poorly protected, from the risks associated with unemployment, illnesses, disability and old age. Unemployment insurance is absent, health insurance programmes for the poor have a narrow reach, and 35 per cent of the employed are outside the pension system. A stronger social safety net should provide support to cushion the impact of future economic crises.
Mahani Zainal Abidin

112
Ideally, such safety net would include eff ective targeting mechanisms and a clear and consistent focus on the needy. Growth should also be sustainable in the long term, so that the expansion of wealth of the current generation is not achieved at the expense of future generation. Th e NEM emphasizes that natural resources should be preserved and a green economy policy be developed. Current trends in energy intensity and carbon emission are not yet in line with sustainable growth aspirations. Policies to encourage cost-based pricing of environmental resources to improve the effi ciency of usage of fuels and water and the provision of incentives to promote “green” innovation and conservation of biodiversity should be introduced.
Malaysia

113
Chapter 5
Biman C. Prasad and Rohit Kishore
Th e Pacifi c island countries are small developing economies, the challenges of which are well documented. Such challenges are similar in many ways, but also varied as these countries are diff erent in terms of population size, land area, culture and natural resources. Although the Pacifi c island countries were not directly or immediately aff ected by the global fi nancial crisis of 2008-2009, they took precautions to cushion any potentially adverse eff ects. Isolated and small, the Pacifi c island countries developed strong economic ties with the outside world, particularly in sectors such as tourism and fi sheries. In addition, the Pacifi c island countries have maintained strong links with their diaspora communities in Australia, New Zealand and the West Coast of the United States, whose remittances came as an unexpected but welcome support during the crisis years.
Background Th e Pacifi c island countries are a diverse group of countries with varied levels of development. Th e indicators for achieving the Millennium Development Goals are also mixed (Flore-Smereczniak, 2011). Th ey can be broadly grouped into three categories and they represent a diverse group (table 5.1). Th e fi rst group of smaller Polynesian countries such as Niue, Samoa, Tokelau, Tonga and Tuvalu are mostly on track to achieve the Goals. Tonga and Tuvalu, however, may not be able to achieve Goals 5 and 6. Th e second group of countries comprise the small Micronesian States. Th ey include Kiribati, Marshall Islands, Nauru and Palau. Nauru and Kiribati
Pacifi c Islands Developing Economies

114
are not on track to achieve several Millennium Development Goals. Th ese countries have extremely poor growth rates. Th e third group includes the Melanesian countries, viz. Fiji, Papua New Guinea, Solomon Islands and Vanuatu. Th ese countries have signifi cant resources, but they are the most problematic in terms of political stability, governance and socio-economic issues. Papua New Guinea, which is the largest of the Melanesian countries, is unlikely to achieve many of the Millennium Development Goals despite its high rates of economic growth in the last few years.
Table 5.1. Characteristics of the Pacifi c Island States, 2008Population Population
growthPopulation
densityUrban
populationGDP perperson
Melanesia and Timor LesteFiji 853 1.7 47 51 3 306Papua New Guinea 5 995 2.5 13 14 943Solomon Islands 489 2.8 17 17 684Vanuatu 215 2.6 18 24 1 799Timor-Leste 1 029 3.9 69 27 346PolynesiaCook Islands 22 1.7 91 70 7 549Niue 2 - 2.4 7 33 4 364Samoa 186 0.4 66 23 2 277Tonga 102 0.6 142 24 2 176Tuvalu 10 0.6 381 48 1 346MicronesiaMicronesia (Federated States of)
111 0.4 159 22 2 205
Kiribati 101 1.8 138 48 703Marshall Islands 65 0.0 636 67 2 363Nauru 10 0.1 482 100 3 500Palau 20 0.8 85 12 671ComparatorsLow income countries 1.6 85 12 671Middle income countries 1.0 45 53 6 564
Source: AusAID (2008); ESCAP (2011a).Note: Population growth rates are for 2000-2009a. Column 1 in thousands. Columns 2-4 in per cent. Column 5 in US$.
Pacifi c Islands Developing Economies

115
Lessons learned It is true that Pacifi c island countries did not suff er much immediately and directly aft er the crisis. But the indirect eff ects were beginning to impact some of them in 2009. For some countries, this continued until 2010, when the world economy started showing signs of a rebound. While tourist numbers and remittances declined, it was not a drastic reduction. While the continued global fi nancial instability has remained a serious concern, the Pacifi c island countries are not expected to be aff ected directly. Indirectly, however, if the Australian and New Zealand economies are aff ected due to the eurozone crisis, then the Pacifi c island countries could be aff ected through declining demand for their exports, impact on remittances from these two countries and the possibility of decline in the number of tourists. In assessing the impact of the global fi nancial crisis, the Asian Development Bank (2009) pointed out several transmission eff ects, which explained some of the adverse impacts that were to later reach the shores of the Pacifi c island countries. In Solomon Islands, Papua New Guinea and Vanuatu, the declining world prices of agricultural commodities lowered incomes for small holder plantations. Rural areas dependent on tourism experienced a decline in incomes with fewer arrivals or less spending. Th e demand for transport and other goods and services used in rural production weakened, aff ecting a range of rural businesses in formal and informal sectors. Th e urban economies in some of the larger countries such as Fiji and Papua New Guinea suff ered a decrease in demand as remittances to urban households declined, and demand for tourism and other services such as international shipping were aff ected. In addition, private investment also declined in some countries. Th is aff ected government revenue, and in some cases poverty alleviation programmes and infrastructure investment had to be wound down or suspended.
Source of resilience and policy responses In terms of direct eff ects, the Pacifi c island countries weathered this because of the nature of their fi nancial systems (table 5.2). Th e Pacifi c island countries have small fi nancial sectors characterized by a small number of banks and a limited number of non-bank fi nancial institutions. Apart from Tonga, many have their own national retirement funds where it is compulsory for workers to contribute. Th e majority of the banks in the Pacifi c island countries are Australian-owned, and the Australian fi nancial system has been very stable
Biman C. Prasad and Rohit Kishore

116
and largely unaff ected by the collapsing fi nancial institutions in the United States. Most of these Australian banks have good risk management strategies, with high interest spreads and profi ts. In addition, most Pacifi c island countries have some forms of capital controls, and this further mitigated the risks. Th e main policy response to the global economic crisis in many of the developed countries was fi scal and monetary policy stimulus to create domestic demand. Many economists of the Keynesian tradition take heart from this as they believe that markets may have failed in some of the instances. However, if one looks carefully at some of the instruments of fi scal policy to stimulate demand, one fi nds that they are not necessarily against the principle of market-oriented policies. In fact one may consider some of the actions as aid-for-trade measures, thereby supporting some of the market-oriented reform, although stimulus packages diff er from country to country and are embedded in their own unique contexts.
Table 5.2. Financial sector indicatorsFiji Kiribati Samoa
Solomon Tonga Vanuatu A. Size of the banking sector in
2007 Central bank assets 3.4 - 0.2 5.1 3.5 3.5 Deposit money bank assets 73.9 - 69.8 50.6 45.5 132.6 Other financial institutions assets 100.2 - 53 27.1 14.5 9.3 Total financial system assets 177.5 157 123 82.8 63.5 145.4
B. Composition of non-bank financial institutions Other financial institutions assets 100.2 - 53 27.1 14.5 9.3 Of which development banks 13.8 - 12.1 0.3 13.9 0 Of which provident fund 64.2 - 32.2 25.5 0.6 9.3
C. Indicators of financial depth in 2007 Liquid liabilities (M2) 56.8 0 46.5 43.8 58.5 107.5 Private credit by deposit money 44.1 0 44.1 28.5 65.8 47.2 Private credit by deposit money Banks and other financial 48.3 0 44.1 33 65.8 47.2
D. Foreign ownership of banks Number of banks (foreign-owned) 6 (6) 1 (1) 4 (3) 3 (3) 3 (3) 4 (3) Assets of foreign-owned banks 100 85.7 100 100 88 Assets of state-owned banks 0 14.3 0 0 12
1000
Islands
Source: IMF Article IV consultations.Note: Indicators in headings A, B and C in per cent of the GDP. Indicators in headings D except the number of banks, expressed in per cent of the total assets of the banking system.
Pacifi c Islands Developing Economies

117
In most Pacifi c island countries monetary policies are primarily used for preserving international reserves as a result of fi xed exchange rates (Yang and others, 2011). Amongst the Pacifi c island countries, only Fiji, Papua New Guinea, Samoa, Solomon Islands, Tonga and Vanuatu operate independent monetary policies (table 5.3). Some countries tried to lower offi cial cash rates to reduce interest rates and stimulate investment. Other countries, such as Fiji and Vanuatu, reduced the required reserve ratios to increase lending to consumers and investors.
Table 5.3. Monetary policy frameworks in Pacifi c Island countries
Country Monetary objectives Monetary target
Main monetary instruments
Exchange rate regime
Fiji Promote monetary stability and a sound fi nancial structure; foster credit and exchange conditions conducive to an orderly and balances economic development
Broad money (M2)
OMO; discount windows; policy rate
Pegged to a basket (US$, AUD, Euro, etc.)
Papua New Guinea
Achieve and maintain price stability and fi nancial system stability, and promote macroeconomics stability and economic growth
Broad money (M3)
OMO; discount windows; policy rate
Float
Samoa Promote sustainability real economic growth by maintaining price stability and international reserves viability
Broad money (M2)
OMO; discount rate reserve requirements; repos
Pegged to a basket within a ±2 percent band (NZD, AUD, US$, Euro)
Solomon Islands
Promote monetary stability and a sound fi nancial structure; foster fi nancial conditions conductive to orderly and balanced development.
Broad money (M3)
Liquid asset requirement; foreign exchange surrender
De facto peg to the US$
Tonga Maintain internal and external monetary stability; promote a sound and effi cient fi nancial system; support macroeconomic stability and economic growth.
Broad money (M2)
OMO: statutory reserve deposit; credit ceilings
Pegged to a basket with monthly adjustment band of up to 5 percent
Vanuatu Maintain low and stable infl ation rate and maintain a suffi cient level of offi cial foreign exchange reserves.
Broad money (M2)
Statutory reserve deposit; OMO; rediscount rate
Adjustable peg, linked to an undisclosed transactions-weighted basket
Source: Yang and others (2011, p. 5).
Biman C. Prasad and Rohit Kishore

118
Exchange rate management is another challenging area that the small economies of the Pacifi c island countries have to grapple with. For many of the Pacifi c island countries, who are dependent on exports of primary products and on tourism, maintaining the competitiveness of their exchange rate is vital and more critical in the current economic environment. In fact, the Pacifi c island countries faced similar challenges aft er the 1997 Asian fi nancial crisis and managed to use exchange rate management tools to weather the negative impacts of that crisis. Many of the Pacifi c island countries also identifi ed exchange rate management as a tool to navigate through the crisis. Fiji, in particular, saw exchange rate management as a major issue in managing its foreign reserves. Th e Pacifi c island countries also received a steady fl ow of remittances, which provided a source of support to families to cushion the declining income from reduced exports and the erosion of purchasing power through infl ation. In particular, Tonga, Samoa, Fiji and Kiribati found this to be an import source of resilience (see table 5.4). Fiji’s remittances receipts between 2004 and 2007 have been around 6 per cent of GDP, but declined in subsequent years (Prasad, 2011). Th e actual amount of remittances received in some of these countries is higher than the offi cial fi gures because they are transferred through informal channels. Remittances support consumption and to a lesser extent productive investment.
Table 5.4. Remittances infl ows as a percentage of GDP in selected Pacifi c Island economies, 2004 to 2009
Trade policy Only Papua New Guinea, Solomon Islands, Tonga, Fiji and Vanuatu
are full WTO members. Th ere are four regional trade agreements which have
2004 2005 2006 2007 2008 2009 Fiji 6.4 6.1 6 4.7 3.3 5.1 Kiribati 7.4 8.8 11.9 8.2 7.6 6.0 Papua New Guinea 0.1 0.1 0 0 0.1 0.1 Samoa 18.7 20.9 24.5 22.4 24.8 25.9 Solomon Islands 9.9 8.5 11 7.3 6.2 7.4 Tonga 41.8 40.3 31.8 33.9 28.8 24.1 Vanuatu 1.5 1.4 1.2 1.0 1.2 1.0
Source: ESCAP (2011b).
Pacifi c Islands Developing Economies
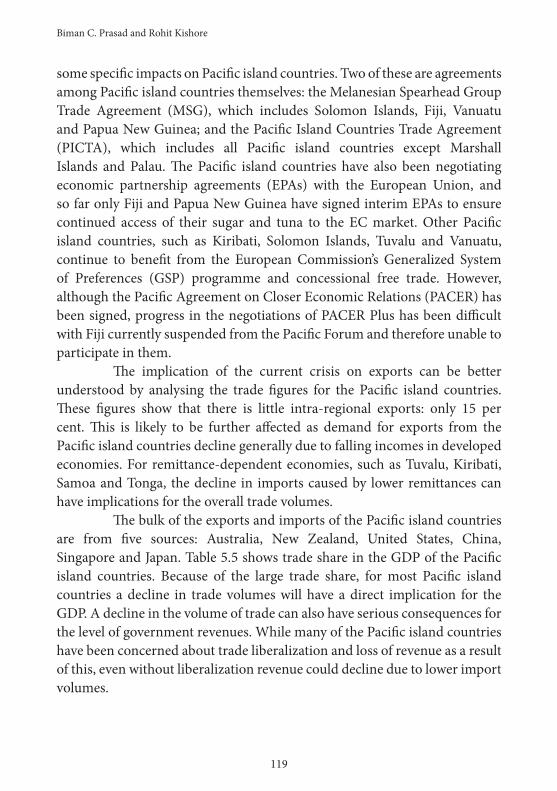
119
some specifi c impacts on Pacifi c island countries. Two of these are agreements among Pacifi c island countries themselves: the Melanesian Spearhead Group Trade Agreement (MSG), which includes Solomon Islands, Fiji, Vanuatu and Papua New Guinea; and the Pacifi c Island Countries Trade Agreement (PICTA), which includes all Pacifi c island countries except Marshall Islands and Palau. Th e Pacifi c island countries have also been negotiating economic partnership agreements (EPAs) with the European Union, and so far only Fiji and Papua New Guinea have signed interim EPAs to ensure continued access of their sugar and tuna to the EC market. Other Pacifi c island countries, such as Kiribati, Solomon Islands, Tuvalu and Vanuatu, continue to benefi t from the European Commission’s Generalized System of Preferences (GSP) programme and concessional free trade. However, although the Pacifi c Agreement on Closer Economic Relations (PACER) has been signed, progress in the negotiations of PACER Plus has been diffi cult with Fiji currently suspended from the Pacifi c Forum and therefore unable to participate in them.
Th e implication of the current crisis on exports can be better understood by analysing the trade fi gures for the Pacifi c island countries. Th ese fi gures show that there is little intra-regional exports: only 15 per cent. Th is is likely to be further aff ected as demand for exports from the Pacifi c island countries decline generally due to falling incomes in developed economies. For remittance-dependent economies, such as Tuvalu, Kiribati, Samoa and Tonga, the decline in imports caused by lower remittances can have implications for the overall trade volumes.
Th e bulk of the exports and imports of the Pacifi c island countries are from fi ve sources: Australia, New Zealand, United States, China, Singapore and Japan. Table 5.5 shows trade share in the GDP of the Pacifi c island countries. Because of the large trade share, for most Pacifi c island countries a decline in trade volumes will have a direct implication for the GDP. A decline in the volume of trade can also have serious consequences for the level of government revenues. While many of the Pacifi c island countries have been concerned about trade liberalization and loss of revenue as a result of this, even without liberalization revenue could decline due to lower import volumes.
Biman C. Prasad and Rohit Kishore
120
Table 5.5. Trade and tariff revenues
Table 5.5 also shows the volume of tariff revenues of Pacifi c island countries as a per cent of total government revenues. While some countries such as Papua New Guinea, Fiji and Solomon Islands are increasingly moving away from dependency on tariff revenue to other indirect forms of taxes such as the value-added tax, others still see tariff s as an important source of revenue for the Government. However, even for the bigger countries which have moved towards value added tax (VAT), the scope of increasing revenue will not materialize in the short- to medium-term. Th erefore, it is estimated that countries will suff er from losses of revenue as a result of further liberalization of their trade regimes. Th is has been one of the concerns of the Pacifi c island countries for some time and many are still contemplating the policy responses to further trade liberalization expected under the PACER Plus negotiation with Australia and New Zealand.
Agricultural policies For many of the Pacifi c island countries, increasing trade by trying to increase manufactured exports not based on agriculture, fi sheries and forestry, is unlikely to yield good results. For Fiji, the export of garments is on the decline, and this trend is likely to continue with the decline in demand for these exports in Australia and New Zealand. In addition, as Australia and
Trade share of GDP (2011) Total From ANZ
Tariff to total revenues Tariff revenues from
ANZCook Islands 111.0 15.1 12.2 6 460 122 Fiji 101.5 17.4 4.9 35 173 983 Kiribati 87.3 23.0 14.3 7 917 941 Marshall Islands 83.3 21.3 2.2 718 881 Micronesia (Federated States of) 64.7 17.7 0.6 267 186 Niue - 2.9 2.8 399 982 Palau 53.8 - - - Papua New Guinea 111.9 3.6 1.4 17 735 890 Samoa 64.3 25.0 14.0 15 042Solomon Islands 124.8 9.0 3.7 3 072 816 Tonga 45.8 33.3 17.2 9 845 417 Tuvalu 79.9 - - - Vanuatu 48.6 27.1 17.2 12 398 316
Pacifi c Islands Developing Economies
Sources: ESCAP (2012); Nathan Associates (2007).Notes: First three columns in per cent. Last column in US$.

121
New Zealand further liberalize their trade, competition for these manufactured exports to these countries would increase, with bigger and cheaper exporters such as China and India likely to displace countries like Fiji. Th e potential, therefore, rests with the agricultural sector. Th e Pacifi c island countries can build a comparative advantage in agriculture, especially in tropical fruits and vegetables, through proper marketing. Th is is a strategy that has worked well in tourism and bottled water. For bigger countries such as Fiji, Vanuatu, Solomon Islands and Papua New Guinea there is a great potential to raise the export of agricultural goods in the short- to medium-term. Some of these countries reverted to an aggressive agricultural production and promotion strategy as a direct response to the worsening economic crisis. Fiji had to cope with two crises – the lingering impact of military coup of 2006 and the global fi nancial crisis. One of the strategies it adopted was putting an emphasis on agriculture. Th is was in response to the increase in global commodity prices. Fiji has been able to increase its output of rice and other traditional root crops such as taro and cassava. Vanuatu also has the potential to raise its agricultural output. Th e Vanuatu Agricultural Development Bank started its operations in 2008 and it is likely to put emphasis on increasing agricultural productivity. Th is would be a prudent policy option given that Vanuatu is also experiencing growth in tourism and some of the increase in agricultural production could feed the tourism industry and help ease the import demand in that sector. While Papua New Guinea has used its mineral and oil income to raise its public spending as an overall response to the crisis, it could also concentrate on agriculture. In addition, boosting agricultural production could also support the Pacifi c island countries food security, for which agricultural and fi sheries production should address the needs for domestic consumption. It is therefore important that infrastructure spending on the agricultural sector should be increased. Such investment could pay off quickly and handsomely in the form of job creation and foreign exchange savings. In addition, attempts should be made to address oft en binding constraints to agriculture such as land tenure, high labour costs and marketing infrastructure.
Social protection policies It was generally perceived that Pacifi c island countries took a less pro-active approach in addressing the social impact of the global fi nancial crisis (Green, King, and Miller-Dawkins, 2010). Samoa reduced its spending on
Biman C. Prasad and Rohit Kishore

122
education and education, respectively, by 8 per cent and 14.9 per cent in the 2009-2010 budgets. Th e Minister of fi nance in Samoa attributed this to the impact of global crisis and said that “for small Pacifi c States like Samoa, we cannot avoid being aff ected given our highly open economy and weak fi scal resilience, which combined leave us with little protection to cushion the impact of the economic downturn”. Th is sums up the situation for most Pacifi c island countries. As economies experience low growth rates, many of these countries will fi nd it diffi cult to allocate resources for various social protection policies.
Current challenges Pacifi c island countries survived the worst eff ects of the global fi nancial crisis, but they have several critical challenges that they need to address. Th ese include the fl uctuating global commodity prices and rising fuel prices fuelling infl ation in many of them. Pacifi c island countries continue to face critical macroeconomic challenges such as rising government budget defi cits, declining government revenue and diffi culties to sustain export growth to ensure sustainable levels of economic progress. In addition, they also face hurdles in achieving the Millennium Development Goals, meeting targets for social protection policies and dealing with regular natural disasters. For some, political and social instability is a major problem. During 2007-2008 infl ation increased in many of the Pacifi c island countries as a result of rising external food and energy prices. Infl ation was highest in Fiji, Papua New Guinea and Solomon Island. Another challenge for the Pacifi c island countries in the future will be to improve their current account and fi scal balances. Foreign reserves will also have to strengthened as many Pacifi c island countries do not have adequate levels and could be in diffi culty if terms of trade deteriorates.
Policies for the future and lessons learned In the medium-term, the Pacifi c island countries will need to pay a lot of attention to maintaining appropriate levels of fi scal balances and foreign reserves to ensure that they are able to respond in a robust manner in the event of a future economic crisis. Th e use of expansionary fi scal policy provides little room for comfort for most Pacifi c island countries except probably Papua New Guinea and Vanuatu which have adopted prudent fi scal policies over the past few years and had reserves to meet contingencies in the event of the crisis (Jayaraman, 2011). Furthermore, loose monetary policy will not work, as most Pacifi c island countries having independent currencies do
Pacifi c Islands Developing Economies

123
not have well developed fi nancial sectors and hence have a weak monetary policy transmission mechanism. Th us, the Pacifi c island countries’ central banks responses to global economic downturn have been largely ineff ective (Jayaraman, 2009). In addition, the Pacifi c island countries will have to adopt a cautious monetary policy stance to avoid credit booms. Th e Pacifi c island countries are currently characterized by rising infl ation and weak economic growth. In the case of Fiji, interest rates are low and banks are fl ush with liquidity, but there is also a low level of confi dence in the economy which is refl ected in a weak demand for credit from the private sector. Much of the infl ation in the Pacifi c island countries is driven by global price rises, except in Papua New Guinea, where domestic demand may be driving infl ation, in which case tightening of monetary policy may be required. Th e Pacifi c island countries need to ensure that that the exchange rate management supports export-led growth. However, their exchange rates are pegged to baskets of currencies of their major trading partners, providing an important nominal anchor for price stability. Some of the key issues that would continue to confront the Pacifi c island countries are the impact of climate change, natural disasters, fl uctuations in commodity, fuel and food prices, and political instability in some of them. In terms of fi scal policy, the Pacifi c island countries will have to reduce their budget defi cits and direct their expenditure towards the goal of building productive capacities in their countries. Many of the Pacifi c island countries need to invest signifi cant amounts in social and economic infrastructure. In particular, health and education infrastructure will need a lot of investment in countries like Solomon Islands, Vanuatu and Papua New Guinea.
Concluding remarks Like many other small island States, the Pacifi c island countries weathered the adverse impact of the global fi nancial crisis. Th is is mainly due to the fact that they have smaller and less developed fi nancial systems, which off ered them protection from exposure to global fi nancial markets. Th e Pacifi c island countries have their fi nancial systems linked to Australia and New Zealand through the major banks owned by Australia. Th e stability of the Australian banks provided another buff er. And many Pacifi c island countries have exchange controls and, with a few exceptions, limitations to foreign borrowing.
Biman C. Prasad and Rohit Kishore

124
However, improving the resilience of the Pacifi c island countries to future economic and fi nancial shocks will be an ongoing challenge because of the volatile nature of external shocks. Although the Pacifi c island countries largely escaped the direct impact of the fi nancial crisis on their domestic fi nancial system, many of them were aff ected indirectly, and they will continue to experience shocks in the future. Most of the indirect eff ects came through trade, capital fl ows and volatility of fuel and food prices. Among the Pacifi c island countries, remittances fell but not drastically, as the Australian and New Zealand economies – from which about 50 per cent of the remittances originate – remained strong. In addition, while tourist numbers declined slightly in 2008 and 2009, they bounced back in 2010 and are is likely to grow on a sustainable basis in the future. Th is is again largely due to the strong Australian and New Zealand economies, which account for 60 per cent of tourists to the Pacifi c island countries.
However, an excessive reliance on tourism and remittances by some Pacifi c island countries pose potential risks. Th e outlook for the Pacifi c island countries’ major trading partners, Australia and New Zealand, does not look too bright. If their economies decline, it could aff ect the amount of remittances and tourist numbers to the the Pacifi c island countries. Th e other risk for the Pacifi c island countries is reduced policy space resulting from large current account and fi scal defi cits. Th is reduced policy space would limit the ability of Governments to cushion the impact of any unexpected future global shock, as well as giving poor signals to investors.
Th e Pacifi c island countries will have to continue to improve their infrastructure, look for new sources of economic growth and reform their governance structures to improve accountability. While many would argue that the Pacifi c island countries have limited opportunities for industrial and export diversifi cation, there are opportunities for the bigger island countries to do so. Th ere is enough product space in the area of agriculture, fi sheries and forestry for countries to diversify production and exports. In addition, more eff orts will have to be made at the political level to accelerate the integration and connectivity of countries within the region. Meaningful regionalism and integration with Australia and New Zealand, as well as pooling resources to improve trade amongst Pacifi c island countries, could also help build resilience in the future.
Pacifi c Islands Developing Economies

125
Chapter 6
PakistanRashid Amjad and Musleh ud Din
Starting in the second half of 2007, the Pakistani economy began to show distinct signs of slowing down and started experiencing serious pressures on its fi scal and balance of payments situation. Growth in the economy took a sharp downward turn. By early 2012 the economy still had not recovered and remained mired in deep stagfl ation – characterized by low growth and high infl ation. Economic policies that were adopted, including the ones under the International Monetary Fund (IMF) programme since November 2008, appear to have been of little help in reversing this situation. Why has the Pakistani economy not been able to break out of stagfl ation? What fundamental factors have been responsible for this situation? Why has Pakistan been the laggard among the countries in South Asia and the larger Asia-Pacifi c region, which were able to relatively recover faster from the global fi nancial crisis? What measures are needed to move out of this maelstrom? Th is chapter attempts to answer these questions. Its fundamental message is that the Pakistani economy faces serious structural imbalances which make it very vulnerable to external shocks and are primarily responsible for its stop-go cycles of economic growth (Amjad and others, 2011; McCartney, 2011). Th e economic problems the country faces, as we show in this chapter, are basically structural in nature and not just due to cyclical movements in the global economy.
Pakistan’s recent economic performance Understanding the dynamics of the Pakistani economy has never been easy. Time and again the country’s economic performance has proven

126
its critics wrong. With relatively low levels of investments and savings, its growth performance has been reasonably impressive though not spectacular. During 1970-2010, its average rate of growth was a healthy 5 per cent, though its growth path has always moved in stop-go cycles. During 2002 to 2007, Pakistan had been witnessing a phase of impressive growth with moderate infl ation (table 6.1). Th ere were no real signs that the economy was about to falter, though there was some unease expressed about the economy’s susceptibility to external shocks (Amjad, 2007). Indeed, offi cial circles were upbeat about the economic performance with claims that Pakistan had fi nally freed itself from its past heavy reliance on external borrowings and was on a path of achieving self-reliant sustainable growth. It was therefore somewhat of a rude surprise when the Pakistan economy suddenly plunged into a deep economic crisis in 2007-2008.
Table 6.1. Economic performance of Pakistan
Source: Pakistan, Ministry of Finance, Pakistan Economic Surveys (various issues) and State Bank of Pakistan, Th e State of Pakistan’s Economy - Quarterly Reports (various issues).Note: GDP growth and infl ation expressed in per cent. Fiscal and current account defi cits expressed as per cent of the GDP
What is perhaps not well-known is that the Pakistani economy faltered not with the onset of the global fi nancial crisis in the second half of 2008 but before that, when the economy was hit by an unprecedented increase in global oil and food prices in 2007-2008. Th is shock forced policymakers to adopt contractionary policies to stabilize the economy. Th ese measures were refl ected in the budget adopted in June 2008 for 2008-2009. Th ough not offi cially acknowledged, the agreement appeared to have been reached with the IMF for support, even though the IMF programme was signed later that year in November 2008.
2001 2002 2003 2004 2005 2006 2007 2008 2009 2010 2011
GDP growth 2.0 3.1 4.7 7.5 9.0 5.8 6.8 3.7 1.7 3.8 2.4
Fiscal defi cit 4.3 4.3 3.7 -2.3 -3.3 -4.3 -4.4 -7.6 -5.3 -6.3 -4.7Current account defi cit
1.8 0.4 0.5 1.2 -4.0 -6.5 -6.6 -9.0 -7.8 -6.5 0.4
Infl ation 3.1 3.3 2.9 4.6 9.3 7.9 7.8 12.0 20.8 11.5 14.1
Pakistan

127
Th e basic question then is not just about the impact of the global recession on the economy of Pakistan. Equally, and perhaps more important, is the vulnerability of the economy to the oil and commodity price shock that preceded the global recession. It is then quite pertinent to ask whether the Pakistani economy would have actually fared not too diff erently from its other South Asian neighbours in terms of defl ecting (and subsequently recovering faster from) the global fi nancial crisis in the absence of the oil and commodity price shock. To try and answer this question we start by examining the Pakistani economic performance post-2000 in terms of economic growth and the movement of key macroeconomic indicators (table 6.1). Th e turnaround in the Pakistani economy post-2003 was preceded by a sharp compression as the new Musharraf government entered into an IMF agreement in 1999 in the face of a possible debt default and very high fi scal defi cits. Th e Pakistani economy in the 1990s had not performed well as successive democratic Governments were unable to push through the needed reforms and successfully complete any of the IMF support programmes they had entered into. Th e nuclear explosion in May 1998 had also led to a sharp decline in donor assistance. Th is situation was worsened by the impact of the Asian fi nancial crisis. Th e Musharraf government used the period under the IMF programme to bring in a number of important reforms covering the fi nancial sector, monetary management, and taxation reforms. Th e economy rebounded as business confi dence increased with gross domestic product (GDP) growth climbing to 9 per cent in 2004-05 from just 2 per cent in 2000-2001.Total investment at around 20 per cent of GDP in 2004-05 also became more respectable, though domestic savings continued to remain low (around 8-10 per cent of GDP) with the gap being made up by foreign savings. Th e growth momentum, however could not be sustained as the very forces that had helped propel the economy post-2001 were also in many ways responsible for bringing to an end the boom which peaked in 2004-05. Cheap money supply led to a monetary overhang (Janjua, 2005) that fuelled infl ation and the rise in oil prices stoked infl ation further. In the face of rising infl ation and increasing oil imports (cheap credit had led to large increases in sales of energy–intensive products like automobiles, motorcycles, air-conditioners etc.) the Government began to put brakes by raising interest rates and reducing the money supply.
Rashid Amjad and Musleh ud Din

128
Th e unprecedented increase in global oil and food prices that followed in 2007 put the Musharraf government in a quandary as macroeconomic imbalances started to build up and economic activity took a sharp hit in a context of rising political instability. By March 2008, when the new Government took offi ce, the economy had slid into a full blown crisis with ballooning fi scal and current account defi cits, sharply rising infl ation, and dwindling foreign exchange reserves, which were fast depleting by almost US$ 1 billion a month with total reserves at around US$ 16 billion. With the economic situation fast deteriorating, the new Government was left with no option but to seek the support of the IMF and signed a Stand-By-Arrangement in November 2008. Th e key elements of the stabilization programme were a reduction in fi scal defi cit, which included cuts in public spending, a tight monetary policy with a 200 basis point increase in interest rates to 15 per cent, and a fl exible exchange rate regime which resulted in a 25 per cent depreciation of the rupee vis-à-vis the United States dollar. But in spite of these stabilization eff orts, Pakistan was not able to lift itself out of stagfl ation due to a combination of factors, including policy slippages, the most notable being the lack of coordination between fi scal and monetary policies, the inability to introduce key structural reforms including the non-implementation of the reformed General Sales Tax (GST), security problems, and crippling energy shortages.
Impact of the global recession and policy responses Th e global fi nancial crisis came at a time when the economy was already under stress due to the terms of trade shock resulting from the global food and fuel price hikes. Th e global fi nancial crisis amplifi ed Pakistan’s economic diffi culties with a marked slowdown in economic growth coupled with a sharp rise in the current account and fi scal defi cits, a spike in infl ation, the depletion of foreign exchange reserves, and pressure on the domestic currency. As a result, economic growth witnessed a sharp downturn from an average of 7.3 per cent during 2004-07 to 3.7 per cent in 2008, further slowing down to 1.7 per cent in 2009 as private investment took a hit on heightened security concerns. With the external accounts already under strain, Pakistan experienced a deterioration in the current account balance, which widened to 9 per cent of GDP in 2008 and put pressure on the domestic currency.
Pakistan

129
Th is was accompanied by a sharp rise in the fi scal defi cit from 4.4 per cent of GDP in 2007 to 7.6 per cent of GDP in 2008, as public revenues dwindled with a slowdown in economic growth. In an eff ort to curtail the fi scal defi cit and being unable to cut sticky current expenditures, the brunt fell on the public sector development programme, which fell from nearly 5 per cent of GDP to less than 2 per cent – with adverse consequences for long term competitiveness and productivity. High fi scal defi cits fi nanced through borrowings from the State Bank, coupled with a tight monetary policy, led to crowding out of private investment in a high interest rate environment. Due mainly to a lack of coordination between fi scal and monetary policies, the tight monetary policy failed to curb infl ationary pressures in the economy, and the infl ation touched an all-time high of 20 per cent in September 2008. Th ough it fell subsequently to nearly 12 per cent, it remained until the second half of 2012. Pakistan’s policy response to the crisis was largely dictated by the IMF programme, under which Pakistan was committed to adopt tight monetary and fi scal policies to restore macroeconomic stability. In response to sharply rising infl ation, the monetary policy was considerably tightened, which hurt private investment though its impact on infl ation remained muted as the latter was driven as much by supply bottlenecks as by demand pressures due to heavy government borrowing. Th e IMF agreement also required a sharp reduction in fi scal defi cits from 7.4 per cent of GDP in 2008-2009 to 4.2 per cent in 2009-2010 and further to 3.3 per cent in 2010-2011. Th e tight fi scal and monetary policies dictated by the IMF left little space for macroeconomic adjustments needed to revive the process of economic growth.
Key fi ndings Based on the foregoing discussion, three key fi ndings emerge. First, the Pakistani economy was vulnerable to external economic shocks due to its initial conditions, including macroeconomic and structural imbalances that acted as shock amplifi ers. Second, despite contractionary policies prescribed under the IMF programme, Pakistan failed to address macroeconomic imbalances due mainly to poor macroeconomic management. Th ird, the impact of the fi nancial crisis was considerably mitigated due mainly to some shock absorbers in the economy, including a sound fi nancial system, reliance on consumption rather than exports, and a healthy infl ow of remittances.
Rashid Amjad and Musleh ud Din

130
Pakistan’s vulnerability to external economic shocks stemmed from a high concentration of exports in cotton and textiles, heavy reliance on external fi nancing, high current account defi cits coupled with a de facto open capital account, low foreign exchange reserves and a weakening domestic currency. All these factors combined to make Pakistan especially prone to cuts in external fi nancing and a slack in global demand for cotton and textiles products. Th ough Pakistan’s macroeconomic policy response was constrained by the IMF programme, poor economic management was largely responsible for the failure to correct macroeconomic imbalances, which continued to pose a risk to the revival of economic growth. First, overdependence on monetary policy to contain the infl ationary pressures was a mistake. While a tight monetary policy stance failed to curb infl ation, it hurt the growth process by stifl ing private investment on the back of high interest rates. Infl ation remained stubborn as it was driven by high fi scal defi cits and supply bottlenecks, including unprecedented power shortages that crippled economic activity. Second, the fi scal policy response was insuffi cient, especially revenue generation, and mainly resulted in cuts in development expenditure that were critical to sustain economic growth. Given Pakistan’s adverse initial conditions, the impact of the crisis would have been much greater had it not been for some shock absorbers that helped contain the fallout from the crisis. First, a sound fi nancial system that was largely insulated from global fi nancial upheavals helped limit the transmission of fi nancial shocks to the domestic economy. Second, Pakistan’s reliance on domestic consumption rather than exports provided a cushion to the domestic economy against a slump in demand in the west. Th ird, Pakistan continued to receive healthy infl ow of remittances that provided a critical support to its balance of payments. Th e above discussion also helps to explain why Pakistan was unable to defl ect the crisis, as was done by its South Asian neighbours – most notably India and Bangladesh. Th e initial conditions in both India and Bangladesh were much healthier than in Pakistan. Th e macroeconomic situation in both the countries was characterized by robust growth, low fi scal defi cits, low infl ation, and comfortable current account and reserves positions. Th e strong macroeconomic fundamentals not only enabled these economies to withstand the external shocks but also provided them the necessary policy space to counter the potential adverse impacts of the crisis.
Pakistan
131
Concluding remarks Th e most pressing challenge facing Pakistan today is to break out of the current prolonged spell of stagfl ation. At the same time, there is a need to reduce vulnerability to emerging pressures on the balance of payments, especially when the global economic outlook continues to be uncertain with the United States still in a phase of slow recovery and the eurozone taking a hit on account of the debt crisis of some of its members. Pakistan has endured a series of supply shocks resulting from consecutive fl oods, unprecedented energy shortages, and a diffi cult domestic security situation. Consequently, economic growth remains below potential and is unlikely to pick up unless reforms are undertaken to remove supply side bottlenecks, especially the alleviation of energy shortages. Recent research (Malik, 2012) has shown that the roots of the energy crisis lie in poor governance, indicating that the problem can be mitigated to a signifi cant extent by bringing about improved economic management in the energy sector. Pakistan needs to grow at 7-8 per cent per annum to provide employment opportunities to its growing labour force, and this is possible only if structural reforms are undertaken to put the economy on a higher growth trajectory on a sustained basis (Pakistan, Planning commission, 2008). Tackling infl ation is another important challenge. Although infl ation has moderated in the recent period, infl ationary pressures persist, especially at a time when domestic oil prices have increased and domestic currency has weakened considerably. On the external front, with weakening exports, Pakistan’s balance of payments have come under pressures which are likely to intensify as loan repayments to the IMF become due. Worse still, the global economic outlook does not present a very optimistic scenario as the United States is still struggling to recover while the eurozone is mired in a fast spreading debt crisis that threatens the very survival of the euro itself. In this scenario, deft macroeconomic management would be required to protect the economy from adverse external shocks. To move the Pakistan economy out of the maelstrom requires a three-pronged strategy focussed on macroeconomic management, structural reforms, and drivers of economic growth. First, prudent macroeconomic management is essential to put the economy on the path of sustainable growth. Th ere is an urgent need
Rashid Amjad and Musleh ud Din

132
for a better coordination between fi scal and monetary policies to restore macroeconomic balance and secure price stability. Th ough government borrowing from the central bank has been curtailed in recent months, the Government has resorted to borrowing from the commercial banks that are accompanied by massive liquidity injections by the central bank. Th is practice tends to crowd out private investment while making it diffi cult for the monetary policy to control the rate of infl ation. Also, there is a need to carefully calibrate monetary policy to balance the objectives of price stability and economic growth. Second, Pakistan has been unable to implement key structural reforms due mainly to a lack of political consensus. Th ere is, therefore, an urgent need to develop a consensus on reforms paving the way for the implementation of much needed reforms in all segments of the economy especially resource mobilization, restructuring of the State-owned enterprises, and the energy sector. In particular, the inability of the Government to raise suffi cient revenues has been the root cause of Pakistan’s economic troubles and there is thus an urgent need for reforms in the taxation system including the introduction of Reformed GST, removal of poorly targeted subsidies, and restructuring of the State-owned enterprises to curtail their huge losses. Th ird, there is a need to undertake critical public investments particularly in infrastructure, energy, and human resource development which are important drivers of economic growth. Th e fact that the public sector development programme has been curtailed in recent years in eff orts to restore fi scal discipline does not augur well for the country’s long term competitiveness. Th ere is a need to channel public spending towards more productive expenditures to foster productivity growth on a sustained basis.
Pakistan

133
Chapter 7
Republic of KoreaKyungsoo Kim
Financial globalization makes peripheral countries, especially small open economies with deep international fi nancial linkages, vulnerable to credit shocks originating from the core countries. Regardless of their economic fundamentals, many emerging market countries (EMCs) were severely hit by the global fi nancial crisis. In fact, one may even say that fi nancial globalization has led to collateral damage, instead of the collateral benefi ts promised earlier (Kose and others, 2006). Th e Republic of Korea is a good example. Th is vulnerability has two specifi cs. One is the so-called capital infl ows problem – that is the vulnerability of the economy and its fi nancial system to massive capital infl ows which could be suddenly stop. Th e other is the potential for high volatility in the foreign exchange (FX) market. Th e capital infl ows problem may be characterized by procyclicality, aperiodicity, and the risk of currency and maturity mismatches. Since the Asian fi nancial crisis, countries in the region assigned high priority to building their foreign exchange reserves. However, simply relying on self-protection is either too costly or even impossible. During the global fi nancial crisis, as Aizenman and Sun (2009) accurately described, many central banks instead of releasing foreign reserves to stabilize their FX markets, were forced to balance the ‘fear of fl oating’ and the fear of losing reserves. Procyclicality emerges through various channels, such as asset price infl ation, real exchange rate appreciation and lending booms. Th is chapter emphasizes the role of central banks in injecting liquidity into the fi nancial system. When surges in capital infl ows are intermediated into local-currency-denominated liabilities, an active maturity transformation is

134
expected: borrowing short and lending long. In order to maintain current monetary policy stances, central banks tend to accommodate credit booms. Th e Republic of Korea’s fi nancial data strongly supports the fi nancial procyclicality hypothesis (Kim, Kim and Park, 2010), which is also confi rmed by international panel data (Kim, Kim and Park, 2011). Th e implementation of interest-rate-oriented monetary policy frameworks fosters fi nancial procyclicality. Aperiodicity of massive capital infl ows makes it hard for policymakers to deal with the capital infl ows problem (Kaminsky, Reinhart and Végh, 2004). While the capital infl ows problem can be easily identifi ed ex-post; it is diffi cult to predict ex-ante. Accordingly, prudential measures, including a fi nancial safety net, should aim at alleviating the costs of a crisis rather than preventing the crisis. However, prudential measures are much easier said than done because they may be easily evaded or yield unintended consequences. In this context, identifying systemically important fi nancial institutions (SIFIs) is what matters the most. In addition, the diffi culties of participants in an FSN scheme to diff erentiate bad luck from bad policy in countries requesting assistance may make them reluctant to contribute much, which could make the size of the scheme smaller than optimal. Nevertheless, in the context of massive capital infl ows that are aperiodic, procyclical, and accompanied by the risk of currency and maturity mismatches, alternative options to preserve fi nancial stability may come only at the cost of fi nancial repression.
Structural underpinnings Th e Korean economy used to recover fast from past crises, such as the fi rst and second oil shock of the 1970s and 1980s, the external debt crisis of the 1980s and the Asian fi nancial crisis in the 1990s. Th e reason is that shocks to the Republic of Korea’s economy sharply depreciated the won (KRW), and the exchange rate deprecation combined with aggregate demand contraction led to huge trade surpluses. Aft er the recovery of the export industry, consumption recovered as well, aft er a certain time lag. However this traditional cycle became less apparent in recent times because of the country’s deindustrialization, characterized by the loss of over a million manufacturing jobs over the last two decades. Relative to the advanced countries, deindustrialization in the Republic of Korea has proceeded in a short period of time. As a result, the services industry never
Republic of Korea

135
had an opportunity to restructure and ended up with overemployment and ineffi ciency. Although manufacturing represents a high share of the GDP, 30.6 per cent compared to 58.2 per cent for services in 2010, in the same year the services industry employed four times more workers than manufacturing. According to a study by the Bank of Korea, it took 30 years, on average, for developed countries to decrease the share of employment in manufacturing by 10 per cent, but for the Republic of Korea it took only 14 years, which implies that the deindustrialization of employment has been over twice as fast (Bank of Korea, 2007). Because of the country’s deindustrialization, the global fi nancial crisis has left deep scars on the Republic of Korea’s economy. Th e reason is that the services sector remained stagnant, even when manufacturing exports recovered. Th e consequence has been stagnant employment growth and a limited number of decent jobs available, which have led to a bigger gap in income and increasing polarization. A lower growth rate of GNI led to declining domestic demand, which had a detrimental eff ect on the services sector. When the crisis occurred, the exchange rate skyrocketed and caused a deterioration of the purchasing power of the population, resulting in drop of the real GNI growth. Th e impact of such drop was concentrated on consumption expenditure, the most important component of domestic demand, in which the service sector heavily relies on.
Th e Republic of Korea’s economy aft er the global fi nancial crisis In addition to the problem of deindustrialization mentioned above, an equally important factor leading to a weaker recovery from the global fi nancial crisis is increasing levels of household debt. Financial liberalization aft er the Asian fi nancial crisis made consumer fi nance very popular, and household debt has grown continuously since 2000. Th e ratio of household debt-to-disposable income, an indicator of household's capacity to service debt, climbed to 155 per cent in 2010 from 130 per cent in 2005, and is the highest among the OECD countries. Since 2002, household debt has depressed consumption. In the Republic of Korea, mortgage loans account for the most important household debt. Th e share of mortgage loans in household loans by banks had also sharply increased from 60.9 per cent in 2007 to 65.9 per cent in 2010 (Igan and Kang, 2011), and of the 67.8 trillion won increase in household loans supplied by
Kyungsoo Kim

136
the banking sector, 93 per cent consisted of mortgage loans. Considering that the household debt usually causes real estate prices to rise, the Republic of Korea’s Government reacted to control household debt. In September 2002, the Government introduced loan-to-value ratio regulation which limits the mortgage loans to a certain proportion of the property value. In August 2005, it introduced a debt-to-income ratio regulation that interlocks mortgage loan into the borrower’s income. However, there is no clear-cut evidence that these regulations contributed to control the growth of household debt. Th e fundamental reason for the increase in household debt may be found in the prolonged period during which interest rates remained low. From September 2008, the Bank of Korea’s policy rate lowered to 2 per cent from 5.25 per cent and stayed at that level for 17 months, which was unprecedented. From November 2009, based on the policy rate, the real interest rate remained negative. Too long and too low interest rates probably encouraged the relentless increase in household debt. Th is policy may also have caused infl ation as a side eff ect. From the fourth quarter in 2010, infl ation which refl ected higher import prices and food prices spread to core infl ation. While rising infl ation has a positive eff ect on employment, it leads to depressed real wages. Household debt and infl ation limit options for monetary policy. In order to reduce infl ation, the policy rate should be increased, but a policy rate hike would aggravate the debt burden. While it is important to reduce infl ation, it is equally important for the real interest rate not to overshoot. Th e importance of the coordination of monetary and fi scal policies cannot be overemphasized because government spending is a signifi cant factor that can fi ll in for a decreasing share of consumption expenditure. Th e Government’s role in mitigating social disparities aft er the Asian fi nancial crisis was important, and government expenditures continue to increase aft er the global fi nancial crisis.
Th e capital infl ows problem Procyclicality is the most notable feature of the capital infl ows problem. Regardless of the level of income and the size of nations, net capital fl ows are strongly correlated with the business cycle. Of course, not all capital fl ows are procyclical. While portfolio investment and banking sector’s external borrowing tend to be highly procyclical, foreign direct investment
Republic of Korea

137
(FDI) is less so (Contessi, DePace and Francis, 2008). Small open economies with deep international fi nancial linkages, such as the Republic of Korea, are more likely to suff er from severe procyclicality. According to Schindler’s (2009) de jure fi nancial integration index of 91 countries from 1995 to 2005, the Republic of Korea ranked 44th. In Asia, the Republic of Korea is the third most widely open country aft er Hong Kong, China, and Japan, and its ranking exceeds that of the United States (47th).
Table 7.1. Flow of foreign exchange funds
Th e Republic of Korea’s foreign currency fl ow of funds in 2007 and 2008 are reported in table 7.1. In 2007, foreign liquidity worth US$ 103 billion fl ew in. In that year, the Republic of Korea’s economy bore fresh
Uses of FOREX liquidity
Sources of FOREX liquidity
2007 2008 2009 2007 2008 2009External assets 27.8 -69.7 111.5 External liabilities 108.2 -16.1 42.6
General government
3.0 -10.6 0.8 General government
21.5 -10.6 23.1
Monetary authority
15.1 -56.4 95.8 Monetary authority
12.3 9.5 4.3
Banks 13.2 6.3 0.9 Banks 56.3 -23.5 4.3Others -3.5 -9.0 14.0 Others 18.2 8.5 11.1
Overseas direct investment
19.7 20.3 36.4 Foreign direct investment
1.8 3.3 2
Overseas equity investment
52.6 -7.1 2.1 Foreign equity investment
-28.9 -33.5 48.1
Financial derivatives
-5.4 14.8 3.1 Others 0.2 -0.2 -0.1
Other capital account
2.4 -0.1 -0.3 Current account
21.8 3.2 61
Other investment
8.2 -3.3 -5.3
Errors and omissions
-2.1 2.0 1.0
Total 103.1 -43.2 153.6 Total 103.1 -43.2 153.6Source: Author's calculation using data from Bank of Korea, Current Economic Issues, and Bank of Korea, Economic Statistics System.Note: All fi gures are in billions of US$.
Kyungsoo Kim

138
liabilities worth US$ 108 billion, or 10.3 per cent of the GDP, comprising of US$ 33.8 billion in the form of portfolio investment in securities issued by the Government and the monetary authority, US$ 56.3 billion of external borrowing by the banking sector and US$ 18.2 billion of external borrowing by the non-banking sector. Th at year, external assets increased by less than US$ 28 billion, US$ 15 billion of which were absorbed by the monetary authority as foreign reserves, and overseas equity investment by domestic residents set a record of US$ 52.6 billion. In 2008, aft er Lehman Brothers collapsed, the Republic of Korea’s economy fell into a rapid downturn cycle generated by a sudden stop and reversal of the massive capital infl ows of the previous year. Between 2008 Q4 and 2009 Q2, the year-to-year GDP growth rate was negative, and it reached and annualized value of almost -13 per cent. A massive deleverage of over US$ 43 billion or about 4.6 per cent of the GDP concentrated on the banking sector, which was not able to roll over its debt and had to pay back US$ 23.5 billion. In that context, the eff orts of the monetary authority to stabilize the foreign exchange markets by selling more than US$ 56 billion in foreign exchange appeared insuffi cient, but a central bank’s swap arrangement with the United States Federal Reserve was eff ective in stopping the attack on the won (Baba and Shim, 2011). Examining table 7.1, some important implications can be obtained. First, the capital infl ows problem may emerge regardless of the exchange rate system. It can be argued that FX market intervention, even if not in a large scale, can generate greater capital infl ows by providing an implicit guarantee on the stability of the exchange rate. But as noted by Valgreen (2007) for the case of Iceland, a country that ran pure fl oating rates and was exposed to huge foreign capital infl ows, fl exible exchange rates do not guarantee fi nancial stability either. Second, because of the mismatch between external assets and liabilities that takes place when capital infl ows are recycled into the domestic economy, the size of the gross capital infl ows is important – larger capital infl ows, larger mismatches. Capital infl ows are typically intermediated into local-currency-denominated liabilities. Figure 7.1 shows non-core, or non-deposit, FX and won liabilities of the Korean banking sector. With the deleveraging process started immediately aft er the collapse of Lehman Brothers, non-core FX liabilities shrank drastically. In addition, the deleveraging had a spillover
Republic of Korea

139
eff ect on the KRW credit market. Th is phenomenon, oft en referred to as a double drain, was unprecedented, and non-core KRW liabilities dried up even though the Bank of Korea aggressively reduced policy interest rates. Financial linkages between domestic and international banks, as discussed below, are behind this phenomenon.
Figure 7.1. Non-core liabilities of the banking sector in the Republic of Korea
Figure 7.2 illustrates the way in which foreign capital infl ows are intermediated through foreign exchange swap (FES) arrangements between a domestic bank (DBK) in the Republic of Korea and a foreign bank branch (FBB), the most important channel for injecting FX liquidity into the Korean fi nancial system. Borrowing from its head offi ce, FBB supplies dollars to DBK through a FES. Th en DBK engages in FX lending. In return, DBK funding from the wholesale credit market (WCM) supplies KRW to FBB and FBB invests in Treasury Bonds. Th erefore, the infl ow of foreign capital causes an increase in domestic credit. Th rough FES, both parties eff ectively borrow short term
0
50
100
150
200
250
300
350
400
450
2003 2004 2005 2006 2007 2008 2009
Trillion KRW
Non-core KRW liabilities
Non-core FX liabilities
Kyungsoo Kim
Source: Author's calculation using data from Bank of Korea, Current Economic Issues and Bank of Korea, Economic Statistics System.

140
assets and invest in longer term assets; thus a maturity transformation takes place.
Figure 7.2. Foreign exchange swap arrangements and maturity transformation
Source: Kim, Kim and Park (2011).
An important consequence of the massive maturity transformation that took place during the boom period was that the yield curve – which shows yields or interest rates across diff erent contract lengths (2 month, 2 year, 20 year, etc.) for a similar debt contract – fl attened. Th e reason is that with DBKs borrowing short term and FBBs investing in longer term assets there was an upward pressure on short-term interest rates and downward pressure on long-term interest rates. In this context, the central bank typically acts to reduce the gap between the short term rates and the policy rate through open market operations, in order to maintain its current monetary policy stance. Th rough open market operations, liquidity is injected into the system. Th erefore, monetary policy accommodates the credit shock – credit causes liquidity. Under what circumstances does the central bank maintain its policy stance and accommodates a credit shock? It happens when fi nancial cycles do
WCM DBK FBB
FX lending TB market
KRW
US$
US$
HQ
US$
KRW
KRW
Republic of Korea
141
not match with business cycles and the central bank is given the mandate to react to the business cycle, for instance by pursuing price stability, rather than to the fi nancial cycle. Infl ation targeting monetary policy is a good example. Using fi nancial data from the Republic of Korea, Kim, Kim and Park (2010) showed that monetary policy accelerated the procyclicality of capital infl ows. Th is is indeed the consequence of any form of interest-rate-oriented monetary policy framework. Kim, Kim and Park (2011), based on panel data collected from 14 countries specifi cally adopting fl oating exchange rate regimes and infl ation targeting monetary policy under the policy rate framework, verifi ed this fact.
Risk of currency and maturity mismatches In EMCs, currency mismatches are oft en accompanied by maturity mismatches, which could lead to a twin crisis (Kaminsky and Reinhart, 1999). Data for the Republic of Korea shows that there is a positive correlation between the growth in the external debt and the degree of maturity mismatches. But knowing this risk, why would the external debt increase so fast? And why it should be mostly short-term debt? Th ere are several logical explanations for heavy reliance on short term indebtedness. One is lenders’ concerns. Foreign lenders prefer short-term contracts, either to monitor debtors' actions (Jeanne, 2009) or to charge a higher risk premium on long-term bonds than on short-term bonds, making it cheaper for emerging economies to borrow short term (Broner, Lorenzoni and Schmukler, 2010). From the borrower’s point of view, short-term debt could provide fl exibility to switch to other lenders if borrowing conditions improve in the future (Mama, 2007). Or the reason could be related to moral hazard incurred by lenders and borrowers alike.
Dealing with the capital infl ows problem In the aft ermath of the global fi nancial crisis, various policy options have been considered to mitigate the impacts of future global fi nancial shocks, including fi nancial safety nets and macroprudential policy. Capital controls have also been reconsidered as an option for coping with surges in capital infl ows, though many observers suggested that they should be the last resort in a pecking order of policy arrangements (Ostry and others, 2010).
Kyungsoo Kim

142
Th ere have been many debates on the excessiveness of foreign exchange reserves (FR) accumulated by EMCs aft er the Asian fi nancial crisis. In retrospect there is no doubt that large accumulations of FR provided a fi rst line of self-defense against the deleveraging process initiated aft er the global fi nancial crisis. Th e size of the FR matters, however, and the benefi ts do not come without costs. For example, Rodrik (2006) argued that EMCs over-invested in the costly strategy of reserve accumulation and under-invested in capital account management policies to reduce their short-term foreign liabilities. His criticism may be best addressed by what the Republic of Korea experienced on the onset of the global fi nancial crisis. Judging from its foreign debt and asset structure as a whole, the economy of the Republic of Korea should not have suff ered a foreign liquidity shortage. However, because of the risks of currency and maturity mismatch concentrated in its banking sector, the FX liquidity of the Republic of Korea was highly vulnerable at the onset of the global fi nancial crisis, even when the country had the world’s sixth largest volume of FR. Th e link between hoarding FR and short term external borrowing is related to the Guidotti-Greenspan rule, according to which short-term external borrowings should be absorbed as FR. But such a rule may encourage banks to rely on short-term borrowing excessively. Indeed, empirical evidence suggests that FR and short term debt of the banking sector cause each other. Based on data from 46 EMCs over the period 2000-2007, Kim (2011) showed that aft er controlling for other macro variables, FR accumulation does not mitigate the risk of maturity mismatches, and it may accentuate the pro-cyclicality of capital infl ows. In addition, the Guidotti-Greenspan rule can cause moral hazard because the risks associated with borrowing or lending are socialized while the returns are privatized. In order for FR to be a useful buff er, prudential regulations should be imposed.
Macroprudential policy Although banks in EMCs engage in hedging activities, their economies as a whole are unable to hedge the risk of currency and maturity mismatches. Th erefore, an insurer of last resort, the central bank, should serve as a stopgap to prevent banks from being illiquid in times of crisis. In that case, the banking sector, the insured, should pay an appropriate premium to the central bank, the insurer. Without the payment of such a
Republic of Korea

143
premium, social and private optimality of external borrowing would not be the same. Alternatively, one could argue that private external borrowing creates a negative externality on domestic asset prices, or more broadly real exchange rates (Jeanne and Korinek, 2010; Aizenman, 2010). Instead of a risk premium, a Pigouvian tax that targets borrowing activities that cause negative spillover eff ects could mitigate the capital infl ows problem. Aft er the global fi nancial crisis the Government of the Republic of Korea strengthened FX-related prudential measures. Th ese measures included mandatory minimum holdings of liquid FX assets for banks and new standards for FX derivatives’ trading risk management. FX forward transactions of corporations were limited to a maximum of 125 per cent and later 100 per cent vis-à-vis physical trade to prevent excessive FX hedging. Government also introduced new ceilings on FX derivatives positions linked to bank’s capital and the use of FX bank loans has been restricted to overseas operations. Most recently, the Government of the Republic of Korea imposed the so called ‘Macro-prudential Stability Levy on non-deposit FX liabilities of the banking sector’. Although it is too early to assess the impact of such measures, at the time of writing the data suggests that they are eff ective (Bank of Korea, 2013). To eff ectively implement these macroprudential policies, it is necessary to identify systemically important fi nancial institutions (SIFIs) to which such policies would be applied. In the case of the Republic of Korea, FBBs are important agents supplying foreign liquidity and, therefore, they should be considered SIFIs. Th e prudential measures imposed on FBBs will defi nitely discourage their short term external borrowings. However, their head offi ces may circumvent these regulations by engaging directly in transactions with DBKs, thus exploit the regulatory arbitrage created by such a levy. To avoid this problem, the head offi ces should also be identifi ed as SIFIs. Another issue related to prudential measures is capital controls. Prudential measures are intended to strengthen the resilience of the fi nancial sector to prevent excessive risk-taking and to limit systemic risks, while capital controls aim at reducing cross-border movements of capital. Th e diff erence is that FX-related prudential measures discriminate according to the currency while capital control measures discriminate based on the residency of the parties to the transaction.
Kyungsoo Kim

144
During 2009-2010, the economy of the Republic of Korea ended up with an enormous current account surplus of US$ 61 billion, which can be seen as typical of the macroeconomic adjustment made in the wake of the global fi nancial crisis. Furthermore, unlike the period preceding the crisis, the accumulation of external assets was much greater than external debts. Th ank to country’s macroprudential measures, the banking sector’s external debts diminished signifi cantly. In the three years between the third quarter of 2008 and the third quarter of 2011, the short term external debt borne by the banking sector shrank by a third, while foreign investors’ portfolio investment expanded. If this shift is the result of market reactions to the prudential measures on the banking sector, we can say that these measures proved to be eff ective.
Collective FSN Th e international fi nancial market is less integrated than the domestic fi nancial market, and there is no supranational legal authority overlooking cross border contracts. Th erefore, the binding constraint of international debt repayment is the willingness rather than the ability to pay, which makes international debt contract incomplete (Eaton and Gersovitz, 1981). A more complete international debt contract would be possible to arrange if bad luck was distinguishable from bad policy. In such a case, debt restructuring contingent on bad luck with good policy could make both creditors and debtors better off . According to Jeanne (2009), the verifi ability of policy quality could be enhanced by appropriate collective action at the international level. In that respect, the pre-arranged lending programme introduced by the IMF in March 2009 called “fl exible credit line” (FCL) aims at improving the verifi ability of policy quality of countries with strong track records but faced with balance of payments pressures and could protect them from contagion in the event of a global fi nancial crisis. As for regional fi nancial arrangement (RFA), the Chiang Mai Initiative Multilateralization (CMIM) established in 2010 is a self-managed reserve pooling arrangement of worth US$ 240 billion which includes a surveillance secretariat, the ASEAN+3 Macroeconomic Research Offi ce (AMRO). Notwithstanding their usefulness, the size of collective FSN such as IMF funds and RFAs has remained constant as a share of GDP but declined drastically compared to the size of the external shocks (IMF, 2011b). As a
Republic of Korea
145
result, the accumulation of FR is still the most important insurance against global liquidity shortages, and reform on global FSN is very much needed. However, such reform is diffi cult because EMCs and mature market countries’ (MMCs) have diff erent interests. Th e latter want a well-functioning FSN in order to reduce the demand for foreign reserves as self-protection and, therefore, contribute to global rebalancing. However, a well-functioning global FSN needs to limit moral hazard, which would require imposing verifi able guidelines for sound policy for borrowers, which is unpopular among EMCs. As a result, the accumulation of foreign reserves may continue to be the preferred option for EMCs, leaving exchange rate adjustments as the second best option for MMCs.
Concluding remarks Accumulating foreign reserves, macroprudential measures, and collective fi nancial safety nets are key options for managing large capital infl ows. Th e accumulation of foreign reserves is an important way of self-protecting against deleveraging. But it causes signifi cant costs and without accompanying prudential measures, it may risk provoking even larger capital infl ows. Collective fi nancial safety nets can be useful substitutes for foreign reserves, even though they may be less than perfect. Properly designed and implemented prudential policies should alleviate the risk of short term external borrowing. To that extent, the economy can be less dependent upon an insurer of last resort - the role of the monetary authority in providing FX liquidity in times of crisis. However, such prudential measures should be well designed, correctly implemented and minimal in distortion. Otherwise, they could prevent domestic fi nancial market system from functioning properly and bring about only short-term relief at the cost of the longer-term benefi ts of an effi cient fi nancial system. In addition, in order for macroprudential regulations to work well, regulatory arbitrage among countries should be minimized. For that purpose, it is essential that national regulatory frameworks are consistent across borders. Inconvertibility of the EMC currency lies at the root of the capital infl ows problem. It makes it diffi cult to hedge exchange risk at the national level, and a country with deep international fi nancial linkages should accumulate exorbitant amount of foreign reserves. Besides, the country is exposed to an exorbitant volatility of exchange rates in the presence of various shocks when
Kyungsoo Kim
146
it is unable to hedge its debt. Naturally, currency internationalization should be the fi nal destination of capital infl ows management. Recently in an attempt to curb excessive foreign currency debt the Government of the Republic of Korea has implemented policy measures on the banking sector such as introducing new ceilings on FX derivatives positions and imposing macro-prudential stability levy on FX borrowing by banking sector. It is too early to assess the impact of such measures accurately but as of now the data suggests that they are eff ective. Foreign currency debt of the banking sector has been visibly reduced. Instead, portfolio investment has increased. However, past experiences of capital regulation in many countries suggest that despite signs of an improvement in the short-run there is little room for complacency in the medium- to long-run. In a country like the Republic of Korea, where industry is the engine of economic growth, the potential demand for FX hedging is enormous. Without currency internationalization the country would suff er even more from the capital infl ows problem in the future.
Republic of Korea

147
Chapter 8
Th ailandBoonchai Charassangsomboon and Pisit Puapan
Th is chapter analyses Th ailand’s experiences during the global fi nancial crisis of 2008-2009 and during the fl ood crisis of late 2011. Given that Th ai economy relied signifi cantly on external demand, it was negatively aff ected by the adverse external environment arising from United States sub-prime fi nancial crisis and the subsequent global economic slowdown that took place in late-2008 and the fi rst half of 2009. As a result, Th ailand’s GDP contracted by 4.1 per cent in the 4th quarter of 2008 and a further 6.1 per cent in the fi rst half of 2009. But despite these large economic contractions, the Th ai economy recovered rapidly in the second half of 2009, supported by government stimulus policies as well as by the gradual recovery of the global economy. Major government policies implemented to stimulate the domestic economy were a mid-2009 supplementary budget worth 1.1 per cent of GDP and the Strong Th ailand Investment Programme worth THB 1.3 trillion or 14 per cent of GDP. Moreover, unlike during the Asian fi nancial crisis that erupted in Th ailand in 1997, the country was well-positioned to cope with economic volatility because of its strong economic fundamentals and sound fi nancial system. Strong economic fundamentals and external sector resiliency in Th ailand can be attributed to accumulated current account surpluses and high levels of international reserves. On fi scal policy, the Th ai Government had maintained strong fi scal discipline, which resulted in low public debt levels prior to the global fi nancial crisis and allowed for fi scal space to pursue expansionary fi scal policy in response to the crisis. Th e country’s sound

148
fi nancial and banking systems at the time of the crisis was the result of eff ective supervision and good management practices, which were refl ected in a low level of non-performing loans (NPL) and a high capital base. Moreover, domestic commercial banks had a minimal exposure to toxic foreign assets. A few years aft er the 2008-2009 global economic crisis, another shock hit the Th ai economy, this time arising from severe fl ooding across the northern and central plains of Th ailand during the second half of 2011. Th e adverse impacts of the fl oods were felt in the manufacturing, construction and tourism sectors and caused a 8.9 per cent contraction of the GDP in the 4th quarter of 2011. In order to prevent future fl ood crises, the Government announced investments in water resource management projects worth over THB 350 billion and a THB 2.27 trillion public investment programme over the 2012-2016 period.
Th ailand’s experience during the global fi nancial crisis Th e global fi nancial crisis of 2008-2009 was the second major economic crisis that aff ected Th ailand over the past decade. Th e fi rst economic crisis of 1997-1998 was home-grown resulting from years of economic bubbles, an inappropriate policy framework, and inadequate fi nancial regulation, but the second major crisis came as an external shock to the Th ai economy. Given the severity of the domestic crisis of 1997-1998, the level of production took over 5 years to recover its pre-crisis level. However, the impact from the second crisis arising from United States fi nancial woes was far more short-lived. Its damaging eff ects were felt mostly in the export sector, particularly during the 4th quarter of 2008 and the fi rst three quarters of 2009, during which exports contracted by an average of 15.5 per cent year-on-year, but the economy recovered briskly during 2010. Th ailand is a small open economy highly dependent on foreign trade and investment. Th us, it is not immune – or “decoupled” – from the ill-eff ects of the global fi nancial crisis. Th e issue is how the eff ects from the global fi nancial crisis transmitted to the domestic economy. When the subprime market melt down took place, it fi rstly aff ected major fi nancial institutions in the United States and Europe, creating a credit-default shock to the fi nancial markets, followed by a sudden decline in global stock markets, and fi nally resulting in a contraction of the real sector’s output of industrialized countries. In general, Th ailand was mostly spared in the fi rst round of the
Th ailand

149
economic shock of late 2007, when the United States sub-prime mortgage problems started to emerge aft er the decade-long United States housing bubble burst in the second half of 2006. At that time, it became evident that major United States-based fi nancial institutions that were directly exposed to sub prime lending had fi nancial problem. Fortunately, only few Th ai fi nancial institutions held such fi nancial instruments; therefore, the initial impact of the crisis was not felt in Th ailand in 2007 and much of 2008 except for periodic gyrations of domestic fi nancial markets. However, the meltdown of Lehman Brothers and the spread of fi nancial and credit crises around the world in September 2008 ignited a devastating impact on the global economy, and Th ailand was also severely aff ected. Initially, during the 4th quarter of 2008, Th ailand’s fi nancial and stock markets became volatile and fell dramatically, as a result of a retreat of foreign funds worth more than US$ 2 billion. Subsequently, Th ailand was aff ected by real economic shocks emanating from its trading partners. Th e Th ai economy started to experience a sharp contraction in its exports aft er November 2008. As a result, economic growth contracted by 4.1 per cent in the last quarter of 2008, lowering the overall rate of growth for 2008 to 2.5 per cent. Th e real sector worsened with a deep decline in early 2009. GDP growth dropped by 7.0 per cent in the fi rst quarter, by 5.2 per cent in the second quarter and by 2.8 per cent in the third. Despite a recovery in the last quarter, with 5.9 per cent growth, Th ailand’s economic growth in 2009 contracted by 2.3 per cent, the fi rst economic contraction since the Asian fi nancial crisis in 1998. Since the Asian fi nancial crisis, Th ailand’s economic expansion has become even more dependent on its external sector, with international trade, measured as export plus import, reaching over 120 per cent of the GDP in recent years. Aft er the initial shock from the global fi nancial crisis in late 2008, the volume of exports of goods and services experienced a large reduction of minus 9.3 per cent in the last quarter of 2008, while the volume of imports of goods and services recorded a low expansion of merely 2.2 per cent. Th ese fi gures represented a substantial decline from the previous quarter, during which export and import volumes grew by 9.8 per cent and 15.4 per cent, respectively. In terms of value, the country’s export fell 14.2 per cent between 2008 and 2009, while imports fell 25.3 per cent. Much of the trade contraction concentrated on industrial products, particularly electronics and electrical
Boonchai Charassangsomboon and Pisit Puapan

150
components, and automotives and vehicles, and exports to traditional markets in the United States, Europe and Japan were hit the most. Private consumption in Th ailand was also negatively aff ected by the global fi nancial crisis. With the falls of external sector’s revenue, private consumption expenditure contracted in most of 2009. Indeed, private consumption was able to grow moderately at a rate of 2.2 per cent in the last quarter of 2008, but it started to contract at -2.1 per cent in the fi rst three quarters of 2009. It started to recover in the last quarter of 2009, when it grew 1.6 per cent. Favourable factors for this improvement include early signs of global economic recovery, a gradual rise of farm income as a result of price increase for agricultural products, and boosting consumer confi dence due to the approval of the Government’s fi rst stimulus package worth approximately 1.1 per cent of GDP and comprising cash transfer programmes and other quick-disbursing projects to the needy and low income groups. Private investment was hit hard by the global fi nancial crisis of 2008-2009. In the fourth quarter of 2008 it contracted 3.4 per cent, and over the four quarters of 2009 it contracted 19.1 per cent, 15.3 per cent, 11.3 per cent and 6.2 per cent, respectively, resulting in an average drop of 13.1 per cent in 2009. Investment in machinery and equipment contracted the most, 15.3 per cent, while investment in the construction sector contracted by -5.1 per cent. On the production side, the most severely aff ected sector was manufacturing, which contracted 6.9 per cent in the fourth quarter of 2008 and 6.1 per cent over 2009, the fi rst year manufacturing experienced negative growth since 1998. Because the manufacturing sector is the largest component of Th ailand’s GDP, its decline hit the Th ai economy hard. However, the traditional agricultural sector was able to withstand the impact from the global crisis by growing at a moderate rate of 1.3 per cent in 2009. Th e global fi nancial crisis of 2008-2009 aff ected employment. Th ailand’s labour force was growing at an annual rate of around 1.5 per cent before the crisis, but the growth rate was minus 1.9 per cent in the last quarter of 2008 and the situation worsened during the fi rst two quarters of 2009 before a mild recovery in the third quarter of that year. Th ailand’s unemployment rate has usually fl uctuated between 1 and 2 per cent, but it reached 2.3 per cent or 900,000 unemployed persons in early 2009. However, employment conditions quickly improved with the economic recovery in the fourth quarter of 2009, and the unemployment rate returned to a normal
Th ailand
151
level of 1 per cent by the end of 2009. Employment data suggests that the global fi nancial crisis aff ected most people in the manufacturing and services sectors and less in the agricultural sector. As far as the fi nancial sector is concerned, the global fi nancial crisis had impacts both on international fi nancial assets held by fi nancial institutions in Th ailand and on fi nancial markets. Th e former impacts were low because Th ai fi nancial institutions have very low exposure to foreign assets. At the end of October 2008, the value of commercial banks’ foreign securities stood at US$ 2.4 billion, which accounted for only around 1.2 per cent of their total assets. Among these foreign assets, banks invested largely in safe and liquid foreign sovereign bond, and their exposure to risky debt securities such as collateralized debt obligation (CDO) was only 0.04 per cent of the total banking assets. Moreover, Th ai banks were well-capitalized with a capital ratio of 15.7 per cent, well above the minimum capital requirement of 8.5 per cent. As a result, Th ailand’s banking system experienced very small direct negative impact from global fi nancial crisis. Moreover, Th ai commercial banks had a sound fi nancial condition, with low outstanding NPLs. Th e second channel of crisis impact was the capital market, which had been more severely aff ected. Foreign portfolio investment outfl ows from Th ailand amounted to US$ 5.3 billion during the fi rst half of 2009, which resulted in a decline in the Stock Exchange of Th ailand (SET) market capitalization from 7 trillion baht in October 2007 to 3.2 trillion baht in November 2008.
Money and foreign exchange Aft er the collapse of Lehman Brothers in September 2008, which shocked global fi nancial markets, the money market in Th ailand faced a minor liquidity tightening. As Th ai banks were in a strong fi nancial position, with minimal exposure to foreign toxic assets, worries lied on the general liquidity situation rather than on risks emanating from bad bank assets. Th ese worries led to an increase in the interbank rate of between 40 and 60 basis points between September and November 2008, while the interbank spread over the rate of government Treasury bills was between 20 and 100 basis points between July 2008 and April 2009. Th e liquidity situation returned to normal by the middle of 2009, as the Bank of Th ailand pursued an accommodative monetary policy.
Boonchai Charassangsomboon and Pisit Puapan

152
Th e impact of the crisis on liquidity was small because there was excess liquidity in the Th ai banking system and banks did not need to rely on foreign money. Indeed, the ratio of loans-to-deposits was less than 0.9 in 2008 and 2009 compared to 1.2 in 1997. Th e capital outfl ows largely came from the panic sale of US$ 2 billion in stocks during the fi rst 3 quarters of 2008. Because of the comfortable level of liquidity in the banking system and the country’s large amount of international reserves, over US$ 105 billion, the capital outfl ows during the crisis had trivial impacts on liquidity in the money and foreign exchange markets. Between 2006 and mid 2008, the value of the baht kept strengthening from 40 per United States dollar to 32 due to the country’s strong macroeconomic conditions and capital infl ows caused by yen carry trades. Starting in April 2008, however, the weakness of United States fi nancial institutions caused massive withdrawals of capital from Asia, which resulted in a weakening of the baht to 34.3 by September 2008. Although the baht weakened vis-à-vis the United States dollar, its value moved in line with other currencies in the region. Th e main reason is that Th ailand faced fewer capital outfl ows than other Asian countries such as the Republic of Korea. In addition, the Bank of Th ailand successfully managed and limited the volatility of Th ailand’s currency. However, the risk appetite of international investors recovered since May 2009, leading to capital infl ows into Th ailand’s stock market and an appreciation of the baht to 33.3 per United States dollar by December 2009. Between July 2007 and July 2008, the monetary policy rate, the one-day repurchase rate, was kept low at 3.25 per cent to stimulate the economy, but it was raised to 3.75 per cent between July and August 2008 to slowdown rising infl ation caused by commodity price bubbles. In October 2008, the monetary policy committee maintained the policy rate amid infl ation concerns, in spite of the global fi nancial crisis, but on 3 December 2008, the policy rate was sharply cut down by 1 per cent to 2.75 per cent in order to aggressively respond to global crisis, and it was subsequently cut until it reached 1.25 per cent in April 2009. Although Th ailand’s stock prices increased signifi cantly before 2008, the price-earnings (P/E) ratio was around 17 by December 2007, much lower than that of other Asian markets. By the end of 2008, the P/E ratio fell to 7. Th e lower stock valuations were caused not only by the global fi nancial crisis but also by local political instability.
Th ailand

153
Due to the relatively small market capitalization (a low 3.4 trillion baht during February-March 2009) and low liquidity, foreign investment has signifi cant impact on Th ailand’s stock market. Between January 2005 and June 2007, foreign investors came back to the Th ai market aft er their departure during 1997 Asian fi nancial crisis. During this period, foreigners had accumulated Th ai stock worth B 329 billion. However, between August 2007 and February 2009, foreigners dumped their equity investment in Th ailand worth 243 billion baht. As a result, the Stock Exchange of Th ailand (SET) index dropped from its peak of 884 points in May 2008 to the lowest point of 413 in March 2009 or 53 per cent decline. Th is indicated that although the crisis was originated in the United States, the global fi nancial crisis can severely hit Th ailand’s stock market due to the capital fl ight to safe haven and liquidity problems. While the direct impact of the global fi nance crisis on Th ai banks was minimal, the secondary impact caused by a sharp drop in exports was not too damaging. In light of the 1997-1998 Asian fi nancial crisis experience, domestic banks were worried about the decline in the quality of their loan portfolios resulting from the decline in demand in key sectors such as manufacturing exports and tourism. However, the rate of NPLs – which had been decreasing continuously since a peak of 45 per cent in 1998 – increased only slightly, from 5.3 per cent in the fourth quarter of 2008 to 5.5 per cent in the fi rst quarter of 2009. In addition, although the volume of loans to the corporate sector and to SMEs dropped in the 2nd and 3rd quarters of 2009, consumer lending including credit cards, mortgages and automobiles continued to grow despite the crisis. Overall, beside a slight decline in asset quality, Th ailand’s banking sector remained fi nancially healthy, and banks continued making profi ts during 2009 despite the drop in the country’s GDP.
Domestic supply shocks from the fl ood crisis in late-2011 Starting in June 2011, heavy fl ooding due to typhoons and persistent rainfall turned into a major economic and social crisis which aff ected fi rst northern Th ailand and subsequently the Chao Praya River basin and Bangkok. Th e impacts of the fl ooding were particularly severe in high-economic activity areas in the central region of the country, where hundreds of lives were lost, millions of people were displaced, public services were disrupted and critical infrastructure and production facilities were badly damaged.
Boonchai Charassangsomboon and Pisit Puapan

154
Th e agriculture sector faced severe negative impacts because the Central plains region is one of the most productive areas for farming in Th ailand. In addition, when the fl oods occurred major cereal crops were in the fi eld, with paddy rice at the initial- to mid-growing stage and maize at an advance critical fl owering stage. More importantly, fl ooding coincided with the peak of the tourism season in Th ailand, which triggered additional revenue loss. As a result of the fl oods, foreign tourist arrivals to Th ailand contracted by 4.7 per cent in the 4th quarter of 2011, in contrast to an expected growth of 10.5 per cent. However, the most damaging impact of the fl oods on the Th ai economy was due to the closures of seven industrial areas, which needed to halt manufacturing production for a sustained period of time. Japanese investments made up the bulk of these operations, and it was mostly specialized in two main sectors in which Th ailand had become a regional hub in the regional supply chain: auto parts & electronics. As a result, the fl oods caused a massive supply-chain disruptions resulting in shutdowns of major auto producers in other parts of Th ailand, such as the Eastern Seaboard, even though they were less aff ected by the fl oods. As far as electronic is concerned, Th ailand is the world’s second major producer of hard disk drives (HDD) aft er China, contributing one-fourth of the world’s total production. Th erefore, the fl ood disaster caused a 28 per cent quarter-on-quarter drop in the global HDD production in the 4th quarter of 2011, disrupting the global computer production supply chain. In the automotive sector, Th ailand is the main production base for auto exports in Southeast Asia, with an annual production capacity at 1.7 to 1.8 million units and exports of vehicles and auto parts worth over US$ 18.5 billion, which represents 9.5 per cent of the country’s total exports. Th us the fl ood crisis had a cascading eff ect on automotive assembly and production in Th ailand and elsewhere, forcing major auto conglomerates to cut production, particularly in Japan. Th e impact of the fl oods in Th ailand could be categorized into two types: (a) Damage of assets, such as housing and household goods, hospitals and schools, roads and bridges, ports and airports, etc. and (b) Losses of production caused both by the destruction of production capacity and by higher costs of production in agriculture, manufacturing, commerce, and tourism, as well as by higher operational costs and lower revenues in basic public services such as education and culture, health, electricity, water
Th ailand

155
supply, etc. Th e second type of impacts resulted in a 8.9 per cent drop of the GDP in the last quarter of 2008 and a modest growth of 0.1 per cent in the fi rst quarter of 2009. In addition to these GDP losses, damage to the major industrial bases in Th ailand, including seven industrial estates in Ayutthaya province, located north of Bangkok, which resulted in closures of hundreds of factories, damaged buildings and infrastructure facilities, were offi cially estimated at 1.3 trillion baht (US$ 42 billion) or 14 per cent of GDP.
Policy responses Initially, during the September 2008 panic in the United States fi nancial market, the Bank of Th ailand calmed down Th ailand’s banking system by providing suffi cient liquidity to the banking system and stabilizing the exchange rate. In response to the global demand slump, the Bank of Th ailand aggressively reduced its policy interest rate from 3.75 per cent to an unprecedented low level of 1.25 per cent by April 2009. Under the Bank’s infl ation targeting regime, the decision to reduce the policy interest rate was supported by less concerns about infl ationary pressures resulting from the dramatic fall of commodity prices and by the slowing down of economic activities during the crisis. In addition, the Th ai Government adopted Keynesian-style fi scal policy measures to urgently increase domestic demand and counteract the adverse impact of the crisis on exports. Th e Government’s fi scal policy response consisted on two stimulus packages, which are described below:
First stimulus package Th e fi rst stimulus package, which was announced in January 2009 and started to be implemented in March 2009, consisted of 3 components: increased spending, tax reduction measures, and fi nancial measures as follows:
Increased spending Th e Th ai Government announced a package worth THB 115 billion of supplementary spending in mid-January 2009. Th e key idea was that an eff ective fi scal stimulation required the Government to inject money as quickly as possible into low-income households because of their high propensity to consume extra income – which implies a high value for the fi scal spending
Boonchai Charassangsomboon and Pisit Puapan

156
multiplier. Th is option was considered better than increasing spending in public investment because of the oft en signifi cant delays in the disbursement of funds and in the implementation of public investment projects. Th erefore, the Government targeted consumption expenses of seven groups of people: farmers, low-income earners, parents, SMEs, community-based enterprises, senior citizens and self-employed. Th e fi rst group of projects included in the package aimed at reducing expenses and increasing disposable income. Among them, a free education project worth THB 19 billion paid the tuition fees, books, uniforms, and materials of 8.5 million students. Th e project expanded the number of years of free education from 12 years to 15 years by adding 3 years of pre-school education from May 2009. Low-income earners making THB 15,000 or less per month received a one-time cash handout of THB 2,000. Th e total cost of this cash transfer, the fastest way to increase spending via private consumption, was about THB 18 billion baht. Senior citizens over 60 without a pension programme received a THB 500 monthly living allowance. Th is programme provided benefi ts to about 5 million senior citizens and had a total cost of THB 9 billion. In addition, THB 13 billion were allocated for temporarily cutting the cost of living of low-income households by providing 6 months of free electricity and water supply for small levels of monthly consumption, as well as free bus and train rides. Th e second group of projects aimed at improving public infrastructure in rural villages. THB 2 billion, THB 1.5 billion and THB 1 billion were provided, respectively, to small water resource development projects, asphalt road projects of 490 kilometres and village health centres development projects. Th e third group of projects aimed at increasing the productivity of unemployed workers. It included a training programme for unemployed workers worth THB 6.9 billion. Th is programme covered 240,000 unemployed workers and off ered over 100 training programmes as well as a THB 5,000 living allowance per month. Th e fourth group of projects supported community development and community-based enterprises through the THB 15 billion Suffi ciency Economy Village Fund. Under this project, the Government distributed THB 1 million for villages to fi nance their own projects. Th e Village Fund, which supports fi scal decentralization, aims to promote grass roots participation in the fi scal decision-making process.
Th ailand

157
As far as the impacts from Th ailand’s fi scal stimulus package, the Ministry of Finance estimated that every THB 100 billion increase in government spending would generate positive economic impact of 1.0 per cent of GDP compared to the baseline. Th e transmission mechanism is described in fi gure 8.1.
Figure 8.1. Transmission mechanism of stimulus package 1 (SP1)
Source: Fiscal Policy Offi ce, Ministry of Finance, Th ailand.
Tax reduction On 20 January 2009, the Government announced a THB 50 billion tax reduction plan to complement its proposals to increase spending. Th is plan targeted home owners, SMEs, community enterprises, and tourism operators. To increase new home purchases in 2009, the Government increased the income tax deduction on new home purchases from THB 100,000 to THB 300,000. In addition, the Government announced that the tax rate and registration fee for property transfers would be reduced. Th ese two measured are estimated to have stimulated the purchase of 50,000 new homes but resulted in a THB 36.5 billion decline in government revenues. Th e benefi ciaries of these measures are home buyers, property developers, construction material producers, banks, and construction workers. In addition, the Government aimed at reducing the tax burden for SMEs, community enterprises, small hotels and debt restructuring fi rms by increasing the minimum corporate taxable income from THB 60,000 baht to THB 1 million per year. Moreover, income tax deductibles for corporate training activities and seminars held in Th ailand increased from 100 per cent
Publicconsumption
Disposableincome
Publicinvestment Employment
Privateconsumption
GDP 1%
Import
Additionalrevenue atevery THB100 billion
Expendituremeasures,e.g., directinvestmentand income
transfer
MPC1.0
Boonchai Charassangsomboon and Pisit Puapan

158
to 200 per cent of the spending on training in order to promote local tourism. Given the low number of foreign tourists visiting Th ailand during the global fi nancial crisis, hotels and resorts were available for training activities and seminars. Th e Ministry of Finance estimated that every THB 10 billion in tax reduction would generate a positive economic impact of 0.06 per cent of the GDP, compared to the baseline. Th e transmission mechanism of tax measures is summarized in fi gure 8.2.
Figure 8.2. Transmission mechanism of tax measures
Source: Fiscal Policy Offi ce, Ministry of Finance, Th ailand.
Quasi-fi scal policyTh e Government also implemented quasi-fi scal policy measures
through its public fi nancial institutions. For farmers, the Government not only planned to spend about THB 150 billion from regular budget to support prices of agriculture products such as rice, corn, rubber, tapioca, fruits and palm, which faced sharp declines, but also increased the fi nancial support for its agricultural bank so that it could provide additional loans worth THB 110 billion. For SMEs and exporters, the Government provided credit guarantees
GDP 0.06%
Import
Privateconsumption
Publicinvestment Employment
Disposableincome (Y-T)
Retainedearning
Privateinvestment
Inventories
MPC1.0
Incomemeasure,e.g. tax
measures
Taxrevenue
lostTHB 10billion
Th ailand

159
to encourage more bank lending. Th e Ministry of Finance estimated that every THB 300 billion increase in domestic credit would generate a positive economic impact of 0.2 per cent of GDP compared to the baseline. Th e transmission mechanism of quasi-fi scal policy can be described in fi gure 8.3.
Figure 8.3. Transmission mechanism of credit measures through SFIs
Source: Fiscal Policy Offi ce, Ministry of Finance, Th ailand.
Figure 8.4. Total eff ect of SP1 on GDP growth
Creditmeasuresthrough
SFIs
Increasein creditline at
THB 300billion
Debt payment/restructuring
Publicinvestment Employment
Import
Disposableincome
PrivateconsumptionLiquidity
creation
CreditfromSFIs
MPC
Privatedecision
Confi dence
GDP 0.2%
2009 Mid year budget
Tax measures
Credit measures
SOE capital budget
Municipal budget
Overlapping budget year
Mega projects
Government budget
1
2
3
4
5
Instant disbursement THB 100 billion
Impact on GDP
Tax refund with every THB 10 billion
Increase in credit line for THB 300 billion
Higher disbursement rate for everyTHB 25 billion
Pushing forward a project for everyTHB 25 billion
0.1%annually
0.1%annually
0.1%annually
0.2%annually
0.06%annually
Source: Fiscal Policy Offi ce, Ministry of Finance, Th ailand.
Boonchai Charassangsomboon and Pisit Puapan

160
In summary, the impact of fi rst stimulus package on the economy can be summarized in fi gure 8.4, which shows that the GDP would increase 1.5 per cent annually in addition to the baseline scenario.
Second stimulus packageIn mid-2009, the Government announced a second stimulus
package, referred to as the “Strong Th ailand Programme” or, more informally, as SP2. Th e bulk of this programme for the period 2010-2012 was to be fi nanced off -budget. Th e total cost of the programme was THB 1.46 trillion, THB 1.11 trillion of which were allocated to government projects and THB 321 billion to investment projects of State-owned enterprises. Th e programme funded tens of thousands of investment infrastructure programmes nationwide, with the objectives of (i) reviving economic growth in the short-term and (ii) raising the country’s productivity and competitiveness in the medium- and long-term. Besides the need to counteract the adverse impacts of the global fi nancial crisis, the need to boost investments in infrastructure was due to the fact that such investments had been low since the Asian fi nancial crisis of 1997. Th e transmission mechanism of the second stimulus package is described in fi gure 8.5.
Figure 8.5. Transmission mechanism in SP2 to GDP growth
Source: Fiscal Policy Offi ce, Ministry of Finance, Th ailand.
DEMAND SIDE: GDP = Cp + Ip + Cg + Ig + (( Xg+Xs) – (Mg + Ms))
Gov’t investment = 1.24 Trillion
SOE investment = 0.32 Trillion
TKK (2010-2012)THB 1.43 Trillion
Employment Current A/C
Crowding inprivate
investment
SUPPLY SIDE: GDP = Agriculture + Manufacturing + Construction +Transport + Whole sale & Retails sales + Hotel & Restaurant + Education
+ Health + Others
Th ailand

161
Nearly 60 per cent of the SP2 package consist of “hard” infrastructure – transport and logistics, mainly roads and rail, and irrigation projects. When the package was announced, the Government argued that it would support a growth rate of up to 4 per cent in 2010 and 5 per cent or more in 2011-2012, provided that the disbursements were kept on track. In the pre-crisis years of the 1990s, total investment made up around 40 per cent of the GDP, 10 per cent public investment and 30 per cent private investment. However, during 2004-08, public investment made up only between 5.3 and 5.9 per cent of the GDP and private investment was only between 16.6 and 17.5 per cent of the GDP. Th erefore, the implementation of SP2 would simultaneously serve to increase domestic demand and to promote national infrastructure development.
Flood crisis policy responses Th e Th ai Government adopted a three-pronged strategy to address the fl ood crisis and prevent future crises. First, the Government provided compensation and other measures, such as debt moratorium, tax reductions and incentives, and soft loan for reconstruction and rehabilitation, to people aff ected by the fl oods. Second, the Government proposed to invest 350 billion to improve fl ood prevention and water management. Th ird, the Government proposed a THB 2.27 trillion investment programme, worth 20.5 per cent of the GDP, over the next 7 years to enhance infrastructure and logistics in Th ailand. Th ese investments in disaster risk reduction will help minimize economic losses and impacts to local communities from future fl oods.
Lessons learned and future direction of Th ai economy Th e major lessons learned for Th ailand from the 2008-2009 global fi nancial crisis are that (1) sound macroeconomic policy and management are crucial for economic resiliency; (2) government stimulus programmes should be implemented in a well-targeted and timely manner, without compromising transparency; (3) medium-term fi scal sustainability should be maintained so that Government has fi scal space in times of crisis; and (4) fi nancial and banking supervision should aim at balancing the objectives of fi nancial stability and innovation. Th e lessons learned from the fl ood crisis are that (1) non-economic shocks such as climate and weather shocks can have signifi cantly negative
Boonchai Charassangsomboon and Pisit Puapan

162
consequences in the domestic economy; (2) dealing with unexpected natural disasters requires ex-ante emergency and crisis resolution planning and coordination, as well as post-crisis eff ective implementation of rehabilitation measures; and (3) the Government should make necessary investments in physical and social infrastructure to mitigate the impact from natural disasters and climate change. In the medium- to long-term the Th ai Government aims at restructuring the economy toward quality-growth and sustainability through the following strategies:
• Achieve stability through sound macroeconomic management. Priority will be given to fi nancial management under appropriate and timely monetary policy, and a surveillance mechanism for economic fl uctuations and a comprehensive warning system will be established. Th ere is a need to improve effi ciency in the management of foreign capital fl ows and in the collection of public revenues. A more eff ective budget allocation and management will also be crucial in preventing fi scal risks and in enhancing the operational effi ciency of State-owned enterprises. Th e private sector will be encouraged to participate more in investment in infrastructure and public service provision and the fi scal capacity of local governments will be improved.
• Enhance the country’s competitiveness with a freer and fairer competitive environment. Th e country’s competitive edge will be strengthened through the development of fi nancial and capital markets, along with the improvement of the workforce. Th e development of an effi cient intellectual property system will facilitate further research and development, knowledge transfers and applications to commercial purposes, generating benefi ts for communities and for society as a whole. In addition, the development of high quality infrastructure and logistic systems will strengthen the effi ciency of domestic and international connectivity consistent with international standards. To boost energy security it will be vital to increase the utilization of clean energy, to develop alternative sources of energy, and to improve energy effi ciency. Reforming the business legal framework, relevant rules and regulations will also be essential to facilitate healthy competition and to enhance effi ciency in a manner compatible with global changes and trends.
Th ailand

163
• Develop connectivity in transport and logistics systems under regional cooperation frameworks. Th is will be achieved through the development of effi cient transport and logistics services meeting international standards, and by the improvement of relevant rules and regulations for the transportation of goods and people. It is also important to enhance the capacity of human resources in transport and logistics businesses and to promote economic connectivity both across borders and linking domestic production poles.
• Utilize science, technology, innovation and creativity as fundamental factors for economic restructuring. Economic restructuring will emphasize research and development, technology transfer and applications leading to commercialization of innovations and improvements in the quality of life. Th e service sector will be restructured to increase its value creation and to become more environmentally friendly. Th e creative economy, including creative business, creative cities and creative industries, will be promoted, and value creation in the agricultural sector will be enhanced through innovation and green production processes. Th ere is also a need to use science, technology and creativity to promote quality and sustainability in the industrial sector and to make Th ailand’s development increasingly knowledge-based and environmentally friendly. Th e public and private sectors will cooperate to create an improved enabling environment to facilitate value creation through the provision of appropriate infrastructure and facilities, thus encouraging technology development and innovation.
Boonchai Charassangsomboon and Pisit Puapan

164

165
References
Ahmed, N., and M.K. Mujeri (2009). Social impacts of global economic slowdown: the case of Bangladesh. Paper presented at the Conference on Th e Impact of the Global Economic Slowdown on Poverty and Sustainable Development in Asia and the Pacifi c, organized by Asian Development Bank. Hanoi, 28-30 September.
Aizenman, J. (2010). Macro prudential supervision in the open economy, and the role of central banks in emerging markets. Open Economic Review, vol. 21, No. 3, pp. 465-481.
Aizenman, J., and B. Pinto (2011). Managing fi nancial integration and capital mobility: policy lessons from the past two decades. Policy Research Working Paper, No. 5786. Washington, D.C.: World Bank.
Aizenman, J., and Yi Sun (2009). Th e fi nancial crisis and sizable international reserves depletion: from “fear of fl oating” to the ‘fear of losing international reserves”? Working Paper, No. 15308. Cambridge, Massachusetts: National Bureau of Economic Research.
Aizenman, Joshua (2005). Financial liberalization: how well has it worked for developing countries? FRBSF Economic Letter, No. 2005-06 (8 April). San Francisco: Federal Reserve Bank of San Francisco, pp. 1-3.
Amjad, R. (2007). Th e Musharraf development strategy: will it deliver?” Lahore Journal of Policy Studies, vol. 1, No. 1.
Amjad, R., and others (2011). Pakistan: breaking out of stagfl ation into sustained growth. Th e Lahore Journal of Economics, vol. 16, No. 16, pp. 13-30.
Asian Development Bank (2009). Pacifi c Economic Monitor. May. Suva.AusAID (2008). Development Research Strategy, Commonwealth of Australia, 2008-10.
Canberra.Baba, N., and I. Shim (2011). Dislocations in the Won-Dollar swap markets during the
crisis of 2007-09. Working Papers, No. 344. Basel, Switzerland: Bank for International Settlements.
Bangladesh Bank (2008). Bangladesh Bank Quarterly, vol. 6, No. 1 (July-September). Dhaka. __________ (2010). Bangladesh Bank Quarterly, vol. 7, No. 4 (April-June). Dhaka. __________ (2011). Annual Report 2009-2010. Dhaka.

166
Bangladesh Bureau of Statistics (BBS) (2000). Preliminary Estimates of Gross Domestic Product 1999-2000 and Final Estimates of Gross Domestic Product 1998-99. Dhaka: Ministry of Planning.
__________ (2001). National Accounts Statistics (Gross Domestic Product, 2000-2001). Dhaka: Ministry of Planning.
__________ (2011). Preliminary Report on Household Income and Expenditure Survey 2010. Dhaka: Ministry of Planning.
Bangladesh, Ministry of Finance (2011). Bangladesh Economic Review 2011. Dhaka. (In Bangla).
Bank of Korea (2013). Financial stability report. April.Basri, M.C., and H. Hill (2010). Indonesian growth dynamic. Working Paper, No. 2010/10.
Canberra: Australian National University.Birdsall, N., and others (1995). Inequality and growth reconsidered: lessons from East Asia.
World Bank Economic Review, vol. 9, No. 3, pp. 477-508. Broner, F.A., G. Lorenzoni, and S.L. Schmukler (2010). Why do emerging economies borrow
short-term? Economics and Business Working Papers Series. Barcelona: Universitat Pompeu Fabra.
Chen, Zhu (2012). Speech at National Health Meeting. 5 January.China, National Audit Offi ce (2011). Th e Audit Report of 2010 Submitted to Th e National
People’s Congress Standing Committee of China, Jun. 27th, 2011. Available from www.audit.gov.cn.
China, National Committee of Population and Family Planning (2011). Th e Development Report on the Moving Population in China. Beijing: China Population Press.
China, National Development and Reform Commission (2011). Th e 12th Five Year Plan for Economic and Social Development. Available from www.sdpc.gov.cn.
Chinn, Menzie D., and Ito, Hiro (2006). What matters for fi nancial development? Capital controls, institutions, and interactions. Journal of Development Economics, vol. 81, pp. 163-192.
Contessi, S., P. DePace, and J. Francis (2008). Th e cyclical properties of disaggregated capital fl ows. Working Paper, No. 2008-041. St. Louis, Montana: Federal Reserve Bank of St. Louis.
Cruz, Moritz, and Bernard Walters (2008). Is the accumulation of international reserves good for development? Cambridge Journal of Economics, vol. 32, No. 5, pp. 665-681.
Eaton, J., and M. Gersovitz (1981). Debt with potential repudiation: theory and estimation. Review of Economic Studies, vol. 48, No. 2, pp. 289-309.
Eichengreen, Barry, Rachita Gullapalli, and Ugo Panizza, (2011). Capital account liberalization, fi nancial development and industry growth: a synthetic view. Journal of International Money and Finance, vol. 30, pp. 1090-1106.
Feng, W. (2011). Th e end of “growth with equity”? Economic growth and income inequality in East Asia. Asia Pacifi c Issues, No. 101. Honolulu: East-West Center.
References

167
Flore-Smereczniak, C. (2011). Th e Millennium Development Goals: a Pacifi c perspective. In Resilience in the Pacifi c: Addressing the Critical Issues, B. Lynch and J. Boston, eds. Wellington: New Zealand Institute of International Aff airs.
Forbes, Kristin. (2007). One cost of the Chilean capital controls: increased fi nancial constraints for smaller traded fi rms. Journal of International Economics, vol. 71, pp. 294-323.
Ginting, E., and P. Aji (forthcoming). Macroeconomic Management in Indonesia: Supporting more Inclusive Growth Processed.
Green, D., R. King, and M. Miller-Dawkins (2010). Th e global economic crisis and developing countries: impact and response. Working draft for consultation. Oxfam, Australia, October.
Growth Commission (2008). Growth report: strategies for sustained growth and inclusive development. Available from www.growthcommossion.org.
Igan D., and H. Kang (2011). Do loan-to-value and debt-to-income limits work? Evidence from Korea. Working Paper WP/11/297. Washington, D. C.: International Monetary Fund.
Ikhsan, M. (2007). Economic reform under a democratic transition regime and peer review in Indonesia. In Shaping Policy Reform and Peer Review in Southeast Asia: Integrating Economies Amid Diversity. Paris: OECD.
Ikhsan, M. (forthcoming). Labour market adjustment during the economic crisis, Indonesia’s experiences from the 1998 Asia fi nancial crisis and the 2008 global fi nancial crisis. LPEM-FEUI Working Paper. Jakarta: Institute for Economic & Social Research, Faculty of Economics, University of Indonesia. (In Bahasa Indonesia).
Ikhsan, M. (forthcoming). Rural poverty in Indonesia. LPEM-FEUI Working Paper. Jakarta: Institute for Economic & Social Research, Faculty of Economics, University of Indonesia. (In Bahasa Indonesia).
International Institute of Labour Studies (IILS) (2009). Th e Financial and Economic Crisis: A Decent Work Response. Geneva: International Labour Offi ce.
International Labour Offi ce (ILO), and World Health Organization (WHO) (2009). Manual and Strategic Framework for Joint UN Country Operations. Geneva.
International Monetary Fund (IMF) (2006). Indonesia: selected issues. IMF Country Report, No. 06/318. Washington, D.C. Available from www.imf.org/external/pubs/ft /scr/2006/cr06318.pdf.
__________ (2010). Bangladesh: Selected Issues. Country Report, No. 10/56. Washington, D.C.__________ (2011a). Bangladesh: 2011 Article IV Consultation. Country Report, No. 11/314.
Washington, D.C. __________ (2011b). Macroprudential policy: an organizing framework. Report prepared by
the Monetary and Capital Markets Department in consultation with Research and other departments. March. Available from www.imf.org/external/np/pp/eng/2011/031411.pdf.
International Organization for Migration (IOM) (2010). Th e Bangladesh Household Remittance Survey 2009 Summary Report. Dhaka: Regional Offi ce for South Asia.

168
Islam, R. (2010). Th e employment challenge in developing countries during economic downturn and recovery. In From the Great Recession to Labour Market Recovery: Issues, Evidence and Policy Options, I. Islam and S. Verick, eds. Geneva and London: ILO and Palgrave Macmillan.
Islam, R., and others (2011). Fiscal and Policy Space for Crisis Response with a Focus on Employment and Labour Market: A Study of Bangladesh. Dhaka and Geneva: Bangladesh Institute of Development Studies and Employment Policy Department, International Labour Offi ce.
Janjua, M.A. (2005). Money supply, infl ation and economic growth: issues in monetary management in Pakistan. Th e Lahore Journal of Economics, Special edition, pp. 73-105.
Jayaraman, T.K. (2009). “Central banks” response in Pacifi c island countries to global economic crisis. Asia-Pacifi c Economic Journal, vol. 9, No. 1, pp. 37-56.
__________ (2011). Global fi nancial crisis and economic downturn: challenges and opportunities for the small island countries in the Pacifi c. Bank of Valletta Review, No. 43, pp. 44-58.
Jeanne, O. (2009). Debt maturity and the international fi nancial architecture. American Economic Review, vol. 99, No. 5, pp. 2135-2148.
Jeanne, O., and A. Korinek (2010). Excessive volatility in capital fl ows: a pigouvian taxation approach. Working Paper, No. 15927. Cambridge, Massachusetts: National Bureau of Economic Research.
Kaminsky, G.L., and C.M. Reinhart (1999). Th e twin crises: the causes of banking and balance-of-payments problems. American Economic Review, vol. 89, No. 3, pp. 473-500.
Kaminsky, G.L., C.M. Reinhart, and C.A. Végh (2004). When it rains it pours: procyclical capital fl ows and macroeconomic policies. In NBER Macroeconomic Annual, M. Gertler and K. Rogoff , eds. Cambridge: MIT Press.
Kim, K., B.K. Kim, and H. Park (2010). Interest rate-oriented monetary policy framework and fi nancial procyclicality. Paper prepared for the Conference on Macroeconomic and Financial Stability in Asian Emerging Markets. Kuala Lumpur, Malaysia, 4 August.
__________ (2011). Monetary policy framework and fi nancial pro-cyclicality: international evidence. Paper presented at BIS-BOK Conference on Macro-prudential Regulation and Policy. Seoul, Korea, January.
Kim, S. (2011). Th e eff ect of foreign reserves on short-term debt infl ows. Korean International Economic Association Kukjekyungjeyonku, vol. 17, No.1, pp. 51-73. (In Korean.)
Klein, Michael W., and Giovanni P. Olivei (2008). Capital account liberalization, fi nancial depth, and economic growth. Journal of International Money and Finance, vol. 27, pp. 861-875.
Kose, M.A., and others (2006). Financial globalization: a reappraisal. Working Paper, No. WP/06/189. Washington, D.C.: International Monetary Fund.
Lindgren, Carl-Johan (2006). Banking Integration in the ASEAN Region: An Overview. Manila: Asian Development Bank.
References

169
Malik, Afi a (2012). Power Crisis in Pakistan: A Crisis of Governance?, PIDE Monograph Series. Islamabad: Pakistan Institute of Development Economics. Available from www.pide.org.pk/pdf/publications/Monograph/Monograph-4-Afi a%20Malik.pdf.
Mama, A.T. (2007). On the maturity structure of foreign debt contracts in emerging market. Quebec, Canada: University of Montreal.
Mujeri, M.K. (2003). Economic Growth and Poverty Reduction in Bangladesh (mimeo). Dhaka: Asian Development Bank and Embassy of Japan.
Mujeri, M.K. (2008). Infl ation and the Poor in Bangladesh. Policy Analysis Unit Policy Paper, No. 0801. Dhaka: Bangladesh Bank.
Mujeri, M.K., and B. Sen (2006). Economic Growth in Bangladesh, 1970-2000. In Explaining Growth in South Asia, K.S. Parikh, ed. New Delhi: Oxford University Press.
Mujeri, M.K., and M. Shahiduzzaman (2008). Navigating the global fi nancial storm: challenges for Bangladesh. Policy Paper 0903, Dhaka: Policy Analysis Unit, Bangladesh Bank.
Nathan Associates (2007). Pacifi c regional trade and economic cooperation joint baseline and gap analysis. Final report prepared for the Pacifi c Islands Forum Secretariat. Suva, Fiji.
Ostry, J., and others (2010). Capital infl ows: the role of controls. Staff Position Note, SDN/10/04. Washington, D.C.: International Monetary Fund.
Pakistan, Planning Commission (2008). Economic stabilization with a human face. Interim Report of the Advisory Panel of Economists. Islamabad, October.
Prasad, B.C. (2011). New opportunities for enhancing sources of economic growth in the Pacifi c Islands. In Resilience in the Pacifi c: Addressing the Critical Issues, B. Lynch and J. Boston, eds. Wellington: New Zealand Institute of International Aff airs.
Rahman, M., and others (2009). Impact of the Global Economic Crisis on the Employment and Labour Market of Bangladesh: A Rapid Assessment. Dhaka and Bangkok: Centre for Policy Dialogue and International Labour Offi ce.
Raihan, S. (2010). Implications of the global economic crisis for the Bangladesh economy. Paper presented at the AusAID-IFPRI-PEP Workshop on the Impacts and Policy Responses to the global Crisis, 8th PEP General Meeting, Dakar, Senegal, 12-18 June.
Ravallion, M. (2009). Th e crisis and the world’s poorest. Development Outreach, vol. 11, No. 3, pp. 16-18.
Reinhart, C.M., and K.S. Rogoff (2009). Th is Time is Diff erent: Eight Centuries of Financial Folly. Princeton and Oxford: Princeton University Press
__________ (2009). Th is Time is Diff erent: Eight Centuries of Financial Folly. Princeton, New Jersey: Princeton University Press.
Rodrik, Dani (2006). Th e social cost of foreign exchange reserves. International Economic Journal, Korean International Economic Association, vol. 20, No. 3, pp. 253-266.
Ruiz-Arranz, M., and Z. Milan (2008). Adequacy of Indonesia’s foreign exchange reserves. In Indonesia: Selected Issues, Country Report, No. 08/298. Washington, D.C.: International Monetary Fund.
Sanago, I. (2010). Impacts of the global fi nancial crisis on households : follow-up case study in Bangladesh. Dhaka: World Food Programme.

170
Schindler, M. (2009). Measuring fi nancial integration: a new dataset. IMF Staff Papers, vol. 56, No.1, pp. 222-238.
Sen, B., and others (2007). Explaining pro-poor growth in Bangladesh: puzzles, evidence, and implications. In Delivering on the Promise of Pro-Poor Growth: Insights and Lessons from Country Experiences, T. Besley and L.J. Cord, eds. New York and Washington, D.C.: Palgrave Macmillan and World Bank.
United States Department of the Treasury (2011). Report to Congress on International Economic and Exchange Rate Policies. December 27th. Available from www.treasury.gov.
United Nations Conference on Trade and Development (UNCTAD) (2011). World Investment Report 2011. Geneva and New York: United Nations.
United Nations Development Programme (UNDP) (2011). Human Development Report 2011 Sustainability and Equity: A Better Future for All. New York: Oxford University Press.
United Nations, Economic and Social Commission for Asia and the Pacifi c (2011a). Statistical Yearbook for Asia and the Pacifi c 2011. Sales No. E.11.II.F.1. Available from www.unescap.org/sfat/data/syb2011/index.asp.
__________ (2011b). Economic and Social Survey of Asia and the Pacifi c 2011: Sustaining Dynamism and Inclusive Development: Connectivity in the Region and Productive Capacity in Least Developed Countries. Sales No. E.11.II.F.2.
__________ (2012). Asia-Pacifi c Trade and Investment Report 2012: Recent Trends and Developments. Bangkok.
United Nations, Economic and Social Commission for Asia and the Pacifi c (ESCAP), Asian Development Bank (ADB), and United Nations Development Programme (UNDP) (2008). A Future Within Reach: Regional Partnership for the Millennium Development Goals in Asia and the Pacifi c. Sales No. E.08.II.F.15.
Valgreen, C. (2007). Th e global fi nancial accelerator and the role of international credit agencies. Paper presented at the International Conference of Commercial Bank Economists. Madrid, Spain, July.
Verick, S., and I. Islam (2010). Th e Great Recession of 2008-09: causes, consequences and policy responses. Discussion Paper, No. 4934, IZA. Bonn: Institute for the Study of Labour.
World Bank (2002). Poverty in Bangladesh: building on progress report No. 24299-BD. Paper prepared by Poverty Reduction and Economic Management Sector Unit, South Asia Region .Washington, D.C.
__________ (2009). Bangladesh Economic Outlook. September 2009, Dhaka: World Bank Resident Mission.
__________ (2011). Indonesia Economic Quarterly. December. Yang, Y., and others (2011). Monetary policy transmission in Pacifi c island countries. Working
Paper, No. WP11/96. Suva, Fiji: International Monetary Fund.Zhang, Ping (2011). Th e work report submitted to the National People’s Congress Standing
Committee of China, 28 November.
References

172
Although the global financial crisis of 2008-2009 was the worst economic crisis in over 60 years for many industrial countries, most Asian and Pacific developing countries weathered it quite successfully. The resilience of the region is somewhat puzzling at first sight. In an increasingly globalized world, aren’t economic shocks supposed to be transmitted faster and farther than ever before? And shouldn’t the largest shock in decades affecting the central financial centres of the world cause substantial ripple effects? Yet, even those Asian and Pacific countries that were most exposed to drops in imports from the Western industrial countries and suffered significant drops in economic activity in 2009 recovered briskly in 2010. Furthermore, in contrast to the Asian financial crisis of 1997, no country in the region experienced a collapse of its banking sector or a balance of payments crisis.
The purpose of the book is to understand why countries in the region were significantly less affected by the crisis than the world’s most advanced economies of Europe and the United States, and what are the main lessons from their experience for building resilience from future crises. The majority of the essays collected in this volume are revised and updated versions of papers presented by experts from the region at a conference organized by the Economic and Social Commission of Asia and the Pacific in Manila in September 2011.
9 789211 206630
ISBN: 978-92-1-120663-0
THE GLOBAL FINANCIAL CRISIS