Emergency in Northern Uganda photo by Silvia Morara – Kitgum, N. Uganda

i
UNITED NATIONS DEVELOPMENT ASSISTANCE FRAMEWORK FOR KENYA: 2018-2022
Richard Olver Anderea Morara
January 2018 Cover Picture: Women’s Group members learn how to identify and tend seedlings as part of environmental management, with support from the UN

ii
TABLE OF CONTENTS
LIST OF TABLES............................................................................................................................................. VI
LIST OF FIGURES .......................................................................................................................................... VII
LIST OF ACRONYMS .................................................................................................................................... VIII
ACKNOWLEDGEMENTS ................................................................................................................................. X
EXECUTIVE SUMMARY ................................................................................................................................. XI
1. THE UNITED NATIONS COMMON COUNTRY ASSESSMENT .................................................................... 1
1.1. PURPOSE AND SCOPE OF THE CCA ........................................................................................................................ 1
1.2. METHODOLOGY .................................................................................................................................................. 1
1.3. LIMITATIONS ...................................................................................................................................................... 2
1.4. CONCEPTUAL FRAMEWORK FOR THE CCA ............................................................................................................. 2
2. INTRODUCTION ......................................................................................................................................... 3
2.1. GEOGRAPHIC, POLITICAL AND SOCIO-ECONOMIC OVERVIEW ................................................................................... 3
2.1.1. Demography .............................................................................................................................................. 4
2.1.2. Economy and Living Standards ................................................................................................................ 5
2.1.3. Politics and System of Governance ........................................................................................................... 7
2.2. EMERGING ISSUES ............................................................................................................................................... 7
2.3. KENYA VISION 2030........................................................................................................................................... 8
2.4. THE KENYA MTP III ........................................................................................................................................... 9
2.4.1. Economy .................................................................................................................................................... 9
2.4.2. Social 10
2.4.3. Political ................................................................................................................................................... 10
3. ECONOMIC GROWTH AND POVERTY REDUCTION ............................................................................... 12
3.1. THE ECONOMIC PILLAR IN MTP III ................................................................................................................... 12
3.1.1. The role of the priority sectors ............................................................................................................... 13
3.1.2. Growth targets, patterns and trends ...................................................................................................... 13
3.1.3. Objectives for the MTP III priority sectors and their challenges ........................................................... 15
3.2. POVERTY REDUCTION ....................................................................................................................................... 21
3.2.1. Poverty in Kenya ..................................................................................................................................... 21
3.2.2. The youthful, female face of poverty ...................................................................................................... 23
3.2.3. The location of poverty ........................................................................................................................... 23
3.2.4. Inequality in Kenya ................................................................................................................................. 25
3.2.5. Reasons for escaping and falling into poverty ....................................................................................... 26
3.2.6. Policy responses for poverty reduction .................................................................................................. 27
3.2.7. The national response to poverty ........................................................................................................... 28
4.0. ECONOMIC THEMATIC AREAS ............................................................................................................. 30
4.1. AGRICULTURE, FORESTRY AND FISHERIES ........................................................................................................... 30
4.1.1. Agricultural policy and strategy............................................................................................................. 30
4.1.2. Agriculture .............................................................................................................................................. 31

iii
4.1.3. Women in agriculture ............................................................................................................................. 33
4.1.4. Food insecurity and the policy response ................................................................................................ 33
4.2. EMPLOYMENT................................................................................................................................................... 34
4.2.1. Youth and employment ........................................................................................................................... 35
4.2.2. The geography of employment ............................................................................................................... 36
4.2.3. Gender equality in employment .............................................................................................................. 38
4.2.4. Policy and Achievements......................................................................................................................... 39
4.3. TOURISM SECTOR .............................................................................................................................................. 40
4.4. ACCESS TO ENERGY ........................................................................................................................................... 41
4.4.1. Challenges and opportunities in the energy sector ................................................................................ 42
4.4.2. Kenya’s progress during MTP II.............................................................................................................. 43
5.0. SOCIAL SECTOR THEMATIC AREAS ..................................................................................................... 44
5.1. CAUSES OF SOCIAL CHALLENGES ........................................................................................................................ 44
5.2. DEMOGRAPHIC CONTRIBUTION TO ECONOMIC GROWTH AND POVERTY REDUCTION................................................ 45
5.2.1. Population and Economic Growth .......................................................................................................... 45
5.2.2. The Global ‘Youth Bulge’ ......................................................................................................................... 45
5.2.3. The ‘Demographic Dividend’ In Kenya ................................................................................................... 46
5.2.4. Policy Measures ....................................................................................................................................... 46
5.2.5. Population Programmes in Kenya .......................................................................................................... 47
5.3. EDUCATION AND LEARNING ............................................................................................................................... 48
5.3.1. Education policy ...................................................................................................................................... 48
5.3.2. Achievements in education ..................................................................................................................... 49
Primary and early childhood education .......................................................................................................... 49
5.3.3. Challenges in education .......................................................................................................................... 50
5.4. HEALTH FOR ALL .............................................................................................................................................. 51
5.4.1. Devolved health services ......................................................................................................................... 51
5.4.2. Maternal, infant and child mortality ...................................................................................................... 52
5.4.4. Sub-national innovation ......................................................................................................................... 54
5.5. NUTRITION AND FOOD SECURITY ........................................................................................................................ 54
5.5.1. Overview .................................................................................................................................................. 54
5.5.2. The national response to malnutrition .................................................................................................. 58
5.5.3. Achievements and challenges in nutrition ............................................................................................. 59
5.6. HIV/AIDS....................................................................................................................................................... 60
5.6.1. Status and trends .................................................................................................................................... 60
5.6.2. Social drivers of the epidemic ................................................................................................................. 60
5.6.3. The geography of the epidemic .............................................................................................................. 61
5.6.4. Human rights and HIV ............................................................................................................................ 62
5.6.5. The cost of anti-retroviral drugs ............................................................................................................ 63
5.7. SAFE WATER, SANITATION AND HYGIENE ........................................................................................................... 63
5.8. SOCIAL PROTECTION ......................................................................................................................................... 65
iv
5.8.1. Vulnerable groups ................................................................................................................................... 66
5.8.2. The National Social Safety Net Programme .......................................................................................... 67
5.8.3. Challenges ............................................................................................................................................... 68
5.9. URBANISATION AND HOUSING ................................................................................................................. 69
5.9.1. Urbanisation ........................................................................................................................................... 69
6.0. POLITICAL THEMATIC AREAS: PEACE, GOOD GOVERNANCE, CORRUPTION AND ACCESS TO JUSTICE
....................................................................................................................................................................... 75
6.1. THE POLITICAL PILLAR ..................................................................................................................................... 75
6.2. PEACE AND CONFLICT ....................................................................................................................................... 76
6.2.1. Causes and resilience .............................................................................................................................. 76
6.2.2. Violent extremism ................................................................................................................................... 77
6.2.3. Resource-based conflict .......................................................................................................................... 77
6.2.4. Ethnic violence ........................................................................................................................................ 78
6.2.5. The Kenyan response .............................................................................................................................. 78
6.3. GOOD GOVERNANCE .......................................................................................................................................... 79
6.4. CORRUPTION .................................................................................................................................................... 80
6.5. DEVOLUTION AND OTHER GOVERNANCE FRAMEWORKS ........................................................................................ 81
6.6. ACCESS TO JUSTICE ........................................................................................................................................... 83
7.0 CROSS CUTTING THEMATIC AREAS ..................................................................................................... 85
7.1. ENVIRONMENT ................................................................................................................................................. 85
7.1.1. Sustainable use of oceans, seas, marine and terrestrial ecosystems ..................................................... 85
7.1.2. Protected Natural Areas and Community Conservation ....................................................................... 86
7.1.3. Water and Air Pollution .......................................................................................................................... 87
7.1.4. Persistent Organic Pollutants (POPs) ..................................................................................................... 88
7.1.5. Climate Change ....................................................................................................................................... 90
7.1.6. Biodiversity ............................................................................................................................................. 91
7.2. HUMANITARIAN CRISES, NATURAL DISASTERS, MIGRATION, RESILIENCE AND EARLY RECOVERY ............................. 93
7.2.1. Natural Disasters ......................................................................................................................... 95
7.2.2. Migration ................................................................................................................................................. 95
7.2.3. Resilience and Early Recovery .............................................................................................................. 102
7.3. CULTURE HERITAGE AND CREATIVE INDUSTRY ................................................................................................... 103
7.4. GENDER EQUALITY AND WOMEN’S EMPOWERMENT .......................................................................................... 104
7.4.1. Constitutional, Legal and Policy Provisions ......................................................................................... 105
7.4.2. Women and Civil Society ....................................................................................................................... 107
7.4.3. Implementation of Legislation ............................................................................................................. 107
7.4.4. Women in Decision-making and Leadership........................................................................................ 107
7.4.5. Gender Mainstreaming ......................................................................................................................... 108
7.4.6. Women and Economic Equality ............................................................................................................ 109
7.4.7. Gender Based Violence .......................................................................................................................... 109
7.4.8. Harmful Cultural Practices ................................................................................................................... 111

v
7.4.9. Age of Marriage .................................................................................................................................... 111
7.4.10. Health, education and gender ............................................................................................................ 111
7.5. AID COORDINATION, COHERENCE AND EFFECTIVENESS ...................................................................................... 111
7.5.1. Volatility of aid in Kenya ....................................................................................................................... 112
7.5.2. Aid fragmentation ................................................................................................................................. 113
7.5.3. Aid coordination ................................................................................................................................... 113
7.5.4. Declining Aid Flows ............................................................................................................................... 114
7.6. THE SUSTAINABLE DEVELOPMENT GOALS AND THE PRINCIPLE OF ‘LEAVE NO ONE BEHIND’ ................................. 115
7.6.1. The Sustainable Development Goals .................................................................................................... 115
7.6.2. Leave No One Behind ............................................................................................................................ 117
7.7. HUMAN RIGHTS .............................................................................................................................................. 120
7.7.1. Human Rights in Kenya’s Constitution, treaties and institutions ........................................................ 120
7.7.2. Human Rights issues and responses ..................................................................................................... 121
8. STRATEGIC ENTRY-POINTS FOR THE UNDAF 2018-2022 ................................................................. 130
8.1. POSITIONING OF THE NEXT UNDAF ................................................................................................................. 130
8.2. A STRATEGY CENTRED ON ACCOUNTABILITY AND LEAVE NO ONE BEHIND ........................................................... 130
8.3. DEVOLUTION .................................................................................................................................................. 131
8.4. GENDER AND HUMAN RIGHTS ........................................................................................................................... 132
8.5. POPULATION AND THE DEMOGRAPHIC DIVIDEND ................................................................................................ 132
8.6. ECONOMIC GROWTH ........................................................................................................................................ 133
8.7. SOCIAL CONFLICT, PEACE BUILDING AND GOVERNANCE ....................................................................................... 133
8.8. RESILIENCE AND SUSTAINABILITY ..................................................................................................................... 133
8.9. HEALTH & HIV/AIDS .................................................................................................................................... 133
8.10. HOUSING AND URBAN DEVELOPMENT ............................................................................................................. 134
8.11. ENVIRONMENT ............................................................................................................................................. 134
8.12. FINANCING THE UNDAF ............................................................................................................................... 134
8.13. PROGRAMME MANAGEMENT AND DELIVERY .................................................................................................... 135
8.14. COMMUNICATIONS ........................................................................................................................................ 135
ANNEXES ..................................................................................................................................................... 136
ANNEX 1: DATA AND INFORMATION NEEDS OF THE CCA .......................................................................................... 136
ANNEX 3: LIST OF UN, GOK INSTITUTIONS CONSULTED FOR THE CCA ...................................................................... 143
ANNEX 4: LIST OF REFERENCES AND BACKGROUND DOCUMENTS ............................................................................... 144
ANNEX 5: LIST OF UNITED NATIONS HUMAN RIGHTS TREATIES RATIFIED BY KENYA .................................................. 146
ANNEX 6: THE HUMAN RIGHTS COUNCIL UNIVERSAL PERIODIC REVIEW 2015: RECOMMENDATIONS ........................... 148

vi
LIST OF TABLES Table 1: Growth in Select Sectors, 2015-2016 14 Table 2: GDP Growth Rates and Projections for Select Developing Countries 16 Table 3: Problems and causes of Kenya’s shortfalls in achieving economic growth targets 22 Table 4: Kenya’s 2015 HDI and component indicators relative to Cameroon & Tanzania 24 Table 5: Key Crops Production 2015-2016 35 Table 6: Youth Unemployment situation in select counties 40 Table 7: Tourism Sector Performance 2015-2016 44 Table 8: The support required to drive the food security strategy 61 Table 9: The Kenya National Micronutrient Survey of 2011: Select Indicators 62 Table 10: Kenya Nutrition Data 63 Table 11: HIV Annual Infections by County 66 Table 12: Causes of rural-urban migration and possible solutions 74 Table 13: Kenyan Cities and Towns with Populations over 100,000 75 Table 14: Some of Kenya’s enduring political problems and their respective causes 80 Table 15: Priority Concerns Related to Chemicals 94 Table 16: In-migrants by region and sex, 2009 101 Table 17: Number of IDPs countrywide in 2008 102 Table 18: Population of refugees as of July 2017 103 Table 19: Kenya’s GII for 2015 relative to selected countries and groups 109 Table 20: Status of Kenya’s accession to International agreements on gender 110 Table 21: Number of Women in Parliament over the years 113 Table 22: GBV Statistics; Kenya Domestic Household Survey (KDHS) 2014 115 Table 23: Top 10 ODA recipients in Africa 119 Table 24: Groups left behind 123
vii
LIST OF FIGURES Figure 1: Kenya in Counties and by Climate 4 Figure 2: Number of births and deaths 2011-2015 5 Figure 3: Population of Kenya by year: 2009 to 2018 6 Figure 4: Overall Economic Growth, 2012-2016 16 Figure 5 & 6: Trends in Kenya’s HDI component indices 1990-2015 24 Figure 7: People living below the poverty Line by County 26 Figure 8: Proportion of Population below Poverty Line (Headcount index) by County 27 Figure 9: Distribution of the working-age population across activities (percent) 38 Figure 10: Formal jobs as percentage of working-age population 39 Figure 11: Cooking fuel by county 45 Figure 12: Neonatal, Postnatal & Child Mortality Rates 2003-2014 57 Figure 13: 100% Food Security: Select targets 60 Figure 14: Improved and unimproved sources of water by county 69 Figure 15: Human waste disposal by county 70 Figure 16: Main material used for floors, walls and roofs in Counties (rural and urban areas) 78 Figure 17: Kenya’s existing protected areas and possible additions 97 Figure 18: Type, frequency and location of common hazards 99

viii
LIST OF ACRONYMS AGDP Agricultural Gross Domestic Product AFD Agence Française de Développement APRs Annual Progress Reports ASAL Arid and Semi-Arid Lands CAADP Comprehensive Africa Agriculture Development Programme CCA Common Country Assessment CCA Climate Change Adaptation CIDPs County Integrated Development Plans COG Council of Governors CSO Civil Society Organisations DaO Delivering as One DRM Disaster Risk Management DRR Disaster Risk Reduction EAC East African Community ECDE Early Childhood Development Education ECOSOC (United Nations) Economic and Social Council EDE End Drought Emergencies EmONC Emergency Obstetric and Newborn Care FBO Faith Based Organisation FPE Free Primary Education GBV Gender Based Violence GDP Gross Domestic Product GER Gross Enrolment Rate HISP Health Insurance Subsidy Programme HSNP Hunger Safety Net Programme IMF International Monetary Fund IOM International Organisation for Migration KALRO Kenya Agricultural and Livestock Research Organisation KDHS Kenya Demographic and Health Survey KEPH Kenya Essential Package for Health KEPSA Kenya Private Sector Alliance KIHBS Kenya Integrated Household Budget Surveys KMET Kisumu Medical and Education Trust KNBS Kenya National Bureau of Statistics KYEP Kenya Youth Empowerment Programme LAPSSET Lamu Port Southern Sudan - Ethiopia Transport LTWP Lake Turkana Wind Power MAPS Mainstreaming, Acceleration and Policy Support MDAs Ministries, Departments and Agencies MDGs Millennium Development Goals MICE Meetings, Incentives, Conventions, and Exhibitions MoDP Ministry of Devolution and Planning MTR Medium Term Review MW Mega Watts NCIC National Cohesion and Integration Commission NEPAD New Partnership for Africa Development NER Net Enrolment Rate NGO Non-Governmental Organisation NIMES National Integrated Monitoring and Evaluation System NSNP National Safety Net Programme OHCHR Office of the United Nations High Commissioner for Human Rights OP-CT Older Persons Cash Transfers OVC-CT Orphans and Vulnerable Children Cash Transfers

ix
PERs Public Expenditure Reviews PPP Public Private Partnership R&D Research and Development RMNCAH Reproductive Maternal Newborn Child Adolescence Health SIDA Swedish International Development Agency SDGs Sustainable Development Goals SEZ Special Economic Zone SGR Standard Gauge Railway STI Science Technology and Innovation TVET Technical and Vocational Education and Training UHC Universal Health Care UNDAF United Nations Development Assistance Framework UNDP United Nation Development Programme UNICEF United Nations Children's Fund UNHCR United Nations High Commissioner for Refugees UPE Universal Primary Education VDS Vision Delivery Secretariat WEF Women Enterprise Fund WHO World Health Organisation WTTC World Travel & Tourism Council YEF Youth Enterprise Fund
x
ACKNOWLEDGEMENTS The authors would like to express sincere thanks for the frank, constructive and helpful insights which everyone, the Government, the UNCT, civil society and other partners have shared. Everywhere people showed the passion and insight that characterizes the work of the UN and its partners. We have reflected many commonly held views in this report: most of its findings and recommendations derive from the deep thought and practical understanding shared with us by Government, UN staff and others at all levels. In the end however, the views and recommendations expressed in this report are our own. We would also like to give special acknowledgement and thanks to the UN Resident Coordinator and Heads of Agencies of the UNCT: their vision, energy and commitment are a credit to the UN idea. Finally, we are extremely grateful for the support and guidance of the staff of the Resident Coordinator’s Office, as well as the many other people who found ways to facilitate our work. Without your efforts to address the needs of this assessment, it could not have been accomplished.

xi
EXECUTIVE SUMMARY The common Country Assessment and Kenya’s Vision 2030 The purpose of this Common Country Assessment (CCA) is to provide insights to guide the development of the new United Nations Development Assistance Framework (UNDAF) for the years 2018-2022. The UNDAF is the strategic plan for focused UN system support for achievement in Kenya of the global Sustainable Development Goals (SDGs) and Kenya’s Vision 2030. The goals of Kenya’s Vision 2030, and the medium-term plans (MTPs) to achieve it, is a better quality of life for all Kenyans. This means access to adequate housing, sufficient income, quality education and health services. It also means adequate personal and social security for everyone. Two key contributors to an improved quality of life are economic growth and poverty reduction. Economic growth is essential for poverty reduction. Poverty reduction, in turn, contributes to economic growth. Key national issues Vision 2030 calls for reforms that will produce sustained economic growth of over 10 per cent. Kenya’s current economic growth rate of between 5 and 6 per cent must be accelerated to reach the target of Vision 2030, to spread the benefits of its newly-attained middle-income country status more widely and to enable it to reduce poverty and exclusion. Such growth would also enable Kenya to take advantage of the opportunities of a potential demographic dividend, in which a falling birth rate and increased employment for the present youth bulge in the working age cohort lower the national dependency ratio. Such a dividend would produce the savings and investment needed for the creation of the prosperous society for all that Kenya is committed to build. For this to happen, Kenya’s key issues must be addressed. While Kenya is experiencing a long-term reduction in the rate of population growth, a national consensus must be built in favour of a more rapid decline. This will require strong and consistent leadership, and a major investment in the education and empowerment of girls and women. Kenya is traditionally a highly patriarchal society. Its 2010 constitution commits it to gender and other forms of equality, and the public sector has taken impressive steps toward gender balance at senior levels of government and the judiciary, and the empowerment of women throughout society. However, most women remain rural smallholders, denied access to land titles or credit. Women also lag in employment and education, though they are catching up. Gender-based violence (GBV) is pervasive and harmful cultural practices persist. Poverty has a female face. The acceleration of economic growth must continue and stabilize at a higher level. Current growth is uneven across sectors and counties. Growth must also be broad-based and inclusive. If not, serious and growing disparities will continue to act as brakes on development and could put Kenya’s social stability at risk. Kenya must develop and implement fully comprehensive policies and programmes to reverse growing disparities, both geographically and among social groups. The root causes of social tensions within Kenyan society must be firmly addressed, if the social stability required for accelerated growth is to be maintained. Uneven development has polarized politics and frayed social trust, leading to tensions and violence around elections. This undermines national unity and promotes social conflict. Perceived high levels of corruption and lack of accountability contribute to social alienation. Disparities and exclusion also breed violent extremism. Determined efforts to build inclusion and restore trust, especially in North-eastern counties of Kenya, are as important as security responses.

xii
Kenya’s recent, bold programme of devolution of authority to new county governments promises to make government and its services more accessible, responsive and accountable to the people. But this depends on the performance of the newly-devolved systems and structures. Capacity-building and greater revenues are both required on a large scale. The question of how to provide such support to 47 counties is a key one for the GoK and its external partners. More investment is needed in infrastructure, basic education and job skills, health, food security and nutrition, irrigation, accountability and in creating an enabling environment for enterprise. There is also a need for improved coordination between national and county governments in devolved functions such as health and agriculture. The country remains predominantly rural, while economic growth is largely urban. Rural Kenya is being left behind and more frequent drought and climate change are worsening conditions. This accelerates rural-urban migration and strains rural resilience. Kenya has not invested sufficiently in agriculture and agro-industry. It should now give highest priority to its planned investments in agriculture and rural infrastructure, services and social support, to achieve rural prosperity and sustainability, and national food security. Kenya has made significant progress in controlling infectious diseases, resulting in increased life expectancy. However, communicable, maternal, neonatal, and nutritional diseases continue to rank as main causes of deaths. HIV/AIDS still ranks highest in premature deaths/years of life lost. Meeting healthcare needs fully will pose a major challenge to budgets at national and county level. For example, the cost of the Kenya HIV response is projected to increase from US $1,115 million in 2017 to $1,283 million in 2022, with a widening budget gap due to an expected decline in external funding. Limited coverage of health insurance and social protection benefits means that many of the poor cannot afford timely and effective treatment, leading to long periods of illness and many preventable deaths. Out of pocket expenditure for health care at 32 % still poses a challenge to accessing quality health care. Health emergencies are a major driver of poverty in Kenya. It will be a major challenge for Kenya to devise a sustainable financing system for healthcare expansion and provision. A significant proportion of Kenya’s population also lacks access to basic services such as electricity and safe drinking water. Kenya has an ambitious programme of electrification, but access in marginalized areas and affordability for most Kenyans are significant issues. Realization of universal access to water remains a significant challenge and requires huge investments in water supply and sanitation infrastructure. Kenya’s rapid rate of urbanisation continues to increase pressure on housing and urban infrastructure. Housing is not being built at anywhere near an adequate rate, and growth of slums and informal settlements is expanding. These are often not served by public schools or other amenities. Over 35 per cent of Kenyans now live in cities and towns, and it is projected that more than 50 per cent will live in urban areas by 2030. Land, materials and credit must be made more easily available for new construction, and low-cost housing solutions developed. Public services and infrastructure must be expanded. The projected mega-city status of Nairobi will require extensive infrastructure development. Unless effective measures are taken, the migration to cities of rural poor people (largely young and female) is bound to worsen the country’s rate of unemployment, which stands at around 40 per cent. Even grimmer is the fact that 8 out of every 10 jobless Kenyans are youth aged between 15-34 years1. Urbanization poses additional challenges to rural youth. They have
1 http://www.worldpolicy.org/blog/2014/03/24/kenyas-emerging-cities-dilemma

xiii
limited access to resources, education, training, and employment, and face negative aspects of the rapid erosion of indigenous values in cities. Due to its geographic location Kenya and its political stability as well as socio economic growth Kenya has since independence been receiving refugees from the region. While the overall current number of refugees of some 480,000 represents less than 1 % of the overall country’s population, they represent 28per cent of the Garissa County population (2009 census gives the population of Garissa as close to 623,000) and 20per cent of the Turkana county population, two of the poorest counties. In the context of devolution, the social services provided to both host and refugee populations and the economic opportunities which the concentration of some 200,000 individuals in each of the counties play an important role over the next five years as the principle of Leave No One Behind (LNOB) is pursued. In addition, several waves of economic workers from various countries in the region have settled in Kenya over the past several decades. At the time of independence, most of them were not granted Kenyan citizenship and have in the meantime become stateless (estimated number is 18,000). These communities include the Pemba, Shona, Galjael, Nubians, people of Congolese, Burundian and Rwandan descent, Shirazi, Waata and children of British Overseas Citizens, in addition to Kenyan Somali communities in North-Eastern Kenya who continue to face serious challenges accessing civil and legal identification documentation. Poverty and inequality The proportion of people living below the national poverty line in 2014 was estimated at 45.2%. Individuals living above the income poverty line may still suffer deprivations in education, health and other living conditions, exacerbated by ethnic and gender discrimination. In Kenya, 36.0 percent of the population is multi-dimensionally poor while an additional 32.0 percent lives near multidimensional poverty. The poor constitute 50.2% of the population in the rural areas and 33.5% in urban areas. Poverty is higher in the northern and coastal parts of the country and significantly lower in others, especially in Nairobi and the central parts of the country. Kenya’s wealth remains highly concentrated, it among the world’s most unequal societies. The incomes of the richest 20 per cent of the population rose steadily in the past decade to stand at 11 times more than the incomes of the poorest 20 per cent, leaving Kenya as East Africa’s second most unequal society after Rwanda. Kenya made nnotable progress in the social sectors during MTP I & II, between 2000 and 2015 in:
• Goal 2: Achieve Universal Primary Education: The primary school net enrollment ratio (NER) increased, with continued provision of resources under the free primary school programme.
• Goal 3: Promote Gender Equity and Empowerment of Women: The girl to boy ratio in primary school is close to gender parity.
• Goal 4: Reduce child mortality: Considerable progress has been made in reducing under five mortality and infant mortality.
• Goal 6: Combat HIV and AIDS, Malaria and other diseases: National HIV prevalence has declined.
The strategy was not as successful in eradicating extreme poverty and hunger (Goal 1), ensuring environmental sustainability (Goal 7), and developing a global partnership for development (Goal 8). Pprogress on improving maternal health (Goal 5) lagged seriously. In the view of the GoK, the main challenges in meeting the MDGs have been:
• Inadequate resources for financing MDG-related activities: this is cited as the main constraint.
• Crises, which have included the 2007/2008 post-election violence and more recent electoral tensions, the food and fuel crisis, terrorism and drought.
• Un-favorable international trade practices that continue to reverse gains.

xiv
The priorities of MTP III Economic: The Plan aims to achieve a sustained 10 per cent economic growth rate by 2022. It prioritises broad based, inclusive economic growth, as well as faster job creation, and reduction of poverty and inequality. To so, it will focus on building a pool of skilled, adaptive and enterprising labour, and promoting public-private partnerships in employment creation. In energy, the country prioritizes the expansion of the electricity supply, and the development of an oil industry (the first on-shore discovery in the Turkana rift was announced in 2012). Wider availability of more reliable electric power will enable enterprise development across the nation. And an oil industry will provide revenues and jobs. Tourism, as the third largest contributor to the GDP after agriculture and manufacturing and the leading foreign exchange earner, has the highest multiplier effect due to its linkage with other sectors. Agriculture provides 75 per cent of the country’s raw materials and contributes a quarter of the GDP. The Plan will realise its great growth potential and promote rural development. The Plan will undertake the key Vision 2030 flagship project - irrigating 1.3 million acres of land. Major investments in other infrastructure, input subsidies, support to farmers (especially women) and policy reforms on land titles and credit will increase production, easing endemic poverty and food insecurity. Wholesale, retail and international trade had been one of the most rapidly expanding areas of the Kenyan economy. Informal trade is the primary livelihood after smallholder agriculture. They are expected to expand substantially as the economy moves towards the 10 per cent growth target. The Plan will also focus on the maritime sector as a new frontier for social and economic growth. Manufacturing’s share of GDP has been stagnant or falling in recent years. Productivity is low. The role of the manufacturing sector as identified in Vision 2030 is to create jobs, generate wealth and attract foreign direct investment (FDI) inter alia by strengthening production capacity and increasing the utilization of R+D results. Emphasis will be given to Micro, Small and Medium Enterprises (MSMEs), which can reduce unemployment and spread growth to smaller towns. Structural changes will increase the manufacturing, industrial, and export sectors, the level and the productivity of investment, as well as raising productivity in all sectors of the economy. Business Process Outsourcing (BPO), a newly emerging sector, is expected to become a magnet for youth and young professionals, leading to a significant reduction of unemployment in this segment of society. Finally, the development of its well-functioning, modern financial system builds on Kenya’s existing comparative advantage in the sub-region and will provide the capital to meet investment needs towards developing Kenya into a middle-income country by 2030. To support these objectives and targets, the Plan will promote enablers: infrastructure; public sector reforms; science, technology and innovation (STI) and ICT. Social: The Plan will seek to provide quality basic education and training to meet the country’s manpower and skills development needs. It focuses on community-based approaches to improve access to essential services, including achieving universal health coverage. It seeks to progressively achieve universal access to water and sanitation. The Plan includes strategies to increase manpower, equipment and shared platforms for expert clinical consultation to provide health services and expertise across the 47 counties. The Plan adopts a multi-sectoral approach to HIV. It will address pesticide and heavy metal contamination of food and animal feeds. It will include strategies to combat harmful emissions and pollution from vehicles and industrial activities. The plan considers climate change impacts. Political: Priorities include preventing corruption and improving governance and accountability, deepening public sector reforms and strengthening the capacity of county governments as well as coordination between national and county governments. The strengthening of oversight institutions will improve service delivery and proper utilization of public resources. The monitoring and evaluation framework will be strengthened. Increased

xv
investment will also be made in developing ICT based data collection systems and sharing of data. The MTP III will also place emphasis on implementing the constitutional provision of the ‘no more than 2/3’ gender principle and empowerment of women, to reduce gender inequalities. Priority will also be given to programmes targeting eradication of gender-based violence. The UN role in the UNDAF 2018-2022 The primary entry point for the UN will be through catalytic funding for inspiration, advocacy, mobilization and partnership support to institutions and social groups committed to help realize the SDG Agenda. As Kenya is now a Middle-Income Country (MIC), aid is being reduced. In sectors such HIV/AIDS and nutrition there are serious sustainability issues for programmes. The UN will need to support the development of new financing mechanisms for key services. They also must better coordinate, reduce overheads and lessen opportunity costs. In pursuing the principle of Leave No One Behind (LNOB) the UNCT has developed a good understanding of the disadvantaged, vulnerable and excluded groups in Kenya; who they are and where. But this understanding is only based on partial data. The new UNDAF should support the development of national and county level data series on a range of metrics. Once available across groups and counties, it should be promoted widely to mobilize support for improved conditions, and to give politicians a basis to compete based on LNOB results and other SDG achievements2. The availability of robust LNOB data, comparable across groups and localities, will enable evidence-based decisions on national investment and UN programming. At present, the UN is working on a range of upstream policy issues, and in a range of downstream communities. The two are not always linked, and agencies are not always fully aligned. A process is needed to examine the data and decide upon the allocations of the UN’s limited capacities in support of national LNOB efforts. The largest numbers of those left behind are in urban, informal settlements, while the worst deprivations are found in specific rural areas, particularly among the ASALs including counties which host significant numbers of refugees. A strategy that focused on improving the conditions of specific communities in both types of areas, carefully selected based on the data, could build national momentum toward LNOB. An LNOB-oriented UNDAF strategy will entail trade-offs. A significant amount of the UN’s work is technical, around national policies and issues important to sector and segments of the general population. These efforts would need to be reviewed and aligned with LNOB efforts. Specifically, support to public authorities should support LNOB efforts, in policy and geography. An LNOB strategy will require substantial technical assistance to counties and departments of focus, including direct support beyond UN capacities. The UN should work with other partners to develop replicable programmes for capacity building, and capture lessons learned, so that these programmes are revised and improved as they are expanded to additional counties. Tracking the achievement of UN programmes in a decentralized setting will be important and difficult. A strengthened and empowered M&E group should create key metrics, and TA should be provided in each county for tracking progress.
2 National Human Development Reports and other flagship UN publications that disaggregate date at sub-national level have long been
used by politicians to promote ‘their’ constituency’s achievements, or to criticize the performance of their rivals. This creates a ‘virtuous spiral’ of rising expectation.

xvi
Making government more accessible and accountable depends on the performance of newly-devolved systems. The question of how to provide support to 47 counties is a key one for the GoK and all its partners. A UN strategy focused on LNOB in pilot counties can demonstrate a path forward. Growth is leaving rural Kenya behind, even as drought and climate change strain rural resilience. With UN help, Kenya must develop policies for rural investment and social support that lead to rural prosperity and sustainability. There is limited investment in some sub-sectors by both national and county level government: more investment is needed in infrastructure, education, health & nutrition, irrigation, food security, among others. And there is a need for conflict management around devolved functions, such as health. The UN should provide advisory services and direct support in these areas. Supporting devolution, especially strengthening national support to the counties, and the capacity of county governments, will remain a key priority. Select counties will become the primary partners of the UNCT in its efforts toward achieving ‘Leave No One Behind’ goals. To support the national-county link, the UNCT will need to more effectively Deliver as One ‘vertically’. This means creating work plans and coordination between UN national policy efforts and county-level TA and direct delivery initiatives. To work effectively at county level, the UNCT will need to greatly improve ‘horizontal’ Delivery as One. There have been promising experiments around county-level coordination. The UNCT should make far greater use of joint programming in close alignment with County Integrated Development Plans (CIDP), for greater ‘horizontal’ coordination. County governments are new and lack capacity. The UN should improve its current, limited operational coherence, to reduce the demands on counties of partnering with multiple UN agencies. In the UN’s work in gender, women’s empowerment and human rights, a similar process of vertical integration will be required. At the centre of this should be a scaled-up commitment to using the rights-based approach to mobilize rights holders. Building a more effective women’s movement, and other groups of rights holders, will be essential for rights to become and remain a priority. However, the empowerment of civil society itself is a sensitive issue, and the UN will need to invest heavily in high-level advocacy and national capacity building as well as at local level. Global and regional capacities are critical in promoting normative standards. The UNCT should build on its existing partnerships to bring positive support and assistance to bear on a range of rights issues. While Kenya is experiencing a reduction in the rate of population growth, the UN should support the process of building a national consensus in favour of a more rapid decline. Current economic growth is erratic and highly uneven across counties. Accelerated growth must be broad-based and inclusive. If not, serious and growing disparities could put Kenya’s social stability at risk, and ultimately undermine its growth trajectory. The UN has a role to play in promoting a national commitment to a more inclusive and balanced pattern of economic growth and formulating comprehensive policies and programmes to address and mitigate growing disparities, both geographically and among social groups. The UN’s role in building trust and helping to reduce disparities should be a consistent element in its work at national and county level. The UNDAF should provide support to a range of peace building, conflict resolution and transformational governance initiatives, promoting democratic

xvii
participation and human rights; devolution and accountability; and peace and community security. Disparities and perceived exclusion can also breed violent extremism. Addressing these in North-eastern counties of Kenya will call for innovative programming and partnerships to contribute to long term sustainability of youth empowerment initiatives. Effective preparedness, mitigation and response to natural and complex disasters will also be a key agenda. Disaster risk management and resilience must be treated as cross-cutting in the new UNDAF. The UN will reduce barriers (experienced currently in drought situations) between emergency response and longer-term preparedness and early recovery. The UNCT will also continue investing in innovative area-based and cross-border programmes to reduce vulnerability and increase resilience of communities. Ccommunicable, maternal, neonatal, and nutritional diseases continue to rank as main causes of deaths, with HIV being the deadliest. These diseases pose a challenge to the health budgets at national and county level, with a widening budget gap due to decline in external funding.3 The UN should continue its efforts in these areas, with a focus on health-care finance. Unless effective measures are taken, urbanization is bound to worsen the country’s rate of unemployment, which stands at around 40 per cent. Urbanization poses additional challenges to youth. The envisaged mega-city status of Nairobi calls for extensive and appropriate infrastructure development, if the concomitant transit problems are to be circumvented. Urban youth employment and urban planning should be key elements of the new UNDAF. Kenya faces a wide array of critical environmental challenges. These challenges are associated with all the other issues of focus of the UN. In the last UNDAF environmental, disaster preparedness and other related issues were bundled in a stand-alone area. Unfortunately, the challenges of coherence proved too great, and the approach was not successful. The UN could manage environmental issues on a stand-alone basis. Or environment could be managed through a matrix management approach: managed within each area but supported technically by a cross-area Environment Group. Whatever the UNCT’s choice, it should give continuing priority to this critical area. Critically for the UN, as Kenya is now a Middle-Income Country (MIC), aid is being reduced by donors. There remains a heavy reliance on donors for funding of certain sub-sectors, such HIV/AIDS and nutrition; there are serious sustainability issues for many programmes. The UN has been developing new approaches to financing for development. Partnerships will become as important as traditional development assistance in the next UNDAF. Promoting legislation and policy that support this shift will be a key, specific priority. The UN will need to strategically package its support. Some of the areas of key priority include support for high level upstream policy and legal issues linked to downstream priorities such as county-level LNOB efforts; development of knowledge management products, enhancing South-South and triangulation cooperation and county to county learning, and consolidation of flagship programmes to create replicable development products. Cross-sectoral opportunities for integration should be developed, and community level programming encouraged. In line with 2016 New York Declaration adopted by the General Assembly, the Kenyan government has officially confirmed its desire to implement the Comprehensive Refugee Response Framework (CRRF). This entails a greater socio-economic inclusion of both refugee and host populations to enhance development of refugee hosting areas in the ASAL regions.
3 NACC

xviii
Given the shortfall in financing for economic development programming, the UN should address these important issues at the upstream level, and downstream in in tandem with other initiatives in area-based programmes. The passage of PPP legislation will be particularly important in opening new approaches. In the next UNDAF cycle, a more ambitious and comprehensive integration of UN business operations is required, to enable the UNCT to operate coherently with national level partners and through hubs at county level. The UN should substantially reinforce communication as one to better communicate key messaging for results and to promote SDG-based partnerships around the UNDAF agenda. At both national and county level, the UN communications effort should focus on the organization, mobilization and support of rights holders. This is especially critical in supporting groups asserting rights in LNOB campaigns at county level.

Kenya: Common Country Assessment 2013-2017 1
1. THE UNITED NATIONS COMMON COUNTRY ASSESSMENT 1.1. Purpose and scope of the CCA The purpose of this Common Country Assessment (CCA) is to provide insights to guide the development of the new United Nations Development Assistance Framework (UNDAF) for the years 2018-2022. The CCA articulates the context, opportunities and challenges facing Kenya, encompassing sustainable development, human rights, gender equality, peace and security, and humanitarian perspectives. The CCA has been largely informed by the situational analyses that the Government of Kenya (GoK) and members of the UNCT have undertaken in preparation for the MTP III. These provide background information on past targets, achievements and challenges as well as taking stock of remaining challenges under the Second MTP 2014-2018. The CCA provides information and analysis to help the UN strategically and programmatically position itself in engaging with stakeholders in support of development of the UNDAF. The CCA will inform the UN Vision 2030, which will articulate the comparative advantages of the UN system in Kenya. The CCA identifies sources of data to support development of the overall theory of change and program logic of the UNDAF, including the assumptions, risks, indicators, targets and baselines of the UNDAF results framework. The assessment and analysis of the CCA is largely focused on the 2030 Agenda including the following: ➢ A situational analysis and assessment of the social, economic, political, policy and legislative
environment for achieving the SDGs, national commitments and priorities and obligations under international conventions ratified by the country;
➢ An analysis of assessment of risks (for different groups and geographic areas (each of the 47 counties), challenges, opportunities, potential trade-offs, national capacities and capacity gaps, policy enablers and limitations, while considering the UN system’s comparative advantage;
➢ An assessment that seeks to present an accurate picture of a national situation from the perspective of the principle of leaving no one behind;
➢ An assessment of financial system in the country in terms of the achievement of the SDGs, focusing primarily on domestic finance;
➢ An analysis of underlying and root causes of multidimensional poverty, inequalities and discrimination, and the reasons why particular groups are left behind;
➢ An analysis of the capacities of duty-bearers to fulfil their obligations and of rights-holders to make their claims;
➢ Gender and geographical analysis at the macro-, meso- and micro- levels; ➢ Conflict analysis was undertaken, focusing on underlying and root causes, and identifying
potential triggers as part of the early warning and conflict prevention roles of the United Nations.
1.2. Methodology This CCA has been largely based on secondary data from GoK and UN sources. Additional information gathering to fill in gaps has been undertaken by the UN agencies in partnership with governmental and non-governmental actors, leveraging UN system convening power to consult and engage with the government and other stakeholders, including the most vulnerable and marginalized people and their organizations. Review of existing sources (assessment, publications, research findings, analytical tools, big data, national surveys,) of disaggregated data (sex, income, age and other factors) both at national and global level was also undertaken with an aim of adding value while building partnerships with key stakeholders. Pertinent information has been obtained from a range of national sources including Annual Progress Reports (APRs) on implementation of the 2nd MTP, the Medium Term Review Report (MTR) of the second MTP, SDGs status reports, Vision Delivery Secretariat (VDS) Status Reports, Reports of the Presidential Delivery Team, Economic Surveys, Public Expenditure Reviews (PERs), Demographic and Health Surveys, Kenya Integrated Household Budget Surveys (KIHBS), Population Census Reports, National Spatial Plan Targets, APRM Reports, as well as a wide range of studies and reports of UN agencies, the World Bank, IMF, FAD, and EAC. This review has been complemented by specific

Kenya: Common Country Assessment 2013-2017 2
studies on critical areas such as policies and programmes to mainstream SDGs and climate change issues and generating employment, especially of youth. Data and information has been disaggregated to the extent possible covering the 47 counties. The CCA highlights the data gaps, noting the need to strengthen capacity to collect data and continuously fill the gaps through future assessment. Targeted analysis from existing data and resources has been undertaken by each of the UN agencies in line with their mandate. The preliminary findings of the report were validated by stakeholders at a workshop and through written comments after the workshop. Initial comments on the draft CCA were also made by members of the UNDAF 2018-2022 Steering Team. 1.3. Limitations The greatest limitation has been the many gaps in data to support comprehensive analysis of sectoral information as well as adequate and balanced analysis of all the 47 counties. This was partly occasioned by the fact that GoK had not finalised its Country Situation Analysis, nor chosen relevant indicators by the time work on this CCA started. The second limitation has been a severe time constraint. The agreement between the GOK and the UNCT in mid-2017 that the next UNDAF should be developed in parallel with the MTP III is positive and important but has meant that work on the CCA had to take place in parallel with the UNDAF final evaluation and the process of strategic prioritization for the new UNDAF. This created difficulty in providing timely inputs to the prioritization process. The third limitation is financial. The current, multiple processes for UNDAF development are rigorous, but require funding that is increasing difficult to mobilize. Due to the unavailability of timely funding, the CCA process started almost two months later than planned. 1.4. Conceptual Framework for the CCA This CCA is a prelude and input to the preparation of UNDAF for Kenya 2018-2022. As in the previous UNDAF for Kenya (2014-2018), UNDAF 2018-2022 will be developed per the principles of UN Delivering as One (DaO), aimed at ensuring Government ownership, demonstrated through UNDAF’s full alignment to Government priorities as defined in the Vision 2030 and Medium-Term Plan III, as well as internal coherence among UN agencies and programmes operating in Kenya. Kenya’s Vision 2030 and MTPs make clear that the goal of all development activities is the achievement of a better quality of life for all Kenyans. Improved quality of life means having access to adequate housing, sufficient income, quality education and health services. It also means adequate personal and human security for everyone. Overall, it means filling those quantity and quality gaps that have been challenging for the average Kenyan to date. At the macro level, two key contributors to an improved quality of life in the context of Kenya are economic growth and transformation. Economic growth is essential and a necessary ― but not sufficient ― condition for poverty reduction. Poverty reduction, in turn, contributes to economic growth. A series of thematic areas underlie these two macro areas and the entire framework is underpinned by crosscutting issues, which contribute to achievements on both sides.

Kenya: Common Country Assessment 2013-2017 3
2. INTRODUCTION 2.1. Geographic, Political and Socio-economic Overview Kenya, located in East Africa, is bordered by Tanzania to the south, Uganda to the west, South Sudan to the northwest, Ethiopia to the north, Somalia to the northeast and the Indian Ocean to the southeast.4 The country has a territory of 582,640 kilometres. Kenya’s climate is diverse, ranging from tropical in southern, western and central regions, to arid and semi-arid in the north and northeast.5 Meanwhile, the country’s central highlands have an equatorial climate.6
Disparities in volume and distribution of rainfall have a significant effect on Kenya’s population. Many parts of the country cannot produce sufficient food from rain-fed agriculture, and therefore are exposed to frequent food insecurity. The arid and semi-arid lands (see Figure 1) depend mainly on livestock production, which is often adversely affected by drought.7 4 Kenya National Bureau of Statistics et al, Kenya Demographic and Health Survey 2014, 2015 at https://dhsprogram.com/pubs/pdf/fr308/fr308.pdf 5 UNDP, About Kenya, at http://www.ke.undp.org/content/kenya/en/home/countryinfo.html, accessed 11 March 2017 6 Ministry of Education, Science and Technology, Education for All: the 2015 national review, 2014, at
http://unesdoc.unesco.org/images/0023/002316/231637e.pdf 7 Ministry of Education, Science and Technology, Education for All: the 2015 national review, 2014, at http://unesdoc.unesco.org/images/0023/002316/231637e.pdf
Figure 1: Kenya in Counties and by Climate
Equatorial Climate Counties
ETHIOPIA
S. SUDAN
UGANDA S
O
M
A
L
I
A
INDIAN
OCEAN
TANZANIA

Kenya: Common Country Assessment 2013-2017 4
2.1.1. Demography Kenya’s population in 2017 was estimated at 49.6 million, with a population growth rate estimated at about 1.5 million per year.8 This is largely because in recent years the number of registered births has far exceeded the number of registered deaths910. Recent figures suggest that children aged 0-18 years are 49 per cent of the total population.11
Figure 2: Number of births and deaths 2011-2015
Source: Department of Civil Registration
While the current, large youth cohort offers a potential ‘demographic dividend’ if economic growth accelerates, prolonged, rapid growth in population size is a long-term constraint to national development. Kenya’s Population Policy for National Development proposes a reduction in the fertility rate to two children per woman by 2050. If this is achieved, the population will increase to 59 million in 2030 and 75 million in 2050, with the proportion of the population aged below 15 years decreasing to 33 and 25 per cent respectively.12
8 UN Data, Country Profile: Kenya, at http://data.un.org/CountryProfile.aspx?crName=kenya 9 Kenya National Bureau of Statistics, Statistical Abstract, 2016, at http://www.knbs.or.ke/index.php?option=com_phocadownload&view=category&id=106&Itemid=1177 10 It should be noted that in 2015, the most recent year that data is available, birth registration coverage was 62.2 per cent and death registration coverage 45.8 per cent. The Civil Registration Department is seeking to improve coverage. Information provided by UNICEF based on Civil Registration Department, Annual Report for 2015 11 UNICEF, Multidimensional Child Poverty in Kenya, Draft, November 2016 12 National Council for Population and Development, Population Policy for National Development, July 2013, via http://ncpd-ke.org/ncpdweb/Main_policies

Kenya: Common Country Assessment 2013-2017 5
Figure 3: Population of Kenya by year: 2009 to 2018
Source: UN Data, Country Profile: Kenya, at http://data.un.org/CountryProfile.aspx?crName=kenya
Kenya has a diverse population comprising 43 ethnic communities13 that includes three of Africa's major sociolinguistic groups: Bantu (67 per cent), Nilotic (30 per cent), and Cushitic (3 per cent). Around 80 per cent of Kenyans are Christian, 10 per cent Muslim, and others follow traditional African religions, other faiths or none.14 Ethnic tensions periodically lead to violence. The rapid urbanization experienced by Kenya over the last decade has increasingly affected the living conditions of the populace. More than a third of the population live in urban areas, and two thirds of the current urban population live in informal settlements.15 It is projected that by 2033, half of the population will be residing in towns and cities.16 Urban growth is driven by rural-urban migration as people seek employment and to escape the effects of climate change. High property prices in urban areas force many households into informal settlements without basic amenities such as safe drinking water, sanitary and drainage systems and other infrastructure.17 2.1.2. Economy and Living Standards With a per capita income of US$1,455 in 2016,18 Kenya is now a lower-middle income country. Kenya’s Human Development Index (HDI) value for 2015 was 0.555, which put the country in the medium human development category and 146th out of 188 countries and territories, slightly higher than the average for Sub-Saharan Africa (0.523). However, when adjusted for inequality, the Kenyan figure falls to 0.391. Kenya’s Gender Inequality Index score of 0.565 is lower than the average for Sub-Saharan Africa, because of the low proportion of women in parliament and low female labour force participation.19
13 The Makonde community were officially recognized as the 43rd tribe in Kenya in February 2017 [Daily Nation, Makonde Granted Kenyan Citizenship, 1 February 2017, at http://www.nation.co.ke/counties/kwale/makonde-granted-Kenyan-citizenship/3444918-3796210-xx1iiw/index.html] 14 Ministry of Education, Science and Technology, Education for All: the 2015 national review, 2014, at http://unesdoc.unesco.org/images/0023/002316/231637e.pdf 15 UNICEF, UNICEF – KCO MTR Report, 2016 16 African Development Bank, Kenya Country Strategy Paper 2014-2018, February 2014, at https://www.afdb.org/fileadmin/uploads/afdb/Documents/Project-and-Operations/2014-2018_-_Kenya_Country_Strategy_Paper.pdf 17 WFP, Comprehensive Food Security and Vulnerability Analysis (CFSVA): Kenya 2016, 2016, at http://documents.wfp.org/stellent/groups/public/documents/ena/wfp285586.pdf 18 World Bank, GDP Per Capita (current US$), at http://data.worldbank.org/indicator/NY.GDP.PCAP.CD, accessed 5 July 2017 19 UNDP, Briefing Note for Countries on the 2016 Human Development Report, 2016, at http://hdr.undp.org/sites/all/themes/hdr_theme/country-notes/KEN.pdf

Kenya: Common Country Assessment 2013-2017 6
In recent years, Kenya has seen robust economic growth underpinned by a stable macroeconomic environment, continued low international oil prices and a stable Kenyan Shilling. Growth reached an estimated 5.9 per cent in 2016, compared to a revised growth of 5.7 per cent in 2015. Growth was expected to rise to 6.1 per cent by 2018,20 but this projection has been revised downward to 4.9 per cent21 because of drought and the unprecedentedly long electioneering period in 2017. Despite these good results, the trend remains well below the 10 per cent target of Vision 2030, the Government’s longer-term development plan22 This 10 per cent target is the level of sustained economic growth required to reverse youth unemployment and achieve the desired demographic dividend. Kenya is running a persistent current account deficit: in 2015, the current account deficit equalled 11.4 per cent of gross domestic product (GDP) – the highest deficit as a share of GDP in the East African Community (EAC) region, and far above the continental average. This deficit is financed increasingly through foreign exchange income, because of growing remittances from abroad.23 Annual average inflation eased to 6.3 per cent in 2016 compared to an average of 6.6 per cent in 2015. This was mainly due to decline in prices of transportation; housing and utilities; and communication. The World Bank has warned that high borrowing rates may reduce the country’s room to manoeuvre economically, but stresses that fiscal consolidation should not take place in a way that compromises critical public investments.24 In 2016 agriculture made up the largest share of Kenya’s economy (32.6 per cent), primarily the growing of crops (25.9 per cent) and animal production (4.4 per cent).25 About 75 per cent of the workforce is engaged in agriculture, mainly as subsistence farmers, and most urban residents periodically leave the cities to assist on family farms.26 Kenya’s main agricultural products include tea, coffee, cattle, maize, and sugarcane.27 The country’s agricultural sector is facing major challenges, including stagnant or declining productivity levels, poor access to input markets and low value addition of most agricultural exports. Only about 6-8 per cent of Kenya’s land has been irrigated, leaving smallholders highly vulnerable to droughts and floods.28 Manufacturing accounts for 9.2 per cent of official GDP.29 Other key economic sectors in Kenya include tourism, services, transport, communications and limited mining.30Kenya is currently experiencing rapid electrification. Nevertheless, a significant proportion of energy is still from biomass, particularly wood fuel and charcoal.31 Generation of energy comes from several sources including hydropower, fossil fuels and geothermal.Unemployment stands at around 40 per cent. Even grimmer is the fact that 8 out of every 10 jobless Kenyans are youth aged between 15-34
20 World Bank, Kenya Economic Update, April 2017, http://documents.worldbank.org/curated/en/988191491576935397/pdf/114115-NWP-PUBLIC-add-series-86p-Kenya-Economic-Update-FINAL-Edition-15.pdf 21 http://www.nation.co.ke/business/Kenya-s-economic-fortunes-tied-to-political-settlement/996-4219294-gksv7xz/index.html 22 Government of Kenya, Vision 2030: the Popular Version, 2012, at www.vision2030.go.ke/lib.php?f=vision-2030-popular-version 23 Laura Giles Álvarez, Florian Krӓtke, Zach White, Alexandra Murray-Zmijewski and Stanley Karuga, County Public Expenditure Review for the Health and Wash Sectors in Kenya: Draft for validation, Oxford Policy Management, January 2017 24 World Bank, Kenya Economic Update, April 2017, http://documents.worldbank.org/curated/en/988191491576935397/pdf/114115-NWP-PUBLIC-add-series-86p-Kenya-Economic-Update-FINAL-Edition-15.pdf 25 Kenya National Bureau of Statistics, Statistical Abstract, 2017, via http://www.knbs.or.ke/index.php?option=com_phocadownload&view=category&id=107&Itemid=1181 26 Ministry of Education, Science and Technology, Education for All: the 2015 national review, 2014, at http://unesdoc.unesco.org/images/0023/002316/231637e.pdf 27 UNDP, About Kenya, at http://www.ke.undp.org/content/kenya/en/home/countryinfo.html, accessed 11 March 2017 28 WFP, Comprehensive Food Security and Vulnerability Analysis (CFSVA): Kenya 2016, 2016, at http://documents.wfp.org/stellent/groups/public/documents/ena/wfp285586.pdf 29 Kenya National Bureau of Statistics, Statistical Abstract, 2017, via http://www.knbs.or.ke/index.php?option=com_phocadownload&view=category&id=107&Itemid=1181 30 UNDP, About Kenya, at http://www.ke.undp.org/content/kenya/en/home/countryinfo.html, accessed 11 March 2017 31 Institute of Economic Affairs, Situational Analysis of Energy Industry Policy and Strategy for Kenya, 2015, at http://dspace.africaportal.org/jspui/bitstream/123456789/34928/1/Situational-Analysis-of-Energy-Industry-Policy-and--Strategy-for-Kenya%20(1).pdf?1

Kenya: Common Country Assessment 2013-2017 7
years32. Most families in Kenya are continuously at risk of poverty or reduced living standards due to a crisis or shock. These crises can be due to illness or disability; ageing unemployment; the death of livestock; a drought or flood; or an economic recession. Any of these challenges can lead to falling living standards and the lower their incomes, the less able families are to cope with risks.33 2.1.3. Politics and System of Governance The Government is headed by a President and Deputy President, and currently includes 18 Cabinet Ministers, the Attorney General and the Director of Public Prosecutions. A bicameral legislature includes 337 Members of the National Assembly and 67 Senators. General elections are held every five years. The judiciary is made up of the Supreme Court, the High Court and subordinate courts.34 Post-election violence has been a feature of national elections in 1992, 1997, and 2007, and tensions have been high around the 2017 election. This violence usually involves tensions between ethnic groups supporting the government, and groups that perceive themselves marginalized. Impunity and corruption are major issues, as are exclusion and inequality. In 2010, Kenya adopted a new constitution, which provides explicit protection for a broad range of human rights, as well as a devolved system of governance. The implementation of the constitution and realization of its guarantees is an ongoing challenge. Forty-seven county governors now oversee provision of public services in many areas, including several social sectors. Through its funding formula and governance structures, the devolved system is intended to ensure equitable distribution of national and local resources and to promote the participation of citizens in decision making on issues that affect them at local level.35 2.2. Emerging Issues Kenya’s current economic growth puts it potentially on track to consolidate its newly-attained middle-income country status, and to take advantage of the opportunities of a potential demographic dividend, in which a falling birth rate and increased employment for the resulting bulge in the working age cohort lower the national dependency ratio. Such a dividend would provide a fundamental boost for the creation of the prosperous society for all that Kenya is committed to build. However, many interconnected issues must be addressed for the dividend to occur, and for it to have the desired effect. First, the acceleration of economic growth must continue and stabilize at a high level. However, current growth is erratic and highly uneven across counties. To be maintained, growth must be broad-based and inclusive. If not, serious and growing disparities could put Kenya’s social stability at risk, and ultimately undermine its growth trajectory. National commitment to a more inclusive and balanced pattern of economic growth is a key issue for the nation, as is the related challenge of formulating comprehensive policies and programmes to address and mitigate growing disparities, both geographically and among social groups. Second, while Kenya is experiencing a reduction in the rate of population growth, a national consensus must be built in favour of a more rapid decline. This will require a strong and consistent leadership support, and a major investment in the education and empowerment of girls and women. Third, the root causes of social tensions within Kenyan society must be firmly addressed, if the social stability required for accelerated growth is to be maintained. As recent elections have demonstrated, the strains attendant on uneven development have polarized politics and frayed social trust. This in turn risks undermining the national idea and promotes social conflict. Persistent
32 http://www.worldpolicy.org/blog/2014/03/24/kenyas-emerging-cities-dilemma 33 World Bank and Government of Kenya, Kenya Social Protection Sector Review, Draft, June 2017 34 UNDP, About Kenya, at http://www.ke.undp.org/content/kenya/en/home/countryinfo.html, accessed 11 March 2017
35 UNDP, About Kenya, at http://www.ke.undp.org/content/kenya/en/home/countryinfo.html, accessed 11 March 2017

Kenya: Common Country Assessment 2013-2017 8
perceptions of high levels of corruption and lack of accountability further contribute to social alienation. Disparities and perceived exclusion can also breed violent extremism. Limited strategies to address insecurity, especially in North-eastern counties of Kenya, hamper realization of results. Fourth, Kenya’s bold programme of devolution to county level promises to make government more accessible and accountable to the people. But this depends on the performance of the newly-devolved systems and structures. Significant support will be required to assure their responsiveness and achievement. The question of how to provide such support to 47 counties is a key one for the GoK and all its partners. There is also limited Investment in some sub-sectors by both national and county governments: more investment is needed in infrastructure, education, health & nutrition, irrigation, and food security, among others. And there is a need for conflict management around devolved functions, such as health. Despite devolution, the country remains predominantly rural, while economic growth is largely an urban phenomenon. Growth is leaving rural Kenya behind, even as drought and climate change strain rural resilience. Kenya must develop policies for rural investment and social support that lead to rural prosperity and sustainability. In two of the most disadvantaged ASAL counties who continue to host large refugee populations, the significant resources used to sustain the refugees and significant infrastructure put in place in their camps, should be leveraged as a vehicle for development, e.g. in basic services, for the greater benefit of the counties and their people. Fifth, Kenya has made significant progress on controlling infectious diseases, resulting in increase in life expectancy. However, communicable, maternal, neonatal, and nutritional diseases continue to rank as main causes of deaths, with HIV still ranking the highest in terms of premature deaths/years of life lost. Moreover, these diseases pose a challenge to the health budgets at national and county level. For example, the Kenya HIV response is projected to increase from US $1,115 million in 2017 to $1,283 million in 2022, with a widening budget gap due to declines in external funding. Sixth, Kenya is experiencing a rapid rate of urbanisation, which continues to increase pressure on urban authorities to meet the needs of growing urban populations. The 35 per cent who now live in cities and towns are projected to grow to more than 50 per cent by 2030. Unless effective measures are taken, this is bound to worsen the country’s rate of unemployment. Lastly, but critical to the national development agenda, Kenya is now a Middle-Income Country (MIC) and aid is being reduced by donors. There remains a heavy reliance on donors for funding of certain sub-sectors, such HIV/Aids and nutrition, and there are serious sustainability issues for many programmes. There is a pressing need for the UN to more strategically package its support to the GOK. Some of the areas of key priority include support for high level upstream policy and legal issues linked to downstream priority focus sectors and geographic areas of focus, development of knowledge management products for the GOK given the new role the country will play within the region, enhancing South-South and triangulation cooperation and county to county learning, and consolidation of flagship programs to draw replicable development products. Cross-sectoral opportunities for integration should be developed, and community level programming encouraged. 2.3. Kenya Vision 2030 Kenya’s transformative agenda is outlined in the country's long-term development blueprint, the Kenya Vision 2030. The overarching goal of the Vision is to create “a globally competitive and prosperous country with a high quality of life by 2030”. It aims to transform Kenya into “a newly industrialized, middle income country providing a high quality of life to all its citizens in a clean and secure environment”. Simultaneously, the Vision aimed to achieve the Millennium Development Goals (MDGs) for Kenyans by 2015 and now the Sustainable Development Goals (SDGs). The Vision is anchored on three key development pillars: economic; social; and political, implemented through a series of successive five-year medium-term plans (MTPs). The theme of the recent MTP II is "transforming Kenya: pathway to devolution, socio-economic development, equity
Kenya: Common Country Assessment 2013-2017 9
and national unity". The Government of Kenya is in the process of finalizing its Third Medium Term Plan (MTP III), which will be informed by findings, lessons, conclusions and key recommendations of the final review of MTP II and the priorities of the newly elected government after the October 2017 elections. The MTP III will endeavour to move the economy towards a high growth trajectory, aiming for a 10 per cent annual growth rate by the end of the Plan period. It will prioritize policies, programmes and projects which generate broad based, inclusive economic growth, as well as faster job creation; reduction of poverty and inequality; address climate change impacts; and enable Kenya to meet the 17 (SDGs) and the goals of African Union Agenda 2063. Kenya participated in the SDGs formulation processes at national, regional and global levels including during the adoption of the SDGs Agenda. The Agenda was adopted while Kenya was already implementing its long term economic blueprint for 2030. The three key pillars of Kenya Vision 2030 provide the framework for the integration of the three dimensions of sustainable development. The Economic Pillar aims to achieve and sustain an average economic growth rate of 10 per cent per annum until 2030. The Social Pillar seeks to build a just and cohesive society with social equity in a clean and secure environment. The Political Pillar aims to realise a democratic political system founded on issue-based politics that respects the rule of law and protects the rights and freedoms of every individual in Kenyan society. The Political Pillar is focussed on Moving to the Future as one Nation. The Pillars are supported by enablers with macro and/or micro foundations. The enablers consist of Infrastructure; Information and Communications Technology (ICT); Science, Technology and Innovation (STI); Land Reforms; Public Sector Reforms; Labour and Employment; National Values and Ethics; Ending Drought Emergencies (EDE); Security; Peace Building and Conflict Resolution. The Vision outlines flagship projects in each sector. Kenya is focusing on the following key sectors with potential to deliver 10% economic growth per annum:
1. Tourism; 2. Agriculture (Agro-processing); 3. Wholesale & Retail trade; 4. Manufacturing; 5. IT enabled Services/Business Process Outsourcing; 6. Financial Services and 7. Oil, Gas & Mineral resources.
For social development, and to meet the basic needs of its people, Kenya is investing in transformation in six key social sectors:
1. Education and Training; 2. Health including HIV and AIDS; 3. Water and Sanitation; 4. Environment; 5. Housing and Urbanisation; 6. Gender, Youth and Vulnerable Groups
2.4. The Kenya MTP III The Third Kenya Vision 2030 Medium Term Plan: 2018-2022 (MTP III) is guided by Kenya Vision 2030, the constitution of Kenya and the priorities of the government and strives to meet the 17 Sustainable Development Goals (SDGs) and the goals of African Union Agenda 2063. It contains many areas of priority of importance to the United Nations: 2.4.1. Economy The Plan aims to achieve a sustained 10 per cent economic growth rate by the end of the Plan period. It prioritises policies, programmes and projects to generate broad based, inclusive economic growth, as well as faster job creation, and reduction of poverty and inequality.

Kenya: Common Country Assessment 2013-2017 10
The MTP will thus focus on creation of sustainable and decent employment opportunities, creation of green jobs and building a pool of skilled, adaptive and enterprising labour force. It will also aim at improving labour market efficiency, strengthening the labour administration system and social dialogue, and promoting public-private partnerships in employment creation. Focus will also be on establishing more youth polytechnics and TIVET institutions to impart the requisite technical skills. The Plan aims at effecting structural changes to increase the shares of the manufacturing, industrial, and export sectors. It seeks to increase the level and the productivity of investment, as well as raising productivity in all sectors of the economy. The Plan prioritises development of the country’s increasingly important oil and mineral resources sector. The MTP III accords priority to investment in infrastructure to support that sector. It will also focus on the maritime sector as a new frontier for social and economic growth. To support these objectives and targets, the Plan will accord priority to enablers such as infrastructure; public sector reforms; science, technology and innovation (STI) and ICT. Increased budgetary resources will be allocated to development spending over the course of the Plan period, to complete key infrastructure projects initiated during the Second MTP period and adequately fund planned new infrastructure projects. The Plan will put in place incentives to attract both domestic and foreign investment including increased reliance on Public Private Partnerships (PPPs). The Plan will also aim at strengthening social and political sectors to facilitate faster development and socioeconomic transformation of the country. The MTP III will increase domestic savings and investment (including FDI). The Plan will also adopt the new framework for financing development and SDGs which relies on interdependent mix of financial resources, technology, and capacity building initiatives and other innovative means of implementation. The plan stresses improved budget implementation, to increase absorptive capacity especially for development projects. Specific economic sectors to be supported by the MTP III include Micro, Small and Medium Enterprises (MSME), and maritime transport and fisheries (the ‘Blue Economy’). The Plan will undertake the Vision 2030 flagship project - irrigating 1.3 million acres of land - and a range of other agricultural goals: rejuvenation of agricultural extension and advisory services, value addition of agricultural products, expanding creating markets, regional integration, and improving competitiveness. 2.4.2. Social The Plan will seek to provide relevant, quality education and training to meet the country’s manpower and skills development needs. It focuses on community-based approaches to improve access to essential services, including achieving Universal Health Coverage. It seeks to progressively achieve universal access to water and sanitation. In view of the rise in non-communicable diseases, the Plan includes strategies to increase relevant manpower, related equipment and machinery, and shared platforms for expert clinical consultation to provide shared skills and expertise across the 47 counties. HIV is a major challenge to the achievement of the national Vision 2030. The MTP III adopts a multi-sectoral approach. Food safety is an emerging issue in the country in the last decade. The Plan will address issues related to pesticides and heavy metal contamination for safe production of food and animal feeds. Additionally, the Plan will include strategies to combat harmful emissions and pollution from vehicles and industrial activities. The plan considers climate change impacts. 2.4.3. Political Emphasis will be placed on preventing corruption and improving governance and accountability, deepening public sector reforms and strengthening the capacity of county governments as well as coordination between national and county governments. Efforts to ensure improved security, access to the criminal justice systems and to mitigate against violent extremism will be prioritized. The strengthening of oversight institutions will be prioritized to ensure service delivery and proper utilization of public resources.

Kenya: Common Country Assessment 2013-2017 11
The monitoring and evaluation framework National Integrated Monitoring and Evaluation System (NIMES) will also be strengthened to better track implementation of national and county governments’ development programmes and projects. A key objective of the MTP III will be to meet the Sustainable Development Goal (SDG) targets. The Cabinet has approved the mainstreaming of the 17 SDGs by Ministries, Counties, Departments and Agencies (MCDAs) in their policy, planning, programmes and budgeting. MCDAs will be expected to report on monitoring indicators identified by Kenya National Bureau of Statistics (KNBS). Increased investment will also be made in developing ICT based data collection systems and sharing of data across government entities through electronic means. The Third MTP will also place emphasis on implementing the constitutional provision of the ‘no more than 2/3’ gender principle and empowerment of women, to reduce gender inequalities in public and private spheres. Priority will also be given to programmes targeting eradication of Gender Based Violence.

Kenya: Common Country Assessment 2013-2017 12
3. ECONOMIC GROWTH AND POVERTY REDUCTION 3.1. The Economic Pillar in MTP III 36 Kenya aims to increase annual GDP growth rates to 10% and to maintain that average till 2030. The strategy for attainment of 10% growth requires macro-economic stability and focuses on six economic areas: sustainable energy for all, tourism, agriculture and livestock, wholesale and retail trade, manufacturing, business process outsourcing, and financial services. These six provide approximately half of the country’s formal employment. However, as shown in the table below, the two sectors that employ the greatest number of low-earning workers, agriculture and trade, have been performing far less strongly than the national average recently, and their selection (along with manufacturing) is a strategic choice to accelerate overall growth by giving priority to addressing the greatest weaknesses of the economy. But with this choice come the considerable difficulties of addressing entrenched structural and social impediments to growth, in these and the other priority sectors. The objective of the MTP III is to move the entire economy up the value chain, to achieve higher and sustainable growth. The six priority economic areas include four high-employment sectors and potential new major sources of employment (business process outsourcing and financial services). Accelerated growth in the six will strongly expand employment, especially for youth, thereby reducing poverty and increasing equity.
Table 1: Growth in Select Sectors, 2015-2016 GROWTH IN SELECT SECTORS
Agriculture, forestry & fishing Mining and quarrying Wholesale and retail trade Information and Communication Financial and Insurance activities Construction Electricity supply Transport and storage Real estate
2015 5.5
12.4 5.9 7.4 9.4
13.9 11.5 8.0 7.2
2016 4.0 9.5 3.8 9.7 6.9 9.2 9.1 8.4 8.8
Source: Kenya National Bureau of Statistics, 2017 To support growth in the six economic areas of priority, and the wider economy, priority will also be given to select ‘enablers’: infrastructure; information and communication technology; and science, technology and innovation. For each sector, investment in the enablers is among the highest priorities. To achieve the envisioned high growth trajectory, the MTP III strategy is to take measures to increase both the level of investment and enhance the productivity of investment, as well as raising productivity in all sectors of the economy. Additionally, the plan will attempt to effect structural changes to increase the shares of the manufacturing, industrial, and exporting sectors in the economy.
36 This section is based on the 3rd Medium-Term Plan of the Vision 2030 (Part 1: The Background), the Second Annual Progress Report on the Implementation
of the First Medium-Term Plan (2008-2012) of Kenya Vision 2030 (Part II: The Challenges), and the National Business Agenda “Realizing the Potential of the Private Sector in Kenya” by the Kenya Private Sector Alliance (Part III: The Way Forward)

Kenya: Common Country Assessment 2013-2017 13
3.1.1. The role of the priority sectors In energy, the country prioritizes the expansion of the electricity supply, and the development of an oil industry (the first on-shore discovery in the Turkana rift was announced in 2012). Wider availability of more reliable electric power will enable enterprise development across the nation. And an oil industry will provide revenues and jobs. Tourism, as the third largest contributor to the GDP after agriculture and manufacturing and the leading foreign exchange earner, has the highest multiplier effect due to its linkage with other sectors. Agriculture, which provides 75 per cent of the country’s raw materials and contributes a quarter of the GDP has great growth potential and crucial socio-economic importance especially for rural development. Wholesale, retail and international trade had been one of the most rapidly expanding areas of the Kenyan economy (wholesale and retail trade grew by an average of more than 10% during the ERS period). They are expected to expand substantially as the economy moves towards the 10 per cent growth target. The role of the manufacturing sector as identified in Vision 2030 is to create jobs, generate wealth and attract foreign direct investment (FDI) inter alia by strengthening the production capacity and increase the utilization of R+D results. Business Process Outsourcing (BPO), a newly emerging sector, is expected to become a magnet for youth and young professionals, leading to a significant reduction of unemployment in this segment of society. Finally, the development of its well-functioning, modern financial system builds on Kenya’s existing comparative advantage in the sub-region and will provide the capital to meet investment needs towards developing Kenya into a middle-income country by 2030. 3.1.2. Growth targets, patterns and trends Vision 2030 calls for high and sustained economic growth, to more fully employ its youth and reap a potential demographic dividend, making it an upper middle-income country by 2030. Kenya's prospects for long-term growth are among the most favorable in East Africa. Sustained by its investments in infrastructure, its location as a regional business hub, and gradual improvements in governance and public-sector capacity, it is expected to keep growing steadily, according to projections by the World Bank and the International Monetary Fund.37 In 2015, the government stated its aim to reach the top 50 of the World Bank index on ease of doing business by 2020. The main success story in the 2017 report is the continued rise of Kenya, which moved up 21 places from 113th last year to 92nd in 2017, placing it third in the list of the world’s top 10 most improved economies, alongside other booming middle-income economies such as the UAE, Indonesia and Kazakhstan. The Kenya results were overwhelmingly positive. Kenya’s rise in the rankings was driven by huge strides forward in four key categories: starting a business, getting electricity, protecting minority investors and resolving insolvency. However, despite a solid, positive performance compared to others globally and regionally, Kenya’s economic growth has been well below the Vision 2030 target rate of at least 10% per annum. It has averaged between 5 and 6%, over the period covering MTP I (2008-2012) and MTP II (2013-2017).
37 ruralpovertyportal.org

Kenya: Common Country Assessment 2013-2017 14
Figure 4: Overall Economic Growth, 2012-2016
Source: Kenya National Bureau of Statistics, 2017
For the last several years, Kenya’s growth has been in line with that of other developing countries experiencing a positive trajectory. As of 2015, Kenya had a GDP of $69.977 billion making it the 72nd largest economy in the world. Per capita GDP was estimated at $1,587.38 However, its growth remains slightly below the EAC average.
Table 2: GDP Growth Rates and Projections for Select Developing Countries
GDP Growth Rates and Projections for Select Developing Countries
Country 2015 2016 2017*
China 6.9 6.7 6.5
Uganda 4.8 4.9 5.5
Tanzania 7.0 7.2 7.2
Rwanda 6.9 6.0 6.0
Burundi -4.0 -0.5 2.0
EAC 5.8 6.1 6.3
South Africa 1.3 0.3 0.8
Source: OECD and World Economic Outlook [IMF] *Projections And, despite Kenya’s entry into low middle-income status, poverty levels are high, largely because of unequal income distribution. Kenya is the country with the most unequal income distribution in the five East African countries39. Sectoral sources of growth In devising the MTP III, the six productive sectors chosen as priorities for the Economic Pillar were each deemed to have the potential of contributing to raising the annual economic growth rate to the target 10 per cent level sought in the MTP, based on recent performance and trends. However, with an average growth rate of 3.7% in the decade 2000-2009, 5.6% in 2010 and around 5% for both 2011 and 2012, the average performance across these six major sectors had lagged the economy in the past.
38 https://en.wikipedia.org/wiki/Economy_of_Kenya
39 http://iequalities.sidint.net/soea, Economic Inequality in Kenya; ttps://wp.nyu.edu/economicinequality/2017/04/03/economic-inequality-in-kenya/; March 2017

Kenya: Common Country Assessment 2013-2017 15
Measures to accelerate their growth of the six sectors have had a positive effect, though drought has curbed production. According to the 2017 Economic Survey, agriculture, forestry and fishing value added decelerated from a revised growth of 5.5 per cent in 2015 to 4.0 per cent in 2016. This slow growth was influenced by insufficient rains during the short rain period. The sector has been negatively affected by the 2017 drought as well. Growth in construction, mining and quarrying and finance and insurance decelerated in 2016, but remained very strong. Other sectors that registered significant improved performance were information and communication; real estate; and transport and storage. Accommodation and food services recorded improved growth of 13.3 per cent in 2016 compared to a contraction of 1.3 per cent in 2015. Persistent drought hampered growth in the fourth quarter of 2016, impacting negatively on electricity supply. 3.1.3. Objectives for the MTP III priority sectors and their challenges 40 Tourism: Endowed with a unique combination of attractions, Kenya is a leading tourist destination in sub-Saharan Africa, with significant potential for tourism growth. Tourism is highly competitive and sensitive to price changes, but premium parks and niche products are so unique that they can be marketed successfully at higher prices. Issues and challenges include insecurity nurtured by income inequalities, unemployment and poverty. There is inadequate infrastructure support to cater for the expected high tourist numbers and limited product diversity with a concentration on only a few parks. Inadequate bed capacity and shortages of sufficiently skilled human resources limit growth, especially in the high-end segment (4 to 5-star hotel categories) and in the new tourism circuits of Western Kenya and North-Eastern Regions. The situation analysis of the MTP pointed to an overreliance on tourists from western countries, which renders the sector vulnerable to external shocks, and called for leveraging the huge national and regional potential. Growth and development of the sector is also hampered by inadequate financing. This particularly affects tourism marketing, which is crucial, given the stiff competition from other tourism destinations in Africa (e.g. South Africa). In order to address the challenges and to proceed with the development of the tourism sector, a range of flagship projects, niche products and supportive programs were initiated under the MTP II. Three new resort cities were to be constructed in Isiolo, Diani and Kilifi with the aim of attracting economic activities and investments and achieving structural multiplier effects in the specific regions. In the same way rehabilitating and expanding existing facilities and infrastructure is aimed at attracting new investment in under-utilized parks. In addition to eco- and cultural tourism initiatives, measures are aimed at developing the capacity of Kenyans to participate in the industry as entrepreneurs and investors. The government, together with Private Sector stakeholders is also promoting specific investments in hotels by international chains and to increase the proportion of returns earned and re-invested locally.
40 This section is based on the 3rd Medium-Term Plan of the Vision 2030 (Part 1: The Background), the Second Annual Progress Report on the Implementation of the First Medium-Term Plan (2008-2012) of Kenya Vision 2030 (Part II: The Challenges), and the National Business Agenda “Realizing the Potential of the Private Sector in Kenya” by the Kenya Private Sector Alliance (Part III: The Way Forward)

Kenya: Common Country Assessment 2013-2017 16
Agriculture, Livestock and Fishing: Agriculture is central to the economy, with great potential for growth and an overarching importance for job creation, income generation and rural development, affecting a wide range of back- and forward linked activities in both the formal and informal sectors. The implementation of dedicated measures foreseen under the ERS and the Strategy for Revitalizing Agriculture (SRA) demonstrated results in fostering growth of the agricultural sector. This applies equally for food and industrial crops as well as for horticulture products. Great potential exists for the development of fisheries activities within Kenya’s Exclusive Economic Zone (EEZ) while at the same time adequate attention has been directed towards the promotion of aquaculture (fish farming) to alleviate fishing pressure in major water bodies. Livestock production which accounts for nearly 90% of the employment opportunities in arid and semi-arid areas and nearly 95% of the family incomes is one of the major activities in the sector. Ensuring food security and eliminating hunger remains however still a challenge for the country. According to the MTP more than 40 per cent of the population lacks access to adequate food due to poverty. It is estimated that intensified irrigation could increase agricultural productivity four-fold and incomes can be multiplied up to ten times. Experience from other countries shows that irrigation is a major driver of agricultural productivity. There is an over-dependence on rain-fed production systems in Kenya. The sector requires significant investment in irrigation infrastructure to reduce its high dependence on rainfall. Further measures are aimed at revamping the key extension institutions of Agricultural Training Centres (ATCs) and Agricultural Mechanization Stations (AMSs) through rehabilitation and upgrading of facilities and equipment. Challenges include the lack by many farmers of adequate capital to acquire new technologies or apply recent innovations of agricultural research. Inadequate access to affordable credit and a low level of product processing lead to a reduced shelf life and limited range of export opportunities. Other challenges include declining soil fertility, low application of key inputs, poor disaster preparedness and response, pre-and post-harvest losses, inadequate markets, poor marketing infrastructure, weak quality control systems, inappropriate legal and regulatory frameworks, and poor governance of the co-operative societies. Measures initiated under the MTP include the setting up of industry development funds, a fertilizer cost-reduction program, and improvements in the quality, quantity and value of processed meat destined for export, and the testing, development and distribution of low-cost irrigation technologies. Adequate approaches to reduce post-harvest losses and support value addition should be equally developed along with improved agricultural extension systems which are to be adopted in cooperation between the government, the Private Sector and non-governmental organizations (NGOs). Measures are to be taken to modernise and encourage farmers to adopt agriculture as a business, comprising of improved access to financial services and agricultural information services. Wholesale, Retail and International Trade: The objective of measures foreseen under this section is to establish a more formal sector that is efficient, multi-tiered, diversified in product range and innovative. Wholesale and retail trade are expected to expand substantially as the economy moves towards the 10 per cent growth target, thereby playing a crucial role toward attainment of national development objectives, wealth creation and eradication of poverty. Informal and formal trade in Kenya account for approximately 10 per cent of employment and have been among the most rapidly expanding subsectors of the economy. Whereas formal trade tends to provide more permanent high-quality jobs, most of the employment in trade is found in the informal

Kenya: Common Country Assessment 2013-2017 17
sub-sector, which is characterized by ease of entry and exit, small scale operations and unregulated markets. Informal trade enterprises have great potential for creating a variety of jobs while generating widespread economic benefits. They are, however, highly fragmented with weak or non-existent linkages between them and the formal sector and a lack of sound managerial skills which has hindered their vertical growth. With a view to international trade comprising of both goods and services, the MTP follows the situation analysis provided by the initial PSDS Strategy document but emphasizes the faster growth of services trade and the significant role it plays for the national economy. During the ERS period a range of diversification efforts were undertaken to move away from the narrow range of products and markets with exports growing at more than 11 per cent between 2003 and 2006. The partnership with the Private Sector was expanded and strengthened to spur growth of businesses and competitiveness. The government streamlined the business regulatory environment and established the Kenya Investment Authority to further improve Kenya’s investment environment and ease the cost of investment in the country. While considerable results have been already achieved, doing business in Kenya is still hampered by the influx of counterfeit, substandard and contraband goods and inappropriate trade regulatory regimes. Deficits in the general infrastructure lead to highly fragmented distribution and retail outlets with the consequence of price escalation of goods and services, compounded by a lack of trade support infrastructure such as trade centres or warehouses in priority export markets. According to the MTP most traders are not able to sustain local and international business due to their inadequate understanding of legal or technical requirements, such as customs regulations and standards. The low utilisation of Information and Communication Technologies (ICTs) has hampered the adoption of e-Trade which is especially significant for the future since it basically affects all trade in services. The sector has a perennial shortage of technical staff, particularly at district and provincial level and in Kenya missions abroad. The latest annual report explicitly deplored the slow pace of implementing trade-related interventions as identified in the first MTP (2008-2012). With a view to accelerating expansion of trade a range of measures have been initiated and implemented over the MTP period. They comprise of flagship projects, strategies and programs in addition to policy, legal and institutional reforms. Manufacturing: The manufacturing sector expected to provide impetus towards the achievement of the Sustainable Development Goals by creating jobs, generating wealth and attracting foreign direct investment. To this end, production capacities should be strengthened, and the generation and utilisation of research and development results (R+D) increased. Furthermore, the share of products in international trade should be significantly raised inter alia by developing niche products for existing and new markets. Between 2011 and 2015 the share of the manufacturing sector in the economy declined from 11.8 % to 10.3 %. A structural transformation towards a manufacturing and export led economy is required, in line with Kenya’s long-term Vision 2030. The National Exports Strategy (NES) was formulated to improve the competitiveness of the sector, deepen existing markets for manufacturers and provide options to expand into new ones. A National Industrial Policy has been prepared to guide the development of the manufacturing industry and a roadmap has been developed to promote Kenya’s industrial development in priority sectors such as agro-processing, agro-machinery, electrical and electronics/ICT. There continues to be low value addition and a narrow export base. Growth is hampered by the underdeveloped transport network and the costly and unstable supply of energy, low absorption of R+D results and innovation, and the damage caused by unfair competition in form of counterfeit and contraband goods, as well as the limited production and managerial skills.

Kenya: Common Country Assessment 2013-2017 18
Specific challenges include: an acute electricity shortage due to limited installed capacity and over-reliance on drought-sensitive hydro power, inadequate funding, shortage of skilled manpower, weak public-private partnerships, delays in procurement, logistical challenges, poor infrastructure, and infiltration of local markets by counterfeit, contraband and substandard goods. Emerging issues and persisting challenges are to be dealt with by flagship projects and supportive programs which are like those foreseen for the trade sector. Business Process Outsourcing: Worldwide, outsourcing of business processes is a large and rapidly growing industry. It involves the transfer of non-core business processes to a third party with at least a guaranteed equal service level. In Kenya, the BPO sector is still small, but the country is determined to establish the necessary capacity for BPO catch up with other destinations in Africa, creating employment opportunities for the youth and young professionals. Kenya plans to capture a portion of this emerging market using comparative advantages such as the quality of education, the volume of people trained in various language skills and a time zone that aligns her with the business hours of major global economies. The government has in the past undertaken various measures to improve the BPO sector performance by launching a comprehensive national ICT policy and establishing the corresponding ICT board, and by providing for the installation of the East African Cable Systems (TEAMS) to lay the technical foundation for an adequate telecommunication infrastructure and reliable data transmission. However, data transmission costs in Kenya are still three times more expensive and energy costs are twice as expensive as those of other BPO destinations, such as India and the Philippines. Both are unreliable as well. Other challenges include inadequate supply of BPO software and hardware, a weak BPO incentive structure and responsiveness and inadequately skilled manpower. A lack of dedicated BPO facilities also weakens the attractiveness of Kenya as a primary BPO destination. Because of these constraints, Kenya has not been attractive as a primary BPO destination. The BPO sector is still a very small part of the Kenyan economy but deemed to be an important growth area. To sustain the BPO sector the government is to complete many infrastructure initiatives, and to market Kenya as a BPO destination. Dedicated initiatives include establishing a BPO Park to provide superior telecommunications infrastructure, easy access to international transport facilities and readily available energy supply and training programmes. Financial Services: The objective is to establish a vibrant and globally competitive financial industry in Kenya, promoting high levels of savings and meeting the country’s investment needs. It will also ensure macroeconomic stability, promote Private Sector development and encourage Foreign Direct Investment in support of implementing the Vision 2030. The MTP aimed at mobilising savings to realise a savings to GDP ratio of 25-28 per cent, thereby sustaining an increase in the ratio of investment to GDP of around 30-32 per cent. Thus, the financial means should be accumulated to support agriculture, manufacturing and other key sectors identified under Vision 2030 and improve access to financial services for a much larger number of Kenyan households to meet their specific financial needs. Programs and projects foreseen under the MTP for the 2018-2022 period are to be anchored on the flagship projects and revolve around the consolidation of the banking sector through an enhanced capital base, an increase in financial access, the formalisation of the microfinance sub-sector, deepening of capital markets by raising institutional capital and expanding bond and equity markets, and the leveraging of remittance and long-term capital inflows for investment needs and economic growth. Government participation in capital markets should be increased through Public-Private Partnerships (PPPs) and issuance of specialised bonds to facilitate investment in key areas. Important policy, legal and institutional reforms underpinning the foreseen activities encompass inter alia reforming the commercial justice system to support the effective working of market-based financial institutions, improving registration arrangements for pledges over movable assets and

Kenya: Common Country Assessment 2013-2017 19
improving the land registration system to facilitate land as a viable collateral, reviewing the Capital Markets Act to provide the Capital Market Authority (CMA) with adequate legal protection, access to bank records in an investigation, ability to obtain freeze orders, and authority to visit at will the regulated companies and their auditors. The current financial sector has low penetration and limited supply of long-term finance. In addition, the sector suffers from low availability of ICT infrastructure, especially in rural areas. Other challenges are overcapacity and price competition, corruption and fraud, poor corporate governance, negative public perception and limited skilled manpower. Creating a conducive business environment for wealth creation Given the crucial role the private sector must play in creating wealth and jobs for Kenyan society, to achieve the objectives of Vision 2030, it is imperative that the Government support business by creating an enabling environment. From the point of view of the Private Sector, the key challenges to creating a more conducive environment are the following:
• Provision of improved and adequate physical infrastructure • Achieving less burdensome business regulation • Ensuring that labour market regulations incentivise employment • Expanding external trade through improved facilitation and market access • Revitalization and transformation of agriculture • Protection of intellectual property rights (IPRs) • Unleash ICT potential to drive innovation and growth • Build an effective and efficient public service • Fight crime and insecurity
Causes and root causes of shortfalls in economic growth Kenya’s relatively low labour productivity is a critical challenge which negatively affects the country’s competitiveness. Kenya’s labour productivity ranking by the World Economic Forum (2016) is comparatively low at 99 out of 138 countries and has stagnated over a long period. The high cost of capital and high lending rates also remains a challenge to investment and job creation despite the recent legislation to cap and bring down lending rates. The pace of implementation of proposed legal, institutional, and structural reforms has been robust but slower than planned. Unemployment and under employment remains high, especially for youth. This is further compounded by skills mismatch between demand and supply, weak linkage between industry and training institutions and skills shortages in some critical areas within the labour market. In addition to the immediate economic causes for growth shortfalls, there are deeper problems that constrain rapid economic development. These are largely socio-cultural or political or have such root causes. In the short to medium term, the chief constraint to economic growth is the periodic political uncertainty that has plagued the nation since the 2007 post-election violence. The current, ongoing political impasse has had a significant impact on the Kenyan economy by creating deep uncertainty. This uncertainty has manifested itself in subdued consumption, investment, business activity, bank lending, share prices and trading on the Nairobi Stock Exchange (NSE) and increases in financial institutions’ non - performing loans. At the macroeconomic level, effects of the political impasse have manifested themselves in the negative impact on the fiscal budget, revenue collection, and economic growth.

Kenya: Common Country Assessment 2013-2017 20
In the longer term, more fundamental factors constrain growth. Factors that have been identified as causes of the shortfalls in Kenya’s economic performance include those set out in the table, below: Table 3: Problems and causes of Kenya’s shortfalls in achieving economic growth targets Problem Documented/perceived causes Root Causes Increasing economic inequalities
• Uneven Rural/urban development • Unequal access to land, water, capital
• Unequal opportunities, based on political patronage, nepotism and ethnicity
A bulging informal economy
• Inadequate physical, social services in rural areas
• Surge in marginalized rural-urban migrant populations
Unemployment and low labour utilization
• Skills mismatch • Limited market driven education and skills training
Low investments (local, foreign)
• Low “ease of doing business” • High levels of corruption • High cost of electricity • Political uncertainty • Terrorism & Crime
• Endemic corruption and un-facilitative political-legal environment
• Lack of close private/private sector collaborative engagement
Low savings • Underdeveloped investment-supporting infrastructures
• Increased vulnerability of the poor; limited social safety nets
Low productivity
• Low value addition • Stagnant manufacturing industry • A sluggish economy
• Poor land use planning and overdependence on rain-fed agriculture
• Low economic diversification e.g. blue economy
• Inequitable land holdings; with many having little or no access to land
Limited access/affordability to energy
• Increased environmental degradation • Limited use of innovation and
technology • Inequitable energy distribution
• Poor policies on energy development
• Suboptimal use of natural resources
• Climate Change
• High poverty levels among riparian communities
• Sub-optimal contribution of blue economy to GDP
• Inadequate exploitation of ocean & marine space, and marine resources
• Lack of awareness/knowledge among communities, private sector and government on potentials of blue economy
• Lack of policies and strategies on exploitation/development of blue economy
Source: UNCT Theory of Change, 2017 The table makes clear that for Kenya to succeed with its ambitious (and achievable) economic goals, it must take a fully integrated approach, giving highest priority to addressing the political and social roots of its economic constraints. Chief among those constraints are poverty and inequality.

Kenya: Common Country Assessment 2013-2017 21
3.2. Poverty reduction 41
3.2.1. Poverty in Kenya While Kenya is experiencing steady economic growth, poverty alleviation remains a challenge. Kenya ranks 145th among 188 countries in the 2016 UNDP Human Development Index (HDI), which measures development in terms of life expectancy, educational attainment and standards of living. Kenya’s HDI value of 0.555 for 2015 is in the medium human development category. Between 1990 and 2015, Kenya’s HDI value increased 17.3 percent. As a country that has just become part of the middle-income group, it is to be expected that Kenya’s 2015 HDI is below the average of 0.631 for countries in the medium human development group and above the average of 0.523 for countries in Sub-Saharan Africa. From Sub-Saharan Africa, countries which are close to Kenya in 2015 HDI rank and to some extent in population size are Cameroon and Tanzania, which have HDIs ranked 153 and 151 respectively (see table X). It is notable that Kenya now has the highest life expectancy and years of schooling of the three. Table 4: Kenya’s 2015 HDI and component indicators relative to Cameroon & Tanzania
Region
HDI value
HDI rank Life expectancy
at birth
Expected years of
schooling
Mean years of
schooling
GNI per capita (PPP
US$)
Kenya 0.555 146 62.2 11.1 6.3 2,881 Cameroon 0.518 153 56.0 10.4 6.1 2,894
Tanzania 0.531 151 65.5 8.9 5.8 2,467
Sub-Saharan Africa
0.523 — 58.9 9.7 5.4 3,383
Medium HDI 0.631 — 68.6 11.5 6.6 6,281
Between 1990 and 2015, Kenya’s life expectancy at birth increased by 3.4 years, mean years of schooling increased by 2.6 years and expected years of schooling increased by 2.0 years. Kenya’s Gross National Income (GNI) per capita increased by about 26.0 percent between 1990 and 2015. The long-term improvement in life expectancy in Kenya is especially notable. As shown in the figures below, Kenya suffered a dramatic drop in life expectancy in the 1990s, which greatly retarded its progress in terms of the HDI. This was largely due to HIV/AIDS deaths.
41 Poverty is a multi-dimensional indicator of the lack of well-being, reflected in poor access to basic necessities such as food, clothing, and shelter; as well as access to basic services such as health care, education, transportation, water, electricity etc.

Kenya: Common Country Assessment 2013-2017 22
Figures 5 and 6: Trends in Kenya’s HDI component indices 1990-2015,42 and Kenya, Ghana and Sao Tome compared
Source: UNDP, Kenya Human Development Report, 2016 During the period between 1990 and 2015 Kenya, held steady or improved in education and GNI per capita, but life expectancy fell dramatically. In comparison, Ghana and Sao Tome and Principe experienced more steady progress toward increasing their HDI figures. Clearly, the HIV epidemic has had a deeply negative effect on Kenya’s development, worsening poverty for many even as income per capita slowly improved. The proportion of people living below the national poverty line in 2014 was estimated at 45.2%. Individuals living above the income poverty line may still suffer deprivations in education, health and other living conditions. In Kenya, 36.0 percent of the population is multi-dimensionally poor while an additional 32.0 percent lives near multidimensional poverty. The breadth or intensity of deprivation in Kenya, which is the average deprivation score experienced by people in multidimensional poverty, is 46.1 percent. Kenya’s Multidimensional Poverty Index (MPI), adjusted by the intensity of the deprivations, is 0.166. Cameroon and Tanzania have MPIs of 0.260 and 0.335 respectively. Kenya has extensive multidimensional poverty, but less so and less intensely than in these peer countries. Comparing multidimensional poverty with income poverty, measured by the percentage of the population living below PPP US$1.90 per day shows that income poverty only tells part of the story. The multidimensional poverty headcount is 2.4 percentage points higher than income poverty. This implies that individuals living above the income poverty line may still suffer deprivations in education, health and other living conditions.
42 UNDP, Kenya Human Development Report, 2016

Kenya: Common Country Assessment 2013-2017 23
3.2.2. The youthful, female face of poverty Kenya has one of the world's highest rates of population growth. The population has tripled in the past 35 years, increasing pressure on the country's resources and leaving young people particularly vulnerable to poverty. Rural women are especially vulnerable because they do not have equal access to social and economic assets; subsistence farming is the primary source of livelihood for most rural women. The gender development index (GDI) reflects gender inequalities in achievement in the same three dimensions of the HDI: health, education; and command over economic resources. The female HDI value for Kenya in the 2015 HDR is 0.531 in contrast with 0.577 for males, resulting in a GDI value of 0.919. In comparison, GDI values for Cameroon and Tanzania are 0.853 and 0.937 respectively. Rural poverty in Kenya is also strongly linked to environmental concerns – especially poor water management, soil erosion, declining soil fertility and land degradation. Climate change, which is one of the major challenges facing the Kenyan economy, could undermine the resource base and contribute to declining agricultural yields. Droughts and floods have increased in frequency and intensity over the last decade. Severe drought occurred in 2010 and 2011, with 4 million people requiring food assistance. 3.2.3. The location of poverty The poor constitute 50.2% of the population in the rural areas and 33.5% in urban areas. More than three quarters of the population lives in rural areas, and rural households rely on agriculture for most of their income. The rural economy, in turn, depends mainly on smallholder farming, which produces the majority of Kenya's agricultural output. About 70 per cent of the poor are in the central and western regions, living in areas that have medium to high potential for agriculture. Poverty and food insecurity are acute in the country's arid and semi-arid lands (ASAL), which have been severely affected by recurrent droughts. At county level, there are significant differences in poverty (see Figure 7, below). The proportion of individuals below the poverty line in Turkana (87.5 per cent), Mandera (85.8 per cent) and Wajir (84.2 per cent) is four times that of Nairobi, which has the lowest poverty at 21.8 per cent, and almost double that of Laikipia (47.9 per cent), the median county. The national inequalities in poverty across counties are depicted in Figure 7, where the incidence of poverty is higher in the northern and coastal parts of the country and significantly lower in others especially in Nairobi and the central parts of the country. It is important to note that 90 percent of the refugees hosted in Kenya reside in two counties (Turkana and Garissa) which are among the poorest.

Kenya: Common Country Assessment 2013-2017 24
Figure 7: People living below the poverty Line by County
These differences are more pronounced at constituency level whereby the proportion of the population below the poverty line in the poorest constituency (Turkana East) with 93.1 per cent of its population living below the poverty line is nine times greater than the least poor constituency (Embakasi West) where only 10.3 per cent of the population live below the poverty line. In total, 25 counties and 148 constituencies have more than 45.2% of their populations below the national poverty line.

Kenya: Common Country Assessment 2013-2017 25
Figure 8: Proportion of Population below Poverty Line (Headcount index) by County.
Source : http://inequalities.sidint.net/kenya/national/poverty/2/
3.2.4. Inequality in Kenya Kenya’s HDI for 2015 is 0.555. However, when the value is discounted for inequality, the HDI falls to 0.391, a loss of 29.5 percent. Cameroon and Tanzania show HDI ranking losses due to inequality of 32.8 percent and 25.4 percent respectively. Notably, while the intensity of deprivation is less severe than in these peer countries, inequality reduces HDI in Kenya quite as severely. Inequality is not reduced by Kenya’s better GNI per capita. Kenya’s wealth remains highly concentrated, making East Africa’s largest economy among the world’s most unequal societies, according to the UN’s Human Development Index (HDI) 2014. The incomes of the richest 20 per cent of the population rose steadily in the past decade to stand at 11 times more than the incomes of the poorest 20 per cent, leaving Kenya as East Africa’s second most unequal society after Rwanda. Ranked by the Gini Coefficient – a measure of income gap that assigns zero to perfect equality and 100 to absolute inequality – Kenya’s score stands at 47.7 behind Rwanda’s 50.8, but 10 points above Burundi – the East African nation with the best wealth distribution with a score of 33.3 points43.
43 http://www.businessdailyafrica.com/Wide-wealth-gap-leads-to-calls-for-pro-poor-policies/539546-2429628-im11m3/index.html

Kenya: Common Country Assessment 2013-2017 26
Inequalities in Kenya are extreme. For example, in Wajir County out of a population of 522,830 peo-ple, only 2,242 people (0.4 per cent of the population) can afford to spend Ksh7,200 or above per month. Access to services is also unequal: for example, individuals in Nairobi County have 2.2 times more access to secondary education than an average Kenyan. 3.2.5. Reasons for escaping and falling into poverty The reasons associated with escaping poverty, and the reasons for falling into poverty are complex, but a study of 4,773 households reports clear sets of reasons that differ by area, or livelihood zones, of the country.44 The livelihood zones comprise high potential agricultural areas, marginal agricultural areas, agro-pastoral, pastoral and urban. The factors associated with escaping poverty in Kenya fall into five groups: Diversification of income sources. Two different pathways are involved: first, business progress in small community-based enterprises; and second, through obtaining a job, most often in the informal sector. 51% of the households overall in all livelihood zones that escaped poverty did so by obtaining additional income from informal enterprises, with this percentage significantly higher for the marginal zone (72%) and somewhat lower for the high potential zone (44%). Formal sector employment. Getting a job in the formal sector was an important reason for escape by a significant number of households (28% overall). It was particularly important in urban centers. Education is required, but relatively few educated people get jobs, so education alone was not a pathway out of poverty. Formal employment accounted for 47% of escapes in pastoral areas, although largely by migration to cities. Crop-related factors. Twenty-six percent of the households that escaped poverty countrywide over the last 15 years did so through crop diversification. This factor was present across livelihood zones, but particularly key in the marginal zone, where it was associated with 1/2 of all observed escapes. Livestock-related factors. Over 1/3 of households escaped poverty via livestock-related strategies that vary across livelihood zones. Livestock diversification—investing in new and/or different types of animals, or in shifting to production of new animal products—was important in the high potential and pastoral zones. Social factors. Help from friends and relatives, small family size, and inheritance were also important for some households. One-quarter of study households that climbed out of poverty across Kenya mentioned help from friends and relatives within the country as important. Property inheritance from parents and relatives was responsible for another 20%. Reasons for falling into poverty are predominantly in three groups: Poor health and heavy expenses related to health care. These are by far the most important reasons behind poverty descents across Kenya. Poor health and debilitating health care expenses were associated with almost 40% of the households that fell into poverty across Kenya, 65% in the marginal zone, consistent with the very high levels of HIV/AIDS and malaria. Health shocks largely unrelated to nutrition – e.g., HIV/AIDS, malaria, tuberculosis – are the most common reason households become and stay poor. Death of a principal income earner (due mainly to disease) was the major factor described as causing 26% percent of household poverty descents, again across all livelihood zones, except for urban areas, where it was relatively less important.
44 Kristjanson P, Mango N, Krishna A, Radeny M, Johnson N. 2009.
Understanding poverty dynamics in Kenya. Journal of International Development

Kenya: Common Country Assessment 2013-2017 27
Land and livestock-related factors are also driving Kenyan households into impoverishment, and they vary across livelihood zones. Drought was responsible for 24% of all descents observed across Kenya. Drought caused more than two-thirds of all descents into poverty in northern and northeastern Kenya, and 21% of households in the agro-pastoral zone. Land subdivision, resulting in small and uneconomic landholdings (<1 ha.) and reduced soil fertility were important in the high potential and agro-pastoral zones. The shrinking size of landholdings has resulted from high population densities and the widespread practice of subdivision for sons. Crop-related losses, due to crop diseases, pests, and long-term declines in world prices of tea and coffee, have been implicated in descents suffered in such high-potential districts as Nyeri, Kirinyaga, Kisii Central and Nandi. Livestock-related losses were associated with another 17% of all descents, with a much higher proportion found in the pastoral and agro-pastoral zones Social factors. High dependency ratios have arisen as relatively young men and women have succumbed to illnesses (many treatable, if not curable) in large numbers. Having numerous dependents strains households’ limited resources and has become a key reason for descents into poverty, associated with 41% of all descents. Insecurity and theft of property was particularly serious in the pastoral zone and it has also caused significant numbers of descents in the marginal and agro-pastoral zones. Cattle rustling and tribal clashes lead to large livestock losses. Theft seriously affects poorer households. 3.2.6. Policy responses for poverty reduction Since different reasons are related to escaping poverty and falling into poverty, different policy responses are needed to deal with each of these trends. Some major, nationwide trends are visible, such as the role of health problems in driving people into poverty and the importance of off-farm income in getting them out. Many other reasons differ across livelihood zones and require targeted policy responses. High Potential Zone – Overall poverty levels have remained relatively stable over the past 15 years. Cropping activities, particularly diversification into higher value food and cash crops, have the potential to alleviate poverty. Land access is an issue, with some people benefiting from increased cultivation while others slip into poverty due to subdivision and soil exhaustion. Health problems and resulting expenses and high dependency ratios are also taking a toll. Marginal Zone – Increases in poverty, due mainly to health problems and their related costs, have been serious here. These require ‘safety net’ income support and health policies, and actions that prevent households from falling into poverty. Given the importance of non-farm income sources, policies aimed at encouraging small business creation and expansion are options for aiding households to climb out of poverty, as are policies favoring agricultural diversification. This is the only zone in which increasing access to livestock was associated with significant poverty reduction, suggesting livestock-related investments would be worth pursuing. Agro-pastoral Zone– This zone experienced increases in poverty over the past 15 years and is among the poorest in the country. Expansion of crop agriculture and an increase in market orientation have been promising strategies in the past, and activities that facilitate these activities—such as improving roads and access to inputs, information and services, and lowering communication costs could have a high poverty impact here. Land access is an issue that will need to be addressed. In a mixed crop-livestock area such as this one, and to a lesser extent in the high potential zone, the importance of property inheritance is a sign that land markets are not an effective re-allocation mechanism. Livestock losses were high which suggests that interventions that reduce losses due to disease or drought might mitigate poverty. Pastoral Zone – This poorest zone has experienced the highest increase in poverty. The high levels of vulnerability in this zone suggests that policies that mitigate vulnerability will be as important as those that seek to promote growth. Climate is a major source of vulnerability. Theft is also a major

Kenya: Common Country Assessment 2013-2017 28
issue and addressing it could have important poverty impacts. Small businesses are important, but unlike in other rural zones, these are found in cities. Policies that make it easier for people to earn money and to move safely between rural and urban areas will help mitigate poverty. Urban Zone – Poverty is high in the urban areas, though it has not increased. Non-farm activities are responsible for most ascents out of poverty. Loss of employment is a major reason for descending into poverty, however agriculture—crop diversification and livestock commercialization—is a successful poverty alleviation strategy for a significant number of urban households. 3.2.7. The national response to poverty Immediately after independence, Kenya focused on eradicating hunger, illiteracy and diseases (sessional paper No. 1 of 1965). Since then many development plans and strategy papers have sought to achieve sustainable development. Poverty Reduction Strategy Paper The National Poverty Eradication Plan (NPEP) of 1999 had a 15-year timeframe to alleviate poverty based on the first UN Millennium Development Goal (MDG) of halving poverty by 2015.The Poverty Reduction and Strategy Paper (PRSP) of 2001 was a short-term strategy for meeting the long-term MDG goal. The PRSP had multiple objectives for reducing poverty and increasing economic growth, linking national public actions, donor support, and the development outcomes needed to meet the MDGs. In 2000, Kenya’s GDP growth rate was between 0 to 0.2% and about 60% of Kenyans were living below the poverty line. Economic Recovery Strategy for Wealth and Employment Creation In 2003 the new NARC Government made reviving the economy its top priority. It abandoned the PRSP and NPEP and adopted an economic recovery strategy (ERS). The ERS, launched in 2003, emphasized economic growth and creation of wealth and employment as means of eradicating poverty and achieving food security. The strategy identified agriculture as the leading productive sector for economic recovery, and revival of agricultural institutions and investment in agricultural research and extension as critical and essential for sustainable economic growth. ERS was based on four pillars: macro-economic stability; strengthening institutional governance; rehabilitation and expansion of physical infrastructure; and investment in the human capital of the poor. Vision 2030 and the Medium-Term Plans The ERS expired in the financial year 2007/08. Kenya Vision 2030 was launched in 2008. Under its MTPs I & II, the country’s economic performance has improved, but never to the levels projected. Major investment in infrastructure continues. High unemployment, especially among youth, remains a key driver of poverty. The signal political achievement of Vision 2030 has been the promulgation of the new Constitution of 2010. This flagship project under MTP I has laid the foundations for future pro-poor governance, through a range of highly progressive rights, and through devolution of powers to the new county-level governments. While the promises of these provisions have not yet been fully realized for the poor, they make it possible over time to achieve the Vision 2030 objective of moving to the future as one nation in a democratic system that is issue based, people centered, results oriented and accountable to the public. The five strategic areas of the pillar are an agenda for poverty alleviation through empowerment; the strengthened rule of law; implementation of the Kenya Constitution 2010; participatory electoral and political processes; democratic public service delivery; transparency and accountability; and, security, peace building and conflict management. Kenya has invested during MTP I & II in a wide spectrum of human and social welfare projects and programmes.

Kenya: Common Country Assessment 2013-2017 29
Notable progress has been achieved in the social sectors. Key achievements of MDG targets were made between 2000 and 2015 in:
• Goal 2: Achieve Universal Primary Education: The primary school net enrollment ratio (NER) increased, with continued provision of resources under the free primary school programme.
• Goal 3: Promote Gender Equity and Empowerment of Women: The girl to boy ratio in primary school is close to gender parity.
• Goal 4: Reduce child mortality: Considerable progress has been made in reducing under five mortality and infant mortality.
• Goal 6: Combat HIV and AIDS, Malaria and other diseases: National HIV prevalence has declined.
The strategy was not as successful in attaining targets in eradicating extreme poverty and hunger (Goal 1), ensuring environmental sustainability (Goal 7), and developing a global partnership for development (Goal 8). In the context of difficulties with decentralization of health services, progress on improving maternal health (Goal 5) lagged seriously, and it was the focus of an MDG acceleration campaign in the last years of the MDG period. In the view of the GoK, the main challenges in meeting the MDGs have been:
• The inadequacy of resources for financing MDG-related activities: this is cited as the main constraint.
• Crises, which have included the 2007/2008 post-election violence and more recent electoral tensions, the food and fuel crisis, terrorism and drought.
• Un-favorable international trade practices that continue to reverse gains. •
Since 2015, the GoK has adopted the SDGs as a framework for its targets under MTP III, and continues to pursue the goals of Vision 2030. Notably, it has increased its investment in the social safety net. In the 2016/2017 Financial Year the government allocated KShs 68.7 Billion (USD $65 million), about 4.4% per cent of total revenues, for direct poverty alleviation programmes. The National Social Safety Net Programme (NSNP) targets vulnerable groups faced with multiple challenges The NSNP is comprised of four cash transfer programmes: Hunger Safety Net Programme Cash Transfers (HSNP-CT); Orphans and Vulnerable Children- Cash Transfers (OVC-CT), Older Persons- Cash Transfers (OP-CT) and Persons with Severe Disability- Cash Transfers (PWSD-CT). Other interventions include the Equalisation Fund and National Government Constituencies Development Fund (CDF). The country has also reviewed its legal frameworks to facilitate actions towards poverty alleviation. Examples include the 2016 National Slum Upgrading and Prevention Policy, which provides a legal and institutional framework for effective slum upgrading and prevention on a sustainable basis, and the adoption of the Mining and Mineral Policy which stipulates a mineral royalty sharing regime, with 10 per cent of the revenue going to the community, 20 per cent to sub-national Government and 70 per cent to National Government. To reduce poverty as well as alleviate it, these positive measures for poverty alleviation should continue to be part of a wider strategy, with major programmes to facilitate informal sector enterprise and livelihoods and to support the development of more profitable and secure smallholder agriculture, tailored to the locality.

Kenya: Common Country Assessment 2013-2017 30
4.0. ECONOMIC THEMATIC AREAS 4.1. Agriculture, Forestry and Fisheries Agriculture, forestry and fisheries are largely smallholder enterprises in Kenya, while industrial enterprises are far more productive and profitable. They both have great potential for growth and an overarching importance for national job creation, income generation and rural development. The smallholder sub-sector is key to food security and livelihoods. The industrial sub-sector is a primary source of export earnings and formal employment. Assuring balanced development of the two is one of the most critical issues for the nation. The sector is the mainstay of Kenya’s economy, currently contributing an average of about 25 per cent of GDP directly, and another 27 per cent indirectly. The sector also accounts for 65 per cent of Kenya’s total exports and provides more than 18 per cent of formal employment. Kenya’s agriculture is predominantly rain-fed, smallholder and informal. Smallholder agriculture employs 70 per cent of the rural population. In Kenya, growth of the national economy is highly correlated to growth and development in agriculture. Although the sector is expected to drive national growth toward the 10 per cent target of Vision 2030, increasingly frequent droughts are seriously affecting production. Droughts in 1997, 2000, 2004, 2005, 2010/11, 2016 and 2017 have each affected between 2 and 4 million people and cut growth. The goal of the Kenya Agriculture Development Strategy, 2010-2020 was to achieve an average growth rate of 5 per cent per year from 2010 to 2015. This was achieved, but sector value added decelerated from growth of 5.5 per cent in 2015 to 4.0 per cent in 2016. Drought in 2017 has constrained growth further. 4.1.1. Agricultural policy and strategy Agriculture-led growth in Kenya is more than twice as effective in reducing poverty as growth led by industry,45 and investment in the sector has been a major priority in Vision 2030. The implementation of the Strategy for Revitalizing Agriculture (SRA) demonstrated strong results in fostering growth of the agricultural sector, equally for food and industrial crops as well as for horticulture products. The current Agricultural Sector Development Strategy (ASDS) 2010-2020 continues this effective approach. The overall objectives of the ASDS are to achieve an agricultural growth rate of 7 per cent per year and to reduce food insecurity by 30 per cent, by promoting an innovative, commercially oriented and climate-smart modern agriculture. The ASDS is guided by two strategic thrusts: increasing productivity, commercialization and competitiveness of agricultural commodities and enterprises; and developing and managing the key factors of production. Vision 2030 identified four major challenges to overcome in achieving its objectives: Productivity. Productivity levels for many crops are below potential and for some, yield and value over a 5-year period have either remained constant or declined. Similarly, most fish and livestock production is below potential. Forest cover and tree productivity have been on the decline. Land use. Land in all areas remains under-exploited, with smallholders using only 60 per cent of their land for agricultural production. Markets. Productivity is constrained by limited storage capacity, lack of post-harvest services and poor access to input markets. Value addition. Kenyan farmers export semi-processed, low-value produce, which accounts for 91 per cent of total agriculture-related exports. The limited ability to add value coupled with high production costs make exports less competitive. Considerable investment has been made to address each of these challenges with positive results, but progress has been slowed over the past decade due to the food crisis of 2007-2008, the famine of 2011, and more recent recurrent droughts, as well as the disruptions caused by the introduction of devolution under the 2010 constitution.
45 IFAD, Investing in rural people in Kenya, 2016

Kenya: Common Country Assessment 2013-2017 31
The increased incidences of drought and unreliable rainfall patterns have led the government to place natural resource management and climate change mitigation at the centre of its agricultural and economic development strategy. The constitution-mandated consolidation of institutions and legislation since 2013 has created the preconditions for a more modern and coherent system for agricultural policy and support. Kenya has now rationalized its agricultural structures and systems. The creation in 2014 of the Agriculture and Food Authority (AFA) merged state corporations associated with agriculture into a single entity, removing overlapping regulatory, licensing, processing, and marketing functions. Legislative changes in 2012 harmonized and updated over 131 pieces of legislation that govern the agricultural sector into four. The 2010 constitution also divided responsibility for agriculture between the national government and the newly-created counties. The national government has considerable authority over policy issues, capacity building, finance and technical assistance while county governments are responsible for priority setting, financial management, agricultural production and related extension services. This allows a better alignment of local needs and priorities and government actions and projects in response. In response to the emergency of 2008, 2009 and famine of 2011 essential food assistance was distributed through different channels all over the country. Price controls were emphasized since 2009 to mitigate the effects of food shortages, fixing maximum prices for essential goods. Although never fully implemented, controls, as well as food assistance, distorted markets and reduced producer incentives. Despite the positive shift of East African countries towards more regional cooperation that has led to the East Africa Common Market Protocol for free movement of goods, the food crises and subsequent droughts led to protectionist measures. These usually trigger responsive measures by neighboring countries and lead to an overall decline of trade flows. Due to the food crises and more recent droughts, government interventions have been characterized in recent years by a strong emphasis on short-term emergency measures, such as safety net policies (food distribution, school feeding, food for work, etc.), short term export bans or import tariff reductions as well as input subsidies, also supported by international development partners with cash transfer programmes. To support production, agricultural price policies in favor of the producers in recent years are characterized by a strong presence and control of the Government, which sets, among other things the producer and input prices. The government also distributed seed and fertilizer through cash vouchers. However, the implementation of these measures proved to be inefficient in many respects, notably in reaching and benefiting the targeted producers and particularly the poorest. 4.1.2. Agriculture Crops There has been a positive trend in the productivity of most agricultural crops since 2003. This has resulted from implementing measures planned in the SRA and the ASDP. However, production costs for most crops are still high due to high costs of inputs especially fertilizer, poor and long marketing chains, low level of mechanization and high transport costs. Industrial crops contribute 17 per cent of Agricultural Gross Domestic Product (AGDP) and 55 per cent of agricultural exports. Horticulture (especially cut flowers), which has recorded a remarkable export driven growth in the past 5 years and is now the largest sub-sector, contributes 33 per cent of AGDP and 38 per cent of export earnings.
Table 5: Key Crops Production 2015-2016 Commodity 2015 2016 % change
Tea ('000 Tonnes) 399 473 18.5

Kenya: Common Country Assessment 2013-2017 32
Coffee ('000 Tonnes) 41.6 46.1 10.8 Fresh horticultural produce ('000 Tonnes) 239 261 9.4 Maize (Million bags) 42.5 37.1 -12.7 Wheat ('000 Tonnes) 239 222 -6.8 Rice ('000 Tonnes) 117 102 -12.9 Sugarcane (‘000 Tonnes) 636 640 0.6 Source: Kenya Economic Survey 2017
Food crops contribute 32 per cent of AGDP, but only 0.5 per cent of exports, Production of the main food crops—maize, wheat and rice—has generally been below the country’s consumption requirements. Fisheries Fish consumption has been declining from a modest 6.0 kg/caput in 2000 to 4.5 kg/caput in 2011. In 2013, around 129 300 people derived their livelihood from fish, including 48,300 in inland waters, 13,100 in coastal waters fishing and around 67,900 in fish farming. Of the total fishery and aquaculture production in 2013, 83 percent came from inland capture fisheries (of which Lake Victoria contributed about 90 percent). Marine capture fisheries produce much less than neighboring countries. Freshwater aquaculture development in Kenya is a remarkable success, making Kenya one of the fastest growing major producers in Sub-Saharan Africa. Annual production quadrupled between 2001and 2009. A nationwide mass campaign launched in 2009 built 7,760 new fish ponds. Together with improved seed supply and other support, farmed fish production more than quadrupled again between 2009 and 2013. The Government looks to promote aquaculture and cured fish products to enhance food security. The main issue in capture fisheries is overcapacity in Lake Victoria and the symptoms of overexploitation (increasing conflict, overfishing, and falling incomes). This issue is being addressed in cooperation with neighboring countries through the Lake Victoria Fisheries Organization (LVFO), and through the Regional Plan of Action for the Management of Fishing Capacity in Lake Victoria that was agreed in March 2007. In the marine sector, a major issue is the control of foreign flag vessels that are fishing tuna in the Exclusive Economic Zone and where illegal, unreported and unregulated (IUU) fishing is known to occur. Livestock Livestock plays an important socio-cultural as well as an economic role among many Kenyan communities. The livestock subsector provides employment to about 10 million people, and contributes 7 per cent to the GDP, and employs 50 per cent of the agricultural labour. Both crop farmers and pastoralists keep livestock for food and income generation. The livestock industry has a high degree of vertical links with upstream and down-stream industries. It is a significant user of products from feeds, drugs, vaccines and equipment manufacturing industries and is a major provider of raw materials for agro-processing industries. The country’s dairy cattle are estimated at 3.5 million head, mainly kept in medium- to high-rainfall areas. The country is self-sufficient in milk production. Livestock production accounts for nearly 90% of livelihoods opportunities in arid and semi-arid areas and nearly 95% of the family incomes. Insecurity in areas affected by the conflict in neighbouring Somalia and instability associated with pasture in lands that have become increasingly arid because of the drought have further aggravated population movement and barriers to service provision. As livestock are moved further afield due to drought, these movements of necessity can be misinterpreted and cause conflict.

Kenya: Common Country Assessment 2013-2017 33
Challenges Most smallholder farmers are over-dependent on rain-fed production systems. They have inadequate access to credit, and lack adequate capital to acquire new technologies or apply recent innovations of agricultural research. A low level of processing of their products leads to a reduced shelf life and limited range of export opportunities. The sector requires significant investment in irrigation infrastructure to reduce its high dependence on rainfall. It is estimated that intensified irrigation could increase agricultural productivity four-fold and multiply farm incomes up to ten times. Experience from other countries shows that irrigation is a major driver of agricultural productivity. Furthermore, the sector needs to be modernized through investment in storage and preservation facilities and in value-addition to boost income of farmers, pastoralists and fisher-folk and increase the growth of value-added agricultural products and exports. Other challenges in the sector are: the adverse effects of climate change, leading to severe droughts; crop diseases and pests, resulting in lower agricultural productivity; high population growth; low uptake and adoption of modern technology; and gender norms. 4.1.3. Women in agriculture Women provide 70 per cent of the labour associated with cash crop production and 89 per cent of subsistence farming labour. Rural women in Kenya continue to lack access to and control of productive resources; land, farm inputs and financial services. Food and nutrition insecurity continue to be a huge challenge for rural women. These are all fuelled by gender norms and inequalities that include lower literacy and access to information; lack of collateral to secure credit for productive resources (only 1% of land titles are in women’s names only); and more time spent on unpaid care work relative to men. For example, women in drought prone areas have their daily chores tripled during drought season and they spend 60 per cent of their time looking for water for livestock and domestic use daily. While there is growing investment by county and national governments to address these issues including through progressive policies and projects, there has been little or no documented evidence of their impact on addressing the gender inequalities that rural women encounter in agriculture. There remains a policy gap in terms of explicit guidance on how initiatives in the agriculture sector can mitigate the effects of gender norms on productivity and women farmers’ involvement. A gender in agriculture policy is needed to provide a framework for the coordinated integration and response to gender equality and women’s empowerment issues in the implementation of the Agricultural Sector Development Strategy 2010-2020 (ASDS). 4.1.4. Food insecurity and the policy response Despite slight improvements, Kenya remains a food-insecure country. According to the MTP II more than 40 per cent of the population lacks access to adequate food due to poverty. In recent years, and especially starting from 2008, the country has been facing severe food insecurity problems. Official estimates indicate over 10 million people are food insecure with a majority living on food relief. 46 Food insecurity is attributed to frequent droughts, the high costs of domestic food production due to high costs of inputs (especially fertilizer), displacement of farmers, high global food prices and low purchasing power due to poverty.
46 Kenya Agricultural Research Institute, Food Security Report, Food Security Portal, IPFRI

Kenya: Common Country Assessment 2013-2017 34
The achievement of national food security47 is a key national objective. As in other countries, the Government’s policy responses to the food crisis includes three major policy interventions that together address the range of issues affecting food production, prices and affordability: Supply related policies
I. Subsidy on farm inputs (especially fertilizer). ii. Improvement of research and extension services and improving their linkages. iii. Provision of rural credit for farming (e.g. the Kilimo Biashara Initiative).48 iv. Improvement in rural infrastructure, especially road network. v. Development of rural agricultural markets and agri-business skills. vi. Improved management of natural resources, especially water for irrigation. vii. Allowing import of tax free maize and banning exports. viii. Providing farmers with planting materials and seeds, especially of drought tolerant crops. ix. Encouraging diversification of crops. x. Encouraging diversified eating habits to avoid over-reliance on maize. xi. Improving operating conditions for food relief organizations. xii. Private sector initiatives to mobilize contributions to the food relief kitty.
Price related policies I. Purchase of maize from farmers at higher than market prices. ii. Subsidy to maize meal millers to bring down consumer prices. iii. Raising strategic food reserve levels to stabilize maize prices iv. Purchasing livestock from the drought-stricken areas v. Allowing private sector to import maize tax free. Income related policies I. Increasing family resources for food through subsidized social amenities; e.g., free education and reduced costs of health at public health facilities. ii. Government transfer funds, especially the Constituency Development Fund (CDF) and Local Authorities Transfer Fund (LATF) iii. Establishing producer and marketing associations for farmers. 4.2. Employment Employment opportunities in Kenya have been declining over time relative to the growth of the population. As a result, youth unemployment has been an endemic and worsening problem over several decades. A recent study49 by a consortium of think tanks led by the INSEAD Business School indicates that the future of Kenya’s competitiveness in the global economy remains clouded as the country struggles to contain the heaviest youth unemployment burden in East Africa. Of a working age population of 24 million, one in every six young Kenyans is unemployed – in Uganda and Tanzania, the figure is about one in every 20. In 2016, the economy generated a total of 832.9 thousand new jobs of which 85.6 thousand were in the modern sector while 747.3 thousand were in the informal sector. Creating enough jobs for the over 800,000 young people entering the Kenya labour market annually would require most of the sectors of the economy to quadruple their 2013 job-creation rates consistently for five years.
47 Food security is defined as “a situation in which all people, at all times, have physical, social and economic access to sufficient, safe and
nutritious food which meets their dietary needs and food preferences for an active and healthy life” (Kenya Food Security Steering Group, 2008). 48 Kilimo Biashara credit services are a loan product specifically designed for smallholder farmers in food crop production with a subsidized
interest rate (10% p.a. vs. 22% p.a. for other loan products). 49 Insead Business School et al, Global Talent Competitiveness Index, 2017.

Kenya: Common Country Assessment 2013-2017 35
Figure 9: Distribution of the working-age population across activities (percent)
Source: UNDP, Youth Employment Survey, 2013
Yet formal sector employment is not growing robustly. Wage employment in the private sector increased by only 3.3 per cent to 1,817.2 thousand persons from 2015 to 2016. Within the public sector, wage employment increased marginally. For those fortunate to have formal jobs, annual average wage earnings grew by 5.9 per cent to KSh 644.8 thousand in 2016. Figure 10: Formal jobs as percentage of working-age population
Source: UNDP, Youth Employment Survey, 2013
4.2.1. Youth and employment In 2012, youth aged 15 to 24 accounted for less than 19% of total employment, whereas they made up over 35% of the working-age population. As such, the youth employment rate, at 33%, is less than half the adult employment rate and one of the lowest in the region. The youth bulge has a weak entrepreneurship culture and the inactivity rate for people aged 15 to 24 reached 61% in 2012, which is an increase of 5% points since 2000.50
50 Danish Trade Union Council for International Development Cooperation, Kenya Labour Market Profile, 2014

Kenya: Common Country Assessment 2013-2017 36
The Government operates with a National Youth Policy (2006) and a Strategic Plan (2007-2012). Current policy encourages the establishment of agricultural production and cottage industries in rural areas to promote informal sector employment and promotes skills development of the youth through vocational training and imparting life skills. In 2014 the responsibility of The Youth Development and Empowerment Service was transferred from the Ministry of Youth Affairs to the Ministry of Devolution and Planning, which sits under the Office of the President. The Youth Enterprise Development Fund (YEDF) financed over 157,000 youth enterprises and contributed to create over 300,000 jobs in five years.51 However, most youth have not been properly informed about the fund and it has limited capacity relative to need. Kenya’s high youth unemployment affects its competitiveness. In the 2017 edition of the Global Talent Competitiveness Index, Kenya is ranked 97th out of 118 economies globally. The country is 7th in sub-Saharan Africa, behind Rwanda, Zambia and Namibia. Kenya is lagging the sub-Saharan mean in several key indicators, including vocational and technical skills, retention of skilled talent and opportunities for growth and development of talent. Politics and corruption have been singled out as the key impediments to an enabling environment for the development of skilled talent, with the country ranked 113th and 112th out of 118 in political stability and corruption, respectively. 4.2.2. The geography of employment Using data from the Kenya National Bureau of Statistics, (KNBS) and the 2009 Census, it is possible to draw a snapshot of the unemployment burden currently facing each of the country’s 47 counties. Though unemployment levels vary widely across the counties, urban counties, such as Kisumu, Nairobi and Mombasa, and those in arid and semi-arid regions, like Garissa, Wajir and Turkana, tend to have similar levels of high unemployment. Counties like Lamu, Samburu, Isiolo, Wajir, Tana River, Marsabit, Turkana and West Pokot reported fewer than 10,000 high school graduates and fewer than 500 university graduates each, indicating future vulnerabilities in developing a skilled labour force. Nairobi ranks top in unemployment among the counties, with more than 1.4 million young people estimated to have joined the labour market in 2017 to compete for limited employment opportunities. The highest wage employer in Nairobi is the manufacturing sector, followed by trade, restaurants and hotels. Others are construction, transport and communications, finance, real estate and business services. Many the Nairobi labour force – an estimated 1.5 million – is self-employed in the informal sector. This is 3.5 times higher than the figure of individuals in formal paying jobs. Overall, unemployment in the county stands at 14.7 per cent with more women (19 per cent) than men (11 per cent) being out of a job.
51 Youth Enterprise Development Fund

Kenya: Common Country Assessment 2013-2017 37
Table 6: Youth Unemployment situation in select counties County Total Youth
unemployment Main economic
Activities Status/Proposed Way forward
Meru 673,000 Agriculture, Growing and marketing of miraa
Diversify into other crops unless UK ban on miraa52 is lifted
Nakuru 676,00 The town’s fish and agro-based processing factories draw thousands of unemployed youth to the county
Registering the fifth-highest number of unemployed young people in the country. Increase investment in agro-processing.
Bungoma 564,000 Agriculture and trade More than 70 per cent of Bungoma’s population is aged below 30, which could see unemployment in the county reach crisis levels. More opportunities for youth employment a priority
Machakos 500,000 Agriculture, Trade & Jua Kali
Also, catchment area from the surrounding counties of Kitui, Mwingi and Makueni.
Kisumu 450,000 Manufacturing, Trade & Agro-processing
Both cities serve as urban magnets for the unemployed and will need to create an average of 450,000 jobs each year to meet the demand.
Mombasa 500,000 Manufacturing, fishing, Port facilities, Agriculture, Tourism
Nairobi 1,400,000 Manufacturing, Trade, Finance, Tourism
Highest wage employer in Nairobi is the manufacturing sector, followed by trade, restaurants and hotels. Others are construction, transport and communications, finance, real estate and business services. Many the labour force – an estimated 1.5 million – is self-employed in the informal sector.
Lamu, Samburu, Isiolo, Wajir, Tana River, Marsabit, Turkana and West Pokot
Reportedly fewer than 10,000 high school graduates and fewer than 500 university graduates each, indicating future vulnerabilities in developing a skilled labour force.
Garissa, Wajir and Turkana.
Tend to have similar levels of
high unemployment
as Nairobi
Respondents with low education levels also tended to end up unemployed or in the informal sector
Source: adapted from https://www.standardmedia.co.ke › Business › Business News & the authors Kenya’s devolved system of government was designed to re-distribute resources from Nairobi to all corners of the country to create regional economic blocs and investment hubs for a variety of industries, especially agricultural-based manufacturing. Stronger and more focused support for agricultural and agro-processing activities in the counties would not only have an impact in terms of new jobs created, but also improve the country’s overall quality of life. This would also help reduce the rate of rural-urban migration, which feeds the high levels of urban unemployment.
52 Elsewhere known as khat, a plant with stimulant properties.

Kenya: Common Country Assessment 2013-2017 38
As shown in the table above, each county government will need to identify the drivers and underlying causes of the unemployment burden they face, and develop investment, skills training and youth employment strategies specific to their circumstances. 4.2.3. Gender equality in employment The country’s 2010 Constitution seeks to remedy the traditional exclusion of women and promote their full involvement in every aspect of growth and development. To achieve this, the government, with the support of external partners, is endeavouring to: • Strengthen women’s access to resources and opportunities that will allow them to share more
broadly in the benefits of economic growth; • Increase the participation of women in decision and policy-making at all levels; • Narrow gender gaps in education and learning. In comparison to other African countries, Kenya has done well in gender equality and women’s empowerment education, leadership and entrepreneurship. Attesting to this, the 2016 report of the African Human Development Index (AHDI) ranked Kenya 18 in Africa and 145 globally in advancing gender equality.53 In line with ILO Conventions, the Employment Act prohibits both direct and indirect discrimination on grounds of race, colour, sex, language, religion, political or other opinion, nationality, ethnic or social origin. The Act specifically provides for equal remuneration for work of equal value. Employers have a duty to promote equal opportunity in employment and strive to eliminate discrimination in any employment policy or practice. The public service has seen the greatest gains. In October 2006, the President ordered that at least 30 per cent of all public service recruitment, promotions and appointments be reserved for women. This has caused a dramatic improvement in gender balance. At the Cabinet level women held 25.5 per cent of the positions. 34 per cent of Principal Secretary positions are held by women. The Kenya Judiciary has made tremendous progress in advancing gender equality. In 2016 42% of judges in Superior Courts were women. Women hold 37 per cent of high-level positions in the judiciary. Among all employees (Judges, Magistrates, and staff), 53% are men to 47% women54. The 2010 Constitution’s Article 81(b) states that, “Not more than two-thirds of the members of elective public bodies shall be of the same gender.” But there has been no consensus on proposals put forward to help meet the requirement. Outside of the sectors of politics and public service, the position of women in employment is also improving. Jobs are correlated with education, particularly secondary education and generally there is now near-gender parity in enrolment, retention, completion and progression rates for both boys and girls at both primary and secondary school levels. However, the number of young women diminishes when they complete secondary education and enter university and other tertiary institutions, and the workforce. Women are predominant in agriculture, where 70 percent of workers are women, as compared to 64 per cent of men. But, very few own land, exclusively in their own names, and most lack access to credit. Women remain underrepresented in the industry and service sectors.55 For instance, only six per cent work in small industries (while men’s rate is 13 per cent) and 23 per cent in the service sector.
53 https://www.capitalfm.co.ke/eblog/2017/03/15/celebrating-kenyas-strides-towards-gender-inclusivity/ 54 http://www.ngeckenya.org/Downloads/Gender%20Equality%20in%20%20Kenya%20post%202010%20%20Constitution.pdf 55 https://www.businessdailyafrica.com/corporate/Gender-gap-widens-in-labour-market/539550-1044878-b24ocez/index.html

Kenya: Common Country Assessment 2013-2017 39
4.2.4. Policy and Achievements Global experience offers lessons but no general solutions to the problems of unemployment: many countries currently suffer from jobless or job-poor growth. Recent policy interventions in Kenya generally follow the positive policy experiences across developing countries and are in line with international good practice in public works. National policies include the promotion of MSEs, the creation of a National Employment Authority (2016), a range of programmes providing direct subsidised support to employment of disadvantaged groups and initiatives to improve basic education and computer literacy. Three core issues face Kenya in achieving broad results from these policies. First, they must be brought to scale, although this would have serious cost implications. Second, employment promotion programmes must be harmonized. And third, education and training must be improved, and policies adjusted to address the most pressing employment needs. During the Second MTP period, several social protection and empowerment programmes were undertaken to increase employment: The Youth Enterprise Development Fund, Women Enterprise Fund (WEF), Uwezo Fund and Access to Government Procurement Opportunities (AGPO). Under the Uwezo Fund KS 5.1 billion has been distributed to 58,943 groups reaching 871,606 beneficiaries. The Kenya Youth Employment and Opportunities Project will reach 280,000 youths in 5 years commencing in 2016. Additionally, a total of 153 youth development centres were established. An on-line Industrial Training Attachment Portal (ITAP)56 was also developed to link industrial training institutions to industry and help students secure attachment places. A Kenya Labour Market Information System (KLMS) has been developed. The informal sector in Kenya has grown and currently employs about 81 percent of workers. In the past, government policies failed to clearly demarcate the formal from the informal sector, and thus failed to provide clear incentives for firms to formalize. In Kenya the terms MSEs, Jua Kali and “informal sector” are used interchangeably, yet not all MSEs are informal. Interventions did not differentiate among needs of heterogeneous establishments. Formal MSEs also tended to be treated in a similar manner to large firms, with respect to taxation and statutory requirements, reducing incentives for informal MSE firms to formalize operations. And for a long time, the government generally lacked policy interventions addressing the issue of informality and small and medium enterprises. Another challenge is that access to formal credit by a majority of MSEs is relatively low. Most of non-agricultural small enterprises (74 percent)57 rely on either their own savings or funds from family members for their initial capital. The study concludes that there is significant room to improve access to credit for better performance of the MSE sector. Government policy now puts emphasis on the micro and small enterprise (MSE) sector. Over the last decade, government has concentrated on creating an enabling environment for these businesses, providing credit, and developing non-financial promotional programs. Although government and other stakeholders tend to focus on unemployment, there is also need for a sustained effort to address labor market related challenges that encompass remedies for “inactivity” and “poor quality jobs” as well. Inactivity and poor-quality jobs affect larger numbers of youth than unemployment. There continues to be an urgent need for improved basic education, and of interventions that promote access to quality basic education for youth, for better labor market outcomes. Low levels of educational achievement have a strong negative influence on an individual’s labor market activity.
56 www.nita.go.ke/itap 57 UNDP, Youth Employment Survey, 2013

Kenya: Common Country Assessment 2013-2017 40
4.3. Tourism sector Kenya has one of the biggest and most diverse tourism industries in East Africa, with offerings in a range of niches. The tourism sector employed more than 1.1 million people directly and indirectly in the year 2016. This accounts for 9.2 per cent of the country’s total employment. Tourism is Kenya’s third largest foreign exchange earner after tea and horticulture, and a major employer, accounting for about 12% of the total wage employment and 13.7%of the gross domestic product (GDP)58 The tourism industry has been going through a challenging period. Two high profile terrorist attacks, followed by instances of violence during the 2017 elections, have taken a toll on the international leisure segment. The hospitality industry responded to the downturn by reducing prices, and room revenue declined through 2014.59 Kenya’s total annual tourism earnings dropped by 7.4% in 2014 to KSh87.1bn ($958.1m).60 Earnings had been decreasing steadily by around 2% each year since 2011, when they peaked at KSh97.9bn ($1.1bn). The government had already been making substantial investments in the promotion and growth of the industry. The industry itself, forced to diversify in the face of the slowdown, is developing new markets and business avenues, including the Asian leisure market, business tourism and the domestic segment. Expansion of tourism markets to new source markets, especially Asia, including China and Japan has significantly raised foreign tourism revenues and stabilised the market despite persistent insecurity in the country. Other positive factors are the increased quality of accommodation and increased east Asia and west Africa destinations for Kenya Airways.61 In 2015-2016 the tourism sector began a solid recovery as it benefited from successful conference tourism and aggressive marketing. As shown below, key indicators were up significantly, a trend that continues in 2017.
Table 7: Tourism Sector Performance 2015-2016 2015 2016 % Change International visitor arrivals 1.18 million 1.34 million 13.5 Tourism sector earnings KSh 84.6 billion KSh 99.7 billion 17.8 Number of hotel bed-nights 5.9 million 6.4 million 8.5 Number of international conferences 218 227 4.1
Source: Kenya Economic Survey 2017 The National Tourism Policy identifies the main constraints which need to be addressed for the sector to grow, including security concerns, poor infrastructure and lack of sufficiently skilled human resources, inadequate infrastructure support, a limited product diversity with a concentration on only a few parks, over-reliance on traditional western source markets, and cumbersome visitor entry formalities. The traditional focus of tourism on a limited number of high-end hotels, parks and resorts has not helped to address income inequalities, unemployment and poverty. To address these challenges, a range of flagship projects, niche products and supportive programs were initiated under the MTP II. Tourism in general is highly competitive and sensitive to price changes, but premium parks and niche products can be marketed successfully at higher prices. Three new resort cities were to be constructed in Isiolo, Diani and Kilifi with the aim of attracting economic activities and investments and achieving structural multiplier effects in their regions. In the same way rehabilitating and expanding existing facilities and infrastructure aimed at attracting new investment in under-utilized parks.
58 http://www.publicworks.go.ke/downloads/National%20Tourism%20Srategy%202013_2018.pdf 59 PWC South Africa, The South African Hospitality Outlook 2014-2018 60 Kenya National Bureau of Statistics, 2015 61 http://www.publicworks.go.ke/downloads/National%20Tourism%20Srategy%202013_2018.pdf

Kenya: Common Country Assessment 2013-2017 41
These efforts under MTP II have been hampered by the effects of the slowdown but are now producing benefits. In many ways, the drivers of long-term demand in Kenya’s tourism sector, including supply diversity, infrastructure quality and destination accessibility, remain extremely attractive and are among the strongest, not just regionally, but across the whole continent of Africa. Kenyan operators are now seeking to diversify revenue streams through the expansion of source markets to grow the tourism sector. Kenya Airways increased flights to China. Meanwhile, high-end hotel chains in Nairobi continue to thrive: occupancy rates are as high as 70%, achieved through corporate guests who make up around 95% of the hotel bookings. The domestic tourism segment continues to evolve into the sector’s primary source of income. According to the WTTC, domestic travel spending accounted for 58.1% of direct travel and tourism GDP in 2014. Over the next decade, the WTTC forecasts that domestic spending will continue to increase at an average annual rate of 5.2%, reaching KSh386.7bn ($4.3bn) in 2025. As the sector expands domestic travel and international tourism in under-used parks, there should be careful efforts to involve marginalised communities, to assure that the expansion promotes inclusion and economic opportunity among the poor. 4.4. Access to energy In Kenya Vision 2030, energy is a key foundation and one of the infrastructural “enablers” upon which the pillars of this long-term development strategy will be built. The successful implementation of the flagship projects of the Vision will greatly depend on a supply of adequate, reliable, clean and affordable energy. Electricity generation must increase, since it is a prime mover of the commercial sector of the economy. In the MTP I and MTP II periods, investment in energy was increased, and flagship programmes established. Policies, legal and institutional structures that support the development of the energy sector were pursued. The three main sources of energy supply in Kenya are electricity, wood fuel, petroleum and renewable energy. Solid biomass, largely non-commercial, meets an estimated 77% of Kenya’s energy demand.62 Commercial energy is dominated by petroleum, electricity, charcoal and some fuel wood. While oil was discovered in 2012, production has not begun. Kenya’s energy use per capita of 468 kg of oil equivalent is less than one quarter of the world’s average per capita. The cooking and lighting fuel used by households depends on socio-economic status. High level energy sources are cleaner but cost more and are used by households with higher levels of income. Simpler sources of fuel, mainly firewood, are used by poorer households. Lack of access to clean sources of energy is a major impediment to development and a source of health problems. A total 65 percent of households in the country use primitive fuels, mostly firewood (64 percent), as the main source of cooking fuel, followed by transitional fuels, mostly charcoal (17.0 percent). Only 6 percent of households use advanced fuels, mostly LPG (5 percent). The use of advanced fuels is 16 times more while the use of transitional fuels is 7 times more in urban areas than in rural areas. The use of primitive fuels is 4 times more in rural areas than in urban areas (see figure 11).
62 IAEA, 2011
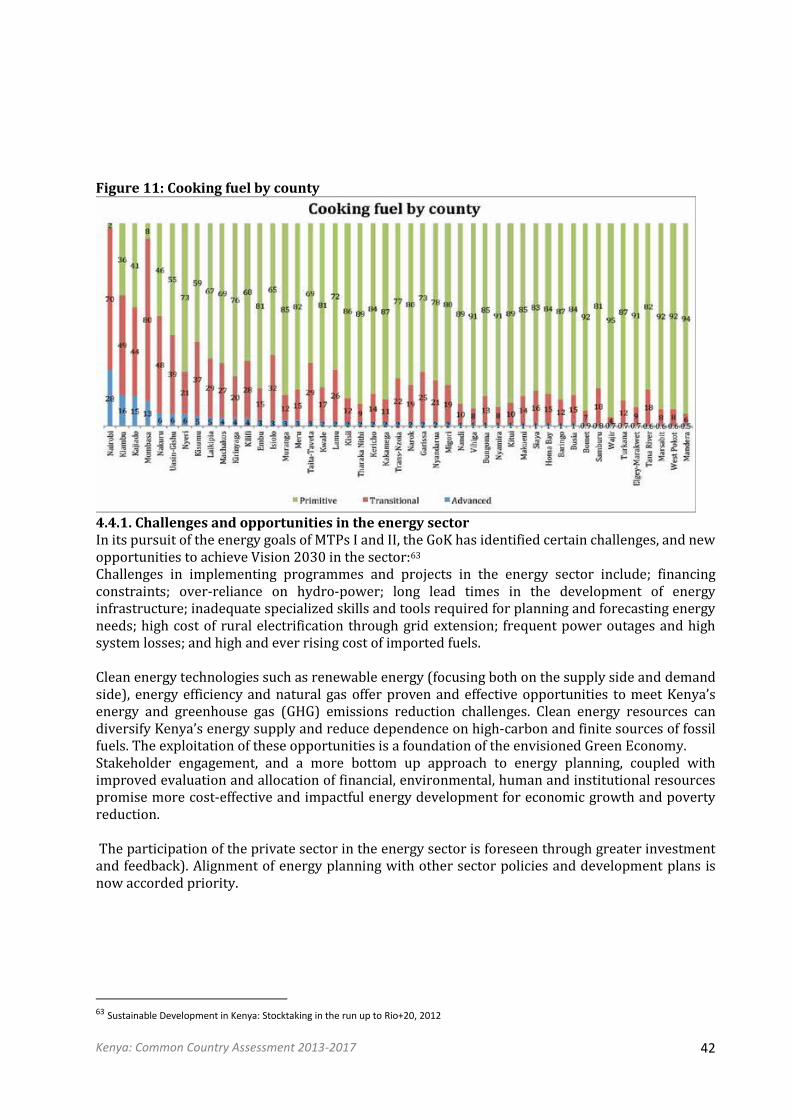
Kenya: Common Country Assessment 2013-2017 42
Figure 11: Cooking fuel by county
4.4.1. Challenges and opportunities in the energy sector In its pursuit of the energy goals of MTPs I and II, the GoK has identified certain challenges, and new opportunities to achieve Vision 2030 in the sector:63 Challenges in implementing programmes and projects in the energy sector include; financing constraints; over-reliance on hydro-power; long lead times in the development of energy infrastructure; inadequate specialized skills and tools required for planning and forecasting energy needs; high cost of rural electrification through grid extension; frequent power outages and high system losses; and high and ever rising cost of imported fuels. Clean energy technologies such as renewable energy (focusing both on the supply side and demand side), energy efficiency and natural gas offer proven and effective opportunities to meet Kenya’s energy and greenhouse gas (GHG) emissions reduction challenges. Clean energy resources can diversify Kenya’s energy supply and reduce dependence on high-carbon and finite sources of fossil fuels. The exploitation of these opportunities is a foundation of the envisioned Green Economy. Stakeholder engagement, and a more bottom up approach to energy planning, coupled with improved evaluation and allocation of financial, environmental, human and institutional resources promise more cost-effective and impactful energy development for economic growth and poverty reduction. The participation of the private sector in the energy sector is foreseen through greater investment and feedback). Alignment of energy planning with other sector policies and development plans is now accorded priority.
63 Sustainable Development in Kenya: Stocktaking in the run up to Rio+20, 2012

Kenya: Common Country Assessment 2013-2017 43
4.4.2. Kenya’s progress during MTP II The goal of the energy sector is to ensure that every Kenyan has access to electricity. To achieve this, about 5.95 million households have been connected to an electricity supply in three years, resulting in 65 per cent of households having access to electricity. During the same period 97 per cent of public primary schools were connected to electricity. Customers connected under the Rural Electrification Programme (REP) rose by 38.2 per cent from 703.2 thousand in 2015 to 972.0 thousand in 2016. Expansion of electric power is not likely to achieve the goal of universal electrification by 2020. Total installed electricity capacity stood at 2,325.7 megawatts (MW) as at December 2016.The intermediate national target has been to increase installed electricity capacity by 5,538 MW to slightly over 6,700 MW by 2017. Having access to electricity also does not mean it is always available: in 2014, only 33 per cent of survey respondents stated that they had connections that worked most or all the time. Affordability is also an issue for many households. A Carbon Action Plan aims to increase the use of energy from renewable sources with dedicated projects. Some of these include photovoltaic power plants, cogeneration plant powered by vegetable oil, biomass plants for steam generation and supply of electricity from wind power. Households have also been supported to invest in improved cooking stoves and to access small solar systems for lighting and basic electricity services. Kenya possesses significant potential sources for power generation in geothermal, wind and biomass energy. Overall, 61 per cent of total power generation capacity is expected to come from renewable sources. As at November 2015, approximately 86 per cent of commercial power generation capacity was from renewable sources. At the same time, the renewable energy share in the total final energy consumption stood at 12.4 per cent in 2014 before decreasing slightly to 11.8 per cent in 2016. Currently, Kenya is building the largest wind farm in Africa – the Lake Turkana Wind Power Consortium (LTWP). It aims to provide 300 MW of low-cost electrical power. Once operational, it will allow the country to eliminate its thermal generating plants, saving KShs. 15.6 billion (US $180 million) per year on imported fuel. Geothermal power has the potential to provide reliable, cost-competitive, base load power with a small carbon footprint, and diversifying power supply away from hydropower, which currently provides the bulk of Kenya’s electricity. Kenya currently has 636 MW of installed geothermal capacity and aims to have 5,530 MW of geothermal power or 26% of total capacity by 2030. This will make it Kenya's largest source of clean energy by 2030. The Mwananchi Gas Project, under implementation, is expected to increase LPG gas usage from 10 per cent to 26 per cent on completion. By September 2017, 10.6 million Kenyans were expected to have access to clean cooking energy.

Kenya: Common Country Assessment 2013-2017 44
5.0. SOCIAL SECTOR THEMATIC AREAS The Social Pillar of the MTP III seeks to build a just and cohesive society with social equity. Government is committed to investing in improving quality of and access to free healthcare and education as well as the social safety net to reduce burdens on households and complement sustainable long-term growth and development. While the country has made significant progress on social indicators, more effort is required to achieve the Sustainable Development Goals (SDGs)64. Between 2000 and 2015 Kenya had mixed success in implementation of the Millennium Development Goals (MDGs). Successes included improved net enrolment rates in education, and greater promotion of gender equality and empowerment of women. However, targets were not met about eradicating extreme poverty and hunger, reducing child mortality, combating HIV and AIDS, malaria and other diseases, ensuring clean water supply and sanitation, and particularly improving maternal health. There are some striking differences in many indicators at regional level in Kenya. Figures for most indicators, such as several related to poverty, education and healthcare, appear to be particularly low in the arid and semi-arid counties, and especially in Mandera, Wajir and Turkana Counties, which are affected both by security concerns and by the ongoing drought. However, groups in other areas of the country also face vulnerabilities. The high prevalence of HIV and large numbers of orphaned children in the southwest of Kenya (particularly Homa Bay, Siaya, Kisumu and Migori Counties) leads to specific violations of rights, and access to services for those living on islands on Lake Victoria is particularly problematic. Increasing numbers of people are residing in informal settlements around the country’s major cities, often in poor living conditions and with limited access to services. Including spending at county level, almost 40 per cent of government expenditure was on social sectors in 2015-2016, of which education accounted for more than half. However, efforts are still needed to allocate needed resources in sectors such as water, sanitation, nutrition and child protection. Planning for and monitoring social services is constrained by a lack of disaggregated data. The Government is working to improve the capacity of Ministries to generate sectoral statistics. 5.1. Causes of Social Challenges Kenyan society has developed over time based on ethnic nationhood, colonialism, religion and tribalism. Development has led to wealth for some and highly positive achievements in affording critical aspects of modernity for all, but also great inequalities, with severe vulnerability and exclusion, especially in informal settlements and ASALs. This is reflected in inequitable access to social services (e.g. education and health) across economic and social classes, geographical regions and ethnic enclaves. Many communities subsist in conditions close to pre-colonial circumstances, or worse, in endemic poverty. Poor governance and corruption diminish the potential positive impact of modern public systems and services. Under Kenya’s former, centralised system, policy formulation and implementation were distant from those served, which often led to poor design, performance and accountability. Weak accountability systems in turn have allowed corruption to flourish. Traditional social norms and values have been unable to restrain this breakdown of public performance and trust. The devolution of authority to county level is intended to bring accountability for public services closer to the people. This highly promising shift can transform governance, but only if the people served become active rights holders - holding public service duty bearers to account at county level. Poor delivery systems (e.g. for education and health) are felt directly by local communities, and therefore have good potential for improvement using a rights-based approach. But for such local efforts to be effective, underlying problems of inadequate resource allocation, inadequate human capacity and skills, poor infrastructure and weak policy implementation must also be addressed nationally.
64 Kenya Voluntary National Report, 2017

Kenya: Common Country Assessment 2013-2017 45
Creating a rights-based partnership for social development will often be difficult. Most people have fragile livelihoods and limited livelihood options, and are often highly vulnerable, with low information and low literacy levels. Inequality and exclusion result in leaving many behind. Undermining all positive efforts and trends, high population growth drives uneconomic division of farmland, and heavy rural-urban migration, leading to ballooning informal urban settlements and slums, and greater poverty, alienation, inequality and marginalization. Population growth also makes it highly difficult for Kenya to expand services, livelihoods and housing to keep pace. And the growth of the urban population runs ahead of urban planning and land use management. 5.2. Demographic Contribution to Economic Growth and Poverty Reduction The total world population is projected to increase to 9.6 billion by 2050, with growth mainly in developing countries, with more than half in Africa. Population of developed regions will remain largely unchanged at around 1.3 billion. In contrast, the 49 least developed countries are projected to double in size from around 900 million people in 2013 to 1.8 billion in 2050. As of midyear 2016, Kenya had a population of 48.5 million. Its annual population growth rate was 2.6%, and 41% of Kenya’s population was under age 15. The Total Fertility Rate, or the average number of children per woman over the course of her lifetime, had declined from 6.1 children in 1990 to 4.4 children per woman in 2015. Kenya is on the path to a population age structure that may enable it to experience a demographic dividend.65 5.2.1. Population and Economic Growth Owing to its high fertility and declining mortality, Kenya is characterized by a youthful population. Projections show about 43 per cent of the population is younger than 15 years (Republic of Kenya, 2009). This implies that over three-fifths of Kenya’s population, or about 25 million people in 2009, are less than 25 years old. Consequently, Kenya faces the formidable challenge of providing its youth with opportunities for a safe, healthy, and economically productive future. Population growth in Kenya continues to exert pressure on land and other resources. High fertility, combined with declining child mortality gave Kenya one of the world's fastest population growth rates in the 1970s and 1980s (Ajayi and Kovole, 1998). The total population rose from about 10 million at independence to 15 million by 1978 and to 47 million in 2017 (estimate). This rapid growth, combined with an economic slowdown, prompted the government to promote family planning to lower fertility rates. Kenya was one of the first African countries to adopt a policy to slow population growth (Ajayi and Kovole, 1998). The trends in growth of population and Gross Domestic Product (GDP) in Kenya from 1963 to the year 2009 show a long-term decline in population growth, and a cyclical increase in GDP growth per annum. The country recorded its highest population growth in 1967 at 4.7 per cent. It grew 3.3 per cent in 1969, 3.8 per cent from 1969 to 1979, 3.4 per cent from 1979 to 1989, 2.9 per cent from 1989 to 1999 and 3.0 per cent for the period 1999 to 2009 (Republic of Kenya, 2010). During the same period the rate of growth of GDP was cyclical, ranging between several years of low growth or contraction (due to natural or complex disasters) and years of high growth of over 7%. 5.2.2. The Global ‘Youth Bulge’ There are currently 1.5 billion people aged 12-24 in the world, with 1.3 billion of them in developing countries. Many developing countries have reached or will soon reach a historical peak in the size of their youth population, a peak that is probably the largest number of young people these countries will ever see. Youth populations in Asia and Latin America reached a peak around 2010 and then began to decline, while Africa's youth population is projected to keep growing beyond 2050. Kenya's youth population was about seven times its 1950 level in 2010 and is projected to be over 12 times its 1950 level in 2050.
65 http://www.demographicdividend.org/country_highlights/kenya/

Kenya: Common Country Assessment 2013-2017 46
The current youth bulge is a product of the "demographic transition," the pattern of fertility, mortality, and population growth that has played out with great regularity around the world. The demographic transition begins when mortality, especially infant and child mortality, begins to fall but birth rates remain high, generating population growth. Birth rates eventually decline, slowing the rate of population growth. High-income countries went through the demographic transition in the 1800s or early 1900s, with a long, slow mortality decline. Population growth rate was modest, rarely exceeding 1% per year. The demographic transition in developing countries has been quantitatively quite different. Mortality declined much faster, generating population growth rates that sometimes exceeded 4% per year, implying doubling times of less than 20 years. For many developing countries and for the world the most rapid population growth occurred in the 1960s, when death rates had fallen rapidly but birth rates were still high. The world's population growth rate reached a maximum of about 4% per year around 1965, the peak of the "population explosion." The rapid growth in the size of birth cohorts in the 1960s caused rapid growth of the childbearing-age population some twenty years later, a process demographers call "population momentum." Today's youth cohort is made up of the children of this population explosion generation.66 5.2.3. The ‘Demographic Dividend’ In Kenya Kenya is at a demographic transformation stage. Fertility levels are declining gradually and Kenyans are living longer. There is reason for optimism that Kenya can benefit from a demographic dividend within 15 to 20 years, if it is able to provide sufficient economic opportunity. It is estimated that its working age population will grow to 73 per cent by 2050, potentially boosting the country’s GDP per capita to some 12 times higher than the present, with nearly 90 per cent of the working age population in employment.67 Conversely, the current youth bulge poses serious challenges to Kenya in the areas of job creation, education, and service delivery. It may be an opportunity, a “demographic dividend” which could transmute Kenya’s fortunes in the first half of the 21st century, but only if the country takes the right steps towards investing in the current youthful population, on the East Asia model.68 Today, among the youthful two-thirds of Kenya’s population, many are unemployed, with the ratio of youth unemployment to overall adult unemployment standing at 46 percent (2009 Kenya Population and Housing Census). At the same time, there are eight dependents for every ten working Kenyans, meaning that the average worker will very often have little left to save or invest for growth. Kenya’s low gross domestic product (GDP) per capita of US $1,246 has contributed to family poverty and increased economic inequalities. Kenya’s ability to turn its youth bulge into a demographic dividend will depend on how it addresses the key challenges facing Kenya in education, health, women’s empowerment and employment. If Kenya does not resolve these issues, the demographic dividend risks becoming a demographic disaster, with ever larger numbers of unemployed, frustrated and unemployable youth. Kenya has “a window of opportunity”, which shuts in an average period of 29 years. There is no automaticity about a youth bulge producing a growth dividend. 5.2.4. Policy Measures A demographic dividend can be realized through many steps:
i. First, improvements in health and nutrition status, especially of girls, women and children, will contribute to a decrease in the number of children born to each family, as survival improves. Programmes to increase access to family planning would prevent unintended pregnancies leading to fewer births. Reductions in fertility coupled with child and maternal mortality
66 The Demography and Economics of the World’s ‘Youth Bulge, David Lam, World Bank 2007
67 http://www.nation.co.ke/oped/opinion/Demographic-Dividend-Youth-Kenya-Society-Population/440808-2840490-15hihh6z/index.html. Also, NCPD Policy
Brief: Demographic dividend opportunities for Kenya, July 2014. 68 “With Kenya’s Youth, The Future Is Here: Invest to Reap Demographic Benefits” Chatterjee and Kibaru-Mbai, UNFPA

Kenya: Common Country Assessment 2013-2017 47
declines are all associated with greater power for women to make decisions about how many children they want and how to raise them. As women cease spending their most productive years having and raising children they can then enter the workforce and contribute to economic production.
ii. Investment in the education of youth. Appropriate education and skills (including life skills) will enable youth to participate in the economy and provide needed labour for its growth. In addition, studies have shown that girls’ education (particularly at secondary level), and empowerment will delay early marriage and slow adolescent fertility. Cultural, social and economic barriers that hinder empowerment of girls and women should also be addressed. Women are half of Kenya’s demographic dividend; if they are given the right tools and community support, they can not only become financially independent, but be the engines that fuel Kenya’s future growth.
iii. Creation of an economic environment where educated youth can find well-paid, decent jobs. Economic policies must target job creation in areas that have potential for longer term returns, including technical and vocational education, agriculture and technology. Kenya has the potential to reap the biggest demographic dividend in world history with a young, working age population at a time when many other economies of the world will be aging. Investments in health, education and economic policies must then be underpinned by good governance, the exercise of public authority which entails adherence to the rule of law and enhancement of human rights applied universally. Only by ensuring a healthy, educated, productive population can Kenya achieve its dream of a becoming a prosperous middle-income country.
5.2.5. Population Programmes in Kenya Kenya was the first Sub-Saharan African country to have a population policy, forming the National Family Planning Programme to reduce population growth in 1967. However, implementation did not yield the desired results. The revised 1984 policy incorporated demographic and socioeconomic goals and diversified partners. The demographic intentions were to reduce the population growth rate, fertility, mortality (particularly infant and child mortality) and rural–urban and rural–rural migration. In 2000, the government of Kenya launched a National Population Policy for Sustainable Development to implement the programme of action of the 1994 International Conference on Population and Development (ICPD). The policy addressed the environment, gender, and poverty, as well as youth. The policy aimed to sustain the ongoing demographic transition. A review of the National Population Policy in the development of Vision 2030 aligned population policy, strategies and programmes with the SDGs and Kenya Vision 2030. Results of the 2008/9 Kenya Demographic and Health Survey and the 2009 Population and Housing Census showed that Kenya is still in the stage of demographic transition characterized by substantial decline in mortality and persistent relatively high fertility. This is contrary to expectations, Kenya having experienced a rapid fertility decline, from 8.1 births per woman in 1979 to 4.7 births per woman in 1998. Birth rates stagnated thereafter, at 4.9 in 2003 and 4.6 in 2009. While birth rates stagnated, from 2003 to 2009 mortality drastically declined. The persistent high fertility in Kenya has resulted in a relatively large and increasing youthful population. The GoK views further reduction of fertility and childhood mortality rates to be critical if Kenya is to record a decline in population growth rate in the future.

Kenya: Common Country Assessment 2013-2017 48
A new population policy adopted in 2012 aims to reduce the number of children a woman has over her lifetime to 3 by 2030. The policy also includes targets for child mortality, maternal mortality, life expectancy, and other reproductive health measures. 5.3. Education and Learning Kenya’s education system has prioritized formal academic education, and only committed to provide universal, free primary education in 2003. This has led to a large youth cohort lacking basic education and skill required for employment. Technical and vocational education and training (TVET) have been very limited. Almost 10 times fewer Kenyans are in vocational training in comparison with the Sub-Saharan Africa's average.69 There is a huge gap in education and technical training for youth entering the labour market. Kenya’s school system has grown rapidly to meet demand from the expanding school-age population, but growth has not kept pace, resulting in overcrowding and the proliferation of private institutions. The system will need to expand to accommodate rising enrolment rates in pre-primary school (73.6% in 2014, KNBS) and secondary school (62.9% in 2015, KNBS). In 2015, the government spent US$3.38 billion on education; spending has increased significantly in recent years, with the government allocating between 23 and 27 per cent of the national budget for education.70 Families spent US$1.44 billion on education in 2015 and expenditure is forecast to rise sharply to US$2.42 billion by 2020. Although the children of affluent Kenyans are likely to attend private schools locally as well as institutions abroad, low-fee private education has also proliferated with studies suggesting that up to 40 per cent of children living in urban slums enroll in such schools. Despite achieving almost universal access to primary school and significantly improving enrolment at secondary level, quality and standards have not kept pace with growing access. Although marginal, it is worth noting that primary and secondary education has been provided to some 94,500 refugees in Karuma and host populations in schools registered with the Government as public examination centers but funded primarily from humanitarian resources. While additional funding will remain, greater integration in the Kenyan education system will be sought. 5.3.1. Education policy The overall education sector goal is to increase access to education and training and improve its quality and relevance. The aims are to reduce deep inequalities, as well as leverage knowledge and skills in science, technology, and innovation for labour market preparedness and global competitiveness. The Kenya Constitution of 2010 provides that every person has the right to free and compulsory basic education, including persons with any disabilities. The Strategic Plan (2008-2012) of the Ministry of Education sought to realize these rights through the following strategic objectives:
• To ensure that all children, including girls, children in difficult circumstances, and those from marginalized and vulnerable groups, have access to free and compulsory primary education and achieve a Net Enrolment Rate (NER) of 100 percent by 2015.
• To enhance access, equity and quality at all levels of education and training by 2015, and increase transition rate to 90 percent by 2012 at all levels;
• To achieve 50 percent improvement in adult literacy, especially for women by 2015; • To promote and popularize Open and Distance Learning (ODL) at all levels of education and
training by 2012; • To ensure quality management capacities amongst education managers and other and other
personnel in education at all levels by 2015
69 Danish Trade Union Council for International Development Cooperation, Kenya Labour Market Profile, 2014 70 British Council

Kenya: Common Country Assessment 2013-2017 49
Great progress has been made toward each of these objectives, but none have been fully realized, and the 2015 sector review71 recommended they receive continued focus. It stressed the need to enhance support to marginalized groups, especially in urban slums and ASAL areas, and to establish appropriate alternative education for children with severe disabilities. In the two ASAL counties host to 90 percent of registered refugees (Garissa and Turkana) in Kenya, advantage should be taken of the infrastructure established in the regions to respond to the needs of both refugees and vulnerable populations in these two counties. To promote the achievement of the objectives it calls for strengthened partnerships with communities and the private sector, an Education Management Information Systems (EMIS) to ensure availability and use of quality data and a multi-sectoral mechanism to monitor and enforce the constitutional right to free, compulsory basic education. Additional measures, including affirmative action programmes, must be undertaken to ensure that youth have relevant education and training and minorities and marginalized groups are provided special opportunities in education. 5.3.2. Achievements in education Primary and early childhood education Education sector achievements under MTP I & II have been significant including the introduction and implementation of free primary education (FPE) in 2003 and increases in the number of Early Childhood Development and Education (ECDE) centres. Policies, strategies, guidelines and programmes toward the goal of UPE continue to increase participation rates in organised learning: they went from 70.2 per cent in 2014 to 74.9 per cent in 2016. However, enrolment remains a challenge in some parts of the country, especially the arid and semi-arid lands (ASALs), and in informal urban settlements. The net enrolment rate for primary school was unchanged between 2011 and 2015 (88 per cent); but much lower in Mandera 27.2% (18.2% for girls) and Wajir 32.9% (23.6% for girls). Enrolment in pre-school facilities increased from 2.5 million in 2011 to 3.2 million in 2015. In 2015, 97 girls were attending for every 100 boys. Gross enrolment rose from 67 per cent in 2011 and 76.5 per cent in 2015. However, figures vary from 123.0 per cent in West Pokot (because of high over-age enrolment) to 18 per cent in Mandera and 29 per cent in Wajir. The latter two also have significantly more boys than girls at pre-school. Large numbers of Kenya’s out-of-school children have disabilities. However, lack of data makes it impossible to quantify the extent of the problem. Special needs education is now being provided at special schools, integrated schools and special units attached to regular schools. Currently enrolment stands at 102,749. Since January 2016, 184 special boarding schools (167 primary schools, 8 secondary schools and 6 technical-vocational institutions) received capitation grants. It is clear, however, that these efforts have achieved only partial coverage of special needs children. Secondary schooling and TVET The transition rate between primary and secondary school remains low at 86 per cent in 2014. The low number of secondary schools in the country (9,440, compared to 31,300 primary schools in 2015) is a major bottleneck to secondary enrolment, as are language barriers. Costs are a barrier for poorer families. Contributing factors include the long distance to schools in some areas. Implementation of a bursary scheme to assist select secondary school students meet other education expenses which are not catered for by Free Day Secondary Education and provision of Grants to ASAL and Pockets of Poverty will help address these issues for some.
71 UNESCO, Education for All 2015 National Review Report: Kenya

Kenya: Common Country Assessment 2013-2017 50
The increase in the total number of public secondary school teachers (65,494 in 2013 to 85,438 in 2015) will also improve secondary schooling. The expansion of Technical and Vocational Education Training (TVET) institutions has resulted in an increase in enrolment from 147,821 (75,105 male and 49,454 female) in 2014 to 202,556 (91,209 male and 74,432 female) in 2016. These numbers are inadequate to meet the need for skills training for Kenya’s large youth cohort. Tertiary education The higher education sector has expanded rapidly to meet demand, slowing the flow of students to other countries. By 2016, there were 23 public universities and 10 university colleges, compared to just six public universities in 2000. There are also 37 private higher education institutions including universities and colleges. However, fewer than half of those qualified for entry to Kenya’s universities gain a place and underfunding has led to quality concerns, meaning that demand for overseas options remains and is likely to grow as pressure for places at home rises. In 2015, 400,000 students were enrolled in tertiary programmes, up from just 195,300 in 2010. Males continue to make up the largest share of enrolments (58.5% in 2014–2015, KNBS), reflecting a similar gender gap in secondary enrolments. In 2013, 12,123 Kenyan students were studying overseas in long-established destinations such as the US and the UK, and mobility to non-traditional destinations is rising. Tens of thousands of Kenyan students are studying in the regional higher education hubs of Tanzania, Uganda and, increasingly, South Africa. 5.3.3. Challenges in education Kenya faces difficulties in providing quality education in the face of poverty, high education costs to households and government, unsatisfactory access levels (especially for post primary education), low progression and regional and gender disparities in educational attainment. In 2015, an estimated 1,292,695 children (55 per cent girls) were out of school. Net enrolment at primary school in 2015, at 88 per cent, was the same as in 2011. Net enrolment in Biomet County was 99.8 per cent, compared to Mandera County’s 27.2 per cent (and 18.2 per cent for girls) and Wajir County’s 32.9 per cent (23.6 per cent for girls). Providing state education for children in the informal settlements around large cities such as Nairobi, Mombasa, Kisumu and Garissa are problematic if the government does not recognize settlements: this opens the way to low-cost private schools that may not meet national quality standards. Children from pastoral community’s face challenges including a perceived lack of value of schooling for pastoral societies, and the long distance to schools in some areas. In north-eastern Kenya, educational institutions, their students and their staff have been affected both directly and indirectly by recent acts of violence, including terrorist attacks on schools. Meanwhile, drought has led to school closures, lower attendance (especially in pastoral communities) and reductions in water supply and school feeding. Refugee children in Dadaab and Kakuma struggle with large classrooms and insufficient teachers, as well as a prohibition on entering the workforce that reduces the incentive to study. Refugee children are also faced with limited opportunities for accelerated programs for those who must catch up with the English or Swahili languages or because of having been out of school for significant periods. In some communities, girls may fear losing their “marriageability” by entering secondary school, and face risks of sexual abuse, but many report their education leading to greater successes in life. The government has enforced re-entry policy to address dropout cases of young mothers who conceived while in school and a sanitary towels programme, both of which enhance girls’ participation in learning.

Kenya: Common Country Assessment 2013-2017 51
Government aspires to have computer-based learning in all the country’s learning institutions from primary school level. However, many counties have substandard or non-existent learning facilities. There are still children learning under trees in several counties. It will be a major challenge to raise standards in all schools to the desired level. The quality of education Relatively good national pupil to teacher ratios and regionally high teacher salaries mask significant regional disparities, which particularly affect arid and semi-arid areas. The pupil to teacher ratio is 30.4:1 nationally, but 77.3:1 in Turkana and 56.5:1 in Mandera. This is partly because hazard allowances for teachers are not commensurate to the difficult conditions and insecurity in northern Kenya. Resources that have been provided by humanitarian and development actors in Turkana and Garissa counties could go a long way in meeting the gaps in these regions and improve education outcomes for the populations in these regions. Regionally comparable tests suggest that the quality of education has not improved in recent years. In 2014, only three out of 10 children in Class 3 could do Class 2 work, with the poorest outcomes in Wajir (9.9 per cent), Mandera (10.1 per cent), Turkana (11.4 per cent) and Garissa (12.9 per cent) counties. In 2017 piloting began of a new national curriculum that is intended to produce citizens equipped with relevant knowledge, values and life skills. A Digital Literacy Programme (ICT Integration in Primary Education) aims to integrate ICT into teaching and learning for pupils in primary schools. The private sector has made significant contributions, including free 3G internet for both primary and secondary schools across Kenya. Through the project, 322 schools have been connected in 33 counties, and more than 100 schools have been provided with tablet devices. Although the frequency and reliability of Internet access in Kenya is lower than in more developed economies, with 16.9 per cent of households and 43.4 per cent of individuals reported as having access to the Internet in 2015, recent figures by the Communication Authority of Kenya indicate that 74.2 per cent of Kenyans are Internet users. 5.4. Health for All Since attaining political independence, the government had prioritized the improvement of the health status of Kenyans. Many successive policy documents and national development plans sought to provide health services to meet the basic needs of the population, place health services within easy reach, and emphasize preventive, promotive, and rehabilitative services without ignoring curative services. While both infant mortality and life expectancy at birth, which are basic indicators of health status, had improved significantly over time, they were still unsatisfactory, and Kenya had more recently experienced a downward trend in health-related outcomes and impact indicators. The Kenyan health sector’s goal is “to attain equitable, affordable, accessible and quality health care for all Kenyan citizens” and thereby, reduce health inequalities.72 Policy objectives include: eliminate communicable diseases, halt and reverse the burden of non-communicable diseases, reduce the burden of violence and injuries, provide essential health care, minimise the exposure to health risk factors and strengthen collaboration with sector providers. 5.4.1. Devolved health services Kenya has now taken a radical, new approach, under the 2010 constitution, decentralising health care provision through devolution to new county governments, with the aim of improving health outcomes at the sub national and national levels through improved health service delivery. The counties are now responsible for delivery of most of health services, mainly primary level care and curative services. This should have highly beneficial effects in the medium term, but aspects of the transition have been difficult.
72 The Kenya Health Policy, 2014-2030 and the Kenyan Health Sector Strategic and Investment Plan (KHSSP, July 2014-June 2018). These provide the framework for progress towards attainment of Vision 2030’s goals for the health sector.

Kenya: Common Country Assessment 2013-2017 52
In recent years, Kenya has suffered a range of health emergencies, including outbreaks of cholera, chikungunya, dengue fever, measles and kalaazaar. To a large extent, health emergency prevention and response is reliant on external partners. The devolved health administrations at county level seemingly have failed to plan for or set aside funds for emergencies. Full immunisation coverage fell from 83.8 per cent in 2012 to 79 per cent in 2014 and 76 per cent in 2016, according to Ministry of Health administrative data. This was a result of underfunding for outreach for underserved populations, stock out of injection devices and vaccines, and frequent labour disputes in the health sector that led to closure of healthcare facilities. These problems arose from challenges linked to devolution of health services and reduced communication between healthcare facilities and communities to address demand side constraints. However, some counties that have been able to develop strong action plans (such as Turkana) have reversed this trend. With external support, the country has introduced new vaccines. Successful vaccination campaigns have been conducted, with 19 million children aged below 14 years vaccinated against measles and rubella in 2016 and nine million children aged below five years vaccinated against polio between 2013 and 2017. This has contributed to Kenya being free of polio since 2013. Children in Kenya have been effectively protected against measles since the vaccination campaign. Retention and redeployment of healthcare professionals are also significant issues in Kenya, particularly in more challenging working environments, such as the arid and semi-arid lands. In recent years, the country has also had to contend with large-scale strikes over safety and conditions, in part due to issues arising from devolution. In refugee’s operations of Dadaab and Kakuma/Kalobeyei located in ASAL Counties of Garissa and Turkana respectively, UNHCR in collaboration with Health Departments in Counties and National Government, provides health services to approximately 423,000 refugees. In addition, these services are available to approximately 120,000 host community in these two Counties. Although the services are available to both communities under same conditions, and the fact that MoH provides some commodities (Vaccines, TB Medicines and ART) and ensures integrated disease surveillance and response, a more formal integration with accountable joint planning and implementation of healthcare will accelerate achievements of health for all ensuring that both refugees and locals are not left behind. 5.4.2. Maternal, infant and child mortality Ministry of Health data suggest that significant improvements have been made in skilled birth attendance since devolution, with the figure rising from 44.4 per cent in 2012 to 57.4 per cent in 2016. This is largely a result of making maternity services free of charge, and improved access to comprehensive obstetric maternal and new-born services. In some counties, the improvements are linked to stipends given to mothers for antenatal care visits and delivery at health facilities. The process has also been facilitated by the engagement of Community Health Volunteers, who continuous follow-up with mothers during pregnancy, and linkage with health facilities increasing the use of health services at the community level. However, in addition to being understaffed, dispensaries in the counties often lack basic equipment, facilities and access to water. In pastoral communities, distance to facilities also continues to lead to more deliveries at home. Neonatal, infant and child mortality have also been steadily falling in recent years, though not enough to meet the MDG targets. However, for neonatal mortality the reduction is slower. Factors behind the downward trend in childhood mortality include high impact interventions, such as increased use of mosquito nets among children, immunization programmes and improvements in the health system, including community-based systems. Under-five mortality is generally higher in arid, semi-arid and rural areas, but 2014 Kenya Demographic and Health Survey data suggest that Nairobi also has high levels of under-five mortality. Nevertheless, one in 42 women will die of a maternity related cause, and 8,000 women will die every year in Kenya of maternity related conditions, the seventh highest figure in the world. Recent county

Kenya: Common Country Assessment 2013-2017 53
figures for total maternal mortality are not available, but Mandera County had the highest figure at the time of the 2009 census.73 Figure 12: Neonatal, Postnatal & Child Mortality Rates 2003-2014
Source: UNICEF- Situation Assessment of Children in Kenya; 21 July 2017 5.4.3. Health system access Social Health Insurance is one of the most efficient ways of financing healthcare. It has been recognised in Kenya Vision 2030 as one of the pillars for Kenya to achieve universal health coverage. Reforms in the National Hospital Insurance Fund (NHIF) aim to allow access to comprehensive health care for all, including vulnerable persons, orphans and the elderly. These reforms since 2013 have resulted in improved access to high quality comprehensive health care at subsidised costs, particularly for the vulnerable segments of society. The Health Insurance Subsidy Programme (HISP) aims to remove financial barriers to health care and reduce incidences of catastrophic health expenditures. This will be realised by consolidating and expanding social health subsidy mechanisms with a view to achieving Universal Health Coverage (UHC). This project targets about 21,530 households of which 17,612 households have been registered to access health services from the hospitals of their choice. The Managed Equipment Service has allowed medical facilities to acquire vital hardware, to improve access to comprehensive Kenya Essential Package for Health (KEPH) services by different constituents of Kenya’s population. The project contributes towards acquisition of infrastructure and equipment for about 100 current Level 4 County Hospitals to accepted standards. These facilities will enable them to provide a wide range of comprehensive health care services. The government is also upgrading health facilities in informal settlements through a project that uses mobile services. Many rural Kenyans are still far from envisaged distances to the nearest health facilities. In many counties, even when such facilities are within reasonable distance, they often lack the necessary drugs, equipment, or staff. There is need to construct health centres and equip stock and staff them. In refugee hosting areas, there is need for the county to adopt the health infrastructure and support them for the benefit of both refugees and host populations. Retention and redeployment of healthcare professionals is still a significant challenge, especially in ASAL counties. Community systems for health and a comprehensive public health approach require strengthening. The Beyond Zero Campaign aims to further HIV Control and promote Maternal Newborn and Child Health in Kenya. The campaign provides mobile clinics to all 47 county referral hospitals. By bringing health delivery closer to Kenya’s citizens, the mobile clinics have been able to treat mothers and children who would otherwise have been obliged to walk miles to seek treatment. Health worker density and distribution per 100,000 population has improved from 21 doctors and 165 nurses in 2014 to 23 doctors and 230 nurses in 2016.
73 The Government does not collect geographically-disaggregated data on overall maternal mortality - only on maternal mortality in healthcare institutions.
3331
22
44
2116
41
23
14
0
5
10
15
20
25
30
35
40
45
50
2003 2008 2014
Neonatal Mortality Rate
Postneonatal Mortality Rate
Child Mortality Rate

Kenya: Common Country Assessment 2013-2017 54
5.4.4. Sub-national innovation At the sub national level, devolution has led to innovative initiatives to address health at the community level. These include: • Mother waiting home (KIROR), an initiative of West Pokot. These are homes constructed next
to health facilities. Expectant mothers move to the KIROR a few days prior to their expected day of delivery and are monitored during labour by the health personnel at the health facility.
• Kenya HIV and Health situation room: this platform has revolutionised data management tracking and evaluation, bringing together data to provide easy to interpret graphical representation of health facility and community HIV services uptake and commodity supply, that is allowing national and county managers to track performance in real-time. It is now being expanded to other reproductive maternal health indicators.
• The sub national Government of Embu has introduced a commodity exchange programme on WhatsApp social platform. Sub county pharmacists facilitate the collection of commodities and transfer them to needy sites.
• Garissa County Health Management Team adapted the provision of MAMA74 kits to pregnant mothers and incentives to Traditional Birth Attendants (TBAs) to improve skilled deliveries.
• Oparanya Care aims at reducing mortality rate of mothers and new born babies during delivery.75
• The Reproductive Maternal, Newborn, Child and Adolescent Health (RMNCAH) Project focuses on improving maternal and new-born outcomes in six high burden maternal mortality counties76. These counties experience about 50% of maternal deaths nationally. 507 additional health care facilities received Managed NH equipment and are now providing emergency obstetric and new born care.
The private sector has also made significant contributions: Mtiba is a mobile health wallet for healthcare savings, payments and bonus schemes developed by the private sector. It allows individuals and organisations to distribute funds for healthcare. The private sector has also created a mobile clinic programme, for mothers and their babies, and a vaccine programme against neonatal tetanus. 5.5. Nutrition and food security 5.5.1. Overview Since 2008, Kenya has faced severe food insecurity problems, attributed to frequent droughts, high costs of domestic food production, displacement of farmers during and after election violence in 2007, high global food prices, and low purchasing power for a large proportion of the population. Kenya’s pastoral and marginal agricultural communities are highly vulnerable to erratic rains and drought and are almost completely dependent on rains to sustain their livelihoods. Their situation is further exacerbated by environmental degradation and rapid biodiversity loss. In some of these areas, tensions, conflicts and insecurity limit households’ capacity to engage in normal livelihood activities. Food insecurity is also high in Nairobi, where 96,356 households had poor or borderline consumption in 2016, because of dependence on markets for food among the urban population. Several ASAL counties are faced with severe drought, leading to doubling in the population in food security crisis and in need of humanitarian assistance from 1.3 million in August 2016 to 2.6 million in February 2017. In these counties, 268,000 young children were found to be moderately acutely malnourished in addition to 37,000 pregnant and breastfeeding mothers who are registered in health facilities77.
74 KMET supplies birth/delivery kits or ”Mama Kits” to public health facilities in low income settings in Kenya 75 https://www.standardmedia.co.ke/article/2000143137/make-oparanyacare-attractive-says-mcas 76 Mandera, Wajir, Turkana, Marsabit, Isiolo, Lamu, and Migori counties 77 https://reliefweb.int/report/kenya/wfp-kenya-nutrition-resource-update-may-2017

Kenya: Common Country Assessment 2013-2017 55
There is a risk of a continuing deterioration in food security and nutrition outcomes for the populations in the ASAL, with a below normal long-rains season. Children in the ASAL are experiencing high levels of under-nutrition (approximately two million stunted children under five years), and as well as multiple deprivations in health, water and sanitation, education, protection, education, and material well-being. 5.5.2. Food security The MTP III seeks to address the food insecurity problem boldly, with a commitment to 100% food and nutrition security. To meet its goal within the next five years, it is looking to pursue three major set of initiatives: Enhance large scale production
1. Place additional 700,000 Acres through PPP (including idle arable land) under maize, potato, rice, cotton, aquaculture and feeds production.
2. Form an Agriculture and Irrigation Sector Working Group (AISWAG) to provide coordination for irrigated Agriculture.
3. Use locally blended fertilizer on a 50/50 basis and implement liming e.g. of maize. 4. Incentives for post-harvest technologies to reduce post-harvest losses from 20% to 15% e.g.
waive duty on equipment and feed
Drive smallholder productivity 1. Establish 1,000 targeted production level SMEs using a performance-based incentive model
in the entire value chain. 2. Improve access to credit/input for farmers through a warehouse receipt system and
strengthen the commodity fund. 3. Establish commercialized livestock feed systems to revolutionize the feed regime and
traceability of animals to access export markets. 4. Secure investors to construct a Shipyard in 2018 (site existing) and increase domestic fishing
fleet by 68 Vessels on the Coast. 5.
Reduce the cost of food 1. Contract farmers for the Strategic Food Reserve (for price stabilization) and other
commercial arrangements. 2. Redesign the subsidy model as flexible voucher- and incentive-based, to maximize impact by
focusing on specific farmer needs. 3. Secure investments through PPP in post-harvest handling (storage, cold storage for fish,
aggregation) and market distribution infrastructure to reduce losses. 4. Rehabilitate and operationalize fish landing sites in Lake Victoria. 5. Eliminate multiple levies across counties in the agriculture value chain (enforce laws on
roads)
Because of these measures, the government aims to roughly double availability of maize, rice and potatoes by 2022. This will be achieved by more than doubling the area under irrigation of large scale, modern farms. At the same time, smallholder production and value addition are targeted to increase from 16 per cent of agricultural production and exports, to 50 per cent by 2022.

Kenya: Common Country Assessment 2013-2017 56
Figure 13: 100% Food Security: Select targets
Source: GOK, 100% Food and Nutrition Security Commitment (2018 – 2022), 2018
These increase in production and new SMEs are projected to create a huge increase in jobs: by 2022, 1.5 million new jobs will be created directly, and another 3 million indirectly. And, the cost of food as a percentage of household income is projected to decline from 47 per cent in 2017, to 25 per cent in 2022. Table 8: The support required to drive the food security strategy
Source: GOK, 100% Food and Nutrition Security Commitment (2018 – 2022), 2018

Kenya: Common Country Assessment 2013-2017 57
5.5.3. Nutrition Over the years, the proportion of people who suffer from hunger has fluctuated between 1.5 million and 3 million78. Many Kenyans also face malnutrition, with inadequate intake of nutritious food in children leading to stunting, wastage, immune-compromise, and high morbidity incidences. The prevalence is 29.1 per cent in rural areas compared to 19.8 per cent in urban areas. Malnutrition among children under 5 is 4.1 per cent (considered acceptable by WHO standards), a marked improvement from 6.7 per cent in 2008. However, levels are high for children in the poorest households, in households with poor food consumption, and in households with poor coping strategies. This, however, is likely to change drastically with increased devolved funding. The 2014 Kenya Demographic and Health Survey revealed significant reductions in stunting, wasting and underweight children, as well as an increase in breastfeeding rates. However, high levels of nutritional vulnerabilities are all holding nutritional advances back. Following the devolution of responsibility for nutrition, most counties have failed to scale up capacity to deliver needed nutrition services, though there are some positive exceptions. The coverage of services for severe acute malnutrition and moderate acute malnutrition is estimated at 50 per cent, with variations across counties. Counties that experience insecurity, such as Mandera, have lower coverage while others, like Kilifi, Kwale, Kitui and Narok, often report high levels of defaulting. Key gaps in management of severe acute malnutrition are poor health facility and community linkages, inadequate prevention of acute malnutrition, limited food security responses and lack of predictable long-term funding. It is intended in the future for high impact nutrition interventions to be a regular part of child healthcare service packages. The 2014 Kenya Demographic and Health Survey revealed significant reductions in stunting, wasting and underweight children, as well as an increase in breastfeeding rates. However, high levels of nutritional vulnerabilities associated with chronic food insecurity; drought in much of the country, (which intensified in 2017); disease outbreaks; and chronic poverty are all holding nutritional advances back. Following the devolution of responsibility for nutrition, most counties have failed to scale up capacity to deliver needed nutrition services, though there are some positive exceptions. Across Kenya, households are highly dependent on buying their food and therefore market integration and food prices are key determinants of household food security. The indicator of food price anomalies was 5.66% in 2014 before decreasing to 3.5% in 2016. Rural households purchase around 76 per cent of their food consumption, while the pastoralist community in Kenya’s poorest and most Arid and Semi-Arid Lands (ASALs) areas must buy all commodities apart from livestock products. Table 9: The Kenya National Micronutrient Survey of 2011: Select Indicators79
Problem Pregnant Women
Pre-School children
School-age children
Non-Pregnant women
Prevalence of anaemia, 41.6 per cent 26.3 per cent 16.5 per cent Prevalence of iron deficiency 36.1 per cent 21.8 per cent 9.4 per cent Prevalence of iron deficiency anaemia
26 per cent 13.3per cent 4.9 per cent
National iodine prevalence deficiency
221. per cent 25.6per cent
Prevalence of Zinc deficiency 83.3 per cent Each year two to four million people need external food aid.80 Under-nutrition contributes to an estimated one-third of all deaths to children under581. More than one-third of children are stunted, and stunting increased from 2003 to 200982. Stunting has a higher burden on male (37 per cent) than
78 Kenya Red Cross on www.alijazeera.com>news>2017/03 79 Source: The Kenya National Micronutrients survey 2011 80 Feed the Future Kenya Profile
81 Maternal and Child Health: Kenya [PDF, 706KB]
82 Kenya Demographic and Health Survey 2003. Kenya National Bureau of Statistics, Nairobi, Kenya, & MEASURE DHS, ICF Macro, Calverton, Maryland, USA.

Kenya: Common Country Assessment 2013-2017 58
female children (33 per cent), on children whose mothers are malnourished (45 per cent), and in rural (37 per cent) versus urban areas (26 per cent). Inadequate infant and young child feeding practices also contribute to high rates of under-nutrition, as only one-third of children are exclusively breastfed until 6 months of age, and less than one-quarter of children 6-23 months receive a minimum acceptable diet83 Table 10: Kenya Nutrition Data
2003 2009 2011
Prevalence of stunting among children under 5 (0-59 months) 30% 35% 35%
Prevalence of underweight among children under 5 (0-59 months) 20% 16%
Prevalence of wasting among children under 5 (0-59 months) 6% 7%
Prevalence of anaemia among children aged 6-59 months n/a 46%8
Prevalence of anaemia among women of reproductive age (15-49 years) n/a n/a
Prevalence of thinness among women of reproductive age (15-49 years) 12% 12%
Prevalence of children aged 0-5 months exclusively breastfed 13% 32%
Prevalence of breastfed children aged 6-23 months receiving a minimum acceptable diet n/a 24%
Source : https://www.usaid.gov/what-we-do/global-health/nutrition/.../kenya-nutrition-profile 5.5.2. The national response to malnutrition Kenya’s commitment to improving nutrition is established in Vision 2030, and its Medium-Term Development Plans. The Government of Kenya approved a National Nutrition Action Plan in November 2012. Kenya has set the following nutrition targets for between 2010 and 2030: reduce severe and moderate stunting by one-third, eliminate iodine deficiency, and reduce anaemia by 30 per cent. The overall impact expected is a 30 per cent reduction in child mortality and an increase in GDP of up to 3 per cent, if implemented to scale. The current National Nutrition Action Plan runs from 2012 to 2017 and is currently under review - a new 5 years NNAP 2018-2022 will also be developed based on the learning from the current review and aims to be more multi sectoral and directly linked to the new Food and Nutrition Security Policy Implementation Framework (FSNPIF) – where nutrition is well articulated. A Nutrition Interagency Coordinating Committee serves as the multi-stakeholder and multiagency platform to coordinate nutrition programmes. Higher-level coordination structures, the National Food Security and Nutrition Steering Committee (NFSNSC) and the National Food and Nutrition Security Secretariat (NFNSS), were established to support the on-going process of decentralization to ensure that nutrition is also prioritized within the country’s 47 counties, each of which developed a nutrition implementation plan for 2013-2015. Kenya is scaling up the package of 11 evidenced based high impact nutrition interventions with approximately 70% of health facilities in the 23 ASAL currently delivering this package. Further scale up is required to meet the public health benefits described in the MoH/ UNICEF/WB nutrition investment case 2016. In 2012, Kenya joined Scaling Up Nutrition (SUN), a global movement that unites national leaders, civil society, bilateral and multilateral organizations, donors, businesses and researchers in a collective effort to improve nutrition.
83 Kenya Demographic and Health Survey 2009. Kenya National Bureau of Statistics, Nairobi, Kenya, & MEASURE DHS, ICF Macro, Calverton, Maryland, USA. TTTTTTT

Kenya: Common Country Assessment 2013-2017 59
5.5.3. Achievements and challenges in nutrition There is increasing integration and collaboration with other sectors including Education, Agriculture, Health and social protection. County Nutrition Action Plans, and increased human resources for nutrition, as well as some funding for nutrition by counties has improved implementation. Many new policies have been enacted: Food and Nutrition Security Policy, Kenya National Nutrition Action Plan (2012), Breast Milk and Substitutes Act, Kenya Health sector strategic plan. Emergency response and innovative approaches have been enacted – surge model, nutrition resilience programming. The implementation of 11 High Impact Nutrition Interventions (HiNi) including exclusive breast feeding and promotion of optimal complementary feeding, vitamin a supplementation, iron-folic acid supplementation for pregnant mothers, prevention and treatment of acute malnutrition, promotion of improved hygiene has made positive impacts. Nutrition supplies have been integrated in government led KEMSA supply chain. Strong government-owned information systems have created a strong evidence base for identification of successes and areas of improvement. Kenya has made significant progress over the last five years. It reduced national stunting rates from 35% in 2008/9 to 26% in 2014 and wasting from 6.9% to 4% during the same time. Among the determinants of under nutrition, exclusive breastfeeding rates increased from 31% to 61% during the same time, directly contributing to the related improvements in infant and child mortality. Additionally, Kenya is the only country out of 74 assessed that is on course for all five World Health Assembly targets. However, these gains are not equitably distributed across the country with large disparities still existing. Stunting ranges from 15% to 45% across counties while wasting ranges from less than 1% to persistently high levels greater than 20% in many of the ASAL counties. For instance, rates of stunting are greater than 40% in eastern, coast, and informal settlements and affect mostly the two to three years age group, at which point the impact is mostly irreversible. The absence of a Minimum Acceptable Diet, a key complementary feeding-related determinant of under-nutrition, also declined from 38.5% in 2008 to 21% in 2014. In addition, these children are affected by micronutrient deficiencies, including Vitamin A and Iron. Nutrition was not clearly highlighted or integrated in the MTP II, nor aligned with the SDGs, leading to inconsistent implementation at the county level. There has been limited investment in nutrition by both national and county level governments, and there remains a heavy reliance on donor funding. With donors reducing funding for Kenya, financing gaps are likely. Other challenges include: • A rising incidence of non-communicable diseases and increasing probability of malnutrition
(underweight and obesity), especially amongst the growing middle class; • Limited number of qualified nutrition personnel; • Weak high level multi-sectoral coordination and planning for nutrition; • Conflict in management of devolved health functions; • Underlying food insecurity, especially exacerbated during drought and other emergencies; • Enduring insecurity, especially in North eastern counties of Kenya, limits realization of results.

Kenya: Common Country Assessment 2013-2017 60
5.6. HIV/AIDS 5.6.1. Status and trends Kenya is one of the four HIV ‘high burden’ countries in Africa and has the fifth largest number of cases in the world: about 1.6 million people were living with HIV infection (PLHIV) at the end of 2016. The epidemic has also negatively affected the country’s economy by lowering per capita output by 4.1 per cent. Roughly 36,000 people died from AIDS-related illnesses in 2016, steadily declining from a total of 51,000 deaths in 201084. The high burden of HIV and AIDS in Kenya accounts for an estimated 29 per cent of annual adult deaths, 20 per cent of maternal mortality, and 15 per cent of deaths of children under the age of five. Just over a million of the people living with HIV are on ART in Kenya. According to the HIV estimates report (2016) the HIV prevalence rate realised a significant drop from 6.7% in 2003 to 5.9% in 2015. New HIV infections have declined by 22% and AIDS-related deaths by 44% in Kenya between 2010 and 2016, showing that the 90-90-90 is saving lives85 Kenya is inching closer to elimination of new HIV infections among children with a 59% decline in new HIV infections between 2010 and 2016. Improvements are mainly due to the rapid scaling up of HIV treatment and care. Among the 1.6 million Kenyans living with HIV, an estimated 640,500 deaths were averted by 2016 by scaling up ART. The proportion of pregnant women, adults and children who tested positive and were put on ARVs increased to 66%. Mother to child transmission has also been reduced greatly in recent years. However, Kenya remains off-track in terms of achieving its prevention target of 22,000 new infections by 2019 (KASF). Progress among young people is slow. About 42% of new HIV infections occurred among young people in 2016. This calls for innovative approaches such as CSE to reach young people with HIV services both in and out of school. Men are being left behind. Men are less likely to know their status, less likely to access treatment, more likely to start treatment late and are more likely to die of an AIDS-related illness than women. Key populations, that is, sex workers, men who have sex with men and drug users, still need urgent attention. 5.6.2. Social drivers of the epidemic Kenya’s HIV epidemic is often referred to as generalized, affecting all sections of the population including children, young people, adults, women and men. Up to 2015, 660,000 children were recorded as being orphaned by AIDS. Factors influencing Kenya’s high generalised HIV burden include cultural practices (e.g. wife inheritance) and widespread promiscuity. Lack of awareness reduces the use of protection. Poverty drives many women to engage in sexual activities in barter for goods or support. In part because of men’s sexual activity with multiple partners, the prevalence rate among women at 6.9% remains much higher than men at 4.2% in 2016 (2017 HIV Estimate report). Notably, 46 per cent of all new HIV infections are among young people aged 15-24 years, with two thirds of those among girls and young women. There is clearly a gap in awareness and protection among girls and young women. Marriage does not seem to reduce the prevalence of multiple partners, especially among men. Married couples account for 44 per cent of new adult infections. Men’s awareness and willingness to practice safe sex is another clear gap.
84 https://www.avert.org/professionals/hiv-around-world/sub-saharan-africa/kenya 85 Kenya is aggressively pursuing this global strategy: by 2020, 90% of all people living with HIV will know their HIV status; by 2020, 90% of all people with diagnosed HIV infection will receive sustained antiretroviral therapy; by 2020, 90% of all people receiving antiretroviral therapy will have viral suppression.

Kenya: Common Country Assessment 2013-2017 61
However, in recent years many studies have identified concentrated epidemics among certain groups who are particularly vulnerable to HIV transmission. The government’s current HIV/AIDS strategy, the Kenya AIDS Strategic Framework 2014/2015 – 2018/2019 (KASF) acknowledges this, describing the epidemic as “deeply rooted among the general population” alongside “concentration of very high prevalence among key populations.”86 It is estimated that 30% of new annual HIV infections in Kenya are among people from key populations. This is disproportionate to how many people from these groups exist within the population. Key populations include men who have sex with men, prisoners, sex workers and their clients, and injecting drug users. These groups contribute a third of new infections in Kenya and require tailored awareness and prevention support. Yet they are often hard to reach. 5.6.3. The geography of the epidemic Geographic location is also a factor, with 65% of all new infections occurring in nine out of the country’s 47 counties, mainly in the southwest. The epidemic is also geographically diverse, requiring geographically differentiated responses. As shown in the table below, those counties with the highest number of new infections among adults (highlighted in red) are either the major cities of Mombasa and Nairobi (or Kiambu, adjacent to Nairobi), or counties in the southwest. The highest prevalence of 26.4 per cent is in Homa Bay County in Nyanza region. The south-western counties of Homa Bay, Siaya, Kisumu and Migori contribute 53 per cent of all new HIV infections among adolescents aged 10-19 years in the country and 50 per cent of all new HIV infections nationally among 15-24-year olds. Poverty and reliance on fishing (which leads to high mobility and “sex for fish”) are key drivers of the virus in this region. The lowest prevalence, approximately 0.4 per cent, is in Wajir County in North Eastern region. There, as in other majority-Muslim areas, cultural norms discourage transmission.
Table 11: HIV Annual Infections by County County New HIV Infections
Among Adults (Above 15)
New HIV Infections Among Children (0-15)
Baringo 108.6 22 Bomet 216.6 45 Bungoma 1,145.0 71 Busia 1,466.9 90 Elgeyo Marakwet 85.1 18 Embu 595.9 44 Garissa 54.6 36 Homa Bay 9,629.2 996 Isiolo 193.4 14 Kajiado 393.8 81 Kakamega 1,934.7 119 Kericho 318.3 66 Kiambu 4,273.1 119 Kilifi 1,413.0 186 Kirinyaga 741.9 13 Kisii 2,071.9 214 Kisumu 8,790.2 909 Kitui 1,546.7 113 Kwale 1,067.8 140 Laikipia 151.0 31 Lamu 103.6 14
86 Kenya National AIDS Control Council (2014) ‘Kenya AIDS Strategic Framework 2014/2015 – 2018/2019’[pdf]

Kenya: Common Country Assessment 2013-2017 62
Machakos 1,744.2 128 Makueni 1,570.9 115 Mandera 72.9 48 Marsabit 151.9 11 Meru 1,391.6 102 Migori 5,092.7 527 Mombasa 2,426 319 Muranga 1,640.4 29 Nairobi 4,719 262 Nakuru 800.9 165 Nandi 217.9 45 Narok 308.8 64 Nyamira 425.1 153 Nyandarua 767.9 14 Nyeri 1,123.6 20 Samburu 57.6 12 Siaya 7,700.3 796 Taita Taveta 526.6 69 Tana River 124.7 16 Tharaka 486.3 36 Trans Nzoia 508.4 105 Turkana 437.7 319 Uasin Gishu 520.2 107 Vihiga 735.5 45 Wajir 27.5 18 West Pokot 93.1 19 Kenya 71,034 6,613
Source : http://nacc.or.ke/wp-content/uploads/2016/12/Kenya-HIV-County-Profiles-2016
Being home to about 172,000 people living with HIV, Nairobi County has the highest HIV burden of all counties. It also hosts high risk populations: young people in informal settlements, and highly mobile groups such as regional refugees, and rural to urban migrants, with implications for accessibility of services. In 2014 the County adopted an initiative to fast track the ending of AIDS as a public health threat by 2030. Since then Nairobi County has achieved a 36% increase in access to antiretroviral treatment, a reduction of mother-to-child transmission of HIV to below 5% and substantive increase in pre-exposure prophylaxis among key populations. This successful approach has been extended to four other places with major informal settlements, namely Eldoret, Kisumu, Mombasa and Nakuru County. 5.6.4. Human rights and HIV People living with the virus are still stigmatized in Kenya, causing many people to avoid HIV testing. Those who are aware they are positive may also find it difficult to get antiretroviral (ARV) drugs or to use them in the presence of other people. Those who do not know their status continue to be involved in high-risk behaviours and activities. Others belong to socially excluded groups. The existence of punitive sections of the penal code makes it difficult for men who have sex with men, sex workers and injecting drug to access services, protect their rights and access justice when their health rights are violated. The government has initiated targeted programmes for these populations, but all are vulnerable and excluded, and require further support within a rights-based approach. In response to these needs, an HIV and AIDS Tribunal was established in 2009. It is the only HIV-specific statutory body in the world dedicated to the epidemic and has powers of a subordinate court. The tribunal has contributed to reducing HIV related stigma and discrimination and has presented an alternative avenue for redress of HIV related human rights violations in over

Kenya: Common Country Assessment 2013-2017 63
2000 cases. The HIV and AIDS Tribunal of Kenya can serve as a possible model for replication in other countries. 5.6.5. The cost of anti-retroviral drugs According to the National AIDS Control Council, life-time costs of antiretroviral treatment for all people living with HIV (based on 30 years with 6% prevalence) would amount to USD $7.2 billion. While Kenya is increasing substantially its budgeted amounts for antiretroviral drugs, this amount is far beyond Kenya’s financial capabilities. External financing remains critical to HIV treatment and care, but its sustainability is problematic, in the face of prospective, long term declines in aid. Financing of HIV treatment and care is a critical national issue. The cost of antiretroviral drugs also raises difficult questions regarding life or death decisions around their allocation: what groups get them, and why. These require that the national strategy have great democratic legitimacy, and be human rights-based, as well as having technical soundness. Promotion of national dialogue, drawing on global best practice, will remain a key role of the UN. 5.7. Safe Water, Sanitation and Hygiene Unsafe or inadequate access to water, sanitation, and hygiene has a profound effect on public health. More than 50 per cent of all hospital visits in Kenya are for illnesses related to water, sanitation, and hygiene. Sanitation related diseases are the number one cause of hospitalization and mortality for children under five. Nearly 90 per cent of diarrhoea is attributed to unsafe drinking water, inadequate sanitation, and poor hygiene. Chronic emergency situations and limited sanitation coverage have contributed to the increase in the spread of faecal-oral diseases such as cholera across the country. Access to safe water, sanitation and hygiene is a basic human right under the 2010 Constitution. While overall responsibility for water resources management is with the national government, the provision of water, sanitation and hygiene services is the responsibility of the county governments. Coordination between the two, and uniform county service capacities are major gaps. Performance data on water and sanitation in urban and rural settings were not previously shared with the public, but this is now a constitutional requirement. A capacity mapping exercise carried out in 2013 showed that Kenya still has gaps in capacity and deployment in areas of high priority. There is a need to strengthen human resources and capacity development strategies for water, sanitation and hygiene to promote rationalization of staff deployment as well as staff training. The percentage of population using safely managed drinking water services was 66.9 per cent in 2014. Since then, an additional 3.3 million people have gained access to clean and safe drinking water. For example, the Nairobi sub-national government has installed public water dispensing machines, enabling residents in informal settlements to access cheap, quality water. The residents pay for water using mobile technology. This has reduced the cost of water and improved revenue collection. From 2014 to 2016, urban water supply coverage increased from 65.4 % to 68.3 %. while access to sanitation increased from 66.7 % to 74 %. The percentage of rural households with access to clean and safe water increased from 45 per cent in 2013 to 50.2 per cent in 2015. This situation is expected to improve substantially under devolved governance. It is notable that (as shown below) successful efforts to increase the availability of improved sources of water in counties such as Turkana and Marsabit mean that they are not the most unequal in availability of water. While significant investments have been made to ensure access to clean water in the Dadaab and Kakuma/Kalobeyei refugee sites, a lot more needs to be done to

Kenya: Common Country Assessment 2013-2017 64
harvest flood/rain water for livestock, domestic and crop production. This is particularly possible in Kakuma which receives a lot of flood water from the hills in Uganda. Figure 14: Improved and unimproved sources of water by county
Source: Kenya National Bureau of Statistics
About 200,000 new water connections will be required annually for universal water access to be realized by 2030. The Government has estimated that it requires KSh 100 billion every year to achieve universal water access but only allocates KSh 40 billion annually, leading to high reliance on external finance. Budgeting for water is further constrained by the high prevalence of non-revenue water in the country. The government has been expanding sewerage capacity, with 887,511 urban households connected to sewerage systems in 2015/2016 financial year. It is expected that by the end of 2018/2019 an additional 388,363 households will be connected. About 350,000 new sewer connections (for about 3.2 million people) will be required annually for universal sanitation access to be reached. Under the devolution settlement, service provision for both water and sanitation are at county level, and the counties have established ministries with responsibilities for both. However, most counties lack the institutional and human resource capacity to deliver strategic planning and coordination. Financing plans are in place for implementing activities in the counties. The challenge has been preparation of investment plans and gaining commitment of resources for sanitation. A sanitation monitoring platform has been built, enabling progress monitoring down to sub-county level across all 47 counties, providing a clear road-map for rural sanitation. Presented with this data and with county sanitation benchmarking reports produced during 2017, eight counties have committed funds to scaling up rural sanitation. However, as shown in the Figure below, the need for improved sanitation correlates with counties with dispersed, low-income populations. It will be difficult to address the needs of those groups in a cost-effective manner.

Kenya: Common Country Assessment 2013-2017 65
Figure 15: Human waste disposal by county
Source: Kenya National Bureau of Statistics The private sector has begun to play a role in financing projects, and this should be brought to scale. The Water of Life Programme is a private sector initiative that has invested in 78 different water and sanitation projects in Kenya, impacting over 3 million people. Citizen management of infrastructure is an important, potential avenue for financing maintenance cheaply. The “Citizen Field Engineer” project, in Nairobi, is another innovative initiative that uses sensors to monitor water quality and supply, which enables community residents to govern, maintain, and repair the physical infrastructure for water delivery. In exchange for their monitoring, residents receive mobile credits, thereby providing a financial incentive to continue with their water management. 5.8. Social Protection The Social Policy Framework (SPF), which was endorsed by African Heads of State in 2009 and echoed in the United Nation’s Social Protection Floor Initiative, commits governments to progressively realize a minimum package of basic social protection that covers: (I) essential health care, and (ii) benefits for children, informal workers, the unemployed, the elderly, and PWDs. Social protection in Kenya is defined by the Constitution, Kenya Vision 2030, and the National Social Protection Policy (NSPP) 2011. Article 43 of the Constitution guarantees Kenyans economic and social rights. It affirms the right to social security and commits the state to provide appropriate social security to persons who are unable to support themselves and their dependents. The NSPP commits the State to reduce poverty and vulnerability. Creation of the State Department of Social Protection at the Ministry of East African Community, Labour and Social Protection in 2015 and the Social Assistance Unit in 2016 have significantly strengthened social protection sector governance, though it remains somewhat fragmented across several ministries.

Kenya: Common Country Assessment 2013-2017 66
5.8.1. Vulnerable groups These vulnerable groups as described below include the 480 000 refugees, among whom 90 % reside in ASALs and 10 % in the urban areas – most of them belonging to the urban poor in Kenyan. The various stateless communities totalling some 18,000 people also display high levels of vulnerabilities as they cannot benefit from the basic social services and are exposed to exploitation when accessing the job markets. Children The State has domesticated the Convention on the Rights of the Child, and the African Charter on Rights and Welfare of the Child, by enacting a Children’s Act 2001. The Convention guarantees the child the right to education under Article 29(1); the right to welfare; and the right to social security and employment. Further, Article 53 of the Constitution also protects the right of every child. Kenya has made progress in protecting the rights of the child. However, a critical mass of children still lives in deprivation: 18.6 per cent of children live in households that sleep hungry, and only 60 per cent of children live in households that can afford three meals a day. There are approximately 4.9 million orphans and vulnerable children (OVCs). Only 2 per cent of children live in households that have previously received CT resources. About 14.4 per cent of children benefit from membership in health insurance schemes. County government budgeting, includes little or no special funds targeting children. Approximately 3.6 million Kenyan children are orphans or otherwise classified as vulnerable. 2.6 million children have lost at least one parent (one million of these to AIDS). Communities have traditionally responded to children without parental care by placing them informally in the care of extended family or community members. However, with increasing socio-economic pressures and weakening family structures, this kinship care mechanism is under threat and many children are at risk of maltreatment. The predominant formal alternative care arrangements are placements in children’s charitable institutions or other institutional care. Amendment of laws and regulations on adoption, including relevant provisions under the Children Act (2001), is still pending. There is currently a moratorium on inter-country adoption and adoption by residents of Kenya who are citizens of other countries, issued in November 2014. This was a response to concerns about possible cases of child trafficking through abuse of Kenya’s adoption processes, and with the aim to review and improve the adoption system. There are still many gaps in legislation and policy related to GBV, child marriages, FGM, child labour, child trafficking etc., that need to be addressed. The specialized children services are not sufficiently equipped neither present to prevent and address the magnitude of the protection risks faced by vulnerable children in Kenya.Children from nomadic community’s face challenges including a perceived lack of value of schooling, and the long distance to schools in some areas. Providing state education for children in the informal settlements around large cities such as Nairobi, Mombasa, Kisumu and Garissa is problematic if the Government does not recognize the settlements: this opens the way to low-cost private schools that may not meet national quality standards. Women Many poor women face challenges that require the attention of the State: 16.4 per cent live in households that go without food at least once a week; about 0.5 per cent cannot afford one meal in a day while 89 per cent are not members of any health insurance scheme. Older persons It is the responsibility of the state to ensure that older persons live a dignified life and receive reasonable care and assistance. However most of the older persons have faced unacceptable challenges: with only 12.7 per cent receiving a pension, and only about 5 per cent receiving cash transfers, and nearly 20 per cent of older persons living in households that sleep hungry at least once in 7 days. Universal pensions for all those over 70 years are introduced from 1 January 2018.
Kenya: Common Country Assessment 2013-2017 67
Only 16.5 per cent have health insurance. The National Hospital Insurance Fund (NHIF) requires a premium payment of Ksh 500 a month to access health services. This fee is unaffordable for most older persons. Youth According to the Social Assistance Act (2013), an unemployed person qualifies for social assistance if they are classified as youth, have no source of income, and their lack of a source of income is not due to negligence. However, there is no social assistance programme targeting unemployed youth. The “Kazi kwa Vijana” programme, which targeted youth, is defunct. Persons with Disability Nearly 46 per cent of PWDs cannot afford to eat three meals a day, while at least 9 per cent cannot afford a meal a day. The national budgetary allocation for PWD-CT is very small. Only 8.7 per cent have ever received social assistance from the government. These could be because of the targeting, which only caters for People with Severe Disabilities (PWSD). Access to health insurance remains a challenge to PWDs, with only 12.7 per cent having a cover.Large numbers of Kenya’s out-of-school children have disabilities. However, lack of data makes it impossible to quantify the extent of the problem. The factors that keep children with disabilities out of school are found both in the home environment and in the education system. Marginalized groups and minorities Article 260 of the Constitution provides no definition for ‘minorities’ but provides a very elaborate definition for ‘marginalized communities’ and ‘marginalized groups’. Most such people likely reside in the arid and semi-arid lands (ASALs), as well as in rural areas and urban informal settlements. They include children, youth, older persons, PWDs and women. Article 56 of the Constitution demands that the state put in place affirmative action programmes to ensure that minorities and marginalized groups participate and are represented in governance and other spheres of life, are provided special opportunities in educational and economic fields, and are provided special opportunities for access to employment. The marginalized and minority communities are in most cases affected by hunger and drought. The government has put in place mechanisms to avert food insecurity during crisis periods with mixed outcomes. However, there is need for sustainable solutions to avert extreme hunger always. The constitutionally created Equalisation Fund aims at correcting the disadvantage of marginalised areas. It is allocated one half per cent of all revenue collection by the national government each year to provide basic services including water, roads, health facilities and electricity to marginalised areas. 5.8.2. The National Social Safety Net Programme Cash Transfers The National Social Safety Net Programme (NSNP) whose objective is to improve well-being and increase resilience among specific vulnerable groups in Kenya who are faced with multiple challenges. The NSNP is comprised of four cash transfer programmes: Hunger Safety Net Programme Cash Transfers (HSNP-CT); Orphans and Vulnerable Children-Cash Transfers (OVC-CT), Older Persons-Cash Transfers (OP-CT) and Persons with Severe Disability-Cash Transfers (PWSD-CT). The social protection safety net cash transfers in 2016/17 were as follows: KShs. 7.9 billion for Orphans and Vulnerable Children (OVC); KShs. 7.3 billion for elderly persons; KShs. 1.5 billion for those with disabilities; KShs. 0.4 billion for street families’ rehabilitation; and KShs. 0.4 billion for Children Welfare Society. Between 2013-14 and 2015-16, the number of beneficiary households of the Government’s four principal cash transfer programmes increased from 522,000 to 829,000. In 2016, it was estimated that more than 2.3 million children (over 10 per cent of those in the country) lived in households that received cash transfers. Of these, the Cash Transfer Programme for Orphans and Vulnerable Children covered 1.1 million. However, the programme’s coverage of the poorest households that need financial support continues to be low, and children under five

Kenya: Common Country Assessment 2013-2017 68
years are particularly unlikely to be in receipt of benefits, while coverage of children with disabilities is only estimated to be 1 per cent. Other interventions include: Equalisation Fund and National Government Constituencies Development Fund (CDF). In 2016/2017 Financial Year the government allocated KShs 68.7 Billion (USD 65 million) about 4.4% per cent of total revenues for direct poverty reduction programmes. Currently, beneficiaries are paid Ksh 2,000 per household irrespective of the number of affected individuals across all the five-cash transfer (CT) programmes. A review of the status of the various groups using the 2015 survey data shows that there is inadequate provision, leading to high levels of inequality and social exclusion. Other programmes include a Hunger and Safety Net Programme, Women Enterprise Fund, Youth Enterprise Development Fund, Affirmative Action Social Development Fund, Constituency Development Fund, UWEZO (Ability) Fund, Procurement Preferences and Reservations (30 per cent affirmative action policy for women, youth, and persons with disabilities in public procurement) National Youth Services Capacity Building Initiatives and the Kenya Youth Empowerment Project (KYEP). These programmes aim at addressing the plight of the less disadvantaged in society, combat poverty, and promote equity. Health Insurance The government has been promoting reforms in the National Hospital Insurance Fund (NHIF) to make it one of the key drivers for achieving universal health coverage. The aim is to allow access to comprehensive health care for all. This has resulted in improved access to health care by Kenyans at subsidised costs; particularly the vulnerable segments of the society and other groups of people including refugees residing in urban areas. 5.8.3. Challenges The overriding challenge for social protection in the coming years will be the coordinated extension of schemes, to reach the most acutely vulnerable, while providing key social insurance elements to the entire population. Groups with particularly difficult circumstances tend to receive the least consistent support. These include the disabled, AIDS orphans, impoverished women and children, and some minority communities. These groups are often found in more remote locations or are scattered. And data gaps, such as that around disabilities, make planning more difficult. Moving towards integration of services provided to refugees with those for the host communities in the two ASAL counties of Turkana and Garissa could also represent an opportunity for taking care of their respective vulnerable populations as has been the case in the past years, 87 and leveraging humanitarian resources for the benefit of nationals in some of the most disadvantaged parts of Kenya. Financing of expanded schemes for the most vulnerable will also be politically difficult, as more socially powerful groups (such as the elderly) press for increased funding. It is telling that a universal pension scheme has been introduced before basic needs of the most vulnerable have been met. Capacity gaps in the social welfare workforce, such as lack of personnel and knowledge and limited infrastructure, hamper their ability to provide social protection services. The access gap is particularly acute in northern Kenya. The State Department of Social Protection faces challenges coordinating the sector, and implementation structures at local level need to be streamlined. Social protection programmes and interventions are implemented by different stakeholders, including Government ministries and agencies, the private sector, communities, households, and other actors. At times their mandates conflict. Coherence and coordination are significant issues. .
87 World Bank: “Yes, in my backyard”, 2017

Kenya: Common Country Assessment 2013-2017 69
5.9. Urbanisation and housing 5.10.
5.9.1. Urbanisation The rapid urbanization experienced by Kenya over the last decade has increasingly affected the living conditions of the populace. More than a third of the population now lives in urban areas, and two thirds of the current urban population live in informal settlements.88 The country’s rural unemployment crisis has created a steady flow of jobless people moving from the rural counties to the cities. Nairobi alone is expected to double its population by 100 per cent by 2030. It is projected that by 2033, half of the population will be residing in towns and cities.89 The process of urbanisation is accelerated by the movement of people displaced by drought, ethnic conflicts, and civil strife. High property prices in urban areas force most migrant households into informal settlements without basic amenities such as safe drinking water, sanitary and drainage systems and other infrastructure.90 Rural-urban migration also slows the rate of development of rural areas as people of prime working age relocate. The Kibera slum within the city of Nairobi is the largest of the informal settlements, with approximately1.2 million inhabitants in an area of 2.5 square kilometres. The environment is degrading and dehumanising, characterised by abject poverty, corruption, periodic violence and contagious disease. Residents largely lack employment.91 The causes and solutions of migration are well understood, as shown below. Table 12: Causes of rural-urban migration and possible solutions92 No Cause/Reason Possible Solution 1 To look for employment Establishing more commerce and industry in
market towns and rural areas 2 Lack of or inadequate social amenities in the
rural areas (i.e., electricity, good schools and recreation)
Improve road networks and supply of electricity in the rural areas Make available high quality educational, health and other facilities in market towns and densely populated rural areas.
3 Inadequate investment in the rural areas Establish/encourage investment schemes in market towns and rural areas
4 Adverse conditions, e.g. due to natural or humanitarian disasters
Improve disaster management and resilience
Investment in infrastructure and energy in underserved areas have been highest priorities of government. The devolution of authority to the counties is also intended in part to empower local people to promote alternate centres of economic development in county capitals and market towns, as well as to improve health, education and other social services. Kenya’s population is concentrated in about 20 percent of the land area. To address the unsatisfactory spatial distribution of the country’s population, Government has adopted policies refocusing the urbanization process from major urban centers to medium and smaller towns as the best way to achieve balanced development.
88 UNICEF, UNICEF – KCO MTR Report, 2016 89 African Development Bank, Kenya Country Strategy Paper 2014-2018, February 2014, at https://www.afdb.org/fileadmin/uploads/afdb/Documents/Project-and-Operations/2014-2018_-_Kenya_Country_Strategy_Paper.pdf 90 WFP, Comprehensive Food Security and Vulnerability Analysis (CFSVA): Kenya 2016, 2016, at http://documents.wfp.org/stellent/groups/public/documents/ena/wfp285586.pdf 91 http://www.lunchbowl.org/the-kibera.html 92 Adapted from https://www.kenyaplex.com/resources/10092-rural-to-urban-migration-in-kenya-causes-and-the-possible-solutions.asp

Kenya: Common Country Assessment 2013-2017 70
This strategy is visibly increasing economic activity in smaller urban areas and holds great promise. As shown in the table below, only three cities have populations of over one million people. Twenty-five more have populations over one hundred thousand. Of these twenty-eight cities, fourteen are county capitals. Twenty-five of the county capitals have populations of under 100,000, and the remainder have populations under thirty thousand. Table 13: Kenyan Cities and Towns with Populations over 100,00093
№ City/ Town Status Population County
Nairobi Metro Metro 6,547,547 Nairobi, Kajiado Machakos, Kiambu
1. Nairobi City 3,375,000 Nairobi
2. Mombasa City 1,200,000 Mombasa
3. Kisumu City 1,068,826 Kisumu
4. Nakuru Municipality 307,990 Nakuru
5. Eldoret Municipality 289,380 Uasin Gishu
6. Kehancha Municipality 256,086 Migori
7. Ruiru Municipality 238,858 Kiambu
8. Kikuyu Town Council 233,231 Kiambu
9. Kangundo-Tala Town Council 218,557 Machakos
10. Malindi Municipality 207,253 Kilifi
11. Naivasha Municipality 181,966 Nakuru
12. Kitui Municipality 155,896 Kitui
13. Machakos Municipality 150,041 Machakos
14. Thika Municipality 139,853 Kiambu
15. Athi River(Mavoko) Municipality 139,380 Machakos
16. Karuri Town Council 129,934 Kiambu
17. Nyeri Municipality 125,357 Nyeri
18. Kilifi Town Council 122,899 Kilifi
19. Garissa Town Council 119,696 Garissa
20. Vihiga Municipality 118,696 Vihiga
21. Mumias Municipality 116,358 Kakamega
22. Bomet Municipality 110,963 Bomet
23. Molo Town Council 107,806 Nakuru
24. Ngong Other Centre 107,188 Kajiado
25. Kitale Municipality 106,187 Trans-Nzoia
26. Litein Town Council 104,600 Kericho
27. Limuru Municipality 104,282 Kiambu
28. Kericho Municipality 104,282 Kericho
Key
93 https://en.wikipedia.org/wiki/List_of_cities_and_towns_in_Kenya_by_population

Kenya: Common Country Assessment 2013-2017 71
Metro Area
Capital City of Kenya
County Capital
The development of smaller towns as economic centres will require integrated support, in terms of town and country planning, and improved governance and services. Further, the benefits of such economic development cannot be allowed to accrue solely to the business community and the well-connected. Strategies for each county must focus on addressing the needs of the vulnerable and excluded: Leave No One Behind must be a central principle of County Integrated Development Plans. The UN system should have a central role in these and other efforts to assure balanced county development. The two main refugee complexes of Dadaab and Kakuma respectively host 230,000 and 180,000 people. Although they do not possess the characteristics of towns they are human settlements which would benefit from urban planning and ultimately also from urban governance structures being put in place, especially since the availability of services has been attracting local populations to settle within the camps, thus in reality accelerating the ongoing urbanisation in these counties. In support of the Turkana county administration UNHABITAT will be examining ways of improving the settlements located in Kakuma and Kalobeyei for the benefit of the host population and refugees.9.2. Housing The housing deficit On current demographic trends, Kenya will be a predominantly urban country by 2030. This creates major challenges in the housing sector. There has been rapid household formation, as well as rural-urban migration, accompanied by expansive growth of slums and informal settlements. The country has been experiencing an annual overall shortfall of housing exceeding 250,000 units. This supply problem drives up prices, and over time, millions of households are denied decent, affordable housing. Urban demand is 250,000 housing units per annum, but only 50,000 are built. There is also an annual deficit of 50,000 units in rural areas. Direct public construction is not a viable answer to the problem. The National Housing Corporation is charged with providing low cost and social housing. It plans to construct 30,000 housing units by 2017 and the ministry will construct over 8,000 units under the Civil Servants Housing Scheme. The government has also been constructing police housing police under an annuity financing model. In 2016, 922 housing units have been completed in Kibera.94 Greater access has been provided to both prime and virgin land for investors to construct housing. However, there are challenges to housing construction and investment, including distorted access to land, high cost of finance, rigid building laws and regulations and the long-term deterioration of housing stock due to the previous lack of a maintenance framework. Informal settlements and slums Population growth, urban migration and the massive shortfall in housing construction has led to uncontrolled and expansive growth of slums and informal settlements. The proportion of the urban population living in slums, informal settlements, or inadequate housing stood at 7.9 per cent in 2014.
94 Ministry of Lands and Physical Planning, 2016

Kenya: Common Country Assessment 2013-2017 72
There are approximately 2.5 million people in about 200 settlements in Nairobi representing 60% of the Nairobi population and occupying just 6% of the land.95 Kibera alone houses perhaps 250,000 of these people. Kibera is the biggest slum in Africa and one of the biggest in the world. The Government owns all the land. 10% of people are historic shack owners and may own many shacks, letting them out to tenants. The remaining 90% of residents are tenants with no rights. The average size shack is 12ft x 12ft built with mud walls, a corrugated tin roof, with a dirt or concrete floor. The rent is about KES 700 per month. These shacks often house up to 8 or more with many sleeping on the floor. There are many tensions in Kibera, particularly tribal tensions between the Luo and Kikuyu, but also between landlord and tenant and those with and without jobs. Only about 20% of Kibera has electricity. It is being extended to some areas, including street lighting, security lighting and connection to shacks (this costs KES 900 per shack, which in most cases is not affordable). Until recently Kibera had no water and it had to be collected from the Nairobi dam. The dam water is not clean and causes typhoid and cholera. Now there are two mains water pipes into Kibera. Residents collect water at KES 3 per 20 liters. In most settlements, there are no toilet facilities. One latrine is shared by up to 50 shacks. Once full, young boys take the contents to the river. Construction of sanitary facilities by external partners is painfully slow. There are no government clinics or hospitals. The healthcare providers are charitable organizations, which also offer free HIV testing and free generic ARV medicine. The policy of the government since independence has been one of ‘slum clearance’. This model has not produced extensive improvements because of opposition of some residents, large in-migration, and the huge cost of direct construction of new housing. Today, while informal settlements are tolerated, they are not generally provided with public services. While their environmental health is poor, and living conditions difficult, they are full of enterprising people with great potential. Improving conditions in informal settlements requires regularization of tenure and provision of public amenities:
• Site and service schemes give people the chance to rent or buy a piece of land. The land is connected to the city by transport links and has access to essential services (e.g., water). People build their own homes using money from a low-interest loan.
• Self-help schemes give people the tools and training to improve their homes. Low-interest loans may be used to help people fund these changes. People may be given legal ownership of the land.
• Enterprise development gives people opportunities for income generation, which can be used to improve the quality of housing and amenities.
• Rural investment to improve the quality of life and create greater opportunities in rural areas may prevent people from migrating to urban areas. Investment in rural areas may therefore help to improve conditions in the city as well.
Inadequate housing In 2014, 43 per cent of children lived in dwellings made of natural material, such as earth, sand, cane, mud, or grass, a rise from 2008-2009. Housing shortages mean there is a critical need to invest more in affordable housing in urban areas. Materials used in the construction of the floor, roof and wall materials of a dwelling unit are indicative of the extent to which they protect occupants. Good housing conditions are also associated with provision of other services such as connections to water supply, electricity, and waste disposal. Low provision of these essential services leads to disease, fewer opportunities, and lack of a conducive environment for learning.96
95 Kibera.org.uk 96 Kenya National Bureau of Statistics (KNBS) and Society for International Development (SID), Pulling Apart or Pooling Together, 2013

Kenya: Common Country Assessment 2013-2017 73
Figure 16: Main material used for floors, walls and roofs in Counties (rural and urban areas)
Turkana, Wajir and Mandera counties have the least proportions of their populations using corrugated iron sheets for roofing their houses, stone, brick or block for walling their houses as well as cement for flooring their houses. Housing policy Vision 2030 aspires to “an adequately and decently-housed nation in a sustainable environment,” attained through: (i) better development of and access to affordable and adequate housing; (ii) enhanced access to adequate finance for developers and buyers; (iii) pursuit of targeted key reforms to unlock the potential of the housing sector; and (iv) initiation of a nationwide urban planning and development campaign, starting with Kenya’s major cities and towns. Kenya’s housing policy emphasizes specific objectives for attaining housing. Its primary focus is to expand availability of housing, to ensure that Kenyan households have decent dwelling units. The chosen instruments for these goals are to facilitate greater accessibility and ownership of housing, slum upgrading in urban areas and the development of a housing Development Fund to increase supply of housing in Kenya’s urban areas. Vision 2030 also states that Kenya’s housing sector could be a growth driver in absorption of labour in the quest to meet the shortage of 250,000 housing units annually. Vision 2030 prioritises infrastructure development and flagship projects comprising metropolitan and investment plans for six regions. External partners are assisting with development of social infrastructure to support the housing sector. There has been a rapid growth in the number of schools, markets, roads, lighting programmes and sewer lines. However, Kenya has not yet developed a self-sustaining model for housing financing and large-scale construction. Some housing laws and regulations have been reformed in line with global best practice, including the housing act and the building code. housing funds have been established to help in reducing the cost of construction. A maintenance policy now requires all buildings to be inspected every 5 years. Kenya’s housing challenges are appropriately described in current policy. However, the policy prescriptions are focused on supply while the housing market has a dual character. Urban areas experience a chronic shortage of rental units and thus need supply enhancements. Rural Kenya has greater space and cheaper land but with poorer quality housing, due to inadequate income to pay for durable walls and flooring materials.

Kenya: Common Country Assessment 2013-2017 74
To address housing issues comprehensively, a range of measures should be taken. Economic growth policies must support the aggressive development of livelihoods for lower income groups, to enhance incomes and thus rental housing and construction materials affordability. Trade liberalization would lower the cost of construction materials. Making land markets in urban areas work efficiently and improving access to housing finance would encourage investment. Finally, urban housing markets would be more efficient with replacement of rent controls and provision of housing vouchers to poorer households.

Kenya: Common Country Assessment 2013-2017 75
6.0. POLITICAL THEMATIC AREAS: PEACE, GOOD GOVERNANCE, CORRUPTION AND ACCESS TO JUSTICE
6.1. The Political Pillar The Constitution of Kenya requires public participation in key governance and policy formulation processes. By providing for public participation, the citizens are to be empowered and made aware of their roles and responsibilities to enable them to participate in deciding on their destiny. The overarching outcome in Kenya’s Vision 2030 for transformative governance looks to the full realization of the constitutional requirements: The articulation of these ideals as concrete goals for achievement under the national plans leading
up to 2030 is of fundamental importance. However, there have been numerous obstacles to the realisation of these ideals since Kenya’s political independence in 1963, which have hardly lessened even after the launch of Vision 2030. Some of the enduring problems are listed in Table 14 below with their respective perceived and root causes: Table 14: Some of Kenya’s enduring political problems and their respective causes
Problem Documented/Perceived Causes Root Causes Poor accountability
• Poor policy formulation/implementation
• Weak Accountability Systems
• Politicisation of public service
• Breakdown of societal norms and values
• Spreading culture of kleptocracy among the political class, Widespread corruption
Endemic Poverty in some regions or enclaves
• Low levels of citizen awareness of rights and responsibilities
• Low participation and poor citizen/media engagement
• Inequitable regional development and skewed public service delivery
• Exclusion,
Violent extremism Insecurity, prevalent conflict and poor social cohesion
• Low levels of confidence in governance institutions, negative ethnicity, Intolerance
• Inequitable social and regional development,
• Historical injustices
Human rights violations
• Gaps in legal framework; incoherence in formulation & application of policies and laws at national & county levels
• Weakened criminal justice system and weak rule of law
• Weak institutional capacities and approaches to human rights
• Selective implementation of policies and application of laws
• Poor Governance
Poor Public Service Delivery
• Weak Institutional Capacities • Limited adherence to the public
service principles and ethicised values system
• Leadership focused on power not service oriented
• Culture of impunity • Corruption
By 2030 Kenya enjoys a state of governance anchored in the rule of law that guarantees human rights
and equitable access to justice, underpinned by a democratic culture that is open, participatory,
effective, inclusive, credible and transparent, with institutions and systems that are fully devolved,
responsive, and results oriented.
Kenya: Common Country Assessment 2013-2017 76
Sources: Various, including the UNDAF Prioritisation Workshop, Naivasha 25th September to 6 October 2017. 6.2. Peace and Conflict Kenya faces multiple peace and security challenges that hinder economic development. These disproportionately affect areas that are already poor and marginalised. The key challenges are: violent extremism (terrorism and radicalization); conflicts over natural resources (pasture, water, extractives and land); and political conflicts (elections, ethnicity and devolution).97 On peace and security, a few areas in Kenya remain vulnerable to inter and intra communal conflicts and an increased incidence of terrorism. In the periods preceding the 2013 and 2017 elections, the National Steering Committee on Peace Building and Conflict Management outlined conflict drivers including: exploitation of ethnic differences for political gain; ineffective public institutions, perceived or real disenfranchisement; socioeconomic marginalization; and insecurity associated with the proliferation of small arms and ‘ungoverned spaces’ within the sub-region. Furthermore, corruption and impunity; poor access to, and delayed justice; social discrimination and inequitable and contested distribution of scarce environmental goods and environmental degradation were cited. The convergence and/or exploitation of these cleavages present a continuing risk of localized or broader conflicts that are particularly exacerbated during electoral years; and suggest a need to focus on the resolution of root cause conflict drivers. 6.2.1. Causes and resilience Long-standing realities of exclusion and deprivation of peripheral communities have been exacerbated by the visible, recent economic growth enjoyed overall in Kenya, heightening a sense of unfairness among those who perceive themselves as ‘left behind’. Such communities also tend to have a relative lack of exposure to people of other religions and ethnicities. Overall levels of literacy and education are low, with youths who join extremist groups particularly deprived in educational terms. 98 Religion is often cited as a reason for joining extremist groups, but most young recruits have limited or no understanding of religious texts. Indeed, higher than average years of religious schooling appears to have been a source of resilience.99 A sense of grievance and limited confidence in government is widespread in regions with the highest incidence of violence. This may be a result of the life experience of acute and relative multidimensional poverty, neglect and political marginalization. Grievances include: belief that government only looks after the interests of a few; low level of trust in government authorities; and experience, or willingness to report experience, of bribe-paying. Disaffection with government is highest among violent extremist groups. Grievances against security actors, as well as politicians, are particularly marked among youths susceptible to recruitment by violent groups, with low levels of trust in the police, politicians and military, and low confidence in the potential for democratic institutions to deliver progress or meaningful change. A key question is how police, military and counter-terrorism units in at-risk environments conduct themselves about human rights and due process. State security-actor misconduct can be a prominent accelerator of recruitment.
97 http://www.chrips.or.ke/publications/research-reports/conflict-assessment-report-2017-peace-security-and-stability-pss-programme-kenya-2016-2020/ 98 Individuals who join extremist groups are found to particularly deprived in educational terms. Journey to Extremism, op cit., p5. 99 Ibid, p 5.

Kenya: Common Country Assessment 2013-2017 77
Meanwhile, positive experiences of effective service provision are a source of resilience: those who believe that government’s provision of services is improving are less likely to be a member of a violent extremist group. 6.2.2. Violent extremism There has been an increasing incidence of terrorism in Kenya. In 2016 Kenya ranked 19th globally at 6.578 (10 being highest), on the Global Terrorism Index. Women are disproportionately affected by conflict and related incidents with the Women Peace and Security Index 2017/18 ranking Kenya 107th globally with a score of 0.631 against a global average of 0.662.100 The initial security threat posed by Somalia-based Al-Shabaab has spread into a web of regionally located terror cells, with partial alliances to terror groups beyond the region. Radicalisation and violent extremism are serious challenges in several Kenyan counties (especially Garissa, Isiolo, Kilifi, Kwale and Mombasa). Mandera, with its proximity to Somalia, is heavily affected. According to Armed Conflict Location and Event Data Project (ACLED), 34 per cent of Al Shabaab attacks in Kenya have occurred in Garissa, making it the most targeted region along with Nairobi. Since 2011, hundreds of civilians have been killed in shopping centers, public transport, a university and places of worship, increasing insecurity and exacerbating inter-religious tensions. Recruitment of young men into extremist movements, particularly Al-Shabaab, has been taking place in all the affected counties over the past three years. Key drivers of violent extremism among youth are poor access to education, poverty, unemployment and lack of opportunities to earn an income as well as a feeling of marginalisation and exclusion101. As a result, the incentive of monetary rewards is believed to have attracted many youths to extremist causes. Perceptions of long-standing regional or communal grievances over land and other resources have also been used to lure youth. Radicalization and violent extremism are rooted in economic marginalization, social exclusion and poor governance, leading to mistrust in national values and institutions. A successful response would promote inclusive human development, particularly in ungoverned spaces, by creating deeper democracy through devolved systems, promoting respect for human rights and social cohesion and the development of attractive and stable livelihood opportunities for youth. 6.2.3. Resource-based conflict In areas with endemic resource-based conflicts,102 pastoralism is the main way of life for many people. Many parts of affected counties are classified as arid/semi-arid lands (ASALs), and therefore conflicts among pastoralists over water and pasture are both common and persistent. Population increases, environmental degradation and restricted access to pasture heighten tensions between communities living in these areas. This sometimes results in violence. Cattle raids are often a cover for or manifestation of conflict over land and have become increasingly commercialised and politicised over the past two decades or so. Over the same period, local communities, particularly pastoralists, have been effectively displaced from communal lands which they have occupied and used for generations. They are denied access to lands which were historically categorised as trust lands, but which have now been purchased by individuals for business and speculative purposes. Most of the lands in question have been allocated for individual ownership, including conservancy owners. Women and children are particularly vulnerable during raids, which sometimes involve sexual violence.
100 Institute for Economics and Peace, Global Terrorism Index, 2016, page 10. 101 http://journey-to-extremism.undp.org/content/downloads/UNDP-JourneyToExtremism-report-2017-english.pdf 102 Especially in the counties of Garissa, Isiolo, Kilifi and West Pokot.

Kenya: Common Country Assessment 2013-2017 78
6.2.4. Ethnic violence Politically-instigated ethnic and communal violence continues to affect the counties of Garissa, Isiolo, Kisumu, Kilifi and to a lesser extent, Kwale. In Garissa, ethnic violence has become more organised and involves both “guns for hire” and standing private militias answering to local politicians. Historically, the planners and perpetrators of ethnic violence in Kenya have done so with impunity. Since the early 1990s, when ethnic violence became a serious concern, there have been few arrests or prosecutions. Recommendations for action against planners and perpetrators by several official inquiries, including the 2009 Commission of Inquiry into Post-Election Violence, have largely been ignored by criminal justice institutions. This can be explained by the fact that powerful national leaders have themselves been implicated in ethnic violence and have used their influence over these institutions to block prosecutions. International prosecutions have also been stymied. 6.2.5. The Kenyan response Preceding the 2017 elections the National Steering Committee on Peace Building and Conflict Management outlined conflict drivers including: exploitation of ethnic differences for political gain; ineffective public institutions, perceived or real disenfranchisement; socioeconomic marginalization; and insecurity associated with the proliferation of small arms and ‘ungoverned spaces’ within the sub-region. Corruption and impunity; poor access to, and delayed justice; social discrimination and inequitable and contested distribution of scarce environmental goods and environmental degradation were also cited. These challenges present a continuing risk of local or national conflicts that are particularly acute during election years. The response of the government to conflict, especially terrorism and electoral tensions, has had a heavy security focus. Indeed, more effective state security institutions, well trained and led, are essential to protect the nation. The security response, however, must be guided by a strategy that seeks to build trust and respects human rights. An effective strategy to contain, reduce and end violence would also focus on the resolution of the root cause conflict drivers. The MTP III foresees many initiatives to do so. To directly support peace-building, the Kenyan strategy on Peace Building and Conflict Management in Kenya was adopted by the National Assembly in 2015. Peace structures have been set up at all levels within government and communities to coordinate peace building and conflict management initiatives and develop and implement intervention strategies. Engagement with the political leadership has been sustained to seek their support in the peace agenda. The promotion of peace is also supported by the establishment of bodies like the National Cohesion and Integration Commission (NCIC), Ethics and Anti-Corruption Commission (EACC), Kenya National Human Rights and Equality Commission, and National Gender and Equality Commission. The Government has also put in place mechanisms to foster peace among warring communities through initiatives like joint Cultural Festivals. Peace dividend projects support peace initiatives geared towards weaning communities from violence and enabling them to use their energies in building peace. Both national and sub national governments are supporting the implementation of the Kenya National Action Plan on UN Security Council Resolution 1325 on Women, Peace Building and Security through engendering peace processes. Regionally, Kenya has participated in various peace keeping missions and support operations, chiefly the Somalia Peace Keeping Mission.

Kenya: Common Country Assessment 2013-2017 79
To promote partnerships and cooperation, Kenya is participating in cross-border meetings and other tripartite arrangements such as EAC, IGAD/CEWARN and bilateral, cross-border peace dialogues with neighbouring countries are held regularly to address conflict issues. The private sector has initiated a peace campaign project meant to foster peaceful coexistence and peace for economic growth and prosperity in the country. This initiative is spearheaded by Kenya Private Sector Alliance (KEPSA) bringing together the private sector, civil society, religious leaders, political leaders, student leaders and governments. The Mkenya Daima initiative is designed to have positive impact on peace in the country especially during and after elections. 6.3. Good Governance The Political Pillar of MTP III aims to realise a democratic political system founded on issue-based politics that respects the rule of law and protects the rights and freedoms of every individual in Kenyan society. The Political Pillar is focussed on Moving to the Future as one Nation. However, the gap between this ideal and current realities is wide, and at times appears to be widening. There is widespread perception that ethnic polarization in electoral politics is destabilizing the nation. The violence and displacements of the 2007 elections were severe and have raised fears of similar conflicts around subsequent elections. Weaknesses in relatively strong governance, characterized by patronage and corruption, are a causal factor in poverty. The 2017 Mo Ibrahim Index on Governance in Africa ranked Kenya an impressive 13 of 53 with a score of 59.3/100, with strengths in national security and safety, rule of law, participation and human rights and gender. Major weaknesses cited are government accountability, corruption and bureaucracy. Corruption is disproportionally pervasive in relation to Kenya’s overall ranking on the Mo Ibrahim Index: the 2016 Transparency International Corruption Perception Index ranked Kenya 145/176 countries with a score of 26/100, noting that corruption has a negative impact on accountability, quality, access and efficiency in the provision of public services. Kenya was ranked Kenya 92/167 in the 2016 Economist Intelligence Unit Democracy Index for inclusive participation and representation and is classified as a hybrid democracy (the category below both full democracy and flawed democracy). Kenya’s overall score is 5.33, compared to full democracy scores of 8 to 10. Least progress is cited in electoral processes and pluralism (4.33); civil liberties (5.00); functioning of government (5.00); political culture (5.63); and political participation (6.67). While the proportion of Kenyan women elected increased from 5.63% in 2013 to 11.40% in 2017; with representation in the National Assembly at 21% up from 19.6% in 2013 Kenya still falls short of meeting the constitutional requirement that not more than two thirds of any gender can hold office in legislative positions or political appointments. The 2017 elections also showed important deficits in the electoral legal framework, and the need for reforms to address underlying conflict drivers that often cause tensions and violence during elections. The implementation of devolved authorities to the 47 new counties during MTP II has expanded the scope and reach of services particularly in the poorest, northern and coastal parts of the country. Increased budgetary allocations, including through the marginalization fund, has resulted in expanded infrastructure, a precondition of easing poverty. The MTP III Concept Note identified several challenges for the 2018-2023 period: better clarification of the roles and functions between national and county governments; low county revenue; irregular disbursement of county funds; and corruption and misuse of public funds. Wide-ranging reforms are necessary to ensure a ‘fit for purpose’ public service, improved public service delivery and increased public trust in government.

Kenya: Common Country Assessment 2013-2017 80
Over the MTP II period Kenya laid the policy foundations for a wide range of priority reforms103 of Kenya’s policy and institutional framework for governance through the promulgation of many policies and laws.104These policies and laws, when implemented, should increase respect for human rights, promote access to justice, respond to Gender Based Violence and realisation of international standards on gender practices,105 public participation and inclusion of youth, women and the marginalized in policy making, among others. 6.4. Corruption The 2016 Corruption Perception Index (Transparency International, 2016) places Kenya 145th Globally (of 176 countries).106 Such a low ranking is correlated strongly with a high degree of social exclusion (social inclusion is a much stronger predictor of corruption levels than GDP per capita). While Kenya has succeeded in developing economically to become a lower middle-income country, it has not significantly reduced high levels of social exclusion. Accountability, quality, reach, access and efficiency in the provision of public services remains a pressing priority. Corruption also seriously affects Kenya's competitiveness. High corruption levels penetrate every sector of the economy. Corruption and a weak rule of law also facilitate criminal networks and the markets they serve. A weak judicial system and frequent demands for bribes by public officials lead to increased costs. Widespread tax evasion hinders Kenya's long-term economic growth, and fraud in public procurement is rampant. Despite market reforms, several business surveys reveal that business corruption is still widespread and that companies frequently encounter demands for bribes and informal payments to 'get things done' in Kenya.107 The public procurement sector in Kenya suffers widespread corruption. Kenya's competitiveness is held back by high corruption levels that penetrate every sector of the economy. A weak judicial system and frequent demands for bribes by public officials lead to increased business costs. Widespread tax evasion hinders Kenya's long-term economic growth, and fraud in public procurement is rampant. According to the EACC, at least 30% of GDP – equivalent to about US$6 billion – is being lost annually to corruption. Political corruption has had a history which spans the entire post-colonial era. Kenya’s government is perceived as among the most corrupt in the world and in Africa according to the 2017 biennial EY Fraud Survey.108 It is estimated the average urban Kenyan pays 16 bribes per month. Most of these bribes are small but large ones are also taken – bribes worth over Ksh 50,000 (US$700) account for 41% of the total value. There is also corruption on a larger scale with senior figures in each of the last two regimes being criticized for their involvement. Corruption, active and passive bribery, abuse of office and bribing a foreign public official are criminalized under the Anti-Corruption and Economic Crimes Act 2003 and the Bribery Act of 2016 which strengthens the fight against the supply-side of corruption. Facilitation payments are criminalized and there are rules for what types of gifts public officials can accept. However, inadequate enforcement is an issue. County governments are also accused of corruption, largely by inflating costs in procurement processes.
103 Improvement of policies/laws through either enactment, signing, enactment or review. 104 National Human Rights Policy Sessional Paper No 3 of 2014; National Policy and Action Plan for Human Rights in 2015; Gender and Development Policy; Legal Aid Act of 2016; Small Claims Court Act of 2016; National Policy on Prevention and Response to Gender Based Violence; Gender and Development Policy; Over 30 policies and guidelines by the National Police Service (NPS); Prevention of Torture Act; Community Land Act; Land Laws Amendment Act; Election Laws (Amendment) Act 2016; Electoral Offences Act 2016; Six (6) electoral process legislations: Political Parties Amendment Act 2016, Election Laws Amendment Act 2016 and Elections Offences Act 2016; Qualifications and requirements for candidates; Presidential Petition Rules; Election Petition Rules; Political Party nomination rules and National Public Participation Guidelines. 105 The institutions where gender advisors were placed include The Parliament, National Gender and Equality Commission (NGEC); Council
of Governors; Ministry of Mines; and Joint UN Team in Turkana. 106 Transparency International, Corruption Perception Index, 2016, p. 107 GAN Business Anti-Corruption Portal: Kenya Corruption Report 108 EY, Europe, Middle East, India and Africa Fraud Survey 2017

Kenya: Common Country Assessment 2013-2017 81
Despite positive developments, the Kenya Anti-Corruption Commission (KACC) was disbanded in 2011 and replaced by an Ethics and Anti-Corruption Commission which is perceived to be less effective. According to a Transparency International public perceptions survey, the Kenyan police are the most corrupt institution in Kenya, and among the top ten bribery-prone institutions in East Africa. After the police, the Ministry of Lands, and the Judiciary branch were the most corrupt institutions within Kenya. The National Police Service has received support towards ensuring ethics and Integrity are entrenched in the institution. The National Police Service was supported to develop an Anti-Corruption Strategy and Code of Conducts and Ethics. To support Policy and institutional framework, there has been advancement in the police reform programme whereby the National Police Service Standing Orders, Strategic and Communication Plans as well as the vetting process have been established. In addition, capacity of the Independent Policing Oversight Authority (IPOA) staff in Complaints Management, Investigations and Inspections of police premises has been improved; this has been done through on-going training from international experts. The National Police Service Commission has progressed with the vetting of officers; they have completed this process for senior ranking officers. The Commission further finalized development of its Strategic Plan, which is now being utilized. The Government continued to implement various institutional reforms to improve police performance in 2016-17. The reforms included: vetting of police officers, installation of a national secure communication network and surveillance system for the National Police Service (NPS) in Nairobi and Mombasa, and introduction of a ‘Roadmap Toolkit’ to guide training of police officers. In August 2016, Kenya passed Access to Information (ATI) legislation aimed at fostering transparency in government, underlining the Government’s willingness to enhance citizen engagement, transparency and accountability. The UN and other partners can play an important role in combating corruption, through the human rights-based approach, in pursuing social inclusion through an innovative programme on governance and accountability that focuses on both policy reform and capacity building in public institutions, and human rights-based advocacy and mobilization campaigns in partnership with civil society. Social inclusion is improved when greater awareness of rights among users of services, and duties among officials, is coupled with enhanced accountability. Such a campaign should draw upon best practices from other African countries that have successfully implemented anti-corruption programmes. 6.5. Devolution and other Governance Frameworks The 2010 Constitution introduced a new system of governance that included 47 county governments with governors and legislatures. In 2013, significant powers were devolved to these county-level governments. This was intended to enhance local participation and service delivery to the most deprived populations. With devolution, and the citizen participation processes required of the counties, government responsiveness and accountability were also expected to increase. County governments have become highly strategic entities, controlling more than 4.5 per cent of GDP in 2015-2016, based on Government figures. They are responsible for planning and delivering a range of functions, including health, water, sanitation, urban services, early childhood development, and other local infrastructure. They are also well resourced and positioned to promote business investment, creating county growth poles as alternatives to large cities. To perform these functions fully, however, they must address urgent capacity development needs. Following devolution, in some cases counties have struggled with insufficient resources to meet competing sector demands, weak systems and challenges attracting and retaining competent or trained staff for planning, budgeting and participatory processes. Early experience indicates that where county governments are committed to improving the situation of the population in their area

Kenya: Common Country Assessment 2013-2017 82
and have been provided with support to develop and implement strong county integrated development plans (CIDPs), significant improvements have been made to several key indicators (health, nutrition and sanitation for example). However, other counties appear to have struggled to spend their new annual budgets, partly because of delays to transfers from national Government, and have not seen similar rises in indicators. The key challenge for the implementation of devolution has been the interpretation of the roles and functions between the national and county governments, as outlined in the Fourth Schedule of the Constitution as well as concurrent and shared functions. Other challenges relate to low collection of own source revenue by county governments and delays in the release of resources to counties occasioned by various factors. Corruption, misallocation and misappropriation of budgetary resources have also been significant in most counties, curtailing the envisioned benefits of devolution to residents. There has also been a trend toward domination of some county governments, and the resources they control, by predominant ethnic groups and clans, to the exclusion of smaller groups. Perceptions among communities of exclusion from political offices and development initiatives have created or heightened tensions within communities and clans in various counties109. Initiatives have been taken by Government to make devolution more effective and address identified challenges. Key devolution institutions were established including the Inter-Governmental Relations Technical Committee (IGRTC), the Intergovernmental Budget and Economic Council (IBEC) and the Council of Governors, among others. A Devolution Policy was developed and launched, and 51 model laws to guide counties in legislation were also developed. To ensure proper implementation of constitutional provisions on devolution, public participation guidelines were developed, and civic education programmes were conducted at both the national and county levels. Counties have put in place solid systems as a basis for devolution process: all the 47 counties have County Integrated Development Plans (CIDPs) to provide the basis for development planning. However, some CIDPs require revisions to strengthen the human rights and gender integration and align to SDGs110. And, continuing support will be required to maintain and build capacities. A National Capacity Building Framework (NCBF) is being implemented in all counties and at the national level. The Ministry of Devolution and Planning developed guidelines for preparation and review of County Integrated Development Plans (CIDP). An Integrated Financial Management Information System (IFMIS) was rolled out to all counties. The Intergovernmental Budget and Economic Committee (IBEC) has initiated the development of a framework to enhance county own-source revenue as well as a framework to guide and manage county borrowing. UN support has been anchored in the NCBF. Support has been provided at the national level to strengthen policy and legislative frameworks and strengthen capacities of strategic institutions. Through the Council of Governors (COG), targeted support has been provided to all 47 counties in many areas which include forums to discuss strategic issues, economic regional blocs, and technical support to counties. UN agencies’ work on devolution and accountability processes has been in the following areas at national and county levels: i) policies, laws and institutional reforms; ii) strengthening of institutional and human capacities; iii) strengthened citizen participation mechanisms and processes; iv) policies, laws and institutional reforms for effective implementation of the Constitution and v) strengthening of institutional and human capacities.
109 http://www.chrips.or.ke/publications/research-reports/conflict-assessment-report-2017-peace-security-and-stability-pss-programme-
kenya-2016-2020/ 110 UNDAF 2014-2018 Mid-Term Review

Kenya: Common Country Assessment 2013-2017 83
The UN will continue to support these processes. At the same time, its emerging strategy of focusing on the most vulnerable will lead to concentration on those counties with the greatest number or prevalence of exclusion and vulnerability. Lessons from these county-level initiatives should be shared and replicated systematically. 6.6. Access to Justice The 2010 Constitution of Kenya obligates the state to facilitate justice to all on equal basis. The right to access to justice includes several rights; the right to access culturally appropriate, procedurally friendly, economically accessible, physically accessible justice and the right to legal awareness and legal aid. The judiciary is an independent body under the constitution, and largely demonstrates independence and impartiality, yet is undermined by allegations of corruption111. Following major reforms in 2011, many unqualified judges were removed, and the reputation of the judiciary subsequently improved112. The judiciary has become more accessible and has reduced its backlog of cases. Parties still encounter difficulties resolving disputes because of weak institutional capacity, a lack of transparency and discrimination113. Companies perceive the judiciary as not being sufficiently independent and do not consider the legal framework effective for dispute settlement or challenging regulations. A third of companies see the court system as a major constraint to their ability to do business in Kenya114. The judiciary has been working towards improving the speed and affordability of justice, raising public understanding of the law and court procedures and promoting public participation through Court User Committees. Significant progress has been made in reducing the backlog on court cases. UN agencies partnered with the High Court on the Justice at Last Initiative (old cases clearance) where, before newly appointed judges were deployed, they cleared close to 15,494 old cases within five days. The new judges were deployed to High Court stations with the highest backlog. These efforts have had some degree of success115. Enforcing a contract takes 465 days on average, which is significantly lower than the regional average116. Access to justice remains a challenge. The costs of justice, especially access to the courts, transport, long distances and delays in finalising court cases works against litigants, especially women accessing justice. Women are also disadvantaged when disputes are resolved through traditional mechanisms such as community elders and clan leaders. Although mobile courts are in place, they are held periodically and there are therefore delays before a case can be resolved. The collection, preservation and presentation of evidence remains a crucial gap, particularly in cases of sexual violence. The legal aid mechanism is not yet operational, and even though pro bono lawyers exist, inadequate structures are in place. Priority should be given to operationalise the National Legal Aid Act. The full implementation of the Act would assure that all persons are represented in a court of law. The Act also sets up a National Legal Aid Service.
111 World Economic Forum, Global Competitiveness Report, 2016 112 BTI Country Report 2016 113 Investment Climate Statement, US Department of State, 2016 114 World Bank Enterprise Survey 2013 115 International Commission of Jurists, Kenyan Branch 116 World Bank Doing Business Report, 2017

Kenya: Common Country Assessment 2013-2017 84
The Court of Appeal has also been decentralized from its previous seat in Nairobi to Malindi, Kisumu and Nyeri. To ensure easier access to judicial services, more trial courts are being established, to ensure that they are reasonably close to the people. The Small Claims Court Act sets up sub-county level courts that will deal with claims not exceeding Ksh 200,000, in an expeditious and informal process. Mediation is now an alternative form of dispute resolution (ADR) in the Judiciary: The Constitution of Kenya, encourages it as a form of dispute resolution. The judiciary in 2016 approved the implementation of mediation within the High Court’s Family and Commercial Divisions in Nairobi. Once an agreement is reached during mediation, it will be adopted and enforced as a judgment or order of the court.

Kenya: Common Country Assessment 2013-2017 85
7.0 CROSS CUTTING THEMATIC AREAS 7.1. Environment The rapid population growth and economic development of Kenya since independence has had a series of generally negative impacts on the country’s unusually rich natural environments. There have been many responses to these growing challenges, with a range of protections, and adaptive and mitigative measures. However, these have not fully stemmed environmental degradation, and the overall trend remains negative. The key issue is that the environment is treated as a second order issue in the context of economic growth and poverty reduction. Environmental issues are generally dealt with as discrete aspects of specific thematic resource management and economic development areas, rather than holistically as an integral national priority. The natural environment in Kenya is considered first and foremost as a set of resources for human use. Environmental issues, natural resources, water, irrigation and mining fall under the authority of a total of 26 semi-autonomous government agencies (SAGAs). As defined, these sectors contribute about 42.4% to gross domestic product (GDP). National goals foresee; conservation, sustainable exploitation, management and utilization of the environment and natural resources for socio-economic development. The national vision for the environment is “sustainable development in a secure environment” while government’s mission is “to promote sustainable utilization and management of environment and natural resources for socio-economic development.” County Environmental Action Plans have been developed and finalized for all counties. These plans, along with the efforts toward community-based conservation of government agencies, provide entry points for a more holistic approach to environmental issues. 7.1.1. Sustainable use of oceans, seas, marine and terrestrial ecosystems Ocean and coastal resources: Over 90% of Kenya’s foreign trade is dependent on maritime transport. Kenya’s enhanced participation in the regional and global maritime transport value chain can yield thousands of jobs in the medium term, make imports cheaper and exports more competitive, as well as establish the Kenyan coastline as a major logistics and transportation hub. Kenya’s Exclusive Economic Zone (EEZ) and adjacent environment is well endowed with resources. The development of the ‘blue economy’ now guides policy making and investment regarding the ocean and coast. Promotion of local deep-sea companies through joint ventures, reflagging of foreign fishing vessels and chartered fishing vessels is one of the country’s strategies in developing its Exclusive Economic Zone (EEZ). A deep-sea fishing fleet development plan calls for a total of 73 new fishing vessels. The promotion of economic use of the ocean and freshwater lakes is placing stress on the biosphere. The proportion of fish stocks (in tonnes) within biologically sustainable levels decreased from 168,413 in 2014 to 144,325 in 2015 and further to 128,645 in 2016. The coverage of protected areas in relation to marine areas was 10% in 2014. A Fisheries Management and Development Act was enacted in 2016. It provides for the conservation, management and development of fisheries and other aquatic resources and seeks to enhance the livelihoods of communities that depend on fishing. Assuring that the conservation and protection of aquatic resources receives independent and effective support is a critical task. Forest resources and Community Conservation: Over 80% of Kenya’s land area is either arid or semi-arid (ASALs) with relatively low human population densities, as opposed to the wetter and more arable 20% of the remaining land area, in which over 70% of the population lives. This more arable 20% is also the naturally forested area, and the location of major forested water catchment areas known as ‘water towers’.

Kenya: Common Country Assessment 2013-2017 86
Forests have been under pressure from expanding settlements, demand for wood products and agriculture, which have affected their extent, integrity and ecological functioning. About 12 % of the land area was originally covered by closed canopy forests. This has been reduced to 1.7% (GOK 2010).117 The Forest Act of 2005 broke from tradition and enabled the formation of community forestry associations as legitimate partners in forest management and protection. This new acceptance of the community as a legitimate interlocutor and forest management partner is not well established. Some conflicts between economic and community interests have historic roots with a human rights dimension, such as the Ogiek in the Mau forest. External support is needed to draw on global best practice in community co-management, even as Kenya seeks to regenerate forests by restricting human settlement, charcoal making and agriculture. Kenya has made significant efforts in the recent past to reduce deforestation and forest degradation. The area under both closed canopy forest and tree cover increased from 6.9 % in 2013 to 7.2 % in 2016. The Act of 2005 made the rules on excisions of forest lands more stringent. Today, the forest sector may partner with private companies, through formal competitive concessions to regenerate, manage and sustainably utilize forests. The Forest Conservation and Management Act 2016 guides the sustainable exploitation of forest resources. Realizing the potential of a sustainable exploitation strategy should be done through south-South and triangular cooperation. The Charcoal Rules of 2009 regulate the charcoal industry and enable the formation charcoal producers and transporters associations, to encourage lawful trade in charcoal and the adoption of sustainable production practices. Social and technological help to producers would assist this vulnerable group while reducing pressure on the forests. Most significantly, the 2010 Constitution requires the country to increase its forest cover to 10%. The Farm Forestry Rules under the Agriculture Act of 2009 require that 10% of farm land be set aside for the growing of trees. Both should be promoted in a consultative manner, using a human rights-based approach. The Kenya Forest Service has increased the regeneration or replanting of areas which have been clear-cut, including rehabilitation of the five major water towers, and tree planting on farms and dry lands. In addition, industrial forest plantations and commercial forest woodlots have been established. Farm and private commercial forestry and nature-based enterprises (non-wood forest products) were established to increase forest cover. The proportion of forest area in the total land area was 5.96 per cent in 2015. Government efforts to protect forests on the major water towers have resulted in increased water volumes, especially in the Rift Valley lakes, leading to increase in fish stocks particularly in Lake Naivasha. Several initiatives were undertaken to reclaim degraded land, including reclamation and water harvesting structures by sub national governments. Degraded land was reclaimed in Turkana, West Pokot and Garissa counties. Land reclamation and water harvesting are especially critical in areas of conflict, and for refugees. 7.1.2. Protected Natural Areas and Community Conservation To date, Kenya has 26 national parks and 30 national reserves (including one game sanctuary); 8% of Kenya's land is under some form of protection. In addition, there are several private game sanctuaries, primarily for the protection of the endangered Black Rhinoceros (Diceros bicornis). The Kenya Wildlife service (KWS) recognises that the survival of Kenya's protected areas depends heavily on positive attitudes of the local people; hence the stated KWS policy of sharing park revenues with the people living adjacent to parks and reserves.
117 ‘Analysis of drivers and underlying causes of forest cover change in the various forest types of Kenya’, RuriConsultants, July 2013

Kenya: Common Country Assessment 2013-2017 87
Though a top foreign exchange earner through tourism revenue, Kenyan national parks face many challenges, some apparently intractable. Pastoralists, including Somali nationals, often trespass in search of pasture for their cattle; poachers kill elephants and rhinos or hunt for zebra; villagers often hunt for antelope or other herbivores; and herbalists (including Tanzanian entrepreneurs) search for rare medicinal plants. Parks can’t deal effectively with these problems because of insufficient funding, inadequate staff and outmoded equipment. The Convention on Biological Diversity (CBD) urges measures to conserve threatened species ex-situ (off-site), to maximize a species’ chance of survival by relocating part of the population to a less threatened location. In Kenya, such facilities cater for endangered species and manage small numbers of species for posterity. The decline of the elephant population prompted Kenya to spearhead the movement for the ban on ivory trade in the Convention on International Trade in Endangered Species (CITES). However, this is a short-term measure: Kenya recognises that the long-term solution to protecting endangered species is critically dependent on establishing a sustainable community wildlife programme, which provides local communities with incentives to protect animals rather than poaching them. Wildlife conservation and management is closely linked with economic development particularly in relation to tourism. It is therefore envisaged that the government assist communities to create nature-based enterprises, to promote their livelihoods in community wildlife areas. In working with communities living with wildlife, it aims to incentivize wildlife resource conservation and management as a land use option. 7.1.3. Water and Air Pollution Water Pollution Water resources in Kenya are increasingly polluted due to agriculture, urbanization, and industry. Groundwater is contaminated through various sources, including: • Pesticides: Run off, especially from farms contaminates runoff water and soil with chemicals.
Excessive use of fertilizers causes nitrate contamination of groundwater far above recommended safety levels.
• Sewage: Untreated or inadequately treated human waste is a major source of ground and surface water pollution.
• Nutrients: Domestic waste water, agricultural run-off, and other activities increase the levels of nutrients in water bodies, causing eutrophication. Good agricultural practices reduce nitrates in the soil and water.
• Synthetic Organics: In recent years, these compounds have been showing up in the aquatic environment. This affects the whole food chain, including humans who eat seafood.
Water scarcity and quality degradation trends in Kenya over the last two decades have increased water rights conflicts for domestic, industrial and irrigation purposes. To protect Kenya's water resources from further degradation, water pollution or effluent discharge standards are necessary. Air Pollution Air quality monitoring in Kenya is practically non-existent. Kenya does not yet have an air quality management system, and any measurements of air pollution have been done on an ad hoc basis. Available data shows that the air quality in major Kenyan urban areas has deteriorated to levels that make air quality management strategies necessary. Out of 20 mainly developing country cities sampled for a UN study on air quality management capability, Nairobi’s capacity was rated as the worst (UNEP/WHO, 1996). There is no legislative or administrative framework within which air quality management could be formulated and implemented in Kenya. The Environmental Conservation and Management Act of 1999 provides a basis for development of one, but its administrative framework is still being put into place. The few relevant studies118 show that air pollution adversely affects human health and the
118 Mapping and Analysis of Air Pollution in Nairobi, Kenya; Dr. Galcano C. MULAKU and L. W. KARIUKI, Kenya
Kenya: Common Country Assessment 2013-2017 88
environment. For example, occupational asthma, silicosis and asbestosis have been reported from industrial workers in battery manufacturing, cement production and mineral processing. Bronchitis, asthma, conjunctivitis and lung cancer are on the increase in the area around the paper manufacturing plant in Webuye town. Car exhaust fumes contribute 40 per cent of the particulate matter air pollution in urban areas of Kenya. In 2015, the East African Community (EAC) implemented harmonized low Sulphur fuel standards for East Africa. As a result, the five East African member states – Burundi, Kenya, Rwanda, Tanzania and Uganda – moved as a block to low Sulphur (50 ppm) fuels as of January 2015.119 However, Kenya does not have advanced fuel efficiency standards, nor has it invested heavily in public transportation. The open burning of waste, including plastics, waste tyres, and other materials, practised both in urban and rural areas, is a significant source of toxic air pollutants. Developing countries increasingly recognize that air quality must be maintained and improved even as economic activity grows. As Kenya accelerates its development, it should look to the experiences of others in setting and implementing standards and mobilizing people in support of pollution abatement. South-South technical cooperation, including city to city, and industry to industry partnerships hold great potential. 7.1.4. Persistent Organic Pollutants (POPs) As Kenya continues to develop, production and use of chemicals is likely to be a major risk to human health and the environment unless their management is adequately addressed. Kenya is party to the Stockholm Convention, which requires the adoption and introduction of measures to reduce or eliminate releases of POPs. Kenya’s first National Implementation Plan (NIP) was submitted in 2007.120 Three types of POPs affect the Kenyan environment: a) Pesticide POPs: Most are now either restricted or banned in the country. Further effort is required to ensure the control of illegal POPs entering Kenya and to dispose of present stocks and waste, estimated at 200 tons, as well as remaining obsolete stocks in the country. Currently, over 350,000 cases of pesticide poisoning occur every year affecting 5 million workers in agriculture.121 b) Industrial POPs: Industrial POPs (chiefly from plastics, electrical and electronic waste) are imported in products and released into the environment. Since 2007 there has been an exponential rise in the amounts of Polybrominated Diphenylether (PDEs) released from computers and other electronic sources. c) Unintentionally Produced POPs (UPOPs): A total of 2872 toxic equivalents (TEQs) were released in 2012. Medical waste incineration contributed 837.1 TEQ, heat and power generation 964.1 TEQ, whereas open burning contributed 241.1TEQg/year. The NIP outlines several strategies and action plans for effective management of POPs in the country, but they are all seriously underfunded122. Public awareness is low. Kenya lacks an established national POPs monitoring programme, and most monitoring data in the country has been produced through Global Monitoring Program (GMP) activities. There is no systematic analysis of POPs residues in water and air from the national priority hot spots.
119 Actions on Air Quality: Policies & Programmes for Improving Air Quality Around the World, UNEP, 2016 120 Kenya National Implementation Plan for The Stockholm Convention on Persistent Organic Pollutants 2014-2019, Ministry of Environment, Water and
Natural Resources 121 Kenya National Profile to Assess the Chemicals Management; Ministry of Environment and Mineral Resources; February 2011 122 The total cost of the NIP is estimated at Kshs 5.8 billion, equivalent to US$670 million. It will be funded by the National Government, county
governments, bilateral programmes and the Global Environment Facility.

Kenya: Common Country Assessment 2013-2017 89
Table 15: Priority Concerns Related to Chemicals
Nature of Problem Scale of
Problem Level of Concern
Ability to Control
Problem
Availability of
Statistical Data
Specific Chemicals Creating Concerns
Priority Ranking
Air pollution National Medium Low Insufficient CO, SOx, NOx, PCDD
1
Marine pollution Regional Medium Low Insufficient Oil 2 Ground-water pollution
National Medium Low Insufficient Fluorides
Storage / disposal of obsolete pesticides
National High Low Insufficient POPs 1
Drinking water contamination
National High Low Insufficient Fluorides, arsenic, nitrates, Organics
2
Soil contamination National High Low Insufficient Pesticides, Acids 3 Hazardous waste treatment / disposal
Regional High Low Insufficient Organic and inorganic
1
Occupational health: agriculture
National High Low Insufficient Agrochemicals 5
Chemical residues in food
National Medium Low Insufficient Organic and inorganic
4
Occupation health: industrial
Regional National
Medium Low Insufficient Paints, lacquers, chromes
1
Public health High Low Insufficient Plastics 1 Pesticides accidents industrial
National Medium Low Insufficient Explosions,
fires 3
Pesticides accidents transport
National Low Low Insufficient All 2
Air pollution National Medium Low Insufficient All 1 Pesticides poisoning/ suicides
National Medium Medium Insufficient All 1
Persistent organic pollutants
National Medium Medium Insufficient All 2
Source: Kenya National Profile to Assess the Chemicals Management; Ministry of Environment and Mineral Resources; August 2011 Consultations by the Ministry of Environment with stakeholders across the country reveal that data is insufficient regarding all priority concerns, and the ability to control nearly all priority problems is low. The consultations suggested strategies including the following:
• Capacity building for the management of toxic chemicals at regional level; • Setting up of chemicals management committees at the county levels; • Effective sensitization of the population on the dangers of chemicals, especially in using
them; • Setting budgets aside for handling of chemical issues within the counties; • Having disaster preparedness mechanisms in place.
The development of data sets on key issues, advocacy campaigns on the dangers of chemicals and assistance in capacity building at county level are all areas in which external technical assistance could be provided as part of integrated programmatic efforts.

Kenya: Common Country Assessment 2013-2017 90
7.1.5. Climate Change East Africa is roughly 0.83 of a degree Celsius warmer now than it was in the 1980s; during the same period, rainfall during the primary rainy season fell by 15 percent.123 Emerging research indicates that climate change could drive down yields of staples such as rice, wheat, and maize roughly 20 percent by 2050. Worsening and widespread drought could shorten the growing season in some places by up to 40 percent. An index produced by the University of Notre Dame ranks 180 of the world’s countries based on their vulnerability to climate change impacts. New Zealand, at No. 1, is the least vulnerable; the United States is ranked No. 11. The best-ranked mainland African country is South Africa, at No. 84; Nigeria, Kenya, and Uganda rank at No. 147, No. 154, and No. 160, respectively.124 Climate change impacts are compounded by local environmental degradation driven by human activity. In Kenya, these include: increasing extent of arid and semi-arid lands; loss of crops; reduced water availability; droughts and related crop failures; spread of diseases such as malaria and cholera; population displacement and migration from climate related disaster-prone areas; and destruction of infrastructure by heavy rainfall. All affect women, the vulnerable and the poor most severely, and climate change mitigation policies must be engendered and pro-poor. Climate change is a major threat to the pastoral communities of northern Kenya and other ASAL areas. Climate change, in combination with existing political, environmental and economic development challenges, is increasingly negatively impacting food, water, health and security. Increasing temperatures and shifting precipitation patterns, combined with population growth and threats to lakes present significant, long-term challenges for the ASALs and Kenya at large. The increasing frequency and intensity of extreme climatic events and slow-onset changes increase the vulnerability of the urban and rural economies. Estimates from some studies have shown the burden of extreme climatic events could cost Kenya’s economy an annual loss of as much as 2% of GDP. Climate change mitigation policies (e.g. a carbon tax and emissions targets) could raise the costs of business for industries, especially if they are energy intensive. Economic stakeholders must be active partners in the development of climate change policy, to ensure reduced vulnerability and cost effectiveness. Climate change has begun to create cross-border impacts: combined with climate change, irrigation developments in neighbouring Ethiopia have led to a drop in the water levels of lake Turkana. These have negatively impacted the livelihoods of about 300,000 people in Turkana county, but the Kenyan government has not raised this issue with Ethiopia.125 There is need for interventions aimed to contribute to improved human security in the ASALs through improved food security, diversified livelihoods, improved health and education, and increased protection. Some programme studies126 indicate that simultaneous application of protection and empowerment programmes can greatly help the development of appropriate responses to the prevailing and emerging conditions in the ASALs. Goal 13 of the SDGs calls on countries to take urgent action to combat climate change and its impacts. Kenya has developed key policies and legislation including the Climate Change Act (2016), National Climate Change Framework Policy, National Climate Change Action Plan and National Climate Change Response Strategy.
123 How Climate change is Fueling a Food Crisis in Kenya, Uganda and Nigeria, Tim McDonnell, September 2016, citing climatologist Bradfield
Lyon of the University of Maine. 124 Notre Dame Global Adaptation Initiative: ND-GAIN Country Index 125 Human Rights Watch, Annual Report 2017 126 Final External Evaluation of “Strengthening Human Security in the Border Communities of Turkana, Kenya” Programme; International
Organization for Migration, Kenya - Nairobi Office; March 2016.
Kenya: Common Country Assessment 2013-2017 91
The Climate Change Act of 2016, if rigorously implemented, is expected to improve coordination and governance of national and local policies related to climate change. The Act calls for county governments to mainstream the implementation of the National Climate Change Action Plan and for each department and national government public entity to integrate climate change action into its plans and sectoral strategies. To effectively address the threats and risks posed by climate change, there is need to:
i. Provide an adequate knowledge base within which communities can embed practical, low cost and sustainable solutions.
ii. Harness coordinated interventions to tackle the threats and risks. iii. Grow institutions that can manage multi-dimensional, multi-sectoral and multidisciplinary
problems/issues that are associated with climate change. Priority will be given to effectively mainstream and integrate climate change measures in MTP III, county integrated development plans (CIDPs) and Sectoral plans. External support in key counties, especially in the ASALs, will enable the implementation of those priorities. 7.1.6. Biodiversity Kenya is a mega bio-diverse country with over 35,000127 species of flora and fauna (species diversity is dominated by insects and plants). Kenya has the second largest number of bird species in Africa. Kenya has 314 species of mammals; in Africa, second only to Zaire which has 409 species. This diversity is found in ecosystems ranging from marine, mountains, tropical, dry lands, forests and arid lands. In addition, there are some 467 inland-lake and wetland habitats. Species richness correlates with the annual rainfall, so wetter forests are richer in species. Consequently, Kakamega Forest has the richest plant diversity in Kenya. However, coastal forests are centres of endemism with many plant and animal species found nowhere else in the world. Most of these ecosystems are represented among protected areas. Rapid human population growth and subsequent land degradation threaten biodiversity and may cause habitat fragmentation or in extreme cases, species extinction. Climate change is also placing pressure on biodiversity. Many plant and animal species populations in Kenya have suffered, and unless urgent measures are taken to restore ecological stability, extinctions will occur. Biodiversity in Kenya also suffers indirect effects of agricultural management practices such as irrigation and drainage, soil erosion, and sedimentation. Bio-piracy and poaching are also challenges facing biodiversity in Kenya.
127 https://www.ieakenya.or.ke/downloads.php?page=ISSUE-32-2011.pdf

Kenya: Common Country Assessment 2013-2017 92
Figure 17: Kenya’s existing protected areas and possible additions
Currently only 10% of the country’s land surface is covered by protected areas, falling well short of the 17% target adopted by the Convention on Biological Diversity. To meet that target, one study has predicted biodiversity geographically from available data, and mapped additional high-biodiversity areas for potential protection.128 As shown on the map above, their results suggest that protected area expansion should concentrate mainly along the coast and in the north-east of Kenya. Managing both the existing protected areas and the proposed additional areas fully would require about 50 times more funds from global partners than Kenya has received thus far in total from the Global Environment Facility. Even the effective operation of existing protected areas urgently requires more funding to curb rampant poaching and other imminent threats. This highlights the vast practical and financial challenges ahead for conserving Kenya’s biodiversity.
128 Scherer L, Curran M, and Alvarez M: ‘Expanding Kenya’s protected areas under the Convention on Biological Diversity to maximize coverage of plant diversity’, Conservation Biology. June 2016

Kenya: Common Country Assessment 2013-2017 93
In 2016, Kenya launched a five-year strategy to integrate the conservation of genetic resources into national climate change adaptation planning and strategies. It looks to conserve key genetic resources ex-situ, to study causes and impacts of climate change and loss of biodiversity and propose necessary coping mechanisms and action plans. However, it is not adequately funded. Clearly, existing models of biodiversity protection are not fully scalable. Alternate approaches are required, and experimentation should be undertaken as part of community-based programmes in biodiversity ‘hotspots’. Such experimentation should also include mechanisms for the pricing of the sustainable use of biodiversity. Biodiversity is central to Kenya’s economic development because it provides basic goods and ecosystem services. It is also integral to key development sectors among them tourism, agriculture, livestock, forestry and fishing. Further, it supports the industrial sector through the provision of raw materials. As such, effective biodiversity conservation, proposed management measures, and practice must be broad based. 7.2. Humanitarian Crises, Natural Disasters, Migration, Resilience and Early Recovery Kenya is vulnerable to both natural hazards and man-made disasters,129 with an estimated 3 to 4 million people being affected annually.130 Their intensity, frequency and magnitude have continued to increase with significant impacts on lives and livelihoods of communities. The scale of the vulnerability and exposure to hazards and the resulting demand for humanitarian assistance is expected to continue to rise. The situation is further exacerbated by increased occurrence of extreme climate and severe weather events coupled with ecosystem degradation, livelihoods impoverishment, demographic changes and limited capacities to manage risks. The national response to disasters in Kenya has been reactive and limited to relief due to lack of risk reduction and preparedness policies, and associated legal and institutional arrangements, and inadequate investments in Disaster Risk Management (DRM) and Climate Change Adaptation (CCA). Globally it is accepted that reducing the risks of disaster is a far better way to manage disasters than ad hoc responses. Investment in reducing vulnerability is cost effective and saves lives and secures livelihoods. The Sendai Framework for Disaster Risk Reduction (2015-2030), which Kenya has committed to implement, advocates reducing exposure to hazards, lessening vulnerability, and improving preparedness for adverse events. The framework prioritizes investments in resilience through risk informed programming. Addressing long-term vulnerability and risks would create lasting impact for disaster-affected communities and is key to securing livelihoods and sustainable development. Lack of a National Disaster Risk Management Legal Framework, with a clear mandate for the establishment of a Disaster Risk Management Policy, has limited the country’s institutional arrangements, including processes and procedures, for risk identification, risk reduction, preparedness, financial protection, and resilient reconstruction.
129 These include drought, floods, land-slides, urban and forest fires, armed conflict, human and animal diseases, pest infestation,
earthquakes, infrastructure collapse and road accidents. 130 This section is drawn from: Risk Informed Programming in Kenya: UNISDR Contribution To Common Country Assessment (CCA) For UNDAF 2018-2022, October 2017

Kenya: Common Country Assessment 2013-2017 94
Figure 18: Type, frequency and location of common hazards131
131 Op. cit., UNISDR, footnote 83
432 9 2
29 21 23
90
430
302 277
137 120
221
548 525
15
0
100
200
300
400
500
600
19
97
20
02
20
03
2004
20
05
20
06
20
07
20
08
20
09
20
10
20
11
20
12
20
13
2014
20
15
20
16
20
17
Disaster recordsOTHERS, 96, 3%
FOREST FIRE, 41, 2%
LANDSLIDE, 45, 2%
RAINS, 48, 2%
DROWNING, 94, 3%
EPIDEMIC, 301, 11%
ROAD ACCIDENT, 383, 14%
FIRE, 473, 17%
DROUGHT, 569, 20%
FLOOD, 735, 26%
TOTAL: 2,785
The Sendai Framework sets out four priority areas for action in Kenya: understanding disaster risk;
strengthening disaster risk governance to manage disaster risk; investing in disaster risk reduction for
resilience and enhancing disaster preparedness for effective response; and to “Build Back Better” in
recovery, rehabilitation and reconstruction.

Kenya: Common Country Assessment 2013-2017 95
7.2.1. Natural Disasters Recurring disasters, particularly droughts and floods, significantly impact livelihoods and economic development in Kenya. Flood and drought events are becoming more frequent, with drought cycles occurring every 2-3 years instead of every 5-7 years. A severe and prolonged drought from 2008–2011 affected 3.7 million people, caused $12.1 billion in damages and losses, and totalled over $1.7 billion in recovery and reconstruction needs132. Agriculture and livestock, the sectors most heavily impacted by drought, are also the main sources of livelihood for nearly 80 per cent of Kenyans. Population growth, urbanization, and increasing demand for energy and water compound Kenya’s drought and flood risk. Results of the August 2017 Long Rains Food and Nutrition Security Assessment (LRA) by UNICEF show that approximately 3.4 million people were acutely food insecure due to the prevailing drought, an increase from 2.6 million in February 2017. The impact of drought conditions is likely to deteriorate further, exacerbated by climate change effects. Weather-induced epidemics, particularly cholera, worsen humanitarian conditions. Of the 47 counties in Kenya, 16 have been affected by cholera in 2017. 2,210 cases have been reported with 32 deaths (Case Fatality Rate of 1.4%), with most of cases reported in Nairobi County133. The rapid spread of cholera is usually attributed to unsafe water sources, poor food handling and poor case management. The Government of Kenya has taken steps to advance disaster risk management (DRM). These include:
• Vision 2030 guidelines for DRM and climate change adaptation (CCA) • A National Policy on Disaster Management, 2009 (an interim DRM strategy is in place
while the draft is pending ratification) • A National Climate Change Action Plan for 2013–2017, focusing on reducing Kenya’s
vulnerability The government’s policy is to reduce risks and advance a DRM agenda. National priorities include supporting a paradigm shift from post-disaster response to risk reduction; incorporating DRM and CCA policies across sectors and into the national and sub-national development planning process; and developing a disaster risk financing strategy. Kenya has also developed an Ending Drought Emergencies strategy which commits the government to end the worst of the sufferings caused by drought by 2022 using two main strategies: first, strengthening the basic foundations for growth and development including security, infrastructure, and human capital; second, strengthening the institutional and financing frameworks for drought risk management. This strategy builds on the National Policy for the Sustainable Development of Northern Kenya and other Arid Lands. The National Drought and Management Authority has been created to implement the strategy. 7.2.2. Migration Kenya is a multi-ethnic, multi-cultural and multi-religious country, home to one of the four largest refugee populations in Africa and some of the world’s oldest refugee camps. On-going policy developments are shaping migration management, and Kenya’s role and strategic location in East Africa highlight political evolutions that continue to structure migration systems in Kenya. Voluntary internal migration The National Council for Population and Development (NCPD 2013:206) reported four types of internal migration patterns in Kenya:
i. Rural–urban, common since colonialism: migrants are attracted to employment opportunities in the cities as well access to social services;
ii. Rural–rural: migrants search for resources (e.g. pasture) or migrate due to landlessness or population pressure at their place of origin;
132 According to GFDRR-supported post-disaster needs assessment(PDNA); https://www.gfdrr.org/kenya 133 https://reliefweb.int/.../kenya/unicef-kenya-humanitarian-situation-report-18-august-2...

Kenya: Common Country Assessment 2013-2017 96
iii. Urban–rural, also known as return migration. Many of those that return were originally resident in the rural areas and return for retirement. This is a recent phenomenon that has yet to be fully investigated;
iv. Urban–urban; usually linked to the formal sector with officials, business owners or employees transferred or relocating to another area of the country.
Table 16 below shows recent relative flows of internal migrants by region and sex, compiled from the Kenya Population and Housing Census data. Nairobi receives the highest percentage of in-migrants, most of whom are women.
Table 16: In-migrants by region and sex, 2009 Region Males (%) Females (%) National (%)
Nairobi 46 53 30.5 Central 50 50 16.5 Coast 51 49 8 Eastern 55 46 6 North Eastern 54 36 1 Nyanza 49 51 8 Rift Valley 52 48 24 Western 48 52 6
Total 100 Source : https://www.unfpa.org/sites/default/files/admin-resource/FINALPSAREPORT_0.pdf.
Rural-urban migrants face health risks if they live in informal settlements, where there are higher levels of morbidity and mortality, as well as higher levels of risky sexual behaviours and drug use. There is a link between mobility and HIV infection. The health vulnerabilities of urban migrant populations have been documented in Kenya, particularly in Eastleigh, where IOM found that most migrants have irregular migration status and are therefore deprived of basic health services due to fear or distrust of authorities and the limited availability of targeted health services. Internally displaced persons Forced migration in Kenya may be a result of conflict, natural disasters, climate change and environmental degradation, or forced evictions. In general, there is a paucity of data on internal displacements, with most of the available information focused on the post-election displacements of 2007. Data is lacking on the number of persons displaced because of climate change and environmental degradation, which particularly affects pastoralists, but anecdotal evidence suggests that pastoralists must move further from traditional grazing areas and for longer periods of time to find pasture and water for their livestock. Development and environmental protection projects have also resulted in forced evictions. The preponderance of complex humanitarian crises in Kenya result from politico-ethnic conflicts. Political unrest in Kenya has been associated with key ethnic divisions in the country, and hence with geographic variations according to ethnic affiliations. Conflict and violence leading to internal displacement have followed every recent election in Kenya (1992, 1997, 2002, 2007, 2013 and 2017), with the greatest number of displacements occurring in 2007–2008134.
134 http://publications.iom.int/system/files/pdf/migration_profile_kenya.pdf

Kenya: Common Country Assessment 2013-2017 97
In the 2007 postelection violence, about 1,300 people were killed and over 650,000 persons displaced. New instances of violence-related displacement continue to occur regularly, although on a much smaller scale. During the 2017 elections, more than 100 casualties were reported, with Nairobi reporting the highest number of casualties. Table 17 below indicates the number of IDPs countrywide in 2008.
Table 17: Number of IDPs countrywide in 2008 IDP Summary Countrywide
Region IDP Camps Total IDPs North Rift 53 72,782 South Rift 181 133,499 Nyanza 35 5,948 Western 15 15,571 Central 20 40,046 Nairobi and environs 4 4,444 Total 308 272,290
Source: Kenya Red Cross Society, 2008. In response to the internal displacement after the 2007 elections, the Government developed programmes geared at providing support to IDPs, focusing on relocation and return as the main durable solutions. However, these programmes failed to consider the possibility of local integration. Also, no mechanism was put in place to prosecute the perpetrators of the violence in that year. In 2009, the Government closed many of the IDP camps even though a significant number of IDPs still lived there without support; others were moved to transit camps. The Government initiated a cash assistance programme for post-2007 IDPs, providing 10,000 Kenyan shillings for all IDPs households, and a further payment of 25,000 Kenyan shillings to those who had lost homes, land or businesses. However, there have been widespread claims of ethnic and regional favouritism, with some getting the compensation as late as September 2017, while others have yet to receive any form of reparation. In addition, the Government purchased land for relocation. However, these land purchases were reported to be uncoordinated, without consultation of local communities and rife with corruption.135 Since 2008, only 2,287 (24%) out of a total of 9,571 households have been resettled. Other NGOs and religious organizations have been working with the Government to construct 19,521 houses for the 313,921 IDPs in different communities in Western Kenya and the Rift Valley.136 The situation of ‘unregistered IDPs’ (IDPs who did not choose to live in IDP camps), and ‘integrated IDPs’ (IDPs who settled with relatives or friends), remain unknown. While more than 650,000 people lost their homes in the violence of 2007–2008, only about 350,000 went to live in the 120 registered IDP camps. Kenya has enacted an IDP Act in 2012 but is not yet to be equipped with a comprehensive policy that would implement efficiently all aspects of the resolutions of internal displacements. The Internal Displacement Monitoring Centre (IDMC) reports there were 309,200 conflict-displaced IDPs in Kenya as of February 2015, and that 182,282 persons were internally displaced due to disasters in 2013. Between January and November 2014, 220,177 people were displaced due to inter-communal violence due to competition over land and water resources, revenge attacks, cattle rustling, and struggles over political representation.137 International Migration Kenya experiences net emigration as departures of citizens exceeds arrivals of foreigners. The estimated five-year average net migration rate from 2010 to 2015 is -0.2 migrants per 1,000 population. Labour market conditions, specifically the wage gap and the supply of labour, explain in part the net emigration rate, especially for youth.
135 Kenya Human Rights Commission, 2012 136 Government of Kenya, 2012 137 IDMC, 2015

Kenya: Common Country Assessment 2013-2017 98
The Kenyan diaspora is a major contributor to the economy of the country. The Central Bank of Kenya reports that 2014 over 1.4 billion USD was remitted through money transfers to Kenya from the diaspora abroad. This figure is low given other, informal means of remitting monies to Kenya. The main sources of these remittances were diaspora in North America (55%) and Europe (27%). Recipients of remittances use the funds mostly for food purchases, homes (including construction, rental, and renovations), education, land purchases, and health, with fewer using the money for business or investments.138 Poverty, lack of development, and lack of opportunities in rural areas are key drivers of out-migration. Migration has a significant impact in certain sectors, for example in the health sector where a sizeable portion of health professionals emigrate. Youth are more heavily affected by unemployment: as of 2009, 15.8 per cent of youth aged 15 to 19 and 13.1 per cent of youth ages 20 to 24 were unemployed, compared to the overall unemployment rate of 8.6 per cent. Youth unemployment is likely a key driver or rural–urban migration and of youth emigration. The Government of Kenya’s Youth Employment Scheme Abroad aims to match Kenyan youth to employment opportunities abroad; between 2008 and 2013, 13,535 youth went abroad for employment under this scheme. Refugees Kenya is currently the fourth refugee hosting nation in Africa and the tenth largest refugee host in the world, due largely to political and security crises in neighbouring countries. The population of refugees is 488,415 as at 31 December 2017 (see disaggregated data in Table 18 below). Kenya has signed and ratified the 1951 United Nations Convention Relating to the Status of Refugees (1951 Convention) and the 1967 United Nations Protocol Relating to the Status of Refugees (1967 Protocol). Kenya has also signed and ratified the 1969 Organization of African Unity Convention Governing Specific Aspects of Refugee Problems in Africa (OAU Convention).
Table 18: Population of refugees as of 31 December 2017
Population Planning Group: Refugee and asylum seekers of various nationalities in Kenya
Age Group
Female Male Total
in numbers
in % in numbers
in % in numbers
in %
0-4 35,506 7.27% 36,136 7.40% 71,642 14.67%
5-11 56,271 11.52% 55,129 11.29%
111,400 22.81%
12-17 47,217 9.67% 42,844 8.77% 90,061 18.44%
18-59 106,096 21.72% 97,000 19.86%
203,096 41.58%
60 and > 5917 1.21% 6299 1.29% 12,216 2.50%
Total: 251,007 51.39% 237,408 48.61%
488,415 100.00%
Major Sites: Dadaab Complex, Kakuma camp and Kalobeyei Settlement, Urban areas
Source: UNHCR Kenya Statistical Report- December 2017
138 Migration in Kenya: A Country Profile, 2015

Kenya: Common Country Assessment 2013-2017 99
The Kenya refugee situation will continue to be affected by the political and humanitarian situation in the region, mainly in its two, main refugee producing countries i.e. Somalia and South Sudan. In Somalia, despite the moderate gains made in the past two years, the humanitarian situation in 2018 is expected to remain fragile, with over 4 million people in need of humanitarian assistance. Most refugees and asylum seekers in Kenya originate from Somalia (58.2%)139. Other major nationalities are South Sudanese (22.9%), Congolese (7.3%); and Ethiopians (5.7%). Almost half of the refugees in Kenya (49%) reside in Dadaab/Alinjugur area, 38 % in Kakuma and 13 % in urban areas (mainly Nairobi). Since late 2013, following several terrorist attacks for which the Somalia-based Al Shabaab group has claimed responsibility, the security situation in Kenya has been adversely affected. Kenya sought to make return and reintegration in Somalia sustainable and to seek support for the voluntary repatriation of Somali refugees and their reintegration in Somalia. Voluntary repatriation continued in 2017 for Somalis and other nationalities, as the situation permitted in the countries of origin. In May 2016, GoK announced its plans to close the camps in the Dadaab refugee complex citing economic, security and environmental concerns. Initially, the government disbanded the Department of Refugee Affairs (DRA) which had been responsible for the registration and coordination of refugees. However, there has been no action on the part of the Kenyan Government aimed at forcibly returning refugee with the Kenyan Government taking a leading role in the implementation of the IGAD Nairobi Declaration from March 2017. Kenya also participated in the IGAD Ministerial Conference on Refugee education on 14 December 2017 in Djibouti which further re-affirmed the GOK position towards Somali refugees based on voluntariness of returns. This notwithstanding, the general decline in the levels of assistance in the camps may contribute to the refugee’s decision to return home, especially in view of the generous voluntary repatriation package that favours large families. The Government continues to discharge its refugee policy through the Refugee Affairs Secretariat (RAS) which replaced the Department of Refugee Affairs (DRA) in 2017. The Secretariat is situated in the Ministry of Interior and Coordination of National Government that is mainly responsible for internal security In line with the IGAD Nairobi Declaration, the government is drafting a National Action Plan that will be further elaborated into a national Comprehensive Refugee Response Framework (CRRF) for Kenya considering the different refugee populations the country is hosting. Preparations for this process, which will take place in a consultative manner, are ongoing. Aligned with priorities articulated in the National Development Plan and County Integrated Development Plans for Turkana and Garissa, the CRRF will build on the commitments the Government of Kenya made both at the 2016 Leaders’ Summit and in the 2017 Nairobi Declaration and its Plan of Action, for the benefit of both refugees and host communities. A Refugee Bill, containing progressive provisions, went through three readings in of 2016 and 2017 but did not receive assent from the President prior to the elections in August 2017. Awareness and advocacy efforts will have to continue with the new Parliament, which has a large proportion of first time legislators. International partners must continue to work with national authorities to ensure that refugee policy is in line with international law and statutes. UNHCR has been working on the handover to the GoK of the main protection processes. By 2020, it is envisaged that UNHCR’s role can shift from implementation to support and quality assurance, as is the case in other middle-income countries. Emergency assistance and humanitarian response Emergency and humanitarian response will continue to be provided to new arrivals from the region; mainly South Sudan, DRC, and Burundi. While the Kenyan Government has been providing asylum, refugees and asylum seekers have been dependent on the international community for protection and assistance, some of them for close to three decades. One of the key challenges in refugees
139 http://www.unhcr.org/ke/figures-at-a-glance

Kenya: Common Country Assessment 2013-2017 100
becoming more self-reliant is the lack of mobility since the government policy of encampment has been strictly implemented since 2014, limiting their access to work, markets and goods. The realization of durable solutions remains a key challenge. While over 76,000 Somali refugees have been assisted to return home since December 2014, with many more having returned on their own, there is basically no return taking place to other countries of origin including Somalia, South Sudan, DR Congo and Burundi mainly because of ongoing insecurity and political instability. There has also been a drastic reduction of resettlement opportunities outside the region, with resettlement countries maintaining small quotas and restrictive criteria on nationalities/profiles. Despite positive legal provisions on the possibility for refugees to acquire Kenya citizenship (continuous residence for seven years and marriage to nationals), refugees are not able in practice to avail themselves of this alternative. As a result, efforts need to be directed towards economic integration through enhanced access to livelihoods and job opportunities. Integration with host communities as a tool for development Turkana, Garissa and Wajir counties, which host 85% of the refugees in Kenya, are among the most marginalized and underdeveloped in Kenya, with high levels of food insecurity, high chronic malnutrition rates, high levels of poverty, poor livelihood opportunities, deficits in human capital, limited access to government provided basic social services and economic infrastructure, and weak governance. These three counties have hosted refugees for over two decades, with associated impacts on the environment, natural resources, infrastructure, economy, and service delivery. Limited access to basic services including education, health and water has resulted in high levels of illiteracy and exposure to preventable diseases, among other challenges. The areas have a degraded natural resource base and the host populations have significant dependence on the refugee camps for social services and economic opportunities. There are both positive and negative socioeconomic and environmental impacts of refugees on host communities. The devolved system of governance in Kenya has for the first time allowed the impacts to be articulated, openly assessed and considered in the County Integrated Development Plans. Positive impacts include: improved access to basic services (host communities can access health facilities, dispensaries and schools in the camps); employment opportunities for the host communities; demand by refugees and the refugee camps for host‐produced livestock and agricultural products as well as fuel wood and charcoal. Negative impacts include: degradation of the environment and diminishing natural resources because of high pressure on biomass to meet energy and construction needs; decreasing water availability evidenced by deeper boreholes and increased costs for water transport; increased distances/time/cost of collecting wood for cooking and lighting; conflicts over grazing lands and water for livestock; increased competition for basic social services such as health, education, and drinking water; and competition for limited livelihood opportunities. Without easy access to energy sources, girls and women must walk long distances looking for firewood, and are exposed to sexual and gender based violence (SGBV).140 These negative impacts are potential sources of conflict between refugees and host communities. However, hostility is mitigated by a shared culture. Most of the refugees in Dadaab are of Somali origin and share the same language, culture and religion with the local people. Socio-economic integration is being promoted through programmes for self-reliance of refugees and the promotion of a conducive environment for livelihoods opportunities, but security policies prevent integration. The new Kalobeyei integrated settlement is located near the Kalobeyei Township (about 3.5 km from Kakuma camp) in Turkana County, measuring 15 square kilometres and designed to accommodate 45,000 refugees. The new settlement is being developed as an
140 Asfaw Kumssa and John F. Jones (2014). Human Security Issues of Somali Refugees and the Host Community in Northern Kenya. Journal of
Immigrant and Refugee Issues. 12:1, pp. 27-46.

Kenya: Common Country Assessment 2013-2017 101
integrated settlement serving both refugees and host community. It will also benefit an estimated 23,600 residents, who will be able to access health, water and education services. Partnership with the county, development partners and the private sector will be key in ensuring that refugees are included in development plans and host communities benefit from assistance currently being provided to the refugee population. Stateless Persons Kenya is not a signatory to the 1954 Convention Relating to the Status of Stateless Persons or the 1961 Convention on the Reduction of Statelessness, but is party to many international and regional legislative instruments that contribute to promote the wellbeing of stateless persons, such as ICCPR, CEDAW, CRC, ACRWC, ACHPR and the Protocol to the African Charter on Human and Peoples’ Rights. At national level, Kenya promulgated a progressive Constitution (2010) with a positive Bill of Rights, and the Citizenship and Immigration Act (2011). The legislative changes provide gender equality in the conferring of citizenship by both men and women to their spouse and their children, protection for foundlings; dual nationality; restrictions related to the revocation of citizenship; entitlement of every citizen to documentation; and, most critically, the opportunity for stateless persons to apply for citizenship by registration. Sections 15 and 17 of the Kenya Citizenship and Immigration Act and its regulations provide an opportunity for stateless persons and their descendants to apply for citizenship by registration. In 2016, the legislation was extended for a period of 3 years and it is expected to expire in 2019. The operational definition in the Act however limits the eligibility for registration to persons who were in the country by 1963. Thanks to continuous advocacy, there is an increasing recognition of the need to broaden the legislation and thereby cover for persons who entered the country after 1963 and their descendants and to prevent statelessness at birth that the Constitution does not currently provide for. The Registration and Identification of Persons Bill, 2014 also provides for opportunities to advocate for specific provisions on the registration of stateless persons to facilitate future determination of their nationality, as well as to provide a legal framework for the identification and registration committees (vetting process), which currently operate in an ad-hoc fashion. The recent recognition and registration of 1,496 Makonde community members has created expectations for registration from other stateless communities including the Pemba, Shona, Galjael, Nubians, people of Congolese, Burundian and Rwandan descent, Shirazi, Waata and children of British Overseas Citizens. Stateless persons continue to face challenges such as arbitrary arrests and exposure to various forms of discrimination in their daily lives mainly because of a total lack of documentation. In practice, however, gaining citizenship is administratively difficult. While the current constitution guarantees equality in citizenship and provides that a national, whether male or female can pass citizenship though marriage,141 refugees and stateless persons married to Kenyans who fulfill the provisions of the law have been limited by tedious processes and delays in acquiring citizenship. Issues and recommendations on migration There are several outstanding policy issues that should be addressed collaboratively by the government and the international community during the MTP III period:
• Lack of a comprehensive migration governance framework, including through finalization and implementation of the Migration Policy and the National Labour Migration Policy.
• Lack of clarity on government’s responsibilities and obligations towards asylum-seekers and refugees under international law.
• There is need for the government to validate the National Action Plan to resolve issues of statelessness, enact new Registration of Persons Law and the accede to the two statelessness conventions
• Incorporation into the migration governance framework and appropriate policies and programmes of the issue of forced migration.
141 Article 15 of the Constitution

Kenya: Common Country Assessment 2013-2017 102
• Lack of explicit linkages between urban planning and migration in both policy and programming.
• Inadequate allocation of resources (by both GOK and donors) to support the development of a comprehensive migration governance framework and its full and effective implementation.
• Lack of tripartite policy (GOK, migrants, and diaspora) to realize the full potential contributions of migration to national development.
• Lack of a Migration Research Unit in the country. The government should fully implement the Kenya Citizen and Immigration Act, 2011 and specifically the provision allowing women to confer citizenship on their spouses. It should also review the Refugee Act to enable asylum seekers and refugees to enjoy the freedoms guaranteed in the Constitution including the right of non-nationals married to nationals to be registered. 7.2.3. Resilience and Early Recovery Natural hazards, political instability and violent conflicts cause human suffering, exacerbate poverty and prevent sustainable human development and equitable human growth. To improve their ability to cope and recover from such shocks, affected communities need to adopt strategies that enhance livelihoods and food security, adapt to and mitigate the effects of droughts and floods, and enable them to better rebuild and build resilience against future shocks. Kenya is vulnerable the flooding and drought, and climate change and environmental degradation have contributed to increased frequency and severity of both. As agriculture is the most important sector of employment in the country, climate change and environmental degradation is of key concern. Those who are most vulnerable to the impact of disasters and conflict live in the most underdeveloped parts of the country. Residents from environmentally vulnerable communities migrate, as both an adaptation and income diversification strategy. Pastoralists are vulnerable to climate change, and loss of livestock due to famine and drought forces some to migrate to settled communities in search of work. Those that resort to migrating further afield and for longer periods in search of pasture and water for their livestock. Rural to urban migration places additional pressures on urban infrastructures and can contribute to urban pollution. Kenya’s refugee camps are situated in environmentally fragile locations, and the presence of large refugee populations has contributed to environmental degradation such as deforestation and pollution from solid waste. The risk of disaster can be managed and reduced through systematic efforts to analyse and address its causal factors. Reducing exposure to hazards, lessening vulnerability of people and property, wise management of land and the environment, and improving preparedness and early warning for adverse events are all examples of disaster risk reduction. Disaster Risk Reduction and Recovery aims to reduce the damage caused by natural hazards like conflicts, earthquakes, floods, droughts and cyclones. In Kenya, the UN works with the Government and other stakeholders to find and facilitate implementation of sustainable solutions to minimize disaster impacts in the country. Some of the areas that the UN works with the Government and People of Kenya are as follows:
1. Developing a legal, policy and institutional framework that guides the country in Disaster Risk Reduction and Recovery
2. Mainstreaming of DRR into long term development plans at both national and county level 3. Implementation of projects that stabilize livelihoods, support recovery and build resilience
of communities impacted by disasters. 3.1. Integrating Farming into Pastoral Lives for Improved Livelihoods 3.2. Building Resilience and Early Recovery through Small Business Enterprise 3.3. Empowering the Girl Child through Education

Kenya: Common Country Assessment 2013-2017 103
3.4. Empowering Communities142 4. Helping people and communities in recovering from the effects of Post-Election Violence
The key to creating a national capacity to promote resilience and recovery lies in the strengthening of national institutions, and in building partnerships. Looking ahead, if Kenya is to cut dependence on food assistance and enhance its capacity to manage its humanitarian crises, many changes are needed, including a more prominent role for the private sector in preparedness and response. Taking greater national responsibility for humanitarian challenges will require a capacity to raise more resources domestically or through borrowing internationally; an improved transport system that allows the private sector to deliver relief items rapidly; more integrated and resilient markets in drought-prone areas; a capacity to transfer cash to crisis-affected people so that they can make use of those markets; a middle class educated on humanitarian issues and willing to contribute and hold their government to account; and a government that plans with the private and NGO sectors, taking advice on international best practice.143 7.3. Culture heritage and creative industry In Kenya, culture plays an important role in social and economic development. It nurtures and concretizes the societal fabric that holds the society together since the country is a multi-cultural society with a vast and rich cultural diversity of all forms of national and cultural expressions and indigenous knowledge systems. If well nurtured, this diversity can be a powerful tool for promoting social-economic welfare and enhancement of national cohesion for sustainable development. The sector promotes development through inter linkages with other sectors such as tourism, health, food and nutrition, transport, education, entertainment, trade, technology and innovation. At the grassroots level, the sector forms a critical social and community linkage contributing to social cohesion. This is anchored in the constitution of Kenya which recognizes culture as the foundation of the nation and as the cumulative civilization of the Kenyan people and the nation (The Constitution of Kenya 2010). The Government of Kenya, with support from the East African Community, undertook a pilot mapping study on culture and creative arts industries to establish the existing opportunities and challenges facing the culture and creative industries as well as to establish the contribution of culture and creative industries to its economy, which was completed in May 2012. Over the years, cultural goods and services in various domains have contributed significantly to the country’s Gross Domestic Product (GDP) yet documentation of this sector’s participation in the economy is very scanty and sometimes not recognized. Data gaps on culture and creative industries exist in Kenya due to inadequate collaborative efforts among the key stakeholders. The Kenya national Bureau of statistics compiles information on tourism with focus mainly on number of visitors, hotel bed and room occupancy, and museums, snake parks and historic sites. The tourism sector earned KShs. 97.9 billion in 2011 with the major attraction being in parks and cultural sites (Economic Survey, 2012). From the 2012 Culture Mapping Study, the following findings were made:
• Majority of the organizations and institutions are in the performing arts and celebrations domain while the main cultural domain activities from individuals are in Visual arts and crafts.
142 For example, due to lack of water and pasture occasioned by the hostile climatic conditions, the people of Turkana have faced starvation
leading to loss of life for both humans and animals. In such circumstances, relief food, water and medicine has been regularly supplied by multi agency support operations leading to a dependency syndrome over the years. However, through various response programmes, a number of UN agencies fund interventions that strengthen institutions responsible for recovery and disaster risk reduction work. E.g. In partnership with the government of Kenya, under the National Drought Management Authority (NDMA), UNDP have targeted some of the worst hit areas in the recent drought and also some of the most under developed. This initiative targets protection of the remaining livelihoods, assets and mitigation of the impact of continued dry conditions from a gender perspective. Several women groups were given goats as part of an initiative to restock livestock after the effects of drought that left most livestock herds seriously depleted. One such group is Koroirok women group who benefited from restocking of 20 indigenous goats and also received business management training to equip them with the necessary skills to handle finances and source for markets. 143 https://www.unocha.org/sites/unocha/files/KENYA%20case%20study%20FINAL.pdf

Kenya: Common Country Assessment 2013-2017 104
• The coverage of cultural productive economic activities for the organizations are mostly international while for the individual is mainly local.
• Main source of funding for both organizations and individuals was sales and performances • One of the major indicators in the culture and creative industry was revenue, working hours,
education and training. •
About marketing of cultural goods and services, internet access and utilization of a website is a major channel for marketing cultural goods and services. The strategies of marketing include word of mouth, newspapers/magazines. Cultural goods and services marketing coverage is worldwide and can easily expand depending on the quality of cultural products. Various studies144 show that cultural and creative arts industry has significantly contributed to the GDP and in creation of employment opportunities. Challenges affecting the creative industry include financial constraints, lack of publicity and equipment, limited market, limited human capacities and insecurity. Given the challenges identified above, there is need for the Ministry of National Heritage and Culture to: develop a register of all the organizations and individuals in the culture and creative industries and their profiles to determine effective interventions; create a platform for data in cultural and creative industries to be collected annually for use in the computation of the country’s GDP; prepare annual reports on performance of cultural and creative industries. The engagement of the international community with the cultural and creative industries is generally limited to partnerships around subject-specific campaigns and initiatives. However, culture should have a prominent role in promoting action to address the entire range of development and humanitarian issues described in this document. Building a culture of peace; promoting the attainment of the SDGs; building awareness and alliances on gender, human rights and environmental issues; popularizing the commitment of the nation to Leave No One Behind; all are well served by building development/cultural alliances around development. For this reason, and as a source of national cohesion, culture should be included as a cross-cutting enabler in the UN’s work. 7.4. Gender Equality and Women’s Empowerment Kenya has made significant advances in gender equality and women’s empowerment in the areas of poverty reduction, the right to health and access to education and women’s involvement in decision-making. These achievements can be attributed to political leadership on gender mainstreaming in the public service, based on constitutional provisions and affirmative action.145 Progress on equality and empowerment in the broader society is comparable to that of African countries with similar incomes and population. The gender inequality index (GII) of the Human Development Report reflects gender-based inequalities in three dimensions: reproductive health, empowerment, and economic activity.146 The GII can be interpreted as the loss in human development due to inequality between female and male achievements in the three GII dimensions. Kenya has a GII value of 0.565, ranking it 135 out of 159 countries in the 2015 index. In comparison, Cameroon and Tanzania (United Republic of) are ranked at 138 and 129 respectively on this index.
144 E.g. http://en.unesco.org/creativity/sites/creativity/files/activities/final_report_on_pilot_mapping_study_of_culture_and_creative_industries_in_kenya.pdf 145 UNCT, Kenya: Report on Situation of the Implementation of The Convention on The Elimination of All Forms of Discrimination Against
Women (CEDAW), February 2017 146 Reproductive health is measured by maternal mortality and adolescent birth rates; empowerment is measured by the share of
parliamentary seats held by women and attainment in secondary and higher education by each gender; and economic activity is measured by the labour market participation rate for women and men.

Kenya: Common Country Assessment 2013-2017 105
Table 19: Kenya’s GII for 2015 relative to selected countries and groups
7.4.1. Constitutional, Legal and Policy Provisions The 2010 Constitution of Kenya, under the Bill of Rights, obligates the State to address the needs of the vulnerable persons in the society with emphasis on protection of the marginalised groups in the society among them women and, persons with disability (PWDs). The Constitution in Article 27(1) enshrines legal equality for all, which has far reaching consequences for addressing the long-standing inequalities that women and girls have experienced. The constitution also created the National Gender and Equality Commission whose mandate is to promote gender equality and freedom from discrimination. There has been mixed progress in the achievement of this goal and its targets. In the past 5 years, legislation has been enacted to address the protection of women in matters related to matrimonial property, marriage and domestic violence. In that regard, Kenya has made good progress in realizing legal equality in these areas, which have long codified the pervasive discrimination and absence of rights of women that had pervaded society. However, the implementation of an overarching policy guidance on gender equality in the form of a National Gender Policy is still pending. There is an obvious gap in terms of policy coherence on gender equality across the Ministries and at county level, which this national document would help address. It would also contribute to overall coordination and improvements in effective deployment of limited financial and human resources to critical needs in Kenya. The Policy has undergone revision to incorporate constitutional provisions including Article 2(6) which spells out the country’s international obligations; align it with the country’s commitment to Africa Union Development Agenda 2063 and the Global Agenda for Sustainable Development (Agenda 2030). The policy is before cabinet awaiting approval. Another pending, foundational policy for realizing gender equality is the proposed National Equality Policy. It aims to promote equality and non-discrimination by providing equal opportunities for all; by assuring that public policy decisions further equity, inclusiveness, equality, non-discrimination and protection of the marginalized, among others.147 In the current policy gap, interpretation of these articles is open or the rights of women and other vulnerable groups are often overlooked by duty bearers. This policy is also before cabinet awaiting approval. Kenya’s accession to international gender agreements In general, Kenya has a strong record of ratifying major international and regional human rights instruments, including gender-based agreements.148 However, Kenya adheres to a dualist legal system and as such international treaties and obligations do not take immediate effect and require implementation through domestic legislation. The result is that the full implementation of many treaties providing protection from discrimination require enactment of enabling legislation. Many
147 It would also bring to life the right to equality and freedom from discrimination on any ground including race, sex, pregnancy, marital status, health status, ethnic or social origin, color, age, disability, religion, conscience, belief, culture, dress, language or birth. 148 http://www.khrc.or.ke/mobile-publications/equality-and-anti-discrimination/8-an-overview-of-international-and-domestic-law-on-discrimination-in-kenya/file.html

Kenya: Common Country Assessment 2013-2017 106
such enactments required to bring Kenya’s domestic law into line with its international obligations have been delayed. Table 20: Status of Kenya’s accession to International agreements on gender
Gender Convention/Treaty
Ratified by Kenya
When?
Policy Implications
International Covenant on Civil and Political Rights (1966)
Yes 1972
International Covenant on Economic, Social and Cultural Rights (1966)
Yes 1972 On signing the International Covenant on Economic, Social and Cultural Rights, Kenya placed a reservation against Article 10 (2) which requires that states make provision for paid maternity leave. In 2009, the UN Treaty Body Monitor re-iterated the need for Kenya to withdraw the reservation to this text.
Optional Protocol I to the International Covenant Civil and Political Rights (1976)
Yes 1972
Convention on the Elimination of all forms of Discrimination against Women (1979)
Yes 1984
Optional Protocol I to the International Covenant on Economic, Social and Cultural Rights (CESCR), (2008)
No Kenya has not signed these Optional Protocols, which recognise the competence of the Committees governing these Conventions to hear individual complaints or institute investigations into breaches.
Optional Protocol to the Convention on the Elimination of all forms of Discrimination against Women (CEDAW), (1999)
No
Kenya has adopted many key International Labour Organisation (ILO) Conventions governing discrimination in employment, including, the Equal Remuneration Convention, 1951 and the Discrimination (Employment and Occupation) Convention, 1958.
UNESCO Convention against Discrimination in Education149,1960
No
Indigenous and Tribal Peoples Convention, 1989
No
Convention on the Rights of the Child (1989) YES 1990
Yes 1990 The Education Act, 23 which governs primary and secondary educational institutions, contains no non-discrimination provisions and does not expressly prohibit discrimination. However, the Children Act (2001) contains a single broad provision prohibiting discrimination on ground of sex or other status.
Optional Protocol I to the Convention on the Rights of the Child (2000)
Yes 2002
Optional Protocol II to the Convention on the Rights of the Child (2000)
No
African Union Treaties Protocol on the Rights of Women in Africa (2005)
Signature only
2003
149 http://portal.unesco.org/la/convention.asp?KO=12949&language=E&order=alpha

Kenya: Common Country Assessment 2013-2017 107
Kenya must clarify the place of international treaties and conventions in national law. The interpretation by the Government on Article 94(5) of the Constitution is that ‘Kenya still maintains discretion150 to implement international laws through Parliament’. This appears contrary to Article 2(6) of the Constitution which states that any treaty or convention ratified by Kenya shall form part of the law of Kenya under the Constitution. Kenya should also ratify the optional protocol to CEDAW. Other measures recommended by UN mandate holders151 include adoption and implementation of the Truth Justice and Reconciliation Commission (TJRC) report. Concrete measures should also be taken to include and consider women’s perspectives in peace and security issues at national and county level including, demonstrable commitment through allocation of a budget to the implementation of the Kenya National Action Plan on UNSCR 1325 (women in peace and security) at national and county level. 7.4.2. Women and Civil Society Change requires social pressure, yet according to UN Women, there is not yet a credible and vibrant women’s movement to advocate for the realization of the gender equality gains mandated in the 2010 Constitution.152 Supporting the development of the movement should be a high priority for the UN. A robust organizing campaign to strengthen women’s groups and others is needed to promote these and other issues, through public campaigns and political pressure. Such advocacy is central to a rights-based approach to gender equality and women’s empowerment. However, there is mounting concern over recent government activities viewed as an effort to limit the operations of civil society organizations and curtail the right to freedom of association. There has been systemic crackdown through arbitrary administrative action on civil society organizations, many of whom have been strong allies speaking out against women’s rights abuses. It is of concern that The Public Benefits Organization (PBO) Act, though signed to law in January 2013 is yet to be gazette despite a Court Order that directed the Government to do so. This Act, once operationalized should provide better regulation and improve the environment for civil society organizations. 7.4.3. Implementation of Legislation Modern legislation seeks to change deeply rooted cultural practices, and the implementation of gender equality laws remains a challenge. For instance, traditional practices governing inheritance, acquisition of land and benefits accruing to land continue to favour men. The government has enacted laws to protect women’s inheritance of their father’s and or spouse’s properties including land, and the laws override customary laws and considerations. But women face barriers to accessing the justice system, including legal costs, bias in traditional justice systems, illiteracy and lack of awareness of rights. It will require significant long-term support to organized national efforts, to ensure that existing laws are applied fully and consistently in all parts of the country. The application of the laws by the judiciary, law enforcement and other duty bearers, as well as the ability of women to claim their rights as provided for under law remain areas for further development. 7.4.4. Women in Decision-making and Leadership The representation of women in various leadership and political roles is still below the 2010 Constitution’s minimum of at least one third of elective and appointive positions. There have been numerous efforts to enact enabling legislation, through strong advocacy by National Gender and Equality Commission (NGEC), women’s civil society groups, parliamentarians and the government, but Parliament has yet to enact legislation to realize the constitutional principle in Article 81(b)
150 Emphasis added. 151 UN Special Rapporteurs on freedoms of peaceful assembly and of association, Maina Kiai; on freedom of opinion and expression, David Kaye; and on the situation of human rights defenders, Michel Forst. http://www.ohchr.org/EN/NewsEvents/Pages/DisplayNews.aspx?NewsID=21172&LangID=E 152 UN Women, Kenya, at http://africa.unwomen.org/en/where-we-are/eastern-and-southern-africa/kenya, accessed 17 April 2017

Kenya: Common Country Assessment 2013-2017 108
which requires that not more than two thirds of members of elected public bodies shall be of the same gender. Through litigation and advocacy, women’s rights groups, parliamentarians and the NGEC made several attempts to resolve the impasse, and In April 2017, the Constitutional Court ordered Parliament to enact legislation in 60 days to ensure that women held at least a third of seats (as required in the Constitution), or risk dissolution. Failing to do so, any Kenyan can petition the Chief Justice of the Republic of Kenya to advise the President to dissolve Parliament. At the time of preparing this report, there is a court case challenging the fact that parliament has failed to enact this law. Over time there has been a steady improvement in the number of female members of parliament. Table 21: Number of Women in Parliament over the years
Year 1969 1974 1979 1983 1988 1992 1997 2002 2007 2013 2017 % Women 1.2 1.4 2.4 8 1.5 3.5 6 8.1 10 19.8 21 In the 11th Parliament, there were 68 women in the National Assembly, and 23 per cent of the Senate,153 both elected and nominated. This constituted 19 per cent of MPs, the lowest in the East African Community. The 2017 election has seen a slight increase to 21 per cent, still the lowest in the region. Rwanda has the highest women representation in the region, with 64 per cent; Uganda has 35 per cent; Tanzania 36 per cent; and Burundi 30 per cent. Notably, four women among the pastoralist communities won seats. Three women were elected senators: in 2013, no woman was elected (18 were nominated as part of affirmative action). Most of the female members of the national parliament and county assemblies are new to the legislatures.154 The number of women elected members of county assemblies has also increased from 84 to 96 of the total 1450.155 Until the August 2017 elections no women had held County Governor positions.156 7.4.5. Gender Mainstreaming There exist legal and policy frameworks to support the country to undertake Gender Responsive Budgeting (GRB), and to pursue gender equitable allocation of resources. These include Chapter 4 of the Constitution, the Public Financial Management Act (2012); and the Sessional Paper on Gender Equality and Development. All provide the legal and policy framework for gender mainstreaming in policy, planning and programming in general and in public financial management system. The Gender Mainstreaming Implementation Plan of Action (2008) and the Sessional Paper No. 2 of 2006 on Gender Equality and Development provide for gender-responsive macro-economic policy formulation systems. There are also guidelines in place on gender responsive budgeting as well as indicators to track gender responsive budgeting within the Public Financial Management Strategy 2013-18. Kenya has also been producing gender datasheets to guide policy formulation and planning. Status of Women Report provides information on the status of women across various sectors. Further, the Government is undertaking capacity building on gender statistics for statistical officers, planning officers and gender officers both at national and sub national levels to enhance collection, collation and analysis of sex disaggregated data.
153 Lily Kuo, Kenya’s high court has ruled that a third of parliamentarians must be women, Quartz, 13 April 2017, at
https://qz.com/957712/kenyas-high-court-has-ruled-that-a-third-of-parliamentarians-must-be-women/ 154 UN Women, Kenya, at http://africa.unwomen.org/en/where-we-are/eastern-and-southern-africa/kenya, accessed 17 April 2017 155 https://www.capitalfm.co.ke/eblog/2017/03/15/celebrating-kenyas-strides-towards-gender-inclusivity/ At the county level 50 per cent of all
Members of County Assemblies are women due to nominated members. 156 Daniel Wesangula, Breakthrough as Kenya poised to elect first female governors, Reuters, 28 April 2017, at http://www.reuters.com/article/us-kenya-politics-women-idUSKBN17U2GP
Kenya: Common Country Assessment 2013-2017 109
Tracking of Budgetary allocation towards women empowerment endeavours, including women enterprise, is also being undertaken. The realization of gender mainstreaming in policy, planning and programming will require a sustained series of efforts, at both national and county levels. Support to these efforts should be a mandatory component of UN assistance to all public institutions. 7.4.6. Women and Economic Equality Working women face challenges, due to their marginal positions, and susceptibility to the economy’s vulnerability to shocks. While over 80 per cent of Kenyan women are engaged in smallholder farming, only 1 per cent own land. Women access less than 10 per cent of available credit, and less than 1 per cent of agricultural credit.157 As a result, poverty has a predominantly female face. Kenya has in place affirmative action funds which specifically target women and other vulnerable groups, addressing the issue of access to credit for small businesses, but their scope and impact thus far are limited. The Government is also implementing various affirmative action programmes for empowerment of women, Youth and PWDs. These include: Women Enterprise Fund (WEF), UWEZO Fund, National Government Affirmative Action Fund and the Youth Enterprise Fund. A total of 49,571 women groups composed of 630,546 individuals received loans amounting to KShs 6.3 billion through WEF and 213,636 women trained on basic accounting, business skills and formation of cooperatives. Another affirmative programme geared towards achievement of gender equity is Access to Government Procurement Opportunities (AGPO), which reserves 30% of all public procurement at both the national and county governments to women, youth and persons with disabilities. 7.4.7. Gender Based Violence Endemic gender-based violence (GBV), including sexual violence, rape, physical violence and sexual harassment remains an area of significant concern in Kenya. Historically, both women and children have borne the brunt of cultural ideas and practices that perpetuate sexual and gender-based violence. Kenya has expanded the definition of GBV to include a range of acts of violence committed against females because they are females and against males because they are males. About 45 per cent of women between the ages of 15 and 49 have experienced physical or sexual violence158. In the 2014 Demographic and Health Survey, 14 per cent of women and 6 per cent of men aged 15-49 reported having experienced sexual violence at least once in their lifetimes. While the Government has developed and adopted policies, enacted laws, developed and implemented educational programmes to combat gender-based violence, response is constrained by the lack of human capacity for prevention and protection, entrenched religious and cultural beliefs that perpetuate negative stereotypes, discrimination and gender inequality, and socio-cultural norms around gender and masculinity. Although Kenya has a Gender Based Violence (GBV) Helpline that affords quick access to GBV services, many survivors have limited access to appropriate services. For this reason and many others, incidences of gender-based violence – against both men and women – remain massively under-reported. According to the Access to Justice Report conducted by UN Women in 2015, 72.6 percent of survivors were unwilling to pursue justice; while only 5% of the survivors seen in facilities in 2014 were willing to go to court owing to insensitivity of law enforcers. This is partly because the victim protection system is weak and worsened by high levels of legal illiteracy in the country, especially among GBV survivors. There has been progress in this area with the enactment of four key family laws - Protection against Domestic Violence Act (2015), Marriage Act (2014), Matrimonial Properties Act (2013), and the Sexual Offences Act (2006).
157 UN Women, Kenya, at http://africa.unwomen.org/en/where-we-are/eastern-and-southern-africa/kenya, accessed 17 April 2017 158 https://www.usaid.gov/kenya/gender-equality-and...kenya/gender-based-violence

Kenya: Common Country Assessment 2013-2017 110
The National Policy for the Prevention and Response to GBV was adopted in 2014 and offers a much-needed basis for a multi-sectoral and coordinated response to GBV. Other laws such as the Sexual Offences Act (2006) are under review. Many challenges however remain before these Acts can be fully implemented. In many instances, the accompanying guidelines and regulations have yet to be developed or there have been delays in doing so, slowing their application by duty bearers. Enforcement is further hampered by limited allocation of resources to key duty bearers including the police, prosecutors, health care workers, judiciary and prisons. The reality is also that a large proportion of services for GBV survivors in some parts of Kenya depend on non-state actors who rely mostly on funding from development partners with little investment by county or national governments. With reductions in funding for women’s rights globally and in Kenya, and the threat that the Public Benefits Organization Act of 2013 poses to the space for NGO operations, many of these services are in jeopardy of shutting down or have already closed. Mechanisms to address practical issues that hamper implementation are still not fully in place or well known by women and girls who require them. Implementation frameworks for the operationalization of the Protection against Domestic Violence Act (2015), Marriage Act (2014) and the Matrimonial Properties Act (2013) need to be put in place. The Sexual Offences Act requires review, to balance pragmatic responses to young male sexual offenders with the rights of survivors of sexual violence. This review should also address the reality of consensual relationships between adolescent boys and girls and clearly distinguish them from acts of sexual violence by minors towards other minors. And most critically, resources must be allocated from county and national budgets for the prevention and response to GBV country-wide. The government developed a National Policy for Prevention and Response to Gender Based Violence (GBV) in 2014 which guides implementation of GBV activities in the country. The country in 2017 launched a Joint Programme on the Prevention and Response to GBV together with the UN. Further steps advocated by the UN include:
1. Adopt regulations for victim compensation to ensure GBV victims receive adequate compensation.
2. Adopt measures that will ensure women victims of GBV can enrol in the witness protection agency.
3. Adopt a reparations framework and ensure prioritization of women victims of SGBV. 4. The State to provide update on the status of Gender Desks in police stations and measures
towards improvement of management of GBV cases. 5. Strengthen the ongoing efforts in implementation of counter trafficking in persons Act of
2010. Table 22: GBV Statistics; Kenya Domestic Household Survey (KDHS) 2014 Category Nature of violence Number of victims Proportion (%) affected Women aged 15-49 physical violence 38% Women aged 15-49 Sexual violence 14% Girls aged between 12-17 GBV Survivors 41% Women aged 18-49 GBV Survivors 32% Girls below 11 years GBV survivors 24 Girls living with disabilities
GBV 1%
women over 50 years GBV 3% All Defilement 3,596 All Rape 913 All Incest 242 All Sodomy 124 Geographical Distribution of GBV
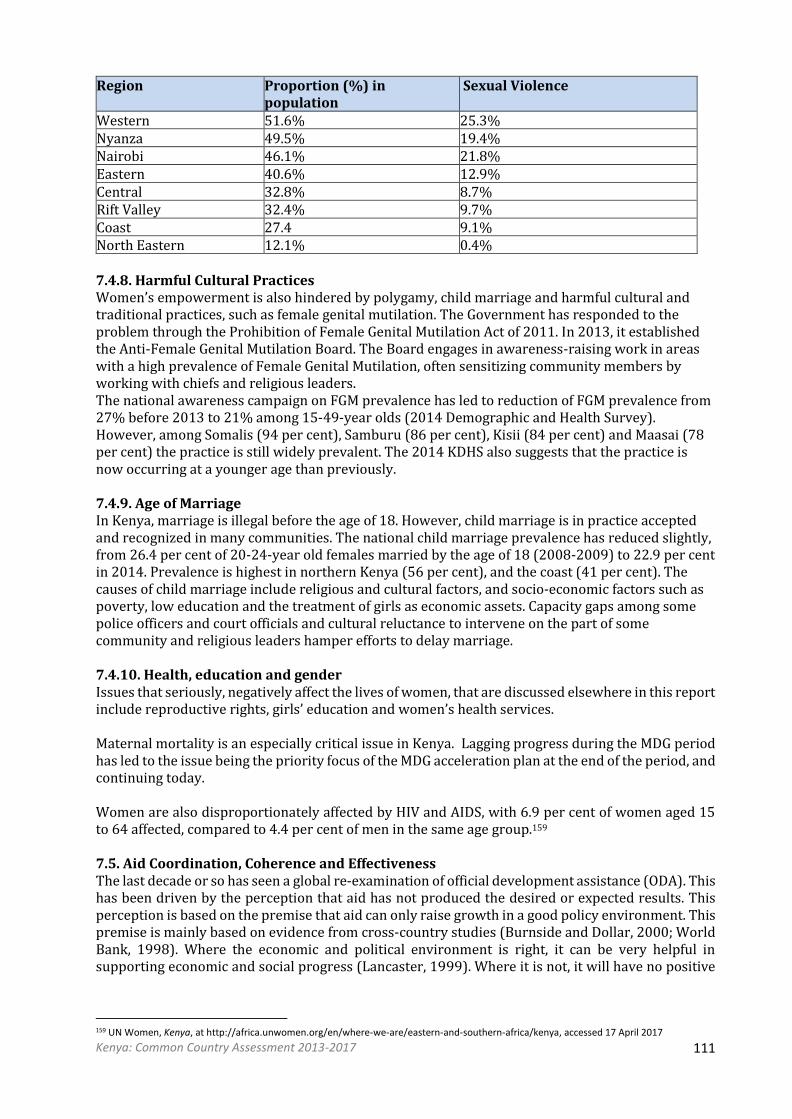
Kenya: Common Country Assessment 2013-2017 111
Region Proportion (%) in population
Sexual Violence
Western 51.6% 25.3% Nyanza 49.5% 19.4% Nairobi 46.1% 21.8% Eastern 40.6% 12.9% Central 32.8% 8.7% Rift Valley 32.4% 9.7% Coast 27.4 9.1% North Eastern 12.1% 0.4% 7.4.8. Harmful Cultural Practices Women’s empowerment is also hindered by polygamy, child marriage and harmful cultural and traditional practices, such as female genital mutilation. The Government has responded to the problem through the Prohibition of Female Genital Mutilation Act of 2011. In 2013, it established the Anti-Female Genital Mutilation Board. The Board engages in awareness-raising work in areas with a high prevalence of Female Genital Mutilation, often sensitizing community members by working with chiefs and religious leaders. The national awareness campaign on FGM prevalence has led to reduction of FGM prevalence from 27% before 2013 to 21% among 15-49-year olds (2014 Demographic and Health Survey). However, among Somalis (94 per cent), Samburu (86 per cent), Kisii (84 per cent) and Maasai (78 per cent) the practice is still widely prevalent. The 2014 KDHS also suggests that the practice is now occurring at a younger age than previously. 7.4.9. Age of Marriage In Kenya, marriage is illegal before the age of 18. However, child marriage is in practice accepted and recognized in many communities. The national child marriage prevalence has reduced slightly, from 26.4 per cent of 20-24-year old females married by the age of 18 (2008-2009) to 22.9 per cent in 2014. Prevalence is highest in northern Kenya (56 per cent), and the coast (41 per cent). The causes of child marriage include religious and cultural factors, and socio-economic factors such as poverty, low education and the treatment of girls as economic assets. Capacity gaps among some police officers and court officials and cultural reluctance to intervene on the part of some community and religious leaders hamper efforts to delay marriage. 7.4.10. Health, education and gender Issues that seriously, negatively affect the lives of women, that are discussed elsewhere in this report include reproductive rights, girls’ education and women’s health services. Maternal mortality is an especially critical issue in Kenya. Lagging progress during the MDG period has led to the issue being the priority focus of the MDG acceleration plan at the end of the period, and continuing today. Women are also disproportionately affected by HIV and AIDS, with 6.9 per cent of women aged 15 to 64 affected, compared to 4.4 per cent of men in the same age group.159 7.5. Aid Coordination, Coherence and Effectiveness The last decade or so has seen a global re-examination of official development assistance (ODA). This has been driven by the perception that aid has not produced the desired or expected results. This perception is based on the premise that aid can only raise growth in a good policy environment. This premise is mainly based on evidence from cross-country studies (Burnside and Dollar, 2000; World Bank, 1998). Where the economic and political environment is right, it can be very helpful in supporting economic and social progress (Lancaster, 1999). Where it is not, it will have no positive
159 UN Women, Kenya, at http://africa.unwomen.org/en/where-we-are/eastern-and-southern-africa/kenya, accessed 17 April 2017

Kenya: Common Country Assessment 2013-2017 112
effect and will be wasted at best. At worst, it can set development back through the potential negative economic and political impacts it may have. From the recipient side, corruption is often given as an explanation of performance disappointment160. This has led to increased attention to a series of problems in political and economic institutions, and even in public policies. These include political and social accountability, integrity of administrative systems and decisions, and the quality and equity of delivery of public services. Combating corruption and lack of accountability and reforming the political culture, systems and structures in which corruption flourishes has proven a difficult task, with no simple, technocratic answers. The Human Rights Based Approach (HRBA) has been promoted by the UN and others as a paradigmatic shift capable of mobilizing both those in the institutions (‘duty bearers’) and those in the public to whom a duty is owed (‘rights holder”) to focus on the better realization of civil and political and economic and social rights. However, in practice the UN and others who work as partners of government find it much easier to build capacity of duty bearers than to support the capacity and mobilization of rights holders. This has led to programming that creates institutional capacities for better public performance without a major impact on performance problems and corruption. Greater attention to advocacy and support for rights holders in key thematic areas is a pressing, first order requirement. Development partners often impose reform and other conditionality’s on their programmes. Each also has their specific priorities and interests, including those related to politics, strategy, trade, culture and ideology. This fragmented approach burdens the GoK with a variety of different initiatives, each with their own requirements, and dilutes the impact of efforts to cohere around core values and goals. Fortunately, the Vision 2030 agenda and the SDGs provide a common framework for the GoK and the donor community, through which greater cohesion around core values and goals can be built. The UN has a central role to play in guiding these coordination processes. To do so, it must build further on its own preliminary efforts toward Delivering as One (DaO), including through cohesion of the UNCT around common advocacy and joint programming. Generally, there are three factors that influence the effectiveness of foreign aid in Kenya: (i) aid volatility; (ii) aid fragmentation; and (iii) aid coordination and harmonization. 7.5.1. Volatility of aid in Kenya Foreign aid to Kenya has been highly volatile. Based on OECD-DAC data, volatility of overall aid (at current prices) was 24.1 per cent compared to 17.2 per cent for Africa and 13.9 per cent for all developing countries during 1980- 2006. ODA in real terms was less volatile, at 20.3 per cent. During 2000-6, the volatility of ODA reported by the DAC was 39.8 per cent. The most stable component of DAC-ODA during this period was technical assistance and country-programmable aid (CPA), a pattern observed when a longer time is considered. Except for CPA, ODA was more stable over 2000-06. Only about 60 per cent of both committed CPA and net ODA were disbursed in 1980-06. The data show an increase in the disbursement ratio, from 5.2 per cent in the 1980s, 34.9 per cent in the 1990s to 51.1 per cent in 2000-06 for DAC-ODA. While a similar pattern obtains for technical cooperation over 2000-06 (51 per cent), the other CPA components were substantially or over-disbursed, with a share of 97 per cent for emergency and food aid, 142 per cent for debt forgiveness, 210 per cent for administrative costs, and 610 per cent for ODA support for NGOs.
160 World Bank 1998; Assessing Aid: What Works and What Doesn't and Why; New York: Oxford University Press.

Kenya: Common Country Assessment 2013-2017 113
One reaction to aid volatility and a decline in aid since the late 1990s has been a reluctance by the government to factor in programme aid in the budget. The government has in the recent past excluded donor budgetary support from its annual budget strategy and enhanced measures for local resource mobilization. Consequently, the country has substantially reduced aid-dependence, with government revenues having increased dramatically after the December 2002 elections. 7.5.2. Aid fragmentation There is considerable aid fragmentation in Kenya; much higher than across Africa and in developing countries in general. Fragmentation, measured by Hirschmann-Herfindahl Index, stood at 0.1 compared to 0.3 for all developing countries and 0.22 for Sub-Saharan Africa in 2006. The average index increased from 0.12 in 1980s to 0.18 in the 1990s (hence resulting in reduced fragmentation), before declining to 0.13 in 2000-06 (increasing fragmentation to about its former level). The number of bilateral and multilateral donors listed in the OECD-DAC database increased from an average of 17 in the 1980s to 19 in the 1990s and to 27 over 2000-06. The number of donors and NGOs is much higher than this, which poses a big challenge to aid coordination. There has been a multiplication of projects, resulting partly from an increase in the number of donors and partly from an increase in the number projects supported by individual donors. Projects have multiplied more rapidly than donors. There was also a large increase in the number of project implementation agencies from 7 in 2000 to 40 in 2005. The proliferation of donors and projects had all the expected effects: multiple meetings involving high-level officials, high levels of administrative efforts, pressures on financial and administrative systems, and so on. As the UN attempts to partner with others to achieve Leave No One Behind, working across many subjects at national and county level, it will find this complexity daunting. More intensive internal cohesion through Delivering as One, and national and county aid coordination systems will prove invaluable. The lessons of the Turkana Flagship programme will be invaluable. The use of UNVs to support county level coordination, developed (under different circumstances) in South Sudan may also be helpful. 7.5.3. Aid coordination Aid coordination in Kenya between the Kenya government and donors began with a World Bank organized Consultative Group (CG) in the early 1970s (O’Brien and Ryan, 2001). This group met regularly throughout the 1970s, 80s and 90s, normally once every two years, with the last held in 1996. With the slowing down of Kenya’s reforms, there were no further formal CG meetings until 2003. A direct outcome of the 2003 Consultative Group meeting was the establishment of the Harmonization, Alignment, and Coordination Group (HAC). The HAC Group has become the main donor force for coordination and alignment. In addition to HAC, the Donor Coordination Group (DCG) was revived after the 2003 CG meeting and it continues to meet with the government regularly to ensure that their financing is closely aligned with the government’s sector strategies, including through sector-wide approaches. The DCG consists of donor and UN agencies in Nairobi and is co-chaired by the World Bank and UNDP. The commitment of government and donors to making aid effectiveness a high priority was formalized in the Partnership Principles signed in 2007 in the context of the Kenya Joint Assistance Strategy (KJAS), and the Kenya External Resources Policy, also promulgated in 2007. KJAS brings together 17 donors in the interest of coordination among themselves and harmonization of their programmes with those of the government. The government has called for donors to increasingly move towards budget support; to release budget support through a combination of fixed tranches and variable tranches; to avoid political conditionality’s and to rationalize other conditionality’s; and to support the government’s efforts to create capacity.

Kenya: Common Country Assessment 2013-2017 114
The donors have agreed to work towards harmonizing and simplifying their systems, processes, and procedures; to work towards sector-wide approaches; to overcome obstacles to quicker disbursement of already-committed funds and to making their assistance more predictable. Some donors also look to adopt a joint multi-annual programming approach. The UN in its turn has committed to simplification and harmonization, and to more aligned, multi-year and joint assistance, as a ‘Delivering as One’ UN Country Team. However, progress toward these goals remains limited. Kenya’s sectoral working groups (SWGs) play a key role in the overall coordination structure, and in the MTP III period, the UN should use its role as champion of the SDGs to encourage greater coherence around those groups. 7.5.4. Declining Aid Flows Countries in Sub-Saharan Africa, including Kenya, continue to benefit from substantial external development assistance flows. However, while global aid once again reached record levels in 2016, this pattern has been called into question recently due to political and economic pressures on traditional donor countries and emergence of competing priorities, chiefly the unprecedented scale of the humanitarian response to global crises. The African Union has called for Shared Responsibility and Global Solidarity through its related Road Map, urging countries to diversify, and adopted balanced and sustainable financing models. Table 23: Top 10 ODA recipients in Africa-USD million (from all donors, net ODA receipts)161
Rank & country 2013 2014 2015 3-year
average
% of recipient
s
1 Egypt 5 513 3 538 2 488 3 846 7%
2 Ethiopia 3 886 3 585 3 234 3 568 7%
3 Tanzania 3 434 2 649 2 580 2 888 5%
4 Kenya 3 308 2 661 2 474 2 814 5%
5 Democratic Republic of the Congo 2 584 2 400 2 599 2 528 5%
6 Nigeria 2 516 2 479 2 432 2 475 5%
7 Mozambique 2 313 2 106 1 815 2 078 4%
8 Morocco 2 009 2 240 1 369 1 873 3%
9 South Sudan 1 399 1 964 1 675 1 679 3%
10 Uganda 1 700 1 635 1 628 1 654 3%
Other recipients 28 146
29 043
28 742 28 643 53%
Total ODA recipients 56 806
54 299
51 036 54 047 100%
Kenya, recently graduated to ‘lower middle-income’ status, is set to experience significant declines in external aid flows. Since the country’s recommitment to reforms in the early 2000s, aid had more than tripled from the levels of previous decades, reaching an all-time high in 2013. While it remains fourth in Africa in terms of net aid flows, aid has been declining since then, a trend likely to continue. At the same time, the national economy remains vulnerable to domestic risks that affect the country’s growth prospects.
161 OECD/DAC, Aid Statistics at a Glance to Africa, 2017

Kenya: Common Country Assessment 2013-2017 115
In view of the above, the government of Kenya has taken a 100$ m facility to implement the Development Response to Displacement Impacts Project(DRDIP) which aims to improve access to basic social service, expand economic opportunities and enhance environmental management for communities hosting refugees in Turkana, Garissa and Wajir counties. The total cost of the project is $103 million financed by an International Development Agency (IDA) credit of $100 to Kenya and an IDA Grant of $3 million to the Intergovernmental Development Authority (IGAD). Kenya is also in the process of negotiating a Grant under the IDA18 sub-window from the World Bank. The purpose of the sub-window is to provide resources on more favourable terms to countries hosting refugees for medium- to long-term investments that will benefit both refugees and host communities. The sub-widow focuses on
• Mitigating the shocks caused by an influx of refugees and creating social and economic opportunities for refugees and host communities
• Facilitating sustainable solutions to refugee situations • Strengthening preparedness for increased or potential new refugee flows
This shifting financing architecture requires countries to identify alternative financing arrangements as well as improve technical and allocative efficiency. At the global and national level, guidance on resource optimization has been provided through the Paris Declaration on Aid Effectiveness, which emphasizes the need for alignment and harmonization of external support to national priorities and calls for high impact investments to make the money work. The UN has a central role to play in assisting Kenya and its development partners to maximize aid flows and their effectiveness, by promoting collaboration in achieving high-impact results, around common global and national goals and principles. These include the SDGs and Kenya Vision 3030 and MTP III, and the principles of: gender, women’s empowerment and human rights; leave no one behind; and accountability. With its convening power, the generation of compelling data on the nature, scope and location of exclusion and vulnerability, and through concerted and compelling advocacy, the UN can mobilize national and international actors in new partnerships around rights-based approaches to solve key problems. 7.6. The Sustainable Development Goals and the Principle of ‘Leave No One Behind’ The principle of ‘Leave No One Behind’ and the Sustainable Development Goals (SDGs) of Agenda 2030 for Sustainable Development, are based on an understanding that issues of poverty, inequality, unsustainable-consumption patterns, environmental degradation, corruption, and increasing conflicts are all interlinked. 7.6.1. The Sustainable Development Goals Kenya participated in the development of the SDGs at national, regional and global levels including during the adoption of the SDGs Agenda. Since its adoption, the Government of Kenya, non-state actors and development partners have committed to the implementation, monitoring and evaluation of the Agenda. Kenya has aligned its Vision 2030 and the 2010 Constitution to the SDG’s. The 2010 Constitution’s provisions for devolved government serve as a mechanism to deepen accountability and improve public services. These development frameworks and institutional arrangements position Kenya to better implement the SDGs. The MTP III includes alignment of interventions aimed at meeting the SDG targets. The Cabinet agreed to mainstream the 17 SDGs by Ministries/Counties/Departments and Agencies (MCDAs) in their policy, planning, programmes and budgeting. MCDAs will be expected to report on the 128 relevant monitoring indicators identified by Kenya National Bureau of Statistics (KNBS) out of the 230 SDG Global Monitoring Indicators. The MTP III outlines four priorities for Kenya’s transformation that will be central to Kenya’s achievement of the SDGs: increasing manufacturing contribution to GDP from 9.2 % in 2016 to 20%

Kenya: Common Country Assessment 2013-2017 116
by 2023; increasing agricultural productivity through value chain development to promote food security and processed agricultural exports; providing affordable housing; and achievement of 100% universal health coverage. The achievement of these four priority goals of the MTP III will require the country to address a range of first order challenges faced by Kenya. Overcoming these challenges is essential, and will be difficult to achieve. Reversing the long-term stagnation of the manufacturing sector and achieving the dramatic growth targeted will require the creation of an enabling business environment, including policy changes facilitating access to land and credit. It will also require the mobilization of large flows of new investment capital, and the easing of trade barriers. Productivity will need to be significantly enhanced, and large numbers of new skilled workers made available, implying a major improvement in both basic education and skills training relevant to modern industry. And, a more reliable electricity supply will be essential, especially in the counties, where incentives seek to promote business. Increasing agricultural productivity will also require changes in land and credit policy, in this case aimed chiefly at assisting female smallholders. Both modern sector and smallholder agriculture require large scale investment in irrigation, and improved support service. Infrastructure and social services will need to be extended to remote and marginalized areas. In the ASALs, and elsewhere, capacity development of the counties, citizen participation systems, rights-based initiatives and peace-building will all be needed to assure stability and that development is people-centered. Affordable housing will require new approaches, likely self-help housing schemes and sites and services programmes, to overcome the financial and bureaucratic constraints of the current model of government-led construction. Policy changes and improvements in low-cost materials supply and credit will be essential. The achievement of universal health coverage almost within reach, but will be a challenge. Devolved systems must be brought to full capacity. Health services must be brought to remote areas through investment in infrastructure and incentive for staffing in such location. And most importantly, the problems of health care financing must be resolved: these include the cost of universal ARV treatments for HIV/AIDS in an era of declining external assistance; the funding of free, universal health care; and the expansion of health insurance and social protection programmes. An SDG Roadmap (2016-2018) has been developed and the government has publicly launched the national SDG campaign. With UN support, it has prepared a voluntary national report, using 128 national SDG indicators. It has also adopted SDG Mainstreaming, Acceleration and Policy Support (MAPS), thereby establishing a platform for localization and implementation. The implementation Framework for the MTP III aligns it with the SDGs through:
• A draft national planning, monitoring and evaluation (M&E) policy that will provide a framework for an ICT based M&E system to monitor implementation of programmes and projects at national and county level.
• Alignment of MTP III to county governments integrated plans, county spatial plans, and ministries, departments and agencies (MDAs) strategic plans and linking them to a results-based framework through performance contracts.
• The commitment of one per cent of the development budget to M&E. Kenya will also be outlining strategies to increase domestic savings and investment (including FDI) including adopting the new framework for financing development and SDGs which rely on an interdependent mix of financial resources, technology and capacity building initiatives and other innovative means of implementation.

Kenya: Common Country Assessment 2013-2017 117
7.6.2. Leave No One Behind The principle of ‘Leave No One Behind’ is central to the Sustainable Development Goals (SDGs) of Agenda 2030 for Sustainable Development: they include goals on inequalities, peace, decent work, justice and transparency, while also vowing to end violence against women and girls, human trafficking and dangerous climate change. They are based on an understanding that issues of poverty, inequality, unsustainable consumption patterns, environmental degradation, corruption and increasing conflicts are all interlinked. Many targets of the SDGs provide concrete objectives in direct relation with the aim of LNOB; many targets also point to specific means through which it can be achieved – providing concrete illustrations of how to ensure that no one is left behind.162 At the national level, many targets explicitly aim at ‘leaving no one behind’. Many targets aim to reduce inequalities of outcome. This includes: ensuring universal and equal access to basic services; ensuring access to food for all, and end malnutrition; achieving and sustaining income growth of the bottom 40 per cent of the population at a rate higher than the national average; and doubling agricultural productivity of small-scale food producers. Targets that detail measures in support of these objectives include: putting in place social protection systems and policies; building the resilience of the poor and vulnerable; access to employment; and expanding infrastructure with a focus on affordable and equitable access for all. Agriculture, health, and water and sanitation are critical to the SDGs agenda, and have been devolved to the County Governments, which therefore also have a key role to play. The range of targets, and the division of responsibilities among multiple nationa l authorities and county governments makes the identification of those who are being left behind a complex task. Many sources of data exist, but they tend to be subject-matter and location specific. There are major gaps, for instance in gender data, and there is no comprehensive analysis of multiple vulnerabilities and other indicators of exclusion. At the core of the task of identifying and responding to those who are being left behind, is the need for an alliance of government, academia, donors and civil society, with UN support, to develop comprehensive data sets that can guide evidence-based programming, implementation monitoring and evaluation. It is also critical that decisions on priorities in addressing the needs of those left behind are based on a comprehensive strategy. Such a strategy must not only identify inequalities, but apply agreed criteria for choosing geographic and sectoral priorities. For instance, while poverty may be most dire in certain ASAL counties, the largest numbers of the poor are found in certain urban informal settlements. The data regarding inequality in Kenya illustrates this challenge. The LNOB road map under implementation envisages work under 5 thematic areas which are: to conduct extensive advocacy and awareness creation, to map out and engage all stakeholders, mainstream the SDGs into National Development Process, domesticate and localize the SDGs agenda, Monitor and evaluate progress and support capacity building for devolved governments to implement the process. Kenya is better experienced, more organized and better resourced than in the previous MDGs era and now has institutional arrangements, plans and programs to undertake such a strategy.
162 World Social Science Report 2016

Kenya: Common Country Assessment 2013-2017 118
Table 24: Groups left behind Groups left behind How they are left behind Causes for being left behind
Women
Gender discrimination and Inequalities throughout all spheres of life, including: More limited access to education The ‘gender gap’ in pay Poor maternal health Agriculturists without land ownership or credit Violence and harmful cultural practices
Traditional, culturally-based discrimination, women’s movement not strong Cultural preference for boys’ education Historic exclusion from formal employment Maternal health a lagging priority Agricultural land traditionally the property of the husband, and credit based on title Weak civil society and political leverage of women: women not organised to educate and campaign
People living in extreme poverty
Multiple vulnerabilities in income, nutrition, health, education, social participation
Political and social exclusion and inequality Informal settlements and remote rural areas lack schools and clinics Limited social protection Lack of opportunity for entrepreneurship
People living with disabilities especially young children
Exclusion from education for most Lack of livelihoods support Lack of services
Limited special education and social protection Lack of data for policy-based response
Widows Often denied property rights Traditional systems of title exclude widows
Elderly people, many taking care of orphans
Small universal pension for over-75 only introduced in 2018 Many impoverished due to HIV/AIDS in family
Traditional support by family and community breaking down Lack of strong social protection system HIV/AIDS death or disability of working age children
People living with HIV & AIDS (PLHIV)
A socially stigmatized population Not all receiving anti-retro-viral drugs
Uninformed fear of the disease Financial and logistical constraints
Disfavoured groups of PLHIV: Intravenous drug users, men who have sex with men and sex workers
Lack of access to supportive services Hard to reach
Disfavoured conduct is illegal Weak civil society
LGBTQ persons Conduct is criminal Denied equality, socially stigmatized
Cultural rejection of non-gender stereotypical behaviours
Street families Lack access to basic needs Not a political priority for social protection No strong civil society support constituency
Orphans, Often mistreated and denied basic needs
Weakening of traditional extended family Limited social protection

Kenya: Common Country Assessment 2013-2017 119
Groups left behind How they are left behind Causes for being left behind
Illiterate people, Low employability Disregarded in citizen participation
Poor access to and quality of basic education Lack of remedial adult education
Pastoralists Neglected and often seen as a menace
Culturally distinct and traditionally excluded from modern political sphere Movements of livestock from necessity be aggression
People living in marginalised areas
Lack of access of basic amenities Lack of infrastructure Weak political voice
Indigenous groups Lack of recognition Conflicts over resources No strong civil society support constituency
Youth Unemployment and underemployment
Limited opportunities for formal sector employment Poor educational preparation for work Limited youth enterprise schemes Limited TVET for skills development
Children Large numbers suffer from poor nutrition, limited access to quality education, and high levels of violence
Food insecurity Limited access to quality education Limited social protection Lack of strong social consensus against violence
Refugees and asylum seekers
Lack of freedom of movement, cannot access formal employment, limited access to education and skills training, livelihoods
Concerns regarding violent extremism; socio-economic exclusion; lack of progressive refugee law
Stateless persons Lack of access to identification documents, cannot work or access all public services; limited access to education and livelihoods
Lack of legislation or recognition of stateless persons
Because of the Country level dialogues, communities have developed their own action plans for implementation. They include action by participants, local government and development partners. Negotiations are ongoing on replicating the dialogue process in the remaining 42 counties. From these LNB Dialogues it is evident that citizen engagement in decision making processes is still a novel concept. It will be difficult to achieve inclusion of voices of those left behind. County governments will need significant and ongoing support in terms of evidence based decision making and intervention processes that prioritize marginalized groups. And it is an open question whether county governments, with generally low capacities, and reputed high levels of corruption, will be able to implement LNOB programmes in a manner that produces lasting results. For such programmes to succeed, the UN and other partners will likely need to engage in direct implementation, while building the capacities of both duty bearers and rights holders. In working to promote and achieve the realization of the principle of Leave No One Behind, the UNCT will need to partner with a wide range of actors to: develop disaggregated data needed for evidence-based programming; to build the capacity of those partners, especially county governments and the vulnerable themselves, to apply the principles of evidence-based decision-

Kenya: Common Country Assessment 2013-2017 120
making to the creation of LNOB strategies; and to implement those strategies to identify and reach populations groups that are, or that are at risk of, being left behind. Depending on the context, the UNCT may need to promote financial and social inclusion, enjoyment of rights and access to essential services for population groups that are left behind. In sectors and counties with weak institutional capacities, the UN’s work to ensure that no one is left behind might involve direct service delivery interventions aimed at strengthening or fulfilling rights, complemented by targeted institutional development support to strengthen local capacity163 7.7. Human Rights 7.7.1. Human Rights in Kenya’s Constitution, treaties and institutions Kenya is committed to an expansive approach to human rights: in 2010, it adopted a new Constitution containing a comprehensive Bill of Rights, which sets out both the rights extending to all individuals and those of specific groups, including for instance, children, youth and persons with disabilities. Specifically, the right to the highest attainable standards of health, education, accessible and adequate housing and water and sanitation, as well as the right to food are all guaranteed in the Constitution as enforceable rights. Chapter Four of the Bill of Rights asserts that “The purpose of recognising and protecting human rights and fundamental freedoms is to preserve the dignity of individuals and communities and to promote social justice and the realisation of the potential of all human beings”. The country also adopted the Paris Principles and formed Kenya National Human Rights and Equality Commissions which are independent institutions, enshrined in the Constitution of Kenya. The Republic of Kenya is a member of the United Nations and the African Union. It has ratified many UN Human Rights Conventions (See Annex 5). Under the constitution, treaties have the force of law, and thus it has made binding international commitments to adhere to the standards laid down in these universal human rights documents. In as far as Kenya has ratified the Optional Protocols for UN Human Rights Conventions or has accepted the Competence of the corresponding UN Treaty Bodies, the citizens of Kenya and their representatives are able to invoke their human rights through these bodies.164 All inhabitants of Kenya may turn to the UN Human Rights Committee through procedure 1503, to the Special Rapporteurs for violations of specific human rights or to ECOSOC for women's rights violations. Since Kenya is a member state of UNESCO, its citizens may use the UNESCO procedure for human rights violations in UNESCO's fields of mandate. Employers' or workers' and certain other organizations (not individuals) of Kenya may file complaints through the ILO procedure in the cases of those conventions which Kenya has ratified. Since Kenya is an AU member, its citizens and NGOs may file complaints to the African Commission on Human and Peoples’ Rights. They may also file complaints according to the EU guidelines (on Human Rights Defenders, Death Penalty and Torture) to Embassies of EU Member States and the Delegations of the European Commission. In cases of human rights violations by multinational enterprises, they may also invoke the National Contact Point in an OECD member state. Finally, Kenya is a member of the International Criminal Court; it may thus be called to account in case of severe crimes. Kenya acknowledges that development is primarily about people and therefore is adopting a human rights-based approach to development. Kenya has a National Human Rights Policy (Sessional Paper No. 3 of 2014) for realization and enjoyment of human rights. There are positive signs of utilization of its policy provisions in its early years. The country has an instrument to operationalize laws and guidelines that deal with human rights. A National Policy and Action Plan for Human Rights was adopted in 2015. Since its adoption, arms of government have started applying its provisions in their
163 UNDG, Programming Principles: UNDAF Companion Guidance, 2017 164 However, CRC Optional Protocol on the sale on children, child prostitution and child pornography has not been ratified.

Kenya: Common Country Assessment 2013-2017 121
work. A case in point: during allocation of houses under the Slum Upgrading Project, a court directed the Kenya National Commission for Human Rights (KNCHR) to be part of the process to ensure transparency, inclusivity and participation of beneficiaries. The government has adopted a plan that will help in the implementation and monitoring of the accepted recommendations during the UPR review (see Annex 6). The plan provides a framework for both the UN and the GOK to work towards promotion of human rights especially through UNDAF and the MTPs. The institutional capacity of the Oversight Agencies to produce timely reports has been enhanced. The UN supported the GOK in the submission of the 8th Periodic Convention on Elimination of Discrimination Against Women (CEDAW) Report and the UPR review recommendations, in line with international requirements. A good number of major corporations in Kenya have adopted and are domesticating the UN Guiding Principles on Business and Human Rights, adopted by UN Human Rights Council in 2011. The Kenya Private Sector Alliance is also spearheading the Sustainable Inclusive Business (SIB) which has assisted businesses to measure and report on sustainability with a focus on the Sustainable Development Goals. It also brings knowledge, networks, studies, publications, trainings and expertise together and makes them accessible to the business community. There is an emerging trend among the business community to engage in economic In December 2015, Parliament adopted the National Policy and Action Plan on Human Rights. The government has adopted a plan that will help in the implementation and monitoring of the accepted recommendations during the UPR review (see Annex 6). The plan provides a framework for both the UN and the GOK to work towards promotion of human rights especially through UNDAF and the MTPs. The institutional capacity of the Oversight Agencies to produce timely reports has been enhanced. The UN supported the GOK in the submission of the 8th Periodic Convention on Elimination of Discrimination Against Women (CEDAW) Report and the UPR review recommendations, in line with international requirements. activities that have a social and environmental dimension. 7.7.2. Human Rights issues and responses Kenya’s progressive constitution enshrines the full array of political and civil rights, and economic and social rights. However, the realization of these rights will require a series of efforts to build consensus, capacity and accountability, for which movements of rights holders will need to campaign, and duty bearers develop mechanisms and systems. For instance, under the right to access health without discrimination, the country established the first HIV Tribunal globally, to increase access to justice of people affected and living with HIV. Despite this and other measures, the enjoyment and fulfilment of health rights is often hampered by low citizen awareness levels. Furthermore, the existence of other punitive laws, as found in sections of the penal code, makes it difficult for groups such as men who have sex with men, sex workers and people who inject drugs to access services, protect their rights and access justice when their health rights are violated. There is a range of views on the state of human rights in Kenya but most human rights organisations (local and international) maintain that the state of civil and political freedoms is not good. The Freedom of the World Index for 2017 rates Kenya at “4” for civil liberties and political freedoms, on a scale of "1" (most free) to "7" (least free).165 Respect for human rights in Kenya remained precarious in 2016-2017, with authorities failing to adequately investigate a range of abuses across the country, amid accusations that they undermined basic rights to free expression and association. Human rights activists and journalists working on a range of issues faced increasing obstacles and harassment.
165 https://en.wikipedia.org/wiki/Human_rights_in_Kenya

Kenya: Common Country Assessment 2013-2017 122
Anti-terrorist campaigns Many issues are related to the fight against terrorist groups. Human rights organizations continue to implicate Kenyan police and military in disappearances and killings of individuals allegedly linked to Al-Shabab166. Kenyan and international human rights organizations documented military and police units, including the Directorate of Military Intelligence, carrying out enforced disappearances, torture and beating of individuals suspected of links with Al-Shabab. Over the last two years, there have been several cases of families reporting the disappearance of their relatives to the police and seeking help from various authorities, without the authorities informing them of the detainees’ whereabouts or properly investigating allegations of abuse. Kenyan authorities have not acknowledged, publicly condemned or investigated at least 32 cases of enforced disappearances and 11 unexplained deaths of people last seen in state custody in Nairobi and north-eastern Kenya. Kenya National Commission on Human Rights, a statutory human rights body, documented at least 100 cases of extrajudicial killings and enforced disappearances of those allegedly linked with Al-Shabab and continue to press for investigations. The Commission on Administrative Justice received at least 25,000 reports of killings by police across the country over 2013-2016. Kenyan authorities have very rarely investigated the killings or held anyone to account. In September 2017, the Office of the Director of Public Prosecutions and the Kenya National Commission on Human Rights separately announced intentions to initiate inquests in killings by police in Kisumu in 2013 and security forces abuses at the coast, respectively. Post-election violence The failed prosecutions of Kenya’s sitting leaders in the International Criminal Court for alleged abuses during the 2007 elections has polarized national opinion, leading to efforts to withdraw from the Court. The government continues its campaign to press the AU to consider calling on its member countries who belong to the ICC to leave the court, but several countries blocked consensus at a July 2016 summit. A bill related to Kenya’s withdrawal from the ICC remains pending in parliament. There is continued inaction regarding the thousands of women and men who claim to have been raped during the post-election violence in 2007-08. The government has not provided livelihood support or medical and psychosocial care to them, including for children who were born from rape and face ethnic violence and discrimination. The government has also not established the restorative justice fund that was promised to survivors of historical injustices, including post-election violence. Kenya’s presidential election on August 8, 2017 (and the repeat election on October 26, 2017) ware marred by serious alleged human rights violations, including unlawful killings and beatings by police during protests and house-to-house operations in western Kenya. Human Rights Watch alleged that at least 100 people were killed and hundreds badly injured167. Transitional justice A Truth Justice and Reconciliation Commission was set up after the post-election violence of 2007-2008. In May 2013, the Commission presented its final report of findings and recommendations to the President, pursuant to the Truth, Justice and Reconciliation Act. The TJRC report was a culmination of extensive hearings around the country aimed at unearthing historical injustices and fostering reconciliation.168 The report is of significance on issues of transitional justice and would facilitate addressing of historical injustices and human rights abuses in the country which resurface regularly, including during election times, and undermine the social fabric and cohesion in the country. Some of its recommendations have been implemented through government action. However, the report is yet to be debated and acted upon formally.
166 https://www.hrw.org/world-report/2017/country-chapters/kenya 167 https://www.hrw.org/news/2017/08/27/kenya-post-election-killings-abuse 168 The Statement by Kenya National Commission on Human Rights: The State of Human Rights and Freedoms in The Republic of Kenya, 14 th March 2017, pg. 4

Kenya: Common Country Assessment 2013-2017 123
Building on this report, the UN has an opportunity to provide both financial and technical support in the implementation of a framework that can significantly enhance accountability, provide reparations for victims and survivors and foster peace in the country. Gender and Women’s Rights The Constitution requires that no more than two-thirds of Parliament be of one gender. However, the provision has not been implemented through enabling legislation. Despite concerted efforts on strengthening advocacy capacity for the two-thirds Gender Rule Bill, failure of the bill to pass through parliament has been a major blow to the fight for gender equality. Unless Kenya passes the two-thirds Gender Rule, the country will not be able to meet the regional requirement for gender equality and participation of women in decision making. Significant progress has been made in strengthening institutional capacity for Gender and Human Rights Mainstreaming: The institutional capacity of the Attorney General’s Office to develop a framework for implementation of the two-thirds gender rule has been strengthened through NGEC. Parliament extended consideration of the two-thirds gender Bill by one year because of lobbying and advocacy efforts by the women’s movement and NGEC but it ultimately failed to be approved, and will have to be reintroduced on the new Parliament. The country was up for review about its international obligations under the Convention on the Elimination of all Forms of Discrimination against Women in October 2017 based on the state report submitted. This provides an opportunity to the UN to support a new set of recommendations on women’s rights. The list of issues the government was asked to respond to include steps taken to implement the previous recommendation of the Committee for the establishment of counselling and support services for victims of violence; information on measures in place to prevent political violence, which often impedes the full participation of women in politics at all levels; measures being taken to promote inclusive education for women and girls with disabilities; measures taken to address the high maternal mortality rate and steps that are being taken to address discriminatory laws and practices with regard to matrimonial and inherited property169. For further discussion of gender rights issues, see Section 6.4. Gender Equality and Women’s Empowerment. Civil society Over the last two years, civil society organizations have reportedly been subject to threats, attacks and harassment from government actors, including attempts to freeze their accounts170, arbitrary arrests and, in one case extrajudicial execution. Such threats have also been in the form of proposed legislative amendments to the yet operationalized Public Benefits and Organizations Act (PBO Act) as well as administrative actions through the NGO Board, which has attempted to deregister some CSOs on allegations of money laundering, lack of filing accounts and tax evasion. In September 2016, the Cabinet Secretary for Devolution announced plans to implement the Public Benefits Organisations (PBO) Act, first signed into law in January 2013. The announcement came just weeks after parliament voted to compel the executive to implement the law without proposed repressive amendments, such as capping NGO funding from foreign sources at 15 per cent. The PBO Act has been stalled for more than three years, despite a High Court ruling in October 2016 ordering GoK to commence the Act.
169 Committee on the Elimination of Discrimination against Women, Sixty-eighth session 23 October-17 November 2017 Item 4 of the provisional agenda Consideration of reports submitted by States parties under article 18 of the Convention on the Elimination of All Forms of Discrimination against Women 170 In 2016 two organizations in Mombasa MUHURI and HAKI Africa had their accounts frozen on grounds that they were engaging with outlawed groups among others

Kenya: Common Country Assessment 2013-2017 124
Nongovernmental organisations (NGOs) working on a range of issues face hostile rhetoric from public officials, including draconian administrative measures and attempts at introducing repressive amendments to the NGO law. In October 2015, the NGO regulatory body announced plans to deregister more than 900 NGOs over, among other reasons, alleged failure to comply with regulatory requirements and links to terrorism. The Cabinet Secretary later suspended the plan. Prior to, during, and after the 2017 elections, several human rights and election-related NGOs have been threatened with deregistration. In December 2016, the government NGO Board, which provides oversight of the NGO sector was moved from Devolution to the Interior Ministry. This decision triggered a major outcry and fears among NGOs of further shrinking of their space. The NGO Board transfer was shortly followed by a circular from the Interior Principal Secretary to the 47 county commissioners requesting an audit of NGOs for their engaging in ‘money laundering, terrorism financing and diversion of aid.171’ A study issued in May 2017 by a coalition of international NGOs172 denounced “open hostility towards human rights defenders” and “constant attempts to undermine them through administrative harassment, criminalization or in some cases arbitrary detention or other violations affecting life or physical integrity.” In 2016, the National Coalition for Human Rights Defenders (NCHRD) documented 60 cases of human rights defenders coming under attack. As of July 2017, there were close to 30 reported cases of human rights activists being subject to intimidation, pressure and attacks across the country, many of which related to scrutiny and denunciation of police brutality. KNCHR has been vocal on the importance of protecting civic space and has swiftly intervened on threats to de-register some of them. UN Special Procedures have repeatedly raised concerns on matters of civic space and specific attacks on NGOs. Significant advocacy has been carried out by senior UN staff in Kenya. The UN should continue to engage in this critical area in recognition that civil society organisations are key partners of Government and the UN in promoting democracy, development and stability through the implementation of SDGs. Concerns on civic space were raised in the Universal Periodic Review (UPR) in 2015, during which the Government of Kenya committed to remedial action including the commencement of the PBO Act. Media and freedom of expression According to Article 35 of the constitution, every citizen has the right of access to information held by the State and by another person and required for the exercise or protection of any right or fundamental freedom. Over the last two years, the UN Special Procedures have addressed several communications around freedom of expression which have not received a response by Government. In May 2017, a joint report by HRW and Article 19 documented an increase in pressure and threats to free expression and media rights in Kenya and detailed separate incidents in which 23 journalists and bloggers had been physically assaulted between 2013 and 2017 by Government officials or individuals believed to be aligned: at least two journalists died under circumstances that may be related to their work. The report also outlined 16 direct threats and 14 cases of police arbitrary arrest (they were later released) with formal complaints lodged. Allegations against the police have rarely been investigated or led to any prosecution. There have been alleged cases of media outlets being pressured by the authorities to sack specific journalists; threats of withholding or withdrawing advertising revenue being used to tone down or censor content; concern that the Communications Authority of Kenya announced in March 2017 that it would not allow media outlets to live-broadcast presidential results from polling centres in the 2017 elections. In the lead-up to the 8 August elections, the Committee to Protect Journalists (CPJ) stated that the Government was using economic strangulation,
171 Ministry of Interior letter dated 6th January 2017 172 “2017 Elections: Broken Promises Put Human Rights Defenders at Risk”

Kenya: Common Country Assessment 2013-2017 125
manipulation and infiltration to suppress the media. In July 2017, the UN Special Procedures noted that, in a bid to curb hate speech, the Communication Authority of Kenya and the National Cohesion and Integration Commission had introduced guidelines173 that were in breach of international standards on freedom of expression and freedom of the media incompatible with Kenya’s obligations under international human rights law. The government continues to enforce laws that undermine media freedom. The Kenya Information and Communication Act (KICA), the Media Act of 2013, and the Security Laws Amendment Act of 2014 contain repressive provisions, which introduce new harsh offences and penalties that should be repealed. In 2016, at least eight journalists and bloggers were arrested and charged under vaguely worded provisions in the new laws, including “misuse of a communications gadget,” “annoying a public official” or “undermining the authority of a public officer.” In May 2016, a High Court judge declared section 29 of KICA, which creates an offense of misusing a communications gadget, unconstitutional. The Constitution 2010 fully enumerated some individual rights to expression and information.
However, there is a lack of unilateral freedom of expression for Kenyan citizens. Amongst the most notable omissions from the enumerated rights is the right to express propaganda for war or an incitement of violence. Moreover, the Kenyan government still retains some control over the spread of dissenting ideas during wartime. In the realm of media specifically, the Constitution prohibits the government from interfering with the spread of truthful information or with any individual's right to access to that information. The government nonetheless sets standards for media content and regulates the enforcement of those rules174. In 2013 Kenyan policymakers amended previous laws to limit certain media coverage of terrorist attacks and attempted to suppress the reporting of the deteriorating safety in Kenya. The amendment to the Kenya Information and Communication Act works to stifle efforts of publications that put forth critical perspectives of the Kenyan government. Although there have been some governmental efforts to enhance the press freedoms of Kenyan citizens, such as The Media Council Bill of 2013 which created a governmental body that would promote and protect the freedom of the media, reportedly, the enforcement of the act has not promoted press freedoms. According to an independent study conducted by Freedom House, Kenya's press rights are somewhat comprehensive. The press is only considered "partly free" largely because of government efforts to enact laws that grant more control over media and publications. Moreover, previous laws, such as the Preservation of Public Security Act, which give the government the right to declare any information to be a security threat and censor that information, are still in effect and have yet to be repealed or amended175. In positive developments, an Access to Information Act was passed, effectively operationalizing Article 35 of the Constitution; arrests and prosecution under section 29 of Kenya Information and Communication Act (KICA) to clamp down on legitimate expression and democratic debate came to an end when section 29 was declared unconstitutional by a High Court Judge in 2017; and, the Media Council of Kenya (MCK) played an important and effective role during the elections, consistent with its mandate. Building on these developments and to partner with the Government of Kenya to foster a culture of accountable and transparent institutions, the UN should continue to work towards enhancing freedom of expression and the protection of media.
173 http://www.ca.go.ke/index.php/public-consultations 174 https://en.wikipedia.org/wiki/Human_rights_in_Kenya 175 https://en.wikipedia.org/wiki/Human_rights_in_Kenya

Kenya: Common Country Assessment 2013-2017 126
Police reform and accountability Though there exist solid regulatory legislation and oversight bodies, there has been insufficient progress on the implementation of police reforms, and increasing concerns are raised about serious human rights violations committed by police and other security agencies. Since 2014, the government has proposed amendments to security legislation, some of which were blocked in court as contrary to constitutional provisions. Further, the police have been increasingly accused of extra-judicial killings176 and misuse of force and firearms during crowd control resulting in the death of those assembled.177 The police force is also widely perceived as being a highly corrupt institution. This is a serious problem for social peace as police corruption impairs the agency’s credibility and effectiveness in enforcing the law and leads to the loss of public trust in the police force as an institution in protecting the public and its property.178 There are opportunities for the UN to continue engaging in this area including through the Police Transformative Agenda launched in 2016 by the police and the enactment of the Prevention of Torture Act and the National Coroners Service Act which have an effect of enhancing police accountability. Indigenous rights Despite the recognition of indigenous communities and their rights in the Constitution, violations of those rights through non-recognition and compliance with court orders continues to be a concern. There were cases of forced eviction of the Sengwer in 2016 from the Embobut and the Ogiek in 2009 and 2016 from the Mau and Elgon forests. Kenya has not enforced or complied with the decision by the African Commission on Human and People’s Rights which in 2010 found that the Kenyan government had violated the Endorois' rights under the African Charter after evicting them from the Mau forest in 2009. Further, in May 2017, the African Court179 found that Kenya had violated the Ogiek community’s rights under the Charter. The UN, through the Special Procedures and its presence in Kenya, has continued to engage with the Kenya government around these challenges.180 There is opportunity and need for the UN to continue to engage in this matter because of recommendations issued in the recent past by the Human Rights Council and by the Committee on Economic Social and Cultural Rights. Economic and social rights The UN has partnered closely with the Government of Kenya to promote economic and social rights. Following the review of Kenya before the UN Committee on Economic, Social and Cultural Rights in early 2016, the Committee’s concluding observations provided new impetus towards measures countering poverty, inequality and marginalization. They include: • A call for Kenya to expedite the adoption of pending legislation and policies, including the
Social Protection Bill, the Children Bill, the Water Bill, the Housing Bill, the Health Bill and the National Social Health Insurance Fund Bill, to give full effect to the economic, social and cultural rights enshrined in its Constitution;
• A recommendation to expedite the adoption of the Legal Aid Bill181, expand the National Legal Aid and Awareness Programme and allocate sufficient resources to the Programme so that disadvantaged and marginalized individuals, particularly indigenous peoples, women, people
176http://www.ipoa.go.ke/wp-content/uploads/2017/04/IPOA-Performance-Report-January-June-2016.pdf IPOA Performance Report January to June 2016 and the Statement by Kenya National Commission on Human Rights: The State of Human Rights and Freedoms in The Republic of Kenya, 14th March 2017, pg. 5 177 Monitoring Report on Police Conduct during public protests and gatherings - A Focus on the Anti-IEBC Demonstrations (April – June 2016). August 24, 2016 178 Asfaw Kumssa. (2015). Police Corruption: A Perspective on its Nature and Control. Donnish Journal of Political Science and International Relations. Vol 1(1) pp. 001-008. 179 The African Commission on Human and People’s Rights vs Republic of Kenya, Application No. 006/2012 180 A joint appeal by the SR HRDs, Indigenous, The issue of human rights obligations relating to the enjoyment of a safe, clean, healthy and sustainable environment and on adequate housing as a component of the right to an adequate standard of living, and on the right to non-discrimination in this context dated 26 April, 2017 was sent to the Kenyan government upon receiving reports of threats against a HRD from the Sengwer community by the Kenya Forest Service during an exercise of forced eviction against them from Embombut forest 181 This was adopted in 2017

Kenya: Common Country Assessment 2013-2017 127
living in rural areas and urban informal settlements, can claim their economic, social and cultural rights;
• A recommendation that Kenya increase the level of public funding, at both the national and county level, to ensure the progressive realization of economic, social and cultural rights, particularly rights to housing, water and sanitation, social security, health and education;
• That Kenya strengthen the investigation and prosecution of cases of corruption, through enhancing the investigative capacity of the anti-corruption body and public prosecutors and ensuring the independent functioning of the Commission;
• A call about the case of the Endorois to implement, without further delay, the decision of the African Commission on Human and People’s Rights (276/2003) and ensure that the Endorois are adequately represented and consulted at all stages of the implementation process;
• Calls to adopt a comprehensive anti-discrimination law that prohibits discrimination, direct or indirect, on all grounds including gender; on unemployment and underemployment to upgrade vocational skills of the workforce to meet the needs of the labour market and to create decent job opportunities; on right to housing to take all necessary measures to provide affordable social housing units for low-income families and to improve living conditions in informal settlements, including through the adoption of the Housing Bill and of the National Slum Upgrading and Preventing Policy; on adequate healthcare services to take concrete measures to enhance access to health services, particularly for disadvantaged and marginalized individuals and groups, including through increasing budgetary allocation to the health sector;
• A recommendation that Kenya increase the budgetary allocation to improve the access to water and sanitation, particularly in urban informal settlements and rural areas.
Child rights The country came up for review of state obligations under the Convention on the Rights of the Child in 2016 and in the concluding observations, the state was encouraged to adopt the following observations among others:
• To harmonize all national laws relating to the rights of the child; to allocate adequate resources for the implementation of the National Plan of Action for Children, 2015-2022;
• To expedite establishment of a comprehensive data collection system that covers all areas of the Convention, including those relevant to child poverty, both at the national and county levels, ensure disaggregation of data by age, sex, disability, geographic location, ethnic origin and socioeconomic background to facilitate analysis of the situation of all children;
• To take into account the conceptual and methodological framework set out in the Office of the United Nations High Commissioner for Human Rights (OHCHR) publication entitled Human Rights Indicators: A Guide to Measurement and Implementation when defining, collecting and disseminating statistical information, seek technical cooperation with, among others, UNICEF, the International Labour Organization (ILO), OHCHR and regional mechanisms in this regard and ratify the Optional Protocol to the Convention on the Rights of the Child on the sale of children, child prostitution and child pornography and the Optional Protocol to the Convention on the Rights of the Child on a communications procedure182. The observations provide for an opportunity for the UN to engage on the child rights at different levels.
According to a 2015 study by the African Network for the Prevention and Protection Against Child Abuse and Neglect, children in Kenya are involved in the commercial sex trade with both tourists and Kenyan nationals who travel from other parts of the country. Sexual exploitation of children in travel and tourism is reportedly common in major tourist destinations, such as Nairobi, Mombasa, Kisumu, Kakamega, Nakuru, as well as in other major towns in Kenya. Children are also exploited in sex trafficking by people working in khat cultivation areas, near Nyanza’s gold mines, along the coast by lorry drivers transporting stones from quarries, by fishermen on Lake Victoria, and at Lokichar in Turkana, where oil exploitation is underway. In most cases, victims of commercial sexual
182 http://tbinternet.ohchr.org/_layouts/TreatyBodyExternal/countries.aspx

Kenya: Common Country Assessment 2013-2017 128
exploitation are not able to access support services because most organizations focus only on awareness raising activities rather than direct service provision. In recent years, efforts have been made to increase the number of and to rehabilitate courtrooms, and to increase the number of magistrates to adjudicate on matters concerning children. The minimum age of criminal responsibility is still set at eight years of age, which is well below acceptable international standards. Children are still treated as adults and held together with adults; there is insufficient information on personnel with specialized training in juvenile justice, including lawyers, judges, prosecutors and public defenders, and correctional officers. Children in contact with the law in Kenya can legally be housed in probation hostels, though there is a lack of such hostels in some counties. Conditions in children’s remand homes have been found to be problematic in some cases, largely because of ageing infrastructure. Child victims of violence can lack access to justice, particularly in cases of sexual violence and harmful practices, due to social stigma, pressure from family members, low rates of investigation and prosecution, frequent delays in court proceedings, lenient sanctions imposed, the risk of re-victimisation in the justice system and the lack of legal aid and other support. In response to some of these concerns, the National Council for the Administration of Justice established a Special Taskforce on Children Matters in 2016 to improve the situation of children in contact with the justice system. The number of children living and/or working on the streets in Kenya is not known, but estimates are high, varying from 50,000 to 250,000. Urban areas with high numbers of children in street situations and homeless families include Nairobi, Mombasa, Kisumu, Eldoret, Lodwar and Nanyuki. There has reportedly been a growth in recent years in children from informal settlements being drawn to the streets of Nairobi during the day, while numbers in Lodwar have reportedly increased because of the impact of the 2017 drought. Devolution has added further complexity to the issue, as county governments lack a constitutional obligation to allocate money for rehabilitation of children in street situations. Child protection risks have increased in drought- and conflict-affected areas in 2017. With increased movements of people in search of water and pasture, one of the key child protection concerns is the risk of children being separated from their families. Refugee children can also be separated from their families, and can face gender-based violence, harmful traditional practices, physical abuse, child labour, discrimination and psychosocial distress. They also generally do not participate in resettlement decisions. To build Government capacity to respond to child protection concerns in emergencies, the Department for Children’s Services created a new Child Protection in Emergencies section in early 2017. Rights of refugees Kenya is party to the 1951 and the 1969 OAU Conventions and has passed a law in 2006 that is currently under review. The main limitation to the refugee’s rights touches upon their freedom of movement as per the encampment policy and the December 2014 security law. Although the Court stated that it is unconstitutional to limit the movements of refugees for security considerations, the Government has not relinquished these restrictions and continues to consider that all refugees should reside in the camps. Camp based refugees and asylum-seekers therefore require movement passes to leave the camps and new arrivals who register in the urban centres are asked to relocate to the camps. The Government has not yet put in place an effective exemption process. Persons of concern are regularly taken to Court for residing outside the camps. The suspension of the registration process in Dadaab since mid-2015 does not enable the new arrivals in Dadaab to enjoy their right to seek asylum. Recognized refugees are entitled to work in Kenya. While the issuance of business licenses is relatively easy to obtain, refugees face serious administrative constraints and delays to get work permits.

Kenya: Common Country Assessment 2013-2017 129
Rights of Migrants Kenya has ratified the East African Common Market Protocol which supports the rights of migrants through annexes of the document. This includes:
• Free Movement of Persons • Free Movement of Labour • Right of Residence
This document alongside various international laws on migrants’ rights promotes the non-discrimination of migrants in the country. Based on experience in the current UNDAF, the UNCT should develop a joint resource mobilization and partnership strategy in collaboration with the GoK through Treasury, including OECD and non - DAC donors, the private sector, and the SDG platform, among others. This strategy should include a compact on approaches to donors and other funders such as a philanthropy or the private sector, making clear when and how funds are sought, and by whom: whether on an agency basis with notice to the SDG Platform, or through SDG Platform. The SDG Platform managed by the RCO must be more actively overseen by the UNCT, so that the MPTF is used and valued by all as a service valued by all agencies. The MPTF will grow if agencies support the Platform to identify and catalyse partnerships. The Secretary-General’s reform programme should be examined in depth by the UNCT collectively, with a special focus on impact investment and blended financing and how they can support the achievement of the SDGs. The UNCT has recognized the great potential for exploration by the UN of additional partnerships and collaborations with non-traditional funders, philanthropies and the private sector, as well as for innovative development financing, such as impact investments. These approaches must be aligned with MoDP/Treasury approaches. Currently the government’s public-private partnership (PPP) legislation exists only in draft. Clarity on PPPs is key for the success of the SDG Partnership Platform. The UN must work with Treasury, the Attorney General, appropriate national and county representatives, the private sector and others to reach accord on the subject and accelerate enactment of a PPP bill. Accountability Accountability for the UNDAF often competes with UN Agencies accountability to their HQs. There is no mechanism to hold specific UN agencies accountable for the UNDAF results, in the same way that they are accountable for their agency work plans and commitments. An annual compact by each Agency with the UNCT to produce certain UNDAF results would create a basis for team review and management dialogue. While there has been progress in operationalizing DaO, many UN agencies continue to be independent in their strategic relationship with the GOK. Feedback from the Government indicated that working directly with individual UN agencies is not an efficient way of doing business and has been contrary the principles enshrined in the UNDAF. In expanding the number of Joint Programmes, the UNCT should develop mechanisms that will motivate agencies to remain accountable and committed to the UNDAF. Lessons learned from other UNCTs that have successfully implemented DaO would provide good practice examples. Leadership of SRAs at UNCT level should not be voluntary or based on individual agency or personal initiative and interest. The potential for coherence and coordination is maximized when the capacity, capability and engagement of the lead entity for any group is clear and appropriate and an accountability mechanism is put in place to review performance and non-performance.

Kenya: Common Country Assessment 2013-2017 130
8. STRATEGIC ENTRY-POINTS FOR THE UNDAF 2018-2022 The next UNDAF will be informed by key lessons and recommendations from the 2016 UNDAF MTR and the 2017 UNDAF final evaluation, as well as the findings of this CCA. Key findings are that the current approach of the UNDAF is relevant and generally well aligned to national priorities and needs, and has put in place strategies to respond to emerging priorities such as Middle-Income Country (MIC) status and the SDGs. It is also well positioned to organize its work around the new UN Programme Principles of: Leaving No One Behind; Human Rights, Gender Equality and Women’s Empowerment; Sustainability and Resilience; and Accountability. The UN has been strategically and actively engaged with the process of MTP III (2018-2022) development, and is effectively aligning the new UNDAF with it. In 2016, GOK launched its SDGs roadmap for the next 2 years. In the new UNDAF, the UN, guided by MAPS (Mainstreaming, Acceleration and Policy Support) will strategically position itself to support the localization and implementation of the SDGs. Specific focus areas will include: a comprehensive UNCT roadmap and costing to facilitate support to the implementation of the SDGs, substantive and regular reporting on key results at the national and county levels as well as defining solutions to off-track goals through an SDGs Acceleration Framework. To effectively align to the 2030 Agenda for Sustainable Development, the UN in Kenya has undertaking a foresight visioning exercise. Priorities of the next UNDAF will also be informed by global and regional priorities such as Africa Agenda 2063, the Paris Agreement and the Sendai Framework among others. The new UNDAF is being developed based on lessons learned, and in direct response to the development of the national MTP III. These require deliberate and strategic efforts for the UNCT to more coherently programme and deliver targeted initiatives, jointly or in close inter-agency coordination, aimed at addressing specific highest order national issues, in specific places. It is our view that the experience of the UNCT in developing joint and flagship programme equips it to move from a series of loosely aligned agency initiatives to Delivering as One in key, targeted upstream and downstream substantive and geographic areas 8.1. Positioning of the next UNDAF Kenya is poised for a potential economic ‘take-off’, with a youth population that could provide a huge demographic dividend, should growth increase to a norm of 10 per cent per year. However, ethnic and political tensions periodically threaten that economic trajectory. Corruption and unresponsive institutions are a serious drag on social trust. And severe inequalities threaten to leave wide segments of the population behind, hold back national development and feed extremism. At its core, the SDG Agenda is about inspiring the country to take the steps and make the changes necessary to achieve the nation’s positive potential. The UN’s fundamental task in the next five years is to encourage, support and accompany those who seek to realize the political, economic and social elements of that dream. The primary entry point for the UN, we would suggest, is not about operational activities for development in the traditional sense, requiring large scale resources for technical assistance. It is about catalytic funding for inspiration, advocacy, mobilization and partnership support to institutions and social groups committed to help realize the SDG Agenda. 8.2. A strategy centred on Accountability and Leave No One Behind In pursuing the application of the principle of Leave No One Behind, the UNCT has developed a good understanding of the disadvantaged, vulnerable and excluded groups in Kenya; who they are and where. But this understanding is only based on partial data. A central task of the new UNDAF should be support to the development of national and county level data series on a range of key LNOB and SDG metrics. Once such data is available across groups and counties, it should

Kenya: Common Country Assessment 2013-2017 131
be published and promoted widely, to mobilize actors in support of improved conditions, and to give politicians a basis to compete based on LNOB results and other SDG issues and achievements183. The availability of robust data on those being left behind, comparable across groups and localities, will give government and the UN a firm basis for evidence-based decisions on national investment and UN programming. At present, the UN is working on a range of upstream policy issues, and in a range of downstream communities. The two are not always linked, and agencies are not always fully aligned. A second step toward creating a more coherent UNCT strategy would be the creation of a process with national partners to examine the data and decide upon the allocations of the UN’s limited capacities in support of national LNOB efforts. The largest numbers of those left behind are in urban, informal settlements, while the worst deprivations are found in specific rural areas, particularly among the ASALs. A strategy that focused on improving the conditions of specific communities in both types of areas, carefully selected based on the data, could build national momentum toward LNOB. An LNOB-oriented UNDAF strategy will entail trade-offs for the UNCT. A significant amount of the UN’s work is technical, around national policies and issues important to sectors and segments of the general population. These efforts would need to be reviewed and aligned with LNOB efforts. Specifically, support to public authorities should support LNOB efforts, in policy and geography. Given the devolution of authority to the counties, and the relative weakness of county capacities, an LNOB strategy will require substantial technical assistance to counties and departments of focus, including direct support. The UN should work with other partners to develop replicable programmes for capacity building across the areas of UN work, and capture lessons learned, so that these programmes are revised and improved as they are expanded to additional counties. Tracking the achievement of UN programmes in a decentralized setting will be important and difficult. A strengthened and empowered M&E group should be tasked with creating and key metrics, and TA should be provided in each county for tracking progress. With LNOB at the centre of the UNDAF, other key thematic and substantive priority efforts should build more closely upon the alignment of the national plan and the SDGs, while providing area-specific programming as part of the UNCT’s integrated support in each locality. These priority areas should include population and employment/livelihoods issues, issues of inequality, social cohesion and trust in public institutions, devolution and funding of priorities, and HIV/Aids, among others. 8.3. Devolution Kenya’s bold programme of devolution to county level promises to make government more accessible and accountable to the people. But this depends on the performance of the newly-devolved systems and structures. Significant support from the UN and others will be required to assure their responsiveness and achievement. The question of how to provide such support to 47 counties is a key one for the GoK and all its partners. A UN strategy focused on LNOB criteria and data in pilot counties can demonstrate a path forward.
183 National Human Development Reports and other flagship UN publications that disaggregate date at sub-national level have long been
used by politicians to promote ‘their’ constituency’s achievements, or to criticize the performance of their rivals. This creates a ‘virtuous spiral’ of rising expectation.

Kenya: Common Country Assessment 2013-2017 132
Despite devolution, the country remains predominantly rural, while economic growth is largely an urban phenomenon. Growth is leaving rural Kenya behind, even as drought and climate change strain rural resilience. With UN help, Kenya must develop policies for rural investment and social support that lead to rural prosperity and sustainability. There is also limited investment in some sub-sectors by both national and county level government: more investment is needed in infrastructure, education, health & nutrition, irrigation, food security, among others. And there is a need for conflict management around devolved functions, such as health. The UN should provide advisory services and direct support in these areas. Supporting the process of devolution itself, especially strengthening national support to the counties, and the capacity of county governments to promote development and improve quality and integrity of service delivery, will remain a key priority. This will take on new importance as select counties will become the primary partners of the UNCT in its efforts toward achieving ‘Leave No One Behind’ goals. To work effectively in supporting the national-county link, the UNCT will need to more effectively Deliver as One ‘vertically’. This means creating work plans and coordination between UN national policy efforts and county-level TA and direct delivery initiatives. At the same time, to work effectively at county level, the UNCT will also need to greatly improve ‘horizontal’ Delivery as One. During the current UNDAF there have been promising experiments around county-level coordination. Close alignment with the County Integrated Development Plans (CIDP), and far greater use of joint programming are likely patterns for greater ‘horizontal’ coordination. County governments are new and lack capacity. The demands on them of partnering with multiple UN agencies would be burdensome – this is what joint programming was designed to avoid. To provide maximum assistance with minimal burden to local partners will require a serious re-examination of current, limited operational UN coherence. 8.4. Gender and human rights In the UN’s work in gender, women’s empowerment and human rights, a similar process of vertical integration will be required. At the centre of this should be a scaled-up commitment to using the rights based approach to mobilize rights holders. Building a more effective women’s movement, and other groups of rights holders, will be essential for rights to become and remain a priority. However, the empowerment of civil society itself is a sensitive issue, and the UN will need to invest heavily in high-level advocacy and national capacity building as well as at local level. In this regard, the global and regional capacities of the UN, development and regional partners and other organizations are critical in promoting normative standards. The UNCT should build on its existing partnerships to bring positive support and assistance to bear on a range of rights issues. 8.5. Population and the demographic dividend Kenya’s current economic growth puts it potentially on track to consolidate its newly-attained middle-income country status, and to take advantage of the opportunities of a potential demographic dividend, in which a falling birth rate and increased employment for the resulting bulge in the working age cohort lower the national dependency ratio. Such a dividend would provide a fundamental boost for the creation of the prosperous society for all that Kenya is committed to build. However, many interconnected issues of importance to the UN must be addressed for the dividend to occur, and for it to have the desired effect. While Kenya is experiencing a reduction in the rate of population growth, the UN should support the process of building a national consensus in favour of a more rapid decline. This will require strong and consistent leadership support, and a major investment in the education and empowerment of girls and women.

Kenya: Common Country Assessment 2013-2017 133
8.6. Economic growth The acceleration of economic growth must continue and stabilize at a high level. However, current growth is erratic and highly uneven across counties. To be maintained, growth must be broad-based and inclusive. If not, serious and growing disparities could put Kenya’s social stability at risk, and ultimately undermine its growth trajectory. The UN has a role to play in promoting a national commitment to a more inclusive and balanced pattern of economic growth. This is a key issue for the nation, as is the related challenge of formulating comprehensive policies and programmes to address and mitigate growing disparities, both geographically and among social groups. 8.7. Social conflict, peace building and governance The root causes of social tensions within Kenyan society must be firmly addressed, if the social stability required for accelerated growth is to be maintained. As recent elections have once again demonstrated, the strains attendant on uneven development have polarized politics and frayed social trust. This in turn risks undermining the national idea, and promotes social conflict. The UN’s role in building trust and helping to reduce disparities should be a consistent element in its work at national and county level, and it is agreed that the new UNDAF should provide support to a range of peace building, conflict resolution and transformational governance initiatives, promoting democratic participation and human rights; devolution and accountability; and peace and community security. Persistent perceptions of high levels of corruption and lack of accountability contribute to social alienation. Disparities and perceived exclusion can also breed violent extremism. Limited strategies to address insecurity, especially in North-eastern counties of Kenya, hamper realization of results. Addressing these issues will call for innovative programming and partnerships to contribute to long term sustainability of youth empowerment initiatives. 8.8. Resilience and sustainability Addressing the development elements of the spectrum of activities required for effective preparedness, mitigation and response to natural and complex disasters will also be a key agenda in the next UNDAF. In the current UNDAF, disaster risk management and resilience building have been woven into long term development in SRA IV. These subjects must also be treated as cross-cutting in the new UNDAF. The UNCT is committed to reduce barriers (experienced currently in drought situations) between emergency response and longer-term preparedness and early recovery. The UNCT will also continue investing in innovative area-based and cross-border programmes to reduce vulnerability and increase resilience of communities through capacity building, promotion of sustainable livelihoods and conflict management strategies. 8.9. Health & HIV/AIDs Kenya has made significant progress on controlling infectious diseases, resulting in increase in life expectancy. However, communicable, maternal, neonatal, and nutritional diseases continue to rank as main causes of deaths, with HIV still ranking the highest in terms of premature deaths/years of life lost.184 Moreover, these diseases pose a challenge to the health budgets at national and county level. For example, the Kenya HIV response is projected to increase from USD 1,115 million in 2017 to 1,283 million in 2022, with a widening budget gap due to decline in external funding.185 The UN should continue its efforts in these areas, with a focus on health-care finance. 184 Source: Kenya Health Metrics and Evaluation 185 NACC

Kenya: Common Country Assessment 2013-2017 134
8.10. Housing and urban development Kenya is experiencing a rapid rate of urbanisation, which continues to increase pressure on urban authorities to meet the needs of growing urban populations. Already, over 35 per cent now live in cities and towns. It is projected that more than 50 per cent will live in urban areas by 2030. Unless effective measures are taken, this is bound to worsen the country’s rate of unemployment, which stands at around 40 per cent. Some 8 out of every 10 jobless Kenyans are youth aged between 15-34 years186. It is worth noting that urbanization poses additional challenges to the youth due to their limited access to resources, education, training, and employment, not to mention negative aspects of the rapid erosion of indigenous values with rural-urban migration. The envisaged mega-city status of Nairobi calls for extensive and appropriate infrastructure development, if the concomitant transit problems are to be circumvented. Urban youth employment and urban planning should be key elements of the new UNDAF. 8.11. Environment Kenya faces a wide array of critical environmental challenges. These challenges are associated with all the other issues of focus of the UN. In the last UNDAF environmental, disaster preparedness and other related issues were bundled in a stand-alone SRA IV. Unfortunately, the challenges of coherence proved too great, and the approach was not successful. There is not yet a consensus within the UNCT on how environmental issues should be addressed in the next UNDAF. We see several possibilities. First, the UN could manage a range of purely environmental issues in a “mini-SRA”, complementary to the areas of focus of the other three agreed SRAs. Or environment could be managed through a matrix management approach. Environmental issues would be managed within each SRA that are closely associated with its areas of focus, but would be supported technically by a cross-SRA Environment Group. Whatever the UNCT’s choice in organizing this work, it should give continuing priority to this critical area. 8.12. Financing the UNDAF With Kenya now no longer a lower income country, and its vision 2030 aiming to transform Kenya into a newly industrialising country, the UN has been developing new approaches to financing for development. Partnerships will become as important as traditional development assistance in the next UNDAF. Promoting legislation and policy that support this shift will be a key, specific priority. Critically for the UN, as Kenya is now a Middle-Income Country (MIC), aid is being reduced by donors. There remains a heavy reliance on donors for funding of certain sub-sectors, such HIV/Aids and nutrition; there are serious sustainability issues for many programmes. Therefore, there is need for the UN to strategically package its support to the GOK. Some of the areas that are of key priority include support for high level upstream policy and legal issues linked to downstream priorities such as county-level LNOB efforts; development of knowledge management products for the GOK given the new role the country will play within the region, enhancing South-South and triangulation cooperation and county to county learning, and consolidation of flagship programs to create replicable development products. Cross-sectoral opportunities for integration should be developed, and community level programming encouraged. Given that there was a shortfall in financing in the current UNDAF for economic development programming, the UN should seek to address these important issues at the upstream level, and downstream in in tandem with other initiatives in area-based programmes. The passage of PPP legislation will be particularly important in opening new approaches to programming in this area.
186 http://www.worldpolicy.org/blog/2014/03/24/kenyas-emerging-cities-dilemma

Kenya: Common Country Assessment 2013-2017 135
8.13. Programme management and delivery The UNDAF evaluations noted that though the UN in Kenya has worked with the GOK for national ownership and leadership of the programme both at national and county level, the coordination structures for implementation need further strengthening for sustainability. This should be done at both national and county level. During the current UNDAF, significant progress has been made in improving programme delivery and efficiency, by the UN Operations Management Team (OMT) in working towards the Business Operations Strategy (BOS). Though initial results include significant net savings, there is a need to fully implement and harmonize BOS initiatives within the UNDAF Framework in the next 2 years. The MTR and final UNDAF evaluations highlight the criticality of reinforcing strategic planning and delivery effectiveness through the BOS, to ensure that programmatic interventions are supported by high quality, efficient and expeditious integrated operational arrangements. In the next UNDAF cycle, a more ambitious and comprehensive integration of business operations is required, to enable the UNCT to operate coherently with national level partners and through hubs at county level. 8.14. Communications There is also a need to substantially reinforce communication as one: to better communicate key messaging for results; to enhance ownership of the programme among all UN agencies and GOK; and to promote SDG-based partnerships around the UNDAF agenda. At both national and county level, the UNCT communications effort should focus on the organization, mobilization and support of rights holders. This is especially critical in supporting groups asserting rights in LNOB campaigns at county level.

Kenya: Common Country Assessment 2013-2017 136
ANNEXES Annex 1: Data and Information Needs of the CCA
Data and information needs Data availability and gaps
Data is Available /Existing Studies (Yes) Source of the Data
Data is not Available (What is the gap, how can we fill the gap)
Root cause analysis 1. Multidimensional causes of
poverty, inequalities and discrimination and vulnerabilities of the most marginalized people (including those at risk) including women, refugees, internally displaced persons, migrants, minorities, indigenous peoples, stateless persons, and populations affected by conflict and natural disasters.
• FAO Policy study • Ag. MTP III situation analysis • Thematic write-ups of the ASGTS
Lead Authors • Ending Drought Emergencies
(EDE) Country Programming Framework (EDE-CPF)
• FAO study: Coordination structures for food and nutrition security and drought management
• Inadequate policy and legislative framework (not based on evidence, no clear targets)
• Weak capacities for data collection, analysis and application • Inadequate and skewed funding of the agriculture sector (inadequate research,
poor service delivery, etc.) • Weak implementation of policies, strategies, standards and regulations e.g.
fertilizer subsidy • Uncompetitive input and commodity markets/cartels • weakness in foundations needed to support sustainable livelihoods in drought-
prone areas (security, infrastructure and human capital (education, health and nutrition)
• Frequent resource use conflict • Weak cross-sectoral and intergovernmental coordination • Weak planning and prioritization capacities
2. Alignment with international
standards, conventions and instruments
3. Analysis of existing inequalities and forms of discrimination and other human rights violations prohibited under international law towards leaving no one behind
4. Structural barriers; reverse unequal distributions of power, resources and opportunities; and/or challenge discriminatory laws, social norms and stereotypes
The Constitution of Kenya (2010) considers all ratified international conventions as part of Kenyan Law. E.g. Maputo declaration and Malabo protocol Kenya’s periodic report of state parties on Convention on Elimination of All Forms of Discrimination Against Women (CEDAW) The Constitution of Kenya (2010) Article 10 (2) provides for non-discrimination of any form
9. The GoK is signatory to several international conventions and instruments. This has however not guaranteed implementation and actualization. Women still face discrimination in access to resources such as land, despite Kenya being signatory to CEDAW.
10. Enforcement challenges abound so full benefits to women have not been realized • Low capacity of stakeholders to participate effectively in national development
processes

Kenya: Common Country Assessment 2013-2017 137
that perpetuate inequalities and disparities.
5. Level of Active and meaningful participation by all stakeholders especially national governments, civil society, private sector and marginalized groups, in national development processes
6. Due diligence and full implementation of normative standards such as the UN’s Guiding Principles on Business and Human Rights in public-private partnerships.
7. Rigorous gender analysis that goes beyond age- and sex-disaggregated data to explain immediate, underlying and root causes and differentiated impacts (including through an appreciation of social, legal, political, economic and cultural dynamics that underpin gender inequality).
8. Implementation of internationally agreed policy frameworks or conventions, including the Beijing Platform for Action (BPFA) and the Convention on the Elimination of All Forms of Discrimination against Women (CEDAW).
County Public Participation Guidelines (2016) Public Participation Bill (2016); UN Guiding Principles on Business and Human Rights (OHCHR, 2011); Kenya Public-Private Partnership Manual (2015); UN Women study on Gender and Agriculture (2015); FAO, Gender and Dairy Value Chain in Kenya (2017) World Bank on Gender and Economic Growth in Kenya (2007) Kenya’s 8th Periodic Report on CEDAW (2016)
• Kenya does not have specific guidelines on business and human rights
• While Kenya has ratified the BPFA and CEDAW, implementation to fully benefit
women is still outstanding
7 legal, policy and institutional environment as well as economic and social patterns affecting the resilience of communities, especially for vulnerable and excluded groups
• Agriculture Sector Development Strategy (ASDS) 201-2020
• FAO Study: Assessment of the Enabling Environment for the Achievement of Food and Nutrition Security, Sustainable
• No rationalization of policy making and implementation framework in view of devolution-study proposes framework for rationalizing, however, though this has been received positively by government, has not been adopted.
• Institutions proposed for the implementation of the FNSP have yet to be established

Kenya: Common Country Assessment 2013-2017 138
8 Integration of environment and social protection in national policies that deal with key development sectors, and ensuring links with emergency, crisis and humanitarian systems;
9 Sustainability and resilience dimensions of development problems, and the interconnections among issues related to the environment, human rights, conflict and vulnerability; implementation of internationally agreed policy frameworks or conventions ratified by the country with the potential to facilitate integrated implementation of the SDGs. These include the Paris Agreement, the Addis Ababa Action Agenda, the United Nations Framework Convention on Climate Change), and the Sendai Framework for Disaster Risk Reduction Paris Agreement
Agriculture and Social Protection in Kenya
• National Food and Nutrition Security Policy (FNSP 2012)
• Kenya Agriculture Sector Development Strategy (ASDS) Review: Proceedings of the first Task Force Retreat (FAO)
• Ending Drought Emergencies (EDE) Country Programming Framework (EDE-CPF)
• National Climate Change Adaptation Framework
• Climate Smart Agriculture Strategy
• Though EDE-CPF was developed in a very inclusive manner, resourcing and buy-in by line ministries still a challenge.
• Inadequate targeting of vulnerable groups for SP activities (youth, women, disabled with potential to be agriculturally productive but lack resources to do so)
• Certain interventions in agriculture contribute to social protection, however, integration of SP in agriculture policies and strategies is weak
• Weak linkages between agriculture and social protection sectors

Kenya: Common Country Assessment 2013-2017 139
7 Capacity of national and local mechanisms, institutions and processes to monitor and report on the progress of SDG implementation for all parts of society, and linking these with international mechanisms, including UN human rights mechanisms; including through joint assessments with target populations; system’s accountability to the general public local community engagement and participation in decision-making—particularly of those who are left behind or are at risk of being left behind—in national policy development, implementation, or monitoring and evaluation,;
8 Existence of transparent and robust data and information for policy formulation, programme design and implementation to manage risks and deliver results through more effective decision-making, both in national policy processes, and the work of the United Nations at the country level.
• Data statistical reviews available from the Kenya National Bureau of Statistics (KNBS) including:
▪ Annual Economic Surveys ▪ Statistical Abstracts ▪ Kenya Facts and Figures ▪ Economic Indicators ▪ Kenya Demographic and Health
Survey (e.g. 2014) 9 Population and Housing Census
reports (e.g. 2009 and planned 2019)
10 Data and periodic reports from
Government of Kenya ministries and associated agencies on their respective sectors e.g. health, agriculture, environment.
11 Kenya Open Data Initiative
12 Country reports of United Nations specialized agencies with operations in Kenya.
13 Various certified reports from local and international institutions (profit or not for profit) with wide ranging operations in Kenya.
14 Various Academic repositories e.g. Universities
15 Lack of timely, accurate and complete datasets to inform decisions and improve accountability.
16 Quality and quantity issues with available data.
17 Differences or confusion over methodology thereby hindering use or integration of datasets. Government departments do not share well enough among themselves as is also the case among UN agencies.
18 Underdevelopment of public repositories of datasets (e.g. Kenya Open Data)
19 Underdeveloped Open Data Policies in both public and private sector that would
help in spurring the ecosystem forward.

Kenya: Common Country Assessment 2013-2017 140
5. Results-focused programming ➢ Assessment and analysis of the
capacities of government and relevant stakeholders on results focused programming.
➢ Articulate the root causes of lack of capacity and explores broad approaches to developing capacities such as through South to South and triangular cooperation.
➢ FAO study: Capacity Development Program for Food and Nutrition Security, Sustainable Agriculture and Social Protection in Kenya
➢ FAO study: Report of the South-South Cooperation (SSC) exchange (Latin America & Asia) for improved Food Security and Nutrition (FSN) focusing on the Governance Mechanisms under devolved systems
➢ Weak evidence based priority setting ➢ Programs are not anchored on properly designed investment plans or with
long-term sustainability in view ➢ Limited capacity at county levels to domesticate national policies and
programmes ➢ Sector experts at the national and county levels lack skills to analyse,
develop and communicate viable program priorities ➢ Inadequate human and institutional capacity for agricultural governance
under a devolved system.
• Analysis and assessment of risks that face Kenya such as market shocks, natural hazards, social unrest, climate change, epidemics and pandemics, and the risk of conflict or serious human rights violations. That can trigger further risks, such as economic loss and political tensions, undermining and reversing progress towards the SDGs.
• Bi annual food security assessments
• Monthly county early warning bulletins
• IPC and PLEWS-Predictive Livestock Early Warning System
• Participatory disease surveillance • PLEWS can to some extent
predict conflict hot spots, (OCHA also have their own system)
• Accurate data for planning purposes – agricultural census • Active Disease surveillance is highly dependent on available funding • Feed Balance sheets
• Multi-dimensional conflict and risk analysis examining multi-hazard risks, human rights, and humanitarian and peacebuilding dimensions in a holistic way.
NDMA early warning bulletins PLEWS, IPC
• Conflict remains a key limiting factor to development in parts of Kenya and very little progress has been made to resolve this. With reference to pastoralism much more focus is needed in working with traditional leaders and institutions (such as the development of pastoral unions) to support negotiated access to range lands and to encourage / assist them to hold their own people accountable for any criminal acts.
• Legislation for the NDCF not yet past

Kenya: Common Country Assessment 2013-2017 141
• Existing coping and response
capacities, and resilience systems. • Conflicts and development analysis • Humanitarian needs overview- an
analysis of development, humanitarian and peacebuilding efforts in crisis
EDE / National Drought Contingency Fund
• Assessment of coherence, alignment and consistency across national policy and programmatic frameworks in support of development efforts
• Assessment of the national development and policy landscape and engagement with stakeholders and development partners, including the World Bank and other international financial institutions.
• Inception report for the Food and Nutrition Security Impact, Resilience, Sustainability and Transformation (FIRST) Program
• FAO Study: Assessment of the Enabling Environment for the Achievement of Food and Nutrition Security, Sustainable Agriculture and Social Protection in Kenya
• FAO study: Capacity Development Program for Food and Nutrition Security, Sustainable Agriculture and Social Protection in Kenya
• Most policies are not guided by an overarching policy framework, regional and global commitments, and empirical evidence.
• Hierarchy and relationship and expected outcomes of objectives are not clear to government staff at different levels.
• Many policies are outdated or have remained in draft form for many years • Conflict between national policies and county governors’ manifestos • Some counties have developed their own sectoral, sub-sector or commodity
policies partly due to lack of clear and official national policy frameworks • Agricultural objectives are given low priority in political party manifestos and
budgets because national and county governments fail to appreciate the important role of agriculture in economic growth
Need to: • Support the review of existing policies and strategic frameworks and formulate
more effective policies • support the review and design of well-thought-out strategy and national
agriculture investment Plan • improve capacity for human and organizational development

Kenya: Common Country Assessment 2013-2017 142
• support to strategic coordination- -focus on the institutionalization of intergovernmental, intra and inter-ministerial and intra and inter-county coordination structures
• Analysis and assessment of
partners – values, risks, partnership strategies risk management measures, including safeguards and due diligence processes
• Numerous civil society and
private sector bodies (including the Agriculture Council of Kenya, Kenya National Agricultural Federation, the Private Sector Alliance, The ASAL Stake Holder Forum (ASF) the Pastoral Parliamentary Group
• As can be seen by the list to the left, there are numerous groups but conformity
and coordination remain key issues (largely because of the lack of a clear strategy on private sector engagement in development processes).

Kenya: Common Country Assessment 2013-2017 143
Annex 3: List of UN, GOK Institutions Consulted for the CCA
Institution
Government of Kenya
Ministry of Finance and National Treasury Ministry of Devolution and Planning Ministry of Industrialization Ministry of Agriculture Ministry of Education Ministry of Environment Ministry of Health Ministry of Labour and East African Affairs Kenya School of Government Office of The Solicitor General- Gjlos PDMA Council of Governors
United Nations System
Food and Agriculture Organisation of the United Nations (FAO) International Labour Office (ILO) International Organisation for Migration (IOM) United Nations Children's Fund (UNICEF) United Nations Development Programme (UNDP) United Nations Educational, Scientific and Cultural Organization (UNESCO) United Nations Entity for Gender Equality and The Empowerment of Women (UN Women) United Nations Environment Programme (UNEP) United Nations High Commission for Refugees (UNHCR)
United Nations Human Settlements Programme (Un-Habitat) United Nations Industrial Development Organization (UNIDO) United Nations Office on Drugs and Crime (UNODC) United Nations Population Fund (UNFPA)
United Nations Programme On HIV/AIDS (UNAIDS)
World Food Program (WFP)
World Health Organisation (WHO)

Kenya: Common Country Assessment 2013-2017 144
Annex 4: List of References and Background Documents Government of Kenya Sources Kenya National Bureau of Statistics; Economic Survey 2017 National Council for Population and Development; 2015 National Adolescent and Youth Survey,
December 2015 Republic of Kenya, Country Analysis, Medium Term Plan 2018-2022; March 2017 Republic of Kenya, Ministry of Devolution and Planning; Implementation of Agenda 2030 for Sustainable Development in Kenya, June 2017 Republic of Kenya; Agricultural Sector Development Strategy (ASDS) 2009 – 2020; 2009 Republic of Kenya; Country Situational Analysis Informing Medium Term Plan III (2018-2022); March
2017 Republic of Kenya; Kenya Vision 2030- A Globally Competitive and Prosperous Kenya, October 2007 National Council for Law Reporting; The Constitution of Kenya, 2010 Republic of Kenya; MTP III: Focus Areas Under Jubilee Manifesto, 2017 Republic of Kenya, Pilot Mapping Study of Culture and Creative Industries in Kenya, May 2012 Republic of Kenya; Socio-economic Update,11 July 2017 United Nations Sources Office of the United Nations High Commissioner for Human Rights; Common Country Assessment (Confidential Report), September 2017 UNAIDS; HIV Epidemic Overview in Kenya, 2017 UNICEF Kenya; Situation Assessment of Children in Kenya (Draft); 21 July 2017 UNIDO; Common Country Analysis (Background Paper, unpublished), Sept. 2017 United Nations CEDAW/C/KEN/8; Convention on the Elimination of All Forms of Discrimination against Women; Consideration of reports submitted by States parties under article 18 of the Convention; Eighth periodic report of States parties due in 2015 (Kenya); 3 March 2016 United Nations Country Team (Kenya); UNDAF 2018-2022 Road Map, 2017 United Nations Country Team Kenya; Complementary Country Analysis, May 2013 United Nations Country Team Kenya; Draft Evaluation Report; The 2014-2018 Kenya United Nations Development Assistance Framework, November 2017 United Nations Country Team, Kenya; Common Country Assessment for the United Nations Development Assistance Framework (UNDAF) 2014-2018 United Nations Country Team, Kenya; Situation of The Implementation of The Convention on The Elimination of All Forms of Discrimination Against Women (CEDAW), February 2017 United Nations Development Group, Common Country Assessment: UNDAF Companion Guidance, 2107 United Nations Development Group; Guidelines to Support Country Reporting on The Sustainable Development Goals United Nations Development Group; Theory of Change -UNDAF Companion Guidance United Nations- Habitat; Habitat Context Analysis Excerpts; 2017 United Nations Kenya; Concept Note for Strategic Prioritization of UNDAF Workshop; July 2017 United Nations Office for Disaster Risk Reduction; Risk Informed Programming in Kenya: UNISDR Contribution to Common Country Assessment (CCA) For UNDAF 2018-2022 United Nations University Centre for Policy Research files; Who Wants (To) Change — Making the UN Development System Fit to Support the 2030 Agenda United Nations; Convention on the Elimination of All Forms of Discrimination against Women: Kenya Eighth Periodic Report of States Parties by Committee on the Elimination of Discrimination against Women (due in 2015); Issue of 1 June 2016

Kenya: Common Country Assessment 2013-2017 145
United Nations; Final Evaluation of the Kenya United Nations Development Assistance Framework (UNDAF) 2014-2018; draft of November 2017 United Nations; Mid Term Review of the Kenya United Nations Development Assistance Framework (UNDAF) 2014-2018; 2016 United Nations; Transforming Our World: The 2030 Agenda for Sustainable Development United Nations; UNDP Kenya Country Programme (2014-2018); Mid-Term Evaluation; May 2017 UNHCR Kenya Statistical Package: http://www.unhcr.org/ke/wp-content/uploads/sites/2/2018/01/Kenya-statistics-package-December-2017.pdf… Other Sources Analyse Africa (Financial Times), Kenya by the Numbers: A Macroeconomic Data and Trends Report on Kenya; County Report 2017 Ellen Harries, Lindsay Hodgson and James; Creating Your Theory of Change NPC’s Practical Guide; Noble November 2014 International Journal of Economics and Management Sciences Vol. 2, No. 6, 2013, pp. 43-60: The Impact of Population Change on Economic Growth in Kenya MAY 201LARK SORIANO C. Soriano, Future UN Comparative Advantage (Kenya); May 2013
The Danish Institute for Human Rights, Linking the Universal Periodic Review to the SDGs

Kenya: Common Country Assessment 2013-2017 146
Annex 5: List of United Nations Human Rights Treaties Ratified by Kenya Status of Ratifications Human Rights Instrument: (Date into force), Ratification, Status, Declaration International Convention on the Elimination of All Forms of Racial Discrimination :1969 Signature: NA, Ratification/Accession: 2001 International Covenant on Civil and Political Rights :1976 Signature: NA, Ratification/Accession: 1972 Optional Protocol to the International Covenant on Civil and Political Rights:1976 Signature: NA, Ratification/Accession: NA Second Optional Protocol to the International Covenant on Civil and Political Rights, aiming at the abolition of the death penalty :1991 Signature: NA, Ratification/Accession: NA International Covenant on Economic, Social and Cultural Rights :1976 Signature: NA,
Ratification/Accession: 1972 ✓ Optional Protocol to the International Covenant on Economic, Social and Cultural Rights :2013 Signature: NA, Ratification/Accession: NA Convention on the Elimination of All Forms of Discrimination against Women :1981 Signature: NA, Ratification/Accession: 1984 Optional Protocol to the Convention on the Elimination of All Forms of Discrimination against Women :2000 Signature: NA, Ratification/Accession: NA Convention against Torture and Other Cruel, Inhuman or Degrading Treatment or Punishment :1987 Signature: NA, Ratification/Accession: 1997 Optional Protocol to the Convention against Torture and Other Cruel, Inhuman or Degrading Treatment or Punishment :2006 Signature: NA, Ratification/Accession: NA Convention on the Rights of the Child :1990 Signature: 1990, Ratification/Accession: 1990 Optional Protocol to the Convention on the Rights of the Child on the involvement of
children in armed conflict :2002 Signature: 2000, Ratification/Accession: 2002 ✓ Optional Protocol to the Convention on the Rights of the Child on the sale of children, child prostitution and child pornography :2002 Signature: 2000, Ratification/Accession: NA Optional Protocol to the Convention on the Rights of the Child on a communications procedure :2014 Signature: NA, Ratification/Accession: NA

Kenya: Common Country Assessment 2013-2017 147
International Convention on the Protection of the Rights of All Migrant Workers and Members of their Families :2003 Signature: NA, Ratification/Accession: NA International Convention for the Protection of all Persons from Enforced Disappearance :2010 Signature: 2007, Ratification/Accession: NA Convention on the Rights of Persons with Disabilities :2008 Signature: 2007, Ratification/Accession: 2008 Optional Protocol to the Convention on the Rights of Persons with Disabilities:2008 Signature: NA, Ratification/Accession: NA Declarations Ratifications (Acronym), Declarations International Covenant on Economic, Social and Cultural Rights (ICESCR) "While the Kenya Government recognizes and endorses the principles laid down in paragraph 2 of article 10 of the Covenant, the present circumstances obtaining in Kenya do not render necessary or expedient the imposition of those principles by legislation." Optional Protocol to the Convention on the Rights of the Child on the involvement of children in armed conflict (OP-CRC-AC) Declaration: "The Government of the Republic of Kenya declares that the minimum age for the recruitment of persons into the armed forces is by law set at eighteen years. Recruitment is entirely and genuinely voluntary and is carried out with the full informed consent of the persons being recruited. There is no conscription in Kenya. The Government of the Republic of Kenya reserves the right at any time by means of a notification addressed to the Secretary-General of the United Nations, to add, amend or strengthen the present declaration. Such notifications shall take effect from the date of their receipt by the Secretary-General of the United Nations”

Kenya: Common Country Assessment 2013-2017 148
Annex 6: The Human Rights Council Universal Periodic Review 2015: Recommendations Kenya has participated in the Human Rights Council’s Universal Periodic Review mechanism through two cycles of review, the most recent in 2015. The next full review will take place in 2025. At the conclusion of the 2015 review, an extensive number of recommendations made to Kenya were accepted, and a much smaller number were noted. Those recommendations accepted by the GOK are commitments to pursue action toward full achievement of the rights at issue, and may be a basis for collaborative action, advocacy and programming. Databases of Recommendations The recommendations of the 2015 Kenya UPR are available electronically in several forms: The documentation of the Human Rights Council’s review of Kenya is available at: http://www.ohchr.org/EN/HRBodies/UPR/Pages/KEIndex.aspx A searchable database of the UPR recommendations to Kenya is available at: http://www.UPR-info.org UPR Info's Database of UPR recommendations and voluntary pledges allows you to access and
search all UPR recommendations and voluntary pledges across several categories:
State under Review, Recommending State, Regional Group, Organisation, Response UPR
cycle, Thematic Issues , and Type of Action . Some of them are exclusive to this unique database developed by UPR Info.