
United Nations Conference on Trade and Development · 2019-04-15 · United Nations Conference on...
33
United Nations Conference on Trade and Development 11 th MULTI-YEAR EXPERT MEETING ON COMMODITIES AND DEVELOPMENT 15-16 April 2019, Geneva Commodity markets: Recent trends and outlook By Janvier D. Nkurunziza Commodities Branch, UNCTAD The views expressed are those of the author and do not necessarily reflect the views of UNCTAD.
Transcript of United Nations Conference on Trade and Development · 2019-04-15 · United Nations Conference on...
United Nations Conference on Trade and Development
11th MULTI-YEAR EXPERT MEETING ON COMMODITIES AND DEVELOPMENT
15-16 April 2019, Geneva
Commodity markets: Recent trends and outlook
By
Janvier D. Nkurunziza
Commodities Branch, UNCTAD
The views expressed are those of the author and do not necessarily reflect the views of UNCTAD.
Boglio
Typewritten Text
Commodity markets:
Recent trends and outlook
Multi-year Expert Meeting on Commodities and Development
15 - 16 April 2019, Geneva
Janvier D. Nkurunziza
Commodities Branch, UNCTAD

Background….
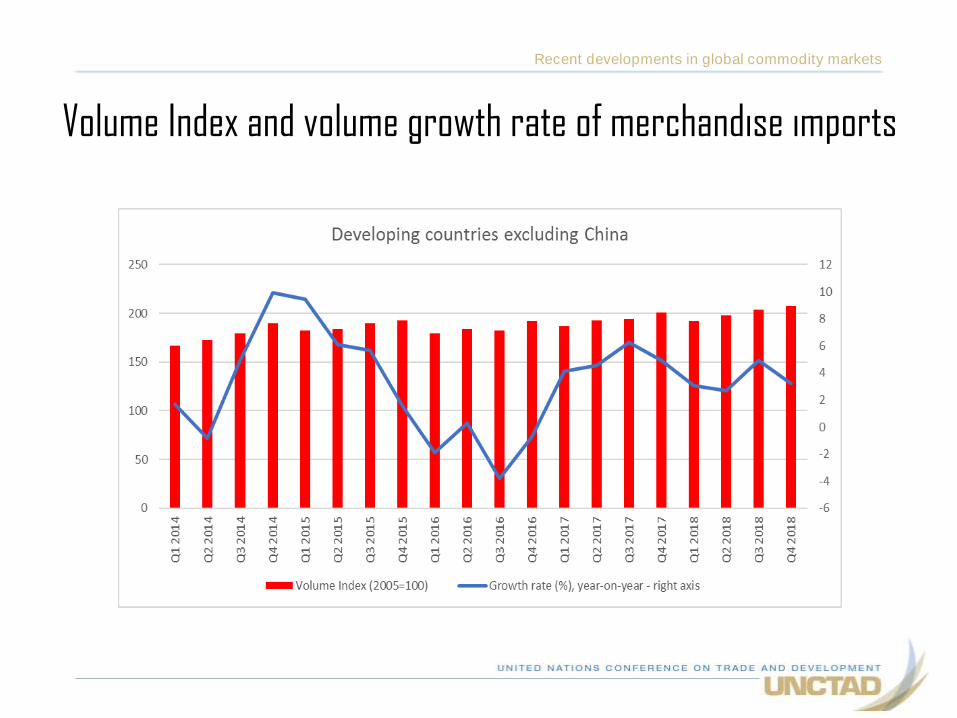
Volume Index and volume growth rate of merchandise imports
Recent developments in global commodity markets
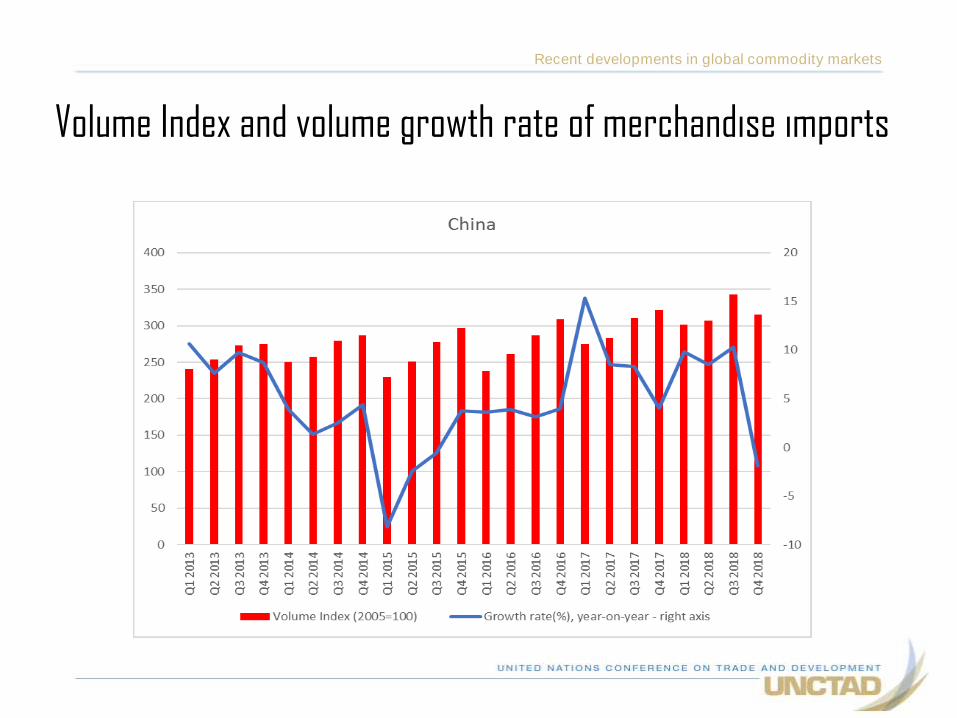
Volume Index and volume growth rate of merchandise imports
Recent developments in global commodity markets
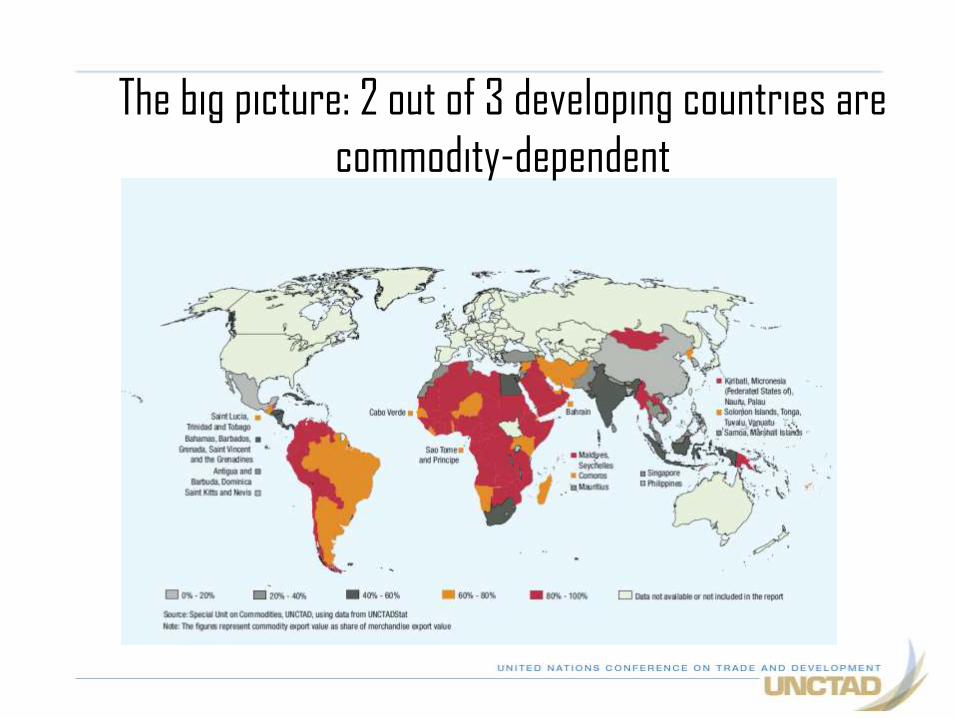
The big picture: 2 out of 3 developing countries are
commodity-dependent
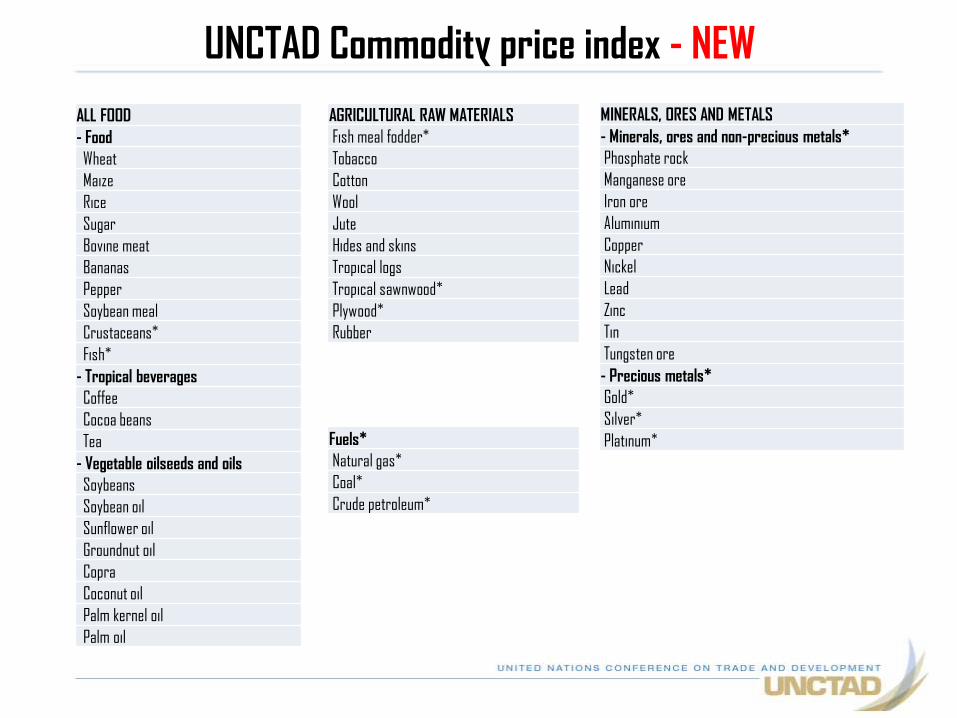
UNCTAD Commodity price index - NEW
ALL FOOD
- Food
Wheat
Maize
Rice
Sugar
Bovine meat
Bananas
Pepper
Soybean meal
Crustaceans*
Fish*
- Tropical beverages
Coffee
Cocoa beans
Tea
- Vegetable oilseeds and oils
Soybeans
Soybean oil
Sunflower oil
Groundnut oil
Copra
Coconut oil
Palm kernel oil
Palm oil
AGRICULTURAL RAW MATERIALS
Fish meal fodder*
Tobacco
Cotton
Wool
Jute
Hides and skins
Tropical logs
Tropical sawnwood*
Plywood*
Rubber
MINERALS, ORES AND METALS
- Minerals, ores and non-precious metals*
Phosphate rock
Manganese ore
Iron ore
Aluminium
Copper
Nickel
Lead
Zinc
Tin
Tungsten ore
- Precious metals*
Gold*
Silver*
Platinum*Fuels*
Natural gas*
Coal*
Crude petroleum*
Price trends….
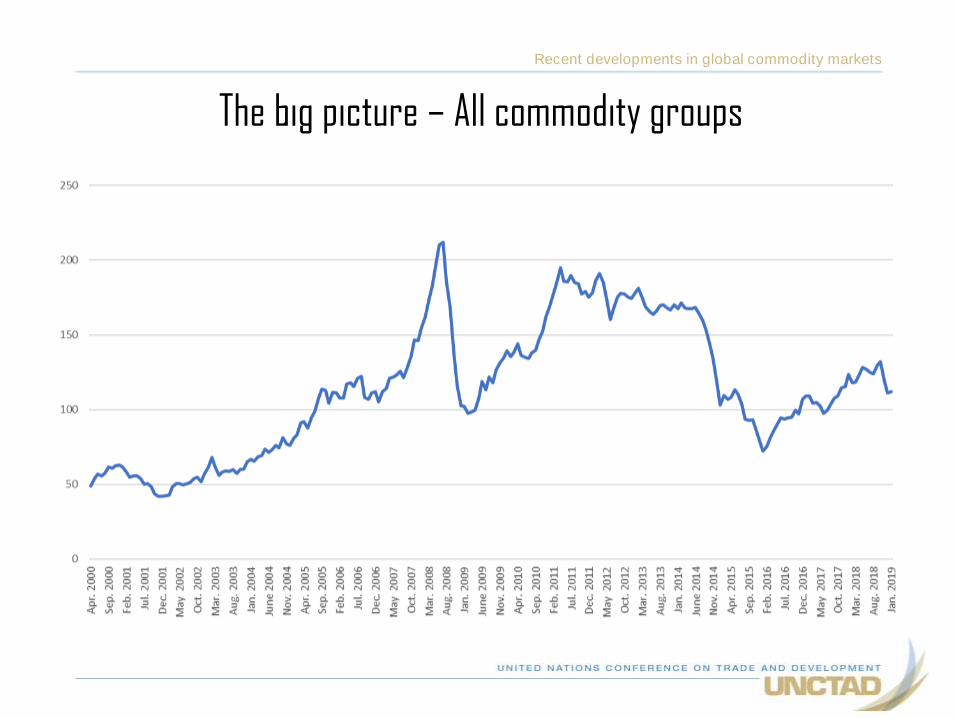
The big picture – All commodity groups
Recent developments in global commodity markets
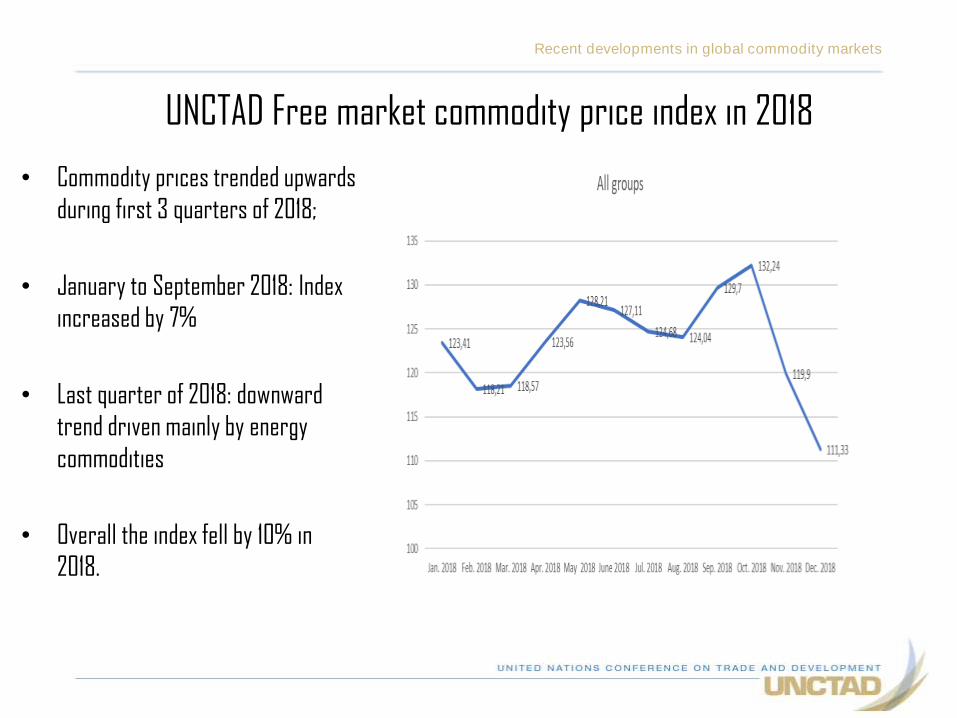
UNCTAD Free market commodity price index in 2018
• Commodity prices trended upwards
during first 3 quarters of 2018;
• January to September 2018: Index
increased by 7%
• Last quarter of 2018: downward
trend driven mainly by energy
commodities
• Overall the index fell by 10% in
2018.
Recent developments in global commodity markets
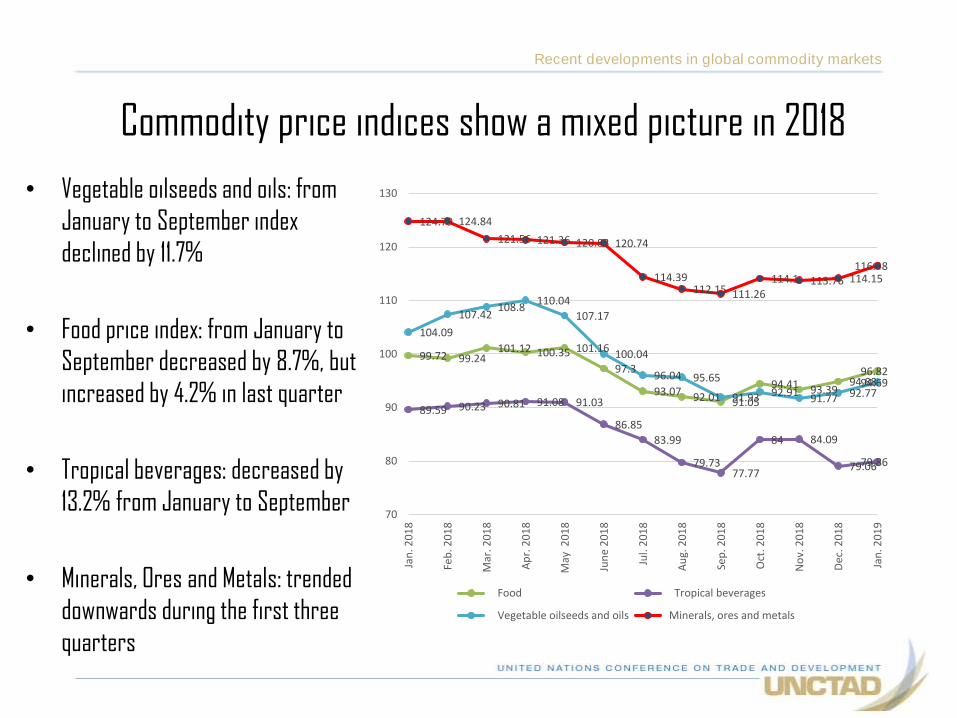
Commodity price indices show a mixed picture in 2018
• Vegetable oilseeds and oils: from
January to September index
declined by 11.7%
• Food price index: from January to
September decreased by 8.7%, but
increased by 4.2% in last quarter
• Tropical beverages: decreased by
13.2% from January to September
• Minerals, Ores and Metals: trended
downwards during the first three
quarters
Recent developments in global commodity markets
99.72 99.24101.12 100.35 101.16
97.3
93.07 92.01 91.05
94.41 93.3994.88
96.82
89.59 90.23 90.81 91.08 91.03
86.85
83.99
79.7377.77
84 84.09
79.0679.86
104.09
107.42108.8
110.04
107.17
100.04
96.04 95.65
91.93 92.9191.77 92.77
94.69
124.79 124.84
121.56 121.36 120.83 120.74
114.39112.15 111.26
114.1 113.76 114.15116.48
70
80
90
100
110
120
130
Jan
. 20
18
Feb
. 20
18
Mar
. 20
18
Ap
r. 2
01
8
May
20
18
Jun
e 2
01
8
Jul.
20
18
Au
g. 2
01
8
Sep
. 20
18
Oct
. 20
18
No
v. 2
01
8
Dec
. 20
18
Jan
. 20
19
Food Tropical beverages
Vegetable oilseeds and oils Minerals, ores and metals
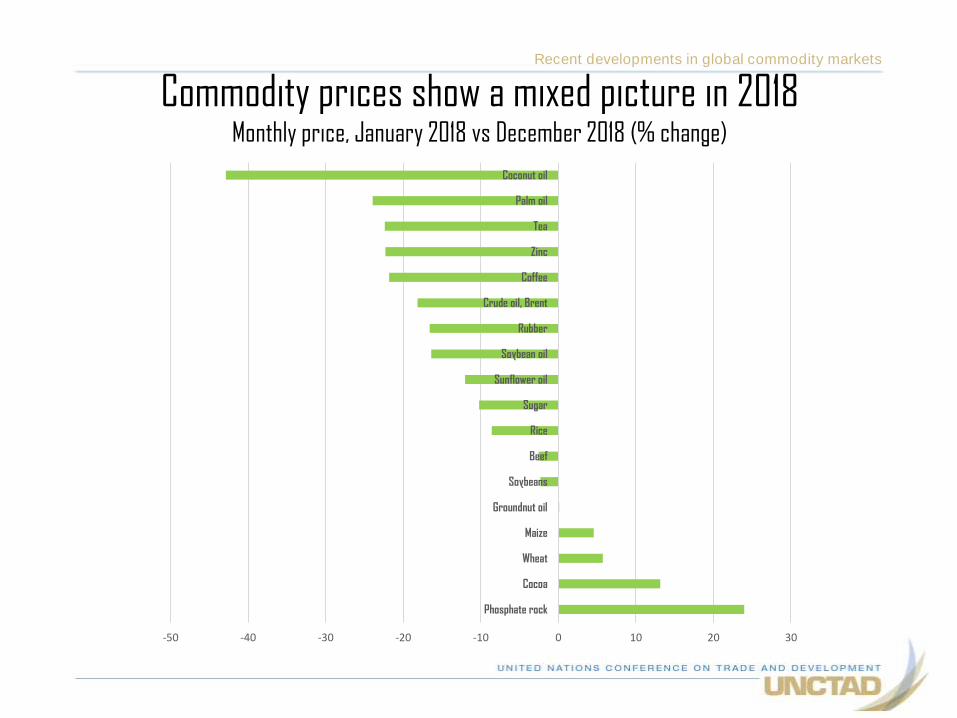
Commodity prices show a mixed picture in 2018Monthly price, January 2018 vs December 2018 (% change)
Recent developments in global commodity markets
-50 -40 -30 -20 -10 0 10 20 30
Phosphate rock
Cocoa
Wheat
Maize
Groundnut oil
Soybeans
Beef
Rice
Sugar
Sunflower oil
Soybean oil
Rubber
Crude oil, Brent
Coffee
Zinc
Tea
Palm oil
Coconut oil
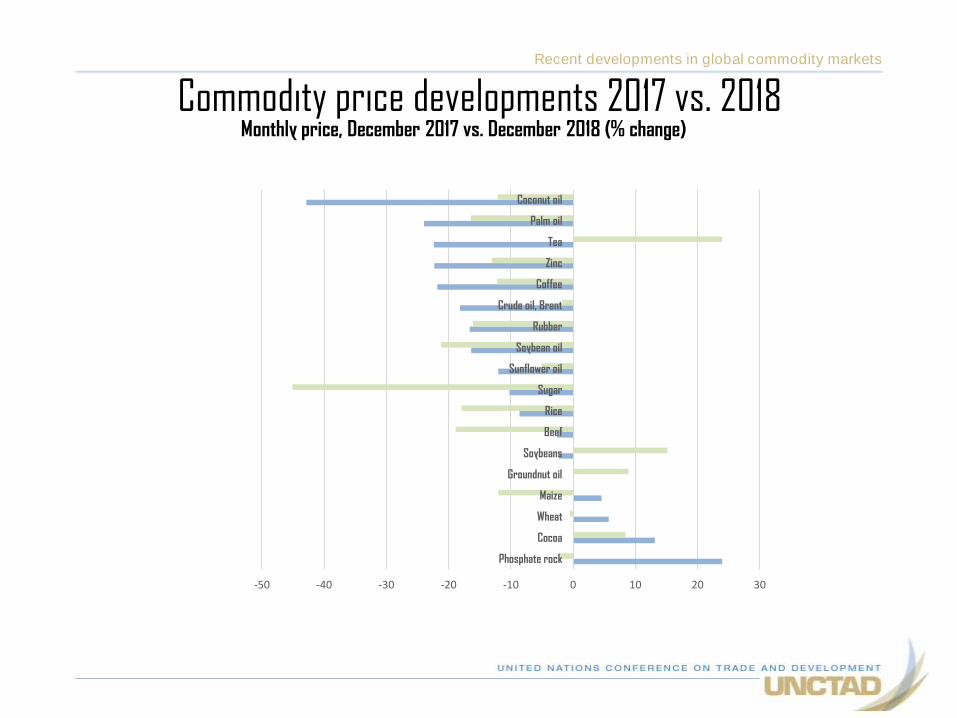
Commodity price developments 2017 vs. 2018Monthly price, December 2017 vs. December 2018 (% change)
Recent developments in global commodity markets
-50 -40 -30 -20 -10 0 10 20 30
Phosphate rock
Cocoa
Wheat
Maize
Groundnut oil
Soybeans
Beef
Rice
Sugar
Sunflower oil
Soybean oil
Rubber
Crude oil, Brent
Coffee
Zinc
Tea
Palm oil
Coconut oil
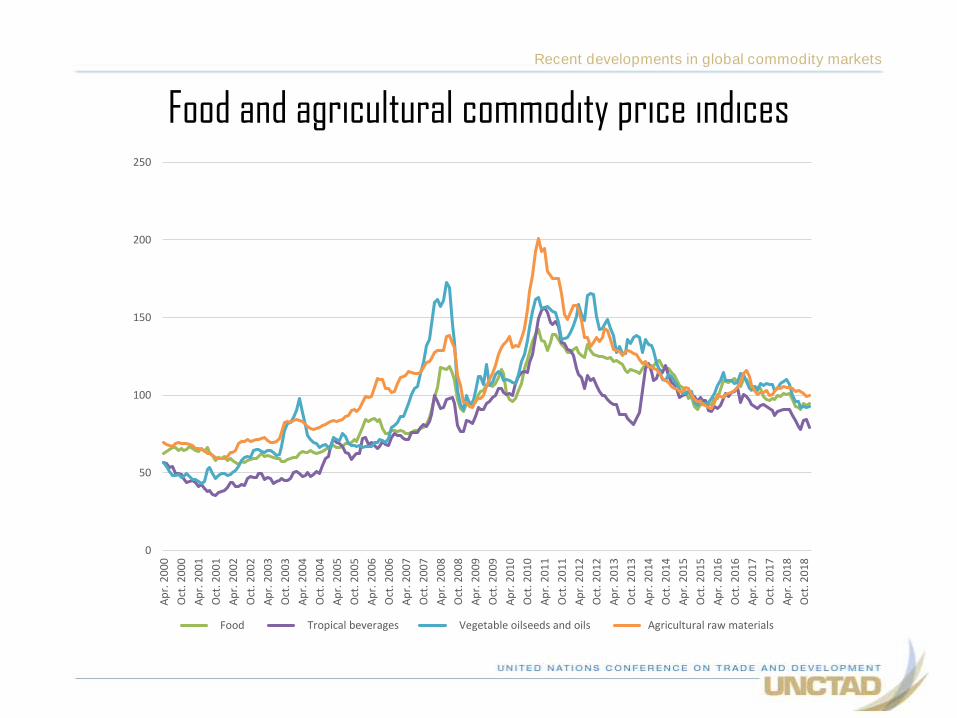
Food and agricultural commodity price indices
Recent developments in global commodity markets
0
50
100
150
200
250A
pr.
20
00
Oct
. 20
00
Ap
r. 2
00
1
Oct
. 20
01
Ap
r. 2
00
2
Oct
. 20
02
Ap
r. 2
00
3
Oct
. 20
03
Ap
r. 2
00
4
Oct
. 20
04
Ap
r. 2
00
5
Oct
. 20
05
Ap
r. 2
00
6
Oct
. 20
06
Ap
r. 2
00
7
Oct
. 20
07
Ap
r. 2
00
8
Oct
. 20
08
Ap
r. 2
00
9
Oct
. 20
09
Ap
r. 2
01
0
Oct
. 20
10
Ap
r. 2
01
1
Oct
. 20
11
Ap
r. 2
01
2
Oct
. 20
12
Ap
r. 2
01
3
Oct
. 20
13
Ap
r. 2
01
4
Oct
. 20
14
Ap
r. 2
01
5
Oct
. 20
15
Ap
r. 2
01
6
Oct
. 20
16
Ap
r. 2
01
7
Oct
. 20
17
Ap
r. 2
01
8
Oct
. 20
18
Food Tropical beverages Vegetable oilseeds and oils Agricultural raw materials
Prices of most food commodities dropped in 2018
• Record output in India & Thailand exerted downward pressure on sugar prices
from January to August;
– Prices fell to 11.08 cents/lb in August 2018, the lowest since august 2015
– Prices increased in last quarter to $12.65 cents/lb due to adverse weather
• Price of rice followed a volatile downward trend largely due to fluctuating
demand.
– From January to December 2018 price fell by 8.6%; but this was a marginal rise from
previous year
– Output for 2018/19 projected higher than demand; price increase unlikely.
Recent developments in global commodity markets
Prices of most food commodities dropped in 2018 (cont’d)
• Maize:
– rising prices in first 5 months due to strong demand and adverse weather conditions in
growing regions (e.g. Argentina)
– return to favourable weather in the latter part of the year helped to stabilise prices.
• Wheat:
– prices volatile: increased from $227.3/mt in January to $245.3/mt in March due to
adverse weather and strong global demand
– fluctuated upwards and downwards until end of year to settle at $240.3/mt in December
– A tight supply outlook is forecast in 2019 likely to exerted upward pressure on prices
Vegetable Oilseeds and Oils
• Prices of all individual oilseeds and oils trended downwards in 2018 except for
groundnut oil.
– Groundnut oil (11.0%)
– Cottonseed oil (-28.4%)
– Palm kernel oil (-41.6%)
– Coconut oil (-42.8%)
– Palm oil (-23.9%)
– Soybean oil (16.3%)
– Sunflower oil (-12.0%)
• Forecast: abundant supply for major oilseeds, so prices likely to remain low.
Recent developments in global commodity markets
Tropical beverages• Tea:
– price declined from $2.95/kg in January to $2.29/kg in December
– favourable weather conditions in growing regions boosted production
• Cocoa:
– price increased from 88.5 cents/lb in January to 120.7 cents/lb in May
– then downwards trend until October before rising slightly to end the year at 100.2 cents/lb
– high prices driven by production levels falling in Côte d’Ivoire and Ghana.
– Negative price developments fuelled by improved weather conditions and higher arrivals at ports of the cocoa-producing regions
• Coffee:
– composite price indicator trended downwards
– largely due to increased harvests for all coffee groups
– Forecasts of healthy production for 2018/19 driven largely by recovery in Brazil
Recent developments in global commodity markets
Agricultural raw materials
• Rubber:
– prices increased from 172.2 cents/kg in January to $175.8 in March
– Mainly due to agreement by major producers to reduce exports by 350,000 metric tons
– prices returned to a downward trend after agreement elapsed; ended the year down by 17%
– Demand growth expected to outpace production increases, hence mild price increases
expected
• Cotton:
– prices flat in 2018, fluctuating within a band of $2.01/kg in January to $1.90/kg in
December
– consumption forecast to outpace production in 2018/19 but prices expected to remain
stable due to high stocks
Recent developments in global commodity markets
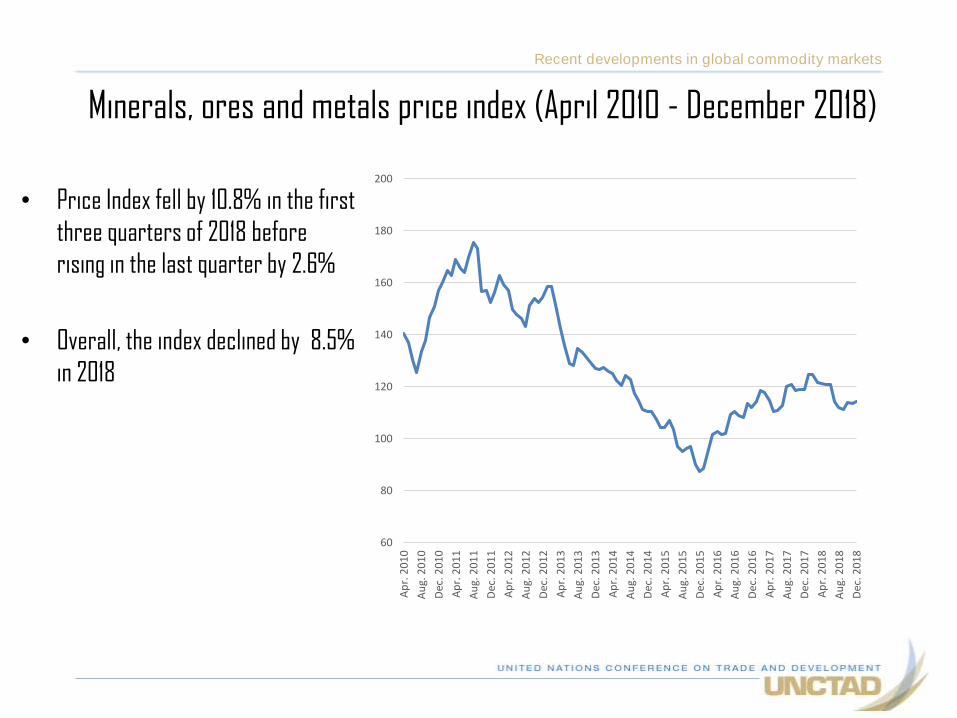
Minerals, ores and metals price index (April 2010 - December 2018)
• Price Index fell by 10.8% in the first
three quarters of 2018 before
rising in the last quarter by 2.6%
• Overall, the index declined by 8.5%
in 2018
Recent developments in global commodity markets
60
80
100
120
140
160
180
200
Ap
r. 2
01
0
Au
g. 2
01
0
Dec
. 20
10
Ap
r. 2
01
1
Au
g. 2
01
1
Dec
. 20
11
Ap
r. 2
01
2
Au
g. 2
01
2
Dec
. 20
12
Ap
r. 2
01
3
Au
g. 2
01
3
Dec
. 20
13
Ap
r. 2
01
4
Au
g. 2
01
4
Dec
. 20
14
Ap
r. 2
01
5
Au
g. 2
01
5
Dec
. 20
15
Ap
r. 2
01
6
Au
g. 2
01
6
Dec
. 20
16
Ap
r. 2
01
7
Au
g. 2
01
7
Dec
. 20
17
Ap
r. 2
01
8
Au
g. 2
01
8
Dec
. 20
18
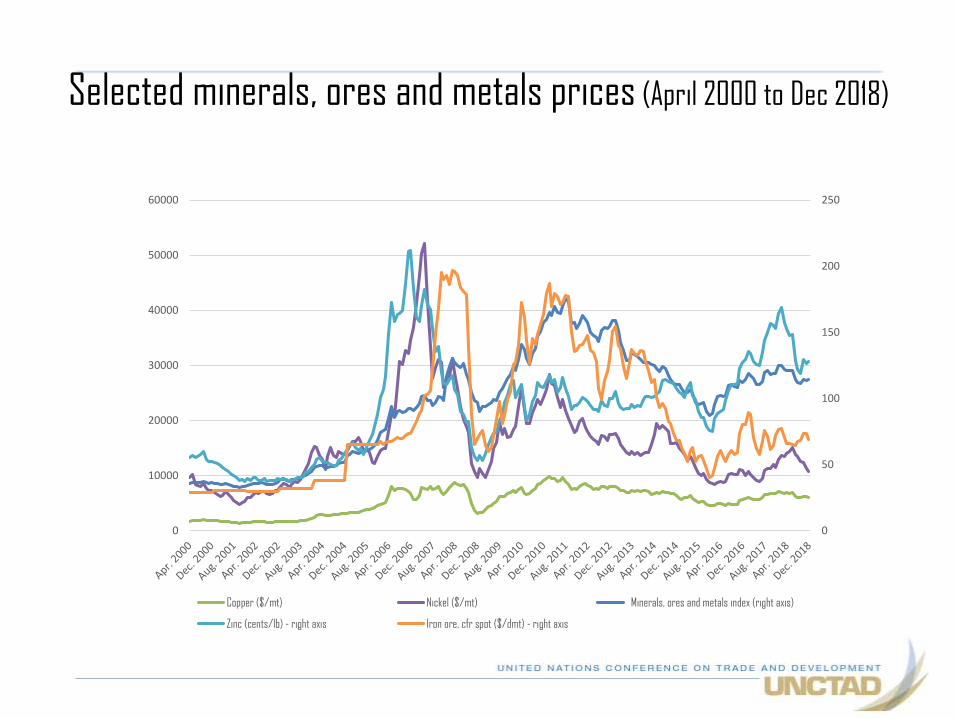
Selected minerals, ores and metals prices (April 2000 to Dec 2018)
0
50
100
150
200
250
0
10000
20000
30000
40000
50000
60000
Copper ($/mt) Nickel ($/mt) Minerals, ores and metals index (right axis)
Zinc (cents/lb) - right axis Iron ore, cfr spot ($/dmt) - right axis
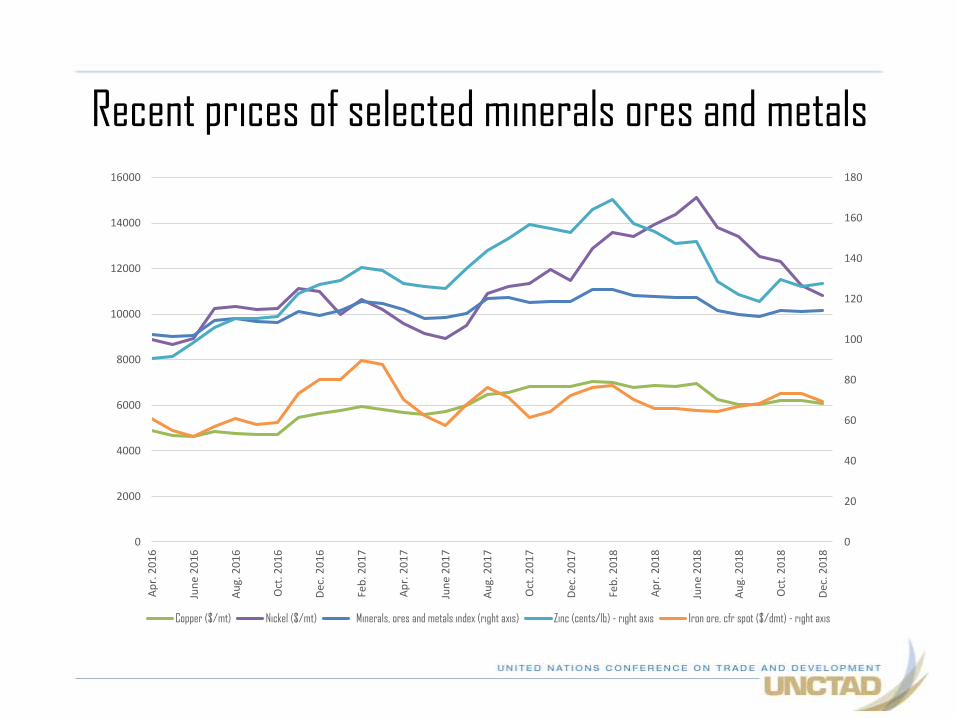
Recent prices of selected minerals ores and metals
0
20
40
60
80
100
120
140
160
180
0
2000
4000
6000
8000
10000
12000
14000
16000
Ap
r. 2
01
6
Jun
e 2
01
6
Au
g. 2
01
6
Oct
. 20
16
Dec
. 20
16
Feb
. 20
17
Ap
r. 2
01
7
Jun
e 2
01
7
Au
g. 2
01
7
Oct
. 20
17
Dec
. 20
17
Feb
. 20
18
Ap
r. 2
01
8
Jun
e 2
01
8
Au
g. 2
01
8
Oct
. 20
18
Dec
. 20
18
Copper ($/mt) Nickel ($/mt) Minerals, ores and metals index (right axis) Zinc (cents/lb) - right axis Iron ore, cfr spot ($/dmt) - right axis
Minerals, ores and metals
• Nickel: price dropped by 15.8% between June and December 2018– Supply chain disruptions due to growing concerns about trade tensions between
US and China
– Consumption forecast to exceed production in 2019 leading to stock reduction
• Iron ore: volatile fluctuating between $76.3 and $64.6/dmt. Why?– concerns over oversupply led to price drop of 9.1% from January to December
– prices expected to remain low due to favorable supply conditions
Recent developments in global commodity markets
Minerals, ores and metals (cont’d)
• Copper: price declined by 14% from January to December 2018
– driven in part by trade tensions between US and China and resulting in a larger
market surplus
– rising future demand likely to tighten market and exert upward pressure on prices
• Zinc prices dropped by 22.3%
– largely due to oversupply and rising inventories
– prices forecast to remain flat in 2019 due to tightening fundamentals
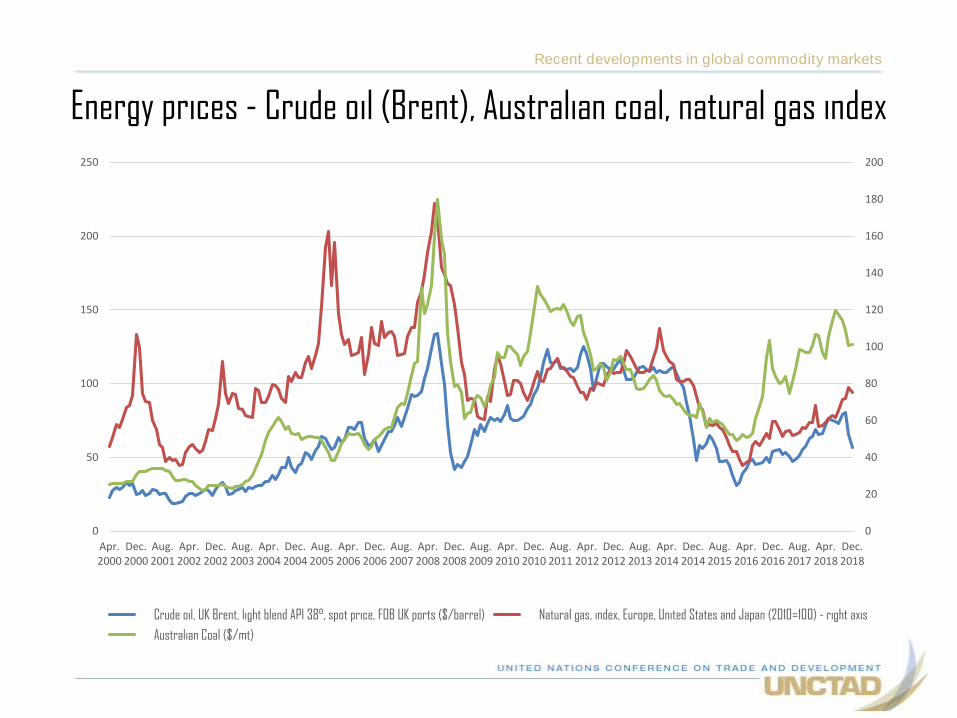
Energy prices - Crude oil (Brent), Australian coal, natural gas index
Recent developments in global commodity markets
0
20
40
60
80
100
120
140
160
180
200
0
50
100
150
200
250
Apr.2000
Dec.2000
Aug.2001
Apr.2002
Dec.2002
Aug.2003
Apr.2004
Dec.2004
Aug.2005
Apr.2006
Dec.2006
Aug.2007
Apr.2008
Dec.2008
Aug.2009
Apr.2010
Dec.2010
Aug.2011
Apr.2012
Dec.2012
Aug.2013
Apr.2014
Dec.2014
Aug.2015
Apr.2016
Dec.2016
Aug.2017
Apr.2018
Dec.2018
Crude oil, UK Brent, light blend API 38°, spot price, FOB UK ports ($/barrel) Natural gas, index, Europe, United States and Japan (2010=100) - right axis
Australian Coal ($/mt)
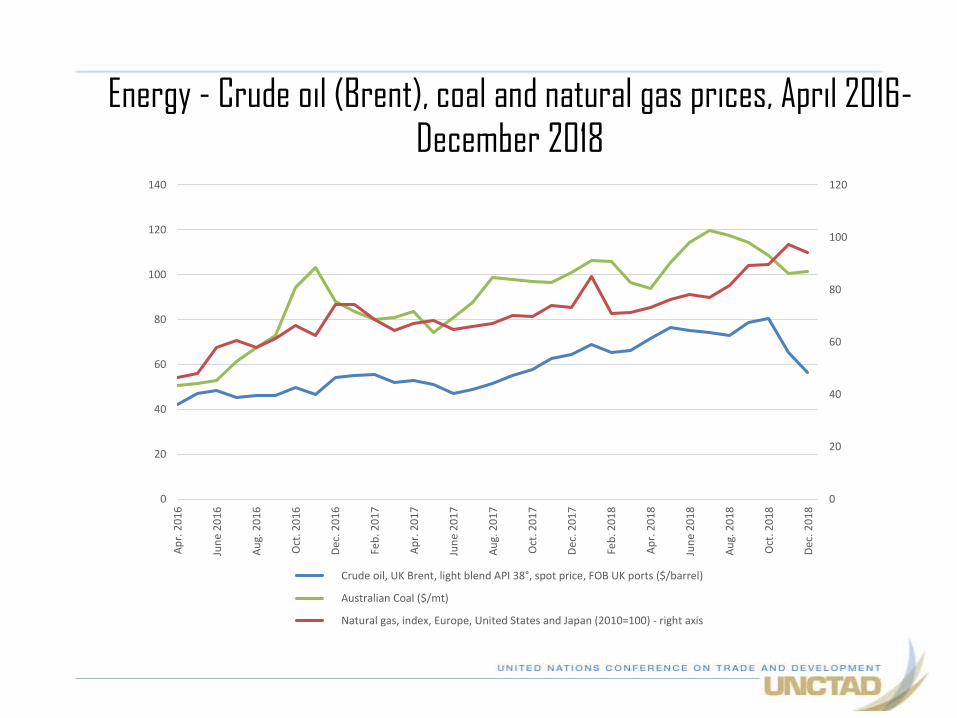
Energy - Crude oil (Brent), coal and natural gas prices, April 2016-December 2018
0
20
40
60
80
100
120
0
20
40
60
80
100
120
140A
pr.
20
16
Jun
e 2
01
6
Au
g. 2
01
6
Oct
. 20
16
Dec
. 20
16
Feb
. 20
17
Ap
r. 2
01
7
Jun
e 2
01
7
Au
g. 2
01
7
Oct
. 20
17
Dec
. 20
17
Feb
. 20
18
Ap
r. 2
01
8
Jun
e 2
01
8
Au
g. 2
01
8
Oct
. 20
18
Dec
. 20
18
Crude oil, UK Brent, light blend API 38°, spot price, FOB UK ports ($/barrel)
Australian Coal ($/mt)
Natural gas, index, Europe, United States and Japan (2010=100) - right axis
Crude oil
• Volatility in crude oil markets continued in 2018:– Relaxation of constraints on crude oil production by OPEC+ helped to cool down prices
between June and August 2018
– supply concerns from the Middle East and Venezuela exerted upward pressure on prices
(currently back at $70 per barrel)
– Price rose by 16.6% from January to peak at $80.5 $/bbl in October due to tightening
market, but fell to $56.5 in December as OPEC+ raised production
– The forecast is that prices will stabilize in 2019 due to greater production constraints
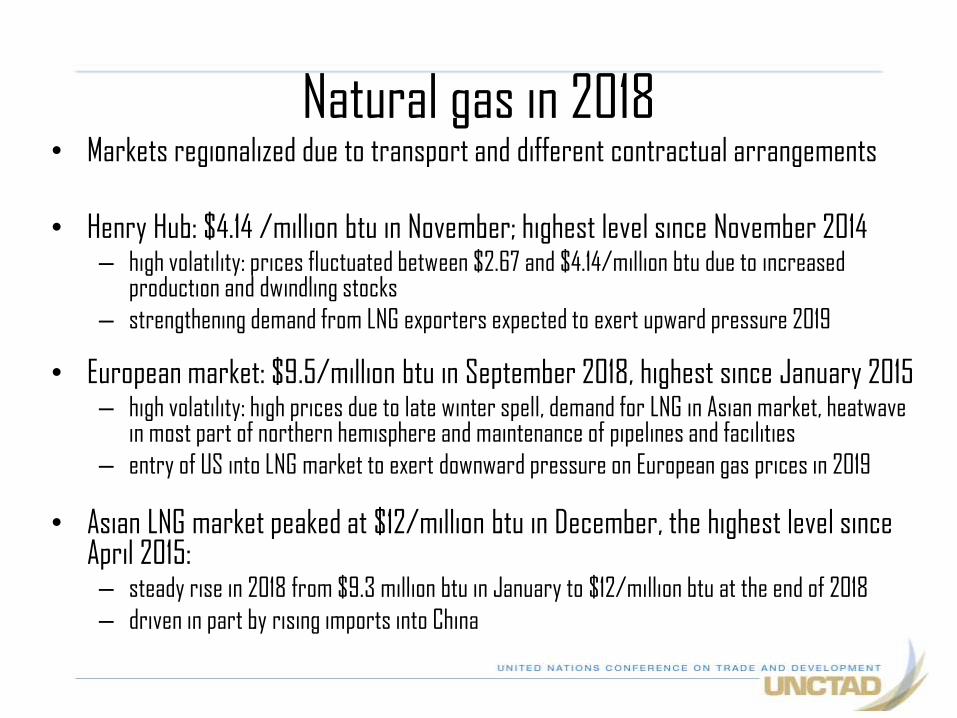
Natural gas in 2018• Markets regionalized due to transport and different contractual arrangements
• Henry Hub: $4.14 /million btu in November; highest level since November 2014– high volatility: prices fluctuated between $2.67 and $4.14/million btu due to increased
production and dwindling stocks
– strengthening demand from LNG exporters expected to exert upward pressure 2019
• European market: $9.5/million btu in September 2018, highest since January 2015– high volatility: high prices due to late winter spell, demand for LNG in Asian market, heatwave
in most part of northern hemisphere and maintenance of pipelines and facilities
– entry of US into LNG market to exert downward pressure on European gas prices in 2019
• Asian LNG market peaked at $12/million btu in December, the highest level since April 2015:– steady rise in 2018 from $9.3 million btu in January to $12/million btu at the end of 2018
– driven in part by rising imports into China
Coal• Coal primary fuel for electricity generation:
– use in power stations accounted for third of global energy related CO2 emissions in 2018
– demand declining in Europe and North America but growing across much of Asia due to its
affordability and availability, thus offsetting declines in other regions.
– Global demand expected to rise for second consecutive year in 2018
• Coal prices volatile in 2018:
– rose from $106.5 per metric ton in January to $119.6 in July but down to $101.3 in
December
– increase driven by robust demand form utilities in Asia, particularly China for industrial
and residential cooling
• 2019: higher growth in production than consumption; downward pressure on
prices
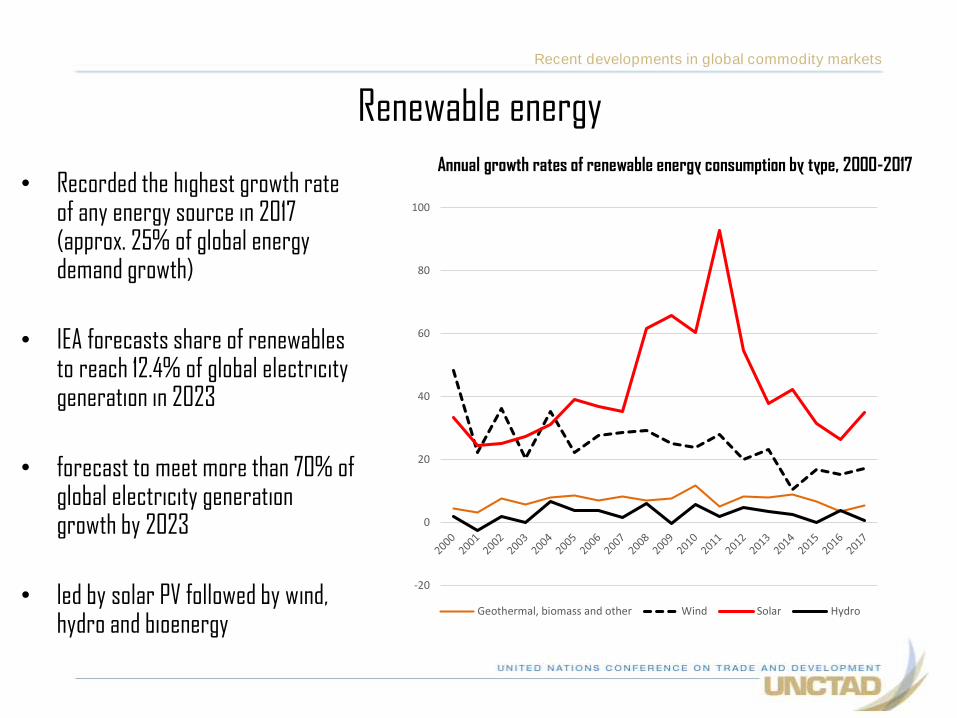
Renewable energyAnnual growth rates of renewable energy consumption by type, 2000-2017
• Recorded the highest growth rate of any energy source in 2017 (approx. 25% of global energy demand growth)
• IEA forecasts share of renewables to reach 12.4% of global electricity generation in 2023
• forecast to meet more than 70% of global electricity generation growth by 2023
• led by solar PV followed by wind, hydro and bioenergy
Recent developments in global commodity markets
-20
0
20
40
60
80
100
Geothermal, biomass and other Wind Solar Hydro

Conclusion….
Summary and outlook
• The general trend showed commodity prices falling in 2018
• Energy prices increased until late in the year; coal consumption rising in Asia
• Renewable energy growth continues dominated by solar and wind; but the growth rate has slowed relative to its peak level in 2011
• Continuing trade tensions between US and China likely to dampen prices of metals in 2019
Recent developments in global commodity markets