UNITED NATIONS - Climate changeunfccc.int/resource/docs/2002/sbi/16.pdf · The United Nations...
45
GE.02-64222 UNITED NATIONS Distr. GENERAL FCCC/SBI/2002/16 1 October 2002 ENGLISH ONLY SUBSIDIARY BODY FOR IMPLEMENTATION Seventeenth session New Delhi, 23–29 October 2002 Item 4 (a) of the provisional agenda NATIONAL COMMUNICATIONS FROM PARTIES NOT INCLUDED IN ANNEX I TO THE CONVENTION CONSIDERATION OF THE FOURTH COMPILATION AND SYNTHESIS OF INITIAL NATIONAL COMMUNICATIONS Fourth compilation and synthesis of initial national communications from Parties not included in Annex I to the Convention Note by the secretariat * CONTENTS Paragraphs Page Explanatory note............................................................................................... 4 I. INTRODUCTION ............................................................................... 1–6 5 II. NATIONAL CIRCUMSTANCES ...................................................... 7 – 22 5 III. SUSTAINABLE DEVELOPMENT AND THE INTEGRATION OF CLIMATE CHANGE CONCERNS INTO MEDIUM- AND LONG-TERM PLANNING ................................................................ 23 – 29 8 * This document is submitted after the due date because all the necessary information was not available on time.
Transcript of UNITED NATIONS - Climate changeunfccc.int/resource/docs/2002/sbi/16.pdf · The United Nations...

GE.02-64222
UNITEDNATIONS
Distr.GENERAL
FCCC/SBI/2002/161 October 2002
ENGLISH ONLY
SUBSIDIARY BODY FOR IMPLEMENTATIONSeventeenth sessionNew Delhi, 23–29 October 2002Item 4 (a) of the provisional agenda
NATIONAL COMMUNICATIONS FROM PARTIES NOT INCLUDED INANNEX I TO THE CONVENTION
CONSIDERATION OF THE FOURTH COMPILATION AND SYNTHESIS OFINITIAL NATIONAL COMMUNICATIONS
Fourth compilation and synthesis of initial national communications from Partiesnot included in Annex I to the Convention
Note by the secretariat*
CONTENTS
Paragraphs Page
Explanatory note............................................................................................... 4
I. INTRODUCTION ............................................................................... 1 – 6 5
II. NATIONAL CIRCUMSTANCES ...................................................... 7 – 22 5
III. SUSTAINABLE DEVELOPMENT AND THE INTEGRATIONOF CLIMATE CHANGE CONCERNS INTO MEDIUM- ANDLONG-TERM PLANNING ................................................................ 23 – 29 8
* This document is submitted after the due date because all the necessary information was not available on time.

FCCC/SBI/2002/16Page 2
Paragraphs Page
IV. INVENTORIES OF ANTHROPOGENIC EMISSIONS ANDREMOVALS OF GREENHOUSE GASES........................................ 30 – 64 9
A. Methodological issues ............................................................ 31 – 51 9
B. Presentation of results ............................................................ 52 – 60 12
C. Current trends ......................................................................... 61 – 64 14
V. MEASURES CONTRIBUTING TO ADDRESSING CLIMATECHANGE............................................................................................. 65 – 93 15
A. Energy..................................................................................... 69 – 75 15
B. Agriculture and livestock ....................................................... 76 – 79 16
C. Waste management................................................................. 80 – 83 17
D. Land-use change and forestry................................................. 84 – 88 17
E. Projects ................................................................................... 89 – 93 18
VI. RESEARCH AND SYSTEMATIC OBSERVATION........................ 94 – 112 18
A. Research ................................................................................. 96 – 104 19
B. Systematic observation........................................................... 105 – 112 20
VII. CLIMATE CHANGE IMPACTS, VULNERABILITY,ADAPTATION AND RESPONSE STRATEGIES............................ 113 – 137 21
A. Methods and approaches ........................................................ 114 – 133 22
B. Adaptation measures and response strategies ........................ 134 – 137 25
VIII. EDUCATION, TRAINING AND PUBLIC AWARENESS............... 138 – 155 25
A. Education................................................................................ 140 – 142 26
B. Training .................................................................................. 143 – 150 26
C. Public awareness .................................................................... 151 – 155 27
IX. FINANCIAL AND TECHNOLOGICAL NEEDS ANDCONSTRAINTS.................................................................................. 156 – 182 27
A. General financial, technological and capacity-buildingneeds and constraints.............................................................. 156 – 160 27
B. National greenhouse gas inventories...................................... 161 – 164 28
C. Measures for addressing climate change................................ 165 – 167 29
D. Assessment of vulnerability to climate change ...................... 168 – 172 29
E. Measures to facilitate adaptation............................................ 173 – 176 30

FCCC/SBI/2002/16Page 3
Paragraphs Page
F. Research and systematic observation ..................................... 177 – 179 30
G. Education, training and public awareness .............................. 180 – 182 31
Tables
1. Problems encountered and areas for further improvement in respectof activity data (AD), emission factors (EF) and methods (M) byParties in the preparation of GHG inventories .................................... 32
2. Completeness of reporting according to table II of the UNFCCCguidelines............................................................................................. 39
3. Aggregate emissions and removals of CO2, CH4 and N2O in CO2
equivalent by major source/sink category, including and excludingland-use change and forestry (gigagrams and percentage of totalby Party)............................................................................................... 40
4. Ongoing or planned research programmes/activities reported onclimate change impacts, vulnerability assessment and adaptationoptions ................................................................................................. 42
5. Methods used by Parties for climate change impacts andvulnerability assessment ...................................................................... 43
6. Summary of the results of impacts and vulnerability assessment byParties, by sector.................................................................................. 45

FCCC/SBI/2002/16Page 4
Explanatory note
The following International Organization for Standardization (ISO) country codes have been usedthroughout this document:
Antigua and Barbuda ATG Mongolia MNG
Bahamas BHS Morocco MAR
Barbados BRB Nicaragua NIC
Botswana BWA Niue NIU
Burkina Faso BFA Panama PAN
Burundi BDI Papua New Guinea PNG
Chad TCD Paraguay PRY
Colombia COL Peru PER
Congo COG Saint Kitts and Nevis KNA
Cuba CUB Saint Lucia LCA
Dominica DMA Swaziland SWZ
Ethiopia ETH Togo TGO
Guatemala GTM Trinidad and Tobago TTO
Guyana GUY Tunisia TUN
Haiti HTI Yemen YEM
Maldives MDV
FCCC/SBI/2002/16Page 5
I. INTRODUCTION
1. Pursuant to Article 4, paragraph 1, and Article 12, paragraph 1, of the Convention, all Parties tothe Convention shall communicate information to the Conference of the Parties (COP). This provisionapplies to Parties that are not included in Annex I to the Convention, referred to as non-Annex I Parties.Article 12, paragraph 5, specifies that each non-Annex I Party shall make its initial communicationwithin three years of the entry into force of the Convention for that Party, or of the availability offinancial resources in accordance with Article 4, paragraph 3. Parties that are least developed countriesmay make their initial communication at their discretion.
2. By its decision 30/CP.7, the COP requested the secretariat to prepare the fourth compilation andsynthesis of initial national communications non-Annex I Parties, based on submissions received fromsuch Parties between 1 June 2001 and 1 June 2002, and to make that report available to the subsidiarybodies for consideration by the COP at its eighth session.
3. The fourth compilation and synthesis of initial national communications from non-Annex IParties covers 31 Parties which submitted their initial communications during the time period indicatedabove. It includes information on the problems and constraints encountered by non-Annex I Parties inusing the Guidelines for the preparation of initial communications by Parties not included in Annex I tothe Convention (FCCC/CP/1996/15/Add.1, decision 10/CP.2, annex) referred to below as the UNFCCCguidelines, and on other issues raised by non-Annex I Parties. The information contained in this report isstructured in accordance with the above-mentioned guidelines.
4. The secretariat noted that Parties, while using the UNFCCC guidelines, provided varying degreesof detail under the various headings and sub-headings of the guidelines. In some instances, theinformation relevant to a particular section of the guidelines was not readily accessible, due either to itsdispersion throughout the text or to an interpretation of a sub-heading which had led to its inclusionunder a different section of the communication.
5. Information provided in this document could also serve in supporting the implementation of otherCOP decisions, particularly those on other matters relating to communications from non-Annex I Parties,on capacity-building in developing countries, on the implementation of Article 4, paragraphs 8 and 9, ofthe Convention, and on technology transfer. Parties may wish to organize the information presented intheir future national communications along these lines. The secretariat will take account of the viewsexpressed by Parties on the structure of the present report and make modifications as appropriate whenpreparing subsequent compilation and synthesis reports.
6. By its decision 30/CP.7, the COP also requested the secretariat to prepare an executive summarycovering the information contained in all the initial national communications from non-Annex I Parties.The summary, which was prepared by the secretariat, includes information from the 83 initial nationalcommunications from non-Annex I Parties that had been submitted since the entry into force of theConvention and is contained in document FCCC/SBI/2002/8.
II. NATIONAL CIRCUMSTANCES
7. All reporting Parties provided information on national circumstances in a separate chapter intheir national communication with varying levels of detail. Parties also presented information relating totheir national circumstances in other thematic chapters such as inventories, vulnerability and mitigation.
8. Fifteen Parties (ATG, BHS, BRB, BWA, COG, CUB, DMA, ETH, KNA, MNG, PNG, SWZ,TCD, TUN, YEM) presented information using a summary table I as provided in the UNFCCCguidelines. This table provides an overview of 15 key socio-economic data sets, such as population size,

FCCC/SBI/2002/16Page 6
gross domestic product (GDP) and literacy rate. Some Parties provided information not only for the year1994, as requested by decision 10/CP.2, but also for other subsequent years. All Parties except one(MNG) also presented information in other general overview tables on tourist arrivals, education,demography and physical geographic characteristics (e.g. climate and weather patterns, biodiversity,drainage basins).
9. The United Nations Development Programme (UNDP) Human Development Report 2001classified two of the reporting Parties as having high human development (BHS, BRB), 15 as havingmedium human development (BWA, COG, COL, GTM, GUY, MDV, MNG, NIC, PAN, PER, PNG,PRY, SWZ, TTO, TUN) and eight as having low human development (BFA, BDI, ETH, HTI, MAR,TCD, TGO, YEM), according to their ranking in the human development index (HDI).1 Six countries(ATG, CUB, DMA, KNA, LCA, NIU) are not included in the HDI. According to the current list of leastdeveloped countries maintained by the United Nations Conference on Trade and Development(UNCTAD), eight of the Parties are also classified as least developed countries (BDI, BFA, ETH, HTI,MDV, TCD, TGO, YEM).
Physical geography
10. All Parties presented information on the physical geography of their countries. This includedinformation on the size and location of the countries and climate. All but one Party reported on thegeomorphologic characteristics of their territories. Many Parties provided information on physical andnatural characteristics, such as hydrology (22 Parties), biodiversity (14 Parties), ecosystems (14 Parties),coastal zones (nine Parties), and soils (six Parties). Many Parties also provided detailed information onclimatic variables, such as rainfall (29 Parties), temperature (25 Parties), humidity (13 Parties), solarradiation (four Parties), and wind (nine Parties).
11. The reported land area of each reporting Party varied from 259 km2 for Niue to over1.5 million km2 for Mongolia. Seven Parties (ATG, BRB, DMA, KNA, LCA, MDV, NIU) reported aland area of less than 1,000 km2.
12. Most Parties also highlighted specific aspects of their climatic circumstances including, interalia, exposure to extreme weather events. For example, 14 Parties reported on (severe) tropical cyclones(ATG, BHS, BRB, CUB, DMA, HTI, KNA, LCA, MDV, NIC, NIU, PNG, SWZ, TUN), 11 Parties(ATG, BHS, BWA, COL, CUB, GUY, MNG, PAN, PNG, PER, TTO) on the effects of the El NiñoSouthern Oscillation (ENSO) phenomenon, seven Parties on droughts (COG, MNG, NIC, PNG, PER,SWZ, TTO) and two Parties (COG, NIC) on flooding. Ten Parties (BWA, BFA, CUB, GTM, MNG,PER, SWZ, TCD, TUN, YEM) indicated that their territories contained arid and semi-arid regions.
13. Twenty-three Parties reported that their territories contained mountainous regions and five ofthem (ATG, DMA, LCA, NIC, PAN) also reported having active volcanoes. Nine Parties (ATG, BHS,BRB, DMA, KNA, LCA, MDV, NIU, TTO) described themselves as being small island States. SixParties (ATG, BHS, GUY, MDV, PAN, TTO) stated that their relief included low-lying coastal areas.Five Parties reported that they were landlocked countries and two Parties (PAN, SWZ) highlighted thefact that they were transit countries. Twenty Parties provided information on forested areas. FifteenParties stressed that deforestation was an important problem for them.
1 The human development index is based on three development indicators: (i) a long and healthy life, as measuredby life-expectancy at birth; (ii) knowledge, as measured by the adult literacy rate (two-thirds weight) and thecombined primary, secondary and tertiary gross enrollment ratio (one-third weight); and (iii) a decent standard ofliving, as measured by gross domestic product per capita (purchasing power parity in US dollars).
FCCC/SBI/2002/16Page 7
Economic circumstance
14. All Parties included information on their economic circumstances. Two topics were addressedby all Parties in this regard: agriculture and fisheries, and services. All but two Parties also reported onthe manufacturing industry. Other topics addressed by a majority of Parties were energy, transport,forestry, mining and tourism.
Primary sector (agriculture, mining, energy)
15. The primary sector was reportedly the largest sector for six Parties (BFA, BDI, ETH, GUY,MNG, NIC). The contribution of the primary sector to GDP for all reporting Parties ranged from 4 percent (BHS) to 43 per cent (TCD). Eleven Parties (BDI, BFA, CUB, ETH, GUY, MAR, MDV, MNG,NIC, TCD, TGO) stressed that the development of the agriculture sector was a priority for them. EightParties (BDI, BHS, BWA, COG, ETH, NIU, TTO, YEM) mentioned that subsistence agriculture wastheir main form of agricultural activity. Eight Parties (BWA, BDI, COL, MAR, PER, PNG, TCD, TGO)indicated that mining was an important sector of their national economy.
16. All reporting Parties provided information on the energy sector. Estimated reserves of fossilfuels and/or non-fossil fuel energy sources were presented by 12 Parties (BDI, BRB, BWA, COL, ETH,MNG, NIC, PER, TCD, TGO, TTO, YEM). The same number of Parties (ATG, BHS, BWA, DMA,KNA, LCA, MAR, MDV, MNG, NIC, NIU, TCD) stressed that they were highly dependent on fossilfuel imports, while two Parties (TTO, YEM) indicated that they were highly dependent on fossil fuelexports. Eleven Parties (ATG, BDI, BHS, BRB, BWA, COL, CUB, MDV, NIU, TTO, TUN) providedinformation on the trend in the energy mix used in their countries and described their initiatives to moveaway from high carbon content fuels such as oil to natural gas and renewable energy sources. ThirteenParties (COG, CUB, LCA, MAR, MDV, MNG, NIC, PER, TCD, TGO, TTO, TUN, YEM) indicated thatfavourable circumstances existed for future exploitation of renewable energy resources, and seven Parties(BDI, COL, ETH, GUY, PAN, PER, PRY) reported on the existence of significant potential forhydroelectric power generation in their countries.
Secondary sector (manufacturing industry)
17. Twenty-two Parties indicated the percentage share of their industrial sector in GDP. Only threeParties (COG, MAR, PNG) reported that the secondary sector contributed the largest share to their GDP.
Tertiary sector (services)
18. The tertiary sector contributed the largest share to the GDP of 14 Parties (ATG, BRB, COL,CUB, DMA, GTM, KNA, PER, PRY, SWZ, TGO, TTO, TUN, YEM), the share ranging from 10.5 percent for Mongolia to 87.2 per cent for Barbados.
19. Nineteen Parties included separate sections on tertiary sector activities. Twenty-three Partiesprovided information on their transport sector. Nine Parties (ATG, BWA, BHS, BRB, DMA, LCA,MAR, MDV, NIU) highlighted tourism as a particularly important economic sector.
Social and demographic circumstances
20. In the description of their social and demographic circumstances, all Parties included apopulation profile. A majority of Parties also reported on the distribution of their population, literacyrates, political system, human health and education and/or research.
21. Population size varied widely between Parties, from less than 3,000 (NIU) to more than53 million people (ETH). Ten Parties (ATG, BHS, BRB, DMA, GUY, KNA, LCA, MDV, NIU, SWZ)

FCCC/SBI/2002/16Page 8
reported having a population of less than one million. All 31 Parties together represented a population ofnearly 250 million.
22. The literacy rate varied from 13 per cent (TCD) to 100 per cent (CUB) and the average literacyrate for all reporting Parties was 70 per cent. The share of urban population ranged from below 8 percent for Burundi to more than 75 per cent for Cuba. The average share of urban population for allreporting Parties was below 50 per cent. Ten Parties (BHS, COG, COL, CUB, MAR, MNG, NIC, PER,PRY, TUN) indicated that 50per cent or more of their population resided in urban areas.
III. SUSTAINABLE DEVELOPMENT AND THE INTEGRATION OF CLIMATE CHANGECONCERNS INTO MEDIUM- AND LONG-TERM PLANNING
23. All Parties provided information on their plans for sustainable development and the integrationof climate change concerns into medium- and long-term planning. In general, information provided onthis issue was very limited and was not specific enough to enable identification of concrete sustainabledevelopment activities. Thirteen Parties dedicated a separate section of their communication tosustainable development concerns, while 14 included a section on national planning, and others providedinformation on these issues within the context of other thematic chapters of the national communications.
24. Twenty-five Parties (ATG, BDI, BHS, BRB, BWA, BFA, COL, CUB, DMA, ETH, GUY, KNA,LCA, MAR, MDV, NIU, PAN, PER, PNG, PRY, SWZ, TCD, TTO, TUN, YEM) provided informationon sustainable development and planning by describing national development or environmental plans,institutional arrangements and legislation on the environment and/or development. The reported areas ofactivity included, inter alia, integrated coastal zone management, environmental impact assessment, fightagainst air and noise pollution, rational use of natural resources and waste management. Sixteen Parties(ATG, BHS, COL, CUB, DMA, ETH, GUY, KNA, LCA, MAR, MDV, MNG, NIU, TCD, TGO, TUN)emphasized the need to ensure an integrated approach in dealing with environmental, social andeconomic issues.
25. Fifteen Parties (ATG, BHS, BWA, COL, GTM, GUY, MAR, MNG, NIC, PAN, PRY, PER,TGO, TTO, TUN) mentioned the creation of committees on sustainable development and/or globalchange. Few Parties reported on concrete activities or priorities in relation to the implementation ofAgenda 21.
26. Fourteen Parties (BDI, COG, COL, DMA, ETH, GUY, KNA, LCA, MNG, NIU, PRY, PER,TGO, TUN) indicated that they were in the process of formulating or had already formulatedcomprehensive national climate change plans and/or policy frameworks to coordinate and facilitate theimplementation of the UNFCCC. Many Parties indicated that climate change concerns would be takeninto account in future social, economic and environmental policies at the national level.
27. Most Parties mentioned the creation of specific institutional frameworks dedicated to climatechange activities. Much of the information on institutional frameworks was related to the establishmentof national climate change committees, which involved government institutions, the private sector andnon-governmental organizations. Twenty Parties (BDI, BFA, BHS, BWA, CUB, DMA, ETH, GTM,GUY, KNA, LCA, MAR, MNG, NIC, PAN, PER, PRY, TCD, TUN, YEM) described the institutionalstructures set up to implement the Convention. Many Parties described very broadly the institutionalstrengthening initiatives necessary for effective implementation of climate change activities. ManyParties also expressed the need for improved capacity to identify national priorities and develop sectoralstrategies and measures to address climate change.
28. Many Parties provided information on efforts to coordinate climate change activities. SomeParties stressed the importance of the role of national UNFCCC focal points or designated national
FCCC/SBI/2002/16Page 9
authorities in coordinating various climate change activities. Several reporting Parties described specificcoordination activities such as meetings, workshops and the development of databases.
29. Some Parties identified the lack of appropriate legislation as an obstacle to the integration ofclimate change issues into national planning, and therefore stressed the need for developing andenforcing the required legislation. Some Parties reported on existing and/or planned environmentallegislation and/or strategies in various areas including, inter alia, forestry, clean air and the energysectors.
IV. INVENTORIES OF ANTHROPOGENIC EMISSIONS AND REMOVALS OFGREENHOUSE GASES
30. In accordance with Article 4, paragraph 1(a), and Article 12, paragraph 1(a), of the Convention,the Parties provided information on their national inventory of anthropogenic emissions by sources andremoval by sinks of greenhouse gases (GHGs) not controlled by the Montreal Protocol. This section ofthe report covers inventory information and methodological and analytical issues and problems identifiedby the 31 non-Annex I Parties which have submitted their national communications.
A. Methodological issues
31. Most Parties followed the UNFCCC guidelines and took into account relevant conclusions of theSubsidiary Body for Scientific and Technological Advice (SBSTA), which encouraged Parties to applythe Revised 1996 Intergovernmental Panel on Climate Change (IPCC) Guidelines for NationalGreenhouse Gas Inventories (FCCC/SBSTA/1996/20, paras. 30(b) and 31).
Methods and gases
32. All Parties followed the IPCC Guidelines2 in compiling their national GHG inventories.Twenty-nine of them used the Revised 1996 IPCC Guidelines, and two Parties (HTI, TCD) used, inaddition, the 1995 IPCC Guidelines.
33. Eighteen Parties (BDI, BFA, BHS, BRB, BWA, COL, CUB, DMA, GTM, GUY, LCA, MAR,MNG, NIU, PAN, PER, TCD, TUN) reported problems relating to limitations of the current IPCCmethodologies for estimation of emissions in some sectors. The major concerns were the availability,quality, and lack of disaggregated data required to apply the IPCC methodology (see table 1). Somecountry-specific problems encountered were: lack of methods for estimating carbon sequestration bycoral reefs and calcareous algae as well as by soils and fruit trees; grassland in steppe climates and forestfires; lack of methods for estimating non-methane volatile organic compound (NMVOC) emissions fromsolid waste disposal; difficulties in calculating emissions from waste combustion; the lack of defaultvalues for sulphur dioxide (SO2) emissions from the mining and metallurgy industry; nitrogen emissionsfrom organic matter with high protein content; lack of method for calculating emissions from solvent use;and inappropriate classification of eco-climatic zones.
34. All Parties estimated emissions of carbon dioxide (CO2), methane (CH4) and nitrous oxide (N2O),with the exception of Maldives, which did not include N2O emissions. Twenty-three Parties (BDI, BFA,BRB, COG, COL, CUB, DMA, ETH, GTM, GUY, HTI, LCA, MAR, NIC, NIU, PAN, PER, PRY, SWZ,TGO, TTO, TUN, YEM) provided emission estimates for all the GHG precursors,3 while five Parties(ATG, BHS, KNA, MNG, TCD) provided estimates for some of these precursors (carbon monoxide
2 The title “IPCC Guidelines” refer to both the 1995 IPCC Guidelines for National Greenhouse Gas Inventoriesand the Revised 1996 IPCC Guidelines for National Greenhouse Gas Inventories.3 Precursors are atmospheric compounds which have an effect on greenhouse gas or aerosol concentrations bytaking part in physical or technical processes regulating the production or destruction rates.

FCCC/SBI/2002/16Page 10
(CO), nitrogen oxides (NOx), NMVOC). Three Parties (BWA, MDV, PNG) did not provide estimates ofthese gases. Five Parties (BRB, DMA, LCA, PER, SWZ) provided estimates of hydrofluorocarbons(HFCs), while the rest did not provide estimates of HFCs, perfluorocarbons (PFCs) and sulphurhexafluoride (SF6). Twenty Parties (ATG, BRB, COL, CUB, DMA, ETH, GTM, HTI, LCA, MAR, NIC,NIU, PAN, PER, PRY, SWZ, TGO, TTO, TUN, YEM) reported emission estimates of SO2.
35. Nineteen Parties (ATG, BFA, BRB, BWA, COG, COL, CUB, DMA, ETH, GTM, GUY, KNA,LCA, PAN, PER, TGO, TTO, TUN, YEM) applied both reference and sectoral approaches. Five Parties(BHS, MDV, PNG, PRY, TCD) used only the reference approach for estimating their fuel combustionemissions, while seven (BDI, HTI, MAR, MNG, NIC, NIU, SWZ) applied only the sectoral approach.Twelve Parties (ATG, BWA, COL, DMA, GTM, KNA, LCA, PER, TGO, TTO, TUN, YEM) performedthe comparison between the two approaches and reported observed differences, which ranged from lessthan 1 per cent (BWA, LCA, TUN) to 40 per cent (TTO). 4 This comparison is a useful self-verificationprocedure, which greatly improves the transparency of the inventories by giving an indication of the levelof uncertainty of the data used. The usefulness of applying both approaches would be enhanced if theidentified differences were explained by all Parties.
36. Estimates of emissions from international aviation and/or marine bunker fuels were reported by24 Parties (ATG, BFA, BHS, BRB, BWA, COG, COL, CUB, DMA, ETH, GTM, GUY, KNA, LCA,MDV, MNG, NIU, PAN, PER, SWZ, TGO, TTO, TUN, YEM). Fourteen Parties (BHS, BRB, COG,COL, CUB, DMA, GUY, LCA, MDV, NIU, PAN, TTO, TUN, YEM) provided a breakdown into marineand aviation bunkers. In conformity with the IPCC Guidelines, these emissions were not included in thenational total but reported separately.
37. The IPCC Guidelines request Parties to make efforts to report the estimated range of uncertaintyin their emission estimates, where appropriate. The reporting of uncertainties was done by more thanhalf of the reporting Parties (17), three (BWA, NIC, TGO) of them providing the informationquantitatively, and 13 (ATG, BDI, BRB, COL, DMA, ETH, GUY, KNA, LCA, PAN, SWZ, TUN, YEM)qualitatively. Cuba reported both qualitatively and quantitatively. The sectors covered in estimating therange of uncertainty were often energy, agriculture and land-use change and forestry (LUCF), and insome cases, waste and industrial sectors.
Activity data
38. Most of the reporting Parties identified the lack of activity data as a major constraint forestimation of emissions of some source categories in at least one sector, which was usually the energyand LUCF sectors, and to a lesser extent the agriculture ,industrial processes and waste sectors.
39. Unavailability of activity data in a suitable form for compiling the national GHG inventory inaccordance with the IPCC Guidelines was reported by 14 Parties (ATG, BHS, BWA, COL, DMA, GUY,KNA, LCA, NIC, NIU, PER, PNG, PRY, TCD). This mainly concerned the energy, LUCF andagriculture sectors.
40. Eighteen Parties reported that some important activity data are either lacking or are notaccessible due to lack of adequate data collection and/or management systems. Seven Parties (ATG,BFA, COL, CUB, LCA, MAR, TTO) reported generally on the issue, while 11 (BHS, BRB, BWA, GUY,MDV, NIC, NIU, PAN, PER, PRY, TGO) elaborated on their needs, which related mainly to the energyand forest sectors. These needs were often identified as lack of institutional capacity for the collection,archiving and management of data for preparing the inventory and systematization/standardization of
4 For countries with oil and gas exports, such as TTO, the observed difference between the two approaches islarger than for other countries.
FCCC/SBI/2002/16Page 11
activity data. Peru reported problems with the calculation of fugitive emissions in the petroleum industryand data on the import of gaseous fluoride compounds.
41. Regarding energy use, 18 Parties (ATG, BDI, BFA, BRB, BWA, COL, DMA, GUY, KNA,MAR, MDV, NIU, PAN, PER, PNG, TUN, TCD, YEM) indicated broadly or specifically the lack ofactivity data. The fields specified were household biomass consumption, vehicles and equipmentefficiency in the transport and industrial subsectors, and international bunker fuels. Panama mentionedthe discontinuation of the energy balance following privatization of its energy sector. Peru wasdeveloping an energy balance that was expected to improve information needed for future inventories.
42. Fifteen Parties (ATG, BFA, BHS, BRB, COL, CUB, DMA, GUY, MAR, PAN, PER, PNG,SWZ, TUN, YEM) reported difficulties in obtaining activity data in the necessary time series for theLUCF sector, as requested by the IPCC methodology. Data on land use and forest cover were oftenoutdated. For example, for Bahamas data date back to a survey carried out during the period 1971 to1976 while for Peru the time series used for changes in forest and woody biomass stock was for theperiod 1965 to 1994. Barbados and Colombia mentioned their inability to estimate abandonment ofagricultural land during the past 20 years. Swaziland reported immense difficulties in estimating areasconverted over different periods of time. Dominica and Saint Kitts and Nevis used expert judgement toevaluate land-use change over the past 20 years.
43. In the industrial processes sector, eight Parties (BDI, BHS, BRB, COL, PER, TGO, TTO, TUN)faced problems in collecting activity data. Togo reported that the needed data were considered to beconfidential, while Colombia indicated problems related to the harmonization of the IPCC sourcecategories with those used locally.
44. The source of the activity data used for the emission estimates of the different sectors and sourcecategories was referenced by all Parties with varying levels of detail, even though this information is notexplicitly requested by the UNFCCC guidelines. Parties indicated that activity data were obtained fromvarious national sources, such as national statistics provided by the respective ministries, municipalitiesand agencies, or from industrial facilities. Nicaragua also indicated having used expert judgement whendata were not available.
Emission factors
45. Twenty-one Parties (ATG, BDI, BRB, COL, CUB, DMA, ETH, GTM, GUY, KNA, LCA, MAR,MDV, NIU, PNG, SWZ, TCD, TGO, TTO, TUN, YEM) reported that the default emission factorsprovided by the IPCC Guidelines often did not reflect national circumstances well, hence their use ininventory calculation led to uncertainties in the estimates. Emission factors were specifically reported tobe inappropriate for the industrial processes and waste sectors mainly, and to a lesser extent foragriculture and LUCF. Trinidad and Tobago and Maldives mentioned significant uncertainties in theemission estimates as a result of the unavailability of factors specific to small island developing States.
46. The IPCC Guidelines do encourage the development and use of local emission factors that suitnational circumstances. However, all Parties used IPCC default methods except three that developedtheir own methodologies regarding fuel combustion for electricity generation (BRB), CO2 emissions fromventing and flaring (COL), LUCF (COL), and enteric fermentation of poultry (GUY). Four othersdeveloped their own emission factors or conversion coefficients for CO2 and non-CO2 from fuelcombustion (BWA, CUB), CH4 from manure management and enteric fermentation (GUY), CO2 frombiomass burned on site (BWA), and biochemical oxygen demand (BOD) value for waste water (MNG).Four Parties used regionally available factors or coefficients, mainly with regard to non-CO2 emissionsfrom savanna burning (BWA), fractions of biomass burned on and off site (DMA, KNA, LCA) andemissions from poultry (LCA).

FCCC/SBI/2002/16Page 12
Reporting tables
47. Fifteen Parties (ATG, BFA, BHS, BRB, BWA, CUB, DMA, ETH, GTM, GUY, LCA, NIU,PER, PRY, TTO) used the IPCC summary tables5 and 12 Parties (BDI, COG, COL, HTI, KNA, MAR,MNG, NIC, PAN, SWZ, TGO, YEM) provided information using tables with a similar format. Tunisiaadopted the IPCC summary tables in a separate inventory document and a similar format in the nationalcommunication. Three Parties (MDV, PNG, TCD) did not use the IPCC summary table(s) or a similarformat.
48. None of the reporting Parties strictly used table II in this way. Three Parties (MDV, PER, PNG)adopted a modified format of that table. All but two Parties (GTM, PNG) included sectors or sourcecategories of the IPCC other than those explicitly required by UNFCCC table II (see table 2). In somecases it was not clear whether certain source categories were not reported because they were not relevantfor the country or had not been estimated for other reasons.
49. Eight Parties (BFA, BRB, COG, CUB, DMA, LCA, TTO, TUN) provided all the necessary IPCCworksheets,6 which give detailed calculations of the estimation of GHG emissions as well as numericalinformation on aggregate emission factors and activity data for inventories using the IPCC defaultmethods. Botswana, Panama and Peru provided some of the IPCC worksheets and the rest did notprovide any worksheet. The provision of these worksheets contributes substantially to the transparencyof the inventories.
50. The degree of completeness in reporting on IPCC sectors and subsectors was high. Only sixParties (ATG, BHS, MDV, MNG, PNG, PRY) did not report on emissions from agricultural soils. Allbut two Parties (BHS, MDV) reported on CO2 emissions from the LUCF sector.
51. Fourteen Parties used the notation keys indicated in the IPCC Guidelines.
B. Presentation of results
52. Table 3 summarizes inventory data in terms of aggregate emissions and removals provided forthe years 1990 and 1994. This table also includes data from Parties which provided data only for a yearother than these two years. In accordance with the UNFCCC guidelines, the analysis provided in thissection is based on 1994 inventory data, whenever possible. When needed, estimates provided by Partieshave been converted into CO2 equivalent estimates using 1995 IPCC global warming potentials (GWPs)in order to facilitate comparison of inventory results. Such a presentation shows, for example, therelative contributions of the different GHGs and the different sectors to a Party’s total GHG emissions.It should be noted that 22 Parties (BDI, BFA, BWA, COG, COL, CUB, ETH, GTM, GUY, HTI, LCA,MAR, MNG, NIC, PAN, PER, SWZ, TCD, TGO, TTO, TUN, YEM) used the GWPs to estimate therelative contribution of each individual GHG or sector to their aggregate GHG emissions, although this isnot required by the UNFCCC guidelines.
53. Other reporting issues were also noted during the process of compiling the inventory information.Different emission estimates for the same sector or source categories were indicated in different places ortables in the communication. Some Parties changed the format of the IPCC summary tables.
5 The summary tables and worksheets are automatically generated when using the IPCC software. SeeGreenhouse Gas Inventory Software for the Workbook of the Revised 1996 IPCC Guidelines for NationalGreenhouse Gas Inventories - Instruction Manual.6 See footnote 5.
FCCC/SBI/2002/16Page 13
Emissions by sources and removals by sinks
54. Most reporting Parties constituted a net source of GHG emissions, with the exception of 10Parties (BDI, BWA, COG, DMA, GTM, GUY, NIC, NIU, SWZ, TCD) which were net GHG sinks due tothe relatively large CO2 removals reported in the LUCF sector compared to emissions from all the othersectors. When considering CO2 only, fourteen Parties (BDI, BWA, COG, CUB, DMA, ETH, GTM,GUY, KNA, LCA, NIC, NIU, SWZ, TCD) showed that removals by sinks in LUCF exceeded their totalCO2 emissions.7
Aggregate GHG emissions expressed in terms of CO2 equivalent8
55. In terms of total GHG emissions expressed as CO2 equivalent, CO2 was the primary GHG forabout half of the Parties (ATG, BHS, BRB, COL, CUB, DMA, GUY, KNA, MAR, MDV, MNG, NIU,PER, TTO, TUN, YEM). For 11 Parties (BDI, BFA, BWA, COG, ETH, HTI, LCA, NIC, PAN, SWZ,TCD), CH4 was the most important contributor to aggregate GHG emissions, and for four Parties (GTM,PNG, PRY, TGO) N2O was the highest contributor.
56. The energy sector was the largest source of GHG emissions for 16 Parties (ATG, BHS, BRB,COG, COL, CUB, DMA, GUY, KNA, MAR, MDV, MNG, NIU, TTO, TUN, YEM), while for 11Parties (BDI, BFA, BWA, ETH, GTM, HTI, NIC, PNG, PRY, SWZ, TCD), it was the agriculture sector.The LUCF sector was the main source of GHG emissions for three Parties (PAN, PER, TGO) while thewaste sector was for one Party (LCA). Agriculture was the second largest emitter for most Parties. ForTrinidad and Tobago and Peru, industrial processes constituted the second and third sources ofemissions, respectively. Removals by LUCF in most Parties offset GHG emissions from this sector, withthe exception of eight Parties (COL, HTI, MNG, PAN, PER, PNG, PRY, TGO).
57. The level of emissions varied widely among reporting Parties. Aggregate GHG emissionsexpressed in CO2 equivalent, excluding LUCF, of all small island developing States (12 Parties)amounted to 76,843 Gg. This represented 12 per cent of the total emissions of all 31 reporting Parties.Five Parties reported emissions lower than 1,000 Gg, while for 23 Parties the emissions were lower than50,000 Gg. In contrast, two reporting Parties had aggregate emissions totalling over 100,000 Gg, rangingfrom about 137,000 Gg (COL) to above 142,000 Gg (PRY). Peru had emissions of above 61,000 Gg.
Emissions of main greenhouse gases (CO2, CH4 and N2O)
58. Carbon dioxide. Fuel combustion in the energy sector accounted for the largest share of CO2
emissions for all Parties, ranging from 66 per cent (TTO) to 100 per cent (ATG, BFA, BHS, BWA,DMA, GUY, HTI, KNA, LCA, MDV, SWZ, TCD) of total CO2 emissions. Within the fuel combustionsector, the energy industry was the largest source of emissions for most Parties, except for 13 (BDI, BFA,COG, COL, DMA, ETH, GTM, HTI, KNA, PAN, PER, SWZ, TGO). On average, transport accountedfor 26 per cent of CO2 emissions from fuel combustion, while for 12 Parties it was the most importantsource, ranging from 35 to 65 per cent. CO2 emissions from international bunker fuels were reported by24 Parties and were equivalent to between 0.5 per cent (MNG) and 416 per cent (SWZ) of total CO2
emissions. The LUCF sector as a whole constituted a net sink of CO2 for 21 Parties. For four Parties
7 In view of the different role of the land-use change and forestry sector in the different Parties - in some, thissector offsets total emissions, while in others it is a large source of emissions - and the request by the IPCCGuidelines to provide net emissions or removals in the different source categories of this sector, the term “total CO2
emissions” in this document denotes the sum of CO2 emissions from all sectors except CO2 emissions and removalsin land-use change and forestry. This enables presentation of the data in a consistent and comparable manner.8 Aggregate GHG emission estimates given in this document represent the sum of total CO2, CH4 and N2Oemissions expressed in CO2 equivalent, using IPCC 1995 GWP values.

FCCC/SBI/2002/16Page 14
(ATG, NIC, PAN, PER) emissions from the forest and grassland conversion subsector in absolute valueexceeded the total net emissions or removals. In the case of four Parties (BFA, COL, HTI, PNG), thelargest emissions in the LUCF sector were from changes in forest and other woody biomass stocks. For19 Parties, however, this subsector constituted the main removal by sinks. For four Parties (BRB, PAN,PER, TGO), removal by sinks in the subsector of abandonment of managed lands was larger than thatfrom changes in forest and other woody biomass stocks.
59. Methane. Agriculture was the largest source of CH4 emissions, ranging from 33 to 100 per centof total methane emissions for 21 reporting Parties. Fugitive fuel emissions were the most important CH4
source for three Parties (BDI, NIU, TGO), accounting for between 56 and 86 per cent of total methaneemissions. The waste sector constituted the primary source of CH4 emissions, ranging from 77 to 100per cent for seven Parties (ATG, BRB, DMA, KNA, LCA, MDV, TTO). In the agriculture sector,livestock was the most important subsector for 25 reporting Parties. Rice cultivation or other agriculturalactivities was the largest source for the other Parties.
60. Nitrous oxide.9 Agriculture was the most important source of N2O emissions for 26 reportingParties, ranging from 50 per cent (COG) to 100 per cent (PNG), while fuel combustion was the largestsource for only one Party (MNG) with a value of 100 per cent. For two Parties, the waste sectorconstituted the most important source of N2O, with values ranging from 59 (NIU) to 100 per cent (ATG).
C. Current trends
61. While the inventory data for the base years 1990 or 1994 are requested by the UNFCCCguidelines, eight Parties (BHS, BRB, COL, CUB, ETH, GUY, MNG, PRY) provided a GHG inventoryfor both 1990 and 1994. This allowed for a preliminary analysis of the trends of GHG emissions in thesecountries. It should also be noted that Barbados provided an annual GHG inventory for 1997 and thatGuyana and Mongolia provided annual GHG inventories from 1990 to 1998, while Ethiopia providedsuch information from 1990 to 1995. Togo provided annual GHG inventories from 1992 to 1998.
62. Total CO2 emissions (excluding LUCF) increased over the period 1990 to 1994 in somecountries: 10 per cent (ETH), 13 per cent (BHS), 15 per cent (BRB), 16 per cent (COL), 23 per cent(GUY) and 150 per cent (PRY). In others, total CO2 emissions declined by 22 per cent (MNG) and 40per cent (CUB). Trends in CO2 emissions differed when the LUCF sector was included in total CO2
emissions.10 In that case, the increase in total CO2 emissions was higher by 1 per cent (COL), 15 per cent(PRY) and 171 per cent (ETH), while in Barbados the increase remained unchanged. For Mongolia andCuba the decreases in emissions were 37 and 71 per cent, respectively. In Guyana, CO2 emissionsdecreased by 11 per cent.
63. CO2 emissions from fuel combustion increased in 1994 compared to 1990 for four Parties (BRB,COL, ETH, GUY) while four other Parties (BHS, CUB, MNG, PRY) reported a decline. The largestincrease was reported by Barbados (35 per cent), and the sharpest decline by Paraguay (71 per cent).
64. Between 1990 and 1994, CH4 emissions increased in six Parties (BRB, COL, ETH, GUY, MNG,PRY) by amounts ranging from 0.2 (MNG) to 302 (PRY) per cent. Emissions decreased, however, forCuba (13 per cent) and the Bahamas (50 per cent). Total N2O emissions in 1994 increased in four Parties(COL, ETH, GUY, PRY) compared to 1990 levels (15 per cent for Colombia, 118 per cent for Ethiopia,26 per cent for Guyana and 145 per cent for Paraguay). CH4 emissions sharply decreased for Cuba (70per cent), and remained stable for two Parties (BRB, MNG).
9 Maldives did not provide N2O estimates and the Bahamas provided only a national total for N2O emissions.10 Due to incomplete reporting for the year 1994, the Bahamas was not taken into account for this comparison.
FCCC/SBI/2002/16Page 15
V. MEASURES CONTRIBUTING TO ADDRESSING CLIMATE CHANGE
65. All Parties, with the exception of Trinidad and Tobago, included in their nationalcommunication, information on programmes containing measures that could contribute to addressingclimate change. Twenty-three Parties presented measures on limiting the increase of GHG emissions, 12on enhancing removals by sinks and 11 on both measures. In the reports, Parties covered aspects such asnational policies that have implications on GHG emissions; potential abatement options in sectors,including methodologies, scenarios, models and criteria used for the assessment, constraints andimplementation strategies; and lists of projects proposed to mitigate climate change.
66. Parties used two general approaches to provide information. Some Parties described the sectoralpolicies and measures adopted by the country that would affect their future emissions, while the majorityof Parties identified the most important sectors in terms of either present or future GHG emissions andanalysed the sectoral measures or projects that could contribute to reductions in GHG emissions orenhancement of removals by sinks. The sectors covered in the reports included energy, agriculture,LUCF and waste.
67. Several Parties reported on the criteria used for the assessment and selection of potentialmitigation options. Criteria mentioned included integration of mitigation options into national andsectoral development plans and programmes, possible impacts on the economy, enhancement ofeconomic growth and development, availability of financial resources, potential environmental impact,potential emission reductions and implementation feasibility and cost-effectiveness.
68. The status of implementation of mitigation options differed among Parties. Many Partiesindicated that studies were at an early stage and that the development of more detailed recommendationswould require consultation with, and input from, stakeholders in the public and private sectors, as well asthe development of appropriate policy and legal measures. A few Parties mentioned sectoral measuresimplemented in previous years, as well as measures that were under implementation. Some Parties alsoprovided information on the proposed mitigation projects, including costs, source of financing, expectedemission reductions and/or status of implementation.
A. Energy
69. Thirty Parties reported on possible measures in the energy sector, covering the supply anddemand sides. Measures on the supply side included, among others, energy conservation and efficiency,cogeneration, increasing transformation efficiency, modernization of thermoelectric utilities, fuelswitching, electricity imports, reduction of losses in transmission and distribution, improvement oftransport infrastructure, development of plans to promote rural electrification and use of renewableenergy sources.
70. On the demand side, Parties identified mitigation options in the industrial, residential,commercial and/or transport sectors. Regarding the industrial, residential, and commercial sectors, themain reported measures related to enhancement of energy efficiency in lighting, cooling, cooking and airconditioning; implementation of demand-side management programmes; promotion of fuel switching;and use of renewable energy.
71. In the transport sector, measures identified by Parties covered development of road transportationmaster plans; introduction of electric or compressed natural gas vehicles, encouragement of earlyadoption of hybrid vehicles, discouragement of the use of private vehicles, improvement of the publictransport system, introduction of vehicle emission standards, adoption of legal measures to limit theimportation of used and/or reconditioned vehicles, modernization of locomotives, improvement of roadinfrastructure as well as passenger and freight vehicle efficiency, and switching from diesel to electrictraction on railways.

FCCC/SBI/2002/16Page 16
72. Parties used either expert judgement or elaborated models for the assessment of mitigationoptions in the energy sector. Parties that used expert judgement, based the assessment on the results ofthe GHG inventories, economic growth patterns and national or sectoral development plans.
73. Parties that used models (BFA, BWA, ETH, MNG, NIC, SWZ, TGO, TUN) projected the levelof future emissions using business-as-usual and one or two mitigation scenarios. The main variablesused to develop scenarios were: population growth, urban population, energy demand, GDP, and oilconsumption. Emission projections were mainly made for the years 2005, 2010, 2020 and 2030. Modelsmentioned by Parties included LEAP,11 GACMO,12 MEDEE-S,13 EFOM-ENV14 and WASP.15
74. Many Parties indicated that abatement options in the energy sector were at an early stage ofassessment and that further studies will be required. Seven Parties (LCA, MDV, MNG, NIC, TCD,TUN, SWZ) presented the strategies that have to be developed to implement the potential mitigationoptions, including aspects such as programmes, resources, lead agencies and time frames as well aspolitical and administrative considerations.
75. Some of the mitigation measures identified for implementation were the use of solar waterheaters (ATG, BRB), use of solar techniques for drying sugar cane (BRB), electricity generation usingbagasse (CUB), the use of biogas technology (BWA, COL), reduction of venting and flaring of naturalgas and increase of efficiency in new vehicles (PAN, PER), cogeneration (GUY, PER), increase of hydroand/or natural gas and/or geothermal electricity generation (PAN, NIC), adoption of improved woodstoves (NIC) and the promotion of photovoltaic energy supply (BWA). Ten Parties (ATG, BRB, COL,DMA, GUY, KNA, MAR, MNG, PAN, PER) reported on the possibility of using wind energy as amitigation measure.
B. Agriculture and livestock
76. Ten Parties (BDI, BWA, COL, ETH, GUY, HTI, LCA, MNG, TCD, TUN) reported on measuresto reduce GHG emissions from agriculture and livestock. Measures reported under agriculture included:introduction of new varieties of rice and management of paddies to reduce CH4 emissions, rational use offertilizers, increase of soil water absorption, reduction of agricultural burning, use of mineral instead oforganic fertilizers and altering of tillage practices to reduce N2O emissions.
77. Measures in the livestock-related operations included improvement of cattle feed, reduction ofCH4 emissions from enteric fermentation, manure management and management of livestock population.
78. The level of reporting in the agriculture and livestock sector was in general limited to lists ofpotential mitigation options; however, six Parties (BDI, BWA, MAR, MNG, TCD, TUN) estimated theemissions for various time horizons and two (BWA, MAR) provided information on the costs ofmitigation measures.
79. Few reporting Parties elaborated on the methodology used for the assessment and selection ofmitigation options in this sector. They used mainly expert judgement based on the results of the GHGemissions inventory, the national development programmes and the feasibility of implementation of theidentified measures. Ethiopia indicated that strategies must be formulated in such a way as to increasefood production to feed the rapidly growing population of the country in a sustainable manner. No Partymade reference to the use of any particular models in this sector.
11 Long-range Energy Alternative Planning system.12 Greenhouse Gas Costing Model.13 Modèle de Demande en Energie pour l’Europe – Sud.14 Energy Flow and Optimization Model – Environment.15 Water Quality Analysis Simulation Program.

FCCC/SBI/2002/16Page 17
C. Waste management
80. Sixteen Parties (BDI, BRB, BWA, COG, COL, ETH, GUY, HTI, LCA, MAR, MDV, MNG,NIU, PNG, TCD, TUN) presented information on measures to address emissions from the waste sector.Most of them reported on potential options or projects and a few on national policies that haveimplications on the emissions from this sector.
81. Reported measures included reduction of disposal of organic materials in landfills and/orrecovery of methane (BRB, BWA, ETH, GUY, HTI, LCA, MAR, MNG, TCD, TUN), use of biogas fromlandfills to generate electricity (BWA, TUN), solid waste and/or sewage management (COG, COL,MDV, MNG, PNG), recycling of biodegradable waste (GUY, MNG, NIU) and composting (ETH, GUY,NIU, PNG, TUN), waste processing and waste water treatment (BDI), incineration (ETH), revision andstrengthening of legislation and promotion of education, training and public awareness on waste issues(PNG).
82. Few Parties described the methodological aspects of the assessment of mitigation options in thewaste sector; however, based on the information provided it is possible to conclude that most reportingParties used the judgement of experts. Seven Parties (BDI, BRB, BWA, ETH, MAR, TCD, TUN)projected the emissions reductions that could be obtained through the application of some of the selectedmeasures, but no Party made reference to the use of any particular models in this sector.
83. In general, reporting Parties indicated that the potential options are only at an early stage ofassessment. Botswana, Morocco and Tunisia presented specific data on costs of some of the proposedmeasures. Ethiopia indicated that the selection and adoption of mitigation options in this sectordepended upon technology, cost of labour, and capacity of local communities.
D. Land-use change and forestry
84. Twenty-five Parties (BDI, BFA, BHS, BWA, COG, COL, CUB, ETH, GTM, GUY, HTI, LCA,MAR, MDV, MNG, NIC, NIU, PAN, PER, PNG, PRY, SWZ, TCD, TGO, TUN) presented informationon measures to enhance removals by sinks in the LUCF sector. They provided information either oncurrent national policies that would affect their future emissions or made an assessment of the potentialmeasures in the forestry sector.
85. Measures reported by Parties included: establishing a legal framework for long-termmanagement of forests, establishing forest inventories, setting up a national forest management plan,legislating on types of activities to be authorized within forests, implementing programmes and plans todevelop territorial management, investing in alternative sustainable economic activities for ruralpopulations, introducing an environment services tax, avoiding forest fires and pest outbreaks,implementing a master plan to control forest fires, replacing wooden poles by steel fencing, promotingsustainable exploitation of forests, introducing tax incentives and subsidies for forests sectors, andpromoting programmes of conservation, regeneration, reforestation, afforestation and agroforestry.
86. Parties indicated that the main criteria used for the assessment and selection of mitigation optionswere the possibility of including these options in national development plans, and a cost-benefit analysisof the forestry sector and policies to prevent deforestation. Chad included a list of socio-economic,environmental, administrative and institutional considerations of the identified mitigation measures.
87. Ten Parties (BDI, BWA, MAR, MNG, NIC, PER, SWZ, TCD, TGO, TUN) projected theemissions for various time horizons (2010, 2020, 2025) and four Parties (BFA, ETH, SWZ, TGO) usedthe COMAP model. Eight Parties (BDI, BFA, BWA, MAR, NIC, SWZ, TGO, TUN) providedinformation on the costs of mitigation measures.
FCCC/SBI/2002/16Page 18
88. Many Parties indicated that, in order to implement the potential mitigation options, furtheraspects of these options should be elaborated, including more comprehensive studies, consultations withstakeholders in the public and private sectors and development of policy and legal frameworks. ThreeParties (CUB, PAN, PER) mentioned specific measures that have already been implemented relatingmainly to policy instruments and forestry laws.
E. Projects
89. Seventeen Parties (ATG, BDI, BFA, BRB, BWA, COL, CUB, ETH, HTI, MAR, MDV, MNG,NIC, PER, TCD, TGO, TUN) included in their national communications a list of proposed projectsaimed at reducing GHG emissions and enhancing removal by sinks. Five Parties (BFA, BRB, HTI,MAR, MNG) elaborated on the associated costs to implement some of the projects and six Parties (COL,MAR, MNG, NIC, PER, TUN) indicated the mitigation potential. Seven Parties (BFA, BRB, CUB, HTI,MDV, TGO, TUN) described project concepts which included expected outcomes of the project and insome cases their environmental and social benefits. A list of projects by country is maintained by thesecretariat at the web page http://unfccc.int/program/nai/ncweb0201.pdf.
90. In the energy sector, the mitigation projects identified in the energy supply area related primarilyto more efficient production and a wider adoption of renewable sources. Some of the projects proposedwere to evaluate the potential of solar, photovoltaic and wind technology, to identify and overcomebarriers to widespread adoption of renewable energy, such as wind, photovoltaics, hydroelectricity,biomass and biogas, urban/rural electrification, to decentralize electrification by photovoltaic systems, toadopt a combined cycle expansion of a thermoelectrical plant which uses natural gas, and to conductenergy resources audits. Within the industrial, residential and transport subsectors, projects concernedimproving energy efficiency, cogeneration, demonstration and introduction of smokeless and highefficiency coal briquetting technology, developing sustainable energy centres, substitution of fuel andmaterials, efficient lighting systems, development of a sustainable inter-island sea-based masstransportation system (MDV) and vehicle fuel efficiency improvement. On the demand side, projectsconcerned management programmes, building insulation improvement, replacement of incandescentbulbs by compact fluorescent lamps, and dissemination of ecological kitchens and improved stoves.
91. In the agriculture sector, projects pertained to information, education and communication andresearch and development in technologies for GHG mitigation in agriculture and livestock farming,implementation of programmes for livestock breeding and development of vegetable gardening.
92. In the waste sector, projects included improvement of carbonization techniques, collection andutilization of wood waste, development of sewage treatment facilities, an integrated waste managementsystem designed to mitigate GHG emissions, collection and transportation of solid waste in the capitalcities, and reprocessing of landfill gas.
93. In the LUCF sector, the projects related to reforestation, wood conservation, conservation andrestoration of forests and national parks, forest management and agro-foresty, establishment, restorationand conservation of humid tropical forests, prevention of conversion of agricultural lands, recovery ofecosystems, and hydrological restoration of a plantation’s water supply basin.
VI. RESEARCH AND SYSTEMATIC OBSERVATION
94. Most reporting Parties provided information on research and systematic observation, either in adedicated chapter or in a section of their national communication. Some Parties, however, providedinformation on this issue in various sections, and a few Parties did not provide any informationspecifically related to research and systematic observation.

FCCC/SBI/2002/16Page 19
95. Most of the research activities identified or planned by Parties were those included in climatechange vulnerability and adaptation assessments and identification of adaptation and mitigation options.Agriculture, water resources, coastal zones and forestry sectors were the most common sectors in whichresearch and systematic observation were undertaken or planned.
A. Research
Ongoing and planned activities
96. Most reporting Parties provided information on their ongoing or planned research programmesand activities, which focused on a better understanding of the impacts of climate change and variabilityon environment, biodiversity, forests, agriculture, livestock, water resources, coastal zones, fisheries,human health and socio-economic sectors (see table 4). Mitigation programmes included plans todevelop renewable energy sources and/or shift to lower CO2 emitting fuels. Research programmes on theimpacts of climate change included activities relating to the maintenance of the sustainability ofagriculture and forests through various means, such as: development and adoption of new andappropriate technologies to reduce impacts of climate change, investigation of the quantity and quality ofsurface and ground water resources, improvement of soil management and a better understanding offishery activities, coral bleaching and marine ecosystems.
97. Other areas of ongoing or planned research on the impacts of climate change included a betterunderstanding of the ENSO phenomenon, climate variability and extremes, climate prediction, reductionand management of uncertainty related to climate change, development of climate change scenariosappropriate to national assessments, food security, diversification and intensification of agriculture, CO2
fertilization of crops, forest species composition and coverage, socio-economic implications of climatechange, and desertification.
98. About half of the Parties (ATG, BHS, BRB, BWA, COL, CUB, DMA, ETH, GUY, KNA, LCA,NIC, NIU, PNG, TTO) provided information on their research and monitoring activities: collection ofdata and monitoring of trends for temperature, rainfall and sea level; climate change and tourism;feasibility of demand-side management of energy systems; flaring and gas recovery schemes fromlandfilling of solid waste; handling of waste water; links between climate and ecosystems structure andfunction; land-atmosphere interactions and the effects of forest fires; effects of clouds and trace gases onthe Earth’s radiation balance; climate change effects on human health, coastal and marine ecosystems;and effects of radiation on cloud feedback mechanisms.
99. Some Parties (ATG, BHS, BRB, BWA, COL, CUB, GUY, NIU, PNG) highlighted theimportance of monitoring, forecasting and predicting climate and weather, assessing the impacts ofdrought and rainfall variability, monitoring climate-related public health events, and promotingintegrated coastal zone management.
100. About half of the Parties (ATG, BFA, BRB, COL, CUB, DMA, GUY, KNA, LCA, MAR, MDV,PAN, PNG, TCD, TGO, TTO) reported on some of their ongoing or planned research programmes onadaptation to climate change in various sectors. Some of these adaptation research programmes includedthe evaluation of a range of coastal adaptation options, plant and animal breeding programmes, integratedpest management, improved soil and crop management, evaluation and costing of adaptation inagriculture, water supply and use, development of new adaptation technologies and development of newresistant plant and crop species.
101. Several Parties (ATG, BHS, BRB, BWA, CUB, GUY, KNA, LCA, MAR, NIU, PNG, TTO)provided information on their ongoing or planned research programmes on mitigation in various sectorsof their economies. These programmes included a comprehensive assessment of wind and other

FCCC/SBI/2002/16Page 20
renewable energy sources, evaluation of the applicability of the proposed mitigation measures, optionsfor energy recovery and end-use, reduction of GHG emissions, evaluation and costing of mitigationmeasures, investigation of solar power, promotion of renewable energy sources, and technologies formethane recovery from waste treatment for use in energy generation.
Specific scientific research
102. Many reporting Parties (ATG, BHS, BRB, BWA, COL, CUB, GUY, KNA, LCA, MAR, MDV,MNG, NIC, NIU, PAN, PNG, TTO, TUN) provided information on ongoing or proposed specificscientific research on the impacts of climate variability, ENSO and extreme climatic events on varioussectors of their economies. Specific scientific research toopics were: the effects of hurricanes andtropical storms, severe rainfall and wind events, droughts and floods and the effects of the El Niño andLa Niña phenomenon on human health, agriculture, coastal zone and fishery sectors.
Pilot and demonstration projects
103. Four Parties indicated their involvement in ongoing pilot or demonstration projects relating to theuse of photovoltaic systems (BRB), wind energy and solar driers (TTO), conversion of motor vehicles touse compressed natural gas as fuel (COL), and sequestration of carbon in soils (GUY).
Cooperation and collaboration
104. Parties also reported on activities within the context of the preparation of their nationalcommunications that were undertaken in close collaboration with national, regional and internationalprogrammes and institutions. For example, island countries of the Caribbean region (ATG, BHS, BRB,KNA, LCA, TTO) participated in a regional climate change programme, with financial support from theGlobal Environment Facility (GEF) and technical and administrative support from national agencies, theUniversity of the West Indies and the Organization of America States (OAS). Papua New Guinea wascollaborating with the United States Department of Energy on its atmospheric radiation measurementprogramme. Peru reported that, in addition to financial and technical support received from its ownagencies, it had received financial support from the GEF, and technical support from the United NationsEnvironment Programme (UNEP), the United Nations Institute for Training and Research (UNITAR)through its climate change training programme (CC:TRAIN), and the Danish Agency for DevelopmentAssistance (DANIDA).
B. Systematic observation
105. Most Parties reported on the ongoing or planned activities relating to systematic observationincluding national observation networks. They also described the upkeep and maintenance of thenetwork of meteorological and hydrological observing stations. The areas for which systematicobservation was undertaken included sea-level monitoring (ATG, GUY, MDV), disaster preparednessand response capabilities and early warning systems (DMA), meteorological and hydrologicalobservations (ATG, BHS, BWA, COL, CUB, DMA, ETH, GTM, GUY, KNA, LCA, MDV, MNG, NIC,NIU, PAN, PER, PNG, TTO), and terrestrial and space observations (MAR).
106. Five Parties (ATG, BHS, CUB, KNA, LCA) reported on their observation and monitoring ofcyclone and hurricane tracks across oceans by use of satellites and others described the monitoring ofwater flows, vegetation change, air quality, incidence of diseases and the level of SO2 concentrations(BWA).
FCCC/SBI/2002/16Page 21
Observation networks and stations
107. Many Parties included information on their observation records and the types of observationnetworks and stations that are in use. These observation systems include a network of observation andmonitoring stations which collect meteorological data (temperature, atmospheric pressure, cloudconditions, precipitation, relative humidity, wind), oceanographic data (tides, sea water temperature, sealevel, circulation), and hydrological data (runoff and groundwater). Cuba reported that it also monitorsand collects data on the levels of stratospheric ozone and stratospheric aerosols while the Bahamasmeasures ultraviolet (UVB) radiation.
108. Many Parties also described the number of observation stations and networks involved insystematic observation. For instance, Botswana operates a network of 400 rainfall and 14 synopticstations, while Cuba has a network of 75 meteorological and 11 rain water quality monitoring stations.Ethiopia has 629 meteorological/climatological stations, 18 synoptic stations and 338 stream gaugingstations; Morocco has 44 synoptic stations and over 1,000 climatological stations. In addition tometeorological stations in operation, Mongolia monitors the concentration levels of CO2, CH4 and carbonmonoxide (CO) over the Gobi desert. Morocco has a network of regional drought observation unitswithin its observation network. Small island States such as Antigua and Barbuda, the Bahamas,Barbados and Papua New Guinea also operate a tide gauge, which measures relative sea-level change.
109. Six Parties (ATG, CUB, DMA, LCA, MDV, MNG) reported on the involvement of non-governmental environmental agencies in the monitoring and assessment of natural ecosystems andmonitoring of biological and physiological changes of the coral reef systems.
110. A few Parties mentioned their participation in various global observing systems, such as theGlobal Sea Level Observing System (BHS), World Meteorological Surveillance, Global AtmosphereSurveillance, Global Climate Observing System, Global Ocean Observing System, BackgroundAtmospheric Pollution Monitoring Network and World Ozone Observing System (CUB), and WorldWeather Watch (ETH).
111. Some reporting Parties provided information on their cooperation and collaboration with regionaland international organizations in systematic observation. Regional organizations include the WorldMeteorological Organization (WMO) (DMA, GUY, PNG, TUN), Caribbean MeteorologicalOrganization and Caribbean Institute of Meteorology and Hydrology (ATG, LCA), Caribbean Planningfor Adaptation to Climate Change through the Organization of American States (ATG, BHS, BRB,TTO), African Centre for Meteorological Applications and Development/Drought Monitoring Centre(ETH, TGO), Southern Africa Development Community/Drought Monitoring and Prediction (BWA),South Pacific Regional Environment Programme, South Pacific Sea Level and Climate MonitoringProgramme, South Pacific Geoscience Commission and South Pacific Regional Meteorological Centre(NIU).
112. The international organizations which have cooperated and collaborated with the reportingParties include WMO, UNEP, GEF, UNDP, the World Health Organization (WHO) and the InternationalAtomic Energy Agency (IAEA).
VII. CLIMATE CHANGE IMPACTS, VULNERABILITY, ADAPTATION ANDRESPONSE STRATEGIES
113. All reporting Parties provided information on their current and future vulnerability as well as onadaptation measures and response strategies. The information related to the methods and approachesused in vulnerability and adaptation assessments, limitations of methods and tools, problems anddifficulties encountered, sectors studied as well as methods for analysing and evaluating adaptation needsand priorities for financial and technical support, and institutional arrangements and networking. Some
FCCC/SBI/2002/16Page 22
Parties also provided information on other technical areas of work relating to vulnerability andadaptation that they would envisage undertaking if they had sufficient financial resources and technicalsupport.
A. Methods and approaches
114. A wide range of models as well as expert judgement were used in the analysis of impacts invarious sectors (see table 5). The models were either process-based or integrated for sectors such asagriculture, water resources, coastal zones, terrestrial ecosystems (forests and grasslands), and humanhealth.
115. Most of the Parties reported on the use of the IPCC Technical Guidelines for Assessing ClimateChange Impacts and Adaptations, including the IPCC emission scenarios (IS92 series), but several otherParties did not specify the methods and approaches they used in their assessments. Some Parties (CUB,KNA, LCA, TCD) specifically reported on the use of the UNEP Handbook on Assessing Vulnerabilityand Adaptation to Climate Change (UNEP Handbook), while other Parties (BHS, COL, CUB, GTM,HTI, TTO) also used expert judgement in their assessment of vulnerability. Ethiopia also consideredpopulation, and economic and environmental scenarios in its assessment of impacts and vulnerability andAntigua and Barbuda indicated the use of synthetic scenarios of climate change.
116. Many Parties indicated the use of various global circulation models (GCM) to generate climatechange scenarios. Fifteen Parties used the integrated model system for the assessment of GHG-inducedclimate change and the scenario generator (MAGICC-SCENGEN) for generating regional climate changescenarios based on various GCM results (see table 5). Burkina Faso used a Japanese model for assessingwater resources. Some Parties also used other types of climate scenarios such as incremental or analoguescenarios for various time horizons up to the year 2100, while a few of these Parties (ATG, BRB, HTI)also reported having used statistical and/or historical methods and downscaling of GCMs (BHS, COL,CUB, GTM, HTI, TTO). Other Parties based their studies on past climate data (BDI, ETH), simulationmethods (ETH, PER) or a combination of methods.
117. A wide range of sea-level rise scenarios for different time horizons up to the year 2100 wereindicated by six Parties that reported on sea-level rise (BHS, COL, CUB, GTM, MDV, PNG). Partiesalso carried out sensitivity analyses by projecting high and low emission scenarios on the future sea-levelchange. For example, Papua New Guinea used the IS92a scenario for a sea-level rise of 80 mm for theyear 2020 and 490 mm for the year 2100, and twice these amounts with the IS92e scenario for the sameyears.
118. Only a few Parties reported on the limitations of the methods and tools used in the assessments.Botswana indicated that GCMs do not address land cover changes arising from the effects of climatechange, while Colombia stressed the shortcomings of the IPCC Guidelines in relation to coastal erosionand flooding, vulnerability of water resources and agriculture and the temporal changes in the incidenceof malaria and dengue. Paraguay indicated that, given the size of the country and the poor resolution ofthe GCM outputs, it was not possible to carry out detailed analyses of impacts on biophysicalsystems/sectors, and Saint Kitts and Nevis highlighted the contradictions between various GCM results.Swaziland indicated that lack of experimental data made it difficult to calibrate and validate statisticallythe modelling outputs on a number of crops.
119. Only Cuba provided information on the way it dealt with the uncertainties inherent in climatechange and emission scenarios. Botswana adopted a variety of GCMs to cover variations inprecipitation.

FCCC/SBI/2002/16Page 23
120. Six Parties (ATG, BHS, COL, PAN, PRY, TTO) reported a major constraint in applying theIPCC Technical Guidelines for Assessing Climate Change Impacts and Adaptation, mostly due to lack ofdownscaling of GCM outputs to suit national circumstances.
121. Information provided by Parties on the current and future vulnerability of the sectors wasdependent on the relative importance of these sectors in their economy (see table 6). A wide range ofsectors and/or areas including agriculture and food security, water resources, coastal zones and marineecosystems, terrestrial ecosystems (forests, rangelands, etc.), human health and human settlements,fisheries, and others such as biodiversity, infrastructure, coral reefs, tourism and energy were covered inthe assessments of vulnerability and adaptation to climate change and its consequent sea-level rise.
Agriculture
122. Almost all reporting Parties assessed the vulnerability of agriculture and indicated that it will beaffected by increased climate variability and extreme events such as droughts and hurricanes, a loss ofsoil fertility and erosion, leaching of mineral fertilizers, heat stress on animals and the indirect effects ofsea-level rise. These impacts were expected to translate into lower productivity in general. Anothereffect identified was a lower quality of fodder that will result in a lower productivity of livestock. SomeParties quantified the reductions in crop productivity, while others mainly used a qualitative assessment.
123. Mongolia reported that its socio-economic development, which is heavily dependent on nomadiclivestock husbandry, will be at risk, while Peru stressed the problem of increase in caloric stress onlivestock, which is currently a problem with the already high temperatures. Many Parties stated that thevery low productivity of their agricultural system will be exacerbated by increased erosion and loss ofsoil fertility resulting from climate change.
124. Maldives indicated that sea-level rise, accompanied by salt water intrusion in groundwater, willpose a threat to the little agriculture practised on low atoll islands. Antigua and Barbuda reported on thebeneficial effects of wetter conditions on most crops and trees and Panama indicated that rice productionwill diminish while that of corn is likely to increase. Swaziland reported that the effect of climate changewas likely to vary with different crops; the yield of maize, a staple crop, was likely to decline by as muchas 60 per cent.
Coastal zones
125. Many reporting Parties assessed the vulnerability of coastal zones (see table 6) with some Parties(ATG, BHS, BRB, COG, COL, CUB, DMA, GUY, HTI, KNA, LCA, MDV, NIU, PAN, PNG, TGO,TTO, YEM) conducting the assessment under different sea-level rise scenarios. The main impactsidentified were erosion and setback of coastlines, increase of salinity in estuaries and wetlands with thedeath of mangroves, salt water intrusion into aquifers, beach degradation and losses, decrease inproductivity of coastal fisheries and devastating effects on species of coral. Almost all coastal countries,including the small island developing States, reported that climate change and its consequent sea-levelrise will have a devastating effect on coastal communities and infrastructure. Dominica reported that15per cent of its coral reef already showed some signs of bleaching, while Papua New Guinea indicatedinundation of some 25per cent of its existing shoreline. Maldives reported that, due to the low elevationof land in the country, it considered its territory as coastal and therefore highly sensitive to sea-level rise.
Water resources
126. Many reporting Parties provided information on the assessment of climate change impacts onwater resources. Some of the Parties (BWA, COL, CUB, DMA, GUY, PNG, TGO) reported a potentialincrease in runoff due to more intense rainfalls and the risk of flash flooding while a few (BFA, ETH)

FCCC/SBI/2002/16Page 24
stressed the decrease in water resources. The negative impacts of salt water intrusion on water quality,sedimentation and evapotranspiration were indicated by most of the reporting Parties, which also statedthat they already faced problems of water shortage.
127. Swaziland reported that its summers will get wetter and its winters drier under various scenariosof future climate change. This is likely to cause changes in water supply and demand, putting additionalpressure on irrigation.
Human health
128. Many Parties reported information with varying levels of detail on the assessment of climatechange impacts on human health. Most of the reporting Parties indicated that the incidence of water- andvector-borne diseases will certainly increase, as well as those related to water contamination. A numberof diseases have been identified, the most common being malaria, dengue and diarrhoea, which are likelyto increase in incidence under future climate change. Many Parties also mentioned the additional stresshigher temperatures will have on the population, which is likely to make them more prone to sicknesses.Some Parties indicated a likely increase in the incidence of endemic diseases as a consequence of climatechange, due to population growth and poorer sanitary conditions.
129. Guyana specifically reported on an increase in the incidence of skin cancer within a section ofthe population as a result of higher incidences of UVB radiation and higher surface temperatures.Maldives indicated that no study has been conducted on the relationship between health and climatechange. Nicaragua reported increases of the malaria index ranging from 38per cent to 150per cent undervarious scenarios of temperature increase.
Terrestrial ecosystems
130. Many Parties provided information on the assessment of climate change impacts on terrestrialecosystems. Most of the reporting Parties indicated a decrease in land cover vegetation as a result of anincrease in aridity and the lower productivity of forests and rangelands. Some Parties (COL, CUB,DMA, GUY, MNG, PER, SWZ) indicated the change and displacement of ecosystems as well as thechanges in species composition, and stressed that deforestation is likely to lead to a loss of biodiversity.Other Parties reported on the risk of frequent occurrence of forest fires in the dry season and the relatedincrease in soil erosion.
131. Colombia and Mongolia quantified the resulting climate change effects on different ecosystems.Cuba estimated that 14per cent of the forest area will be affected while Peru reported a 21.8per centretreat of the area under glaciers. Swaziland reported that assessment of the vulnerability of several treespecies showed that their composition, production and distribution is highly likely to be affected byclimate change.
Fishery resources
132. Eleven Parties (ATG, BRB, DMA, GUY, LCA, MDV, NIU, PER, PNG, TGO, TTO) reportedwith varying levels of detail on the assessment of climate change impacts on fishery resources. Impactswere expected to stem from destruction of nursery areas and breeding grounds, such as mangroves andcoral reefs, availability of nutrients and increased water temperatures. Antigua and Barbuda indicatedthat climate change and variability may affect the availability of fish by altering the distribution of theresources that fish depend on. Maldives indicated the need to study the spatial variations of oceanupwellings in relation to tuna migration to better understand the vulnerability of this fishery resource toclimate change. Peru reported on a reduction of fishing activities during ENSO events.

FCCC/SBI/2002/16Page 25
Other sectors or resources and biodiversity
133. Some Parties provided information on the vulnerability of other sectors or resources, such ashuman settlements, tourism and biodiversity. Some Parties (ATG, BHS, BRB, COL, GUY, KNA, LCA,MNG, TTO) indicated the potential effects of frequent storms and hurricanes on infrastructure, energysystems and tourism. Colombia and Mongolia reported on soil degradation and desertification, and windand water erosion, respectively.
B. Adaptation measures and response strategies
134. Most Parties provided information on adaptation options, measures and/or strategies related toclimate change impacts for a wide range of sectors. Many Parties reported on adaptation options forwater resources and indicated various water policy reforms to be introduced such as those focusing onwater conservation, inter-basin water transfer, desalination, flood management and construction of dams.Some Parties (BFA, BWA, COL, CUB, DMA, GTM, GUY, ETH, HTI) reported on adaptation optionsand/or strategies in agriculture, which varied from development of drought-tolerant crops to improvingearly warning systems, enhancing erosion control, and training and assisting farmers. Other Parties(ATG, BHS, BRB, KNA, LCA, NIU, PAN, PER, PNG) reported on adaptation measures which could beundertaken in coastal zones, namely integrated coastal zone management, and yet others reported onhuman health, forests, tourism, fisheries, human settlements, biodiversity and wildlife. Reportedmeasures included improvement of the health care system, enhancement of forest management,protection of tourism infrastructure, strengthening of environmental legislation and promotion ofconservation.
Methods of assessing and analysing adaptation
135. Many reporting Parties did not provide a clear indication of the methods used in assessing andanalysing adaptation measures. Some Parties used expert judgement based on the GCM results orprojections by impact models. Haiti also used a statistical method while Mongolia reported on the use ofa screening matrix where the selected options were assessed in accordance with a set of criteria. ManyParties identified adaptation strategies and measures without using any particular analytical or evaluationmethod.
Stakeholder participation
136. A few Parties reported on the level of engagement of stakeholders, including policy makers, inthe vulnerability and adaptation process. Mongolia reported that it was important to engage privateenterprises and academic and educational institutions along with government agencies in the planningand implementation of activities, while Guyana, Niue and Trinidad and Tobago indicated that many oftheir activities relating to the vulnerability and adaptation assessment process involved variousstakeholders through consultations and workshops. Niue mentioned the adoption of a participatoryapproach that made it possible to involve stakeholders.
137. A few Parties reported on the participation and collaboration between national experts andinstitutions in vulnerability and adaptation assessment work, and Togo indicated that there was a lowlevel of participation in such work.
VIII. EDUCATION, TRAINING AND PUBLIC AWARENESS
138. All reporting Parties provided information on education, training and/or public awareness.However, the nature, scope and level of detail of information provided varied widely from one Party toanother. Eleven Parties (BWA, CUB, ETH, MNG, NIC, NIU, PER, TCD, TGO, TTO, YEM) dedicated

FCCC/SBI/2002/16Page 26
a separate chapter to at least one of the three issues. The other Parties provided related information inother chapters.
139. Twenty Parties (ATG, BFA, BHS, BWA, CUB, DMA, ETH, GUY, KNA, LCA, MAR, MDV,NIC, NIU, PER, PNG, TCD, TGO, TTO, YEM) reported on the development and implementation ofeducational and public awareness programmes on climate change and its effects. Sixteen Partiesexpressed their need for financial and technical support to address their concerns on education, trainingand public awareness. Twelve Parties reported on actual or needed international cooperation in thedevelopment and exchange of educational and public awareness materials.
A. Education
140. Twenty-one Parties (ATG, BDI, BFA, BWA, CUB, DMA, ETH, GUY, MAR, MDV, MNG,NIC, NIU, PAN, PNG, PRY, SWZ, TGO, TTO, TUN, YEM) provided general information on existinginitiatives and/or future plans to incorporate the issue of climate change into primary, secondary andtertiary educational programmes. Some of these Parties had already started teaching climate change,mainly at university level.
141. Nine reporting Parties (ATG, BFA, CUB, ETH, GUY, MAR, NIU, PNG, TCD) providedinformation on the extent of participation in international and/or regional educational programmes andworkshops relating to climate change.
142. Information on public access to information on climate change and its effects was included in 16initial national communications (ATG, BFA, BWA, CUB, ETH, GUY, LCA, MAR, MDV, NIC, NIU,PAN, PER, TGO, TTO, YEM). Niue indicated its commitment to granting scholarships for the study ofthe science of climate change.
B. Training
143. Twenty-three Parties provided information regarding training on issues related to climate change.The nature of the information and level of detail provided did not allow for clear identification of thefocus and magnitude of training programmes or a clear distinction between actual activities and needs.Only four Parties (ATG, ETH, MDV, TTO) clearly outlined concrete actions and programmes.
144. Sixteen Parties (BFA, BWA, CUB, DMA, ETH, GUY, KNA, LCA, MAR, MDV, MNG, NIU,PNG, PRY, TGO, TTO) indicated target groups for training activities.
145. Twenty Parties highlighted the importance of the various training activities they had beeninvolved in during the preparation of the initial national communication. They indicated the valuableinput they had received from international experts as well as from the various multilateral and bilateraltraining programmes on the different components of the national communication.
146. Six of the reporting Parties (ATG, BHS, CUB, ETH, PER, PNG) provided information on theirparticipation in, and/or organization of, regional and international training programmes and workshops.
147. Eleven Parties expressed the need to have training on specific technical and policy issues relatingto climate change and sustainable development.
148. Seven Parties (BFA, ETH, HTI, MAR, PAN, PNG, TGO) expressed the need to build capacityfor the formulation of climate change project proposals in the required format and/or to access bilateraland multilateral funds for project development and implementation.
149. Cuba provided specific information on the number of sufficiently trained personnel and policymakers it had at its disposal to carry out its obligations under the Convention effectively. It indicated
FCCC/SBI/2002/16Page 27
that it had a critical mass of experts that would guarantee its full participation in future implementationof the UNFCCC and the fulfilment of its commitments under the Convention.
150. Nine Parties (BFA, BRB, GUY, HTI, MAR, NIC, NIU, TGO, TTO) provided information on theneed for existing national centres to promote the exchange of information on climate change.
C. Public awareness
151. Twenty-two reporting Parties stressed the importance of public awareness in the area of climatechange. Several Parties highlighted the challenges they faced in improving public awareness on climatechange. However, information provided on the focus and scope of public awareness programmes wasoften scanty and general in nature.
152. Seven Parties (BHS, CUB, ETH, GUY, HTI, MDV, TTO) provided information on the contentof public awareness materials needed or being used. Four Parties indicated that public awarenessmaterials needed to include basic information on climate change and its effects on the country.
153. Nineteen Parties (ATG, BRB, CUB, DMA, ETH, GUY, HTI, KNA, LCA, MAR, MDV, MNG,NIC, NIU, PER, PNG, PRY, TGO, TTO) reported on the ways and means used for existing and plannedpublic awareness activities. The means employed to improve public awareness included, inter alia,workshops, radio and television programmes, newspapers, films, pamphlets and web sites.
154. Five reporting Parties (COL, KNA, NIU, PNG, TGO) clearly indicated public participation inprogrammes and activities aimed at addressing climate change and its effects at the national level.
155. Nine Parties (ATG, DMA, ETH, KNA, NIC, NIU, PNG, TGO, TTO) reported on planned,ongoing and/or implemented special awareness campaigns for specific groups such as decision makers,journalists, artists, academia, coastal communities, insurance companies and industrialists.
IX. FINANCIAL AND TECHNOLOGICAL NEEDS AND CONSTRAINTS
A. General financial, technological and capacity-building needs and constraints
156. All reporting Parties provided information on the financial, technological and capacity-buildingneeds and constraints they encountered in the preparation of their national communications and theimplementation of the Convention. The level of detail provided by each reporting Party on these issuesvaried considerably and the information presented as constraints and needs was scattered within thevarious chapters of the communications.
157. Almost all Parties acknowledged receiving financial and technical assistance from the GEF andits implementing agencies and other multilateral or bilateral programmes for the preparation of the initialnational communication. Twenty-eight Parties expressed their need for further financial and/or technicalsupport for improving the national communications and/or implementing the Convention, includingsupport for a number of programmes and activities addressing climate change in general.
158. Fourteen Parties (ATG, BDI, BHS, BRB, COL, DMA, ETH, LCA, MDV, NIU, PER, SWZ,TGO, TTO) indicated their needs for capacity-building in the collection, archiving and management ofdata needed for the preparation of national communications. Ten of the reporting Parties (BDI, BFA,BWA, CUB, ETH, MAR, MNG, PAN, TTO, TUN) provided information on their needs for buildingnational capacity for climate change project development and management. The same number of Parties(ATG, BHS, BWA, DMA, ETH, GUY, LCA, MDV, PNG, TTO) reported on the need for buildingcapacities to generally address climate change.

FCCC/SBI/2002/16Page 28
159. Fourteen Parties (ATG, BDI, BFA, BHS, DMA, ETH, KNA, LCA, MDV, NIU, PAN, PRY,TGO, TTO) stressed the need to promote information sharing and networking at the national,subregional/regional, and international levels. Ten Parties (ATG, BHS, DMA, ETH, GUY, KNA, LCA,MAR, MDV, NIU) indicated their needs in relation to the integration of climate change into nationalplanning and policy-making towards sustainable development.
160. Some Parties mentioned the need for better institutional arrangements to enable data collectionand analysis while others indicated the needs for further capacity-building and human resourcedevelopment in the context of the preparation of national communications. Other Parties identifiedimproved coordination and cooperation between relevant institutions and agencies as key factors infacilitating the integration of climate change concerns into policy-making processes. A few Partiesindicated the need to improve the capabilities of national climate change coordinators and nationalinstitutions to manage and coordinate climate change programmes.
B. National greenhouse gas inventories
161. Almost all Parties reported difficulties they encountered in preparing their national GHGinventories and indicated that these stemmed from lack of quality data (including organization andaccessibility of data), lack of technical and institutional capacities, and problems related tomethodologies (emission factors and activity data). Therefore many Parties expressed the need toimprove national activity data collection, archiving, quality, accessibility and management (24 Parties)and to develop appropriate local emission factors (25 Parties). Cuba proposed to undertake furtherresearch to reduce the level of uncertainties in the estimation of CO2 emissions and removals. TwoParties (KNA, LCA) identified the need for assistance and support from the GEF on data collection andmanagement and 10 Parties also indicated the need to enhance national policies for improving GHGinventories.
162. Twenty-two Parties referred to the need to strengthen institutional arrangements for thepreparation of GHG inventories. Tunisia indicated the need for financial support for institutionalstrengthening. Panama mentioned a review of the role of the institutions involved with preparation of theinventory and the need to build capacity for developing a more effective information system. Saint Luciastressed the need for further development of institutional arrangements to ensure data gaps are filled.Guyana reported that the sector agencies do not have the appropriate staff and/or equipment to performrequired tasks.
163. Twenty Parties (ATG, BHS, BRB, BWA, COL, CUB, DMA, ETH, GUY, KNA, LCA, MAR,MDV, NIU, PAN, PNG, TCD, TGO, TTO, TUN) provided information on the need to train personnel inthe compilation and analysis of GHG inventories. Areas identified were improvement of skills in thecollection and compilation of data, establishment of appropriate databases, archiving, analysis anddissemination of data on climate change and GHG emissions, and identification of major sources andsinks.
164. Sixteen Parties provided information on the need to improve GHG inventory methodologiessuitable for use under a range of national circumstances. The Bahamas and Trinidad and Tobago pointedout that carbon sequestration by coral reefs and marine ecosystems should be included in the inventories.Cuba expressed the need for expanding the emission sources and to include their emission factors, andfor financial assistance to acquire or use satellite and aerial photographs for the estimation of emissionremovals in the LUCF sector. Panama reported problems in estimating emissions from waste burning.Niue recommended further disaggregation of tropical forest under LUCF while Botswana proposed thatnatural mortality be taken into account and that anthropogenic savanna fires be separated from naturalones. Tunisia identified the need for improvement of the IPCC methodology relating to transnational gastransport, carbon uptake in arboriculture, soil emissions and solvent use. Peru found that the IPCC
FCCC/SBI/2002/16Page 29
methodologies did not fully account for the estimation of SO2 emissions due to the lack of data for themetal mining industry.
C. Measures for addressing climate change
165. Several problems and constraints and the needs for undertaking specific activities werementioned by Parties relating to the assessment and possible implementation of mitigation options.Among the problems mentioned were inadequate institutional arrangements, lack of information, lack ofunderstanding of the need to undertake GHG mitigation assessment, lack of methods for calculating andanalysing the costs of mitigation measures (CUB), lack of systematized information related to theconditions and quality of forests (NIC), lack of capacity for mitigation analysis and project development(MAR).
166. Parties highlighted several constraints to the possible implementation of mitigation measures,including the lack of public awareness, education, training and/or development in the different sectors(BHS, KNA), lack of tax incentives and/or policies that promote the introduction, production and use ofmore efficient appliances, as well as the use of renewable sources of energy (NIC), aversion to the risk ofadopting new technologies, higher cost of mitigation technologies, lack of public and political support forthe implementation of mitigation measures and lack of long-term policy in the transport sector (MAR),absence of a suitable database on wind measurements for potential applications (ATG) and barriers totransfer of the appropriate technologies (GUY).
167. Some Parties provided information on the barriers to implementing the mitigation measuresidentified in the proposed projects. These barriers often related to lack of financial resources, policy,technology awareness, economic benefits and capacity. Panama mentioned that, due to the privatizationof its energy sector, the number of projects for alternative sources of energy had diminished and that theywere not likely to emerge in the short-term. Peru also stressed that the pre-feasibility study on improvingthe energy efficiency of industrial boilers demonstrated that, in some cases, the mitigation options wereprofitable, but they would not be assumed by the private sector. Morocco indicated a low level of energyconsumption in rural areas, and difficulties in reducing energy use from biomass and changingagricultural practices.
D. Assessment of vulnerability to climate change
168. Twenty Parties reported on problems and constraints in, and the need for, assistance forvulnerability assessments (ATG, BDI, BFA, BHS, BRB, BWA, COL, CUB, DMA, GUY, KNA, MAR,MNG, NIU, PAN, PER, PNG, TGO, TTO, TUN). The needs related mainly to upgrading of researchcapacity, data collection and analysis on vulnerability and adaptation measures, and of human capacityand skills to assess and respond to the impacts of climate change. Ten Parties (ATG, BDI, BFA, BHS,DMA, ETH, KNA, NIU, PAN, TGO) highlighted the need for enhancing the performance of models usedfor developing climate change scenarios so as to improve the results of vulnerability studies. Otheridentified needs were financial and technological resources, institutional strengthening, and thedetermination of the cost of identified measures. The areas of focus varied according to Parties’circumstances and very often included agriculture, water resources, coastal zones and human health.
169. Four Parties (DMA, GUY, KNA, NIU) indicated the need for more in-depth vulnerability andadaptation studies on sectors such as coastal zones, forestry, agriculture, marine resources and coralreefs. In the case of Botswana, assistance was requested for the assessment of the vulnerability ofwildlife, the interpretation of complex data sets and the interaction of human-environment systems. Peruneeded technology transfer to identify disease vectors. Burkina Faso expressed the need for assistance inmodelling and improvement of methodologies for vulnerability and adaptation assessments.

FCCC/SBI/2002/16Page 30
170. Many Parties provided information on their needs and priorities for education, training andresearch relating to vulnerability and adaptation assessments. Sixteen Parties emphasized the need fortraining while 14 Parties emphasized research. The needs for training and education primarily concernedstrengthening human and institutional capacities to undertake in-depth research on vulnerability andadaptation in various sectors.
171. Some Parties envisaged the need for improving projections of future changes in temperature andprecipitation as well as reducing the level of uncertainty in vulnerability and adaptation assessments.Togo identified model development as an important factor in this context. Four Parties (ATG, DMA,GUY, TGO) reported a low level of national capacity and expertise in vulnerability and adaptationassessment work, and emphasized the need for promoting regional and international cooperation,networking and sharing of information, pooling of resources and transfer of appropriate technologies onvulnerability and adaptation.
172. Three Parties (CUB, DMA, TTO) emphasized the need to strengthen existing institutions to carryout further work on adaptation to climate change. Paraguay identified training of technical staff toundertake the task of making vulnerability and adaptation assessments, and Guyana particularlyemphasized the need for equipment and trained personnel. Cuba reported the need to strengthen itsnational surveillance and observation systems.
E. Measures to facilitate adaptation
173. Many of the reporting Parties (ATG, BFA, BHS, BRB, CUB, DMA, ETH, GUY, KNA, MAR,MNG, NIC, NIU, PER, PNG, TGO, TTO, TUN) provided information on the financial and technologicalneeds to support and facilitate the identification, evaluation and/or implementation of measures to adaptto the adverse impacts of climate change.
174. Needs identified by Parties on adaptation comprised improving human and institutionalcapacities, improving methodologies and models, promoting awareness of the community-basedorganizations and government and private sector institutions on issues relating to adaptation, promotingthe transfer of adaptation technologies, and improving scientific research, data collection and analysis.Adaptation measures were identified in the agriculture, water resources, human health, coastal zones,forestry and biodiversity sectors.
175. Some Parties indicated the need for more detailed in-depth studies in order to formulateadaptation measures. Antigua and Barbuda mentioned that adaptation options should be cross-sectoraland aimed at reducing existing vulnerabilities and also building capacities for enabling sustainabledevelopment. Cuba indicated that most of the measures proposed had been considered in its presentlegislation and in the national strategies for the conservation and protection of natural resources.
176. Antigua and Barbuda mentioned the need to establish a framework process for applying andintegrating adaptation measures into national development, and Maldives expressed the need tostrengthen the legal, institutional and administrative arrangements to respond to the effects of climatechange. Dominica reported on the need to facilitate the adaptation process while Niue advocated theintegration of measures into national planning processes.
F. Research and systematic observation
177. Many of the problems, difficulties and constraints relating to research and systematic observationfor some reporting Parties were broadly identified as lack of financial resources and technical supportand lack of human capacities and capabilities. For instance, lack of financial resources imposed severerestrictions on technical and logistical support for institutions and agencies responsible for collecting,collating, managing and using meteorological and hydrological data. Lack of financial resources and

FCCC/SBI/2002/16Page 31
human capabilities also limited the capacity to adequately monitor environmental and climatologicalparameters in areas where such gaps existed.
178. In terms of gaps, needs and priorities for systematic observation, 17 reporting Parties indicatedthat many significant gaps existed, particularly for establishing new monitoring stations, improvingtechnical capacities and capabilities, upgrading and maintaining equipment, coordinating andstrengthening institutions responsible for education, training and research, particularly in the science ofmeteorology and climatology, database development and management, and upgrading, rehabilitating andstrengthening existing observation systems, stations and networks. Other priority needs includeddetection and prediction of climate change, improvement of systems for collection, management and useof data and the capacity to maintain equipment on a regular basis. Eighteen reporting Parties (ATG, BDI,BHS, BRB, CUB, DMA, ETH, GUY, KNA, LCA, MAR, MDV, MNG, PAN, PER, PNG, PRY, TGO)expressed the need for improving research and systematic observation through capacity-building inscientific research, and for development of a wide range of educational materials.
179. Fifteen reporting Parties (ATG, BFA, BRB, COL, CUB, ETH, GUY, MAR, MDV, NIC, PAN,PER, TGO, TTO, TUN) drew attention to the need to strengthen universities and research institutions toundertake climate change studies. Maldives indicated the need to establish partnerships with otherinternational research institutions, and other small island countries, on research related to climate changeand sea-level rise, while Nicaragua indicated the need to fund teaching activities at universities and toencourage undergraduate teaching and research in climate change issues.
G. Education, training and public awareness
180. Twenty-five Parties (ATG, BDI, BFA, BHS, BRB, BWA, CUB, DMA, ETH, GUY, KNA, LCA,MAR, MDV, MNG, NIC, NIU, PAN, PER, PNG, PRY, TGO, TTO, TUN, YEM) provided informationon the need for developing or improving national programmes for formal and non-formal education, aswell as raising awareness on climate change issues in academic and research institutions and among thepublic at large. Five reporting Parties (BFA, MDV, NIU, PER, PNG) mentioned the need for sharing ofpublic awareness materials and development and dissemination of awareness materials in locallanguages. Thirteen of the reporting Parties (ATG, BFA, BHS, BRB, CUB, GUY, MAR, NIU, PAN,PNG, TGO, TTO, TUN) indicated a need for the establishment and/or enhancement of national and/orregional centres of excellence in order to improve the exchange of information between stakeholders andto facilitate public access to information on climate change.
181. Two Parties (MAR, MDV) reported on the need for assistance for the development ofeducational materials and four Parties (BFA, ETH, MAR, TGO) highlighted the need for training ofmedia practitioners in developing or updating climate change awareness materials. One Party (TGO)expressed the need for common methodologies and approaches for training programmes on education,training and public awareness.
182. Twelve Parties (ATG, BHS, BRB, COL, CUB, DMA, MAR, MNG, PER, PRY, TGO, TUN)reported on the need for information exchange among national, regional and international experts, andintergovernmental and non-governmental organizations on research and systematic observation. Antiguaand Barbuda, Barbados, the Bahamas and Dominica mentioned the various organizations andprogrammes in the Caribbean region, such as the Caribbean Meteorological Organization, the CaribbeanInstitute of Meteorology and Hydrology, the Caribbean Foresters’ Society and the Caribbean Planningfor Adaptation to Climate Change, as important regional cooperation initiatives which would needstrengthening. Cuba stressed the collaborative role of its experts in the region while Tunisia reported onthe need to create a climate change network to promote information exchange and cooperation.
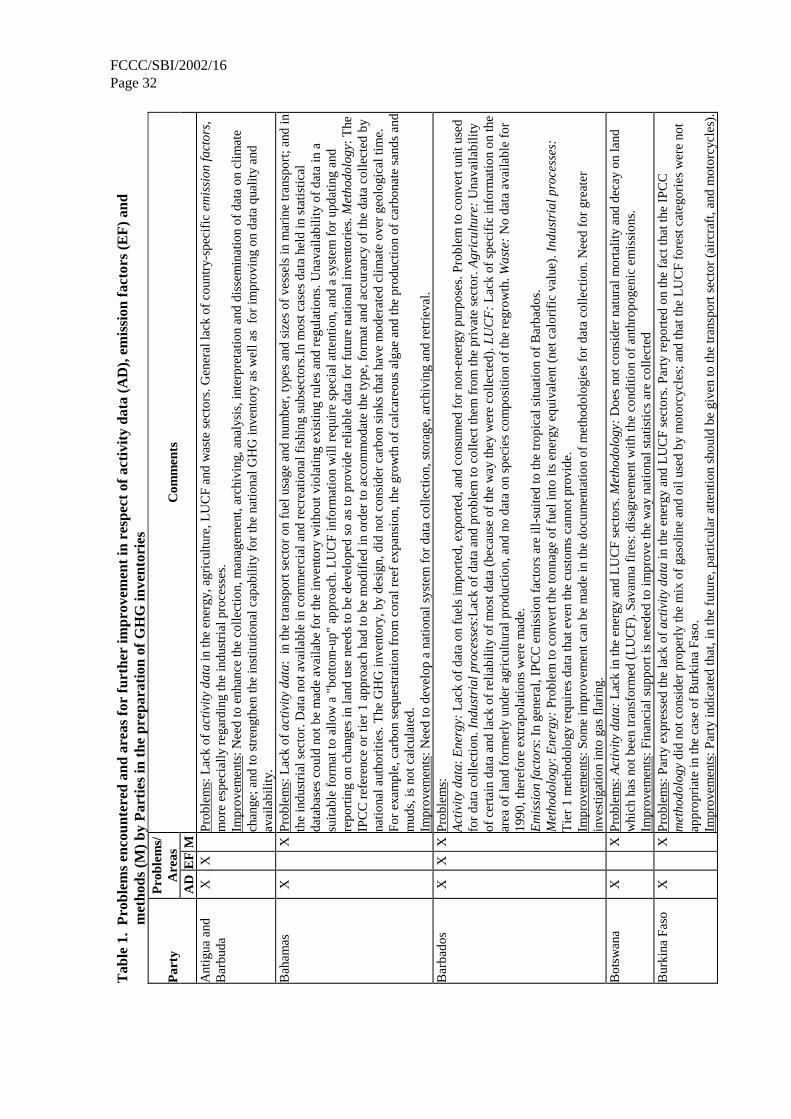
FCCC/SBI/2002/16Page 32
Tab
le1.
Pro
blem
sen
coun
tere
dan
dar
eas
for
furt
her
impr
ovem
ent
inre
spec
tof
acti
vity
data
(AD
),em
issi
onfa
ctor
s(E
F)
and
met
hods
(M)
byP
arti
esin
the
prep
arat
ion
ofG
HG
inve
ntor
ies
Pro
blem
s/A
reas
Par
tyA
DE
FM
Com
men
ts
Ant
igua
and
Bar
buda
XX
Pro
blem
s:L
ack
ofac
tivi
tyda
tain
the
ener
gy,a
gric
ultu
re,L
UC
Fan
dw
aste
sect
ors.
Gen
eral
lack
ofco
untr
y-sp
ecif
icem
issi
onfa
ctor
s,m
ore
espe
cial
lyre
gard
ing
the
indu
stri
alpr
oces
ses.
Impr
ovem
ents
:Nee
dto
enha
nce
the
colle
ctio
n,m
anag
emen
t,ar
chiv
ing,
anal
ysis
,int
erpr
etat
ion
and
diss
emin
atio
nof
data
oncl
imat
ech
ange
;and
tost
reng
then
the
inst
itutio
nalc
apab
ility
for
the
natio
nalG
HG
inve
ntor
yas
wel
las
for
impr
ovin
gon
data
qual
ityan
dav
aila
bilit
y.B
aham
asX
XP
robl
ems:
Lac
kof
acti
vity
data
:in
the
tran
spor
tsec
tor
onfu
elus
age
and
num
ber,
type
san
dsi
zes
ofve
ssel
sin
mar
ine
tran
spor
t;an
din
the
indu
stri
alse
ctor
.Dat
ano
tava
ilabl
ein
com
mer
cial
and
recr
eatio
nalf
ishi
ngsu
bsec
tors
.In
mos
tcas
esda
tahe
ldin
stat
istic
alda
taba
ses
coul
dno
tbe
mad
eav
aila
befo
rth
ein
vent
ory
with
outv
iola
ting
exis
ting
rule
san
dre
gula
tions
.Una
vaila
bilit
yof
data
ina
suita
ble
form
atto
allo
wa
"bot
tom
-up"
appr
oach
.LU
CF
info
rmat
ion
will
requ
ire
spec
iala
ttent
ion,
and
asy
stem
for
upda
ting
and
repo
rtin
gon
chan
ges
inla
ndus
ene
eds
tobe
deve
lope
dso
asto
prov
ide
relia
ble
data
for
futu
rena
tiona
linv
ento
ries
.Met
hodo
logy
:The
IPC
Cre
fere
nce
orti
er1
appr
oach
had
tobe
mod
ifie
din
orde
rto
acco
mm
odat
eth
ety
pe,f
orm
atan
dac
cura
ncy
ofth
eda
taco
llec
ted
byna
tiona
laut
hori
ties.
The
GH
Gin
vent
ory,
byde
sign
,did
notc
onsi
der
carb
onsi
nks
that
have
mod
erat
edcl
imat
eov
erge
olog
ical
time.
For
exam
ple,
carb
onse
ques
trat
ion
from
cora
lree
fex
pans
ion,
the
grow
thof
calc
areo
usal
gae
and
the
prod
ucti
onof
carb
onat
esa
nds
and
mud
s,is
notc
alcu
late
d.Im
prov
emen
ts:N
eed
tode
velo
pa
natio
nals
yste
mfo
rda
taco
llect
ion,
stor
age,
arch
ivin
gan
dre
trie
val.
Bar
bado
sX
XX
Pro
blem
s:A
ctiv
ity
data
:Ene
rgy:
Lac
kof
data
onfu
els
impo
rted
,exp
orte
d,an
dco
nsum
edfo
rno
n-en
ergy
purp
oses
.Pro
blem
toco
nver
tuni
tuse
dfo
rda
taco
llect
ion.
Indu
stri
alpr
oces
ses:
Lac
kof
data
and
prob
lem
toco
llec
tthe
mfr
omth
epr
ivat
ese
ctor
.Agr
icul
ture
:U
nava
ilabi
lity
ofce
rtai
nda
taan
dla
ckof
relia
bilit
yof
mos
tdat
a(b
ecau
seof
the
way
they
wer
eco
llect
ed).
LU
CF
:L
ack
ofsp
ecif
icin
form
atio
non
the
area
ofla
ndfo
rmer
lyun
der
agri
cultu
ralp
rodu
ctio
n,an
dno
data
onsp
ecie
sco
mpo
sitio
nof
the
regr
owth
.Was
te:
No
data
avai
labl
efo
r19
90,t
here
fore
extr
apol
atio
nsw
ere
mad
e.E
mis
sion
fact
ors:
Inge
nera
l,IP
CC
emis
sion
fact
ors
are
ill-s
uite
dto
the
trop
ical
situ
atio
nof
Bar
bado
s.M
etho
dolo
gy:E
nerg
y:P
robl
emto
conv
ertt
heto
nnag
eof
fuel
into
itsen
ergy
equi
vale
nt(n
etca
lori
fic
valu
e).I
ndus
tria
lpro
cess
es:
Tie
r1
met
hodo
logy
requ
ires
data
that
even
the
cust
oms
cann
otpr
ovid
e.Im
prov
emen
ts:S
ome
impr
ovem
entc
anbe
mad
ein
the
docu
men
tatio
nof
met
hodo
logi
esfo
rda
taco
llect
ion.
Nee
dfo
rgr
eate
rin
vest
igat
ion
into
gas
flar
ing.
Bot
swan
aX
XP
robl
ems:
Act
ivit
yda
ta:
Lac
kin
the
ener
gyan
dL
UC
Fse
ctor
s.M
etho
dolo
gy:
Doe
sno
tcon
side
rna
tura
lmor
talit
yan
dde
cay
onla
ndw
hich
has
notb
een
tran
sfor
med
(LU
CF)
.Sav
anna
fire
s:di
sagr
eem
entw
ith
the
cond
itio
nof
anth
ropo
geni
cem
issi
ons.
Impr
ovem
ents
:Fin
anci
alsu
ppor
tis
need
edto
impr
ove
the
way
natio
nals
tatis
tics
are
colle
cted
Bur
kina
Faso
XX
Pro
blem
s:P
arty
expr
esse
dth
ela
ckof
acti
vity
data
inth
een
ergy
and
LU
CF
sect
ors.
Par
tyre
port
edon
the
fact
that
the
IPC
Cm
etho
dolo
gydi
dno
tcon
side
rpr
oper
lyth
em
ixof
gaso
line
and
oilu
sed
bym
otor
cycl
es;a
ndth
atth
eL
UC
Ffo
rest
cate
gori
esw
ere
not
appr
opri
ate
inth
eca
seof
Bur
kina
Faso
.Im
prov
emen
ts:P
arty
indi
cate
dth
at,i
nth
efu
ture
,par
ticu
lar
atte
ntio
nsh
ould
begi
ven
toth
etr
ansp
orts
ecto
r(a
ircr
aft,
and
mot
orcy
cles
).
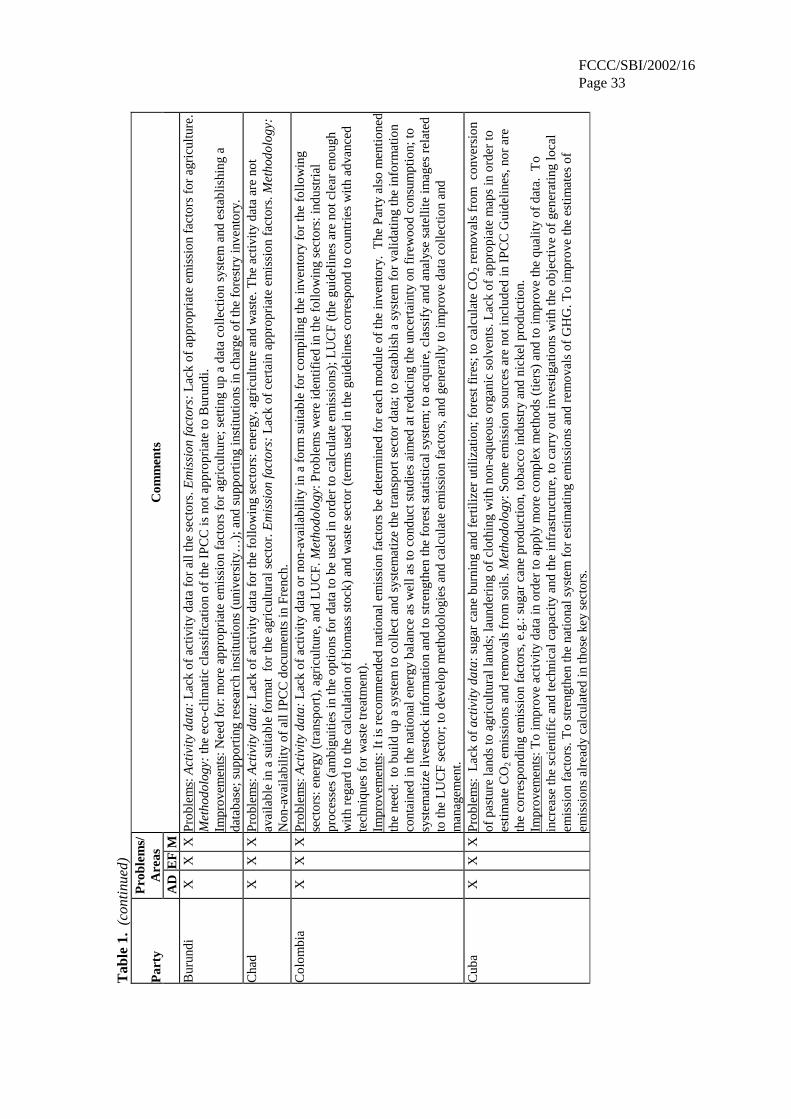
FCCC/SBI/2002/16Page 33
Tab
le1.
(con
tinu
ed)
Pro
blem
s/A
reas
Par
tyA
DE
FM
Com
men
ts
Bur
undi
XX
XP
robl
ems:
Act
ivit
yda
ta:
Lac
kof
activ
ityda
tafo
ral
lthe
sect
ors.
Em
issi
onfa
ctor
s:L
ack
ofap
prop
riat
eem
issi
onfa
ctor
sfo
rag
ricu
lture
.M
etho
dolo
gy:
the
eco-
clim
atic
clas
sifi
catio
nof
the
IPC
Cis
nota
ppro
pria
teto
Bur
undi
.Im
prov
emen
ts:N
eed
for:
mor
eap
prop
riat
eem
issi
onfa
ctor
sfo
rag
ricu
lture
;set
ting
upa
data
colle
ctio
nsy
stem
and
esta
blis
hing
ada
taba
se;s
uppo
rtin
gre
sear
chin
stit
utio
ns(u
nive
rsit
y…);
and
supp
orti
ngin
stit
utio
nsin
char
geof
the
fore
stry
inve
ntor
y.C
had
XX
XP
robl
ems:
Act
ivit
yda
ta:
Lac
kof
activ
ityda
tafo
rth
efo
llow
ing
sect
ors:
ener
gy,a
gric
ultu
rean
dw
aste
.The
activ
ityda
taar
eno
tav
aila
ble
ina
suita
ble
form
atfo
rth
eag
ricu
ltura
lsec
tor.
Em
issi
onfa
ctor
s:L
ack
ofce
rtai
nap
prop
riat
eem
issi
onfa
ctor
s.M
etho
dolo
gy:
Non
-ava
ilabi
lity
ofal
lIP
CC
docu
men
tsin
Fren
ch.
Col
ombi
aX
XX
Pro
blem
s:A
ctiv
ity
data
:L
ack
ofac
tivity
data
orno
n-av
aila
bilit
yin
afo
rmsu
itabl
efo
rco
mpi
ling
the
inve
ntor
yfo
rth
efo
llow
ing
sect
ors:
ener
gy(t
rans
port
),ag
ricu
lture
,and
LU
CF.
Met
hodo
logy
:Pro
blem
sw
ere
iden
tifie
din
the
follo
win
gse
ctor
s:in
dust
rial
proc
esse
s(a
mbi
guiti
esin
the
optio
nsfo
rda
tato
beus
edin
orde
rto
calc
ulat
eem
issi
ons)
;LU
CF
(the
guid
elin
esar
eno
tcle
aren
ough
wit
hre
gard
toth
eca
lcul
atio
nof
biom
ass
stoc
k)an
dw
aste
sect
or(t
erm
sus
edin
the
guid
elin
esco
rres
pond
toco
untr
ies
wit
had
vanc
edte
chni
ques
for
was
tetr
eatm
ent)
.Im
prov
emen
ts:I
tis
reco
mm
ende
dna
tion
alem
issi
onfa
ctor
sbe
dete
rmin
edfo
rea
chm
odul
eof
the
inve
ntor
y.T
heP
arty
also
men
tion
edth
ene
ed:
tobu
ildup
asy
stem
toco
llect
and
syst
emat
ize
the
tran
spor
tsec
tor
data
;to
esta
blis
ha
syst
emfo
rva
lidat
ing
the
info
rmat
ion
cont
aine
din
the
natio
nale
nerg
yba
lanc
eas
wel
las
toco
nduc
tstu
dies
aim
edat
redu
cing
the
unce
rtai
nty
onfi
rew
ood
cons
umpt
ion;
tosy
stem
atiz
eliv
esto
ckin
form
atio
nan
dto
stre
ngth
enth
efo
rest
stat
istic
alsy
stem
;to
acqu
ire,
clas
sify
and
anal
yse
sate
llite
imag
esre
late
dto
the
LU
CF
sect
or;t
ode
velo
pm
etho
dolo
gies
and
calc
ulat
eem
issi
onfa
ctor
s,an
dge
nera
llyto
impr
ove
data
colle
ctio
nan
dm
anag
emen
t.C
uba
XX
XP
robl
ems:
Lac
kof
acti
vity
data
:sug
arca
nebu
rnin
gan
dfe
rtili
zer
utili
zatio
n;fo
rest
fire
s;to
calc
ulat
eC
O2
rem
oval
sfr
omco
nver
sion
ofpa
stur
ela
nds
toag
ricu
ltur
alla
nds;
laun
deri
ngof
clot
hing
wit
hno
n-aq
ueou
sor
gani
cso
lven
ts.L
ack
ofap
prop
iate
map
sin
orde
rto
estim
ate
CO
2em
issi
ons
and
rem
oval
sfr
omso
ils.M
etho
dolo
gy:S
ome
emis
sion
sour
ces
are
noti
nclu
ded
inIP
CC
Gui
deli
nes,
nor
are
the
corr
espo
ndin
gem
issi
onfa
ctor
s,e.
g.:s
ugar
cane
prod
ucti
on,t
obac
coin
dust
ryan
dni
ckel
prod
ucti
on.
Impr
ovem
ents
:To
impr
ove
activ
ityda
tain
orde
rto
appl
ym
ore
com
plex
met
hods
(tie
rs)
and
toim
prov
eth
equ
ality
ofda
ta.
To
incr
ease
the
scie
ntif
ican
dte
chni
calc
apac
ityan
dth
ein
fras
truc
ture
,to
carr
you
tinv
estig
atio
nsw
ithth
eob
ject
ive
ofge
nera
ting
loca
lem
issi
onfa
ctor
s.T
ost
reng
then
the
natio
nals
yste
mfo
res
timat
ing
emis
sion
san
dre
mov
als
ofG
HG
.To
impr
ove
the
estim
ates
ofem
issi
ons
alre
ady
calc
ulat
edin
thos
eke
yse
ctor
s.
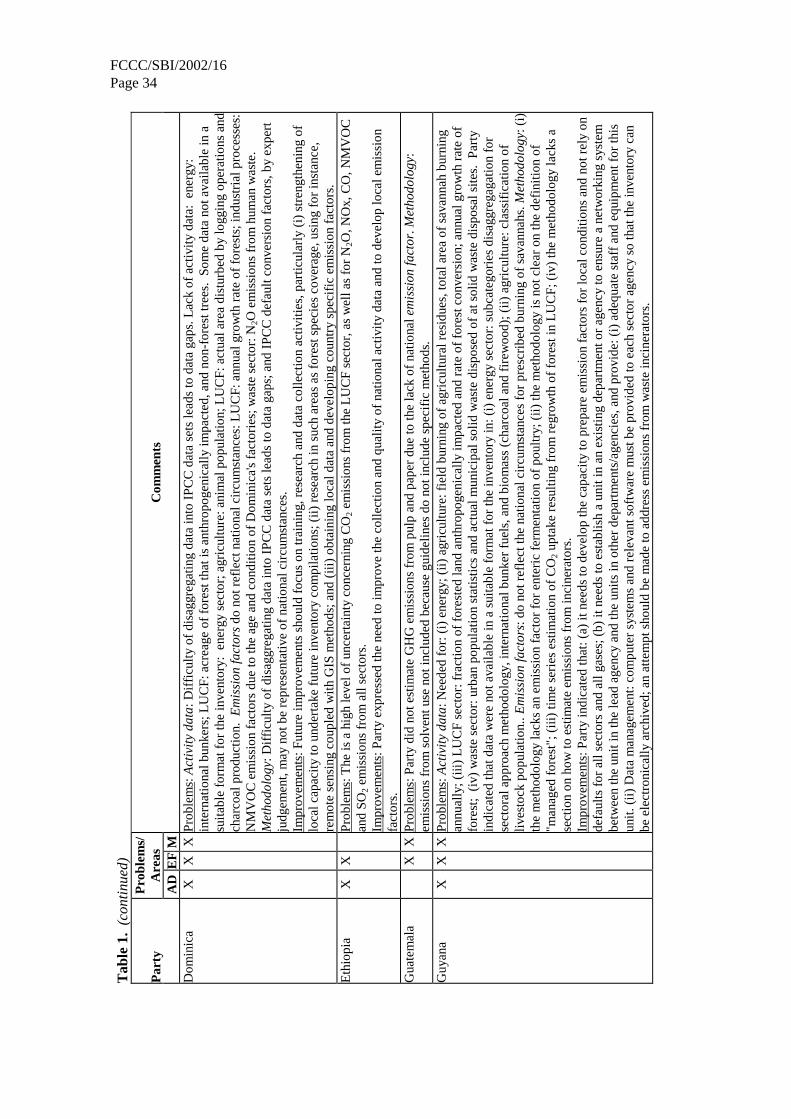
FCCC/SBI/2002/16Page 34
Tab
le1.
(con
tinu
ed)
Pro
blem
s/A
reas
Par
tyA
DE
FM
Com
men
ts
Dom
inic
aX
XX
Pro
blem
s:A
ctiv
ity
data
:Dif
ficu
lty
ofdi
sagg
rega
ting
data
into
IPC
Cda
tase
tsle
ads
toda
taga
ps.L
ack
ofac
tivi
tyda
ta:
ener
gy:
inte
rnat
iona
lbun
kers
;LU
CF:
acre
age
offo
rest
that
isan
thro
poge
nica
llyim
pact
ed,a
ndno
n-fo
rest
tree
s.So
me
data
nota
vaila
ble
ina
suita
ble
form
atfo
rth
ein
vent
ory:
ener
gyse
ctor
;agr
icul
ture
:ani
mal
popu
latio
n;L
UC
F:ac
tual
area
dist
urbe
dby
logg
ing
oper
atio
nsan
dch
arco
alpr
oduc
tion
.E
mis
sion
fact
ors
dono
tref
lect
natio
nalc
ircu
mst
ance
s:L
UC
F:an
nual
grow
thra
teof
fore
sts;
indu
stri
alpr
oces
ses:
NM
VO
Cem
issi
onfa
ctor
sdu
eto
the
age
and
cond
ition
ofD
omin
ica'
sfa
ctor
ies;
was
tese
ctor
:N2O
emis
sion
sfr
omhu
man
was
te.
Met
hodo
logy
:Dif
ficu
lty
ofdi
sagg
rega
ting
data
into
IPC
Cda
tase
tsle
ads
toda
taga
ps;a
ndIP
CC
defa
ultc
onve
rsio
nfa
ctor
s,by
expe
rtju
dgem
ent,
may
notb
ere
pres
enta
tive
ofna
tiona
lcir
cum
stan
ces.
Impr
ovem
ents
:Fut
ure
impr
ovem
ents
shou
ldfo
cus
ontr
aini
ng,r
esea
rch
and
data
colle
ctio
nac
tiviti
es,p
artic
ular
ly(i
)st
reng
then
ing
oflo
calc
apac
ity
toun
dert
ake
futu
rein
vent
ory
com
pila
tion
s;(i
i)re
sear
chin
such
area
sas
fore
stsp
ecie
sco
vera
ge,u
sing
for
inst
ance
,re
mot
ese
nsin
gco
uple
dw
ithG
ISm
etho
ds;a
nd(i
ii)ob
tain
ing
loca
ldat
aan
dde
velo
ping
coun
try
spec
ific
emis
sion
fact
ors.
Eth
iopi
aX
XP
robl
ems:
The
isa
high
leve
lof
unce
rtai
nty
conc
erni
ngC
O2
emis
sion
sfr
omth
eL
UC
Fse
ctor
,as
wel
las
for
N2O
,NO
x,C
O,N
MV
OC
and
SO2
emis
sion
sfr
omal
lsec
tors
.Im
prov
emen
ts:P
arty
expr
esse
dth
ene
edto
impr
ove
the
colle
ctio
nan
dqu
ality
ofna
tiona
lact
ivity
data
and
tode
velo
plo
cale
mis
sion
fact
ors.
Gua
tem
ala
XX
Pro
blem
s:P
arty
did
note
stim
ate
GH
Gem
issi
ons
from
pulp
and
pape
rdu
eto
the
lack
ofna
tiona
lem
issi
onfa
ctor
.Met
hodo
logy
:em
issi
ons
from
solv
entu
seno
tinc
lude
dbe
caus
egu
idel
ines
dono
tinc
lude
spec
ific
met
hods
.G
uyan
aX
XX
Pro
blem
s:A
ctiv
ity
data
:Nee
ded
for:
(i)
ener
gy;(
ii)ag
ricu
lture
:fie
ldbu
rnin
gof
agri
cultu
ralr
esid
ues,
tota
lare
aof
sava
nnah
burn
ing
annu
ally
;(iii
)L
UC
Fse
ctor
:fra
ctio
nof
fore
sted
land
anth
ropo
geni
cally
impa
cted
and
rate
offo
rest
conv
ersi
on;a
nnua
lgro
wth
rate
offo
rest
;(i
v)w
aste
sect
or:u
rban
popu
latio
nst
atis
tics
and
actu
alm
unic
ipal
solid
was
tedi
spos
edof
atso
lidw
aste
disp
osal
site
s.P
arty
indi
cate
dth
atda
taw
ere
nota
vail
able
ina
suit
able
form
atfo
rth
ein
vent
ory
in:(
i)en
ergy
sect
or:s
ubca
tego
ries
disa
ggre
gaga
tion
for
sect
oral
appr
oach
met
hodo
logy
,int
erna
tiona
lbun
ker
fuel
s,an
dbi
omas
s(c
harc
oala
ndfi
rew
ood)
;(ii)
agri
cultu
re:c
lass
ific
atio
nof
lives
tock
popu
latio
n..E
mis
sion
fact
ors:
dono
tref
lect
the
natio
nalc
ircu
mst
ance
sfo
rpr
escr
ibed
burn
ing
ofsa
vann
ahs.
Met
hodo
logy
:(i)
the
met
hodo
logy
lack
san
emis
sion
fact
orfo
ren
teri
cfe
rmen
tati
onof
poul
try;
(ii)
the
met
hodo
logy
isno
tcle
aron
the
defi
niti
onof
"man
aged
fore
st";
(iii)
time
seri
eses
timat
ion
ofC
O2
upta
kere
sult
ing
from
regr
owth
offo
rest
inL
UC
F;(
iv)
the
met
hodo
logy
lack
sa
sect
ion
onho
wto
estim
ate
emis
sion
sfr
omin
cine
rato
rs.
Impr
ovem
ents
:Par
tyin
dica
ted
that
:(a)
itne
eds
tode
velo
pth
eca
paci
tyto
prep
are
emis
sion
fact
ors
for
loca
lcon
ditio
nsan
dno
trel
yon
defa
ults
for
alls
ecto
rsan
dal
lgas
es;(
b)it
need
sto
esta
blis
ha
unit
inan
exis
ting
depa
rtm
ento
rag
ency
toen
sure
ane
twor
king
syst
embe
twee
nth
eun
itin
the
lead
agen
cyan
dth
eun
its
inot
her
depa
rtm
ents
/age
ncie
s,an
dpr
ovid
e:(i
)ad
equa
test
aff
and
equi
pmen
tfor
this
unit
.(ii
)D
ata
man
agem
ent:
com
pute
rsy
stem
san
dre
leva
ntso
ftw
are
mus
tbe
prov
ided
toea
chse
ctor
agen
cyso
that
the
inve
ntor
yca
nbe
elec
tron
ical
lyar
chiv
ed;a
nat
tem
ptsh
ould
bem
ade
toad
dres
sem
issi
ons
from
was
tein
cine
rato
rs.

FCCC/SBI/2002/16Page 35
Tab
le1.
(con
tinu
ed)
Pro
blem
s/A
reas
Par
tyA
DE
FM
Com
men
ts
Mal
dive
sX
XP
robl
ems:
Lac
kof
deta
iled
acti
vity
data
requ
ired
for
the
sect
oral
appr
oach
was
the
bigg
ests
hort
com
ing.
Dat
aw
ere
nota
vaila
ble
toes
tim
ate
GH
Gem
issi
ons
inal
lsec
tors
.Unc
erta
inti
esm
ayar
ise
from
the
use
ofde
faul
tem
issi
onfa
ctor
sno
tapp
ropr
iate
toth
elo
cal
circ
umst
ance
s.Im
prov
emen
ts:P
arty
men
tione
dth
ene
edfo
rtr
aini
ngin
colle
ctin
gst
atis
tical
data
and
mod
ifyi
ngth
eIP
CC
Gui
deli
nes
toca
ptur
eth
esm
alls
cale
ofG
HG
emis
sion
sin
the
Mal
dive
s.M
ongo
liaX
XP
robl
ems:
Lac
kof
relia
ble
activ
ityda
tain
gene
ral.
Met
hodo
logy
:The
use
ofth
eIP
CC
defa
ultc
oeff
icie
nts
likel
yin
trod
uces
som
eun
cert
aint
yin
the
GH
Ges
timat
es.P
arty
men
tione
dth
at"a
nthr
opog
enic
step
pean
dfo
rest
fire
sw
ere
noti
nclu
ded
inna
tiona
lem
issi
onto
tals
beca
use
the
IPC
CG
uide
line
sdo
notc
onsi
der
this
anan
thro
poge
nic
sour
ceat
this
tim
e".T
heIP
CC
Gui
deli
nes
dono
trec
ogni
zeso
me
coun
try-
spec
ific
sour
ces
ofG
HG
emis
sion
s(e
.g.,
min
ing
asa
sour
ceof
CO
2be
caus
eit
requ
ires
conv
ersi
onof
gras
slan
dsto
min
esi
tes.
Mor
occo
XX
XP
robl
ems:
Lac
kof
acti
vity
data
onse
ctor
alen
ergy
cons
umpt
ion,
bunk
erfu
els,
and
fore
stry
.Reg
ardi
ngth
em
etho
dolo
gyth
eP
arty
men
tion
edth
atem
issi
ons
from
fuel
woo
dco
mbu
stio
nsh
ould
beac
coun
ted
for
inth
een
ergy
sect
oran
dno
tthe
LU
CF
sect
or.
Impr
ovem
ents
:Nee
dto
impr
ove
both
activ
ityda
taan
dem
issi
onfa
ctor
s.N
icar
agua
XP
robl
ems:
The
lack
ofac
tivi
tyda
ta,o
rth
eir
avai
labi
lity
inan
unsu
itabl
efo
rmat
,im
plie
dm
ore
freq
uent
use
ofex
pert
judg
emen
t.Im
prov
emen
ts:N
eed
toim
prov
eth
equ
ality
ofac
tivity
data
inL
UC
F(d
evel
opa
natio
nalf
ores
tinv
ento
ry).
Niu
eX
XX
Pro
blem
s:A
ctiv
ity
data
:L
arge
gaps
inac
tivi
tyda
taco
llec
tion
wer
ein
dica
ted.
Spec
ific
sect
ors
notr
epor
ted
for
lack
ofac
tivi
tyda
taar
esm
all-
scal
eco
ttage
indu
stri
es.I
twas
diff
icul
tto
diff
eren
tiate
the
resi
dent
ialf
rom
the
agri
cultu
re/f
ores
try/
fish
erie
sse
ctor
due
toa
larg
eam
ount
ofun
reco
rded
data
and
disc
repa
ncie
sw
ithi
nth
eda
taav
aila
ble.
Inad
diti
on,1
994
for
Niu
e,di
dno
tgiv
ea
true
repr
esen
tati
onof
the
actu
algr
eenh
ouse
gas
emis
sion
sdu
eto
maj
orco
nstr
uctio
nan
dde
velo
pmen
twor
kun
dert
aken
onth
eis
land
inth
atye
ar.E
mis
sion
fact
ors
and
met
hodo
logy
:P
arty
felt
that
the
IPC
CG
uide
line
san
dde
faul
tval
ues
wer
eex
cess
ive
for
such
asm
alli
slan
dna
tion
wit
ha
negl
igib
lepo
pula
tion
base
.T
heIP
CC
defa
ultv
alue
sfo
rL
UC
Fw
hich
wer
eus
edw
ere
very
gene
ralf
ortr
opic
alfo
rest
;the
refo
reP
arty
felt
that
ther
esh
ould
have
been
afu
rthe
rdi
sagg
rega
tion
ofth
etr
opic
alfo
rest
into
smal
ler
cate
gori
es.

FCCC/SBI/2002/16Page 36
Tab
le1.
(con
tinu
ed)
Pro
blem
s/A
reas
Par
tyA
DE
FM
Com
men
ts
Pan
ama
XX
Pro
blem
s:L
ack
ofse
ctor
alac
tivi
tyda
ta,a
sw
ella
sla
ckof
syst
emat
izat
ion
and
stan
dard
izat
ion
ofth
eac
tivi
tyda
ta.C
once
rnin
gL
UL
UC
F,a
mor
ede
talie
dan
alys
isof
the
sate
llite
imag
esan
dae
rial
phot
ogra
phs
shou
ldbe
carr
ied
out,
inor
der
tode
term
ine
with
mor
epr
ecis
ion
the
diff
eren
tcla
sses
ofve
geta
tion
.The
nati
onal
ener
gyba
lanc
eis
notp
rodu
ced
ona
regu
lar
basi
san
ym
ore.
Lac
kof
wel
ltra
ined
staf
f,ab
leto
man
age
data
.Met
hodo
logy
:The
IPC
CG
uide
lines
dono
tpre
sent
am
etho
dolo
gyto
calc
ulat
eem
issi
ons
from
was
teco
mbu
stio
n.T
hedo
mes
tic
inst
itut
iona
lrea
lity
does
nota
llow
for
anap
prop
riat
ere
spon
seto
the
met
hodo
logi
calr
equi
rem
ents
,pa
rtic
ular
lyin
the
case
ofL
UC
F.N
eed
tore
vise
the
IPC
Cm
etho
dolo
gyre
gard
ing
the
woo
dex
trac
ted
from
natu
rala
ndpl
ante
dfo
rest
sfo
rlo
ng-t
erm
use.
Impr
ovem
ents
:To
impr
ove
the
data
base
onen
ergy
;to
exam
ine
the
data
and
the
appl
icat
ion
ofth
eIP
CC
Gui
deli
nes
for
the
sect
oral
appr
oach
and
sink
cate
gori
es;t
oan
alys
eth
equ
ality
ofth
ere
sults
and
qual
ityco
ntro
lof
veri
fica
tion
proc
edur
esfo
rth
eac
tivity
data
ofth
ena
tura
lfor
ests
;mor
ede
tail
eddi
gita
lana
lyse
sof
the
sate
llit
eim
ages
;rev
isio
nan
dap
prov
alof
the
met
hodo
logi
esap
plie
din
the
fore
stco
ver
stud
ies,
carr
ied
outi
n19
70,1
986
and
1992
;rev
isio
nof
the
IPC
Cm
etho
dolo
gyre
gard
ing
the
woo
dex
trac
ted
from
the
natu
rala
ndpl
ante
dfo
rest
sfo
rth
elo
ngte
rmus
e(c
onst
ruct
ion,
furn
iture
,etc
.).
Pap
uaN
ewG
uine
aX
XP
robl
ems:
Lac
kof
acti
vity
data
(ene
rgy,
agri
cultu
re,L
UC
Fan
dw
aste
sect
ors)
asw
ella
sso
me
data
nota
vaila
ble
ina
suita
ble
form
at(a
gric
ultu
re).
Impr
ovem
ents
:Thi
sfi
rstG
HG
inve
ntor
yis
still
a“w
ork
inpr
ogre
ss”;
data
gaps
inal
lsec
tors
need
tobe
addr
esse
d.P
arag
uay
XP
robl
ems:
Par
tyre
port
edth
ela
ckof
acti
vity
data
for
allt
hese
ctor
sof
the
inve
ntor
y.Im
prov
emen
ts:N
eed
to(m
ainl
yfo
rL
UC
F):(
a)de
velo
pin
form
atio
nan
d/or
ada
taba
sew
hich
wou
ldsu
ppor
tthe
peri
odic
prep
arat
ion
ofG
HG
inve
ntor
yin
alls
ecto
rs;(
b)re
duce
unce
rtai
nty
rela
ted
toce
rtai
nda
tafr
omen
ergy
,for
estr
yan
dag
ricu
ltura
lsec
tors
and/
orre
quir
edin
form
atio
nge
nera
tion
;(c)
acce
ssna
tion
alan
dgl
obal
info
rmat
ion
onm
etho
dolo
gies
and
emis
sion
fact
ors;
(d)
crea
tea
clim
ate
data
base
with
met
eoro
logi
cala
ndhy
drol
ogic
alup
datin
g.N
eed
to:(
a)im
prov
eda
taqu
ality
and
upda
teda
tain
alls
ecto
rs;
(b)
crea
tea
data
base
both
for
cons
umpt
ion
and
end-
use
inth
een
ergy
sect
or,m
ainl
yfo
rin
dust
ry,r
esid
enti
alan
dru
ralu
se.
Per
uX
XP
robl
ems:
Lac
kof
adeq
uate
stat
isti
cald
ata
(fug
itive
emis
sion
s).S
ome
data
are
nota
vaila
ble
ina
suita
ble
form
at(e
nerg
y,ag
ricu
lture
).S
ome
ofth
eca
tego
ries
setb
yth
eIP
CC
met
hodo
logy
dono
tcor
resp
ond
toth
esi
tuat
ion
inth
eco
untr
y.So
me
natio
nals
peci
fici
ties
are
notf
ully
cove
red
byth
eIP
CC
met
hodo
logy
:itd
oes
notp
rese
ntde
faul
tval
ues
for
SO2
emis
sion
sfr
omth
em
inin
gan
dm
etal
lurg
yin
dust
ry.T
heIP
CC
met
hodo
logy
does
notc
onsi
der
nitr
ogen
ous
emis
sion
sfr
omor
gani
cm
atte
rw
ithhi
ghpr
otei
nco
nten
t.Sa
intK
itts
and
Nev
isX
XP
robl
ems:
Lac
kof
acti
vity
data
inth
een
ergy
,agr
icul
ture
,LU
CF
and
was
tese
ctor
s.A
ctiv
ityda
tano
tava
ilabl
ein
asu
itabl
efo
rmfo
rco
mpi
ling
the
inve
ntor
yin
the
ener
gy,a
gric
ultu
rean
dL
UC
Fse
ctor
s.D
ata
are
gene
rally
disp
erse
dbe
twee
na
num
ber
ofag
enci
esan
dno
com
pute
rize
dda
taba
seex
ists
.E
mis
sion
fact
ors:
the
IPC
Cde
faul
tem
issi
onfa
ctor
for
N2O
from
hum
anse
wag
em
ayno
tbe
appl
icab
leto
the
coun
try.
Impr
ovem
ents
:Fut
ure
effo
rts
shou
ldfo
cus
ontr
aini
ng,r
esea
rch
and
data
colle
ctio
nac
tiviti
es,p
artic
ular
ly(i
)st
reng
then
ing
oflo
cal
capa
city
toun
dert
ake
futu
rein
vent
ory
com
pila
tion
s;(i
i)re
sear
chin
such
area
sas
fore
stsp
ecie
sco
vera
ge,u
sing
for
inst
ance
,rem
ote
sens
ing
coup
led
with
GIS
met
hods
;and
(iii)
obta
inin
glo
cald
ata
and
deve
lopi
ngco
untr
y-sp
ecif
icem
issi
onfa
ctor
s.
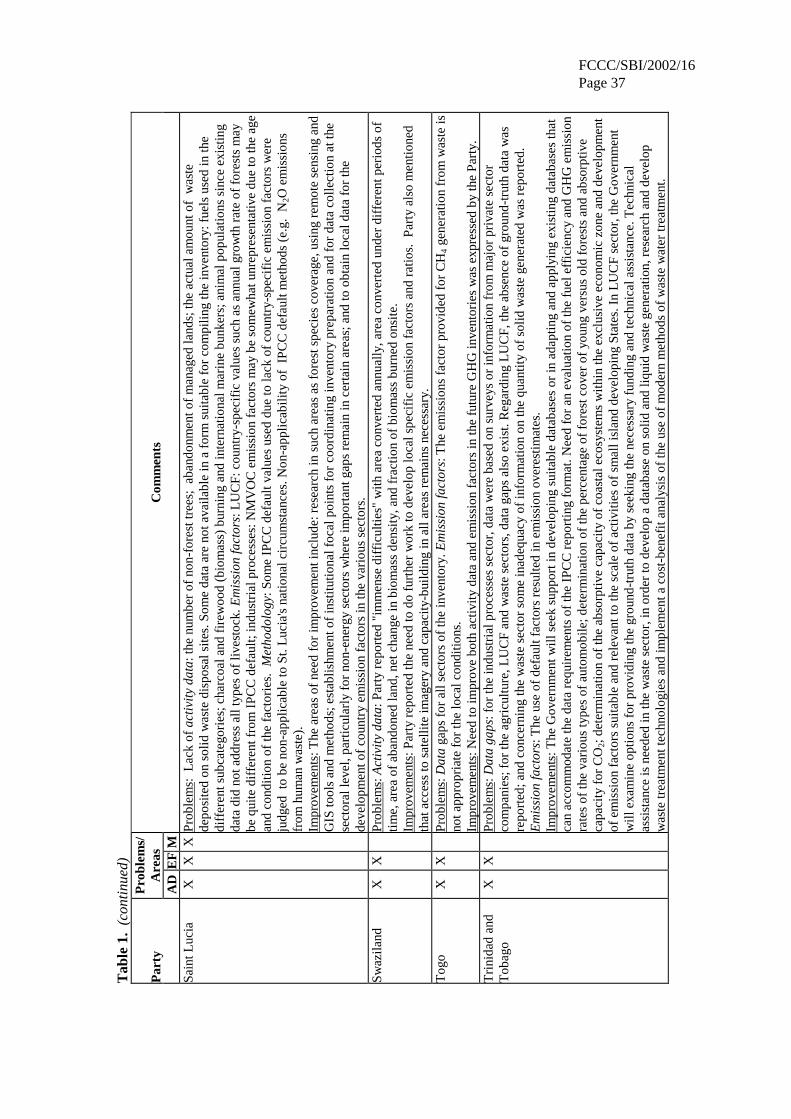
FCCC/SBI/2002/16Page 37
Tab
le1.
(con
tinu
ed)
Pro
blem
s/A
reas
Par
tyA
DE
FM
Com
men
ts
Sain
tLuc
iaX
XX
Pro
blem
s:L
ack
ofac
tivi
tyda
ta:t
henu
mbe
rof
non-
fore
sttr
ees;
aban
donm
ento
fm
anag
edla
nds;
the
actu
alam
ount
ofw
aste
depo
site
don
solid
was
tedi
spos
alsi
tes.
Som
eda
taar
eno
tava
ilabl
ein
afo
rmsu
itabl
efo
rco
mpi
ling
the
inve
ntor
y:fu
els
used
inth
edi
ffer
ents
ubca
tego
ries
;cha
rcoa
land
fire
woo
d(b
iom
ass)
burn
ing
and
inte
rnat
iona
lmar
ine
bunk
ers;
anim
alpo
pula
tions
sinc
eex
istin
gda
tadi
dno
tadd
ress
allt
ypes
ofliv
esto
ck.E
mis
sion
fact
ors:
LU
CF:
coun
try-
spec
ific
valu
essu
chas
annu
algr
owth
rate
offo
rest
sm
aybe
quite
diff
eren
tfro
mIP
CC
defa
ult;
indu
stri
alpr
oces
ses:
NM
VO
Cem
issi
onfa
ctor
sm
aybe
som
ewha
tunr
epre
sent
ativ
edu
eto
the
age
and
cond
ition
ofth
efa
ctor
ies.
Met
hodo
logy
:Som
eIP
CC
defa
ultv
alue
sus
eddu
eto
lack
ofco
untr
y-sp
ecif
icem
issi
onfa
ctor
sw
ere
judg
edto
beno
n-ap
plic
able
toSt
.Luc
ia's
natio
nalc
ircu
mst
ance
s.N
on-a
pplic
abili
tyof
IPC
Cde
faul
tmet
hods
(e.g
.N
2Oem
issi
ons
from
hum
anw
aste
).Im
prov
emen
ts:T
hear
eas
ofne
edfo
rim
prov
emen
tinc
lude
:res
earc
hin
such
area
sas
fore
stsp
ecie
sco
vera
ge,u
sing
rem
ote
sens
ing
and
GIS
tool
san
dm
etho
ds;e
stab
lishm
ento
fin
stitu
tiona
lfoc
alpo
ints
for
coor
dina
ting
inve
ntor
ypr
epar
atio
nan
dfo
rda
taco
llect
ion
atth
ese
ctor
alle
vel,
part
icul
arly
for
non-
ener
gyse
ctor
sw
here
impo
rtan
tgap
sre
mai
nin
cert
ain
area
s;an
dto
obta
inlo
cald
ata
for
the
deve
lopm
ento
fco
untr
yem
issi
onfa
ctor
sin
the
vari
ous
sect
ors.
Swaz
iland
XX
Pro
blem
s:A
ctiv
ity
data
:Par
tyre
port
ed"i
mm
ense
diff
icul
ties"
with
area
conv
erte
dan
nual
ly,a
rea
conv
erte
dun
der
diff
eren
tper
iods
ofti
me,
area
ofab
ando
ned
land
,net
chan
gein
biom
ass
dens
ity,
and
frac
tion
ofbi
omas
sbu
rned
onsi
te.
Impr
ovem
ents
:Par
tyre
port
edth
ene
edto
dofu
rthe
rw
ork
tode
velo
plo
cals
peci
fic
emis
sion
fact
ors
and
rati
os.
Par
tyal
som
enti
oned
that
acce
ssto
sate
llite
imag
ery
and
capa
city
-bui
ldin
gin
alla
reas
rem
ains
nece
ssar
y.T
ogo
XX
Pro
blem
s:D
ata
gaps
for
alls
ecto
rsof
the
inve
ntor
y.E
mis
sion
fact
ors:
The
emis
sion
sfa
ctor
prov
ided
for
CH
4ge
nera
tion
from
was
teis
nota
ppro
pria
tefo
rth
elo
calc
ondi
tions
.Im
prov
emen
ts:N
eed
toim
prov
ebo
thac
tivity
data
and
emis
sion
fact
ors
inth
efu
ture
GH
Gin
vent
orie
sw
asex
pres
sed
byth
eP
arty
.T
rini
dad
and
Tob
ago
XX
Pro
blem
s:D
ata
gaps
:for
the
indu
stri
alpr
oces
ses
sect
or,d
ata
wer
eba
sed
onsu
rvey
sor
info
rmat
ion
from
maj
orpr
ivat
ese
ctor
com
pani
es;f
orth
eag
ricu
ltur
e,L
UC
Fan
dw
aste
sect
ors,
data
gaps
also
exis
t.R
egar
ding
LU
CF,
the
abse
nce
ofgr
ound
-tru
thda
taw
asre
port
ed;a
ndco
ncer
ning
the
was
tese
ctor
som
ein
adeq
uacy
ofin
form
atio
non
the
quan
tity
ofso
lidw
aste
gene
rate
dw
asre
port
ed.
Em
issi
onfa
ctor
s:T
heus
eof
defa
ultf
acto
rsre
sult
edin
emis
sion
over
esti
mat
es.
Impr
ovem
ents
:The
Gov
ernm
entw
illse
eksu
ppor
tin
deve
lopi
ngsu
itabl
eda
taba
ses
orin
adap
ting
and
appl
ying
exis
ting
data
base
sth
atca
nac
com
mod
ate
the
data
requ
irem
ents
ofth
eIP
CC
repo
rtin
gfo
rmat
.Nee
dfo
ran
eval
uati
onof
the
fuel
effi
cien
cyan
dG
HG
emis
sion
rate
sof
the
vari
ous
type
sof
auto
mob
ile;d
eter
min
atio
nof
the
perc
enta
geof
fore
stco
ver
ofyo
ung
vers
usol
dfo
rest
san
dab
sorp
tive
capa
city
for
CO
2;de
term
inat
ion
ofth
eab
sorp
tive
capa
city
ofco
asta
leco
syst
ems
wit
hin
the
excl
usiv
eec
onom
iczo
nean
dde
velo
pmen
tof
emis
sion
fact
ors
suita
ble
and
rele
vant
toth
esc
ale
ofac
tiviti
esof
smal
lisl
and
deve
lopi
ngSt
ates
.In
LU
CF
sect
or,t
heG
over
nmen
tw
ille
xam
ine
opti
ons
for
prov
idin
gth
egr
ound
-tru
thda
taby
seek
ing
the
nece
ssar
yfu
ndin
gan
dte
chni
cala
ssis
tanc
e.T
echn
ical
assi
stan
ceis
need
edin
the
was
tese
ctor
,in
orde
rto
deve
lop
ada
taba
seon
soli
dan
dli
quid
was
tege
nera
tion
,res
earc
han
dde
velo
pw
aste
trea
tmen
ttec
hnol
ogie
san
dim
plem
enta
cost
-ben
efit
anal
ysis
ofth
eus
eof
mod
ern
met
hods
ofw
aste
wat
ertr
eatm
ent.
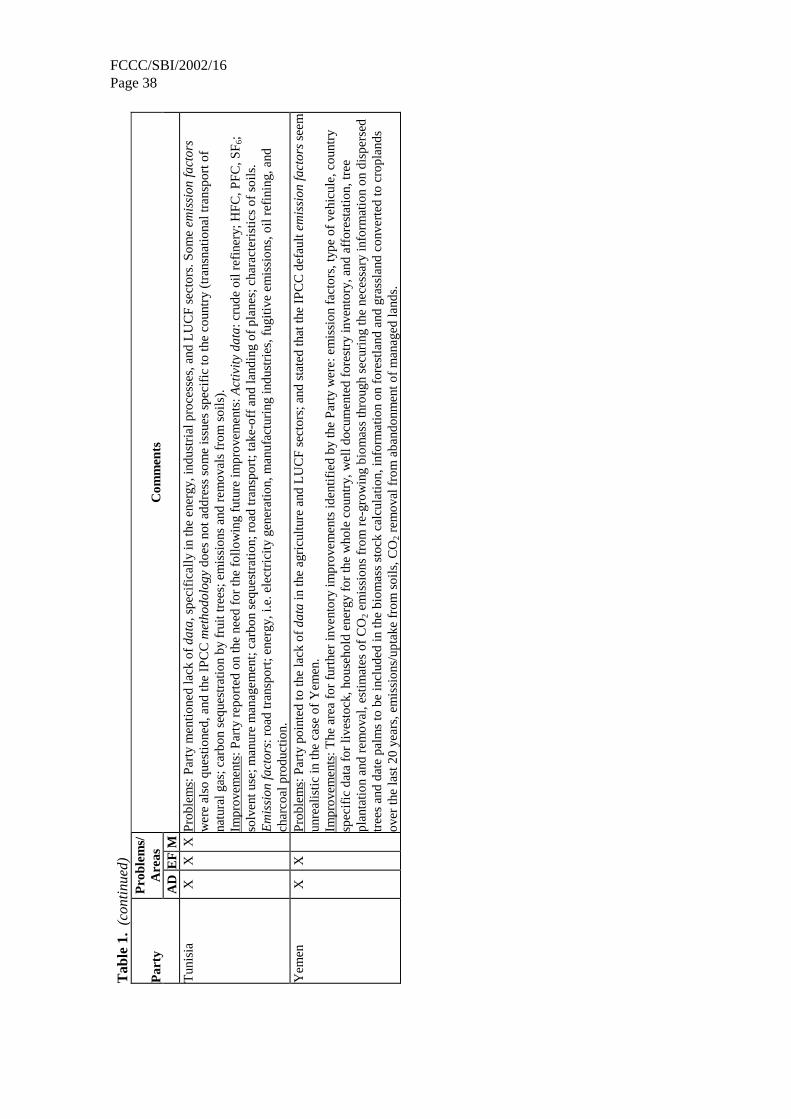
FCCC/SBI/2002/16Page 38
Tab
le1.
(con
tinu
ed)
Pro
blem
s/A
reas
Par
tyA
DE
FM
Com
men
ts
Tun
isia
XX
XP
robl
ems:
Par
tym
enti
oned
lack
ofda
ta,s
peci
fica
lly
inth
een
ergy
,ind
ustr
ialp
roce
sses
,and
LU
CF
sect
ors.
Som
eem
issi
onfa
ctor
sw
ere
also
ques
tion
ed,a
ndth
eIP
CC
met
hodo
logy
does
nota
ddre
ssso
me
issu
essp
ecif
icto
the
coun
try
(tra
nsna
tiona
ltra
nspo
rtof
natu
ralg
as;c
arbo
nse
ques
trat
ion
byfr
uitt
rees
;em
issi
ons
and
rem
oval
sfr
omso
ils).
Impr
ovem
ents
:Par
tyre
port
edon
the
need
for
the
follo
win
gfu
ture
impr
ovem
ents
:Act
ivit
yda
ta:c
rude
oilr
efin
ery;
HFC
,PFC
,SF 6
;so
lven
tuse
;man
ure
man
agem
ent;
carb
onse
ques
trat
ion;
road
tran
spor
t;ta
ke-o
ffan
dla
ndin
gof
plan
es;c
hara
cter
isti
csof
soil
s.E
mis
sion
fact
ors:
road
tran
spor
t;en
ergy
,i.e
.ele
ctri
city
gene
ratio
n,m
anuf
actu
ring
indu
stri
es,f
ugiti
veem
issi
ons,
oilr
efin
ing,
and
char
coal
prod
ucti
on.
Yem
enX
XP
robl
ems:
Par
typo
inte
dto
the
lack
ofda
tain
the
agri
cultu
rean
dL
UC
Fse
ctor
s;an
dst
ated
that
the
IPC
Cde
faul
tem
issi
onfa
ctor
sse
emun
real
istic
inth
eca
seof
Yem
en.
Impr
ovem
ents
:The
area
for
furt
her
inve
ntor
yim
prov
emen
tsid
entif
ied
byth
eP
arty
wer
e:em
issi
onfa
ctor
s,ty
peof
vehi
cule
,cou
ntry
spec
ific
data
for
live
stoc
k,ho
useh
old
ener
gyfo
rth
ew
hole
coun
try,
wel
ldoc
umen
ted
fore
stry
inve
ntor
y,an
daf
fore
stat
ion,
tree
plan
tatio
nan
dre
mov
al,e
stim
ates
ofC
O2
emis
sion
sfr
omre
-gro
win
gbi
omas
sth
roug
hse
curi
ngth
ene
cess
ary
info
rmat
ion
ondi
sper
sed
tree
san
dda
tepa
lms
tobe
incl
uded
inth
ebi
omas
sst
ock
calc
ulat
ion,
info
rmat
ion
onfo
rest
land
and
gras
slan
dco
nver
ted
tocr
opla
nds
over
the
last
20ye
ars,
emis
sion
s/up
take
from
soil
s,C
O2
rem
oval
from
aban
donm
ento
fm
anag
edla
nds.
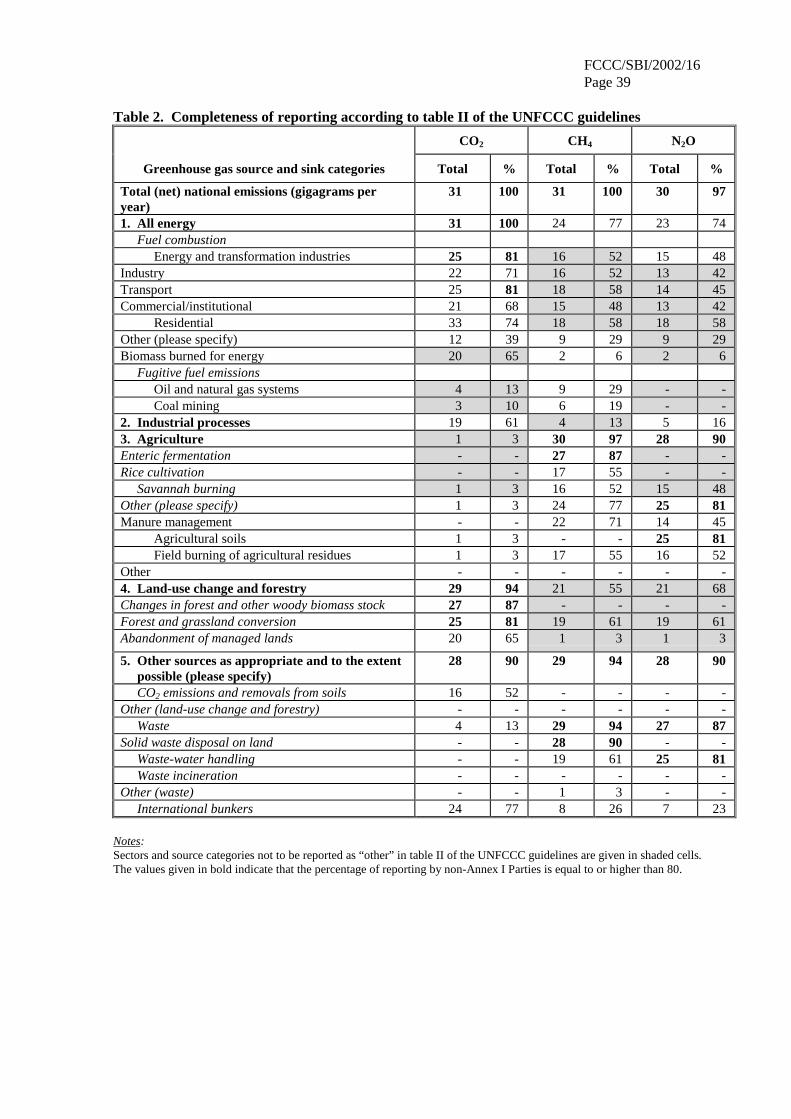
FCCC/SBI/2002/16Page 39
Table 2. Completeness of reporting according to table II of the UNFCCC guidelines
CO2 CH4 N2O
Greenhouse gas source and sink categories Total % Total % Total %
Total (net) national emissions (gigagrams peryear)
31 100 31 100 30 97
1. All energy 31 100 24 77 23 74Fuel combustion
Energy and transformation industries 25 81 16 52 15 48Industry 22 71 16 52 13 42Transport 25 81 18 58 14 45Commercial/institutional 21 68 15 48 13 42
Residential 33 74 18 58 18 58Other (please specify) 12 39 9 29 9 29Biomass burned for energy 20 65 2 6 2 6
Fugitive fuel emissionsOil and natural gas systems 4 13 9 29 - -Coal mining 3 10 6 19 - -
2. Industrial processes 19 61 4 13 5 163. Agriculture 1 3 30 97 28 90Enteric fermentation - - 27 87 - -Rice cultivation - - 17 55 - -
Savannah burning 1 3 16 52 15 48Other (please specify) 1 3 24 77 25 81Manure management - - 22 71 14 45
Agricultural soils 1 3 - - 25 81Field burning of agricultural residues 1 3 17 55 16 52
Other - - - - - -4. Land-use change and forestry 29 94 21 55 21 68Changes in forest and other woody biomass stock 27 87 - - - -Forest and grassland conversion 25 81 19 61 19 61Abandonment of managed lands 20 65 1 3 1 3
5. Other sources as appropriate and to the extentpossible (please specify)
28 90 29 94 28 90
CO2 emissions and removals from soils 16 52 - - - -Other (land-use change and forestry) - - - - - -
Waste 4 13 29 94 27 87Solid waste disposal on land - - 28 90 - -
Waste-water handling - - 19 61 25 81Waste incineration - - - - - -
Other (waste) - - 1 3 - -International bunkers 24 77 8 26 7 23
Notes:Sectors and source categories not to be reported as “other” in table II of the UNFCCC guidelines are given in shaded cells.The values given in bold indicate that the percentage of reporting by non-Annex I Parties is equal to or higher than 80.
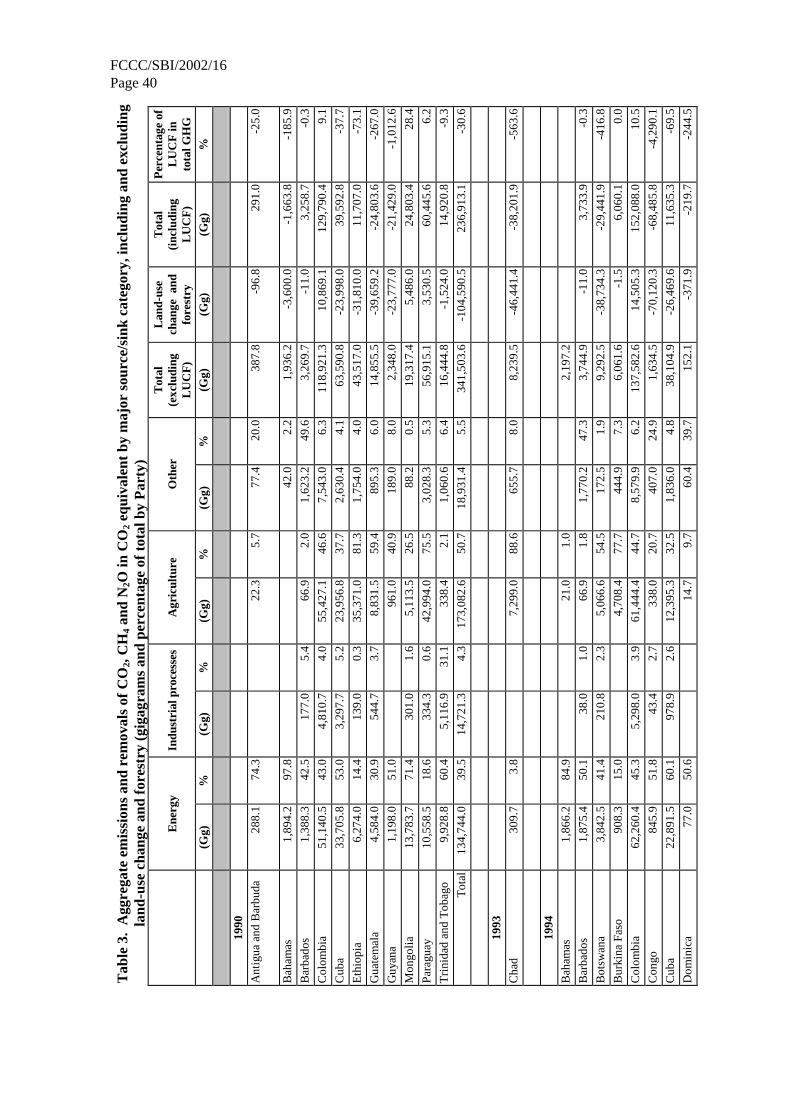
FCCC/SBI/2002/16Page 40
Tab
le3.
Agg
rega
teem
issi
ons
and
rem
oval
sof
CO
2,C
H4
and
N2O
inC
O2
equi
vale
ntby
maj
orso
urce
/sin
kca
tego
ry,i
nclu
ding
and
excl
udin
gla
nd-u
sech
ange
and
fore
stry
(gig
agra
ms
and
perc
enta
geof
tota
lby
Par
ty)
Ene
rgy
Indu
stri
alpr
oces
ses
Agr
icul
ture
Oth
erT
otal
(exc
ludi
ngL
UC
F)
Lan
d-us
ech
ange
and
fore
stry
Tot
al(i
nclu
ding
LU
CF
)
Per
cent
age
ofL
UC
Fin
tota
lGH
G(G
g)%
(Gg)
%(G
g)%
(Gg)
%(G
g)(G
g)(G
g)%
1990
Ant
igua
and
Bar
buda
288.
174
.322
.35.
777
.420
.038
7.8
-96.
829
1.0
-25.
0
Bah
amas
1,89
4.2
97.8
42.0
2.2
1,93
6.2
-3,6
00.0
-1,6
63.8
-185
.9
Bar
bado
s1,
388.
342
.517
7.0
5.4
66.9
2.0
1,62
3.2
49.6
3,26
9.7
-11.
03,
258.
7-0
.3
Col
ombi
a51
,140
.543
.04,
810.
74.
055
,427
.146
.67,
543.
06.
311
8,92
1.3
10,8
69.1
129,
790.
49.
1
Cub
a33
,705
.853
.03,
297.
75.
223
,956
.837
.72,
630.
44.
163
,590
.8-2
3,99
8.0
39,5
92.8
-37.
7
Eth
iopi
a6,
274.
014
.413
9.0
0.3
35,3
71.0
81.3
1,75
4.0
4.0
43,5
17.0
-31,
810.
011
,707
.0-7
3.1
Gua
tem
ala
4,58
4.0
30.9
544.
73.
78,
831.
559
.489
5.3
6.0
14,8
55.5
-39,
659.
2-2
4,80
3.6
-267
.0
Guy
ana
1,19
8.0
51.0
961.
040
.918
9.0
8.0
2,34
8.0
-23,
777.
0-2
1,42
9.0
-1,0
12.6
Mon
goli
a13
,783
.771
.430
1.0
1.6
5,11
3.5
26.5
88.2
0.5
19,3
17.4
5,48
6.0
24,8
03.4
28.4
Par
agua
y10
,558
.518
.633
4.3
0.6
42,9
94.0
75.5
3,02
8.3
5.3
56,9
15.1
3,53
0.5
60,4
45.6
6.2
Tri
nida
dan
dT
obag
o9,
928.
860
.45,
116.
931
.133
8.4
2.1
1,06
0.6
6.4
16,4
44.8
-1,5
24.0
14,9
20.8
-9.3
Tot
al13
4,74
4.0
39.5
14,7
21.3
4.3
173,
082.
650
.718
,931
.45.
534
1,50
3.6
-104
,590
.523
6,91
3.1
-30.
6
1993
Cha
d30
9.7
3.8
7,29
9.0
88.6
655.
78.
08,
239.
5-4
6,44
1.4
-38,
201.
9-5
63.6
1994
Bah
amas
1,86
6.2
84.9
21.0
1.0
2,19
7.2
Bar
bado
s1,
875.
450
.138
.01.
066
.91.
81,
770.
247
.33,
744.
9-1
1.0
3,73
3.9
-0.3
Bot
swan
a3,
842.
541
.421
0.8
2.3
5,06
6.6
54.5
172.
51.
99,
292.
5-3
8,73
4.3
-29,
441.
9-4
16.8
Bur
kina
Fas
o90
8.3
15.0
4,70
8.4
77.7
444.
97.
36,
061.
6-1
.56,
060.
10.
0
Col
ombi
a62
,260
.445
.35,
298.
03.
961
,444
.444
.78,
579.
96.
213
7,58
2.6
14,5
05.3
152,
088.
010
.5
Con
go84
5.9
51.8
43.4
2.7
338.
020
.740
7.0
24.9
1,63
4.5
-70,
120.
3-6
8,48
5.8
-4,2
90.1
Cub
a22
,891
.560
.197
8.9
2.6
12,3
95.3
32.5
1,83
6.0
4.8
38,1
04.9
-26,
469.
611
,635
.3-6
9.5
Dom
inic
a77
.050
.614
.79.
760
.439
.715
2.1
-371
.9-2
19.7
-244
.5
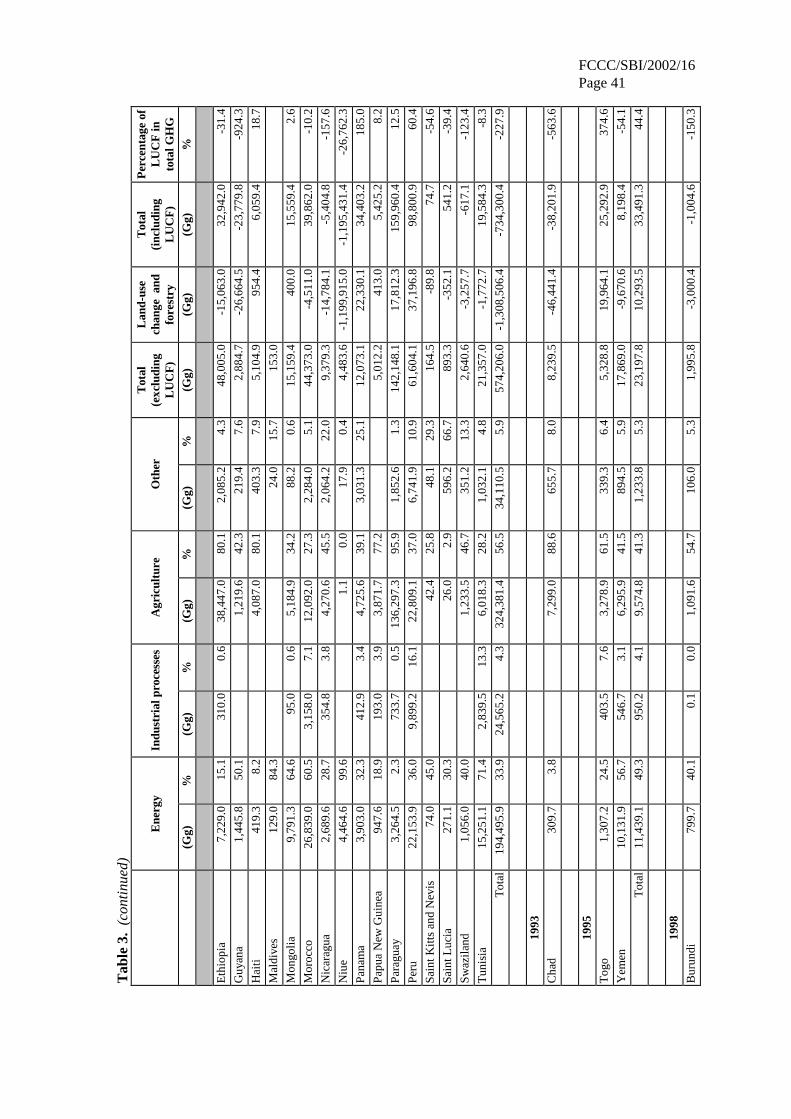
FCCC/SBI/2002/16Page 41
Tab
le3.
(con
tinu
ed)
Ene
rgy
Indu
stri
alpr
oces
ses
Agr
icul
ture
Oth
erT
otal
(exc
ludi
ngL
UC
F)
Lan
d-us
ech
ange
and
fore
stry
Tot
al(i
nclu
ding
LU
CF
)
Per
cent
age
ofL
UC
Fin
tota
lGH
G(G
g)%
(Gg)
%(G
g)%
(Gg)
%(G
g)(G
g)(G
g)%
Eth
iopi
a7,
229.
015
.131
0.0
0.6
38,4
47.0
80.1
2,08
5.2
4.3
48,0
05.0
-15,
063.
032
,942
.0-3
1.4
Guy
ana
1,44
5.8
50.1
1,21
9.6
42.3
219.
47.
62,
884.
7-2
6,66
4.5
-23,
779.
8-9
24.3
Hai
ti41
9.3
8.2
4,08
7.0
80.1
403.
37.
95,
104.
995
4.4
6,05
9.4
18.7
Mal
dive
s12
9.0
84.3
24.0
15.7
153.
0
Mon
goli
a9,
791.
364
.695
.00.
65,
184.
934
.288
.20.
615
,159
.440
0.0
15,5
59.4
2.6
Mor
occo
26,8
39.0
60.5
3,15
8.0
7.1
12,0
92.0
27.3
2,28
4.0
5.1
44,3
73.0
-4,5
11.0
39,8
62.0
-10.
2
Nic
arag
ua2,
689.
628
.735
4.8
3.8
4,27
0.6
45.5
2,06
4.2
22.0
9,37
9.3
-14,
784.
1-5
,404
.8-1
57.6
Niu
e4,
464.
699
.61.
10.
017
.90.
44,
483.
6-1
,199
,915
.0-1
,195
,431
.4-2
6,76
2.3
Pan
ama
3,90
3.0
32.3
412.
93.
44,
725.
639
.13,
031.
325
.112
,073
.122
,330
.134
,403
.218
5.0
Pap
uaN
ewG
uine
a94
7.6
18.9
193.
03.
93,
871.
777
.25,
012.
241
3.0
5,42
5.2
8.2
Par
agua
y3,
264.
52.
373
3.7
0.5
136,
297.
395
.91,
852.
61.
314
2,14
8.1
17,8
12.3
159,
960.
412
.5
Per
u22
,153
.936
.09,
899.
216
.122
,809
.137
.06,
741.
910
.961
,604
.137
,196
.898
,800
.960
.4
Sai
ntK
itts
and
Nev
is74
.045
.042
.425
.848
.129
.316
4.5
-89.
874
.7-5
4.6
Sai
ntL
ucia
271.
130
.326
.02.
959
6.2
66.7
893.
3-3
52.1
541.
2-3
9.4
Sw
azil
and
1,05
6.0
40.0
1,23
3.5
46.7
351.
213
.32,
640.
6-3
,257
.7-6
17.1
-123
.4
Tun
isia
15,2
51.1
71.4
2,83
9.5
13.3
6,01
8.3
28.2
1,03
2.1
4.8
21,3
57.0
-1,7
72.7
19,5
84.3
-8.3
Tot
al19
4,49
5.9
33.9
24,5
65.2
4.3
324,
381.
456
.534
,110
.55.
957
4,20
6.0
-1,3
08,5
06.4
-734
,300
.4-2
27.9
1993
Cha
d30
9.7
3.8
7,29
9.0
88.6
655.
78.
08,
239.
5-4
6,44
1.4
-38,
201.
9-5
63.6
1995
Tog
o1,
307.
224
.540
3.5
7.6
3,27
8.9
61.5
339.
36.
45,
328.
819
,964
.125
,292
.937
4.6
Yem
en10
,131
.956
.754
6.7
3.1
6,29
5.9
41.5
894.
55.
917
,869
.0-9
,670
.68,
198.
4-5
4.1
Tot
al11
,439
.149
.395
0.2
4.1
9,57
4.8
41.3
1,23
3.8
5.3
23,1
97.8
10,2
93.5
33,4
91.3
44.4
1998
Bur
undi
799.
740
.10.
10.
01,
091.
654
.710
6.0
5.3
1,99
5.8
-3,0
00.4
-1,0
04.6
-150
.3
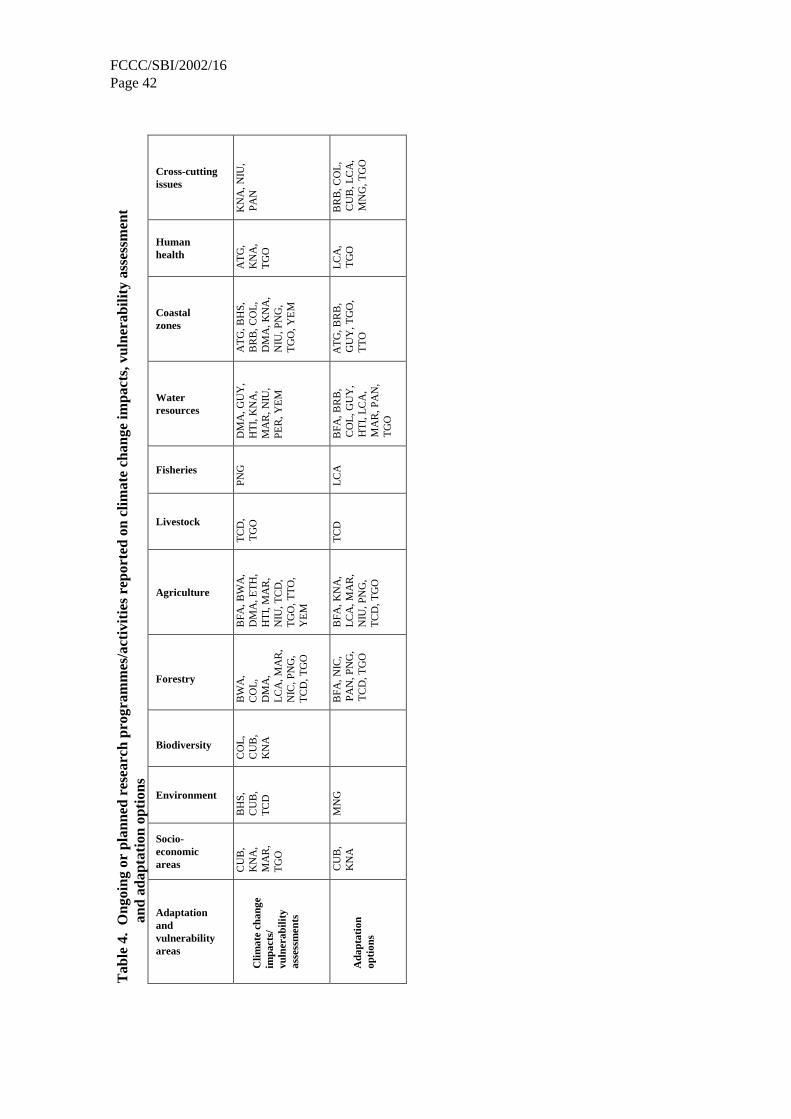
FCCC/SBI/2002/16Page 42
Tab
le4.
Ong
oing
orpl
anne
dre
sear
chpr
ogra
mm
es/a
ctiv
itie
sre
port
edon
clim
ate
chan
geim
pact
s,vu
lner
abili
tyas
sess
men
tan
dad
apta
tion
opti
ons
Adaptationandvulnerabilityareas
Socio-economicareas
Environment
Biodiversity
Forestry
Agriculture
Livestock
Fisheries
Waterresources
Coastalzones
Humanhealth
Cross-cuttingissues
Clim
ate
chan
geim
pact
s/vu
lner
abili
tyas
sess
men
ts
CU
B,
KN
A,
MA
R,
TG
O
BH
S,C
UB
,T
CD
CO
L,
CU
B,
KN
A
BW
A,
CO
L,
DM
A,
LC
A,M
AR
,N
IC,P
NG
,T
CD
,TG
O
BFA
,BW
A,
DM
A,E
TH
,H
TI,
MA
R,
NIU
,TC
D,
TG
O,T
TO
,Y
EM
TC
D,
TG
OPN
GD
MA
,GU
Y,
HT
I,K
NA
,M
AR
,NIU
,PE
R,Y
EM
AT
G,B
HS,
BR
B,C
OL
,D
MA
,KN
A,
NIU
,PN
G,
TG
O,Y
EM
AT
G,
KN
A,
TG
O
KN
A,N
IU,
PAN
Ada
ptat
ion
opti
ons
CU
B,
KN
AM
NG
BFA
,NIC
,PA
N,P
NG
,T
CD
,TG
O
BFA
,KN
A,
LC
A,M
AR
,N
IU,P
NG
,T
CD
,TG
O
TC
DL
CA
BFA
,BR
B,
CO
L,G
UY
,H
TI,
LC
A,
MA
R,P
AN
,T
GO
AT
G,B
RB
,G
UY
,TG
O,
TT
O
LC
A,
TG
OB
RB
,CO
L,
CU
B,L
CA
,M
NG
,TG
O
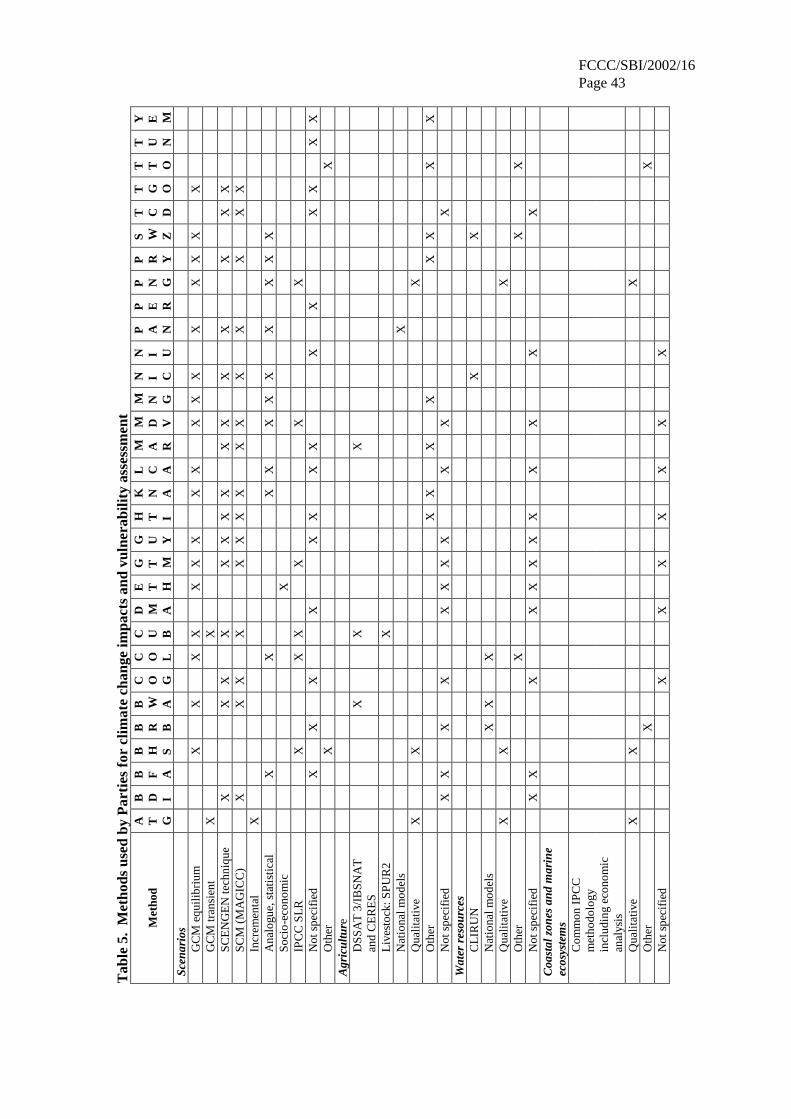
FCCC/SBI/2002/16Page 43
Tab
le5.
Met
hods
used
byP
arti
esfo
rcl
imat
ech
ange
impa
cts
and
vuln
erab
ility
asse
ssm
ent
Met
hod
A T G
B D I
B F A
B H S
B R B
B W A
C O G
C O L
C U B
D M A
E T H
G T M
G U Y
H T I
K N A
L C A
M A R
M D V
M N G
N I C
N I U
P A N
P E R
P N G
P R Y
S W Z
T C D
T G O
T T O
T U N
Y E MSc
enar
ios
GC
Meq
uili
briu
mX
XX
XX
XX
XX
XX
XX
XX
XX
GC
Mtr
ansi
ent
XX
SC
EN
GE
Nte
chni
que
XX
XX
XX
XX
XX
XX
XX
XS
CM
(MA
GIC
C)
XX
XX
XX
XX
XX
XX
XX
XIn
crem
enta
lX
Ana
logu
e,st
atis
tica
lX
XX
XX
XX
XX
XX
Soc
io-e
cono
mic
XIP
CC
SL
RX
XX
XX
XN
otsp
ecif
ied
XX
XX
XX
XX
XX
XX
XX
Oth
erX
XA
gric
ultu
reD
SS
AT
3/IB
SN
AT
and
CE
RE
SX
XX
Liv
esto
ck:S
PU
R2
XN
atio
nalm
odel
sX
Qua
lita
tive
XX
XO
ther
XX
XX
XX
XX
Not
spec
ifie
dX
XX
XX
XX
XX
XX
Wat
erre
sour
ces
CL
IRU
NX
XN
atio
nalm
odel
sX
XX
Qua
lita
tive
XX
XO
ther
XX
XN
otsp
ecif
ied
XX
XX
XX
XX
XX
XX
Coa
stal
zone
san
dm
arin
eec
osys
tem
sC
omm
onIP
CC
met
hodo
logy
incl
udin
gec
onom
ican
alys
isQ
uali
tati
veX
XX
Oth
erX
XN
otsp
ecif
ied
XX
XX
XX
X
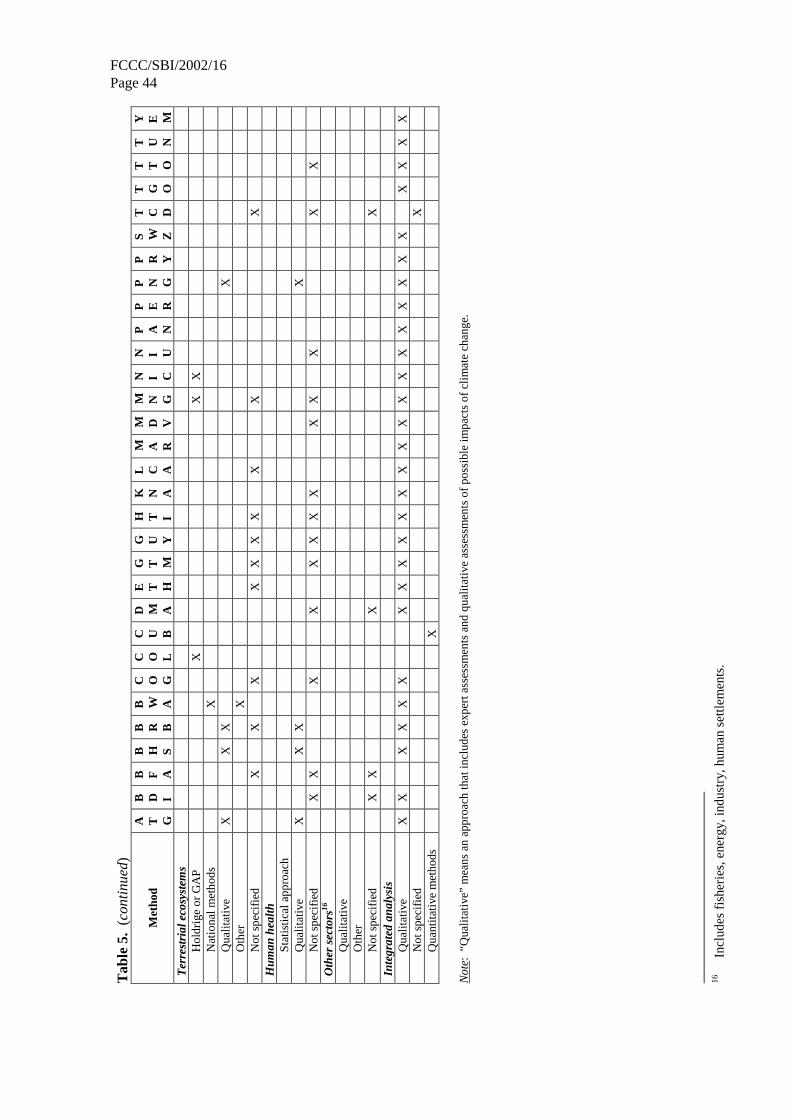
FCCC/SBI/2002/16Page 44
Tab
le5.
(con
tinu
ed)
Met
hod
A T G
B D I
B F A
B H S
B R B
B W A
C O G
C O L
C U B
D M A
E T H
G T M
G U Y
H T I
K N A
L C A
M A R
M D V
M N G
N I C
N I U
P A N
P E R
P N G
P R Y
S W Z
T C D
T G O
T T O
T U N
Y E MT
erre
stri
alec
osys
tem
sH
oldr
ige
orG
AP
XX
XN
atio
nalm
etho
dsX
Qua
lita
tive
XX
XX
Oth
erX
Not
spec
ifie
dX
XX
XX
XX
XX
XH
uman
heal
thS
tati
stic
alap
proa
chQ
uali
tati
veX
XX
XN
otsp
ecif
ied
XX
XX
XX
XX
XX
XX
XO
ther
sect
ors16
Qua
lita
tive
Oth
erN
otsp
ecif
ied
XX
XX
Inte
grat
edan
alys
isQ
uali
tati
veX
XX
XX
XX
XX
XX
XX
XX
XX
XX
XX
XX
XX
XX
Not
spec
ifie
dX
Qua
ntit
ativ
em
etho
dsX
Not
e:“Q
uali
tati
ve”
mea
nsan
appr
oach
that
incl
udes
expe
rtas
sess
men
tsan
dqu
alit
ativ
eas
sess
men
tsof
poss
ible
impa
cts
ofcl
imat
ech
ange
.
16In
clud
esfi
sher
ies,
ener
gy,i
ndus
try,
hum
anse
ttlem
ents
.
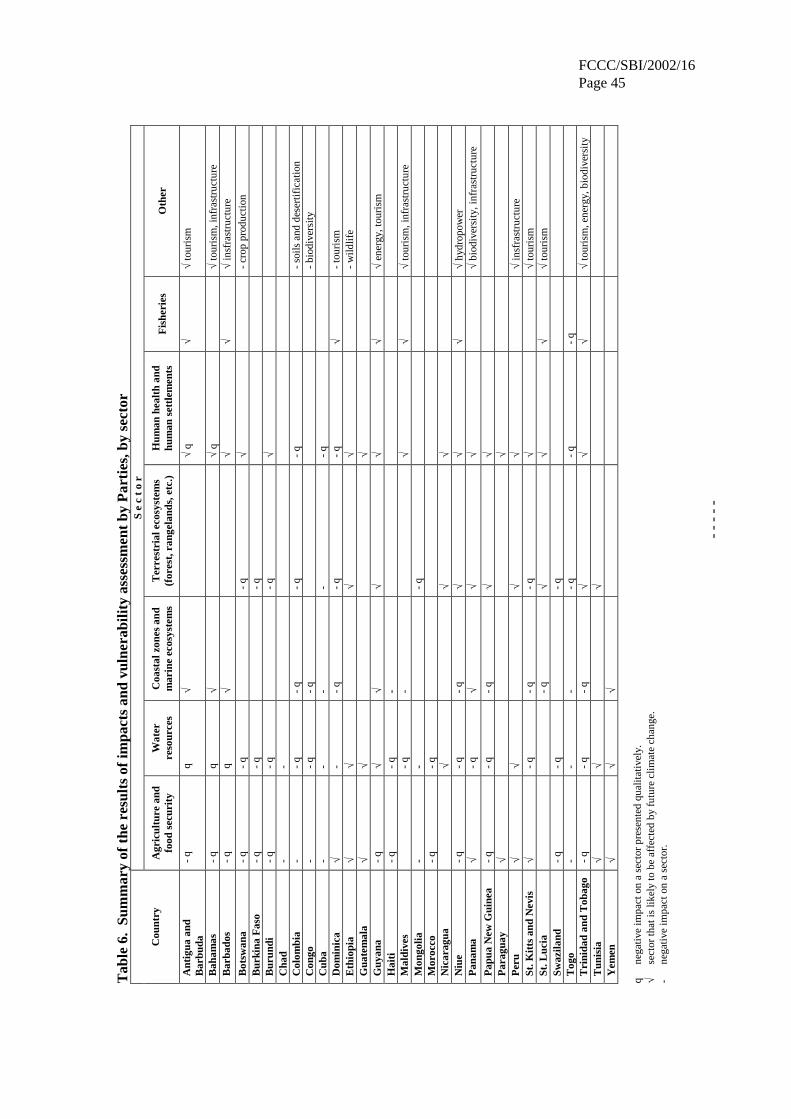
FCCC/SBI/2002/16Page 45
Tab
le6.
Sum
mar
yof
the
resu
lts
ofim
pact
san
dvu
lner
abili
tyas
sess
men
tby
Par
ties
,by
sect
orS
ec
to
r
Cou
ntry
Agr
icul
ture
and
food
secu
rity
Wat
erre
sour
ces
Coa
stal
zone
san
dm
arin
eec
osys
tem
sT
erre
stri
alec
osys
tem
s(f
ores
t,ra
ngel
ands
,etc
.)H
uman
heal
than
dhu
man
sett
lem
ents
Fis
heri
esO
ther
Ant
igua
and
Bar
buda
-q
q√
√q
√√
tour
ism
Bah
amas
-q
q√
√q
√to
uris
m,i
nfra
stru
ctur
eB
arba
dos
-q
q√
√√
√in
sfra
stru
ctur
e
Bot
swan
a-
q-
q-
q√
-cr
oppr
oduc
tion
Bur
kina
Fas
o-
q-
q-
qB
urun
di-
q-
q-
q√
Cha
d-
-C
olom
bia
--
q-
q-
q-
q-
soils
and
dese
rtif
icat
ion
Con
go-
-q
-q
-bi
odiv
ersi
tyC
uba
--
--
-q
Dom
inic
a√
--
q-
q-
q√
-to
uris
mE
thio
pia
√√
√√
-w
ildlif
eG
uate
mal
a√
√√
Guy
ana
-q
√√
√√
√√
ener
gy,t
ouri
smH
aiti
-q
-q
-M
aldi
ves
-q
-√
√√
tour
ism
,inf
rast
ruct
ure
Mon
golia
--
-q
Mor
occo
-q
-q
Nic
arag
ua√
√√
Niu
e-
q-
q-
q√
√√
√hy
drop
ower
Pan
ama
√-
q√
√√
√bi
odiv
ersi
ty,i
nfra
stru
ctur
e
Pap
uaN
ewG
uine
a-
q-
q-
q√
√P
arag
uay
√√
Per
u√
√√
√√
insf
rast
ruct
ure
St.K
itts
and
Nev
is√
-q
-q
-q
√√
tour
ism
St.L
ucia
-q
√√
√√
tour
ism
Swaz
iland
-q
-q
-q
Tog
o-
--
-q
-q
-q
Tri
nida
dan
dT
obag
o-
q-
q-
q√
√√
√to
uris
m,e
nerg
y,bi
odiv
ersi
tyT
unis
ia√
√√
Yem
en√
√√
qne
gati
veim
pact
ona
sect
orpr
esen
ted
qual
itat
ivel
y.√
sect
orth
atis
likel
yto
beaf
fect
edby
futu
recl
imat
ech
ange
.-
nega
tive
impa
cton
ase
ctor
.
--
--
-