United m Counting consumption - WWF
84
3 CO2 emissions, material flows and Ecological Footprint of the UK by region and devolved country Counting consumption United Kingdom Counting consumption United Kingdom
Transcript of United m Counting consumption - WWF

3
CO2 emissions, material flows and Ecological Footprint of the UK by region and devolved country
Counting consumption
United Kingdom
Counting
consumption
United
Kingdom

© WWF-UK, 2006
All rights reserved. No reproduction, copy
or transmission of this publication can be
made without the prior written permission
of the copyright holders.
Published by WWF-UK
Panda House
Weyside Park
Godalming
Surrey GU7 1XR
ISBN 1 85850 214 4
A CIP catalogue record for this book
is available from the British Library
Designed by The Design Pod
Printed by Arrowhead Printing Ltd
on Cyclus Offset, a recycled paper made
from 100 per cent post consumer waste

Contents
Foreword 2
Executive summary 3
1 Learning to count: The Ecological Budget UK project 4
2 Sustainability policy and Ecological Budget UK 6
3 National results: Ecological Footprint, CO2 emissions and material flow analysis 8
4 Regional overview 16
5 Regional analysis
East of England 22
East Midlands 26
London 30
North East 34
North West 38
South East 42
South West 46
West Midlands 50
Yorkshire and Humberside 54
Northern Ireland 58
Scotland 62
Wales 66
6 A framework for sustainable consumption and production 70
7 The future 76
Appendix: Project scope and methods 78
Contact details 80

2
FO
RE
WO
RD Foreword
Every generation has new challenges to face,and sometimes these challenges are so greatthat they quite simply define our time.
Living in a world with environmental limitswill define ours. Never before have we had to face such enormous unintendedconsequences of our past endeavours:consequences that are global in scale and which will require united global effort to address.
Preventing a 2°C rise in the globalaverage temperature will be hugelychallenging. It will require steering humanityon a new course that is as much aboutchange and transformation in economies and markets as it is in our own lives andbehaviour. The consensus now is not aboutwhether we should or could change the waywe live, but of the more urgent and immediatequestions of when, how and at what cost?
We cannot embark upon such atransformative journey unprepared. To bringthe vision of a One Planet Economy – as set out in the government SustainableDevelopment Strategy – into reality, we need to understand the connection betweenour lifestyles, the goods and services that
underpin them, and the real impacts on the planet such as the use of materialresources and energy.
Ecological Budget UK is a giant step in this direction. By providing the most comprehensive analysis yet attempted, it helps us to track materials, CO2 and our Ecological Footprint through every form of production and consumption of the UKeconomy by industrial sector, geographicalarea and socio-economic group. Under-standing the relationship between theeconomy and the environment on which it is based is a prerequisite if we are to move towards sustainability.
I urge the UK government carefully toconsider this analysis, and to use it as onepart of the evidence base for creating policyand fiscal frameworks which support thelong-term transformation of the economy. In moving to a sustainable future, we will need to pay as much attention to the stocksand flows of materials and energy as we now do to the stocks and flows of money.
Andrew LeeDirector, Sustainable Development Commission

3
EX
EC
UT
IVE
SU
MM
AR
Y
Ecological Budget UK provides a
much needed evidence base to better
understand the important issues of
Sustainable Consumption and Production
(SCP). It provides a statistical and scientific
basis for SCP strategies in the UK at
national and regional levels. It shows
the total global impact of UK consumption,
not only by accounting for direct resource
flows and emissions within the UK, but
also by including the manufacture of
imported products and materials. Ecological
Budget UK’s three headline indicators –
CO2 emissions, material flow analysis,
and the Ecological Footprint can be
used together or side-by-side for
different purposes.
The Ecological Budget UK has
produced the following headline results.
Material flow
> The total material input is 15.2 tonnes
per person (also described as
tonnes/capita or t/cap).
> Of this total, 26 per cent comes from
imports.
> The average household directly
purchases 2.5 tonnes a year and throws
away a tonne of waste each year.
> 35 per cent of all material goes to capital
stocks (new buildings, roads and other
infrastructure).
> 21 per cent of all material is exported.
> 37 per cent of all material ultimately
ends up as waste.
Ecological Footprint
> The total Ecological Footprint per person
in the UK is 5.4 global hectares (an area
equivalent to a normal hectare but
adjusted for average global productivity).
> The highest footprint of all devolved
administrations and English regions
is the South East at 6.3 global hectares
per person.
> The lowest footprint of all devolved
administrations and English regions is
Wales at 5.2 global hectares per person.
> If the footprint was to be distributed
evenly among the global population,
the UK is currently overshooting that
by a factor of three. In other words,
if everyone lived like we do in the
UK, we would need three planets
to support our current lifestyles.
CO2 emissions
> The total carbon emissions from
UK production is 10.8 t/cap.
> The total carbon emissions from
UK consumption is 11.9 t/cap.
> The total carbon emissions in imports
for consumption is between 10 and
30 per cent of the total UK emissions.
> In terms of carbon emissions, the most
resource intensive sectors are the cement
industry followed by electricity generation.
> The most indirectly resource intensive
sector is banking and finance.
> The consumption type with the highest
impact is domestic energy consumption
followed by car use.
> The consumption type with highest
impact per £ spent is electricity
generation.
This baseline report concludes that it
would require three planets to support the
world’s consumption if everyone used as
many of the Earth’s available resources
(“bio-capacity”) as the average UK resident.
This level of resource use is unsustainable,
and demonstrates the need for a ‘One
Planet Economy’ – an economic system
of production and consumption which
respects environmental limits while being
financially and socially sustainable. A One
Planet Economy will require a 75 per cent
reduction in resource flows and the
Ecological Footprint – this is commonly
known as a Factor Four reduction.
This is a hugely challenging target.
But it is essential to long-term sustainability,
even if achieved at the distant horizon of
2050. A Factor Four reduction in resource
consumption means a year-on-year
reduction of -3 per cent in resource flows
and Ecological Footprint. Set against an
economic growth rate averaging 2.25 per
cent per year, this implies ‘decoupling’
economic and material growth at a rate
of -5.25 per cent per year – over twice
the rate seen in recent years.
One of the key outputs of the Ecological
Budget UK project, the Resources and
Energy Analysis Program (REAP), provides
an essential contribution to the UK policy
evidence base. Following the launch of this
report, a five year programme of research
and development is now taking shape.
This includes a contribution to the evidence
base for the One Planet Economy:
> national material/energy accounts
and budget implications, to be shown
alongside the fiscal and monetary
budget, on an annual basis;
> a full breakdown of direct, external,
embedded and induced impacts of
economic activity, using CO2, material
flow analysis, Ecological Footprint
analysis and other appropriate measures;
> an investigation of key supply chains
(e.g. construction, chemicals) for their
total environmental costs and benefits
on a life cycle/risk management basis;
> an investigation of critical policy options
(e.g. nuclear power) for the total
environmental costs and benefits
on a life cycle/risk management basis.
Ecological Budget UK has taken the first
step in understanding how the decisions
we take every day affect the environment
around us. It is an essential step in creating
a platform to enable us to move from the
current UK ‘three planet economy’
to a One Planet Economy.
Executive summary

4
Sustainable development – development
that meets the needs of people today
without compromising those of future
generations – is now an urgent necessity.
However, accurate standardised measures
are required if the UK’s impact on nature
is to be determined reliably. Recognising
this, the Department for Environment,
Food and Rural Affairs (Defra) has called
for environmental policy decisions to
be based on sound evidence that
can be tested for validity, consistency
and robustness.
However, like most other countries,
the UK has so far had no comprehensive
understanding of which countries, regions,
sectors and activities contribute to its
environmental impact. Which activities
contribute most to CO2 emissions?
Where do resources come from or
end up? What are the environmental
impacts of trading with other countries?
This missing information is crucial if we
are to develop sound sustainable
consumption and production strategies
and policies for the UK.
The Ecological Budget UK project not
only provides this much needed evidence
base, but also offers a way to measure
core requirements for sustainability.
The UK Sustainable Development Strategy
itself raises the idea of a One Planet
Economy; Ecological Budget UK provides
the detail and the measuring stick for this.
1L
EA
RN
ING
TO
CO
UN
T 1 Learning to count:The Ecological Budget UK project
Ecological Budget UK: a route map The project has four main outputs:
1 This current baseline report summarises
national and regional results – a
comprehensive set of physical accounts
(CO2 emissions, the Ecological Footprint,
and material flow analysis) that reflect the
global impacts of resource consumption.
Although not a full exposition of the
methodology, it does show some
of the most important applications.
For those interested in a more technical
treatment of Ecological Budget UK and
resource accounting than is available
in this summary report, see the eight
full technical reports and publicly
available spreadsheets at
www.ecologicalbudget.org.uk.
2 Strategy for a One Planet Economy
is a prospectus for continuing research
on the question of how to steer the
UK economy towards a One Planet
Economy. It provides a demonstration
and research programme for a more
joined-up system of national accounts,
a One Planet Economy comprehensive
spending review, and One Planet
Economy strategies for each sector
of production and consumption.
3 REAP (Resource and Energy Analysis
Program) is the project’s software
application. It enables interactive
access to Ecological Budget UK’s
resource accounting data and can
assess future scenarios and policy
options in terms of sustainability.
You can learn more about REAP
at www.sei.se/reap
The Ecological Budget UK project
was funded by Biffaward and regional
partners and jointly fulfilled by WWF-UK,
the Stockholm Environment Institute
and the Centre of Urban and Regional
Ecology at Manchester University.
If everyone on Earth had the same consumption patterns as the average UK resident, humanitywould need the resources of three planets to support itself. Many government policy-makers,scientists, businesses and citizens are aware of this, and share an interest in moving towards a more sustainable and equitable use of the planet’s natural resources.
“Counting consumption”– a baseline reportUK and regional carbon, material flow & Ecological Footprint in consumpion and production
“Stategy for aOne Planet Economy”– a prospectusBuilding the evidence base for moving towards a One Planet Economy inconsumption & production
REAP toolkit(Resource and EnergyAnalysis Program)Software for modelling &assessment of consumption & production
Local areaFootprint database
Technical reports1 Outline & methods2 Data structure3 Input-output method4 UK/regional results5 Scenario model6 REAP user manual7 REAP applications8 Strategy for One Planet Economy
Regional report:North East
Regional report:West Midlands
“Sustainable communitiesin the West Midlands”

5
4 There are also regional applications
of the Ecological Budget UK in the
North East and West Midlands;
an analysis of “sustainable communities”
in urban regeneration in the West
Midlands; and a parallel project in the
North West which focuses on the
benchmarking of business sustainability.
Why is the EcologicalBudget UK projectimportant?
The Ecological Budget UK project is
a huge advance in measuring the effect
of UK consumption, providing a statistical
and scientific basis for sustainable
production and consumption strategies
in the UK at national and regional levels.
Currently, national and regional agencies
do not have a reliable and comparable
measure of the impacts of their resource
consumption. This report demonstrates
how those measures can be constructed
and used in policy-making, and the project
features many unique advances.
It shows the total global impact of
UK consumption, not only by accounting
for direct resource flows and emissions
in the UK, but also by including the
manufacture of imported products and
materials. Ecological Budget UK’s three
headline indicators – CO2 emissions,
material flow analysis, and the Ecological
Footprint – can be used side by side
for different purposes.
1L
EA
RN
ING
TO
CO
UN
T
Ecological Budget UK’s three indicators
all show the indirect effects of consumption
along with the direct effects, both upstream
and downstream of any sector or product.
This is particularly relevant in the UK’s
service-dominated economy, where the
effects of resource consumption are
often hidden through offsite supply chains.
These indicators enable comparisons
between the production side of the
economy (including exports) and the
consumption side (including imports).
Since sustainability involves consumption
as well as production, a full environmental
trade balance such as this is essential.
The indicators presented here also
show detailed differences between the
resource flows and Ecological Footprint of
local authorities and different social groups.
We suggest that the Ecological Budget
UK provides the reliable measure of human
demand on nature that the UK government
has called for in chapter 3 of its Sustainable
Development Strategy, and we believe that
this knowledge can and should be applied
directly to policy.
What does EcologicalBudget UK suggest?
This baseline report concludes that it
would require three planets to support
the world’s consumption if everyone used
as many of the Earth’s available resources
(“biocapacity”) as the average UK resident.
This level of resource use is unsustainable,
and demonstrates the need for a
One Planet Economy – an economic
system of production and consumption
which respects environmental limits while
being financially and socially sustainable.
A One Planet Economy will require a
75 per cent reduction in resource flows and
the Ecological Footprint: this is commonly
known as a Factor Four1 reduction.
This is a hugely challenging target.
But it is essential to long-term sustainability,
even if achieved at the distant horizon
of 2050. A Factor Four reduction in
resource consumption means a year-on-
year reduction of -3 per cent in resource
flows and Ecological Footprint.
Set against an economic growth rate
averaging 2.25 per cent per year, this
implies decoupling economic and material
growth at a rate of -5.25 per cent per year
– more than twice the rate seen in recent
years. This reality is the theme of the
accompanying Strategy for a One Planet
Economy, which suggests the next
steps for government, consumers
and businesses.
“The Ecological Budget UK project is a huge advance in measuring the effect of UK consumption”
1 Von Weizacker, E., Lovins, A.B. & Lovins, L.H., 1997,
Factor Four: Doubling Wealth, Halving Resource Use –
A Report to the Club of Rome, London, Earthscan.

6
Ecological Budget UK developed a number
of indicators to contribute evidence to the
UK Sustainable Consumption and
Production (SCP) Framework. It developed
detailed material flow accounts, and carbon
dioxide and Ecological Footprint accounts
by sectors and regions, to understand how
policy intervention can contribute to the goal
of a One Planet Economy. These results can
be found in chapter 3. For a full account of
what Ecological Budget UK contributed to
the material flow analysis, CO2 and Footprint
accounts, see Appendix. Below we have
described how our work relates to specific
policy areas in the UK SCP Framework.
Chapter 6 takes this further by looking at
the policy levers to achieve a One Planet
Economy by analysing the supply chains
in consumption and production for
two key sectors.
The concept of SCP was initiated at the
United Nations Conference on Environment
and Development (UNCED) in 1992.
It is rooted in the acknowledgement that
many of today’s most pressing global
environmental problems, such as climate
change, biodiversity loss and deforestation,
are associated with the sheer volume of
resources used in developed countries
such as the UK1. With the establishment
of its framework for SCP,2 the UK
government has restated its commitment
“to deliver continuous economic and social
progress that respects the limits of the
Earth’s ecosystems, and meets the needs
and aspirations of everyone for a better
quality of life now and in the future”.3
2S
US
TA
INA
BIL
ITY
PO
LIC
Y 2 Sustainability policy and Ecological Budget UK
The Resource and Energy Analysis
Program (REAP) model has three unique
features which make it suitable to
address SCP:
> analysis of total impacts of consumption
to meet final demand, not only the
emissions and resource use, in the UK;
> analysis of inter-dependencies between
sectors and supply chains, which
show market transformation effects
in the round; and
> analysis of material flow at regional
and local authority levels, enabling
a closer connection with regional
and local policies.
The REAP system of accounting opens up
new possibilities in comprehensive analysis
of global impacts (see Figure 1):
> the “internal” UK emissions accounts
at present include only emissions from
energy conversion within the UK, as
specified by the Kyoto Protocol and its
accounting conventions;
> an “extended” account includes aviation
and international shipping to and from
the UK, which are the fastest growing
emissions sources. This wider boundary
has been analysed by the Tyndall
research below;
> an “embodied” account then tracks
the goods and products produced
overseas and consumed in the UK
(this is the logic of the consumption-
based approach); and
> an “induced” account aims to measure
the ultimate environmental and social
damage, in terms of deforestation,
desertification, etc. These effects are
often more uncertain and more indirect,
but no less important. The Ecological
Footprint is increasingly popular as a
measure because it has the potential
to reflect this more global view, even
though its calculations are less certain.
To demonstrate the application of REAP
to the UK’s SCP framework, its potential
contribution to seven key policy areas of
the framework has been identified below.
The concept of Sustainable Consumption and Production (SCP) was first highlighted atthe Earth Summit in 1992. More recently, the UK government’s framework for SCP hasrestated its commitment to address development needs and quality of life issues in waysthat respect environmental limits. This chapter outlines how the Ecological Budget UKproject supports this agenda.
Products
Strengthening UK and international
measures to improve the environmental
perfomance of products and services,
including improved product design.
Production
Improve resource efficiency and reduce
waste and harmful emissions across
business sectors.
Consumption
Influence consumption patterns, including
proposals for new advice for consumers.
Procurement
Sustainable procurement in the public
sector to make the UK a leader within
the EU by 2009.
Innovation
Support for innovation to bring through
new products,materials and services.
Sustainable business
Increase transparency, corporate
responsibility and skills in business
and other organisations.
Waste
Increased emphasis on reducing waste
at source and making use of it
as a resource.
1 UN, 1992, Agenda 21, New York.
2 DTI and Defra, Sustainable Development Strategy, 2003
(available from www.sustainable-development.gov.uk).
3 ibid, p6.
4 One Planet Development Strategy, available from
www.ecologicalbudget.org.uk

Social &environmental
change
Fig 1 Measuring the external impacts of regions
1 Internal (territorial) impacts
2 External (transport) impacts
3 Embodied impacts
4 Induced impacts
Overseasproduction
Production Distribution Consumption Waste Exportedwaste
Internationaltransport
Material flows
7
Products
SCP policy: Strengthening UK and
international measures to improve the
environmental performance of products
and services, including improved
product design.
The REAP program shows improvements
in performance by changing consumer
demand for energy, and the direct and
indirect performance of service sectors.
On a number of fronts, better performance
may or may not be enough to counteract
increasing consumption. For instance, a
refrigerator may become twice as efficient,
but have no gain in efficiency, if it is twice
the size. For some products, most impact
occurs during the production phase
and others in the use phase. REAP has
the ability to identify where in the supply
chain a product’s impact lies, thereby
providing valuable insights to improve
product efficiency.
Production
SCP policy: Improve resource efficiency
and reduce waste and harmful emissions
across business sectors.
The Ecological Footprint is a valuable
measure of energy and material intensity
in production. So far, gains in technological
efficiency have just kept pace with rises
in consumption. With a detailed
understanding of the direct and indirect
material and energy use of production
patterns in the UK, Ecological Budget UK
data can highlight where intervention can be
made to achieve the greatest improvement.
The need for capturing impacts across the
entire upstream and downstream supply
chain is of particular importance and has
been noted in the Guidelines of the Global
Reporting Initiative (GRI) and by the World
Business Council on Sustainable
Development. Ecological Budget UK has
made a major step in understanding this
down to the sectoral level.
2S
US
TA
INA
BIL
ITY
PO
LIC
Y
Consumption
SCP policy: Influence consumption
patterns, including proposals for new
advice for consumers.
One of Ecological Budget UK’s strengths
is that it has provided the most detailed
analysis of the environmental consequences
of consumption in the UK to date. The data
is organised by the standard consumption
classification system (COICOP) and gives
room for a number of analyses helping
to combine expenditure data with
environmental impacts and social welfare
issues. The Ecological Footprint also has
great potential to raise awareness, but it
remains to be seen to what degree people
will change their consumption habits.
Procurement
SCP policy: Sustainable procurement in
the public sector to make the UK a leader
within the EU by 2009.
REAP can analyse procurement choices.
Increasingly, as public services are
privatised, the first objective for the public
sector is to minimise short-term costs
which can work against attempts to invest
in sustainable procurement. As a good
test of the REAP toolkit, the Sustainable
Development Commission has
commissioned SEI to explore the CO2
Footprint of the education sector. Again,
the fact that REAP can consider both the
direct and indirect flows of procurement
is a considerable advancement with
significant policy application.
Innovation
SCP policy: Support for innovation to
bring through new products, materials
and services.
While not directly highlighting the
barriers that exist in achieving resource
efficiency gains in new products, Ecological
Budget UK does benchmark the average
performance of a sector, allowing
comparisons to be made with new
products entering the market.
Sustainable business
SCP policy: Increase transparency,
corporate responsibility and skills in
business and other organisations.
This is clearly essential; government
alone cannot bring about sustainable
consumption and production. To help
with this, the REAP toolkit provides
evidence about industry and raw material
supply chains, the effects of innovation,
performance benchmarking and so on.
Combined with future work on structural
path analysis, information from
Ecological Budget UK can help unravel
a company’s supply chain. This provides
extensive detail of the impact of sector
or company activities. In the case of
a company, control over the input
procurement process then provides the
possibility of substituting impact-intensive
suppliers with more sustainable suppliers.
Waste
SCP policy: Increased emphasis on
reducing waste at source and making
use of it as a resource.
The One Planet Development Strategy4
shows that this needs a comprehensive
market transformation programme in each
key sector. Combining waste data with
resource input data helped identify
resource-greedy sectors and establish
where noteworthy changes can be made.
ResearchA technical description of the research
undertaken for the Ecological Budget UK
project can be found in the Appendix.

8
Ecological Budget UK indicator 1: CO2 emissions
The UK interacts with the rest of world
through trade – exchanging resources,
services, cultures and ideas. In terms of
resources, this means importing more than
230m tonnes of materials and products
and exporting 193m tonnes, exchanging
resources with most countries in the world.
CO2, emitted when most of these
materials and products are produced,
contributes significantly to climate change –
a fact which is undisputed in the published
scientific literature. Highlighted by key
political figures in the UK as one of the
greatest threats to mankind, climate
change has risen up the political agenda.
The Kyoto Protocol demonstrates
a global consensus that action to reduce
CO2 emissions is a priority.
If they are to be reduced, it is important
to monitor and measure CO2 emissions
and which human activities cause them.
At present, the government measures
CO2 physically emitted within the UK’s
boundaries, as specified by the Reporting
Convention of the COP (Consumption
according to Purpose). The indicator can
be described as “territorial emissions” or
“emissions from production”. The Ecological
Budget UK CO2 indicator also estimates
emissions from consumption as well
as production. Figure 1 juxtaposes these
two methods of allocating emissions.
Emissions from production include all
CO2 emissions from goods and services
produced in the UK wherever they are
consumed (either in the UK or exported).
3N
AT
ION
AL
RE
SU
LTS 3 National results:
Ecological Footprint, CO2 emissions and material flow analysis
This measure does not take into account
import-related emissions. The “emissions
from consumption indicator” includes
the emissions from goods and services
consumed within the UK, wherever they
come from (UK goods and services
produced + imports – exports). While
including import-related emissions in
the estimation procedure, this indicator
excludes export-related emissions.
Each approach has a different application
and there are, of course, advantages and
disadvantages to both. The production
indicator can help pinpoint the drivers
behind changes in emissions rooted in the
way the UK provides its goods and services
to final consumers across the world, while
the consumption indicator can help to
identify drivers behind changes in the
worldwide impact of emissions from the
UK’s consumption patterns. Both indicators
are required to enable informed decisions,
more efficacious and fair policies,
and more specific abatement strategies.
Hypothetically, one way to reduce
CO2 emissions from production (territorial
emissions) would be to close down all
UK manufacturing, shift it to other countries,
then import the goods and services that
the UK consumes. However, although
this would eliminate many emissions from
production, it would do nothing to curb
total global emissions (due to continuing
consumption). To a much lesser degree,
this pattern has occurred within the UK
as its economy has shifted from heavy
industry towards services – a sector which,
more than any other, depends on indirect,
“hidden” resource flows far away from
its final consumed product.
The current absence of a “CO2
emissions from consumption” indicator
is a shortcoming of present UK monitoring
approaches, which Defra has recognised.
The Department is working with the
Stockholm Environment Institute to
identify the most appropriate approach
to constructing such an indicator for the
UK. It is essential that a CO2 indicator that
accounts for trade and overall consumption
be included in the UK’s headline indicators
for sustainable development.
At present, there is no commonly
accepted method for calculating embodied
CO2 emissions of imports. Most frequently,
these embedded emissions are estimated
based on the assumption that imports are
produced with the same economic structure
and the same resource efficiency as in the
UK. Considering that many goods and
services come from regions of the world
where resource efficiency is lower (and
therefore emission intensities are higher than
in the UK), there is a wide consensus that
ignoring different production technologies
results in an under-estimation of the
overseas impact of UK consumption.
Therefore, some authors1 2 have proposed
models that use specific information about
production processes and efficiencies
in other countries. In order to establish
a robust indicator for calculating import-
related CO2 emissions, Defra has
The Ecological Budget UK project analysed the Ecological Footprint, CO2 emissions andmaterial flows of the UK. Each of these indicators is an important measure of resource flowsin the UK economy and offers an insight into how the economy impacts upon the global and local environment. Below is a summary of the results of each indicator.
Fig 1 CO2 emissions from consumption and production
CO2 emissionsfrom goods and servicesproducedand consumedin the UK
CO2 emissionsfrom exportsfrom the UK
CO2 emissionsfrom imports to the UK
The rest ofthe world
UK Abroad
Ab
road
UK
Production emissions
Co
nsum
pti
on
emis
sio
ns

9
commissioned SEI to review existing
approaches and to propose an
appropriate estimation framework.
This work is continuing.
Recognising that it is insufficient to use
only national data for calculating the CO2
emissions embodied in imports and the
current lack of a standard procedure for
doing it differently, SEI is adopting a careful
estimation approach by taking an average
of a lower and a higher bound estimate of
models that use specific information of the
different world regions. The lower bound
estimate accounts for specific resource
efficiencies of 12 economic sectors in eight
world regions.3 The higher bound estimate
of import-related emissions is taken
from the National Footprint Accounts.4
Therefore, at first stage there is still
significant uncertainty of the scale of issue.
Some analyses suggest a “CO2 from
consumption” indicator is 30 per cent higher
than the UK territorial emissions, while
others suggest a very small variation.
Employing the methodology described
above, Figure 2 shows the difference of
CO2 emissions from consumption and those
from production. The difference is due to
trade of goods and services that emit
CO2 in their production.
3N
AT
ION
AL
RE
SU
LTS
More than 636m tonnes of CO2 are
emitted in the UK. On the other hand,
UK consumption causes 703m tonnes
of emissions, both within the UK and
in the rest of the world. This is 11 per cent
higher than emissions from production.
Household activities are the single largest
contributor to CO2 emissions from
consumption. Figure 3 provides a
breakdown of what kinds of household
activities contribute most to the UK’s
emissions from consumption.
In households, the consumption of gas
and electricity is responsible for 23 per
cent of total CO2 emissions. This is
closely followed by personal transport
use. Emissions from car purchase, use,
maintenance and repair, and all public
transport, account for 21 per cent of total
emissions (most being from cars). These
two key categories represent nearly 50 per
cent of total emissions from consumption.
Food contributes significantly to CO2
emissions from consumption.
Combining eating out and food purchased
for consumption at home accounts for
more than 7 per cent of emissions.
Onsite vs. offsite production of CO2
Because industries trade goods and
services with each other in the process
of producing goods for final demand, it
is possible to distinguish between onsite
production emissions (CO2 emitted directly
from an industry’s production centres) and
offsite production emissions (those emitted
elsewhere to provide goods or services
for a particular production industry).
It is important to note that offsite
emissions take into account sectoral
interdependencies between industries
in their production processes.
In Figure 4, column 1 displays the
onsite CO2 emissions of different industrial
sectors. As may be expected, onsite
carbon releases from the energy sector are
Emissions fromconsumption
Emissions fromproduction
0
2
4
6
8
10
12
Government
Capital investment
Household
Other
CO
2em
issi
ons
t/ca
pFig 2 CO2 emissions from consumptionand production
10.76 t/cap 11.81 t/cap
0
0.5
1.0
1.5
2
Fig 3 UK household CO2 emissions from consumption
House
hold
appli
ance
s
Person
aleff
ects
n.e.c
Ration
ofpe
rsona
l
trans
port
equip
ment
Purcha
seof
vehic
lesFo
od
Caterin
g servi
ces
Trans
port
servi
ces
Private
trans
port
(car fue
l)
Electric
ityco
nsum
ption
Gasco
nsum
ption
CO
2em
issi
ons
t/ca
p
Figure 2 shows
the difference in
CO2 emissions
from consumption
and CO2 emissions
from production.
The difference is
due to trade of
goods and services
that emits CO2
in their production.
the most significant, amounting to 179m
tonnes, followed by the transport sector
with 114m tonnes and metal manufacturing
with 72m tonnes.
Column 2 reflects the interdependencies
of industries, and takes into account the
industrial supply chains (and resulting CO2
emissions) that provide materials for
production of particular goods or services.
The measure assigns emissions to the final
product or service at the end of the chain.
This is called a “lifecycle” perspective, and
accounts for all relevant onsite and offsite
CO2 flows required to provide for the final
deliveries of the various industrial production
sectors. Another way to put it is that a
lifecycle measure of CO2 from production
only measures the carbon emitted from the
final product delivered to individual
consumers.
Measuring CO2 onsite versus measuring
CO2 in terms of lifecycle emissions of a
product (including offsite emissions)
considerably changes the total emissions
assigned to each sector. For instance, once
the energy sector is held responsible only
for the emissions it triggers by delivering
energy directly to consumers, its
CO2 account drops to 77m tonnes.
This is a considerable reduction of more
than 100m tonnes, and in terms of lifecycle
CO2 emissions from production makes
the transport sector the single largest
CO2-emitting sector – around 84m tonnes.
Emissions no longer allocated to the
energy sector (in this case) are re-allocated
to the other industrial sectors that use
energy to produce their final goods and
services. While the energy industry’s
lifecycle emissions are smaller than its onsite
emissions, the opposite is true for most
service industry sectors – wholesale and
retail trade, construction and finance
(“financial intermediation”) for example.
While the finance sector emitted only 1.6m
tonnes of CO2 from its own sites, it caused
1 Harris, R., 2000, “Methodologies for estimating the levels
of atmospheric emissions arising from the production of
goods imported into the UK”, ONS Eurostat contract No.:
97/09/57/013 Part 1. London, Office for National Statistics.
2 Lenzen, M., Pade, L.L. & Munksgaard, J., 2004,
“CO2 Multipliers in Multi-region Input-Output Models”,
Economic Systems Research, 16:391-412 pp.
3 Wiedmann, T., Moro, M., Hammer, M. & Barrett, J., 2005,
“National and Regional Physical Accounts (Material Flows)
for the United Kingdom”. REAP Report No. 4, Resources
and Energy Analysis Program, Stockholm Environment
Institute, York, November 2005. Available at
www.ecologicalbudget.org.uk
4 Wiedmann, T., Minx, J., Barrett, J., Wackernagel, M.,
2006, “Allocating Ecological Footprints to Final
Consumption Categories with Input-Output Analysis”,
Ecological Economics 56, 2006, 28-48.

the highest “hidden” emissions – required
by their extended supply chains but emitted
by other sectors. Service industries lead this
measure, since they produce little physical
output while heavily relying on intermediate
inputs from other industries. Per £ spent
on final demand, 98 per cent of the CO2
emissions triggered in the banking and
finance sector are triggered offsite. Similarly,
96 per cent of emissions from the insurance
and pensions sector are caused offsite,
followed by 93 per cent of emissions for
the real estate sector.
10
another 17m tonnes of offsite emissions in
other sectors.
The offsite emissions in the wholesale and
retail trade sector amounted to about 58m
tonnes, while onsite emissions were just
about 12m tonnes. This approach has
significant policy relevance. Onsite accounts
help identify target sectors, while lifecycle
emissions help identify the most important
supply chains. Information from our
models can be used to identify the most
resource-intensive processes within
these supply chains.
While the above table reflects the total
emissions triggered by industrial sectors
from two different perspectives, Figure 5
shows the 10 most CO2-intensive industrial
3N
AT
ION
AL
RE
SU
LTS
production chains in the UK economy
per £ spent on final demand. While the
production of non-mineral products,
including the “cement, lime & plaster”
industry, only triggers a total of about
13m tonnes of CO2 along its lifecycle, it is
the most CO2-intensive production process
per £ spent on final products, followed by
the energy sector and the production of
inorganic chemicals. Again, this information
has a clear policy relevance because
it identifies the most intensive production
supply chain priority sectors that can be
targeted. Figure 6 estimates offsite
CO2 emissions compared with total lifecycle
emissions per £ spent on final demand.
In effect, this shows which industries have
Code Industry
1-2 Agriculture 8.85 8.03 0.81
3 Fishing 3.27 1.17 2.10
4-5 Mining of energy producing materials 26.07 11.06 15.00
6-7 Other mining 2.79 4.45 1.65
8-20 Food 17.27 26.73 9.46
21-28 Textiles 9.61 12.90 3.29
29-30 Leather 1.10 1.21 0.11
31 Wood 6.60 1.43 5.17
32-34 Paper 23.61 9.96 13.65
35 Petroleum products 22.51 15.23 7.27
36-46 Chemicals 61.09 36.34 24.75
47-48 Rubber & plastics 24.34 10.24 14.10
49-53 Other non-metal mineral products 18.98 6.25 12.72
54-61 Basic metals 71.91 34.66 37.24
62-68 Machinery 30.76 40.58 9.82
69-76 Electricals 34.31 41.83 7.52
77-80 Transport equipment 31.32 51.90 20.58
81-84 NEC 43.72 37.15 6.56
85-87 Electricity, gas and water supply 179.07 76.80 102.27
88 Construction 6.17 37.83 31.66
89-91 Wholesale and retail trade 12.33 69.92 57.58
92 Hotels and restaurants 2.62 32.35 29.73
93-99 Transport, storage & communication 113.81 84.06 29.74
100-102 Financial intermediation 1.58 18.81 17.23
103-114 Real estate 6.50 28.89 22.38
115 Public administration & defence 9.96 32.28 22.32
116 Education 5.87 16.52 10.65
117-118 Health & social work 7.25 26.13 18.88
119-122 Other community activities 7.61 16.12 8.51
123 Private households with employed persons - - -
Total 790.99 790.99 -
CO2 emissionsfrom production
(measured on-site)
LifecycleCO2 emissions from
production (takinginto account off-site
emissions & tradebetween industries)
Fig 4 Onsite and “lifecycle” CO2 emissions from production, by industrial sectors (millions of tonnes) 2001
0
2
4
6
8
10
1
Fig 5 Top ten shares of offsite CO2 intensities
C
emen
t,lim
e&
plas
ter
Elec
trici
typr
oduc
tion
&di
strib
utio
n
Inor
gani
cch
emic
als
Iron
&st
eel
Wat
ertra
nspo
rt
Fish
ing
Airt
rans
port
Ferti
liser
s
Non
-ferro
usm
etal
s
Gas
dist
ribut
ion
CO
2in
tens
ity(t/
cap)
0
Ban
king
&fin
ance
Anci
llary
trans
port
serv
ices
Insu
ranc
e&
pens
ion
fund
s
Ow
ning
&de
alin
gin
real
esta
te
Lega
lact
iviti
es
Com
pute
rser
vice
s
Auxi
llary
finan
cial
serv
ices
Hot
els,
cate
ring,
pubs
,etc
.
Con
stru
ctio
n
Toba
cco
prod
ucts
%
20
40
60
80
100
Fig 6 Top ten shares of offsite CO2 flows
CO
2in
tens
ity(t/
cap)
The difference

11
3N
AT
ION
AL
RE
SU
LTS
Ecological Budget UKIndicator 2: material flow
While in the past most environmental
initiatives focused on containing
concentrated toxins and pollutants, many
contemporary environmental problems are
a result of the sheer volume of resources
required by the human economy. The
material flow analysis (MFA) results from
the Ecological Budget UK catalogue
the tonnages of material resources needed
to supply every form of consumption and
production in the UK. Ecological Budget
UK’s MFA shows, in terms of volume of
resources used, why the UK’s Ecological
Footprint is as big as it is. It suggests
that, in order to reduce this Footprint,
it is necessary to reduce the volume and
increase the efficiency of resources flowing
through the economy. To this aim, MFA
can identify resource-greedy production
and consumption sectors, at which the
government can target efficiency efforts.
Figure 7 is a summary of the material
flows of the UK economy by industrial
sectors. The “Input” side documents the
total material input into the UK’s economy
and comprises production in the UK and
imports from the rest of the world. All this
data can be viewed on the Ecological
Budget UK website in considerably more
detail (www.ecologicalbudget.org.uk).
Figure 7’s “Output” shows where
products were consumed: either directly
by households or capital investment, or
indirectly by other industrial sectors higher
up in the supply chain in order to produce
their own “output”. Industrial sectors 1 to 7
represent the primary sectors, which provide
the raw materials for industrial processes.
A considerable proportion of their output
to the UK economy is purchased by other
industries (called “intermediate demand”).
The output side includes waste by
industrial sectors.
Overall, the total raw material input to
the UK economy in 2001 was 664m tonnes.
This figure corresponds with the Office of
National Statistics’ (ONS) total, ensuring
that these accounts are compatible. These
accounts, however, go further than the
ONS totals and provide a comprehensive
breakdown of the resource requirements
and outputs of each sector, and their
destination by final demand category.
The food, beverage and tobacco industry,
for example, provided 100m tonnes of
products, of which 80m tonnes were
domestically produced and 20m tonnes
imported. This is the highest output across
manufacturing sectors. Some 43m tonnes
of these products were consumed by
Fig 7 The material flows of the UK economy (millions of tonnes)
Imports Direct Indirect Direct Indirect Residual materialRegional Imports from other material flows material flows material flows material flows flows (incl.trans- Exports
Total production from rest regions Total of household of household of capital of capital formation, stock to rest Code Industry supply (2001) of world in the UK demand consumption consumption investment investment changes & waste) of world
1-2 Agriculture 112.20 96.24 15.96 - 112.20 42.22 44.01 2.09 4.45 15.95 3.46
3 Fishing 1.29 0.91 0.37 - 1.29 0.05 0.70 - 0.01 0.36 0.15
4-5 Mining & quarrying 333.03 255.69 77.33 - 333.03 11.24 126.25 2.95 17.45 80.70 94.41
6-7 Other mining 332.78 310.81 21.97 - 332.78 - 42.99 - 3.06 268.01 18.71
8-20 Food 99.68 80.22 19.46 - 99.68 42.70 33.42 - 0.65 15.72 7.17
21-28 Textiles 5.12 2.39 2.73 - 5.12 2.03 0.90 - 0.22 1.07 0.88
29-30 Leather 0.73 0.05 0.67 - 0.73 0.21 0.11 - 0.06 0.24 0.09
31 Wood 14.80 7.62 7.18 - 14.80 1.32 4.53 0.40 4.80 2.90 0.83
32-34 Paper 25.06 14.34 10.71 - 25,06 0.30 5.61 0.02 5.26 10.52 3.33
35 Petroleum products 19.93 - 19.93 - 19.93 2.50 6.02 - 1.33 11.65 21.72
36-46 Chemicals 47.15 29.06 18.09 - 47.15 2.13 14.21 0.007 3.96 13.80 13.03
47-48 Rubber & plastics 9.27 6.17 3.09 - 9.27 0.73 3.12 0.12 1.70 1.61 1.98
49-53 Other non-metal mineral products 131.47 127.10 4.37 - 131.47 3.24 30.41 5.21 57.85 31.25 3.49
54-61 Basic metals 44.72 31.00 13.72 - 44.72 0.18 9.30 1.88 9.65 8.23 15.46
62-68 Machinery 12.39 8.25 4.14 - 12.39 0.95 1.72 2.58 0.62 4.02 2.47
69-76 Electricals 20.84 17.89 2.95 - 20.84 0.39 2.02 3.26 1.96 11.11 2.07
77-80 Transport equipment 16.87 11.44 5.43 - 16.87 3.88 2.66 2.25 0.51 4.34 3.21
Supply Demand
private households directly, while another
33m tonnes occurred indirectly during
production. The remaining 24m tonnes
were exported or added to the physical
stock of the economy.
Sectors 8 and onwards do not produce
their own raw materials, but draw them
entirely from sectors 1 to 7. The output
figures of secondary or manufacturing
sectors (8-80) show the amount of
products provided to the UK economy
domestically and from abroad. Service
sectors have been excluded here, because
they use rather than produce materials
or products.
As with most material flow accounts,
construction materials dominate.
Responsible for more than 200m tonnes
of materials in 2001, capital investment5
accounts for over a third of UK resource
flows. This highlights the importance of
ensuring at the national policy level that
resource efficiency is integrated into new
capital investment.
Manufacturing is a lower proportion
of the whole UK economy than in the
past. However, the UK still exports a
considerable amount of products – 193m
tonnes – and a considerable proportion of
the materials produced in the UK stay here.
5 Capital Investment refers to money used by a business to
purchase fixed assets (for example land or buildings).

12
Many exports are materials that at one point
in their lifecycle were imported. Influenced,
like most countries, by policies supporting
globalisation and world trade, the UK
swaps and transports millions of tonnes
of materials to and from countries around
the world.
Waste in the UK
The UK’s pattern of waste “arisings” (waste
production) and waste management is
crucial to understanding its material
“metabolism” (how materials flow through
the economy). The national material flow
accounts show the economy’s material
inputs, imports, exports and waste streams.
This evidence can be applied in various
ways: the first conclusion is that at a
conservative estimate, British industry is
putting up to 8 per cent of its gross profit
into landfill.6
Waste data at the sectoral level has
been derived from the 2002/3 commerical
and industrial survey compiled by the
Environment Agency (EA). Figures for waste
covered a number of industrial and
commerical sectors. Therefore the total
net production of waste within the grouping
was used to determine what proportion
of the EA’s “total group waste figure”
was apportioned to that particular
industry sector.7
3N
AT
ION
AL
RE
SU
LTS
At the regional level, poorer regions (for
example the North East and Wales, which
also tend to produce more goods than they
consume) have far more waste arisings and
disposal shortfalls. This will become more
crucial as landfill taxes and transport costs
rise, as the local waste trading system
gets under way, and as new opportunities
emerge in waste recovery for environmental
technologies8.
Waste arisings have been projected to
2020/21 in the ODPM Companion Guide
to Planning Policy Statement 10: Spatial
planning for integrated waste transport
(March 2006).9 The average growth rate
in municipal solid waste for England and
Wales was 3 per cent per year.10 Figure
8 provides a summary of each UK region’s
projected growth rate for waste arisings,
along with a predicted increase
in tonnages of waste needing disposal
or recovery from 1998/9 to 2020/21.
Figure 8 shows that on current trends,
an extra 113m tonnes of waste will need to
be dealt with by 2020. Of this, 48m tonnes
(42 per cent) is mostly inert waste from the
construction and demolition industry, much
of which is reused in aggregates and
construction. For the remainder, if we
convert the regional arisings to tonnages
per capita within each region using 2001
census data, we conclude that, within the
next 15 years, each UK resident will
produce 1 extra tonne of waste per annum.
Most local authorities predict that they will
only have capacity for about 25 per cent
of this to be landfilled by 2021, which will
mean that many extra facilities must be
provided to recycle, reuse, recover or
convert this material to energy by that year.
Min Max Municipal Commercial Industrial Special Constructiongrowth growth solid waste waste waste waste & demolition
RReeggiioonn % annum % annum tonnage tonnage tonnage tonnage waste tonnage Total
North West 3.00 3.51 4.55 1.72 0.90 0.95 14.74 22.02
North East 3.00 3.71 1.78 0.54 0.92 0.87 4.41 7.75
Yorkshire & Humberside 2.53 3.00 2.57 1.21 2.31 1.46 2.59 8.85
West Midlands 3.00 4.00 3.76 0.34 1.27 0.66 3.44 8.90
East Midlands 3.00 3.56 2.56 0.97 1.44 1.52 3.34 8.49
London 2.59 4.60 7.04 2.37 0.50 1.09 3.60 13.63
East of England 3.00 4.50 4.86 1.35 0.89 1.59 3.91 11.18
South West 3.00 4.13 3.49 0.98 0.71 0.73 3.71 8.98
South East 2.18 3.00 4.76 2.20 1.21 0.11 7.16 15.46
West 3.00 6.00 4.05 0.62 1.22 0.10 1.79 7.78
Total 39.46 12.36 11.40 11.06 48.74 113.08
Fig 8 Predicted increase in millions of tonnage of waste arisings between 1998/9 and 2020/21 (additional tonnage to 1998/9 position)1111 1122
6 Cambridge Econometrics & AEA Technology, 2004,
Benefits of Greener Business, report to the Environment
Agency, available at www.reward-uk.org
7 For more information on the approach visit
www.ecologicalbudget.org.uk
8 Note: Scotland and Northern Ireland operate their
own systems and data is pending.
9 This Guide takes details from the Strategic Waste
Management Assessments (SWMAs) reports on each
region, based on 1998/99 figures for waste arisings,
and predicts increases in waste arisings per region.
Each sub-region has different rates of growth, depending
on what was reported in regional reports and the Defra
Municipal Waste Survey.
10 UK Prime Minister’s Strategy Unit (PMSU),
Waste Report, 2002.
11 A further breakdown of waste arisings can be found
on the Ecological Budget UK website
(www.ecologicalbudget.org.uk) by municipal, commercial,
industrial and special waste.
12 EA predictions. Note: with the exception of municipal
waste data, there is a lack of detailed waste data for
most waste streams. Agricultural waste growth
predictions not available.
13 A global hectare is the same size as a normal hectare
and is adjusted for average world productivity.
“On current trends, an extra 113mtonnes of waste will need to be dealt with by 2020”

13
Eliminating overshoot is crucial to the
long-term well-being of the planet.
Unfortunately, overshoot is often not
obvious until it is too late, since natural
capital can continue to be harvested even
if it is being used at an unsustainable rate.
For example, it is possible to over-fish and
eventually deplete a local area, but fish
yields might continue even as the system
teeters on collapse.
Sustainable development means
accepting ecological limits and the reality
of overshoot. It is not possible to draw on
ecological services faster than they can be
replenished and still be sustainable, even if
the consequences aren’t immediate. As it
is, the Ecological Footprint of the UK is
5.4 global hectares per person13 (gha/cap) –
compared with a world average of 2.2
gha/cap and an available global biocapacity
of 1.8 gha/cap. On a per person basis,
the UK has an Ecological Footprint among
the highest 15 countries. This exceeds
global ecological limits, particularly as
developing countries continue to increase
their Ecological Footprint and take up a
larger share of global biocapacity.
For this study, the UK Ecological Footprint
has been categorised according to different
final demand (consumption) categories.
Primarily, these involve various kinds of
household consumption, but also include
consumption by government and capital
investment, as seen in the box right.
3N
AT
ION
AL
RE
SU
LTS
Indicator 3: Ecological Footprint
The Ecological Footprint is a calculation
method that estimates the demand of
human activities on nature. Any sort of
resource use – going out for a meal,
flying to Spain, building a house, or even
paying into a pension scheme, leaves
an Ecological Footprint on the planet.
The Ecological Footprint is a
comprehensive measure of the resources
consumed by a population (the UK, in this
analysis). It measures the balance between
human demand and nature’s supply. The
Footprint calculates how much productive
land and sea is needed to provide the
energy, food and materials we use in
our everyday lives, and how much land
is required to absorb our waste. It also
calculates the emissions generated from the
oil, coal and gas we burn, and determines
how much land is required to absorb them.
The Ecological Footprint can be
estimated for individuals, households,
schools, businesses, cities, regions or
countries, and can assess the demand a
population is placing on the environment.
Sustainability requires living within
the regenerative capacity of the planet.
At present, human demand is exceeding
this capacity by about 20 per cent.
This is called “overshoot” (see Figure 9).
In essence, ecological overshoot means
the overuse of domestic or overseas land
resulting in overgrazed pastures, depleted
fisheries, degraded forests and the
accumulation of carbon emissions in the
global atmosphere. The Ecological Footprint
is an important tool in attempting to
understand this phenomenon.
1.4
1.2
1.0
0.8
0.6
0.4
0.2
01960 20001995199019851980197519701965
Ecological Footprint
Available biological capacity
Num
ber
of p
lane
ts
Fig 9 Humanity’s Ecological Footprint (WWF Living Planet Report 2004)
Travel 0.84
Home & energy 1.16
Food & drink 1.14
Fig 10 Ecological Footprint of the UK (gha/cap)
Consumables0.65
Services 0.41
Fixed capital 0.76
Government & other 0.40
5.4 gha/cap
The main componentsof the UK’s EcologicalFootprint (gha/cap)Home and energy 1.16
Domestic fuel including gas and
electricity, oil and bio-fuel. Also includes
the building, maintenance and repair of
dwellings.
Food and drink 1.14
Food and drink purchased for home
consumption, alcoholic drinks purchased
in pubs, restaurants, takeaways, and
other catering establishments.
Travel 0.84
Car fuel, the impact associated with
purchasing and maintaining private
vehicles, and public transport.
Capital investment 0.76
Investment in tangible fixed assets such
as plant and machinery, transport
equipment, dwellings and other buildings
and structures.
Consumables 0.65
Includes durable and non-durable items
including newspapers, clothing,
appliances, glassware, tools, medical
products, audio-visual equipment,
personal effects, etc.
Services 0.41
Includes education, postal, telephone,
water supply, recreation, insurance,
private hospital, financial services, etc.
Government and other 0.40
Includes the resources used by national
and local government, universities and
colleges.
Household energy
consumption, food
consumption and
transport dominate
the Ecological
Footprint of the UK.

What makes up the high EcologicalFootprints of the SouthEast and other areassurrounding London?
> higher income means greater access
to resources, particularly noticeable in
more purchases of furniture, personal
effects and household appliances;
> very high travel demand dominated by
low-occupancy, high-polluting vehicles;
> regular purchase of new cars: in some
areas of the South East the Footprint
of buying and maintaining cars is
higher than the national average
Footprint for using them;
> long-distance exotic holidays more
than once a year;
> large and often old inefficient homes
with low occupancy compared with
their size;
> heavy reliance on the service sector
for eating out, recreational and cultural
activities;
> large gardens that need maintenance
and treatment;
> more short weekend breaks in the UK;
> and
• a lower Footprint for tobacco;
• an average Footprint for alcohol;
• an average Footprint for food eaten
at home.
14
The Ecological Footprint of every
local authority area in the UK
Combined with funding from other projects,
the Ecological Budget UK project has
produced an Ecological Footprint for every
local authority area in the UK. Figure 13
provides an insight into the variation of the
Ecological Footprint across the country.
All this data, and a detailed description of
the methodology used to calculate these
Footprints, is available free of charge at
www.sei.se/reap and
www.ecologicalbudget.org.uk
There tend to be high Ecological Foot-
prints in the Home Counties and wealthier
London boroughs, and in some rural areas,
especially the East of England and Cheshire.
The lower-income areas of Wales, the South
West, and the “Northern Way” areas in the
North have lower Footprints.
The connection between wealth and
the Ecological Footprint
Even data at the local authority level hides
many variations in the UK’s Ecological
Footprint. The variation between the largest
and smallest local authority areas is 26 per
cent. When we look at the Ecological
Footprint of socio-economic groups across
the UK, the group with the largest
Ecological Footprint has a 40 per cent larger
Footprint than the group with the smallest.
Figure 11 shows the Footprint of all the
ACORN14 groups in the UK, highlighting the
impacts of different groups in the UK. The
challenge of sustainable development is to
decouple a high quality of life from a high
Ecological Footprint.
3N
AT
ION
AL
RE
SU
LTS
350
300
250
200
150
100
50
0
1200
1000
800
600
200
400
019 61 2001199119811971
1000
GDP at market prices
EF of consumption
Final consumption expenditure
Eco
logi
cal F
ootp
rint
(mill
ion
glob
al h
ecta
res)
Bill
ions
of E
uros
Fig 12 Trends in economic growth and Ecological Footprint in the UKFig 11 The Ecological Footprint of ACORN types
6.0
7.0
5.0
4.0
3.0£190 £210 £230£170£150£130£110
Eco
logi
cal F
ootp
rint
(gha
/cap
)
Total expenditure (£/cap/wk)
EF per ACORN typePolynomial trendline
EF of consumptionEF of consumptionEF of consumption
Bill
ions
of E
uros
200
Bill
ions
of E
uros
In general, it is still the case that
the more the UK spends, the
greater its Ecological Footprint.
This sets an interesting challenge
when attempting to move towards
sustainable development. To what
degree is it possible to continue
economic development, increase
household expenditure and reduce
the UK’s Ecological Footprint?
“There tend to be high EcologicalFootprints in theHome Counties andwealthier Londonboroughs, and insome rural areas,especially the East of England and Cheshire”
14 ACORN – A Classification of Residential Neighbourhoods
– is produced by CACI. For more information visit
www.caci.co.uk

15
3N
AT
ION
AL
RE
SU
LTS
Fig 13 UK Ecological Footprints (England and Wales by NUTS4 District; Scotland and Northern Ireland aggregated)
Total Ecological Footprintincluding aviation (gha/cap)
Northern Ireland aggregate value 5.56Scotland aggregate value 5.27
4.50 - 4.74
4.75 - 4.99
5.00 - 5.24
5.25 - 5.49
5.50 - 5.74
5.75 - 5.99
6.00 - 6.24
6.25 - 6.49
6.50 - 6.74

16
The Ecological Budget UK project provides
the most comprehensive understanding
yet of the UK’s physical production and
consumption, and of the resource flows
between regions, devolved administrations,
and the rest of the world. This then provides
the vital evidence to feed back into future
economic and spatial strategies.
1. Why look at regionsand devolved countries? In some ways, regions and devolved
administrations are the cornerstones of
sustainable development, where there
is often a “fit” between physical, social,
economic and political activities. Water
catchments, air dispersion patterns, soil
types and agricultural markets are each
quite clearly defined at the regional level.
So are urban hinterlands, travel patterns
and housing markets. Economic flows,
industrial profiles, higher education, research
and media awareness are strong at this
level. Around the UK there is a long history
of regional identity, linked with dialects and
kinship patterns.
In general the regional level offers
an opportunity to make new linkages
for the sustainable development agenda,
between the local and the national scale,
where economic and urban policy is often
in a greater state of flux. The new plethora
of regional and devolved development
agencies, assemblies, government offices,
quangos and others are each intended
to add value at the appropriate level, and
if properly coordinated could so do.1
In practice the rhetoric is way ahead
of the reality: while each UK region or
devolved country produces its sustainability
4R
EG
ION
AL
OV
ER
VIE
W 4 Regional overview
strategies and appraisals, it continues to
increase its global impacts through material
consumption and mobility.2 It is clear that
“more of the same” is unlikely to deliver
solutions to complex and deep-rooted
problems, but that new thinking is needed
on the potential at the regional level for
linking public, private and community
sectors.3
The Ecological Budget UK project
aims to contribute to this new agenda. By
targeting its analysis at the regional level, it
provides a practical yardstick for assessing
problems and potential solutions. By looking
at both the consumption and production
sides, it brings together the regional
economic strategies and spatial strategies
which often point in different directions.
The UK space
The UK comprises nine English regions
including London, and the three devolved
administrations of Northern Ireland,
Scotland and Wales. Each has a different
mix of political and economic power,
and each is at the upper level of a local
government structure of counties, rural
districts, metropolitan boroughs and
unitary authorities.
In terms of collecting consistent resource-
use data and developing sustainable
development strategies, dividing the UK
into regions and devolved administrations
is a good starting point. In practical and
functional terms, other classifications may
be more useful, and there is an active
debate on how best to organise and plan
the “UK space”. This applies to the
questions highlighted by the Ecological
Budget UK project – resource flows,
supply chains, total environmental impacts –
and their policy implications for economic
and urban development.
For instance, there is a debate on city-
regions, or conurbations plus hinterlands,
as more natural functional units. The Core
Cities group argued for the case of the eight
largest provincial centres as the gateways
and generators of activity for most of
England.4 Other definitions include the
“travel to work” areas, based on 75 per
cent self-containment of labour markets,
or “functional urban regions”5. On a larger
scale there are experiments with inter-
regional schemes such as the Northern
Way and Midlands Way, and the national
Sustainable Communities plan.
The “bio-region” concept applies clearly
to more remote territories, where there is
often a direct fit between river catchments,
natural resources and landscape types.
In the more urbanised parts of England,
bio-regions are often obscured and may
differ from social or economic units.
However, with new agendas for rural
enterprise and landscape management,
such as community forests and local
food markets, the bio-regions may
emerge once more.
The Ecological Budget UK data provides
a platform for further research on each of
these units, using the detailed breakdowns
of local authorities, supply chains and
social group consumption choices. For
the moment we focus on the regions and
devolved administrations as the main units.
In the past 10 years, the UK government has devolved increasing power to the Englishregions, Wales, Scotland and Northern Ireland. As a result, they have more responsibility for delivering the growing sustainability agenda. However, this is difficult without a region-specific, standardised measure of both local and global environmental impacts and limits. This chapter provides an overview and comparison between different parts of the UK, and sets the direction for a more detailed review in chapter 5.
1 Sustainability North West (SNW), 2004, Regional
Governance and Sustainable Development, Manchester,
SNW. Available at www.snw.org.uk (as of June 2005).
2 SDC (Sustainable Development Commission), 2005,
The next steps: An independent review of sustainable
development in the English regions, London, SDC.
3 Ravetz, J., 2000, City-Region 2020: integrated planning
for a sustainable environment, (with foreword by the
UK Secretary of State for the Environment), London,
Earthscan, in association with the TCPA.
4 Office of the Deputy Prime Minister, 2003, The Strategic
Environmental Assessment Directive: Guidance for
Planning Authorities on applying European Directive
2001/42/EC, London, ODPM.
5 ERN (English Regions Network), with RDA Planning Leads
Group, Office of the Deputy Prime Minister, Department
for Transport, 2005, Regional Futures: England’s Regions
in 2030: Final Report.

Fig 1 Regional types and material balances Fig 2 Regional CO2 emissions from consumption and production
Dependency/expropriation
De-materialised consumption
Material intensiveconsumption
Materialintensive
production
De-materialisedproduction
Industrialaffluence
Service sector affluence
Post industrialsustainability
UK avera
ge
Production emissions
Consumption emissions
East o
f Eng
land
East M
idlan
ds
Lond
on
North
East
North
Wes
t
South
East
South
Wes
t
Wes
t Midl
ands
Yorks
hire &
Humbe
rdsid
e
Northe
rn Ire
land
Scotla
ndW
ales
0
6
8
10
12
14
16
CO
2 (t/
cap)
4
2
17
The regional balance of production
and consumption
Regional economies vary as to their material
intensity in production or consumption. For
instance, Greater London is a high-volume
material consumer but its economic activity
is in the service sector, far along the supply
chain from the material-intensive manu-
facturing of other more industrial regions.
In terms of material intensity, there
are four general types of production/
consumption balance, as shown in Figure 1:
1. a conventional model of industrialised
affluence is seen where both production
and consumption are material-intensive;
2. if production is material-intensive but
consumption is not, this may show the
dominance of extractive industries such
as mining or intensive agriculture, which
are often associated with poverty
or dependency;
3. if consumption is more intensive than
production, this may show a service
sector economy which sucks in resources
from elsewhere, and thereby exports
its environmental impacts; and
4. low material-intensity for both production
and consumption – as shown in the top
right corner of the diagram – represents
a post-industrial model of sustainability –
the goal of the Sustainable Consumption
and Production concept.
The interaction of production and
consumption takes place through many
long and complex supply chains in a
modern economy. The Ecological Budget
UK data can identify these effects which
are otherwise hidden from view. The service
sector may induce higher material flows
than manufacturing activity – for instance,
financial services demand resources
from a long supply chain that includes
manufacturing of goods such as paper
and electronics, and extraction
of resources to make those products.
4R
EG
ION
AL
OV
ER
VIE
W
CO2 emissions:consumer andproducer regionsIn general, the South of England
consumes more and produces fewer
CO2-emitting resources, and the North
consumes less and produces more.
London, for instance, has the lowest
CO2 emissions from production, but
is among the highest in emissions
from consumption.
Net consumer regions:
London, South East, South West,
West Midlands. Also Northern Ireland
and the East of England.
Net producer regions & countries:
North East, Wales, Yorkshire and
Humberside. Also Scotland, the East
Midlands and the North West.
The picture of the UK’s material supply
chains shows clearly a North-South divide,
where the northern regions tend to produce
more and consume less, while the southern
regions consume more and produce less –
as can be seen in the CO2 results for the
regions (Figure 2).
This shows a pattern of burden shifting
at different scales: between regions,
within regions, between wealthy and poor
communities, between the regions and
devolved administrations of the UK, and
between the UK and the rest of the world.
There is further evidence shown by the
comparison of the three main measures
of the Ecological Budget UK – Ecological
Footprint, CO2 emissions and material flow
analysis, here defined as Regional Material
Consumption (RMC) after subtracting
exports (Figure 3).
This shows how wealthy regions such
as the South East may have the highest
Ecological Footprint but lower material
consumption than others. London is
obviously the most dominated by service
activity, but appears to draw in material at
quite a healthy level. In contrast, the North
East has a low Ecological Footprint and
CO2, but a higher than average material
consumption.
Fig 3 Regional Ecological Footprint, CO2 emisssions and material consumption
North
East
Ecological Footprint (gha/cap)
CO2 emissions from consumption (t/cap)
North
Wes
t
Yorks
hire &
Humbe
rside
East M
idlan
ds
Wes
t Midl
ands
East E
nglan
d
Lond
on
South
East
South
Wes
t
Wale
s
Scotla
nd
Northe
rn Ire
land
12.0
18.0
16.0
14.0
0
10.0
8.0
6.0
4.0
2.0
Regional Material Consumption (t/cap)

18
The mega-city region
This central powerhouse of the UK
economy includes Greater London, the
South East and part of the East of England:
some definitions would include parts of the
South West, East and West Midlands, with
a population approaching 20 million people,
or a third of the UK. The economy is
generally more service- and knowledge-
based, with the London financial sector at
its centre. The population is more affluent,
although this is partly negated by the higher
cost of living.
Many urban households are in flats
(generally more efficient); further away from
the centre, houses are on average larger
(generally less efficient). In London itself,
household travel distances are less and
there is a higher than average proportion
of public transport use. This mega city
region also hosts three international airports
that serve most of the UK’s travel demand
and are hubs for overseas travellers.
There are more extended supply chains
coming through to the service sector, and
more globalised markets for production
and consumption. Much of the physical
landscape is protected, where productive
uses are giving way to leisure and amenity.
Industrial or post-industrial regions
This regional type is more centred on
manufacturing, processing and distribution,
although local and public services still form
the majority of employment. In large, mixed
conurbations, housing is often smaller and
in poorer condition, with lower distances
travelled. In peri-urban and rural areas,
travel distances are higher and there is
new affluence overlaid on historic poverty.
Although there are generally higher
proportions of dependants, material
consumption continues to grow, and retail
and leisure services continue to drive
economic growth. This regional type is found
in parts of Wales, Scotland, East of England
and West Midlands, North East and North
West, and Yorkshire and Humberside.
Rural/peripheral regions
The more rural and remote territories are
scattered around the west and north of
the UK. While there is more farming and
forestry, land-based activity is shifting to
tourism as the main employer. There are
local production sectors such as forestry
and mineral extraction, but even these
are small parts of the rural economy.
4R
EG
ION
AL
OV
ER
VIE
W
Settlements are more in market town and
village patterns, and the more extended
travel distances rely on private transport.
There are problems with second home
ownership and housing poverty traps,
so more of the local housing tends to
be unimproved and inefficient.
Devolved administrations
Northern Ireland, Scotland and Wales each
show a mixture of regional economic and
physical types, from large urban areas
to remote countryside. In both urban and
rural areas there are pockets of poverty
and historic wealth. There are also
new forms of wealth creation via creative
and information and communication
technology (ICT) industries. Tourism is one
of the main growth areas, while agriculture
sheds labour and acquires capital. Energy
production varies – Scotland has much
hydropower, while Northern Ireland still
relies on coal for housing and industry.
Travel distances are relatively lower, partly
due to many local economies that are
more self-contained.
The Republic of Ireland should naturally
be included in any wider picture of the UK,
the more meaningful functional unit being
the British Isles. But Ireland, in contrast
with the UK, is a special case: it has a newly
industrialising economy, a lower population
density, and a more remote agrarian-based
society. Irish data could be included in future
versions of the Ecological Budget UK.
A further view on these regional types
can be seen by comparing the conventional
measure of wealth in Gross Value Added
(GVA), with Ecological Footprint as the
aggregate measure of consumption
impact (Figure 4).
This shows very clearly the divided UK
in terms of wealth and poverty. London,
the East of England and the South East
are one end of the scale, and the North
East, Wales and Northern Ireland at the
other. The GVA figures appear to have some
parallel to the Ecological Footprint figures –
in other words, the wealthy consume more
with greater Footprint than the poor. What
is topical here is the ratio of “Ecological
Footprint per GVA”, which shows how much
impact is caused for each unit of economic
activity. On this measure, London and the
South East are the most efficient, while the
North East and Northern Ireland are the least.
2. Linking regionalconsumption andproduction to policy
There is a growing aspiration towards the
ideals of the One Planet Economy, but a
huge gap between the reality of regional
development policy. Most of the regional
strategy documents now quote
“sustainability” on every page, but on closer
inspection, the main agenda still revolves
around “growth.”6 For the UK’s Regional
Economic Strategies (RES) this often
means economic growth per se, tempered
with some social inclusion, while for the
Regional Spatial Strategies (RSS) it means
enabling, managing and coping with the
effects of “growth.”
From the viewpoint of the Ecological
Budget UK project, it is not the quantity
but the quality of such growth that is most
important – what kind of growth, for whom
and at what cost. These questions are
Fig 4 Regional Footprint/economy intensity
North
East
GVA (£1000/cap)
Ecological Footprint (gha/cap)
North
Wes
t
Yorks
hire &
Humbe
rside
East M
idlan
ds
Wes
t Midl
ands
East E
nglan
d
Lond
on
South
East
South
Wes
t
Wale
s
Scotla
nd
Northe
rn Ire
land
5.0
15.0
20.0
25.0
0
10.0
Ecological Footprint per unit GVA

19
explored in depth in the parallel report
Strategy for a One Planet Economy. Here
we present a very simplistic sustainable
development growth agenda for the
UK and its regions, with three measures:
> environmental impacts from resource
use – rapid reduction, measurable with
the Ecological Footprint at a net rate
of 3 per cent per year;
> economic growth, as measured by
monetary activity – a rate which appears
to be self-sustaining for the UK within
the global economy, currently about
2.25 per cent long term (including
variations between regions); and
> social welfare (quality of life, equity
and inclusion) – high growth, although
recognising this can be difficult to
measure.
This development triangle questions many
of the basic assumptions about regional
development, and helps clarify the basic
policy options:
> production: further growth in high-impact
industries and distribution systems,
or more resource efficient industries,
compatible with a One Planet Economy;
> consumption: assumption of high growth
in material consumption, or a sustainable
consumption agenda. This underlies the
success or failure of many regional
policies: urban renaissance, public
transport, local food markets and social
inclusion, for example;
> housing: further growth in conventional
construction and household energy use,
or more sustainable building patterns;
> transport: further growth in traffic and
road construction, or lower impact modes
of transport, with better integration
between supply and demand; and
> energy, water, waste, etc.: more power
stations, dams and landfills, or alternative
ways of managing demand with less cost
and environmental impact.
These and many more policy options
are long and complex issues. However,
the aims of growth and development are
basic principles that need to be debated,
analysed and then put into regional targets.
4R
EG
ION
AL
OV
ER
VIE
W
Many policy-makers have done so.
For instance, the South East England
Regional Assembly has declared its aim
to “stabilise the growth in the South East
ecological footprint by 2016”7. This shows
a new kind of thinking about the power
and responsibility of regional and
devolved government.
3. Regional economicdevelopment – The RES
Regional economic issues
The RES are produced by the UK’s Regional
Development Agencies and by devolved
administrations as a comprehensive action
plan that garners both EU and national
funding. Each RES is benchmarked against
a series of “floor” targets set by the
Department of Trade and Industry, and a
parallel target for sustainable development
has been the subject of debate. Most
regions aspire to perform equal to or better
than the national average, although this
is logically impossible. In reality, the UK
economy continues to feature long-running
tensions and conflicts which play out on
the level of regional development policy:8
> the large differential in productivity
(GVA/employed person) between the
South and the North and Midlands
shows no signs of reducing;
> there are signs that the major cities
are beginning to lead GVA growth now
that office-based service activities are
increasingly important;
> manufacturing employment will continue
to fall as a result of static output and
productivity improvements, with the
largest direct impacts on the Midlands
and parts of the North;
> the highest formation rate for high
technology companies is in the South,
along with the UK’s main concentration
of research and development activity; and
> hidden unemployment (including long-
term sickness, training and other
government schemes) is higher in the
North than in the stronger economies
surrounding London.
Regional economic options
Valuing the quality of growth more than
the quantity raises many questions about
alternative development paths and policy
options. Is an RES focused on economic
growth alone, or more on growth in quality
of life and reduced environmental impacts?
Is the shift towards services dependent on
increasing imports of material goods from
overseas, which increases environmental
impacts? How can a low-impact, high-
quality plan for the future be compared
to the alternatives and implemented?
The RES theme of resource productivity
is central to this, and can be defined in
various ways – output per investment,
per employee, or per tonne of waste or
emissions. Energy efficiency and CO2
emissions rates will improve through a
combination of regulatory power, financial
investment, market development and
technology innovation. It is fair to say that
Regional Development Agencies have only
indirect leverage on most of these factors.
An overall agenda for consumption is
hardly mentioned in the average RES, it
being taken for granted that rising affluence
contributes to a healthy retail sector.
The typical RES contains a mixture of
supply-side and demand-side actions,
each of which has some scope for influence
on a region’s material flows and Ecological
Footprint:
> promoting business clusters: these
have the opportunity for environmental
technology innovation, low-impact
infrastructures such as waste or sewage
treatment, employers’ green travel
planning, and other features of an
“eco-industrial park”;
> enhancing competitiveness and
productivity: this involves energy and
material efficiency in industry. It may also
extend towards a market transformation
of both supply and demand sides –
meeting consumer needs in new ways;
> mobilising the knowledge base: this
reflects the shift towards knowledge-
based innovation, high technology and
use of advanced ICT – each of which can
be a catalyst in new low-impact patterns
of production and consumption;
> economic inclusion and mobilising the
labour market: this works at the human
scale of training and career support,
incentives for graduates, entrepreneurs
and intermediate labour markets (the
latter is particularly relevant where it
revitalises the social economy, increasing
social welfare while reducing material
impacts);
> sites and premises: this traditional core
of economic development is still hugely
relevant to land use, construction rates,
transport demand and other services;6 See footnote 2
7 SEERA (South East England Regional Assembly), 2005,
“Stabilising the ecological footprint in the South East Plan:
A report to SEERA by the Centre for Urban & Regional
Ecology”. Available at www.southeast-ra.gov.uk/
southeastplan/publications/research/
se_footprint_summary_report_july05.pdf (as of June 2005).
8 See footnote 5

20
> urban and rural renaissance: these
agendas contain the economic and
employment sides of the spatial
strategies. In each, there is an urge for
policy integration, so that economy,
housing, transport and services all
reinforce each other; and
> image and environment: in many RES
the environmental agenda might be seen
as a surface level add-on, although it can
be argued that image and quality of life
factors are totally essential in a globalising
economy. An important question raised
by resource accounting is to what degree
local environmental improvements are
achieved by displacing the impacts
elsewhere – for instance if a local steel
mill closes, and the same amount of steel
is then imported from overseas.
Looking around the various RES
documents, their attempt to acheive
sustainability through these measures often
lacks the ambition or clout needed to meet
the challenge of a One Planet Economy.
With that in mind, a further set of more
strategic measures is proposed in chapter
7 of this report
4R
EG
ION
AL
OV
ER
VIE
W
4. Regional physicaldevelopment – The RSS
Regional and national spatial issues
Across each of the regions and devolved
administrations there are tensions and
conflicts about managing growth and
mitigating decline. The current lack of a
national spatial framework is a hindrance –
for instance, any attempt to plan in the
crucial zone between Bedford and Bristol
would involve five different RSS with totally
uncoordinated maps and policies. Yet the
global impact of the UK space largely
depends on the ability to cope with these
regional and national spatial issues.9 In the
UK as a whole, there are several issues and
trends of particular importance to future
spatial planning:
> Climate change, flooding and water
supply – all influenced by current
development in the UK – have inter-
regional significance. These issues
are of greatest relevance in the South,
and parts of the East Midlands.
> Changing working practices are leading
to increasing demand for travel, with a
trend for commuting less often but over
greater distances. These pressures are
evident in most regions but particularly
the South, significantly affecting railways
as well as the road network. There is
increasing demand for international travel,
which future airport expansion seeks to
accommodate. International connections,
including surface access to airports,
can be a stimulus for city and
regional economies.
> The centres of major cities are active
areas of growth. An example is the
economic success of central London
and its wider “mega-city region,”
which contains some 18.6 million people.
> Some city regions in the Midlands,
the North and South West are also
experiencing increasing economic growth.
At the same time, there are significant
variations within these city regions.
The resurgence of core city centres and
some outlying towns is in stark contrast
with some inner urban areas and former
industrial towns which experience severe
deprivation and population decline.
There are areas of deprivation in the
South, particularly in inner London
and the costal towns.
RSS issues
The RSS are being produced by the
Regional Assemblies and their devolved
administration counterparts as a more
comprehensive and responsive strategic
tool in the spirit of sustainable development.
They are also subject to lengthy processes
of consultation and sustainability appraisal.10
As the main framework for the physical
functioning of the region, they have a
bearing on its material flows and Ecological
Footprint. However, their scope is limited by
policy pressures and industry norms, and
often RSS debate is about the levels and
locations of growth, rather than the quality
and purpose of growth. These are the key
issues that many RSS address:
> housing planning options: the location of
housing influences transport demand and
accessibility to employment and services;
> transport supply options: regional policy
options include development of new
infrastructure such as trams or new
motorways, or constraint measures
such as parking charges or road pricing
schemes. The EU and the UK
government are calling for increased
vehicle efficiency, fuel quality and
emissions controls;
Fig 5 Regional mass balance summary (t/cap)
North
East
Regional productionImports from rest of the world
North
Wes
t
Yorks
hire &
Humbe
rside
East M
idlan
ds
Wes
t midl
ands
East E
nglan
d
Lond
on
South
East
South
Wes
t
Wale
s
Scotla
nd
Northe
rn Ire
land
-20.0
10.0
20.0
30.0
40.0
0
-10.0
Household demand
Exports to rest of the world
Total waste (MSW/C&I/C&D)

21
> housing construction options: this is
an economic sector with potential for
increased efficiency in energy and waste.
Household demand dictates how much
energy must be produced, how much
water supplied, and which utilities must
be provided;
> energy supply options: this is a topical
national debate with growing implications
at the local and regional level, as fossil
fuels begin to look increasingly expensive
and unreliable. Many forms of renewable
energy, particularly biofuel and tidal
schemes, have impacts on land-use and
landscape, while the nuclear alternative
has many risks and liabilities;
> waste management options: this is
the other end of the pipe to the regional
material consumption shown above.
The pattern of waste arisings and waste
transfers around the regions is crucial to
understanding their material metabolism.
Ecological Budget UK accounts show by
each sector the overall balance of material
inputs, imports, exports, stocks and waste
streams (Figure 5).
This evidence can be applied in various
ways: the first conclusion is that at a
conservative estimate, British industry is
putting up to 8 per cent of its gross profit
into landfill. At the regional level we can see
that some of the poorer regions have waste
arisings and waste disposal shortfalls way
in excess of other more wealthy regions.
This will become more crucial as landfill
taxes and transport costs rise, as the local
waste trading system gets under way, and
as new opportunities emerge in waste
recovery for environmental technologies.
4R
EG
ION
AL
OV
ER
VIE
W
Taking sustainableproduction andconsumption forward in the regions
In conclusion, this discussion comes back
to the question of “what is a successful
region?” – in other words, “what is a
sustainable region?” The regional footprint
indicator is perhaps the nearest to a single
measure of sustainability when set against
the long-term targets of the parallel report
Strategy for a One Planet Economy.
The evidence of Ecological Budget UK
can also be linked to the wider view on
sustainable develpment, as shown by the
Regional Quality of Life headline indicators.12
The latest version of these did not include
Ecological Footprint and material flow
analysis (MFA), as reliable data did not exist
at that time. However, no fewer than half the
indicators can be seen to be directly related
to Ecological Footprint and MFA in some
way (economic output, housing conditions,
climate change, air quality, traffic volume,
river quality, land use, household waste,
total waste). Future versions of the regional
indicators should be refined to show more
insight into the underlying patterns and
causes of these trends.
Meanwhile, promoting Sustainable
Consumption and Production (SCP) is now
one of five strategic priorities for Defra, and
a major theme in Securing the Future, the
UK government’s Sustainable Development
Strategy. Defra also published a set of
indicators for assessing progress towards
SCP in 2005. The regions are being
increasingly called on by central government
to provide strategic added value to the SCP
agenda, which is now funded through the
Business Resource Efficiency and Waste
(BREW) programme.
9 Wong, C., Ravetz, J. & Turner, J., 2000, The UK Spatial
Planning Framework: a discussion document, London,
Royal Town Planning Institute.
10 See footnote 4
11 Cambridge Econometrics & AEA Technology, 2004,
Benefits of Greener Business, report to the Environment
Agency, available at www.reward-uk.org
12 Defra with ONS, 2003, Regional quality of life counts –
2003, available at www.sustainable-development.gov.uk/
documents/publications/rqolc2003.pdf (as of Jan 2006).
13 Materials available at www.scpnet.org.uk
Regions have already taken the initiative
in many areas such as renewable energy,
sustainable construction and waste
recovery. They are also beginning to develop
their strategic capacity for evidence-
based policy, working through regional
observatories, university partnerships and
industrial collaborations.
The recently formed SCPNet (Sustainable
Production and Consumption Network) will
develop and support the use of tools, data
and analysis to influence regional decision-
making in a positive, practical and effective
way.13 Ecological Budget UK provides an
ideal evidence base and opportunity to take
work in this area forward in the regions and
devolved administrations, by building on
existing networks and projects. It will help
to answer topical regional questions such as:
> What level of CO2 emissions are likely
in 2020 with current trends in economic
activity and transport growth?
> Which policy measures could reduce
commercial and industrial waste impacts
by 20 per cent by 2020, given alternative
trends in business formation?
> What is the effectiveness of different
strategies and technology options in
promoting regional resource efficiency,
and how do we measure it?
These and other issues are explored in
the next chapter on regional and devolved
administration issues, and the following
chapter on the analysis of SCP.

SupplyMaterial supplied to
the region’s economyfor consumption
or production
DemandMaterial demanded by the region,other UK regions or the world for consumption or production
Regional production
84.6 million tonnes
Regional consumption
77.3 million tonnes
Imports from the rest of the world
21.6 million tonnes
RMI
133.4 million tonnes
Regional material inputs and consumption
RMI/cap
24.7 tonnes
RMC
47.6 million tonnes
RMC/cap
8.8 tonnes
Imports fromother UK regions
56.8 million tonnes
Exports toother UK regions
74.3 million tonnes
Exports tothe rest of the world
11.4 million tonnes
Fig 1 Material flows of the East of England
Households 41.8
Capital investment 13.9
Residual material flows* 21.6
*including transformation stock changes and waste
22
AnalysisMaterial flow
Reflecting its role as a shipping and
transportation hub, the East of England has
very high material flows both into and out
of the region. It exports 75m tonnes of
materials and goods to the rest of the UK;
more than any other region except the East
Midlands. A considerable proportion of
exports are agricultural and food products,
totalling over 20m tonnes, and paper
products, totalling 16m tonnes.
The East of England’s imports even more
than it exports. It relies more heavily on
the rest of the world to provide all its goods
and services than the rest of the world
relies on it. The East of England’s Regional
Material Consumption (RMC) is also higher
than average. Even more so than the South
East, high transport demands dominate
the Ecological Budget UK results for the
East of England.
5E
AS
T O
F E
NG
LA
ND East of England
Transportation
The issue of aviation is of critical importance
to the East of England. Given the region’s
airports and its overall affluence, it is not
surprising that its per capita Ecological
Footprint for aviation is over 15 per cent
higher than the national average. Variation
within the region is even more extreme.
In 2001, residents from St. Albans – one
of the wealthiest areas with easy access
to Stanstead, Luton and Heathrow within
Hertfordshire – travelled 235 per cent
further by plane than other residents from
the local authority with the lowest rate
of air travel.
The predominance of semi-rural and,
in parts, wealthy communities in the East
of England have resulted in the highest
CO2 emissions from transport of any region;
13 per cent higher than the national per
capita average. The impact of commuting
is noticeable, and is intensified by low car
occupancy for commuting in some areas
(1.1 persons per car in East Hertfordshire).
This combination of high car ownership,
low car occupancy, and high distance
travelled leads to an Ecological Footprint
for transport that is nearly 40 per cent
higher than the UK average.
Energy
The East of England’s lower than average
household energy consumption somewhat
makes up for its high transport Footprint,
and brings its total Footprint closer
to average. While the East of England’s
consumption of electricity is similar to
the UK average, its consumption of gas –
mainly used to provide heat – is about
15 per cent lower. The East of England’s
residents buy less electrical and audio-visual
equipment, but have a higher Footprint from
private education and weekend breaks
within the UK. Overall, the region’s
consumption pattern and inflated Footprint
reflect a society that is more affluent than
the UK average and one that also travels
long distances for work and leisure.
Services 0.47
Fixed capital 0.76
Consumables 0.61
Home & energy 1.05
Government & other 0.40
Travel 1.17
Fig 3 The East of England’s Ecological Footprint (gha/cap)
Food 1.17
Total
5.64 gha/cap
Fig 2 Regional Ecological Footprints (gha/cap)
Wales 5.20 South West 5.24Yorkshire & Humberside 5.30 North East 5.31 West Midlands 5.36 Scotland 5.37 North West 5.45 East Midlands 5.47 London 5.58 East of England 5.64 Northern Ireland 5.65 South East 6.29 UK Average 5.36
Material flow analysis
Ecological Footprint

23
5E
AS
T O
F E
NG
LA
ND
Sustainable development
in the East of England
> The East of England has many distinctive
regional cities, large towns, and a
significant rural landscape, and is home
to around a fifth of England’s market
towns.
> With a growing population of 5.4 million,
the region has one of the strongest and
fastest growing economies in the UK,
and is home to extensive Research and
Development activity.
> The East contains many of the UK’s
most important international gateways
and transport corridors.
> The Regional Economic Strategy (RES)
aims to build on these existing strengths
and also maintain its natural
resources as a base for food, farming,
and renewable energy. It also seeks
to improve workforce skills, business
enterprise and productivity, and counter-
act deprivation and social exclusion.
> The region’s high level of growth
has created increasing pressures
on housing, transport, and other
infrastructure and services, while
per capita levels of public expenditure
are the lowest in the country.
Future implications
Though the sustainable consumption and
production agenda itself is not directly
visible in the RES, it does address
renewable energy, rural diversification, and
the controversial question of the rate of
new housebuilding. Major new public
transport is not likely in the foreseeable
future, but the continued growth of the
Cambridge – Stansted corridor, the
northern Thames Gateway, and other
growth areas may bring opportunities for
more integrated sustainable development.
Under the current status quo, the increase
in demand for personal transport will be
met mostly by private vehicles.
Overview
CO2 emissions
Food & drink
Home & energy
Travel
Government & fixed capital
Tobacco 0.01Household tools, utensils& maintenance 0.10Newspapers, books & stationery 0.07Medical & personal products 0.12Furniture& furnishings 0.13Textiles & footwear 0.18Personal effects nec 0.23Audio visual & photo equipment 0.14Household appliances 0.20
Recreational items & equipment 0.25
Consumables
Hospital services 0.04Social protection 0.10Other services nec 0.06Education 0.06Accommodation 0.08Telephone & fax 0.07Water supply 0.08
Insurance & finance 0.25
Recreation & culture 0.09
UK residentholidays abroad 0.21
Services
Catering services 0.41
Non-alcoholic beverages 0.04Alcoholic beverages 0.07
Food 0.36
Fig 4 CO2 emissions from consumption in the East of England (t/cap)
Total0.88 t/capUK Av. 0.87 t/cap
Total2.81 t/capUK Av. 3.10 t/cap
Total3.03 t/capUK Av. 3.03 t/cap
Total2.77 t/capUK Av. 2.44 t/cap
Total1.43 t/capUK Av. 1.46 t/cap
Total1.05 t/capUK Av. 0.90 t/cap
Transport services 0.73
Purchase of vehicles 0.44
Operation of personal transport 0.35
Private transport(car fuel) 1.25
Maintenance & repair 0.12
Gas 1.31
Actual rentals for housing 0.05
Electricity 1.21
Imputed rentals for housing 0.12
Emissionsfrom consumption
11.97 t/capUK Av. 11.81 t/cap
Territorial emissionsfrom production
10.50 t/capUK Av. 10.76 t/cap
Fixed capital 1.87
Government& other 1.16
“Reflecting its role as a shippingand transportationhub, the East ofEngland has veryhigh material flowsboth into and out of the region.”

24
The region is currently developing a new
Regional Spatial Strategy (RSS) which will
help plan through to the year 2021 for
issues such as economic growth, housing,
transport, waste management, and mineral
extraction. The final RSS will be published
later in 2006. To demonstrate how
Ecological Budget UK data can be applied,
we have selected some of the draft RSS
targets related to waste and transport, listed
the various scenarios they have projected
for meeting those targets, and assessed
how these different scenarios would impact
the East of England’s Ecological Footprint.
WasteThe draft East of England RSS1 sets out
a strategy to reduce the total amount
of material that ends up as waste.
Researchers affiliated with the Ecological
Budget UK project undertook an extensive
Ecological Footprint analysis of the different
possible future waste scenarios for the
County of Hertfordshire. Hertfordshire
represents nearly 10 per cent of the East
of England’s population, making it a good
statistical sample size for the region as a
whole. However it should be noted that
Hertfordshire is not a representative social
or economic template for the whole of the
region, as this would mask key regional
variations. This Hertfordshire analysis
demonstrates the importance of a waste
minimisation target. Recycling without
overall waste minimisation is not highly
effective. As it is, Hertfordshire’s waste
programme (scenario 4) has both a waste
minimisation programme (which the RSS
currently does not have) and more stringent
recycling requirements than the RSS.
5E
AS
T O
F E
NG
LA
ND Spotlight
Scenarios for waste and transport in the East
Scenario 1 – RSS targets for recycling + no waste minimisation
Continuing to meet existing RSS waste targets will bring a 5 per cent
increase in the Ecological Footprint from 2001 to 2023.
Scenario 2 – RSS targets for recycling + Hertfordshire Waste
Minimisation Plan
This scenario will decrease the Ecological Footprint by 10 per cent.
Scenario 3 – Hertfordshire Recycling Targets + no waste
minimisation strategy
If Hertfordshire recycles 50 per cent of its waste and its discarded waste
grows by 2.5 per cent (a decrease of the RSS targeted waste growth of
3 per cent) each year after 2012, the Ecological Footprint will decrease
by 20 per cent.
Scenario 4 – Hertfordshire Recycling Targets + Hertfordshire
Waste Minimisation Plan
This scenario will bring about a 25 per cent reduction in the Ecological
Footprint by 2021 but a 5 per cent increase from 2021 to 2023.
Scenario 5 – Hertfordshire Waste Minimisation Plan + Potential
Best-Practice Recycling Targets (72 per cent of waste by
2023).
If Hertfordshire uses our best practises recycling model in their plan, they
will recycle 72 per cent of their waste by 2023, and the Ecological Footprint
will be reduced by 35 per cent.
The results – the Ecological Footprint of five different waste scenarios in Hertfordshire
The existing Waste
Strategy (Scenario 4)
will bring a 5 per cent
increase in the
Ecological Footprint
from 2021 to 2023. 400,000
200,000
02001 2007 2013 2019 2025
600,000
800,000
1,000,000
1,200,000
Fig 5 Ecological Footprint waste scenario results
EF
(gha
)
1
2
3
4
5
Scenarios

Results: The projected
Ecological Footprint of transport
in Hertfordshire, under
current policies.
Listed below are all the components that
comprise Hertfordshire’s total transport
Footprint. Some components reduce the
Footprint or have little effect on it; others
increase it dramatically. This is why the
total transport Footprint continues to rise
in the graph (left), a 17 per cent increase
from 2005 to 2020.
1 If the number of occupants per car
is reduced from 1.56 to 1.50, this will
bring about a 1.2 per cent increase in
the Ecological Footprint between 2005
and 2020.
2 An increase in the total distance
travelled by cars will bring about a
21 per cent increase in the Ecological
Footprint from 2005 levels by 2020.
3 Increased efficiency in cars and buses
will reduce the Ecological Footprint
of transport by 6 per cent from
2005 levels.
4 Increased use of buses and trains will
bring about a 0.2 per cent increase
in the Ecological Footprint from
2005 levels to 2020.
5 An increase in the purchasing
of (predominantly second) cars
per household will contribute to
a 3 per cent increase in the Ecological
Footprint from 2005 levels to 2020.
6 An increase in the use of taxis will
bring about a 0.3 per cent increase
in the Ecological Footprint from
2005 levels to 2020.
400,000
200,000
02001 2007 2013 2019 2025
600,000
800,000
1,000,000
1,200,000
Fig 6 Waste scenario 5
EF
(gha
)
25
Transport
Again using Hertfordshire as a sample size
for the East as a whole, we will analyze the
impacts of current transport policies on the
Ecological Footprint. The East of England’s
draft RSS has some measures in place
that might reduce car travel. These include:
(1) target 4, to increase the proportion
of people that work locally; (2) target 34,
to increase non-car transport use; and
target 36, to stabilize car journeys into
urban areas.2 If Hertfordshire were to
introduce no additional measures on top
of those recommended in the draft RSS,
its projected Footprint from travel would
continue to increase by 1.1 per cent per
year, a 17 per cent increase over 15 years.
5E
AS
T O
F E
NG
LA
ND
1 See the East of England’s RSS Target 53 at
http://www.eera.gov.uk/category.asp?cat=120
2 See the East’s RSS at
http://www.eera.gov.uk/category.asp?cat=120
Scenario 5 provides an insight into how
recycling and waste generation relate.
Even if increased recycling achieves a
significant Ecological Footprint reduction for
a time, an increasing tonnage of total waste
will eventually outweigh that. All scenarios
demonstrate what would happen in the
long term if recycling is successful but
waste generation continues to increase:
an initial dip in Ecological Footprint, but a
long-term increase. In short, recycling must
be coupled with a waste minimisation plan
in order to reduce the Footprint over the
long term.
The projected Footprint under Scenario 5
suggests that it would be helpful to have an
even more aggressive waste minimisation
plan in Hertfordshire and the East of
England in general. For example, the region
could work towards a goal of zero waste
growth after 2012. One controversial but
proven technique to achive this is enforcing
a fee on residents and businesses based on
the weight of their waste. In terms of waste,
Hertfordshire is an instructive model for
how sustainable waste policy in the East
of England might look.
2000 2005 2010 2015 2020
1.10
1.05
1.00
0.95
0.90
0.85
0.80
0.75
0.70
0.65
0.60
Fig 7 Projected Ecological Footprint per resident given existing Hertfordshire policies
EF/
cap
The 6 per cent increase in fuel efficiency
has done very little in comparison to
the growth in the Ecological Footprint
through increased mobility (17 per cent
increase in Ecological Footprint).
ROGER SCRUTON / COLLECTIONS PICTURE L IBRARY

SupplyMaterial supplied to
the region’s economyfor consumption
or production
DemandMaterial demanded by the region,other UK regions or the world for consumption or production
Regional production
104.2 million tonnes
Regional consumption
99.9 million tonnes
Imports from the rest of the world
8.4 million tonnes
RMI
142.5 million tonnes
Regional material inputs and consumption
RMI/cap
34.1 tonnes
RMC
64.5 million tonnes
RMC/cap
15.4 tonnes
Imports fromother UK regions
65.2 million tonnes
Exports toother UK regions
73.4 million tonnes
Exports tothe rest of the world
4.5 million tonnes
Fig 1 Material flows of the East Midlands
Households 31.6
Capital investment 8.8
Residual material flows* 59.5
*including transformation stock changes and waste
26
AnalysisThe East Midlands’ Ecological Footprint and
per capita carbon dioxide emissions from
consumption are very near the UK average.
However, like the rest of the UK, there
is significant variation between the
Ecological Footprint and CO2 emissions
of different local authorities and socio-
economic groups1.
A more detailed look reveals significant
differences within the East Midlands. The
biggest local authority Footprint is 11 per
cent larger than the smallest. The difference
5E
AS
T M
IDL
AN
DS East Midlands
between socio-economic groups is more
extreme. The group with the biggest
Footprint has one that is 35 per cent larger
than the smallest. To put this in context,
the difference between the largest Footprint
UK region (the South East, at 5.86 gha/cap)
and the lowest (Yorkshire and Humberside,
at 5.00 gha/cap), is around 16 per cent.
Very distinct differences in consumption
are responsible for variations within the
East Midlands. Energy consumption in
prosperous enclaves (see Figure 5)
is 74 per cent higher than in areas of high
employment, and the high-low variation
for the Footprint of air travel between these
two groups is 62 per cent. In contrast, the
variation between the Ecological Footprint
of food is less extreme – about 20 per cent.
Wealth generally leads to a higher individual
Footprint, but this variation is due less to
essential consumer items such as food than
non-essential optional items such as air
travel and high energy use. In light of this,
it is possible to lower a population’s
Ecological Footprint without threatening
the basic quality of life.
As a general rule, Ecological Footprint
and CO2 emissions are higher from a meal
Services 0.41
Fixed capital 0.76
Consumables 0.62
Home & energy 1.20
Government & other 0.40
Travel 1.01
Fig 3 The East Midlands’ Ecological Footprint (gha/cap)
Food 1.07
Total
5.47 gha/cap
Fig 2 Regional Ecological Footprints (gha/cap)
Wales 5.20 South West 5.24Yorkshire & Humberside 5.30 North East 5.31 West Midlands 5.36 Scotland 5.37 North West 5.45 East Midlands 5.47 London 5.58 East of England 5.64 Northern Ireland 5.65 South East 6.29 UK Average 5.36
Material flow analysis
Ecological Footprint
Fig 5 Variations in Ecological Footprints in the East Midlands
Wea
lthy
subu
rbs
Home o
wning,
skille
d wor
kers
Prosp
erous
encla
ves
0
1.00
3.00
2.00
4.00
5.00
6.00
0
1.00
3.00
2.00
4.00
5.00
6.00
Area w
ith hi
gh
unem
ploym
ent
Nottin
gham
Ashfie
ld
Rushc
liffe
0
1.00
3.00
2.00
4.00
5.00
6.00
Corby
UK
EM
Ecological Footprints of socio-economics groups
35% variation
Ecological Footprints of Local Authorities
11% variation
National and regional Ecological Footprints
2% variation

Food & drink
Home & energy
Travel
Government & fixed capital
Tobacco 0.01Household tools, utensils& maintenance 0.10Newspapers, books & stationery 0.07Medical & personal products 0.12Furniture& furnishings 0.16Textiles & footwear 0.17Personal effects nec 0.14Audio visual & photo equipment 0.18Household appliances 0.19
Recreational items & equipment 0.24
Consumables
Hospital services 0.03Social protection 0.06Other services nec 0.06Education 0.06Accommodation 0.07Telephone & fax 0.06Water supply 0.07Insurance & finance 0.22Recreation & culture 0.10UK residentholidays abroad 0.17
Services
Catering services 0.34
Non-alcoholic beverages 0.04Alcoholic beverages 0.06
Food 0.35
Fig 4 CO2 emissions from consumption in the East Midlands (t/cap)
Total0.79 t/capUK Av. 0.87 t/cap
Total3.23 t/capUK Av. 3.10 t/cap
Total3.03 t/capUK Av. 3.03 t/cap
Total2.46 t/capUK Av. 2.44 t/cap
Total1.39 t/capUK Av. 1.46 t/cap
Total0.90 t/capUK Av. 0.90 t/cap
Transport services 0.62
Purchase of vehicles 0.36
Operation of personal transport 0.33
Private transport(car fuel) 1.16
Maintenance & repair 0.18
Gas 1.77
Actual rentals for housing 0.04
Electricity 1.17
Imputed rentals for housing 0.08
Emissionsfrom consumption
11.80 t/capUK Av. 11.81 t/cap
Territorial emissionsfrom production
11.35 t/capUK Av. 10.76 t/cap
Fixed capital 1.87
Government& other 1.16
27
at a restaurant than at home. Residents of
the East Midlands eat out less often than
the national average, so CO2 emissions
from eating out are 10 per cent lower than
the national average.
Material flow
The East Midlands contributes substantially
to the weight of the UK’s economy. It has
the second highest Regional Material Input
(RMI) and third highest Regional Material
Consumption (RMC), amounting to
34.1 t/cap and 15.5 t/cap respectively.
About 48 per cent of the physical flows
into the East Midlands economy (that
is, originating within the region) are from
regional material production: at 68.8m
tonnes total or 16.5 t/cap this is second
highest on a per capita basis across the UK.
A further 46 per cent or 15.62 t/cap of the
RMI indicator stem from imports from other
regions, which is the highest across the UK.
However, this is only one side of the East
Midlands’ heavy involvement in regional
trade: it is also the biggest material/physical
5E
AS
T M
IDL
AN
DS
exporter to other UK regions at 17.59 t/cap.
Overall, it therefore involves most heavily
in regional physical trade, shipping 138.7m
tonnes of materials in and out.
While this physical trade with other
UK regions is most pronounced, the East
Midlands’ material exchanges with the rest
of the world are much less developed.
Per capita, both imports and exports rank
third lowest among regions, making only
4 per cent and 2 per cent of the UK’s
imports and exports from/to other countries
respectively. However, this cannot belittle
the overall importance of trade. Summing
continued over the page
Sustainable development
in the East Midlands
> The East Midlands, between the
expanding mega-city of London and
the former industrial areas of the North,
includes traditional rural communities
but increasing intensive agriculture
and urban commuting. Its three urban
centres are Nottingham, Leicester,
and Derby.
> The East Midlands’ Regional Economic
Strategy (RES) is a good example of a
typical UK regional strategy document,
with themes including enterprise,
employment, transport, tourism and
culture, rural development, and urban
regeneration.
> The East Midlands’ Regional
Development Agency seeks to
measure economic performance
against a Top 20 Index of sustainable
development criteria, which include
Gross Domestic Product per head,
unemployment rate, differences
between highest and lowest
performing localities, and measures
of energy use and waste production.
> There is a long history of environmental
initiatives in the region. Leicester was
the UK’s first “Environment City,”
Newark and Sherwood had some
of the UK’s first low-energy housing,
and Nottingham has a sustainable
urban transport initiative.
Future implications The East
Midlands Top 20 Index format for
measuring sustainable development
succeeds in covering a variety of
sustainable development issues,
but could be expanded to more
explicitly reflect how ecological limits
and environmental impacts link to
economic growth, social welfare,
and quality of life.
Overview
CO2 emissions
1 For this example, “Socio-economic groups” are organised
by the ACORN Classification – A Classification of
Residential Neighbourhoods”. For further information visit
www.caci.co.uk.

all material exchanges with other regions
as well as the rest of the world, the East
Midlands still exhibits the highest per
capita level of trade at 36.3 t/cap.
On a net basis, the East Midlands exports
more than it imports. Taking into account all
trade flows within the UK and the rest of the
world, the East Midlands is a net material
exporter, with a physical export surplus of
4.3m tonnes. Interestingly, like some other
regions and devolved countries, this
physical weight of trade activities outweighs
the total regional material intake from
regional production and imports: in other
words, the East Midlands trades more
materials than it uses within all production
and consumption processes.
So far we have mainly expressed
the regional material flows in terms of
production – where the various material
flows occur. We can also express them
in terms of consumption and allocate the
required domestic and import flows across
various final demand activities. Household
activities in the East Midlands, for example,
are also more material-intensive than the UK
average. To provide the goods and services
consumed in the East Midlands, 7.6 t/cap
or 31.6m tonnes of materials were required
through the various lifecycle stages in the
production chain. As much as 9.7m tonnes
or 31 per cent of these were from mining
energy-producing materials, another
6.3m tonnes from agriculture, hunting
and forestry, and 5.5m tonnes from food,
beverages and tobacco.
28
In contrast to most other cities in the UK,
Nottingham is moving towards decreasing
its per capita transport Footprint. It is very
difficult to decouple growth in transport
from a higher transport Footprint and higher
CO2, but Nottingham is attempting to do
this. Its Ecological Footprint for transport
is 36 per cent lower than neighbouring
Rushcliffe, demonstrating how much a
Footprint can vary among local authorities
in the East Midlands.
To begin with, Nottingham has a compact
city centre that encourages alternatives to
car transport. In that context, the city and
county’s joint Local Transport Plan,
launched in 2001, has developed a new
transport network that integrates buses,
trams, cars, taxis, walking and cycling.
An updated five-year plan, to be launched
in April 2006, aims to continue “reducing
traffic growth and encouraging the use
of alternatives to the car”.2
Average road traffic in the East Midlands
has increased by 20 per cent over the last
10 years.3 However, over the past seven
years, overall traffic in Nottingham has
dropped by 0.4 per cent, and bus and tram
use has increased by over 8 per cent.4
5E
AS
T M
IDL
AN
DS Spotlight
A compact city centre
Nottingham’s compact city centre reduces
its transport Footprint. This compactness
is an intrinsically low-Footprint design that
many other UK towns also share. When
shops and services are close together, it is
easier to walk, cycle or take the bus than to
drive. Central Nottingham, for instance, has
an average of 0.7 vehicles per household,
compared with 1.1 vehicles for the greater
Nottingham household. Low car ownership
always contributes to a lower Ecological
Footprint and lower CO2 emissions.
Many UK cities have (or have had)
a compact, lower Footprint city centre.
As they work towards sustainability, they
have an advantage over cities that are
historically more vehicle-focused.
Nottingham city centre’s pedestrian-friendly,
car-restricted “Clear Zone”5 – a model that
many other UK towns also share – further
enhances the appeal of low-Footprint
transport options. Economically, walkable
city centres also tend to increase a
city’s commercial appeal by attracting
more people.
Low Footprint transport in Nottingham
Analysis continued
“When shops andservices are closetogether, it is easier to walk, cycle ortake the bus than to drive”
“East Midlands trades morematerials than it uses within allproduction andconsumptionprocessess”

29
5E
AS
T M
IDL
AN
DS
2 www.nottinghamcity.gov.uk/
ltp2_executive_summary_oct05.doc
3 www.sustainable-
development.gov.uk/performance/performance.htm
4 www.nottinghamcity.gov.uk/
sitemap/transport_and_streets.htm
5 www.nottinghamclearzone.com
6 Focus on Personal Travel, 2005, DfT
7 Report to the Executive directors, Nottingham
express transit, 2002,
www.netphasetwo.com/downloads/EXE2404B.pdf
8 Cairns, S., Sloman, L., Newson, C., Anable, J., Kirkbride,
A. & Goodwin, P., 2004, “Smarter Choices – Changing the
Way We Travel”. Final report of the research project: The
influence of soft factor interventions on travel demand.
Department for Transport, London, 20 July 2004.
www.dft.gov.uk. See report at
www.dft.gov.uk/stellent/groups/dft_susttravel/documents/
page/dft_susttravel_027707.pdf.
Travelling to work and
work travel plans
The way people travel to work affects the
transport Footprint. Commuting makes
up 20 per cent of Nottingham’s transport
Footprint (excluding air travel), and a quarter
of all miles driven in cars and vans are miles
driven to work.6 In Nottingham, commuter
travel is particularly important, as it is the
UK’s ninth largest “travel to work” area.7
Nottingham was a pioneer of the
“workplace travel planning” concept in the
early 1990s. A workplace travel plan is a
coordinated effort to promote alternatives
to driving to work. In Nottingham, this has
meant greatly improving bus, cycle and
walking routes as well as promoting car
share schemes, offering financial incentives
for not driving, and implementing car
park restrictions and charges.
Nottingham decided to focus its efforts
on a handful of the city’s largest employers.
Now, 25 employers and some 52,000
employees promote and use alternative
commuting plans.
Scenarios for the future
It is estimated that 28 per cent of
Nottingham’s working population is involved
in some sort of travel plan. Assuming that
the city’s travel plans have had the same
effect as the average UK travel plan (18 per
cent less car travel for people using the
plan), the transport Footprint of someone
involved in a Nottingham travel plan is
reduced by 10 per cent. Nottingham’s travel
plans still have room for improvement; the
travel plan at Orange Telecommunications
in Temple Point, Bristol8 managed to reduce
commuters’ car mileage by 66 per cent,
using a combination of initiatives such
as limited parking and parking charges.
If Nottingham City’s plan were as successful
as this, and the whole of greater
Nottingham were involved, the transport
Footprint of the average travel plan
commuter would be reduced by 38 per
cent. In which case, the total Ecological
Footprint of Nottingham would be reduced
by 33,000 hectares (gha) – an area almost
half the size of Greater Nottingham.
Soft policies andbehaviour change“Soft policies” contribute to a change
in behaviour without major infrastructure
change. Travel plans, car sharing
schemes, travel awareness campaigns
and the encouragement of teleworking
and home shopping are all “soft policies”
in which Nottingham has invested.
Although there are limits to what they
can achieve, these policies often offer
high returns for minimal investment.
For example, one study suggests
that having groceries delivered to the
home instead of driving to a shop or
supermarket reduces the Footprint
of grocery shopping by 70 per cent
per load delivered. Travel plans have
worked effectively in Nottingham and
elsewhere, and teleworking generally
reduces car use.
PH
OT
OD
ISC
LONELY PLANET

SupplyMaterial supplied to
the region’s economyfor consumption
or production
DemandMaterial demanded by the region,other UK regions or the world for consumption or production
Regional production
47.5 million tonnes
Regional consumption
105.7 million tonnes
Imports from the rest of the world
61.7 million tonnes
RMI
145.3 million tonnes
Regional material inputs and consumption
RMI/cap
20.0 tonnes
RMC
89.7 million tonnes
RMC/cap
12.0 tonnes
Imports fromother UK regions
52.0 million tonnes
Exports toother UK regions
33.0 million tonnes
Exports tothe rest of the world
22.4 million tonnes
Fig 1 Material flows of London
Households 60.3
Capital investment 23.4
Residual material flows* 23.0
*including transformation stock changes and waste
30
AnalysisMaterial flow
More than any other region, London’s
consumed resources come from outside
of the region. There is little industry (hence
its low CO2 emissions from production,
around 8 tonnes per capita), little food
production, little fibre production, little
capacity to absorb CO2, and its waste is
largely exported. Service industries are
greatly concentrated in London, particularly
financial services, which rely exclusively on
resources from other countries or regions.
There is a considerable flow of resources
through the capital: 113m total tonnes of
materials were imported and 56m tonnes
5L
ON
DO
N London
were exported in 2001. It is not surprising
that London imports more material and
goods than it exports since it is
predominately a service economy. Only
13.5m tonnes of new goods physically enter
all households in London (“direct flows”),
meaning that on average, each household
directly consumes 4.5 tonnes of materials
per year. Of the total tonnes goods
consumed, 7m tonnes of these direct
flows into all households are food.
As is always the case with material flows,
the “indirect flows” resulting from household
consumption are much higher than direct
flows into houses. This is predominantly
due to construction and maintenance
materials; they make up a smaller portion
of direct flows into houses than food does,
but require many more resources to be
produced. Primarily because of construction
materials, every tonne of material directly
consumed by Londoners produces
3.5 tonnes of “indirect flows” that never
enter the house.
Ecological Footprint
London’s Footprint follows the general
pattern of many metropolitan areas.
Its Ecological Footprint from goods and
services is high, while its transport Footprint
is relatively low. Primarily because of high
rates of eating out, London’s food Footprint
is the UK’s second highest (1.21 gha/cap,
against a UK average of 1.14 gha/cap).
Its Ecological Footprint from services is the
UK’s highest (0.39 gha/cap, as compared to
a national average of 0.31 gha/cap). On the
other hand, because it relies heavily on non-
car transport, its total transport Footprint
is 0.60 gha/cap, significantly lower than
national average of 0.68 gha/cap.
Services 0.48
Fixed capital 0.76
Consumables 0.68
Home & energy 1.21
Government & other 0.40
Travel 0.84
Fig 3 London’s Ecological Footprint (gha/cap)
Food 1.21
Total
5.58 gha/cap
Fig 2 Regional Ecological Footprints (gha/cap)
Wales 5.20 South West 5.24Yorkshire & Humberside 5.30 North East 5.31 West Midlands 5.36 Scotland 5.37 North West 5.45 East Midlands 5.47 London 5.58 East of England 5.64 Northern Ireland 5.65 South East 6.29 UK Average 5.36
Material flow analysis
Ecological Footprint

31
CO2 emissions from consumption
London is among the highest in the
UK for carbon dioxide emissions from
consumption, outpaced only by the East
of England and the South East. London’s
carbon dioxide emissions from consumption
are 15 per cent higher than the UK average,
due mainly to three activities: travelling
abroad, eating out, and “recreational and
cultural services.”
Recreational and cultural services include
the impacts associated with venues and
events for sports, cinema, theatre, music
and entertainment. Not surprisingly, London
has higher than average emissions as a
result of services provided at these facilities.
However, it is also important to remember
how “consumer responsibility” emissions
are reflected in Ecological Budget UK.
Some entertainment that takes place within
London is allocated to consumers from
elsewhere; for example, a North East
continued over the page
5L
ON
DO
N
Sustainable Development
in London
> London has a highly productive global
economy, and is also an increasingly
expensive and congested place to live
or do business (by 2016, population
is projected to grow by 800,000).
> London has high unemployment,
child poverty and concentrations
of disadvantage.
> London’s Economic Development
Strategy seeks to address these
challenges by 1) investing in people:
increasing employment, reducing
workforce disparities, and addressing
concentrated areas of disadvantage,
and by 2) investing in enterprise:
encouraging business start-ups,
improving workforce skills, and
continuing productivity and innovation
in London’s enterprises.
> Much of London’s economic strategy
depends on the physical and infra-
structure issues in the spatial strategy
(London Plan); many social inclusion
measures depend on government
schemes such as New Deal for
Communities and Sure Start, and
local environmental measures largely
depend on the 33 London Boroughs.
> The London Plan aims for ultra-efficient
new and existing buildings, though
much depends on complex
coordination of local efforts and the
level of sustainability in London’s
1,400 neighbourhood centres.
Future implications It is clear that
London will always be a net importer of
materials and a net exporter of value-
added services. Therefore, for London to
achieve its Footprint targets, it must both
address rising consumption and bring
about changes in production further
up the supply chain, encouraging
environmental and social sustainability
in corporations and public organisations.
The London Plan is an opportunity to
transform the housing and building stock
to ultra-efficient development. On the
transport front, major Footprint-reducing
steps (such as London’s city-centre
congestion charge on private automobiles)
have been taken, and will reduce
London’s transport Footprint. However,
these gains are generally overtaken by
year on year increases in air travel.
Overview
CO2 emissions
Food & drink
Home & energy
Travel
Government & fixed capital
Tobacco 0.01Household tools, utensils& maintenance 0.09Newspapers, books & stationery 0.08Medical & personal products 0.13Furniture& furnishings 0.15Textiles & footwear 0.21Personal effects nec 0.30
Audio visual & photo equipment 0.22
Household appliances 0.26
Recreational items & equipment 0.14
Consumables
Hospital services 0.07Social protection 0.09Other services nec 0.09Education 0.09Accommodation 0.09Telephone & fax 0.09
Water supply 0.09
Insurance & finance 0.22
Recreation & culture 0.10
UK residentholidays abroad 0.16
Services
Catering services 0.51
Non-alcoholic beverages 0.04Alcoholic beverages 0.06
Food 0.35
Fig 4 CO2 emissions from consumption in London (t/cap)
Total0.95 t/capUK Av. 0.87 t/cap
Total3.13 t/capUK Av. 3.10 t/cap
Total3.03 t/capUK Av. 3.03 t/cap
Total2.04 t/capUK Av. 2.44 t/cap
Total1.60 t/capUK Av. 1.46 t/cap
Total1.06 t/capUK Av. 0.90 t/cap
Transport services 0.74
Purchase of vehicles 0.28
Operation of personal transport 0.24
Private transport(car fuel) 0.78
Maintenance & repair 0.13
Gas 1.52
Actual rentals for housing 0.13
Electricity 1.06
Imputed rentals for housing 0.29
Emissionsfrom consumption
11.81 t/capUK Av. 11.81 t/cap
Territorial emissionsfrom production
8.10 t/capUK Av. 10.76 t/cap
Fixed capital 1.87
Government& other 1.16
The analysis above, compiled for the
Ecological Budget UK project, describes
the Ecological Footprint and density
of seven cities. London’s Ecological
Footprint is magnitudes lower than
some lower density cities, supporting
the carbon dioxide and Footprint results.
Fig 5 The relationship between urban density and transport footprint
Housto
n
Transport EF
Population density
Toro
nto
New Yo
rk
Beijing
Shang
hai
Lond
onTo
kyo
Tran
spor
t Eco
logi
cal F
ootp
rint (
gha/
cap)
Den
sity
(peo
ple/
ha)
0
1.50
2.00
2.50
3.00
1.00
0.50
0
30.0
40.00
50.0
60.0
20.0
10.0

resident visiting London to see an opera is
responsible for those emissions. Thus, the
numbers shown for recreational and cultural
services emissions represent emissions
resulting from Londoners at their leisure.
Transport
Personal transport Footprints and
CO2 emissions for Londoners are noticeably
lower than average. Residents of London do
not travel as far or use cars as much as the
rest of the UK. This reflects an increase in
urban density, low car use, and a continually
improving public transport system.1
London’s recent “bus renaissance”
has been almost entirely responsible for
a 12 per cent increase in total bus use
in the UK. The Footprint of buses does
not necessarily increase within increased
bus patronage. In London, while more
buses have been brought into service and
new routes established, inefficiencies in
the system have also been removed. Bus
occupancy is an excellent example that has
risen in London peak time from 28 people
per bus in 1994 to 44 people today2.
Nationally, buses are only 22 per cent full.
In London peak travel time this has
increased to nearly 100 per cent, reducing
the Ecological Footprint of travelling one
km by bus in London by 80 per cent.
32
The Ecological Footprintof services in LondonAs highlighted, the demand for services in
London is high. Earlier analyses about the
impact of services have only taken into
account the “on-site” impacts of
consumption, the direct energy used and
waste produced. This has resulted in a
previous underestimation of the true impact
of consumption. However, for a service to
function, it demands resources from nearly
all industrial sectors. Ecological Budget UK’s
analysis of London has taken into account
the direct (on-site) and indirect (off-site)
impacts. This provides a unique and
detailed insight into the service economy of
London. The Ecological Budget UK project’s
Extended Environmental Input-Output Model
re-allocates the indirect flows of energy
and materials to services in London, tracing
the demands of the service economy
on all industrial sectors. Figure 6 indicates
the variation between the indirect and
direct carbon footprint in London for
several key services.
5L
ON
DO
N Spotlight
This new analysis demonstrates
the importance of taking indirect flows
into account, particularly in the service
sector, where many effects are hidden.
For example, the legal sector’s direct
emissions only account for 9 per cent of its
total impact. For the banking and finance
sector, direct impacts only account for
5 per cent of their total, meaning that in the
past 95 per cent of the impact has been
ignored. Most of the impact from London’s
services occurs outside London, though
this has not been documented in previous
analyses. Because these indirect flows
have been ignored, the data would lead
The Ecological Footprintof services and housing
Fig 6 The indirect and direct carbon footprint of key London services
Indirect carbon Footprint
Direct carbon Footprint
Car
bon
Foot
prin
t (gh
a/£1
0 m
illion
)0
1.50
2.00
2.50
1.00
0.50
Lega
l
activ
ities
Bankin
g an
d
finan
ce
Auxilia
ry fin
anica
l
servi
ces
Compu
ter
servi
ces
“London’s recent‘bus renaissance’ has been almostentirely responsiblefor a 12 per centincrease in total bus use in the UK”
1 Stead, D., Williams, J. & Titheridge, H., 2000, “Land use,
transport and people: identifying the connections” in
Williams, K., Burton, E. & Jenks, M., Achieving Sustainable
Urban Form, London, E & F Spon.
2 http://www.tfl.gov.uk/tfl/press-centre/press-releases/press-
releases-content.asp?prID=596
3 To learn more about REAP, see www.sei.se/reap

33
5L
ON
DO
N
us to believe that a simple shift to a
“service economy” is a viable way to
achieve sustainability. Yet in simply
shifting to a service economy to achieve
sustainability locally, the ecological
impacts are simply moved elsewhere.
Supplementary PlanningGuidance and REAPThere is considerable evidence that
London actively and explicitly seeks to be
a sustainable city. The Mayor and the GLA
have correctly targeted London’s housing
as a key sustainability issue and have taken
steps to improve standards through the
London Plan and associated Supplementary
Planning Guidance.
Currently, emissions from household
energy consumption in London are
substantial, accounting for 27 per cent of
total CO2 emissions (taking into account all
indirect energy flows such as maintenance
“In shifting to aservice economy to achievesustainability locally,the ecologicalimpacts are simplymoved elsewhere”
of the energy infrastructure and energy
required in mining and drilling). The London
School of Economics (LSE) is working
with the Ecological Budget UK project
to assess potential Footprint savings that
could result from London’s Supplementary
Planning Guidance on Sustainable Design
and Construction.
The LSE will use the Resources and
Energy Analysis Program (REAP) scenario
projection software that has been developed
as part of Ecological Budget UK.3 LSE will
create housing construction scenarios for
London based on the ‘Mayor’s preferred
standards’. and use REAP to compare the
resource-use impacts of these scenarios.
The detailed component-based ecological
footprint data that is produced in REAP
can then be used as a tool for local
planners and policy makers to compare
the ecological impacts of different planning
standards and combinations of standards.
If applied more widely, this project could be
used to establish a baseline for sustainability
appraisals of local plans and enable local
authorities to empirically assess sustainable
housing policies and rate progress.
LONELY PLANET

34
AnalysisThe North East has the largest variation
between “producer responsibility” and
“consumer responsibility” carbon dioxide
emissions of any UK region or devolved
administration. Emissions from regional
production are close to 16 tonnes per
person, while emissions from consumption
are only 11 tonnes per person – a 32 per
cent difference.
The North East’s role as a big producer
gives it considerable influence over total
emissions produced in the UK. Improved
production efficiency could help offset high
consumption elsewhere, whereas less
efficient production will magnify the effects
of consumption in other regions. In contrast
to its high emissions from production, the
North East has the lowest CO2 emissions
from consumption of any UK region or
devolved administration. Together, these
echo a pattern found in other regions and
devolved countries. The North East’s
CO2 emissions are 7 per cent lower than
the UK average, and 18 per cent lower than
the South East. The analysis below gives
some insight into why this is so.
5N
OR
TH
EA
ST North East
Material flow
Because the North East has high production
and low Domestic Material Consumption,
many of its imported materials are used
in production and then re-exported. The
North East economy required 36m tonnes
of materials to function, of which a
considerable proportion was imported
from other UK regions (19m tonnes) and
a lesser amount from the rest of the world
(6m tonnes). Most of these resources
(28m tonnes) are then exported to the rest
of the world.
This is consistent with the North East’s
very low Regional Material Consumption
(RMC) (which is in turn consistent with its
low Ecological Footprint and low CO2
emissions from consumption). The North
East has the lowest per capita household
consumption in the UK at 6.5 t/cap.
The highest in the UK are the South East
(9 t/cap) and London (8.5 t/cap).
Compared with other categories, the house-
hold consumption category is quite evenly
distributed across the UK. Yet it is the
biggest driver of material production, so
even small variations in measurement have
large ripple effects on the production chain
and total resource use. The North East also
has the lowest material flows in the UK into
capital investment (1.72 t/cap), compared
with a national average of around 2.31 t/cap
and London, the region with the most at
3.13 t/cap.
Food and nutrition
Per capita CO2 emissions from food
consumption in the North East is near the
UK average. North East households
consumed 1.45m tonnes of food in 2001,
or 0.6 tonnes per household. Just less than
120,000 tonnes of this was never eaten
but disposed of in landfill, and a further
240,000 tonnes of food packaging waste
was generated. A growing proportion of
this packaging is being recycled: recent
figures suggest 23 per cent of municipal
waste is now recycled1. Food makes up
a considerable proportion of the total
Ecological Footprint (24 per cent), which
is typical.
Transport
The average North East resident travels
9,500km a year. London is the only UK
region or devolved country whose residents
SupplyMaterial supplied to
the region’s economyfor consumption
or production
DemandMaterial demanded by the region,other UK regions or the world for consumption or production
Regional production
42.9 million tonnes
Regional consumption
40.0 million tonnes
Imports from the rest of the world
5.9 million tonnes
RMI
55.2 million tonnes
Regional material inputs and consumption
RMI/cap
22.0 tonnes
RMC
27.1 million tonnes
RMC/cap
11.0 tonnes
Imports fromother UK regions
19.3 million tonnes
Exports toother UK regions
20.9 million tonnes
Exports tothe rest of the world
7.1 million tonnes
Fig 1 Material flows of the North East
Households 16.4
Capital investment 4.3
Residual material flows* 19.3
*including transformation stock changes and waste
Services 0.32
Fixed capital 0.76
Consumables 0.52
Home & energy 1.10
Government & other 0.40
Travel 0.93
Fig 3 The North East’s Ecological Footprint (gha/cap)
Food 1.28
Total
5.31 gha/cap
Fig 2 Regional Ecological Footprints (gha/cap)
Wales 5.20 South West 5.24Yorkshire & Humberside 5.30 North East 5.31 West Midlands 5.36 Scotland 5.37 North West 5.45 East Midlands 5.47 London 5.58 East of England 5.64 Northern Ireland 5.65 South East 6.29 UK Average 5.36
Material flow analysis
Ecological Footprint

35
travel less. This means that there is a lower
material requirement for mobility and lower
CO2 emissions in the North East.
In terms of car ownership, the North East
is also lower than the UK average, although
ownership is growing faster than in any
other English region. In 2001, this was
0.36 cars per person in the North East
compared with the UK average 0.43 per
person. As the average car in the UK
weighs just over a tonne, this variation
means that material consumption in the
North East is 180,000 tonnes less than
the UK average. The North East also avoids
many indirect flows associated with car
production. Research2 suggests that some
20 tonnes of materials are required for
one car – so the North East’s relatively low
car ownership creates a potential saving
of 3.6m tonnes of materials a year.
Lower CO2 emissions can be attributed
more to less travel in general than to the
use of more sustainable modes of transport
such as rail and bus. Therefore, the
challenge for both the Regional Economic
Strategy (RES) and the Regional Transport
Strategy is to ensure a low material input
for future mobility while still meeting basic
5N
OR
TH
EA
ST
Sustainable development
in the North East
> The North East economy is still
effected by the 20th century collapse
of shipbuilding and then coal mining.
Rural areas are being re-discovered
with a raft of eco-tourism activities,
though the North East still has lower
than average levels of entrepeneurship
and job skills.
> The Regional Development Agency
(RDA) strategy aims to raise business
productivity and entrepeneurship,
increase workforce skills, rely on the
training capacity of the region’s
universities, meet arising transport
needs, and realise the renaissance of
rural and urban communities.
> The regional Science and Industry
Council is working to build a stronger
research base and improve
performance, and five North East
Centres of Excellence will form a link
between university-based Research
and Development and businesses.
> The region has a history of green
initiatives; Newcastle, for instance,
is the UK’s first Carbon Neutral city,
and now has a green urban
renaissance strategy.
Future implications With its lower
population, history of green initiatives,
and strong levels of social and economic
cohesion, the North East has great
potential in terms of sustainable
consumption and production. In terms
of infrastructure, immigration and the
demand for housing is lower than
average, so market forces are less likely
to spur major upgrading of the regional
building stock and transport network
in the near future.
Overview
1 Data from Defra Waste Statistics, available from
www.defra.gov.uk/environment/statistics/
waste/kf/wrkf07.htm
2 Moll, H.C., 2002, “Changing material use in passenger cars:
a road to sustainable use of materials and energy?”
in: Proceedings of the OECD International Conference
“Towards sustainable transportation”, Hull (Quebec), Canada.
CO2 emissions
Food & drink
Home & energy
Travel
Government & fixed capital
Tobacco 0.01Household tools, utensils& maintenance 0.08Newspapers, books & stationery 0.06Medical & personal products 0.09Furniture& furnishings 0.09Textiles & footwear 0.16Personal effects nec 0.13Audio visual & photo equipment 0.13Household appliances 0.17Recreational items & equipment 0.20
Consumables
Hospital services 0.02Social protection 0.03Other services nec 0.04Education 0.04Accommodation 0.05Telephone & fax 0.06Water supply 0.06Insurance & finance 0.12Recreation & culture 0.11UK residentholidays abroad 0.17
Services
Catering services 0.57
Non-alcoholic beverages 0.04Alcoholic beverages 0.06
Food 0.35
Fig 4 CO2 emissions from consumption in the North East (t/cap)
Total1.02 t/capUK Av. 0.87 t/cap
Total2.95 t/capUK Av. 3.10 t/cap
Total3.03 t/capUK Av. 3.03 t/cap
Total2.19 t/capUK Av. 2.44 t/cap
Total1.11 t/capUK Av. 1.46 t/cap
Total0.70 t/capUK Av. 0.90 t/cap
Transport services 0.79
Purchase of vehicles 0.31
Operation of personal transport 0.24
Private transport(car fuel) 0.84
Maintenance & repair 0.10
Gas 1.53
Actual rentals for housing 0.06
Electricity 1.13
Imputed rentals for housing 0.13
Emissionsfrom consumption
11.01 t/capUK Av. 11.81 t/cap
Territorial emissionsfrom production
15.83 t/capUK Av. 10.76 t/cap
Fixed capital 1.87
Government& other 1.16
transport needs in the North East. This will
keep CO2 emissions stable in the region.
Eco-efficiency in production
Because a considerable amount of materials
are produced in the region, the North East
has a unique opportunity to address eco-
efficiency of production. Such a change
could be set comfortably within a RES,
attempting to drive economic growth at the
same time as maximum resource efficiency.
By combining valuable data from this study
and REWARD (Regional and Wales
Resource Productivity and Development
project)3, the North East agencies can work
with key local resource and energy users.
Increased efficiency in production will also
contribute to a reduction in CO2 emissions
from consumption in other UK regions and
devolved administrations. At present, they
consume nearly 20m tonnes of materials
and goods produced in the North East.
3 REWARD is a research partnership linking the Environment
Agency, the National Assembly of Wales and five Regional
Development Agencies plus a supporting group of expert
consultants. It is now expanding to all regions, including
London. www.reward-uk.org

36
The city of Sunderland aims to develop
sustainable communities. This is against
the backdrop of the UK’s new sustainable
development strategy, Securing the Future,
which has caused some debate in
government about the definition of
“sustainable communities”. Ecological
Budget UK can help benchmark what it
means for a community to be sustainable.
It also confirms that sustainable
communities cannot focus on one isolated
issue. Production, consumption and waste
all influence each other, and successful
sustainable communities require a broad,
coordinated approach to sustainability.
Delivering sustainability at a community
level is a way for people immediately and
directly to reduce their Ecological Footprint
and CO2 emissions. Because of the smaller
size of an individual community, residents
can often move forward very quickly with
their efforts, and have substantial impact
around the UK and the world.
Housing and sustainable
communities
The North East faces the challenge of
dwindling traditional industries and a
shrinking population. Economic prosperity
is also declining, and the region has a
widening poverty gap and low life
expectancy compared with other parts of
the UK. Most of the North East’s many rural
settlements and small market towns lie at
a distance from major employment centres,
lack affordable housing and have low
access to public services. In terms of
development, then, the North East’s
challenge is not to manage rapid growth,
as is the case in much of the southern UK.
5N
OR
TH
EA
ST Spotlight
Instead, it is to meet a basic standard
of living, to ensure that vital infrastructure
is maintained, and to encourage residents
to stay in the area.
Developing attractive housing is one
way to do this. As in other communities
developing housing, the North East has
an opportunity to build sustainability widely
into its infrastructure at the same time
as it seeks to provide affordable housing.
Recognising this, the multi-regional
agency The Northern Way4 addresses
housing and sustainability. Its report,
Creating Truly Sustainable Communities,
suggests several programmes related to
housing and low-Footprint design. It plans
to use Ecological Footprinting to advise
city regions on sustainable development,
and embed the development of sustainable
infrastructure into regional and local
planning strategies. It also plans to
complement increased energy efficiency
in new homes with high quality design.5
The North East’s draft Regional Spatial
Strategy is the first to be developed using
The Northern Way’s sustainability principles
mentioned above, and the Regional Housing
Strategies of all three northern regions have
been developed under guidance from
The Northern Way.
Sunderland: workingtowards a sustainablecommunity
Sunderland City Council is an example of a
local authority taking the lead on sustainable
community development. Its Sustainable
Development Strategy has been
incorporated in the Community Strategy,
which is supported by the Ecological
Footprint as an environmental indicator.
This is helping the authority achieve regional
targets, such as those highlighted by The
Northern Way, and is moving the council
towards developing Sustainable Community
Strategies, as encouraged by the Deputy
Prime Minister.
Sunderland City Council has also
launched a sustainability appraisal of its
key strategies, beginning with the Local
Development Framework. This has already
highlighted the key sustainability challenges
facing Sunderland: outward migration, an
ageing population, high levels of land-filling,
and others. The next step is to make
sustainable communities the prime focus
of Sunderland’s Local Development
Framework, helping clarify future options
for waste and energy.
Sustainable communities in the North East
“Successful sustainable communitiesrequire a broad, coordinated approach to sustainability”

37
Community participation
and Ecological Budget UK
The technique of participatory appraisal
has been widely used in Sunderland to
increase community input into development,
increase community satisfaction, and garner
community support for more sustainable
designs. Successes include community-
informed housing development on the
Lambton Cokeworks site, and a better
understanding of community needs for
the Hetton Sustainable Transport Project.
As part of the Ecological Budget UK
project, WWF-UK is working with
Sunderland City Council to develop the
Ecological Footprint more widely as a
communication tool, and to demonstrate to
community organisations how they can use
the Footprint for planning. Through a series
of community workshops, Sunderland
engaged diverse groups such as St Anne’s
RC Primary School, the Pennywell
Neighbourhood Centre, the Farringdon
Jubilee Centre, The Access Point –
Racecourse Estate, and the Quarry
View Primary School, among others, to
generate ideas for Ecological Footprint-
reducing projects.
With help from the council, these
neighbourhood groups generated promising
project ideas to reduce their Footprint in
several categories: raising awareness of
sustainability through practical projects with
groups, growing food locally and organising
box deliveries of fruit and vegetables,
distributing advice leaflets for sustainable
practices in the home, and promoting
cycling/walking initiatives. By encouraging
the voluntary participation of community
groups and using the Footprint as an
instructive tool in plans and strategies,
Sunderland is working towards a successful
sustainable community programme.
5N
OR
TH
EA
ST
National and localstrategies fordeveloping sustainablecommunities
> Securing the Future, the UK
government’s new sustainable
development strategy, names
sustainable communities as a priority.
> The Egan Review Skills for Sustainable
Communities provides a broader
definition of sustainable communities
than had previously been used by
the Office of the Deputy Prime
Minister (ODPM).
> The Academy for Sustainable
Communities, based in Leeds, was
founded by the ODPM and provides
training in achieving sustainable
communities.
> The Local Strategic Partnership’s
Learning Programme on Sustainable
Communities is jointly funded by Defra
and the Academy for Sustainable Skills,
and investigates how best to engage
LSPs in learning about sustainable
communities.
> The Audit Commission published the
Ecological Footprints of all local
authority areas in January 2006. This
information will be available free of
charge as a tool for communities
seeking to measure their sustainability.
WWF-UK is using the information and
results from the Sunderland project to
explore the development of a community
Ecological Footprint tool. Its main feature will
be to develop a method to enable
community organisations to measure their
Ecological Footprint – in terms of transport,
homes and energy, consumables, food,
services, leisure and holidays, and other
categories – then plan to reduce it.
The future of sustainable
communities
The future of sustainable communities
Sustainable development can start at the
community level. Effective community
programmes such as Sunderland’s take a
coordinated approach to sustainability, and
capitalise on the smaller, more accessible
size of their community. Increasingly,
customised Footprint application tools and
methods, such as the one being developed
following the work in Sunderland, will be
available to communities across the UK.
With the Ecological Budget UK project’s
release of the REAP modelling software6,
regions and communities will have an
even more powerful tool to assess the
potential ecological impacts of different
development options.
4 The Northern Way was initiated by the Office of the Deputy
Prime Minister and is led by three regional development
agencies: One North East, Yorkshire Forward, and the
North West Regional Development Agency. See more at
www.thenorthernway.co.uk/index.html
5 This is a summary of The Northern Way’s report Creating
Truly Sustainable Communities. See the whole report at
www.thenorthernway.co.uk/app_june05.html
6 To learn more about REAP, see www.sei.se/reap
“Neighbourhood groupsgenerated ideas to reduce their Footprint in several ways,including growing food locallyand organising box deliveries”
INGRAM PUBLISHING

SupplyMaterial supplied to
the region’s economyfor consumption
or production
DemandMaterial demanded by the region,other UK regions or the world for consumption or production
Regional production
74.5 million tonnes
Regional consumption
84.7 million tonnes
Imports from the rest of the world
14.5 million tonnes
RMI
117.6 million tonnes
Regional material inputs and consumption
RMI/cap
17.4 tonnes
RMC
45.6 million tonnes
RMC/cap
6.7 tonnes
Imports fromother UK regions
67.5 million tonnes
Exports toother UK regions
64.9 million tonnes
Exports tothe rest of the world
6.9 million tonnes
Fig 1 Material flows of the North West
Households 47.6
Capital investment 13.4
Residual material flows* 23.7
*including transformation stock changes and waste
38
AnalysisMaterial flow
The North West has a remarkably low
amount of materials flowing through its
economy. Both Regional Material Input
(RMI) – 17.5 t/cap – and Regional Material
Consumption (RMC) – 6.8 t/cap – are the
lowest of any UK region or devolved
country. This is due to a low throughput
of energy carriers and mining materials.
Per capita, only 1.2 tonnes of energy
carriers are required for the North West
economy – the lowest in the UK.
The demand for mining materials is third
lowest, with 4.9 t/cap.
On the other hand, the North West has
the highest throughput of chemicals of all
UK regions and countries – 2.0 t/cap.
This not only shows the dominance of
chemical and related industries in the
region, but also demonstrates that a high
flow of chemicals does not necessarily
come with a high flow of energy materials,
and that some types of flows don’t affect
total throughput tonnes as much as others
– even if, like chemicals in the North West,
they are much higher than average.
5N
OR
TH
WE
ST North West
In terms of physical trade, the North West
shows the archetypal pattern for an English
region heavily involved in intra-UK trade and
much less in material exchanges with the
rest of the world. With 133m tonnes, this is
the second highest physical exchange with
other UK regions, being equally driven by
imports (51 per cent) and exports (49 per
cent). While the North West mainly imports
quarrying materials as well as wood or
wood products, it predominantly exports
food as well as pulp and paper products.
Taking into account all trade with other
regions and countries and subtracting
imports from exports, the North West
is one of five net importing regions with
an import surplus of 10.2m tonnes.
Ecological Footprint
The North West’s Ecological Footprint of
5.12 gha/cap is lower than the UK average,
but still higher than that of four other English
regions, and of Wales and Scotland. A more
detailed analysis reveals that the Footprint
of car use and electricity consumption are
particularly low. Residents in the North West
have the third lowest transport Footprint
at 0.62 gha/cap, after London and Yorkshire
and Humberside, which both have
0.60 gha/cap. This is mainly due to low
car mileage and low related expenditure
for private transport. In terms of electricity
consumption and gas distribution, the
North West ranks second lowest with 0.39
gha/cap, after London with 0.37 gha/cap.
CO2 emissions
Total consumer-related carbon dioxide
emissions are 11.5 t/cap – slightly lower
than the UK average of 11.8 t/cap but
higher than the territorial emissions of the
North West of 10.8 t/cap. Notably, domestic
energy consumption in the North West
is responsible for 1.7 tonnes of CO2 per
capita, which is well above the UK average
of 1.5 t/cap and third highest of all regions
and countries: only the East Midlands and
Northern Ireland are higher at 1.8 and 2.7
t/cap respectively.
Services 0.37
Fixed capital 0.76
Consumables 0.64
Home & energy 1.20
Government & other 0.40
Travel 0.95
Fig 3 The North West’s Ecological Footprint (gha/cap)
Food 1.13
Total
5.45 gha/cap
Fig 2 Regional Ecological Footprints (gha/cap)
Wales 5.20 South West 5.24Yorkshire & Humberside 5.30 North East 5.31 West Midlands 5.36 Scotland 5.37 North West 5.45 East Midlands 5.47 London 5.58 East of England 5.64 Northern Ireland 5.65 South East 6.29 UK Average 5.36
Material flow analysis
Ecological Footprint

39
5N
OR
TH
WE
ST
CO2 emissions
Food & drink
Home & energy
Travel
Government & fixed capital
Tobacco 0.01Household tools, utensils& maintenance 0.07Newspapers, books & stationery 0.07Medical & personal products 0.11Furniture& furnishings 0.15Textiles & footwear 0.16Personal effects nec 0.27Audio visual & photo equipment 0.13Household appliances 0.21
Recreational items & equipment 0.26
Consumables
Hospital services 0.02Social protection 0.05Other services nec 0.05Education 0.04Accommodation 0.05Telephone & fax 0.06Water supply 0.08Insurance & finance 0.20Recreation & culture 0.09UK residentholidays abroad 0.19
Services
Catering services 0.44
Non-alcoholic beverages 0.04Alcoholic beverages 0.05
Food 0.34
Fig 4 CO2 emissions from consumption in the North West (t/cap)
Total0.87 t/capUK Av. 0.87 t/cap
Total3.20 t/capUK Av. 3.10 t/cap
Total3.03 t/capUK Av. 3.03 t/cap
Total2.12 t/capUK Av. 2.44 t/cap
Total1.46 t/capUK Av. 1.46 t/cap
Total0.83 t/capUK Av. 0.90 t/cap
Transport services 0.65
Purchase of vehicles 0.32
Operation of personal transport 0.24
Private transport(car fuel) 0.91
Maintenance & repair 0.14
Gas 1.74
Actual rentals for housing 0.06
Electricity 1.13
Imputed rentals for housing 0.13
Emissionsfrom consumption
11.51 t/capUK Av. 11.81 t/cap
Territorial emissionsfrom production
10.76 t/capUK Av. 10.76 t/cap
0.00.20.40.60.81.0
Fixed capital 1.87
Government& other 1.16
OverviewSustainable development
in the North West
> As the birthplaces of the industrial
revolution, Manchester and Liverpool
suffered extreme levels of poverty and
pollution, followed by 50 years of decline
and restructuring. From the challenges of
social exclusion, ill-health, obsolescence
and dereliction, the ‘metropolitan’
North West is now re-inventing itself
as a globalized hub for creative and
knowledge-based industries in the
‘new urbanism’ mode.
> The North West’s regional economy as
a whole is diverse, and catching up with
the UK, but in GVA/per capita lags
behind by about 10 per cent.
> The North West Development Agency
aims to transform the region through
sustainable economic development
into a competitive, high added value,
knowledge-based inclusive economy: • raising the output of businesses and
the productivity of workers;• creating more & better jobs; • ensuring skills for life, especially
for those without qualifications;• enabling people to access work,
including for disadvantaged groups;• helping disadvantaged communities; • reducing variations across the region.
> The Development Agency has expressed
support for renewable energy,
environmental technology, community-
based recycling, ethical finance and
corporate responsibility.
> The North West’s Regional Spatial
Strategy (RSS) has several levers with
which to direct its construction sector.
The strategy encourages use of previously
developed land, re-use of disused
buildings and land, and higher density
building where practicable.
Future implications Developers have
an opportunity to provide more floor space
per Footprint hectare by building at higher
densities (which reduces built-up land), and
making more available certain services –
such as transport – that are important for
sustainable communities. The RSS Policy
DP3: Quality in New Development –
requires new development to demonstrate
“good design quality.” This can encourage
innovative, eco-friendly, and adaptable
buildings with improved energy and
materials efficiency.
However, these moves towards
sustainable development may not yet be
enough to turn the tide of material growth.
For instance, Manchester Airport, the major
air hub in the North, continues to double in
size (and, roughly, in Footprint and CO2
emissions) every 10-15 years.
“The North West is one of five netimporting regionswith an importsurplus of 10.2m tonnes”

40
With more than a quarter of a million
businesses, the North West accounts for
11 per cent of the UK’s total business
base. In 2001 the North West out-
performed the UK economy as a whole.
The region remains relatively dependent on
more traditional manufacturing, mainly of
chemicals and transport equipment, and is
under-represented in some higher growth
sectors such as business, financial services
and electronics.
Longer-term economic trends are difficult
to determine, but GDP growth will probably
be somewhere between 2-3 per cent per
year. Construction and the public sector are
key drivers of regional growth, although the
shift to services is likely to continue in this
region as elsewhere, with a reduction of
primary and manufacturing employment
towards 15 per cent of the total.
The North West is home to 6.9 million
people in 2.8 million households. It has
the second largest population of the UK’s
regions and is three times more densely
populated than the European average.
Even so, the population has reduced
since the 1970s, which can be linked to
migration to the more prosperous South.
The population is still booming, with
current projections of a slight rise over
the next 20 years.
Residential and commercial building
Today, there are 2.8 million dwellings in the
North West. In recent years some 20,000
houses have been built annually. Net of
clearance, almost 13,000 dwellings are
expected to be built annually between
now and 2016 – that’s 143,000 new
houses over the next 11 years. If this level
of construction continues through to 2050,
it would result in 585,000 new dwellings
in the region – a 20 per cent increase
over today’s levels.
Commercial building continues at
approximately 1-2 per cent of the building
5N
OR
TH
WE
ST Spotlight
stock per year. About 63 per cent of new
development is on recycled land, short of
the regional target of 70 per cent. Derelict
land is expected to remain at its current
level of 4.3 per cent of the total, while the
current vacant housing total will remain
consistent at about 130,000 dwellings.
Construction is the largest resource-using
sector, both in direct materials use and the
energy demand of its products. With rising
costs of energy and waste disposal, and
forthcoming Building Regulations and EU
directives, there will be increasing pressure
on construction to raise its game. Many
contracts will be based on environmental
as well as financial performance.
In order to achieve a more sustainable
way of constructing and housing, major
efforts are required by all participants,
including builders, designers, architects,
construction companies, home owners
and tenants.
In the course of the Eco Region NW
project (see box right), a detailed material
flow analysis of the construction sector
in the North West was undertaken.
This can help identify where the problems
are and what the solutions could be.
The construction industry is by far
the most mass-intensive of any sector:
construction materials make up 40 per
cent of the 118m tonnes of total regional
material input (RMI) from all activities.
Quarry products, including aggregates,
sand, crushed rock and limestone,
constitute by far the largest type of
material flow, accounting for 28 per cent
of the total RMI. Raw materials make
up roughly 90 per cent of material inputs
for the construction sector, while only
10 cent are recycled or secondary.
Construction and
Ecological Budget UK
The detailed material flow analysis by
Ecological Budget UK and Eco-Region
NW enables us to identify for which purpose
construction materials are directly being
used in the regional economy. Figure 5
shows these details for the main
construction activities – building new
dwellings and the maintenance and repair
of existing dwellings. In 2001, 5.5m tonnes
of materials were used for the construction
of new dwellings, followed by 1.5m tonnes
for maintaining and repairing existing
properties.
This shows that although new-build
(especially commercial) projects attract
most media and professional attention,
repair, maintenance and refurbishment
are also very significant consumers of
construction services and materials. It also
suggests that for every new-build house,
about 300 tonnes of materials have to be
moved and put in place; of this, around
160 tonnes actually make up the
house itself.
Construction and building in the North West
Type of material
(commodity group)
Mining & quarrying materials 2,568.0 584.7
Structural clay products 366.0 29.4
Cement, lime & plaster 281.0 156.7
Articles of concrete, stone, etc. 1,974.0 475.0
Wood & wood products 145.9 155.0
Paints, varnishes, etc. 13.0 16.4
Rubber products 2.0 3.5
Plastic products 39.2 46.8
Glass & glass products 18.5 8.6
Ceramic goods 14.1 4.8
Iron & steel 47.1 23.9
Structural metal products 37.3 15.2
Electric motors & generators, etc. 17.6 8.7
Total 5,523 1,529
Mai
nten
ance
and
rep
air
Co
nstr
ucti
on
Fig 5 Materials used for construction purposes in the North West region (kilotonnes/year, 2001)

41
Environmental impacts
of construction
Carbon dioxide and other emissions
released during the extraction and transport
of raw materials are not normally added to
the construction sector’s carbon balance,
yet applying the consumer principle allows
us to see what the total impacts of demand
for construction activities are. Following this
principle, we calculated total CO2 emission
and Footprint factors for the main
construction materials. These take into
account all emissions and impacts that
occur along the production and supply
chain of these materials. Results are
depicted in Figure 6 and Figure 7.
The picture is different for the two
indicators. Structural metal products
show very high relative impacts for both
CO2 emissions and the Footprint. All other
construction materials have lower CO2
emissions per tonne, especially aggregates
and bulk materials which don’t require many
steps of manufacturing. However, wood,
rubber and plastic products show a high
specific Footprint per tonne which is due
to their additional land requirements.
Using the information from both the
material flow analysis and the environmental
impact analysis allows the calculation
of total impacts of construction activities
in the North West – for example for the
construction of one average new home.
Key facts from this analysis are:
> The construction of one new dwelling
in the North West sets free 62 tonnes
of CO2;
5N
OR
TH
WE
ST
Eco-Region North West
The Eco-Region NW is a projectdeveloped from the Biffaward nationalresearch programme of waste/resourceflow analysis. Eco-Region NW sets a new standard for analysis of waste andmaterial flows at the regional scale and is coordinated with the national levelsystem, Eco-Budget UK. It provides a“joined up” information system whichmeasures environmental performance atboth the regional level and the firm level.
The Eco-Region NW extends the
national system, with a particular
focus on:
> waste management sector
> construction sector
> business applications
> policy applications.
The Eco-Region NW information system
also makes links between the flows of
resources and waste, and their causes
in production and consumption. It also
connects a top-down analysis at the
regional level with a bottom-up environ-
mental report template at the firm level.
> The highest CO2 impact – 14 tonnes or
22 per cent – is due to structural metal
products, 11 tonnes are due to iron and
steel products and 10 tonnes are due
to cement, lime and plaster products;
> An average new house in the North West
requires an Ecological Footprint area of
30 gha. Most of this area is due to wood
products which require 12 gha, followed
by concrete and structural metal products
with 3 gha each; and
> On a per capita basis, total housing in
the North West is responsible for CO2
emissions of 0.33 t/cap and for a
Footprint of 0.18 gha/cap.
Regional Spatial Strategy and
housing strategy
The RSS has several levers with which to
direct the construction sector. It encourages
use of previously developed land, re-use of
disused buildings and land, and building at
higher densities where practicable. Building
at higher densities, which reduces land
take and makes some services that are
important for sustainable communities such
as transport more viable, may be viewed by
some developers as an opportunity to sell
more floor space for a given development
Footprint. The RSS Policy DP3: Quality
in New Development requires new
development to demonstrate quality design.
This means innovative design that results in
eco-friendly and adaptable buildings with
improved energy and materials efficiency.
Fig 6 Total Ecological Footprint (gha) per tonne of material Fig 7 Total CO2 emissions (tonnes) per tonne of material
Mining & quarrying materialsStructural clay products
Cement, lime & plasterArticles of concrete, stone etc
Wood & wood productsPaints, varnishes etc
Rubber productsPlastic products
Glass & glass productsCeramic goods
Iron & steelStructural metal products
Electric motors & generators etc
7.0
6.0
5.0
4.0
3.0
2.0
1.0
0
1.40
1.20
1.00
0.80
0.60
0.40
0.20
0

SupplyMaterial supplied to
the region’s economyfor consumption
or production
DemandMaterial demanded by the region,other UK regions or the world for consumption or production
Regional production
89.0 million tonnes
Regional consumption
108.4 million tonnes
Imports from the rest of the world
27.8 million tonnes
RMI
148.8 million tonnes
Regional material inputs and consumption
RMI/cap
18.5 tonnes
RMC
71.9 million tonnes
RMC/cap
8.9 tonnes
Imports fromother UK regions
68.5 million tonnes
Exports toother UK regions
59.1 million tonnes
Exports tothe rest of the world
17.6 million tonnes
Fig 1 Material flows of the South East
Households 71.6
Capital investment 21.0
Residual material flows* 15.8
*including transformation stock changes and waste
42
AnalysisThe South East’s CO2 emissions from
consumption are high and its Ecological
Footprint is large. CO2 emissions from
consumption are 13.4 tonnes per person,
13 per cent higher than the national average
and 21 per cent higher than the North
East (the region with the lowest CO2 from
consumption per capita). The South East’s
Ecological Footprint is 6.3 global hectares
per capita, 17 per cent higher than the
national average and 21 per cent higher
than Wales’ Footprint per capita (the
lowest in the UK). Particularly within a
small country, this variation is significant.
Transport
The South East’s emissions from personal
transport are among the highest in the
country. Ironically, many emissions are due
to residents who commute daily to London
– which has the lowest transport emissions
of any region. The difference between the
two regions is substantial: the CO2 emitted
as a result of South East residents’
5S
OU
TH
EA
ST South East
transport is 45 per cent higher than
emissions from London residents’ transport.
The only other region that travels further
per capita is the East of England, the other
major region bordering the capital. Because
numerous South East residents commute
to London, many of their travel emissions
are released in the capital. While in terms
of health this is not significant for CO2
(which is distributed quite evenly in the
atmosphere, no matter where it is emitted)
it means that London is subject to other
harmful local pollutants because of the
people who travel there. This is true even
though residents of London drive less and
emit less CO2 from transport.
South East residents place greater
demand on all transport modes, travelling
nearly 13,000km a year. A “high mobility”
society uses more resources. The continual
purchasing of new cars in the South East
has indirect manufacturing emissions of
0.44 t/cap, while car maintenance releases
a further 0.41 t/cap.
Emissions from an individual in the
UK who purchases and maintains a car
are equal to the average person’s total
emissions in Pakistan for one year1.
Material flow
At first sight, the South East shows a
surprisingly small intake and consumption of
materials. With 18.59 t/cap of total Regional
Material Input (RMI), it is second smallest
among UK regions, and its Regional
Material Consumption (RMC) is fourth
lowest at 8.98 t/cap. While the 52.4m
tonnes (or 6.55 t/cap) of regional material
production/extraction is moderate in
comparison to the UK average, both figures
are mainly determined by the South East’s
high imports. In fact, it is the largest material
importer from other UK regions with 68.6m
tonnes, and the second largest when
imports from the rest of the world, totalling
96.4m tonnes, are counted. Its exports, in
contrast, are comparatively low: the South
East is the UK’s second largest net material
importer with a surplus of 19.5m tonnes.
One reason the South East’s total
RMC and RMI aren’t as large as might
be expected (given its very large Ecological
Footprint) is the fact that RMC and RMI
only account for materials that physically
flow within, into and out of a region’s
borders. They do not account for “indirect
resource flows” which occur in other regions
Services 0.55
Fixed capital 0.76
Consumables 0.89
Home & energy 1.26
Government & other 0.40
Travel 1.30
Fig 3 The South East’s Ecological Footprint (gha/cap)
Food 1.14
Total
6.29 gha/cap
Fig 2 Regional Ecological Footprints (gha/cap)
Wales 5.20 South West 5.24Yorkshire & Humberside 5.30 North East 5.31 West Midlands 5.36 Scotland 5.37 North West 5.45 East Midlands 5.47 London 5.58 East of England 5.64 Northern Ireland 5.65 South East 6.29 UK Average 5.36
Material flow analysis
Ecological Footprint

43
during production processes of goods and
services consumed elsewhere – in this case,
the South East. Taking indirect material
flows into account, household consumption
is the most material-intensive of any UK
region, amounting to around 9 t/cap per
year, compared with a national average of
7.5 t/cap per year. This rate of consumption
is mainly driven by material flows from the
agricultural sectors (13.6m tonnes), the
mining sector (22m tonnes) and the food
industry (11.8m tonnes).
The CO2 emissions and Ecological
Footprint results for the South East clearly
demonstrate the impacts of a booming
economy that spends more money than
average on most kinds of consumption.
In contrast to many UK regions and
devolved countries, the South East’s
CO2 from consumption is considerably
higher than CO2 from production. Emissions
from production are still significant (more
than 10 tonnes per person), reflecting
the fact that the South East has an active
manufacturing base in addition to its
service economy. The heavy flows depicted
in the Direct Material Inputs table also
demonstrate the large amount of resources
5S
OU
TH
EA
ST
that the South East economy exchanges
with the rest of the UK and the world.
Goods and services
The South East spends more than the
average on goods and services, which
is reflected in its high CO2 emissions.
The production of jewellery for South East
residents emits 0.35 t/cap, 55 per cent
higher than the national average.
Generally, services have lower
CO2 emissions per £ spent than goods,
with a few exceptions such as eating out.2
But although services are often efficient,
they still have a high overall impact when
consumed at high rates. The South East
spends more on goods and services than
any other region, and it is not surprising that
the resulting CO2 emissions are higher than
the national average (35 per cent higher for
goods and 32 per cent higher for services).
This analysis demonstrates that the
development of eco-efficient services is
of particular importance to the South East
in terms of reducing their overall Footprint.
Sustainable development
in the South East
> The largest and most successful
economy in the UK by far, it is also
one of the most unequal, congested
and overheated.
> Together with London and the East of
England, the South East accounts for
over 50 per cent of the UK’s Research
and Development, and alongside the
North West is the largest
manufacturing region in the UK.
> Polarisation has increased as greater
wealth generates a demand for more
services, creating an ‘hourglass’
economy, dependent on lower paid,
lower value jobs.
> In the Regional Economic Strategy
(RES) there is a tangible realization
that this kind of growth rate is
unsustainable, and it makes a priority
of sustainable consumption and
production.
Future implications The South East’s
RES makes a priority of sustainable
consumption and production – delivering
products and services with lower
environment impacts, while boosting
competitiveness. The South East is well-
placed to lead this new approach to
consumption and production, with its
strong research base and many
businesses in both the product design
and environmental technology sectors.
Developments in the technology of reuse,
remanufacturing and recycling offer a
significant economic opportunity for the
region. The South East is expected to
experience greater climate change
impacts than the rest of the UK by 2050.
Overview
2 Discussed in more detail in chapter 6, “A framework for
sustainable consumption and production”.
1 International emissions information obtained from
the UN Common Database (CDIAC) via “Globalis –
Interactive World Map”
Food & drink
Home & energy
Travel
Government & fixed capital
Tobacco 0.01Household tools, utensils& maintenance 0.14Newspapers, books & stationery 0.08Medical & personal products 0.14Furniture& furnishings 0.19Textiles & footwear 0.19
Personal effects nec 0.35
Audio visual & photo equipment 0.26
Household appliances 0.30
Recreational items & equipment 0.33
Consumables
Hospital services 0.04Social protection 0.05Other services nec 0.08Education 0.10Accommodation 0.09Telephone & fax 0.08Water supply 0.08
Insurance & finance 0.30
Recreation & culture 0.11
UK residentholidays abroad 0.26
Services
Catering services 0.38
Non-alcoholic beverages 0.04Alcoholic beverages 0.07
Food 0.36
Fig 4 CO2 emissions from consumption in the South East (t/cap)
Total0.85 t/capUK Av. 0.87 t/cap
Total3.37 t/capUK Av. 3.10 t/cap
Total3.03 t/capUK Av. 3.03 t/cap
Total2.94 t/capUK Av. 2.44 t/cap
Total1.98 t/capUK Av. 1.46 t/cap
Total 1.20 t/capUK Av. 0.90 t/cap
Transport services 0.79
Purchase of vehicles 0.44
Operation of personal transport 0.41
Private transport(car fuel) 1.31
Maintenance & repair 0.16
Gas 1.64
Actual rentals for housing 0.06
Electricity 1.38
Imputed rentals for housing 0.13
Emissionsfrom consumption
13.37 t/capUK Av. 11.81 t/cap
Territorial emissionsfrom production
10.12 t/capUK Av. 10.76 t/cap
Fixed capital 1.87
Government& other 1.16
CO2 emissions

44
With population growth projected for the
entire South of England, the South East
region is under continuing pressure to build
new homes. The South East England
Regional Assembly’s (SEERA) draft RSS
plans 28,900 new homes a year. Already,
the South East’s Ecological Footprint of
1.26 gha/cap for home-building and energy
use is the second highest in the UK.
The Draft Regional Spatial Strategy
The RSS commits to stabilising the region’s
per capita Footprint by 2016. A stable
Footprint is one where the Footprint per
capita is no longer increasing, although the
total Footprint may be. SEERA has pursued
a low-Footprint home construction policy –
a main component of Footprint stabilisation.
Other SEERA plans have also focused
on lowering the housing Footprint.3
5S
OU
TH
EA
ST Spotlight
Stabilising the South East’s
footprint: The housing component
SEERA seeks to counteract the South
East’s .025 gha/cap per housing Footprint
with several specific measures:
> make existing housing more energy
efficient (0.005 gha/cap savings per year);
> use low-impact construction for all house-
building (0.005 gha/cap savings per year);
> use low-impact construction for all other
construction (0.004 gha/cap savings
per year);
> use low-energy housing design to
the EcoHomes “excellent” standard
(0.001 gha/cap savings per year);
> use low-energy design for all other
construction (0.004 gha/cap savings
per year); and
> avoid traffic increases as a result of new
housing by providing public transport
and a cycling/walking infrastructure
(0.006 gha/cap savings per year).
Local authorities
SEERA’s RSS will not become operational
until 2007, and other policies in the plan
both support and contradict Footprint
stabilisation in the South East. While the
Strategy expresses a commitment to
sustainable construction, its draft version
(March 2005) had dropped a requirement
that all new homes be built to EcoHomes
“very good” standards.
Against this backdrop, some South East
local authorities are already building more
sustainable housing on their own without
being required to by law. For example,
Ashford Borough Council’s draft Local
Development Framework will require most
new development to be built according to
EcoHomes “excellent” standards by 2008,
and to be carbon neutral by 2015.
Chichester already requires an EcoHomes
“excellent” rating for new housing, and
Brighton’s Supplementary Planning
Guidance calls for a “very good” rating
for new development. Croydon’s
Supplementary Planning Guidance requires
new developments to be carbon neutral.
Home construction and the South East’s attempt to stabilise its footprint
3 For example, SEERA’s Southeast Integrated Regional
Framework, “Objective 16,” the Southeast’s Regional
Economic Strategy and the Taking Stock resource
use analysis.
4 ibid
“Some South Eastlocal authorities arealready building moresustainable housingon their own”

45
5S
OU
TH
EA
ST
The SEERA DraftRegional SpatialStrategy: Policy CC3 In order to reflect the Plan’s emphasis
on more sustainable resource use,
SEERA will promote measures that seek
to stabilise the South-east’s Ecological
Footprint by 2016, and to reduce the
Footprint during the second half of the
Plan period. Implementation will require
a sustained new programme of action
incorporating:
> increased efficiency of resource use
in new development;
> adapting existing development to
reduce its use of energy, water and
other resources;
> introducing complementary
legislation and fiscal measures
by government; and
> changing behaviour of organisations
and individuals.
The future
Not only has SEERA committed to
stabilising its Footprint, but it has also to
“reduce the global, social and environmental
impacts of consumption of resources”.4
Ecological Budget UK can help determine
what this will mean in terms of practical
strategy and policy-making. It shows what
resources housing requires, and enables
the South East to compare its Footprint
with other regions. Ecological Budget
UK also provides a standardised baseline
measurement for future studies. All this
information is included in the Resource
and Energy Analysis Program (REAP),
a scenario modelling tool for decision-
makers in the region.
In the South East as a whole, the
RSS sets relatively low targets for using
renewable energy. There is also great
pressure to expand the region’s airports,
and the South East’s general economic
expansion is among the fastest in the
country. These factors may counteract
Footprint and CO2 reductions as a result
of more sustainable housing designs.
Despite some of these unresolved
tensions, the South East has taken steps
towards low-Footprint housing, sustainable
resource use and a stabilised Footprint
by 2016. Future Footprinting, CO2
consumption monitoring and resource flow
analysis will gauge these efforts. But most
important of all, the South East has an
opportunity to introduce sustainable
building into the mainstream – an advance
that will affect its Footprint far beyond
the next 10 years.
“Most important of all, the South Easthas an opportunityto introducesustainable buildinginto the mainstream”
PEGGY ALLCOT/WWF-UK

SupplyMaterial supplied to
the region’s economyfor consumption
or production
DemandMaterial demanded by the region,other UK regions or the world for consumption or production
Regional production
102.3 million tonnes
Regional consumption
108.2 million tonnes
Imports from the rest of the world
12.4 million tonnes
RMI
121.5 tonnes
Regional material inputs and consumption
RMI/cap
24.6 tonnes
RMC
81.8 tonnes
RMC/cap
16.5 tonnes
Imports fromother UK regions
33.2 million tonnes
Exports toother UK regions
33.2 million tonnes
Exports tothe rest of the world
6.4 million tonnes
Fig 1 Material flows of the South West
Households 36.1
Capital investment 10.0
Residual material flows* 62.1
*including transformation stock changes and waste
46
AnalysisThe South West is England’s largest region,
parts of which are very peripheral: the
northern tip in Gloucestershire is as close
to Scotland as it is to Land’s End1. It is also
a rural region with a dispersed population, of
whom around 35 per cent live in settlements
of fewer than 10,000. The South West also
possesses a higher proportion of very small
villages than any other region.
Its peninsula character means that it has
nearly 1,120km of coast, 60 per cent of
which is designated Heritage Coast. More
than three million people (62 per cent of the
population) live within 10km of the coastline.
Nearly 37 per cent of the region comprises
protected landscape, and with good reason
– its two national parks and 14 Areas of
Outstanding Natural Beauty attract 26
million tourists a year.2
5S
OU
TH
WE
ST South West
Despite the perceived high quality of life,
the region nevertheless suffers from huge
internal disparities. The north and east are
close neighbours to the Midlands, the South
East and London, while the far south-west
suffers from marked under-investment and
lack of opportunities. This is illustrated not
only by below average productivity levels,
but also marked differences across the
region – for example, 153 per cent of UK
productivity (Gross Value Added per head)
is in Swindon, but only 57 per cent in
Cornwall, which is classified as a European
Union Objective One area.3
Notably, two of the region’s key strategies
– the draft Regional Economic Strategy
(RES)4 and draft Regional Spatial Strategy
(RSS)5 – recognise the need to reduce the
South West’s Ecological Footprint6, to
develop within environmental limits, and
to promote sustainable consumption and
production. This is a significant commitment
for a region expecting to see rapid growth in
the coming 20 years (recent research
suggests a population increase of 600,000,
the creation of 450,000 new jobs and the
provision of some 550,000 new homes.)7
Resolving the tension between an increased
population and economic growth, and
the urgent need to reduce resource
consumption and CO2 emissions, will
be a major sustainability challenge in
the coming years.
Ecological Footprint
The South West’s Ecological Footprint is
5.24 gha, the second lowest in the UK
to Wales at 5.20 gha. The UK average
is 5.36 gha. Consistent with the UK,
home & energy and food are the largest
components, accounting for 22 per cent
and 20 per cent of the Footprint
respectively. Travel accounts for a further
17 per cent, consumables 11 per cent, and
services 7 per cent. The South West has an
above-average Ecological Footprint only in
travel and services, while home & energy
is a fraction below the national average.
Services 0.38
Fixed capital 0.76
Consumables 0.57
Home & energy 1.15
Government & other 0.40
Travel 0.91
Fig 3 The South West’s Ecological Footprint (gha/cap)
Food 1.07
Total
5.24 gha/cap
Fig 2 Regional Ecological Footprints (gha/cap)
Wales 5.20 South West 5.24Yorkshire & Humberside 5.30 North East 5.31 West Midlands 5.36 Scotland 5.37 North West 5.45 East Midlands 5.47 London 5.58 East of England 5.64 Northern Ireland 5.65 South East 6.29 UK Average 5.36
Material flow analysis
Ecological Footprint

47
CO2 emissions
The South West’s “territorial” CO2 emissions
are 9.46 tonnes/capita, below the UK
average of 10.76 tonnes/capita, and the
fourth lowest in the country. Consumer
emissions are 17 per cent higher than terri-
torial emissions at 11.47 t/cap incomparison
to the UK average of 11.81 t/cap.
Home & energy use accounts for 27 per
cent of the South West’s CO2 emissions.
This is the largest component and is
consistent with the rest of the UK.
Travel is the second largest contributor
to the South West’s CO2 emissions,
accounting for 21 per cent (2.37 t/cap)
of the Ecological Footprint. Although this
is below the UK average of 2.44 t/cap,
it is worth noting that CO2 emissions from
private vehicle use (120 t/cap) account for
51 per cent of total travel CO2 emissions –
the largest proportion in the UK and the
third highest in the country. Only the South
East (131 t/cap) and East (125 t/cap) have
higher levels.
But in sharp contrast, the South West
also has the lowest CO2 emissions (0.49
t/cap) from public transport services in the
country and the biggest gap between
5S
OU
TH
WE
ST
Sustainable development
in the South West
> The South West is characterised by its
largely rural landscape, long coastline,
few major cities and many small
settlements. Rural communities play
an important role in the South West’s
economy.
> Over the next 20 years, the South
West’s population could rise
by 600,000.
> The South West’s Regional
Development Agency has a detailed
and explicit sustainable development
strategy. It recognizes that:• business efficiency can be enhanced
through better environmental
management;• quality of life in the region is a major
attractor of investment, business,
workers and tourists;• environmental technologies and
services, such as renewable energy,
represent a huge global market
where the South West can become
a leader;• in identifying the environment as
a key ‘driver’ for the economy, it is
important to build rather than
diminish the region’s environmental
and cultural capital;• over 12 per cent of regional economy
relies directly on the land and
landscape.
Future implications Sustainable
development is a mounting challenge
for the South West – taking needed steps
to develop its regional economy whilst
still securing environmental and social
benefits. As it grows, the South West will
need to answer many major questions
about transportation, housing, agriculture,
and energy: Is it possible to attract new
visitors to the region without major new
transport infrastructure? How might the
South West sustainably meet the demand
for housing and visitor lodging? What role
might low-impact farming play in
revitalizing rural areas? Which renewable
energy options will the region pursue?
Overview
CO2 emissions
Food & drink
Home & energy
Travel
Government & fixed capital
Tobacco 0.01Household tools, utensils& maintenance 0.10Newspapers, books & stationery 0.08Medical & personal products 0.11Furniture& furnishings 0.14Textiles & footwear 0.14Personal effects nec 0.16Audio visual & photo equipment 0.13Household appliances 0.23Recreational items & equipment 0.23
Consumables
Hospital services 0.04Social protection 0.06Other services nec 0.06Education 0.05Accommodation 0.07Telephone & fax 0.06Water supply 0.09Insurance & finance 0.21Recreation & culture 0.09UK residentholidays abroad 0.13
Services
Catering services 0.36
Non-alcoholic beverages 0.04Alcoholic beverages 0.06
Food 0.34
Fig 4 CO2 emissions from consumption in the South West (t/cap)
Total0.80 t/capUK Av. 0.87 t/cap
Total3.10 t/capUK Av. 3.10 t/cap
Total3.03 t/capUK Av. 3.03 t/cap
Total2.37 t/capUK Av. 2.44 t/cap
Total1.32 t/capUK Av. 1.46 t/cap
Total0.86 t/capUK Av. 0.90 t/cap
Transport services 0.49
Purchase of vehicles 0.32
Operation of personal transport 0.35
Private transport(car fuel) 1.20
Maintenance & repair 0.13
Gas 1.36
Actual rentals for housing 0.06
Electricity 1.43
Imputed rentals for housing 0.12
Emissionsfrom consumption
11.47 t/capUK Av. 11.81 t/cap
Territorial emissionsfrom production
9.46 t/capUK Av. 10.76 t/cap
Fixed capital 1.87
Government& other 1.16
1 ‘First Draft RSS’, SW Regional Assembly, Version 1.92,
October 2005.
2 ‘First Draft RSS’, SW Regional Assembly, Version 1.92,
October 2005.
3 ‘Just Connect – An Integrated Regional Strategy for the
South West 2004-26’, SW Regional Assembly, 2004.
4 ‘SW Regional Economic Strategy – Draft for Consultation’,
SWRDA, September 2005.
5 ‘Draft RSS – Version 2.2’, SW Regional Assembly, RSPTG
meeting papers, 12 January 2006.
6 In April 2005, the South West published ‘Stepping
Forward’, its first material flows and Ecological Footprint
study, undertaken by Best Foot Forward. For an
explanation of any differences in the results between these
studies, refer to the Ecological Budget website. For more
details of Stepping Forward, visit
www.steppingforward.org.uk
7 See footnote 4.
private and public transport emissions –
2.5 t/cap of CO2 are produced from private
vehicle users for every t/cap produced by
users of public transport.
Travel patterns in the region are also
different from the rest of the UK. Visiting
friends and holidays/day trips account for
the most kilometres travelled, compared
with commuting and shopping in the rest of
the UK. South West residents also have the
lowest CO2 emissions from holidays abroad,
at 0.13 t/cap – half the amount of the South
East, which has the highest (0.26 t/cap).
continued over the page
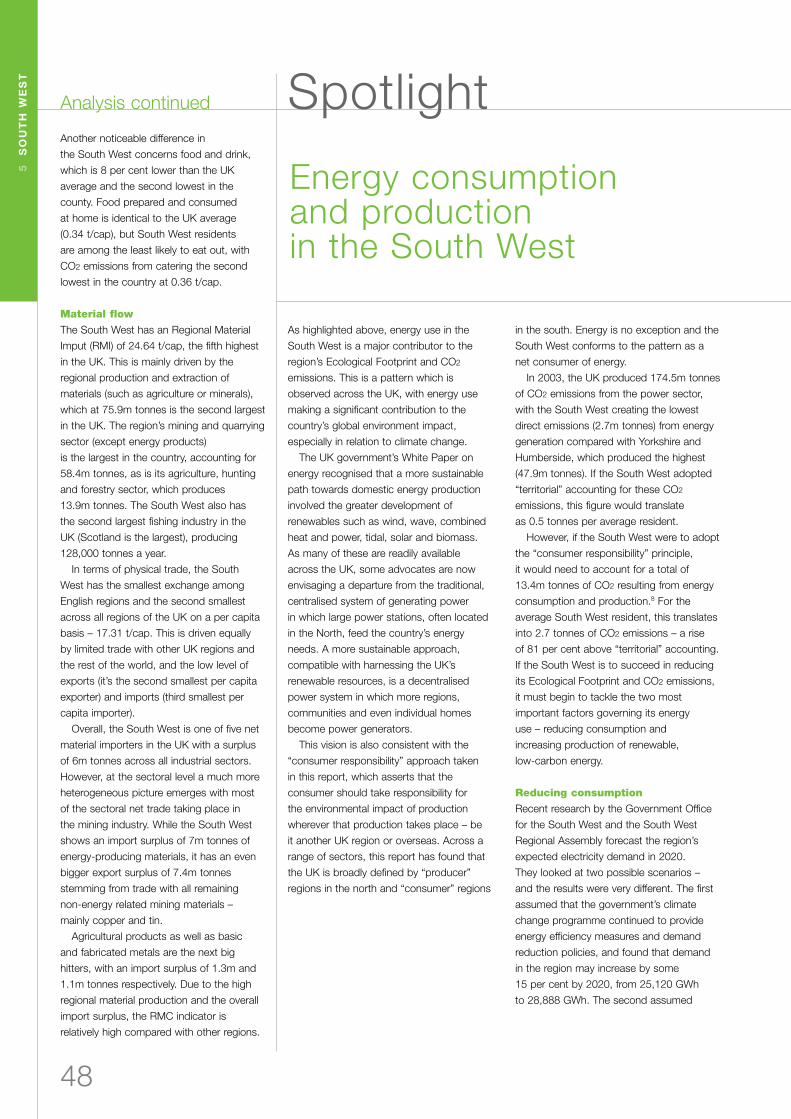
48
As highlighted above, energy use in the
South West is a major contributor to the
region’s Ecological Footprint and CO2
emissions. This is a pattern which is
observed across the UK, with energy use
making a significant contribution to the
country’s global environment impact,
especially in relation to climate change.
The UK government’s White Paper on
energy recognised that a more sustainable
path towards domestic energy production
involved the greater development of
renewables such as wind, wave, combined
heat and power, tidal, solar and biomass.
As many of these are readily available
across the UK, some advocates are now
envisaging a departure from the traditional,
centralised system of generating power
in which large power stations, often located
in the North, feed the country’s energy
needs. A more sustainable approach,
compatible with harnessing the UK’s
renewable resources, is a decentralised
power system in which more regions,
communities and even individual homes
become power generators.
This vision is also consistent with the
“consumer responsibility” approach taken
in this report, which asserts that the
consumer should take responsibility for
the environmental impact of production
wherever that production takes place – be
it another UK region or overseas. Across a
range of sectors, this report has found that
the UK is broadly defined by “producer”
regions in the north and “consumer” regions
5S
OU
TH
WE
ST Spotlight
in the south. Energy is no exception and the
South West conforms to the pattern as a
net consumer of energy.
In 2003, the UK produced 174.5m tonnes
of CO2 emissions from the power sector,
with the South West creating the lowest
direct emissions (2.7m tonnes) from energy
generation compared with Yorkshire and
Humberside, which produced the highest
(47.9m tonnes). If the South West adopted
“territorial” accounting for these CO2
emissions, this figure would translate
as 0.5 tonnes per average resident.
However, if the South West were to adopt
the “consumer responsibility” principle,
it would need to account for a total of
13.4m tonnes of CO2 resulting from energy
consumption and production.8 For the
average South West resident, this translates
into 2.7 tonnes of CO2 emissions – a rise
of 81 per cent above “territorial” accounting.
If the South West is to succeed in reducing
its Ecological Footprint and CO2 emissions,
it must begin to tackle the two most
important factors governing its energy
use – reducing consumption and
increasing production of renewable,
low-carbon energy.
Reducing consumption
Recent research by the Government Office
for the South West and the South West
Regional Assembly forecast the region’s
expected electricity demand in 2020.
They looked at two possible scenarios –
and the results were very different. The first
assumed that the government’s climate
change programme continued to provide
energy efficiency measures and demand
reduction policies, and found that demand
in the region may increase by some
15 per cent by 2020, from 25,120 GWh
to 28,888 GWh. The second assumed
Energy consumption and production in the South West
Analysis continued
Another noticeable difference in
the South West concerns food and drink,
which is 8 per cent lower than the UK
average and the second lowest in the
county. Food prepared and consumed
at home is identical to the UK average
(0.34 t/cap), but South West residents
are among the least likely to eat out, with
CO2 emissions from catering the second
lowest in the country at 0.36 t/cap.
Material flow
The South West has an Regional Material
Imput (RMI) of 24.64 t/cap, the fifth highest
in the UK. This is mainly driven by the
regional production and extraction of
materials (such as agriculture or minerals),
which at 75.9m tonnes is the second largest
in the UK. The region’s mining and quarrying
sector (except energy products)
is the largest in the country, accounting for
58.4m tonnes, as is its agriculture, hunting
and forestry sector, which produces
13.9m tonnes. The South West also has
the second largest fishing industry in the
UK (Scotland is the largest), producing
128,000 tonnes a year.
In terms of physical trade, the South
West has the smallest exchange among
English regions and the second smallest
across all regions of the UK on a per capita
basis – 17.31 t/cap. This is driven equally
by limited trade with other UK regions and
the rest of the world, and the low level of
exports (it’s the second smallest per capita
exporter) and imports (third smallest per
capita importer).
Overall, the South West is one of five net
material importers in the UK with a surplus
of 6m tonnes across all industrial sectors.
However, at the sectoral level a much more
heterogeneous picture emerges with most
of the sectoral net trade taking place in
the mining industry. While the South West
shows an import surplus of 7m tonnes of
energy-producing materials, it has an even
bigger export surplus of 7.4m tonnes
stemming from trade with all remaining
non-energy related mining materials –
mainly copper and tin.
Agricultural products as well as basic
and fabricated metals are the next big
hitters, with an import surplus of 1.3m and
1.1m tonnes respectively. Due to the high
regional material production and the overall
import surplus, the RMC indicator is
relatively high compared with other regions.

49
operating.13 Recent research suggests that
by 2020 the South West’s accessible
resource of renewable energy could be as
much as 2,504MW – 96 per cent more than
it already utilises – and that meeting a 20
per cent target would require harnessing
about half that amount (1,247MW).14
Regional case study:marine renewables
The coast of the South West offers
tremendous potential for marine renewables
– in particular, the high tidal ranges of the
north coast and Severn Estuary, which
averages as much as 11 metres on spring
tides. Potential tidal power options such as
lagoons, barrages and tidal stream
technologies have been explored for the
Severn Estuary. Some of these schemes,
such as the barrage, have been rightly
criticised for their significant adverse
environmental impacts. However, tidal
lagoon technology has the potential to
be less environmentally damaging, as does
the deployment of wave and tidal stream
devices. The DTI has sent out positive
signals to developers by approving the
construction of a 60MW tidal lagoon
generation project in Swansea Bay, across
the estuary from the South West. Tidal
lagoons could produce as much as 4,500
MW of power if all available resources were
developed in the Severn Estuary.
Similarly, at Lynmouth Bay on the north
5S
OU
TH
WE
ST
coast of Devon, small-scale tidal stream
technology has been tested and would
seem to offer great potential as the South
West is considered to have “a tidal stream
resource of national significance”.15 The
South West is also investing in the Wave
Hub, which will enable renewable electricity
from up to four separate devices to be
delivered to the main grid by 2007. The
development phases of the Wave Hub are
designed to coincide with the development
of appropriate renewable technologies.
It is hoped that both wave and tidal
stream technology will play a large part
in contributing to the region’s 2020 target,
with 250MW and 100MW of installed
capacity respectively, contributing nearly
28 per cent of the required capacity
to meet the 2020 target.16
Given the right investment within
a supportive political climate, marine
renewables offer a safe and reliable source
of energy, and therefore must constitute
a potentially cost-effective source
of future energy.
8 Defra, Local & Regional CO2 emissions estimates for
2003, www.defra.gov.uk/environment/statistics/
globatmos/galocalghg.htm
9 “REvision 2020 – Final Report”, GOSW & SW Regional
Assembly, June 2005.
10 For more details of Stepping Forward, visit
www.steppingforward.org.uk
11 Regional Renewable Energy Strategy for the SW of
England 2003-2010, RegenSW, April 2003).
12 The South West’s Regional Spatial Strategy, October 2005
Draft, “Policy E1.” See Policies E1-E5 for a more detailed
plan of how renewable energy will be deployed.
13 “Survey identifies 100 renewable electricity schemes
saving 313,000 tonnes of CO2 a year”. Southwest
Renewable Agency, February 2005.
www.rege+nsw.co.uk/press/news-read.asp?id=30
14 ‘REvision 2020 – Final Report’, GOSW & SW Regional
Assembly, June 2005.
15 SW RDA Seapower SW Review – Resources, Constraints
and Development scenarios for Wave and Tidal Stream
Power, 2004.
16 See footnote 14.
all the savings forecast in the energy
White Paper would be met, and found that
estimated demand may decrease by more
than 11 per cent, down to 22,509GWh.9
While the second scenario is a significant
improvement, the South West’s first
Ecological Footprint report, Stepping
Forward, discovered the importance of
getting to grips with the energy efficiency
of the existing housing stock. The report
found that simple measures, such as all
householders replacing white goods with
A-rated ones, fitting low-energy light bulbs,
improving insulation levels and installing
condensing boilers, could reduce
CO2 emissions by 35 per cent. It also
found that further savings could be made
if 80 per cent of householders fitted solar
hot water heating systems and other
such measures.10
Renewable energy
One way the South West can reduce
consumption of imported energy is by
developing and using its own renewable
energy. The region has identified increased
production of renewable energy as a priority
in many of its key strategies. In 2003,
RegenSW, the regional renewable energy
agency, published the first Renewable
Energy Strategy which set a target of
meeting 11-15 per cent renewable electricity
production by 2010.11 In addition, the
draft RSS sets additional targets of meeting
20 per cent of demand by renewable
energy by 202012, and it includes new
policies on promoting “integrated
renewables” into new housing schemes.
Unfortunately however, only about 3 per
cent of the region’s electricity demand is
met by renewable sources at present, with
102 renewable electricity projects currently
“By 2020 the South West’saccessible resource ofrenewable energy could be as much as 2,504MW”
EDWARD PARKER/WWF-UK

SupplyMaterial supplied to
the region’s economyfor consumption
or production
DemandMaterial demanded by the region,other UK regions or the world for consumption or production
Regional production
84.9 million tonnes
Regional consumption
103.0 million tonnes
Imports from the rest of the world
19.0 million tonnes
RMI
118.6 million tonnes
Regional material inputs and consumption
RMI/cap
22.5 tonnes
RMC
56.9 million tonnes
RMC/cap
10.8 tonnes
Imports fromother UK regions
60.6 million tonnes
Exports toother UK regions
57.4 million tonnes
Exports tothe rest of the world
4.1 million tonnes
Fig 1 Material flows of the West Midlands
Households 36.0
Capital investment 10.4
Residual material flows* 56.6
*including transformation stock changes and waste
50
AnalysisThe West Midlands’ Ecological Footprint
is marginally lower (by 3 per cent) than the
UK average, with a higher impact for food
consumption and energy use and a lower
impact for goods and services and
transport. West Midlands residents also buy
fewer things such as electrical equipment,
newspapers and other daily consumables.
This results in lower emissions for
both consumables and durable items
(16 per cent below the national average).
Like most other regions and devolved
countries, car use dominates CO2
emissions related to transport (74 per cent
of the transport total – slightly higher than
the national average). Household gas and
electricity consumption is also significant,
and car and household energy use combine
to represent 35 per cent of the region’s
total CO2 emissions from consumption,
compared with the national average of
37 per cent.
5W
ES
TM
IDL
AN
DS West Midlands
Material flow
Total Regional Material Input (RMI – the total
tonnes of materials used in the region’s
economy) and Regional Material
Consumption (RMC – the total tonnes
of materials used up in the region) in the
West Midlands are just below the regional
average in the UK: 22.5 t/cap and
10.8 t/cap respectively. With regional
material production being comparatively low
(the third smallest) at 7.39 t/cap of materials
(33 per cent of RMI), 67 per cent of RMI
input was provided by imports – 60.6m
tonnes from other UK regions and 19.1m
tonnes from the rest of the world. Most
prominently, the West Midlands imported
from other world regions 8.6m tonnes of
energy-producing materials, accounting for
45 per cent of total non-UK imports, as well
as 2.7m tonnes of basic and fabricated
metals and 2.1m tonnes of coke and
petroleum products. Imports from other UK
regions were dominated by products from
very different industries: 25 per cent of their
weight stemmed from publishing and
printing, while 23 per cent came from the
food, beverages and tobacco industry. Even
though the West Midlands also exported a
substantial 61.7m tonnes of materials, it still
depended on other places in the UK and
abroad on a net basis. In other words,
subtracting total exports from total imports,
the West Midlands is the third largest net
material importer across the regions with a
surplus of 18m tonnes. Due to this surplus,
the RMC is slightly higher than the RMI
when compared with other regions.
RMC and RMI take into account all
material flows that occur within the West
Midlands and implicitly assign responsibility
for these to the region. However, a
considerable amount of physical flows might
actually occur to produce the goods and
services produced elsewhere. Re-allocating
these upstream lifecycle material flows to
the region of final consumption provides
an alternative view of regional material flows
(see Figure 4).
Taking into account all the flows that
West Midlands consumers trigger in other
UK regions, within the West Midlands itself
and in the rest of the world, the average
West Midlands consumer requires a total
of 6.8t/cap of materials compared with a
national average of 7.5t/cap. This is the
third smallest in the UK (equal with Yorkshire
Services 0.36
Fixed capital 0.76
Consumables 0.54
Home & energy 1.17
Government & other 0.40
Travel 0.97
Fig 3 The West Midlands’ Ecological Footprint (gha/cap)
Food 1.16
Total
5.36 gha/cap
Fig 2 Regional Ecological Footprints (gha/cap)
Wales 5.20 South West 5.24Yorkshire & Humberside 5.30 North East 5.31 West Midlands 5.36 Scotland 5.37 North West 5.45 East Midlands 5.47 London 5.58 East of England 5.64 Northern Ireland 5.65 South East 6.29 UK Average 5.36
Material flow analysis
Ecological Footprint

Food & drink
Home & energy
Travel
Government & fixed capital
Tobacco 0.01Household tools, utensils& maintenance 0.08Newspapers, books & stationery 0.06Medical & personal products 0.10Furniture& furnishings 0.13Textiles & footwear 0.16Personal effects nec 0.20Audio visual & photo equipment 0.14Household appliances 0.18Recreational items & equipment 0.18
Consumables
Hospital services 0.02Social protection 0.04Other services nec 0.05Education 0.03Accommodation 0.06Telephone & fax 0.06Water supply 0.07Insurance & finance 0.22Recreation & culture 0.09UK residentholidays abroad 0.16
Services
Catering services 0.43
Non-alcoholic beverages 0.04Alcoholic beverages 0.06
Food 0.36
Fig 4 CO2 emissions from consumption in West Midlands (t/cap)
Total0.88 t/capUK Av. 0.87 t/cap
Total3.14 t/capUK Av. 3.10 t/cap
Total3.03 t/capUK Av. 3.03 t/cap
Total2.36 t/capUK Av. 2.44 t/cap
Total1.24 t/capUK Av. 1.46 t/cap
Total0.80 t/capUK Av. 0.90 t/cap
Transport services 0.62
Purchase of vehicles 0.34
Operation of personal transport 0.29
Private transport(car fuel) 1.11
Maintenance & repair 0.12
Gas 1.62
Actual rentals for housing 0.05
Electricity 1.24
Imputed rentals for housing 0.11
Emissionsfrom consumption
11.45 t/capUK Av. 11.81 t/cap
Territorial emissionsfrom production
9.40 t/capUK Av. 10.76 t/cap
Fixed capital 1.87
Government& other 1.16
51
and Humberside and behind only the North
East and Wales). It also compares with the
South East, which at 8.5 t/cap is the
highest in the UK, followed by London,
at 8.5 t/cap. Compared with others, the
household consumption category is quite
evenly distributed across the UK. Yet it is
the biggest driver of material production,
so even small variations in the measurement
have large ripple effects on the production
chain and total resource use.
Housing
While most individual components of the
West Midlands’ total Footprint are slightly
lower than average, some are higher.
The construction of new homes, repairing
of old ones, and use of operational energy
are the most significant components of the
West Midlands’ Ecological Footprint, and
make up a higher than average proportion
of the total Footprint. This supports earlier
findings that 20 per cent of West Midlands
households suffer from fuel poverty, due to
the poor condition of the existing housing
stock1. The remaining analysis investigates
why West Midlands housing makes up a
higher than average proportion of its
5W
ES
TM
IDL
AN
DS
Sustainable development
in the West Midlands
> The region is transitioning from a
former engineering base, to a more
mixed knowledge-based economy,
although 20 per cent of the workforce
are still in manufacturing compared
to 15 per cent nationally.
> In comparison to the overall UK
economy, the West Midlands has lower
GVA and income levels and fewer
business start ups. The dynamism
of Birmingham city centre is the equal
of any, but often major financial and
professional services have gone
either to London or to Manchester
and Leeds.
> Highlights of the Regional Economic
Strategy (RES): coordinate competing
urban development agencies, diversify
business base, capitalize on region’s
universities to promote learning, create
conditions for growth, and regenerate
communities.
> Environmental improvement is
mentioned in the West Midlands’ RES,
but the wider sustainable consumption
and production theme does not appear
directly as a first priority.
Future implications Sustainable
consumption and production is not
a priority in the RES, which will influence
regional planning. The West Midlands’
newly trained, entrepreneurial and affluent
workforce may tend to outmigrate from
the crowded conurbation and encourage
high-Footprint development. The West
Midlands can utlize urban renaissance
strategies, introduce sustainable
consumption and production policies,
and lean on green belt constraints
to counteract this.
Overview
CO2 emissions
The average house in the
West Midlands...
> is occupied by 2.41 people, 0.4 cats
and 0.3 dogs;
> consumes 9,127 KWh of energy,
producing 5.18 tonnes of CO2;
> weighs about 150 tonnes, with another
137 tonnes for the foundations;
> lasts for about 60 years;
> requires 0.50 tonnes of materials each
year for maintenance and repair; and
> uses energy derived from natural gas
(66 per cent) and electricity
(24 per cent).
1 UK government Sustainable Development Indicators:
www.sustainable-
development.gov.uk/indicators/regional/2003/h04.htm
Ecological Footprint, material flows and
CO2 emissions.
Of the 150 tonnes required to build the
average West Midlands house, most
comprises concrete and stone. An average
4.8 tonnes of materials is consumed in the
house each year, and an extra 0.50 tonnes
continued over the page

52
The West Midlands’ Regional Spatial
Strategy (RSS) plays a key role in deciding
how future housing will be provided.
Planning decisions about housing distrib-
ution, location and type of development
will make or break the urban and rural
renaissance agendas. They will also have
profound affects on future CO2 emissions
and the region’s Ecological Footprint.
Designing for efficiency
in new housing
Many houses in the West Midlands are
poorly insulated, leading to high CO2
emissions from consumption. Some houses
are impossible to make more efficient; for
instance, most Victorian houses have solid
wall construction, so cavity wall insulation
is out of the question. Often it is difficult
to retrofit a house if it has not been
designed with energy efficiency in mind.
However, designers can include options
for efficiency in new housing. Various steps
that require no lifestyle change by the
occupants can be taken to make a
house much more efficient (see Figure 6).
Our analysis demonstrates the potential
savings to be made from including these
measures in housing design. It is important
to note that this is not an exhaustive list,
merely a demonstration of some Footprint-
5W
ES
TM
IDL
AN
DS Spotlight
reducing options that could become
standard features of a house design.
Interestingly, most of these options
could be fitted retrospectively, given that
the house design originally allowed for
retrofitting. This decrease in emissions
from energy consumption could be coupled
with a similar decrease from energy
production. Many local authorities have
a target of using 10 per cent renewable
energy to power new housing
developments. Combined with the energy
efficiency steps recommended above,
emissions would be reduced by
38 per cent from the current design.
Durability in housing
While many houses in the UK are not
energy efficient, numerous others are old
and durable. Even though some may be
inefficient, they last a long time, and the
emissions and Footprint impacts of their
construction are spread out over the lifetime
of the house. Using this analysis, a house
that is energy efficient but lasts only a short
time may have the same emissions and
Footprint impacts as a house that is
energy inefficient but lasts a long time.
The benefits of building sturdy houses, in
terms of their CO2 emissions and Ecological
Footprint, can be seen right (Figure 7).
Housing, density and transport in the West Midlands
Analysis continued
0
200
600
400
800
1000
1200
1400
1600
Hot w
ater
Cookin
g
Space
heati
ng
Fig 5 Final demand sectors for energy in the West Midlands
Lights
&
appli
ance
s
CO
2 (k
g)
Other
Gas
Gas/oil
Coal
Electricity
Fig 6 Tonnes of CO2 emissions per year for a household, before and after energy saving measures are implemented
Ways to achieve increased home energy efficiencythrough design
Loft insulation (100mm-200mm)Cavity wall insulationDraught strippingDouble glazing with low ‘e’ glassFloor insulationGas central heating controlsHot water tank insulationHot water tank thermostatPrimary pipework insulationCondensing boiler
Appliances 0.8Lighting 0.54Cooking 0.24Hot water 0.37Heating 1.67
Appliances 0.8Lighting 0.54Cooking 0.24
Hot water 0.37Heating 1.67
Total per year
3.62 tonnes
Total saving in CO2 emisssions
33%
Total per year
5.48 tonnes
Before
After
is required for maintenance and remodelling.
In total, the average West Midlands house
requires 5.3 tonnes of products a year.
Building the average West Midlands
home produces 61 tonnes of CO2 –
approximately 1 tonne a year over the
lifetime of the building. Yearly emissions
from maintenance and repair add another
0.19 tonnes of CO2. However, the most
significant emissions come from direct
energy used to operate the house – around
5.38 tonnes a year. This is more than
4.5 times greater than emissions from
construction and maintenance.
Surprisingly, the building materials used in
the greatest quantities to construct a house
do not necessarily have the greatest CO2
impact. Only 2 tonnes of metal products
(1.3 per cent of the total average materials
used for home building) are used in an
average house, but these are responsible
for the most CO2 emissions occurring
during their production. Material flow tables
have allowed us to take into account such
“indirect flows” as the mining required to
extract ore, the energy to produce metal
products, and transport.2
Per unit used in the UK, gas produces
less CO2 than electricity. While gas
represents 66 per cent of all the energy
used in the West Midlands, it accounts for
only 54 per cent of its CO2 emissions from
consumption. Electricity use accounts for
24 per cent of energy used in the West
Midlands, but only 37 per cent of emissions.
These four types of energy use are similar
in terms of total CO2 emissions. More total
energy (in terms of Kilowatt hours) is used
for space and water heating, but these
rely on gas, which emits less CO2 per
Kilowatt hour.

53
adopted this ethos. The Southbank
development in Wolverhampton’s Canalside
quarter features high-density residential
space developed around an English
Heritage Grade II-listed historical building.
Advantage West Midlands – the regional
government’s redevelopment agency –
has invested a substantial portion of its
£300 million annual budget in urban
revitalisation projects, promoting city centre
living. These projects include the East Side
development in Birmingham, the Swanswell
and Electric Wharf mixed-use developments
in Coventry city centre, and St John’s Urban
Village in Wolverhampton. The Ecological
Budget UK project is analysing building
density in the West Midlands, which will be
documented in a detailed regional report
later this year.
The impact of declining
household sizes
All regions in the UK have seen a decline
in the size of households over the past
four decades. Figure 8 highlights how they
could decline to about two people per
house by 2021.
Fewer people per household means lower
energy efficiency per person. Figure 9
highlights the energy consumed in the
region by households of varying sizes3.
A household with fewer people uses
much more energy per person. In addition
to this direct energy use, fewer people per
home means more homes are required,
which increases the per capita impact of
housing construction.
The REAP analysis has calculated the
impacts of this. Maintenance, direct energy
5W
ES
TM
IDL
AN
DS
use and construction of the house have all
been taken into account.
Figure 10 indicates the potential change in
household sizes that could occur as the
average number of people per
house reduces to two by 2021.
Using these figures and combining them
with an analysis of energy requirements
helps us project the CO2 and Ecological
Footprint to 2021. The analysis suggests
that if occupancy levels are as low as
two by 2021 there would be a 13 per
cent increase in energy demand. Even as
builders seek to introduce sustainability
into design, housing will continue to have
a major impact on the CO2 emissions and
Ecological Footprint of the West Midlands
for many years to come.
2 For further information on the methodology, refer to REAP
Report 2 “The Use of Input-Output Analysis in REAP”,
available from
http://sites.wwflearning.co.uk/data/files/reap-report-no-2-
83.pdf
3 Original Data obtained from INCPEN, 2001, Towards
Greener Households: Products, Packaging and Energy,
ISBN 1901576507
Housing density and transport
Growth in the West Midlands’ low-density
rural population has meant a corresponding
growth in transport demand. The region
has been increasingly unable to cope with
its position at the hub of the national rail
network, making low-Footprint train travel
less reliable and affordable. Increased car
travel makes West Midlands urban areas
less attractive through diminished air quality
and streets that are unsafe for walking
and cycling.
As demonstrated in the regional analysis
of London, higher density development
leads to a lower Ecological Footprint,
particularly of transport. Many new
developments in the West Midlands have
0.20
030 60 90 120
0.40
0.60
0.80
1.00
1.20
Fig 7 Ecological Footprint and CO2 emissions of a building’s construction
CO
2 (to
nnes
)E
F (g
ha)
Lifetime of a building (years)
030 60 90 120
2.50
2.00
1.50
1.00
0.50
Lifetime of a building (years)
If a building lasts 30 years, the 60 million
tonnes of CO2 from its construction
average 2 tonnes a year. If a building
lasts 120 years, the average drops to
0.70 tonnes a year – an annual savings
of 1.3 tonnes of CO2 emissions. This can
be compared with the energy efficiency
saving over the same period. If the
average floor space is 98m2, the CO2
emissions of a 1900 house would be
10 tonnes a year compared with a 1982
house producing 7 tonnes – an annual
saving of 2.8 tonnes.
GJ/
pers
on/y
ear
1.00
0.50
01971 1981 1991 2001 2011 2021
150
2.00
2.50
3.00
3.50
Fig 8 The deline in the size of UK householdsFig 9 Energy consumed by West Midlands’ households
Res
iden
ts p
er h
ouse
hold
3+ p
erso
n
hous
ehold
2 pe
rson
hous
ehold
1 pe
rson
hous
ehold
Avera
ge0
50
100
200
150
Fig 10 Projected household sizes by 2021
3 8%4 9%5 4%6 1%
2 38%
1 40%
Average household
2.02 people
Averagehousehold
2.37people
2001 2021
15% 3 14% 4 5% 5 2% 6
35% 2
29% 1

SupplyMaterial supplied to
the region’s economyfor consumption
or production
DemandMaterial demanded by the region,other UK regions or the world for consumption or production
Regional production
90.6 million tonnes
Regional consumption
77.7 million tonnes
Imports from the rest of the world
9.6 million tonnes
RMI
116.1 million tonnes
Regional material inputs and consumption
RMI/cap
23.3 tonnes
RMC
41.3 million tonnes
RMC/cap
8.3 tonnes
Imports fromother UK regions
52.2 million tonnes
Exports toother UK regions
63.7 million tonnes
Exports tothe rest of the world
11.0 million tonnes
Fig 1 Material flows of Yorkshire & Humberside
Households 34.1
Capital investment 10.1
Residual material flows* 33.5
*including transformation stock changes and waste
54
AnalysisThe results for Yorkshire and Humberside
are a study in contrasts, mainly of high
production and low consumption. On the
one hand, the region is one of the highest
emitters of CO2 from production (mainly
energy production in coal-fired power
plants), emitting 13.37 tonnes of CO2
per capita. On the other hand, it has low
CO2 emissions from consumption of energy
and fuel – its 10.07 tonnes per capita is
one of the lowest for any English region.
This means that Yorkshire and
Humberside exports much of the
power and manufacturing it produces.
This phenomenon is also demonstrated
in the material flow analysis below.
Yorkshire and Humberside contains
18 per cent of the electricity generating
capacity in the UK, and produces 58 per
cent of regional greenhouse gas emissions.1
5Y
OR
KS
HIR
E A
ND
HU
MB
ER
SID
E Yorkshire and Humberside
This is primarily a result of the area’s coal
mining legacy. A large number of coal-fired
power stations – including DRAX, the
biggest coal-fired power station in the UK –
were built around the region’s supply of
coal. More recently, Yorkshire and
Humberside has become home to a
number of gas-fired plants. It is worth noting
that Yorkshire and Humberside is one the
most instructive regions in terms of the
difference between CO2 emissions from
consumption and production. Although
emissions from production are documented,
tracking emissions from consumption
makes it possible empirically to compare
the two.
Material flow
Yorkshire and Humberside has an average
Regional Material Input (RMI), amounting
to 23.4 t/cap. In contrast, it has the second
lowest Regional Material Consumption
(RMC) in the UK, with 8.3 t/cap of materials
consumed in the region. This difference
is driven by the structure of the region’s
physical trade activities. Netting out physical
imports and exports, Yorkshire and
Humberside shows an export surplus of
12.9m tonnes – only Scotland shows larger
net exports. So 84 per cent of all trade
takes place with other UK regions rather
than the rest of the world. Imports from
the rest of the world (besides the UK) are
particularly low at 2t/cap. This is the second
lowest per capita import level across
regions. These high exports and moderate
total imports mean that even though an
average amount of materials enter its
economy (RMI), most flow out again –
hence the low RMC.
Yorkshire and Humberside ties with the
West Midlands for the third lowest material
impact of household consumption in
the UK. To provide the goods and services
consumed in the region’s households,
6.8 t/cap were required across the
various lifecycle stages of production and
consumption. While only households in the
North East and Wales had a smaller impact,
this compares with 9 t/cap in the South
Services 0.37
Fixed capital 0.76
Consumables 0.58
Home & energy 1.13
Government & other 0.40
Travel 0.90
Fig 3 Yorkshire & Humberside’s Ecological Footprint (gha/cap)
Food 1.17
Total
5.30 gha/cap
Fig 2 Regional Ecological Footprints (gha/cap)
Wales 5.20 South West 5.24Yorkshire & Humberside 5.30 North East 5.31 West Midlands 5.36 Scotland 5.37 North West 5.45 East Midlands 5.47 London 5.58 East of England 5.64 Northern Ireland 5.65 South East 6.29 UK Average 5.36
Material flow analysis
Ecological Footprint

55
East and 8.4 t/cap in London. In contrast to
other categories, household consumption
is quite evenly distributed across the UK.
Yet it is the biggest driver of material
production, so even small variations in the
measurement have large ripple effects on
the production chain and total resource use.
Different types of consumption
Due to lower consumption of gas and
electricity, CO2 emissions from household
energy use are lower in the region than the
national average. There is a similar pattern
for transport, which is responsible for lower
emissions and a decreased Ecological
Footprint. The region’s residents still rely
on cars as the main mode of transport,
but they travel less than the average UK
resident each year. As with the surrounding
northern regions, residents simply consume
less and rely less on services. This is in
sharp contrast to many of the UK’s
southern regions.
5Y
OR
KS
HIR
E A
ND
HU
MB
ER
SID
E
Sustainable Development in
Yorkshire and Humberside
> Yorkshire and Humberside includes the
growth hubs of Leeds and York, the
old industrial areas of South Yorkshire
and the Humber, the large shire county
areas of North Yorkshire; and the two
national parks where development is
highly constrained.
> The Yorkshire and Humberside
Regional Development Agency is
outwardly supportive of sustainable
development principles, particularly
in developing renewable energy.
> Its Regional Economic Strategy (RES)
makes priority for manufacturing and
industrial clusters.
> The RES aims to put 10,000 young
people into jobs, and fosters a pro-
active partnership with employers and
training organizations to make the
most of the labour market.
> In Yorkshire and Humberside’s
Regional Development Agency, there
is strong emphasis on urban design
as an enabler of investment in a series
of market towns, and on Urban
Regeneration Companies as the
catalyst for transforming the secondary
cities of Sheffield, Bradford and Hull.
Future implications Yorkshire and
Humberside’s air travel increase will
continue to grow as a perceived gap
in aviation capacity is filled. Some
progressive urban transit schemes are
pending government approval. The region
will also continue to experience the
familiar storyline of increased congestion
on motorways and trunk roads. The
Regional Development Agency’s strong
emphasis on urban design as an enabler
of investment in a series of market towns
– and on Urban Regeneration Companies
as catalysts – will continue to transform
the secondary cities of Sheffield,
Bradford and Hull.
Overview
1 Source: Regional Greenhouse Gases Emissions
Monitoring and Modelling Study – update of baseline
2003 – Cambridge Econometrics
CO2 emissions
Food & drink
Home & energy
Travel
Government & fixed capital
Tobacco 0.02Household tools, utensils& maintenance 0.09Newspapers, books & stationery 0.06Medical & personal products 0.10Furniture& furnishings 0.13Textiles & footwear 0.14Personal effects nec 0.20Audio visual & photo equipment 0.17Household appliances 0.21Recreational items & equipment 0.17
Consumables
Hospital services 0.02Social protection 0.04Other services nec 0.05Education 0.03Accommodation 0.07Telephone & fax 0.06Water supply 0.07Insurance & finance 0.17Recreation & culture 0.10UK residentholidays abroad 0.18
Services
Catering services 0.44
Non-alcoholic beverages 0.03Alcoholic beverages 0.06
Food 0.35
Fig 4 CO2 emissions from consumption in Yorkshire & Humberside (t/cap)
Total0.89 t/capUK Av. 0.87 t/cap
Total3.01 t/capUK Av. 3.10 t/cap
Total3.03 t/capUK Av. 3.03 t/cap
Total2.03 t/capUK Av. 2.44 t/cap
Total1.30 t/capUK Av. 1.46 t/cap
Total0.80 t/capUK Av. 0.90 t/cap
Transport services 0.64
Purchase of vehicles 0.28
Operation of personal transport 0.24
Private transport(car fuel) 0.86
Maintenance & repair 0.13
Gas 1.54
Actual rentals for housing 0.06
Electricity 1.16
Imputed rentals for housing 0.13
Emissionsfrom consumption
11.07 t/capUK Av. 11.81 t/cap
Territorial emissionsfrom production
13.37 t/capUK Av. 10.76 t/cap
Fixed capital 1.87
Government& other 1.16
Food is the one exception to Yorkshire and
Humberside’s low Ecological Footprint and
low CO2 emissions from consumption. The
region’s high CO2 emissions and Footprint
from food mainly reflects people’s high
consumption of meat, which has a higher
Footprint than crops. In summary, there is a
significant contrast between production and
consumption results.
This demonstrates the importance of a
region-specific understanding of resource
use and CO2 emissions from both the
production and consumption point of view.

but from high production which is driven
by consumption elsewhere. This means that
increasing production efficiency can have a
large impact on reducing the UK’s overall
CO2 emissions. The Climate Change Action
Plan document highlights a number of
emission reduction projects in the region;
additional assessment with Ecological
Budget UK indicators (CO2 and Ecological
Footprint) can help assess the relative
success of these projects.
The Ecological Footprintof biomassYorkshire’s Climate Change Action Plan
identifies biomass (fuel created from any
recently living organism such as crops or
chipped wood) as an alternative energy
source to fossil fuels in the region. Biomass
could be integrated into the present energy
production infrastructure as it releases
almost no CO2 compared with fossil fuels.
Through a CO2 emissions analysis and an
Ecological Footprint analysis of biomass,
we concluded that its advantage is that it
does reduce CO2 emissions substantially.
The disadvantage is that it delivers very
little Ecological Footprint savings.
At present, the Ecological Footprint
and CO2 emissions results for Yorkshire
and Humberside follow many of the same
contours. This is because of a heavy
reliance on fossil fuels that is represented
in both indicators. Using biomass
extensively in the region would make
differences appear between the two
indicators. Carbon dioxide emissions would
drop. A change in the Ecological Footprint
would range anywhere from a reduction
by half to no change at all.
Figure 5 provides an insight into the
Ecological Footprint of different biomass
crops. For the sake of comparison, coal –
the current fuel of choice in Yorkshire and
Humberside – has been included in the
graph above. Apart from ethanol from maize
(which is not an option), all biomass crops
have a lower Ecological Footprint than coal.
The Footprint reduction could be less
than some might expect.
The reason for this is that the
Ecological Footprint “space” taken up by
CO2 emissions and absorption can often
be replaced by “space” taken up by
cropland and biomass refinement. Biomass
products that need more refinement to
become useful fuel have a similar Ecological
Footprint to coal. Yet biomass fuels that
can be used directly for heat generation
have considerable scope at reducing both
CO2 emissions and the Ecological Footprint.
56
In order to deal with its high CO2 production
legacy, Yorkshire and Humberside became
the first UK region to contribute to the UK
emissions reduction targets through
publishing its RES in 2002. The RES target
is to reduce greenhouse gas emissions
by at least 20 per cent between 1990
and 2010.
The region has subsequently built climate
change response plans into major regional
strategies, including the Regional Spatial
Strategy (RSS) and the overarching
regional strategic framework Advancing
Together. In 2002 Yorkshire and
Humberside also published Warming Up
the Region, a detailed assessment of the
potential impacts of climate change, and
how the region might adapt to these.
On 9 December 2005, the region launched
a full Climate Change Action Plan –
Your Climate: Yorkshire and Humberside’s
Climate Change Action Plan.2
These strategies are a critical first step.
A main target of the Climate Change Action
Plan is to integrate a concern for climate
change into a relevant regional document.
Other documents include the RSS, the RES
and waste, energy and transport strategies.
Ecological Budget UK provides detailed
information about all these sectors, and
can contribute to both processes by
suggesting realistic targets and high CO2
sectors. It also confirms that Yorkshire and
Humberside’s main contribution to CO2
emissions is not from high consumption,
5Y
OR
KS
HIR
E A
ND
HU
MB
ER
SID
E Spotlight
Climate change, CO2 and biomass in Yorkshire and Humberside
“Yorkshire and Humberside’s maincontribution to CO2 is not from highconsumption, but from high productionwhich is driven by consumption elsewhere”

Ethano
l from
maiz
eW
ood
inte
nsiv
e
Eth
anol
from
woo
d
Eth
anol
from
sug
ar c
ane
Eth
anol
from
sug
ar b
eet
Woo
d ex
tens
ive
Rap
e oi
l
Bio
gas
(land
fill g
as)
Eth
yl e
ster
of r
apes
eed
Eth
anol
from
whe
at
Eth
anol
from
woo
d
Str
aw a
s by
-pro
duct
Coa
l
Eth
anol
from
mai
ze
0
Fig 5 Ecological Footprint of different biomass crops
50
100
150
200
GW
h/ha
Woo
d int
ensiv
e
Ethan
ol fro
m w
ood
Ethano
l from
suga
r can
e
Ethano
l from
suga
r bee
t
Woo
d ex
tensiv
e
Rape o
il
Biogas
(land
fill ga
s)
Ethyl e
ster o
f rap
esee
d
Ethano
l from
whe
at
Ethano
l from
woo
d
Straw as
by-
prod
uct
Coal
57
Biomass and land use
The overall effect of using biomass for fuel,
particularly as it relates to land used for
food, is complex and needs further study.
At present, Yorkshire and Humberside
produces more than 8.5m tonnes of
agricultural products and imports
4.8m tonnes more, although only 2.8m
of these tonnes are consumed as food
by the region. The rest is eaten elsewhere,
and a substantial portion is used for non-
food products. Increasing use of biomass
could raise the demand for non-food
agricultural products.
As it is, Yorkshire has the opportunity
to reduce its food Footprint by developing
more local food supply chains (importing
and exporting less in order to eat more food
grown locally). It is unclear how biomass
would affect such efforts. In summary,
current analysis of biomass shows that its
impact is mixed. More extensive study is
needed to find out which land-use policy will
most effectively reduce CO2 emissions and
the Ecological Footprint. How best to use
5Y
OR
KS
HIR
E A
ND
HU
MB
ER
SID
E
land is a complex and constantly evolving
question that all UK regions face.
Prudently, Yorkshire and Humberside
is relying on multiple solutions – not only
biomass – to achieve its ambitious CO2
emission targets. Its Climate Change Action
Plan also understands the importance of
public communication. It seeks to ensure
the participation of all stakeholders who are
able to influence change. Ecological Budget
UK provides empirical evidence to assess
the current status of the programme, and
a benchmark with which to compare future
measurements. As Yorkshire and
Humberside continues to craft future policy,
Ecological Budget UK’s Resources and
Energy Analysis Program (REAP) software3
can help suggest low-Footprint, low-CO2,
low-resource options.
2 This programme was launched just before publication of the
Ecological Budget UK report. See more at
www.yourclimate.org
3 For more about REAP, see www.sei.se/reap
“Current analysis ofbiomass shows thatits impact is mixed.More extensivestudy is needed tofind out which land-use policy will mosteffectively reduceCO2 emissions and the EcologicalFootprint”

SupplyMaterial supplied to
the region’s economyfor consumption
or production
DemandMaterial demanded by the region,other UK regions or the world for consumption or production
Regional production
33.0 million tonnes
Regional consumption
29.5 million tonnes
Imports from the rest of the world
6.7 million tonnes
RMI
31.8 million tonnes
Regional material inputs and consumption
RMI/cap
18.8 tonnes
RMC
17.6 million tonnes
RMC/cap
10.4 tonnes
Imports fromother UK regions
3.9 million tonnes
Exports toother UK regions
6.3 million tonnes
Exports tothe rest of the world
7.8 million tonnes
Fig 1 Material flows of Northern Ireland
Households 11.8
Capital investment 3.0
Residual material flows* 14.7
*including transformation stock changes and waste
58
AnalysisMaterial flowThe various sectors of Northern Ireland’smaterial flows are almost without exceptionthe smallest compared with other parts ofthe UK. This is true both per capita and interms of total material flows. NorthernIreland’s total Regional Material Input (RMI)and total Regional Material Consumption(RMC) is 18.9 t/cap and 10.5 t/caprespectively. This is the lowest among the three devolved administrations and all UK regions.
In household consumption (a major
component of RMC) Northern Ireland
contributes only 3 per cent to the national
total. In the capital investment component
5N
OR
TH
ER
N I
RE
LA
ND Northern Ireland
of RMC, the Province also adds the smallest
share of 2 per cent, compared with London
and the South East at 17 per cent and
15 per cent respectively.
While per capita physical trade with
other countries in the world is near the
UK average, Northern Ireland has by far
the lowest physical trade of materials with
other UK regions. Imports from and exports
to other regions amounted to 6.1 t/cap,
compared with a UK average of about
18 t/cap. Such low flows may be due to
Northern Ireland’s geographic position,
which is more isolated from Great Britain
than any other devolved administration or
region. As a result, it is likely that Northern
Ireland trades more with the Republic
of Ireland than with the rest of the UK.
The only material flow sector where
Northern Ireland shows above average
flows is in exports to the rest of the world.
All other categories, including household
consumption and capital investment,
are lower than in most of the UK’s
other regions.
CO2 emissions
For reasons mentioned below,
Northern Ireland’s current CO2 emissions
measurement from production may be
unreliable. As it is, it shows that emissions
from production in the Province are
9.16 t/cap. This would be the second
lowest in the UK, and substantially lower
than the national average of 10.76 t/cap.
Many private households in Northern Ireland
are heated by coal fires. Since these
emissions do not come from power stations
on the national grid, they may be under-
measured, even though they produce
CO2. It seems likely that Northern Ireland’s
emissions from production are actually
higher than indicated here.
Services 0.29
Fixed capital 0.76
Consumables 0.52
Home & energy 1.66
Government & other 0.40
Travel 0.88
Fig 3 Northern Irelands’ Ecological Footprint (gha/cap)
Food 1.14
Total
5.65 gha/cap
Fig 2 Regional Ecological Footprints (gha/cap)
Wales 5.20 South West 5.24Yorkshire & Humberside 5.30 North East 5.31 West Midlands 5.36 Scotland 5.37 North West 5.45 East Midlands 5.47 London 5.58 East of England 5.64 Northern Ireland 5.65 South East 6.29 UK Average 5.36
Material flow analysis
Ecological Footprint

59
Measurements of emissions from
consumption are more reliable, and reflect
domestic coal burning. Northern Ireland is
high – 12.44 t/cap versus the national
average of 11.81 t/cap, largely because
of high coal burning.
Ecological Footprint
In the same way that Northern Ireland’s
emissions from consumption are high,
its Ecological Footprint is also high, mainly
as a result of energy consumption.
At 5.65 gha/cap, its Footprint is second only
to the South East. The largest component
of Northern Ireland’s Footprint, “home and
energy” (1.66 gha/cap), is driven by
ineffective insulation and heating practices.
The food Footprint is also large
(1.14 gha/cap), as is the travel Footprint
(0.88 gha/cap) – the latter due mainly
to high car use and distance travelled.
5N
OR
TH
ER
N I
RE
LA
ND
Sustainable development
in Northern ireland
> In relation to the rest of the UK,
Northern Ireland is a small and
peripheral region with a growing
regional economy, economically linked
with the Republic of Ireland.
> Northern Ireland has continued its
recent trend of steady growth,
benefiting from greater political stability.
Since 1998 employment levels are up,
unemployment rates down and GVA
has grown steadily. At the same time,
it maintains the highest economic
inactivity rates in the UK, relatively low
skills levels in the workforce, and low
productivity.
> The ‘Economic Vision’ partnership
strategy put forth by the office of the
Secretary of State for Northern Ireland
sets out fairly typical themes: • Increase investment in Research
and Development and promote
innovation/creativity• Promote and encourage enterprise• Ensure the right skills for future
employment opportunities• Ensure a modern infrastructure
in place to support business.
Future implications In the current
Economic Vision there is emphasis only
on ‘sustainable economic development’
as the process of modernization and
moving away from public sector
dependency. In this context, the definition
of “sustainability” can be expanded for
Northern Ireland to include the impact
of development on resource flows.
Elsewhere, the strategy encourages
specific action in sectors such as
agriculture and tourism, and addresses
the energy sector, which has been
historically centred on coal. An active
Local Agenda 21 programme in the
green and community lobby will continue
to bring to the fore the environmental
impacts of resource consumption.
Overview
CO2 emissions
Food & drink
Home & energy
Travel
Government & fixed capital
Tobacco 0.02Household tools, utensils& maintenance 0.12Newspapers, books & stationery 0.06Medical & personal products 0.10Furniture& furnishings 0.15Textiles & footwear 0.18Personal effects nec 0.15Audio visual & photo equipment 0.08Household appliances 0.15Recreational items & equipment 0.22
Consumables
Hospital services 0.02Social protection 0.05Other services nec 0.04Education 0.04Accommodation 0.03Telephone & fax 0.06Water supply 0.01Insurance & finance 0.16Recreation & culture 0.08UK residentholidays abroad 0.15
Services
Catering services 0.42
Non-alcoholic beverages 0.04Alcoholic beverages 0.03
Food 0.36
Fig 4 CO2 emissions from consumption in Northern Ireland (t/cap)
Total0.86 t/capUK Av. 0.87 t/cap
Total4.53 t/capUK Av. 3.10 t/cap
Total3.03 t/capUK Av. 3.03 t/cap
Total2.16 t/capUK Av. 2.44 t/cap
Total1.22 t/capUK Av. 1.46 t/cap
Total0.63 t/capUK Av. 0.90 t/cap
Transport services 0.59
Purchase of vehicles 0.26
Operation of personal transport 0.27
Private transport(car fuel) 1.04
Fixed capital 1.87
Government& other 1.16
Maintenance & repair 0.13
Gas 2.73
Actual rentals for housing 0.04
Electricity 1.54
Imputed rentals for housing 0.09
Emissionsfrom consumption
12.44 t/capUK Av. 11.81 t/cap
Territorial emissionsfrom production
9.16 t/capUK Av. 10.76 t/cap
“In householdconsumption (a major componentof RMC) NorthernIreland contributesonly 3 per cent to the national total”

The EcologicalFootprint of low-densitydevelopmentHalf of all new homes in Northern Ireland
are single family (or “single person”)
detached dwellings outside towns and
cities. In terms of energy, transport and
built-up land, low-density development
has an intrinsically higher Footprint than
development closer to city centres.
Heating is less efficient than in terraced
houses or flats. Building is often on land
that could be used for food production
or green space. Most dramatically, low-
density development increases Northern
Ireland’s already high dependency on the
car, which always has a Footprint higher
than any other form of local transport.
60
Driven by new investment, the physical
transformation of Northern Ireland over
the past 10 years has been dramatic.
This change is expected to continue with
heavy investment in public infrastructure,
offices, hotels and residential property.
The Northern Ireland administration’s
investment strategy for the next
10 years envisages an expenditure of
some £16 billion on critical improvements.
This includes £3.3bn on schools,
£2.2bn for health facilities, £2bn in public
housing and £2bn on water supply and
sewage treatment.
Given the comparatively low
investment in the Province’s infrastructure
and economy and a lack of social and
economic opportunity over the last
30 years, regeneration is necessary and
exciting. Northern Ireland’s regeneration
plan can invest in both sustainable and
unsustainable infrastructure.
5N
OR
TH
ER
N I
RE
LA
ND Spotlight
Development of road transport
The administration’s strategy in general
affirms sustainable development, although
many projects in the budget will drastically
increase Northern Ireland’s Ecological
Footprint. More than £2bn is allocated to
road transport development – driven by
suburban development – while less than
a quarter of that sum is planned for
lower-Footprint options such as rail,
bus and cycling.
Northern Ireland is already heavily
reliant on road transport. This accounts
for 31 per cent of its CO2 emissions,
overtaking energy production as the single
largest contributor, the only part of the UK
where this is the case. It is also the only
part of the UK in which domestically-
produced greenhouse gas emissions are
still rising: they were 2 per cent higher
in 2002 than in 1990.
Studies suggest that increasing urban
roadway capacity tends to generate
additional peak-period trips that would
otherwise not occur, in effect negating
reductions in traffic congestion. This
consists of a combination of diverted
vehicle trips (trips shifted in time, route and
destination), and induced vehicle travel
(shifts from other modes, longer trips and
new vehicle trips). Over time, “generated
traffic” often fills a significant portion
(50-90 per cent) of added urban roadway
capacity1.2 Figure 5 summarises the results
of various studies that measure the amount
of added urban roadway capacity that is
filled with induced travel.
Most studies conclude that the additional
road space is “filled” within three years.
This partly explains why Northern Ireland is
facing a potential increase in the Ecological
Footprint of personal travel over the
next 10 years3.
Regeneration in Northern Ireland
Fig 5 Portion of new capacity absorbedby induced traffic
Author Short-term Long-term(3+ years)
SACTRA 50-100%
Goodwin 28% 57%
Johnson and Ceerla 60-90%
Hansen and Huang 90%
Fulton, et al. 10-40% 50-80%
Marshall 76-85%
Noland 20-50% 70-100%

61
Also in Belfast, Cavehill Primary School
is housed in an energy-efficient building
that includes passive solar design, high-
efficiency gas boilers, maximum daylight
usage, photovoltaic cells and rainwater
harvesting. And one of the UK’s largest
renewable energy plants has been opened
in County Fermanagh, producing an
innovative biomass fuel.
The Ecological Footprint
of efficient housing
Figure 6 highlights the benefits that can
be achieved by setting an EcoHomes
“excellent” standard for new buildings.
Modifying and implementing public policy
is a challenging process. However, the
above analysis shows the potential benefits
of building more energy efficient homes:
an average home built according to 2002
UK standards has a lower Footprint than
does the general UK housing stock.
5N
OR
TH
ER
N I
RE
LA
ND
1 Hansen, M. and Huang, Y., 1997, “Road Supply and
Traffic in California Urban Areas,” Transportation Research
A, Vol. 31, No. 3, 1997, pp. 205-218.
2 Noland, R., 2001, “Relationships Between Highway
Capacity and Induced Vehicle Travel,” Transportation
Research, A, Vol. 35, No. 1, January 2001, pp. 47-72;
also available at www.epa.gov/tp/trb-rn.pdf.
3 Data obtained from: “A Position Report on the Future
Investment Needs of the Northern Ireland Railway
Network (2004). Available from:
www.foe.co.uk/resource/consultation_responses/future_rai
lway_investment.pdf
Sustainable building
Some projects in the Northern Ireland
administration’s initiative will reduce its
Ecological Footprint. The school-building
programme proposes that new schools
be designed according to the best possible
sustainable construction practices.
The Department of Education also seeks
to operate its schools more sustainably
and to incorporate sustainable
development as a key theme in the
curriculum. This demonstrates the potential
of government agencies to reduce their
own Footprint, and in the process to set
a benchmark for the region. Another of
the administration’s initiatives, worth £50m
over the next two years, envisages Northern
Ireland taking a UK lead in developing
renewable energy technologies, including
wind, tidal and biomass systems.
There are other movements towards low-
Footprint regeneration in Northern Ireland.
In Belfast, a new £11m comprehensive
community treatment and care centre
is being subjected to an independent
sustainability audit, the results of which
will inform similar future buildings
throughout the Province.
“The EcologicalFootprint of anEcoHomes“excellent” house is 35 per cent lessthan the typical UK house”
“Increasing urban roadway capacitytends to generate additional peak-periodtrips that would otherwise not occur”
Homes built according to the “excellent”
EcoHomes standard have a lower Footprint
than those built to 2002 standards. Overall,
the Ecological Footprint of an EcoHomes
“excellent” house is 35 per cent less than
the typical UK house.
The future of sustainable
development in Northern Ireland
Like the rest of the UK, Northern Ireland
still struggles to initiate a major shift
to sustainable regeneration, and the
temptation of growth and regeneration at all
costs may threaten its future environmental
stability. Having said that, many of the
policies and projects mentioned here
demonstrate sustainable regeneration
in Northern Ireland. Gauges such as the
Ecological Footprint and CO2 accounting
can help decision-makers differentiate
between sustainable regeneration and
simple economic expansion. Putting
sustainable development at the heart
of regeneration can achieve both
concepts at the same time.
Fig 6 The Ecological Footprints of UK housing
Typic
al UK ho
uses
gha/
cap
New ho
uses
buil
t
to E
coHom
es
“Exc
ellen
t” sta
ndard
New ho
uses
buil
t to
2002
Stan
dard
s
Building a house
Transport
Energy
0
0.20
0.60
0.40
0.80
1.00
1.40
1.20
1.60
DIGITALVIS ION

SupplyMaterial supplied to
the region’s economyfor consumption
or production
DemandMaterial demanded by the region,other UK regions or the world for consumption or production
Regional production
194.0 million tonnes
Regional consumption
193.2 million tonnes
Imports from the rest of the world
7.1 million tonnes
RMI
193.5 million tonnes
Regional material inputs and consumption
RMI/cap
38.2 tonnes
RMC
97.0 million tonnes
RMC/cap
19.1 tonnes
Imports fromother UK regions
20.8 million tonnes
Exports toother UK regions
14.7 million tonnes
Exports tothe rest of the world
81.7 million tonnes
Fig 1 Material flows of Scotland
Households 36.9
Capital investment 13.4
Residual material flows* 142.9
*including transformation stock changes and waste
62
AnalysisAlthough the consumption patterns of
people in Scotland result in an Ecological
Footprint and carbon dioxide emissions
from consumption that are similar to the
UK average, a breakdown by household
activities does show variation. Scotland
has a lower than average Footprint for food,
housing, services and holiday activities,
but its CO2 emissions are higher for
household energy.
CO2 emissions
Scotland’s CO2 emissions from production
and consumption are very similar. On a per
capita basis, its territorial emissions are
higher than the UK average and its
CO2 emissions from consumption are lower.
CO2 emissions from household energy
consumption are higher than the UK
average: 3 t/cap compared with an average
5S
CO
TL
AN
D Scotland
of 2.75 t/cap. This may be partially due to
Scotland’s colder climate. Even though
much of Scotland is rural, it emits only 1.3
tonnes of CO2 from transport, compared
with the UK average of 1.7 t/cap.
Material flow
Imports and RMI Scotland’s material flow
picture is distinctive from its Ecological
Footprint and CO2 emissions.1 Total and per
capita, Scotland has the highest Regional
Material Input (RMI) in the UK, amounting
to 193.6m tonnes or 38.22 t/cap.
This compares with a regional average
of 24.17 across the UK.
The high RMI figure is mainly driven
by the high level of material extraction
in Scotland – some 25 per cent (165.5m
tonnes) of the overall extraction in the
UK. Most of this is North Sea oil extraction,
which accounts for almost all the 119.9m
tonnes of materials from the mining and
quarrying sector specialised on energy
carriers – 64 per cent of the total RMI.
Another 34.7m tonnes is added by all
other activities in the mining industry.
However, imports contribute comparatively
little to the high RMI figure. Imports to the
rest of the world are the smallest and
imports from other UK regions are second
smallest across the UK at 1.41 t/cap
(compared with a national average of 3.5
t/cap) and 4.13 t/cap (compared with
a national average of 9.0 t/cap) respectively.
Although it does not contribute significantly
to overall material flows, Scotland is
the largest producer of fish in the UK.
Two thirds of UK fish catches come from
Scotland – a mass flow of 609,000 tonnes.
Only 82,000 tonnes of fresh fish are directly
exported to other regions in the UK
or abroad. Most is processed into fish
products, which are then either exported
or consumed.
Services 0.33
Fixed capital 0.76
Consumables 0.67
Home & energy 1.20
Government & other 0.40
Travel 0.95
Fig 3 Scotland’s Ecological Footprint (gha/cap)
Food 1.06
Total
5.37 gha/cap
Fig 2 Regional Ecological Footprints (gha/cap)
Wales 5.20 South West 5.24Yorkshire & Humberside 5.30 North East 5.31 West Midlands 5.36 Scotland 5.37 North West 5.45 East Midlands 5.47 London 5.58 East of England 5.64 Northern Ireland 5.65 South East 6.29 UK Average 5.36
Material flow analysis
Ecological Footprint

63
Exports and RMC While Scotland’s
imports rank among the lowest in the UK,
no other region exports as much to the rest
of the world. Driven by 59m tonnes of sales
in oil and other energy carriers, Scotland
exported 81m tonnes – 42 per cent of the
UK’s total exports – to other parts of the
world in 2001. At the same time, however,
per capita exports to other UK regions were
smallest at 2.91 tonnes, compared with a
national average of 9.0 tonnes. In this
sense, Scotland shows a typical physical
trade pattern for the devolved countries,
being more involved in world trade than in
intra-UK trade compared with the English
regions.
Overall, the indicated trade patterns lead
to a physical export surplus for Scotland of
68.5m tonnes across the regions. This is
not only the highest in the UK, but it also
compares with net imports of 11.8m tonnes
on the national level. This huge export
5S
CO
TL
AN
D
surplus leads to the largest difference
between the RMI and Regional Material
Consumption (RMC)2 estimate across the
regions. However, the high level of regional
material extraction still leaves Scotland with
the highest RMC figure of 19.17 t/cap,
compared with a regional average of 11.7
across the UK.
Sustainable Development
in Scotland
> Scotland has a dynamic economy,
and at the same time continues to
have low productivity, the highest rate
of child poverty in the UK, and
the extra challenge of working in
the remote highlands and islands.
> As compared to its population,
Scotland has a large overall land
area and greater access to natural
resources, but there is much wastage
and inefficiency in resource use and
industry.
> The Framework for Economic
Development in Scotland, updated
in 2004, sets out four goals:
1 Economic Growth – with growth
accelerated and sustained through
greater competitiveness in the global
economy
2 Regional Development – with
economic growth a pre-requisite
for all regions to enjoy the same
economic opportunities
3 Closing The Opportunity Gap –
social development in turn contrib-
uting to national economic prosperity
4 Sustainable Development – in econ-
omic, social and environmental terms
> This fourth goal includes a Green Jobs
strategy, and a large scale renewable
energy programme. It is yet to be seen
how this will translate to growth sectors
such as that of chemical-intensive
salmon farming on the west coast.
Meanwhile, modernization of regional
economies is expected to raise trans-
port demand and other material flows.
Future implications Scotland’s
innovative new Sustainable Development
Strategy recognises the need for a
significant shift towards more sustainable
consumption and production patterns,
and represents a change in Scottish
sustainability strategy. It prioritizes
reducing the inefficient use of resources,
exploring the impact of products and
materials across their whole lifecycle, and
encouraging people to think about the
social and environmental consequences
of their purchases. Ecological Budget
UK project results can inform these
efforts and, combined with the efforts
of many local authorities in Scotland, the
Scottish Parliament has an opportunity
to be a leader in sustainability.
Overview
1 One important difference between material flows and CO2
from emissions should be noted here: in material flows,
energy-producing materials converted into electricity are
attributed at “Regional Material Consumption” to the region
that converted them to electricity, simply because electricity
has no mass so is not considered a “material flow”. In CO2
emissions measurements, however, the same energy-
producing materials converted into electricity are attributed
as “CO2 emissions from production” to the region that
converted them into electricity. CO2 emissions from
consumption would be attributed to the region or country
that consumed the electricity. Generally, a high RMC will
mean a high Ecological Footprint, although Scotland shows
some exception to this.
2 It should be noted that Scotland’s total RMC may be
high due to inconsistent data from official sources.
The Ecological Budget UK material flow analysis relies
on the best available data, but sometimes this does not
allocate material flows exactly to all regions and devolved
countries. In 2001, for example, the official data source
allocated 90m tonnes to an “unknown” region. Much of this
uncertainty relates to oil processing, so it is likely to affect
the data for Scotland. Therefore, the RMC figure for
Scotland requires further investigation. This example also
demonstrates clearly that considerable improvements in
the tracking of resources in the UK are necessary.
CO2 emissions
Food & drink
Home & energy
Travel
Government & fixed capital
Tobacco 0.02Household tools, utensils& maintenance 0.09Newspapers, books & stationery 0.08Medical & personal products 0.11Furniture& furnishings 0.15Textiles & footwear 0.18Personal effects nec 0.22Audio visual & photo equipment 0.17
Household appliances 0.30
Recreational items & equipment 0.18
Consumables
Hospital services 0.02Social protection 0.05Other services nec 0.05Education 0.04Accommodation 0.04Telephone & fax 0.06Water supply 0.01Insurance & finance 0.18Recreation & culture 0.09UK residentholidays abroad 0.16
Services
Catering services 0.41
Non-alcoholic beverages 0.05Alcoholic beverages 0.05
Food 0.31
Fig 4 CO2 emissions from consumption in Scotland (t/cap)
Total0.82 t/capUK Av. 0.87 t/cap
Total3.24 t/capUK Av. 3.10 t/cap
Total3.03 t/capUK Av. 3.03 t/cap
Total2.32 t/capUK Av. 2.44 t/cap
Total1.48 t/capUK Av. 1.46 t/cap
Total0.72 t/capUK Av. 0.90 t/cap
Transport services 0.68
Purchase of vehicles 0.29
Operation of personal transport 0.26
Private transport(car fuel) 1.08
Maintenance & repair 0.10
Gas 1.41
Actual rentals for housing 0.06
Electricity 1.54
Imputed rentals for housing 0.13
Emissionsfrom consumption
11.61 t/capUK Av. 11.81 t/cap
Territorial emissionsfrom production
11.49 t/capUK Av. 10.76 t/cap
Fixed capital 1.87
Government& other 1.16

Fig 5 The Ecological Footprint of different fuels
120
100
80
60
40
20
0
CoalFu
els
Natura
l gas
Misc
anth
us
Wate
r
Woo
d ex
tensiv
e
Woo
d int
ensiv
e
Photo
volta
icW
ind
Solar h
eatin
g
A commitment torenewable energy: the 2003 PartnershipAgreement betweenScotland’s Labour and Liberal Democratparties“We will work towards our target for
40 per cent of Scottish electricity
generation to be from renewable energy
sources by 2020. We will support the
development of wave, tidal and solar
energy and support the development
of technologies to promote the greater
use of fuel from wood and other energy
crops. We will press the UK government
and electricity companies to strengthen
the electricity grid. We will encourage
participation in renewable energy projects
by communities and local authorities.”
64
Scotland produces 11 per cent of the UK’s
total CO2 emissions,3 and produces more
energy from oil, gas and coal than it
consumes. Because the rest of the UK
consumes these fuels, changing Scotland’s
energy sources from fossil fuels to
renewable energy would contribute
significantly to lowering the UK’s overall
CO2 emissions.
Many Scottish politicians already aspire
to make Scotland the “renewable energy
capital” of the UK by harnessing its
impressive renewable sources – wind,
hydro, wave, tidal and biomass. The ruling
coalition (Labour and Liberal Democrat)
appears genuinely committed to promoting
renewable energy in Scotland, as does
the Scottish National Party, the Greens and
the Scottish Socialists. The government also
sees developing renewable energy as a way
to promote economic growth, particularly
in rural areas that are short of jobs.
The Yorkshire and Humberside case
study (see pages 56-57) assessed the
impacts of using biomass for energy and
found that it may be beneficial in terms
of CO2 emissions, but not always in terms
of Ecological Footprint. The analysis in
Figure 5 compares the Ecological Footprint
of other kinds of renewable energy and
shows the various benefits of renewables.
With the exception of biomass,
CO2 emissions savings are similar.
Efforts are slowly moving forward to
produce and use less CO2-intensive energy
in Scotland. The Scottish Parliament
5S
CO
TL
AN
D Spotlight
published an Energy Efficiency Strategy
in early 2006 and is due to update its 2000
Climate Change Programme. This plans
for increased reliance on renewable energy,
and may commit Scotland to domestic
CO2 reduction targets for the first time.
It is hoped that the Resource and
Energy Analysis Program (REAP)
will contribute to the analysis of these
strategies, assessing the effectiveness
of the adopted policies.
The role of renewables and
micro-generation in eliminating
“fuel poverty”
The Parliament also seeks to eradicate
“fuel poverty” by 2016 – giving all people
in Scotland access to adequate energy.
So far, this strategy has not relied
on efficiency or renewables; it depends
on cheap fuel, available to more people
with rising incomes, provided by wider
Renewable energy in Scotland
connection to the national natural gas
grid. Given the rising price of fossil fuels,
this strategy will become less tenable,
and renewable energy will become
more competitive.
Another low-CO2 cost-effective
alternative to fossil fuels is microgeneration
– the generation of heat or electricity at
the community or household level instead
of in large centralised generating plants.
It is particularly cost-effective in rural
areas, of which Scotland has many.
Microrenewables take pressure off
the centralised and usually CO2-based
production grid and still deliver energy.
A great deal of money is spent on
eradicating fuel poverty; in future, this
money might instead drive the develop-
ment of renewables and microrenewables.

65
liquefied gas is transported to the town via
road. All the renewable fuel is being sourced
locally and many “green” jobs are being
created. It is estimated that the scheme
will save around 5,000 tonnes of CO2 over
its lifetime of 25 years and the cost savings
will be around £2m to the end users.
REAP in ScotlandThe Resource and Energy Analysis Program
(REAP) is being piloted by a number of local
authorities in Scotland – Aberdeen City,
Aberdeenshire, and North Lanarkshire
Councils. Using REAP, they will produce
a baseline assessment of their
CO2 emissions and Ecological Footprint,
and assess the Footprint and CO2 impacts
of transport strategies, development and
other future scenarios.4
The three-year project, running to
June 2007, is:
> measuring the footprint of each local
authority area;
> developing a software tool for policy-
making;
> developing a strategy and projects
to reduce the footprint; and
> producing education materials for schools
to measure a “whole school” footprint.
5S
CO
TL
AN
D
3 Key Environment Statistics 2005, Scottish Executive
Publication www.scotland.gov.uk/
Publications/2005/08/15135632/56521#2
4 For further information visit www.scotlandsfootprint.org
Regional case study:WickA number of projects across the UK have
demonstrated the advantages of local
energy systems based on community
heating. For the domestic sector, heat
generation is by far the most significant
issue related to CO2 emissions. Community
heating links buildings with homes via a
system of pipes known as the heat network,
with heat provided from a central source.
Sustainable fuel sources can be used, and
a serious reduction in energy lost through
transmission can be achieved. Probably the
best Scottish community energy scheme
is in Wick. Led by Highland Council, it is
the largest of its kind in the UK.
The first phase of this continuing project
was to link a local distillery to 400 houses,
utilising waste heat. The second phase
will build on the existing heat network to
encompass most of the town, including
the hospital, secondary school and a further
1,000 homes. The system is using wood
fuel (forestry residue) as the source which
will generate heat and electricity through
a gasification process. They will add to
the fuel mix by incorporating gas from an
anaerobic digestion system fed by the local
fish processing plant. In terms of reducing
the CO2 Footprint, Wick is a good example:
it is currently off the gas network and
HIE / STOCKSCOTLAND.COM
“Scottish politicians already aspire to make Scotland the ‘renewable energy capital’ of the UK”
ConclusionsAlthough UK energy policy is set by
the national government, the Scottish
Parliament and local authorities can set
their own targets for CO2 reduction and
use of renewable energy as part of their
contribution to reducing the overall
UK CO2 emissions. They also administer
many other areas that influence CO2
levels – housing, planning and transport,
for example.
The energy coin always has two sides:
consumption and production. More efficient
production can be cancelled out by less
efficient consumption. However, because
Scotland produces more than it consumes,
and because of its vast capacity for
renewable energy, it stands to make
a great contribution to reducing the
overall UK CO2 emissions.
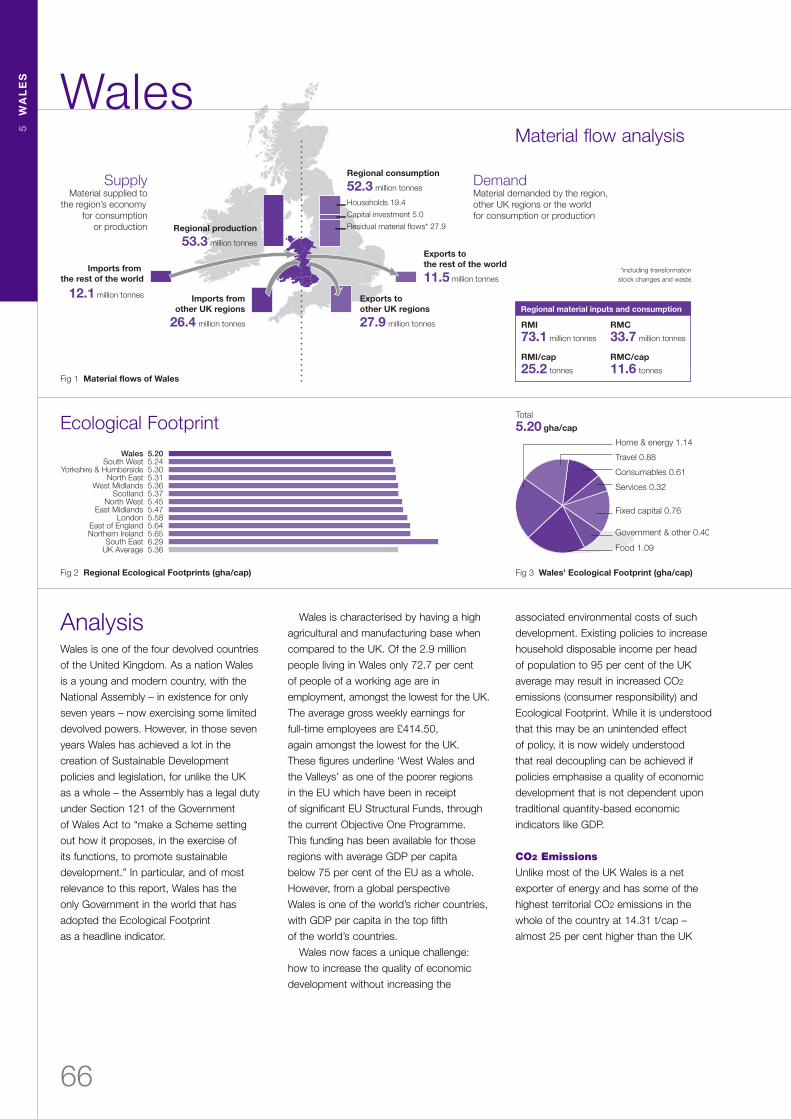
SupplyMaterial supplied to
the region’s economyfor consumption
or production
DemandMaterial demanded by the region,other UK regions or the world for consumption or production
Regional production
53.3 million tonnes
Regional consumption
52.3 million tonnes
Imports from the rest of the world
12.1 million tonnes
RMI
73.1 million tonnes
Regional material inputs and consumption
RMI/cap
25.2 tonnes
RMC
33.7 million tonnes
RMC/cap
11.6 tonnes
Imports fromother UK regions
26.4 million tonnes
Exports toother UK regions
27.9 million tonnes
Exports tothe rest of the world
11.5 million tonnes
Fig 1 Material flows of Wales
Households 19.4
Capital investment 5.0
Residual material flows* 27.9
*including transformation stock changes and waste
66
AnalysisWales is one of the four devolved countries
of the United Kingdom. As a nation Wales
is a young and modern country, with the
National Assembly – in existence for only
seven years – now exercising some limited
devolved powers. However, in those seven
years Wales has achieved a lot in the
creation of Sustainable Development
policies and legislation, for unlike the UK
as a whole – the Assembly has a legal duty
under Section 121 of the Government
of Wales Act to “make a Scheme setting
out how it proposes, in the exercise of
its functions, to promote sustainable
development.” In particular, and of most
relevance to this report, Wales has the
only Government in the world that has
adopted the Ecological Footprint
as a headline indicator.
5W
AL
ES Wales
Wales is characterised by having a high
agricultural and manufacturing base when
compared to the UK. Of the 2.9 million
people living in Wales only 72.7 per cent
of people of a working age are in
employment, amongst the lowest for the UK.
The average gross weekly earnings for
full-time employees are £414.50,
again amongst the lowest for the UK.
These figures underline ‘West Wales and
the Valleys’ as one of the poorer regions
in the EU which have been in receipt
of significant EU Structural Funds, through
the current Objective One Programme.
This funding has been available for those
regions with average GDP per capita
below 75 per cent of the EU as a whole.
However, from a global perspective
Wales is one of the world’s richer countries,
with GDP per capita in the top fifth
of the world’s countries.
Wales now faces a unique challenge:
how to increase the quality of economic
development without increasing the
associated environmental costs of such
development. Existing policies to increase
household disposable income per head
of population to 95 per cent of the UK
average may result in increased CO2
emissions (consumer responsibility) and
Ecological Footprint. While it is understood
that this may be an unintended effect
of policy, it is now widely understood
that real decoupling can be achieved if
policies emphasise a quality of economic
development that is not dependent upon
traditional quantity-based economic
indicators like GDP.
CO2 Emissions
Unlike most of the UK Wales is a net
exporter of energy and has some of the
highest territorial CO2 emissions in the
whole of the country at 14.31 t/cap –
almost 25 per cent higher than the UK
Services 0.32
Fixed capital 0.76
Consumables 0.61
Home & energy 1.14
Government & other 0.40
Travel 0.88
Fig 3 Wales’ Ecological Footprint (gha/cap)
Food 1.09
Total
5.20 gha/cap
Fig 2 Regional Ecological Footprints (gha/cap)
Wales 5.20 South West 5.24Yorkshire & Humberside 5.30 North East 5.31 West Midlands 5.36 Scotland 5.37 North West 5.45 East Midlands 5.47 London 5.58 East of England 5.64 Northern Ireland 5.65 South East 6.29 UK Average 5.36
Material flow analysis
Ecological Footprint

67
average of 10.76 t/cap. Only the North
East exceeds this at 15.83 t/cap.
As a result of lower household
expenditure than the UK, Wales has the
lowest CO2 emissions from consumption,
again with the exception of the North East.
Such reduced consumption has resulted in
a fifth less CO2 emissions than the UK
average when measured in this way.
The fact that these emissions are lower
demonstrates that, in terms of carbon
dioxide emissions, Wales is carrying the
environmental burden for consumption
that occurs outside its territory.
Material flow
With 25.21 t/cap Wales’ Regional Material
Input (RMI) indicator is the third highest
across the UK. This is equally driven by
an above average regional production
of materials amounting to 11.93 t/cap
and an above average material import of
13.28 t/cap. For example, 21.95m tonnes
or 63.37 per cent of Wales’ regional
extraction stems from the mining of non-
energy producing materials. Excluding
5W
AL
ES
Sustainable Development
in Wales
> Wales has a mountainous terrain, and
is historically the back yard to British
imperial aspirations.
> It is a former site for coal and steel,
though is now moving into a
knowledge-based role.
> It retains its own language, but is
increasingly integrated into the English
economy, e.g. through supply chains,
tourism and second homes.
> The vision for the Regional Economic
Strategy (RES) equivalent,
A Winning Wales, is “to achieve a
prosperous Welsh economy that is
dynamic, inclusive and sustainable,
based on successful, innovative
businesses with highly skilled, well-
motivated people”. The key areas for
action to achieve this vision include:
“• increase the knowledge, research
and development, and innovation
capacity in all parts of the Welsh
economy;• help more people into jobs to bring
down our levels of economic
inactivity;• build on our considerable
strengths in manufacturing;• increase the number of jobs in
financial and business services;• encourage the development of
our country’s green economy;• promote opportunities for
Welsh companies to develop
international trade;• support the social enterprise sector
which can bring growth and opport-
unity to disadvantaged communities.”
Future implications
The regeneration of the South Wales
coalfields was a major achievement that
continues to generate new clusters of
environmental technologies. The South
Wales terrain is resistant to intensive
agriculture, and encourages small scale
eco-farming, eco-tourism and other
diversification. However, this same terrain
also makes ground transport more
difficult – for instance, linking the south
and the north of the country will probably
involve an air shuttle system. Wales’
strong national culture, language and
high-quality community life can offer
something of a counter-weight to
intensive consumerism.
Overview
material exports to the rest of the world
and the other UK regions leaves a
Regional Material Consumption (RMC)
estimate of 11.62 t/cap, which ranks
fifth across regions, but performs just
below the regional average of 11.7 t/cap.
Trade activities of Wales seem to show a
pattern quite characteristic for the devolved
countries. Like for Scotland and NI the
physical trade with other UK regions is not
so developed. Even though Wales trades
with 54.4m tonnes of materials about
20m tonnes more than Scotland and about
44m tonnes more than NI, the NE is the
only English region less involved in intra-UK
trade in total terms. However, on a per
capita basis this picture is skewed and
Wales performs just above UK average.
continued over the page
CO2 emissions
Food & drink
Home & energy
Travel
Government & fixed capital
Tobacco 0.01Household tools, utensils& maintenance 0.09Newspapers, books & stationery 0.06Medical & personal products 0.09Furniture& furnishings 0.12Textiles & footwear 0.14Personal effects nec 0.15Audio visual & photo equipment 0.18Household appliances 0.19Recreational items & equipment 0.22
Consumables
Hospital services 0.02Social protection 0.04Other services nec 0.05Education 0.03Accommodation 0.05Telephone & fax 0.05Water supply 0.08Insurance & finance 0.15Recreation & culture 0.10UK residentholidays abroad 0.15
Services
Catering services 0.37
Non-alcoholic beverages 0.04Alcoholic beverages 0.07
Food 0.34
Fig 4 CO2 emissions from consumption in Wales (t/cap)
Total0.82 t/capUK Av. 0.87 t/cap
Total3.08 t/capUK Av. 3.10 t/cap
Total3.03 t/capUK Av. 3.03 t/cap
Total2.14 t/capUK Av. 2.44 t/cap
Total1.25 t/capUK Av. 1.46 t/cap
Total0.72 t/capUK Av. 0.90 t/cap
Transport services 0.58
Purchase of vehicles 0.24
Operation of personal transport 0.29
Private transport(car fuel) 1.04
Maintenance & repair 0.11
Gas 1.62
Actual rentals for housing 0.04
Electricity 1.22
Imputed rentals for housing 0.09
Emissionsfrom consumption
11.04 t/capUK Av. 11.81 t/cap
Territorial emissionsfrom production
14.31 t/capUK Av. 10.76 t/cap
Fixed capital 1.87
Government& other 1.16
1 Source for data: Office for National Statistics, Wales.
Selected Key Statistics and Regional Profile (2005)
2 WAVE. Wales A Vibrant Economy. Strategic Framework for
Economic Development Consultation Document (2005).
3 Reducing Wales’ Ecological Footprint: Report Summary.
SEI and WWF. 2005.

Relevant WelshAssembly Governmenttargets and policy> Second Organic Action Plan for Wales
2005-2010 – “10-15 per cent of
agricultural land in Wales to be organic
or in-conversion by the end of 2010”
> Food and Well Being: Reducing
inequalities through a nutrition strategy
for Wales – “Knowledge of
recommended number of portions
of fruit and vegetables, and correct
estimation of a portion size will
increase by 10 per cent from
31 per cent by 2005”
68
5W
AL
ES Spotlight
Food production and consumption
is the basis for a significant proportion
of our material flows and waste production,
and is the single largest component of
the Ecological Footprint of Wales, as
it is in the UK.
Over the last 50 years, our relationship
with food has changed considerably.
The food we eat has hidden impacts on
the world around us. We have become used
to year round produce flown thousands
of miles across the globe, cheaply available
in vast supermarkets. The production
of food in farms has become increasingly
mechanised, large-scale and more
specialised, and food supply-chains
have become more complicated and
transport-intensive.
Food retailing has become concentrated
within a small number of multiple retailers,
with many of their stores located away from
the traditional high street, now accounting
for over three-quarters of food sales.
Takeaway food and ready-to-eat meals
are now very popular. All these changes
have influenced the resource production,
consumption and environmental impacts
of the Welsh food and farming system.
Scenarios for food
and farming in Wales
The Welsh Assembly Government has
acknowledged these changes to our
production and consumption of food, and
has recommended that “10-15 per cent
of agricultural land in Wales is to be organic
or in-conversion by the end of 2010”.1
This target is consistent with the Welsh
Assembly Government’s vision of an
innovative agri-food industry, creating high
quality, value added food products while
at the same time enhancing the biodiversity
of the Welsh countryside, supporting
tourism and the survival of the Welsh family
farm. The Welsh Assembly Government
has also developed key consumption
targets that help promote a healthier diet
through Food and Well Being: Reducing
inequalities through a nutrition strategy
for Wales (2003).
While organic farming may be one
of several approaches to delivering such
policy goals, it is the only approach that is
seriously attempting to address all of them
simultaneously. However, in the last few
years, while production and consumption
of organic food has grown rapidly in the
UK, in Wales it is still only 3.2 per cent
of all food production and 1.1 per cent
of all consumption.
Researchers at SEI undertook an
extensive analysis of the production and
consumption of food in Wales as part of
the Reducing Wales’ Ecological Footprint
Project2. This analysis has demonstrated
the importance of linking local production
and consumption systems, to deliver
integrated benefits that encompass
a reduced environmental impact of our
food and farming system and an increase
in healthy diets in the population of
Wales – especially in key target groups.
Food and farming in Wales
Analysis continued
Typically for a devolved country trade with
the rest of the world is more developed than
in most of the English regions amounting to
8.15 t/cap. In fact only London as (one of
the) the centre(s) of the UK economy is the
only English region which trades more with
the rest of the world in physical terms. At
the same time both Scotland and NI have
a higher per capita trade with ROW than
Wales. Overall, Wales’ trade balance is
almost even showing a slight export surplus
of 0.9m tonnes across industries. However,
looking at individual industries gives a much
richer picture. “Metal products” and “energy
materials” from mining are mainly exported
with a net balance of 4.8 and 1.7m tonnes
respectively, while products from
“agriculture, hunting and fishing”, “mining
and quarrying except energy producing
materials”, as well as “food, beverages and
tobacco” are mainly imported with a net
balance of 1.0m tonnes, 2.3m tonnes and
2.4m tonnes respectively. However, so
far this analysis has only looked at flows
which actually occur within the region
or which cross its political boundaries
(borders). If the regional lifestyle is to be
assessed, such a picture can be misleading,
because flows in one regions might
occur to support consumption activities
in another region without actually
crossing the region’s borders.
Looking, for example, on the lifecycle
impacts of household consumption
activities, Wales only triggers 6.7 tonnes
of materials per capita compared
to a national average of 7.5 t/cap once
all material flows are assigned to the
consuming region. This is the second
smallest material impact of households’
across UK's regions. The same is true
for capital investment, which only gives
rise to per capita flows of 1.73 tonnes
compared to a national average of
2.31 tonnes.

69
Scenario 1: Linking supply chains
The advantages of organic farming, the
current level of demand, the current policy
opportunities and Welsh Assembly
Government targets mean that organic
production should now be taken up as
a mainstream policy for Welsh agriculture.
The scenarios constructed by SEI
explore what would happen if the target
was reached and if the organic food
produced was also consumed in Wales.
The area of organically managed farmland
in Wales has increased significantly from
under 1 per cent in 1998 to 4 per cent,
or 58,000 ha, in 2002. However, growth
has stagnated leaving a major challenge
to achieve the objective. If the ambitious
target of 15 per cent organic production
by 2010 was achieved and if further growth
in organic production can be maintained
until 2020, there would be a reduction
in the Ecological Footprint of 11 per cent.
5W
AL
ES
Scenario 2: Changing diets
An increase in organic food production
and consumption is not enough: it’s not
just about the quality of the food we eat
but also what types of food our diets are
composed of. This is where the nutrition
strategy complements the organic strategy,
highlighting the need for complementary
approaches. The scenario exploring the
potential reduction due to eating fresh,
seasonal, organic food with a low-meat
diet reduced the Ecological Footprint
from 1.24 to 0.89 gha/cap (a reduction
of 30 per cent). By achieving key policy
objectives, we can also achieve direct health
benefits and could also indirectly contribute
to ecological sustainability. The scenario
results also suggest that a healthy diet
will usually have a low Ecological Footprint
meaning benefits to the individual and
the environment.
1 Second Organic Action Plan for Wales 2005-10,
Welsh Assembly Government, 2004.
2 Barrett, et al., 2005, Reducing Wales Ecological
Footprint, WWF Cymru.
3 www.materialhealth.com
High
Low
Present Ecological Footprint of food production
Fig 5 Ecological Footprint reduction for Organic Food Target
11%reductionpossible
Footprint by 2020 if an ambitious strategy for organic food productionis adopted
High
Low
Present average EcologicalFootprint of food consumption
Fig 6 Ecological Footprint reduction for Changing Diets Scenario
Footprint friendly diet
up to
30%reductionpossible
Conclusions
The ability to link both organic
production and consumption is crucial.
Simply increasing the proportion of organic
agriculture doesn’t result in a reduction
in the Ecological Footprint. This is a strong
indication that a reduced environmental
impact relies as much on the quality of the
food we eat as on what types of food make
up our diets. The best approach is
a complementary one: combining both the
nutrition strategy with an organic strategy.
To increase the procurement of organic
food products in Wales it is realised that
there needs to be a reliance on existing
supply chains. Two major supply chains
that could be explored are the NHS and
schools. Both are large purchasers of food
and could potentially purchase a large
proportion from the Welsh organic market.
A recent study of the NHS3 demonstrated
that over 53, 256 tonnes of food were
purchased in 2001, and it is estimated
that Welsh hospitals consume around
4,000 tonnes. This suggests that significant
capacity is already available. Apart from
certain product groups – for example
tropical fruits – Welsh agriculture has
the ability to produce sufficient volumes
to cover demand if all food in the NHS
were to be organic and local.
LEFT & MIDDLE; IAN HOMER / WWF-UK, ABOVE; COLLECTIONS/F IONA PRAGOFF

70
Ecological Budget UK provides a far-
reaching “SCP framework” to help analyse
the supply chains in consumption and
production. This framework underpins each
“activity sector” such as food, housing,
transport, products and so-on, and the
policy options for the SCP agenda.
SCP trends and targets
The first issue is to define sustainable
consumption and production, then to
see how Ecological Budget UK can help
measure it, assess trends and targets and
set priorities. Further discussion of
alternative trends, targets and strategies
are contained in the parallel report
Strategy for a One Planet Economy.
One Planet Economy
The summary of the evidence so far shows
that:
> the Ecological Footprint measure reveals
that consumption, mainly by wealthy
nations, is using up the Earth’s resources
at several times their share;
> as a service-led economy, the UK is now
exporting our environmental burdens by
importing goods from overseas;
> the UK government has set a long-term
target for a 60 per cent reduction in
climate emissions – but this should
build in the principle of global equity
(i.e. that the difference between wealthy
polluters and poor recipients needs
to be reduced);
> this then translates into a long-term goal
of 75 per cent reduction in resource use –
i.e. a Factor Four increase in resource
efficiency;1 and
> such resource efficiency improvement
can be both cause and effect of
economic growth and competitiveness.
6A
FR
AM
EW
OR
K 6 A framework for sustainableconsumption and production
When the UK economy is clearly moving
on this strategic path towards a Factor Four
step change, it will take up the challenge of
the UK Sustainable Development Strategy,
and move towards a real One Planet
Economy. As this was not defined in the
UK Strategy, we provide here a working
definition: a system of production and
consumption which respects environmental
limits, local and global, while being
economically and socially sustainable.
Timescales and targets
Clearly, the transformation of the UK into a
One Planet Economy is not going to happen
overnight. But we can define the target rate
of progress by setting the Factor Four goal
at a strategic point such as 2050, the
current horizon for UK climate policy.
> This equates to a year on year reduction
in total resource use of about -3 per cent
per year, as measured by Ecological
Footprint.
> By 2020, at this rate, the reduction in
total Ecological Footprint would be about
-40 per cent, and by 2050 about -75 per
cent.
> If we factor in long-range economic
growth at 2.25 per cent, the required
rate of decoupling or improvement in the
resource efficiency (EF/£GDP) would be
-5.25 per cent per year reduction. This is
about twice the rate of decoupling in the
recent past.
Implications for SCP
The question is, should the decoupling be
on the production or consumption side?
Recent improvements in energy efficiency in
production – for instance in vehicles – are
generally outweighed by increases in car
ownership and travel per person. This then
raises issues on consumption; on whether
people really need or want to travel greater
distances every year, or whether there are
more sustainable ways of meeting those
needs. The contribution of Ecological
Budget UK, as in the next section, is to
integrate both consumption and production
sides for a balanced view on SCP.
We can start to estimate the likely effects
of an SCP agenda on resource flows and
the shift towards a One Planet Economy.
Clearly, there would be changes right
through the supply chain. Input of raw
materials would be greatly reduced, as
would energy in distribution and manufac-
turing. Added value on manufacturing and
services would increase, as would the
recycling and re-manufacturing of used
products, in a nearly zero-waste and
zero-emissions economy. At the same
time, human welfare and social equity
would increase.
For each stage in the supply chain there
are also economic implications – for firms,
sectors, consumers and the UK economy.
As explored in the Strategy for a One
Planet Economy, there are direct, indirect
and induced effects at every level.
While businesses naturally argue against
energy taxes, there is clear evidence
that competitiveness, innovation and
quality management are all stimulated by
environmental policy, as well as the obvious
environmental and social benefits.
SCP Framework
The above outline of the SCP agenda and
its implications for resource flows suggests
many questions for investigation. Which
is more important – consumption or
production? How can we measure the
effects on complex supply chains? Is it
better to replace old buildings with more
efficient new ones?
So far, Ecological Budget UK has shown a cross-section of the national economy as a whole, and the implications for regional development. Here we look at the agenda for SustainableConsumption and Production (SCP), which is at the centre of the sustainability debate.
1 Von Weizacker, E., Lovins, A.B. & Lovins, L.H., 1997,
Factor Four: Doubling Wealth, Halving Resource Use –
A Report to the Club of Rome, London, Earthscan.
2 ONS, 2005

71
6A
FR
AM
EW
OR
K
are implicated in the delivery of
products to household and government
“final demand”.
For each of these measures there is a
standard accounting arrangement for
consumption and production, as for
instance in the Blue Book tables of
UK national accounts.2 This shows the
contribution of imports, exports and capital
investment, and the supply and demand
from other industries, as in Figure 1.
A similar structure can also be followed
to show the resource flows above –
the material and energy flows – which
generate CO2 and Ecological Footprint.
In the arrangement of the economic
accounts, the total production equals
exactly the total consumption, which is
also reflected in the “mass balance”
principle of Ecological Budget UK.
SCP framework
The scheme above is a start, but does not
say very much about the multiple supply
chains involved in producing sophisticated
consumer items in a complex service-
dominated economy. A more realistic picture
of a typical supply chain, greatly simplified,
is shown by the SCP framework below
(Figure 2). The logic of this SCP framework
is to apply standard accounting practice to
the resource flow issues in the SCP agenda:
raw materials, energy, emissions, waste,
recycling and so-on. Such a framework
can only be as good as the data available:
for instance, current UK waste data does
not contain details of its material content,
its industry source or its location of origin.
So the framework shown here is greatly
simplified compared with the reality,
where many materials are used to make
many products, at many intermediate
stages, in many sectors, with many
environmental effects.
Fig 2 SCP framework
Primaryproduction
Manufactureproduction
Services‘production’
Demand:consumables
Exported/wasteemissions
Raw materialsfrom‘nature’
Energy & transportin production
Re-use & recycling
Durables
Fixed capital
Material flowEnergy flowWaste/emissions
Regional boundary
Productsin use
Energy & transport in use
Producerwaste/emissions
Consumerwaste/emissions
Exportedprimary
Exportedmanufacture
Exportedservices
Importedmanufacture
Importedprimary
Importedservices
1 2 3 4 5
Fig 1 Mass balance of consumption and production
Production
Input from ‘nature’(not costed)
Imports
Factors ofproduction
Purchasesfrom otherindustries
Supply to otherindustries
Exports
Capitalinvestment
Regional boundary
Consumptionby households
Consumptionby government
Consumption and production
balance
First we look at how consumption and
production are represented in the Ecological
Budget UK system. This shows three
main measures which are different but
interrelated, each providing a contrasting
view on resource flows and their impacts.
> CO2 emissions: this is the most common
and easily calculated resource flow, and
the most topical as the largest human
cause of climate change. As in chapter
4, this is usually measured in terms
of “production” or territorial emissions;
however, Ecological Budget UK provides
an alternative view in consumption.
CO2 is mainly generated by energy
production and consumption – in other
words energy flow, which runs in parallel
with material flow.
> Material flow: this can be measured in
Direct Material Consumption (DMC) –
the total amount of materials directly
used or consumed in the region,
excluding exports. There is also the larger
Total Material Consumption (TMC), which
includes the indirect or “hidden” material
flows generated.
> Ecological Footprint: this includes the
land area equivalent for the sequestering
of CO2 emissions plus other impacts on
bio-productive land use, and is a simpler
measure of total impact than Life Cycle
Analysis (LCA). Ecological Footprint
is allocated on the “consumption
responsibility” basis – measuring total
impacts from all material flows which

72
However, the Ecological Budget UK data
is enough to provide an outline five-stage
resource flow model of the UK and regional
economies.
> The five stages correspond to the
primary, secondary, tertiary, demand
and “externalities” classification of
economic sectors. Each type shows
a particular material intensity from
the gross tonnages of minerals and
agricultural sectors through to services
where materials are involved but of
little value compared with the human-
added value.
> Various kinds of waste streams are
shown by the shaded boxes on the
right hand side, coming off each stage.
> Various inputs of the “factors” of energy
and transport are also shown at each
of the five stages.
> On the consumption side is a simple
breakdown: consumables are items with
less than a year’s life, durables are items
with a life of more than a year, and fixed
capital describes items such as buildings
with an indefinite lifespan. For each type,
a stock-flow model can be constructed
if needed.
> The “products in use” circle shows the
lifecycle demands and impacts
of products and infrastructure such
as vehicles or buildings.
The implication of this more evolved scheme
is that resource productivity – the useful
outputs per unit of input – can be measured
in different ways at each stage of the supply
chain in terms of material inputs or outputs,
energy, emissions or waste.
There is also a parallel concept on the
agenda for further research – resource
consumption effectiveness. This represents
the human welfare output per unit of
consumption input: for instance, buying one
car may bring a certain benefit, but buying
two cars does not (usually) bring double
that. In reality it is often very difficult to
quantify the level of human welfare on
the consumption effectiveness side, so the
measures have to be taken with a pinch of
salt. However, the combined view is crucial
to the analysis of the SCP concept.
SCP framework and the SCP agenda
We can then use the SCP framework to
highlight the various effects of the shift
towards Factor Four and a One Planet
Economy, at each stage of a typical supply
chain. This would include:
> On the production side, reducing the
input of natural materials to the system;
6A
FR
AM
EW
OR
K
> reducing the volume of resource flows
at various points;
> increasing energy efficiency and transport
efficiency in production;
> reducing the Ecological Footprint per
tonne of resource flows; and
> generally increasing resource productivity
(the amount of added value for producers
per unit of resource flows).
> On the consumption side, increasing
the energy efficiency of products in use;
> increasing the average lifetime of both
consumable and durable products; and
> increasing the rate of re-use, recycling
and re-manufacturing, and reducing the
waste and emissions leaving the system.
To achieve all this in a consumer-led market
economy will need innovation to increase
the welfare added of products – so that
consumers will prefer to buy long-life, low-
impact, zero waste products, for example.
REAP activity sectors
The “activity sectors” sections below use
the SCP framework to show the resource
flows through the supply chains of two
example sectors in the Resource and
Energy Analysis program (REAP) modelling
system (the full set includes food, shelter,
transport, products, services, public
services, energy and waste).
In the two sectors that follow, covering
food and shelter, policy options and levers
are currently under development in the
REAP modelling system. There are also
many economic and social implications
of these policy options to be followed up
in the Strategy for a One Planet Economy
research programme.
The analysis follows as closely as
possible the SCP framework diagram
in Figure 2: the data has been drawn at
the UK level from the REAP system and
appears in summary input-output tables.
This serves as a start, although it loses
the detail of the full 123 sector accounts;
when there are full UK physical input-output
tables, a larger version would be feasible.
There are also unresolved questions where
the national accounts show different results
to industry studies – so the reports below
are at this stage an illustration of what
is to be followed up.
Sustainable food and farming
The UK food chain, from farming to waste
disposal, involves very large resource flows,
including economic, material and energy
(Figure 3). The largest economic activity is
at the secondary stage of food processing,
and nearly all of this goes direct to
households. Catering and other value-
added operations are also larger than
primary production in agriculture.
In material terms, agriculture produces
nearly 90m tonnes a year, food and drink
processing throughput is 80m tonnes a
year, and food-related imports total 34m
tonnes to primary or food manufacturing
sectors. About 9m tonnes of controlled
waste comes from food processing, and
3.3m tonnes from catering. Households
then consume about half a tonne per
person, a further 100kg which goes to
waste, plus a further 60kg of food and
drink packaging or containers.
The UK is 60 per cent self-sufficient by
material flow for all foods, and 75 per cent
for domestic varieties such as potatoes.
Imports are therefore a minority share by
weight, but generally involve the longer
distance and higher value-added items.
Current food and farming policy
There are many layers to this complex
and controversial policy agenda. At the
international trade level, the World Trade
Organization Doha Round of trade talks was
unresolved at the end of 2005. EU member
states, the US and other developed
countries are maintaining for the moment
-150
-50
-100
0
50
100
150
200
Proce
ssing
Farm
ing
Fig 3 Provisional resource flows in food and farmingTra
nspo
rt, et
c.
Retail,
etc.
Impo
rts
House
holds
Gover
nmen
t
Inves
tmen
t
Expor
ts
Was
te
Material (million tonnes)
Economy (£ billion)
Energy (tera-joules)

73
the structures of farm subsidies and import
tariffs which restrict the global trade in food
and favour the larger intensive producers.
Meanwhile, the EU Common Agricultural
Policy (CAP) reforms have now shifted
the farm subsidy regime from production
quotas to whole farm payments, including
environmental criteria.
The UK sustainable food and farming
strategy aspires towards an integration of
rural economic development, public health
and efficient food production. It advised that
farming could be separated into intensive
and extensive areas of production across
the UK.3 Recent research shows how the
distribution of food is responsible for more
than a quarter of all freight travel.4
In much of the crowded UK there is
competition between urban and rural land-
uses: 14 per cent of the land area is subject
to Green Belt policy where land values
should be stable, but in reality are pressured
by other quasi-farm uses such as horse
stabling and garden centres. Even in rural
areas, agriculture as such comprises less
than 5 per cent of the economy.
Factors of change
The majority of UK residents have enough
food, so future trends are more concerned
with food quality, diets, sources, production
methods and distribution. These are some
of the key factors to be modelled in the
REAP system:
> Imported percentage: the trend towards
imported foods is set to continue, and the
shake-out of UK agriculture and CAP
reform may well accelerate this process.
> Vegetarian percentage: this affects the
balance between energy intensive meat-
based food (32 per cent by weight)
and others. Further spread of vegetarian
diets would see overall reductions in
Ecological Footprint, as well as possible
health benefits.
> Organic production percentage:
at present this covers 0.6 per cent of
food volume by weight, but has been
increasing by 15 per cent per year
over the last decade. There are different
opinions on whether this trend will
continue or level off.
> Chemical intensity: the inputs by weight
of chemical fertilisers and pesticides have
increased dramatically in the last 50 years,
and this is the majority of the energy and
material inputs to farming.
> Packaging percentage: food packaging
by weight has increased only slowly, but
more rapid is the shift from low-energy
re-useable packaging to higher-energy
disposable material.
> Food waste fraction and composting
percentage: there is limited re-use of
food for animal feed from institutional
catering. Current levels of food waste
composting are a fraction of 1 per cent,
but the regional waste strategy contains
objectives to increase this fraction.
These policy options and levers are shown
on the food SCP framework in Figure 4.
Towards sustainable food
and farming
The current globalised, high-energy, fossil
fuel-based food sector, instrumental in
the trade balance between rich and poor
countries, will need to change in a One
Planet Economy if the overall impacts are
to be cut by a factor of four. These are
some of the main opportunities ahead for
policy, producers and consumers:
> Consumer demand and preference: This
is likely to be as much “push” from food
scares, dietary concerns and possibly
health insurance companies, as “pull”
from simple consumer preference. The
turning point may be when retail chains
realise there is more profit in higher-value,
high-quality niche products, than in the
conventional approach to volume sales.
> Food technology and supply chains:
production technology is likely to enable
greater quality and diversity through
ICT-based precision methods. There is
also growing awareness of natural
growing cycles and use of natural genetic
capital in medicinal and material sciences.
There may be legal developments such
as law suits against producers of unhealthy
food. The big unresolved question
concerns genetically modified food (GM),
whether it’s regarded as a hazard or
contribution to a sustainable food system.
> Food markets and subsidies: The vital
key to this structural shift towards a
sustainable agriculture system is the
economic management of food markets
and subsidies. The current CAP reforms
have leaned towards environmental
Fig 4 Food and farming resource flows and policy options
Agriculture,forestry
Foodprocessing
Distribution,retailcatering, etc.
Foodconsumed
Producerwaste/emissions
Consumerwaste/emissions
Exported/wasteemissions
Farmexports
Foodprocessingexports
Foodserviceexports
Importedraw foods
Importedfoodproducts
Importedfood-relatedservices
Re-use & recycling
Fixed capitalin foodsupply chain
1 2 3 4 5
6A
FR
AM
EW
OR
K
3 Defra, 2003
4 Defra, 2005

74
priorities, but the overall effect may
be to encourage large-scale intensive
production to be imported.
> Global trade and international
development: at the same time as re-
thinking regional and local production, it is
crucial that the benefits to the developing
world of basic food production are not
lost. A strategic convergence programme
would help to diversify production in the
developing world, and to move away from
the current monoculture of cash-crops
which are so vulnerable to commodity
prices and extreme weather events.
> Land markets and land management:
farm land values are likely to increase
along with pressures for other uses, and
the CAP environmental objectives aim to
encourage niche foods and higher value
production.
Built environment
The shelter or “built environment” sector
shows an opposite case to the food sector
– instead of immediate consumption, it
concerns the accumulation of material and
financial “stocks”, and their operation in use.
There are three main categories:
> housing of all types, sizes, ages and
ownership;
> other buildings – commercial, industrial
and public sector; and
> other infrastructure – civil engineering,
transport, drainage, etc.
The general shape of the supply chain can
be seen in Figure 5. The minerals and
aggregates sector has a material production
throughput of 180m tonnes a year, and
secondary manufacturing of building
materials and components had a material
production of 56m tonnes. The construction
sector is classed as a service industry,
and not in the national material accounts.
However, industry studies show a total
material requirement of 420m tonnes, of
which only 360m were incorporated into
construction products – the remainder
becoming waste (mostly quarrying waste).5
The energy in production shows the
dominance of the building materials sectors,
the largest being the cement and steel
industries. This totals 197 terra joules
(TJ), compared with 41 TJ in construction
itself and 21 TJ in construction minerals
and aggregates. As regards the operation
of the buildings in use, heating and power
in all UK buildings generates 51 per cent
of the total energy demand and
CO2 emissions.
6A
FR
AM
EW
OR
K
Energy in housing is classed under “private
households” as consumption, but energy
used in other buildings is found under the
production sector accounts.
In each of the building types there are
distinct stock-flow effects. The addition to
the building stock is 1-2 per cent per year,
but the demolition of the older stock is a
tiny fraction of this. At these rates it would
take more than 1,000 years to replace the
average house which is built to a notional
60-80 year design life standard. This
uncertainty about lifespan is crucial to
the balance of construction impacts
with energy-in-use impacts. To make real
progress in reducing the built environment
Environmental Footprint over the next few
decades, new buildings will be a minor
component compared with the existing
building stock and its profligate demand
for energy.
For demonstration buildings it appears
possible to achieve ultra-low energy usage,
at 1-2 per cent extra capital cost, which
is more than offset by lower energy bills.
However, for the mainstream industry
there are many barriers and disincentives
to investment in efficiency. The situation
is more difficult with the existing building
stock, where conditions, age, type and
ownership are all different. Hence there is
a need for new kinds of organisations and
financial packages to help bridge the gap.
Future trends and drivers
Most parts of the UK are under increasing
pressure for new housing: this is mainly
due to forecast population growth of 3.5
per cent per decade, and a household size
which is on average 2.4 to 2.1 people.
This is a challenge for meeting the Ecological
Footprint targets:
> Construction of 200,000 dwellings a
year will consume massive amounts of
materials and energy, wherever it is done.
> However, the new dwellings have the
potential to be much more efficient in
energy and water than the existing stock:
there is technological potential to reduce
external resource demands almost
to zero at a small added capital cost.
> Concentration of new construction in
urban areas will tend to generate more
reclamation and demolition waste than
the equivalent in a greenfield location, and
higher densities tend towards multi-storey
buildings which are more energy and
material intensive for the same floorspace.
> The social and economic effects of
regeneration, and their effects on
affluence and consumer spending habits,
will be much more significant than the
transport effects of urban concentration,
and possibly than the direct energy
requirements of the new housing.
Factors of change
These are some of the key factors which
can be modelled in the REAP system, as
shown on the resource flow framework
(Figure 6):
> household floorspace per person in both
existing and new housing, driven by the
natural aspirations for space. The outward
spread of urban development is then
constrained by planning policy in the UK;
> the stock turnover itself, as a proportion
of existing stock, and the rate of
demolition of older dwellings;
> household energy efficiency per unit of
floorspace for new and existing dwellings.
This is based on a composite measure of
energy demand as the sum of end-uses
such as heating and lighting, and shares
of energy fuels;
-100
0
-50
50
100
150
200
250
Man
ufactu
ring
Mine
ral, e
tc.
Fig 5 Provisional resource flows in the built environment
Trans
port,
etc.
Constr
uctio
n
Impo
rts
House
holds
Gover
nmen
t
Inves
tmen
t
Expor
ts
Was
te
Material (million tonnes)
Economy (£ billion)
Energy (tera-joules)

75
> household material efficiency per
floorspace. This applies to new
construction, the volume of materials used
per unit floorspace, and the Ecological
Footprint intensity of those materials.
Again, this is on a highly averaged level;
> waste arisings and material lifecycle. How
much bulk material stays in the system
or comes out as waste, and how much
of the waste then re-enters the system;
> commercial and public service buildings
need a similar range of units to housing
above. The difference is that they are not
related to population in the same way, but
rather to economic growth and economic
structure, and the intensity of floorspace
per unit of economic activity.
Towards a sustainable built
environment
This challenging agenda applies on many
levels and sectors, but the reality is that
the construction industry supply chain is
known, not unreasonably, for inertia and
conservatism. The concept of sustainable
construction is emerging as a policy
agenda, a business approach and a
marketing label. Beyond the rhetoric, it
is likely to involve increased pressure from
regulation, supply chain pressures, tax and
subsidy incentives, and public procurement.
6A
FR
AM
EW
OR
K
In each of these the Ecological Budget
UK data can help distinguish facts from
aspiration, and short-term gains from
long-term effects:
> increased eco-efficiency and reduced
materials intensity per unit of floorspace;
> reduced primary inputs, and increased
recycling and secondary use;
> zero-waste construction and demolition
practices;
> integrated materials management
systems;
> public procurement and market
development initiatives;
> economic and institutional arrangements
to provide finance and other incentives
for sustainable construction; and
> regional spatial strategies, urban
regeneration, and the balance of new
build with rehabilitation.
One of the parallel projects to the Ecological
Budget UK is the Eco-Region North
West project, which has focused on the
construction and built environment sectors.
This has developed an Eco-Benchmark
system for assessing the resource flow
performance (material flow analysis and
Ecological Footprint) of construction and
buildings in use. Another offshoot is the
West Midlands Sustainable Communities
project, which is comparing the pros and
cons of new build versus rehabilitation
in the context of economic and community
regeneration.
ConclusionsOver the past 100 years, supply chains
have become more and more complex,
with thousands of materials and components
going into final products sourced from
hundreds of countries. While not providing
a complete and detailed supply chain of
every product, Ecological Budget UK has
helped with an understanding of the general
pattern of key supply chains in the activity
sectors of food, construction, transport
and so-on.
More important, it has linked the material
and energy requirements of supply chains
with their economic output in the context
of national and regional targets for SCP.
As identified in the chapter, the social
welfare that can be derived from a given
product is another important dimension
of the SCP debate. In future, it is hoped
that further developments in the Ecological
Budget UK data will contribute to more
detailed analyses of sectors, firms,
products, technologies and consumer
choices. This will add to the evidence base
on the fundamental structure of production
and consumption systems, and help point
the way towards a One Planet Economy.
Fig 6 Built environment resource flows
Minerals,aggregates& forestry
Buildingmaterials
Construction,real estate,etc.
Buildingmaintenance,etc.
Producerwaste/emissions
Consumerwaste/emissions
Exportedwaste/emissions
Mineralexports
Materialexports
Constructionexports
Buildingsin use
Importedminerals& forestry
Importedmaterials
Importedconstruction
Re-use & recycling
Fixed capitalin buildings
1 2 3 4 5
Energy & transport in use
5 Smith, R.A., Kersey, J.R. & Griffiths, P.J., 2002,
Mass Balance of the Construction Industry, Viridis.

76
Sustainable consumptionand production targets
The overall messages from the results
in this report now become very clear:
> The Footprint measure shows that
consumption by UK residents is using
up the Earth’s resources at several times
their per capita share.
> As a service-led economy we are now
exporting our environmental impacts,
by importing goods from overseas,
even while the UK becomes cleaner
and greener.
> The UK government’s long-term target
for a 60 per cent reduction in climate
emissions translates into a long-term
goal of a 75 per cent cut in resource
use – i.e. a Factor Four increase
in resource efficiency.
> Such resource efficiency improvement
can be both cause and effect of
economic growth and competitiveness.
> This can be achieved through the
principle of ‘market transformation’.
We interpret this as environmental
sustainability combined with
technological, economic, organisational
and social change.
Only when the UK economy is clearly
moving on this strategic path towards a
Factor Four step change can the challenge
of the UK Sustainable Development
7T
HE
FU
TU
RE 7 The future
Strategy 2005 be taken up. This will move
us towards a real One Planet Economy –
an economic system of production and
consumption which respects environmental
limits, while being financially and
socially sustainable.
The concept of the One Planet Economy
was referred to in the UK Sustainable
Development Strategy, but not defined,
measured or otherwise followed up at that
point. This is the cue for the Ecological
Budget UK.
Towards a One Planet Economy
These are the principles behind the
proposals for moving the UK towards a
One Planet Economy:
> The first principle is ‘integrated asset
management’ covering economic, social
and environmental capitals and risks –
in other words, that the UK economy
should manage itself as intelligently as
any other large complex organisation.
> The national accounts and fiscal
budgeting systems should support
integrated asset management, with
the ‘triple bottom line’ approach to
comprehensive accounting for all
forms of capital – economic, social
and environmental.
> This leads to the ‘polluter pays
precautionary principle’ – i.e. that users
of environmental services should pay
for the risk or damage caused, locally
or globally. While this idea is not new,
the issue here is applying it either to
producers, intermediaries or consumers.
> This should be followed through on an
integrated supply chain principle, i.e. by
tracking material and energy resources
from cradle to grave, and from supply
sides to demand sides.
> This adds up to a full ‘market
transformation’ programme in each
sector, for low impact technologies
and sustainable consumption patterns.
> Such a programme should be financially
viable, aiming at net gains in both
national and individual costs and benefits.
> Such a programme should also be
socially responsible, aiming towards
equalising the differences between social
groups, between regions, and between
the UK and the developing world.
> To implement this requires a practical
‘business case’ to be developed for
each economic sector: each policy
level: each product type, and so on.
This chapter highlights what the Ecological Budget UK project has achieved, and the mainresults so far. This is but a start, and there are many questions to follow up – regional and local policy, industrial supply chains, taxation and international trade; questions that will be addressed by the One Planet Economy Network Strategy.

77
The contribution ofEcological Budget UK
The Ecological Budget UK first phase
results, and the Resource and Energy
Program (REAP) toolkit, provide an essential
contribution to the UK policy evidence
base. Following the launch of the phase 1
results, a five year programme of research
and development is now taking shape.
This includes, firstly, a contribution
to the evidence base for the One Planet
Economy:
> national material/energy accounts
and budget implications, to be shown
alongside the fiscal and monetary budget,
on an annual basis;
> a full breakdown of direct, external,
embedded and induced impacts of
economic activity, using CO2, material
flow analysis, Ecological Footprint
Analysis and other appropriate measures;
> an investigation of key supply chains
(e.g. construction, chemicals) for their
total environmental costs and benefits
on a lifecycle/risk management basis;
> an investigation of critical policy options
(e.g. nuclear power) for the total
environmental costs and benefits on
a life cycle/risk management basis.
Following on, there is great potential
for the Ecological Budget UK project
to demonstrate the applications to the
One Planet Economy, in the national
and regional government policy process,
for example:
> developing medium-long term market
transformation strategies for key sectors
of consumption and production, e.g.
construction, chemicals, etc.
> exploring the fiscal policies and
programmes needed to facilitate this
market transformation, including taxation
7T
HE
FU
TU
RE
or other charges. This can be
demonstrated in the form of an alternative
Comprehensive Spending Review;
> identifying the potential for public
procurement and other investment in
clean technologies. This uses the public
sector trading potential to its full effect,
as an instrument of public policy;
> investigating the potential for international
development policy, using economic
partnerships and other instruments;
> exploring the contributions of regional
and devolved administrations; local
authorities: and other agencies of
government, e.g. in health and education.
Thirdly, there is an urgent need to enhance
and mobilise capacity – for innovation,
learning, participation and new forms
of networking. At a simple local level,
if people can network with their neighbours
enough to share car journeys, then traffic
congestion could be cut at a stroke.
At a national economy level, if industries can
find a user for their by-products in advance,
then our waste problems could be a thing
of the past.
Such examples represent the ‘network’
strand of the One Planet Economy Network
(OPEN) Strategy, deliberately framed as
a network and process, because it is much
too diverse and complex to be organised
by one group, or completed at one point
in time. A start has been made at the
regional level by the SCPNet forum,
and this needs to be extended to other
levels in the public sector, private sector
and civic sectors.
Next steps
Ecological Budget UK has set out the
beginning of a longer-term programme
of research and development. Our under-
standing of the flows of materials and
energy through the UK demands much
more detailed investigation if we are
serious about moving the UK towards
a One Planet Economy.
As the follow on to the Ecological
Budget UK, the OPEN Strategy has been
launched. This is outlined in the full
reports on www.ecologicalbudget.org.uk.
The OPEN Strategy, to summarise the
above, is arranged in three parallel streams:
> building the evidence base: accounting
and analysis of UK consumption and
production;
> building the applications: applying this
evidence to the challenge of achieving
the One Planet Economy in consumption
and production;
> building the capacity: promoting networks
in order to mobilize the potential of public,
private and civic sectors.
Ecological Budget UK is the most significant
step to date in understanding how the
decisions we take every day affect the
environment around us. It is an essential
step in creating a platform to enable us
to move from the current UK ‘three planet
economy’ to a One Planet Economy.

78
Resource accounts
> The Ecological Budget UK resource
accounts have established the tonnes
of materials and products which are
produced, imported, exported, added
to stock and consumed by the UK’s
devolved countries and regions.
> The Ecological Budget UK resource
accounts bring together a number
of useful measures such as Domestic
Material Consumption (DMC) and
Domestic Material Input (DMI). These
are used by national government to
understand material flows in the UK.
> The Ecological Budget UK method
organises the tonnes of resources used
in the UK economy into 123 industrial
production sectors, according to the
Standard Industrial Classification.
This breakdown makes it possible
to identify resource-greedy production
sectors. Tonnes of resources are also
disaggregated into 82 “final demand”
or consumption categories covering
private households, government
(local and national), exports
and capital investment. This makes
it possible to identify resource-greedy
consumption categories.
AP
PE
ND
IX Appendix: Project scope and methods
> The resource accounts adhere
to Eurostat standards and trade
classifications. Eurostat is the
European Union government office
that coordinates and standardises
EU statistics. This means Ecological
Budget UK results fit into the statistical
classifications of other EU countries.
> The Ecological Budget UK project has
provided a baseline measurement of
resource consumption. Coupled with
future resource accounts, we will be able
to reliably measure changes in resource
consumption from year to year. Ecological
Budget UK is compatible with the UK
Office for National Statistics’ (ONS) top-
level indicator on resource consumption,
which tracks from 1970 to present day.
> Ecological Budget UK is based
on the ONS Economic Accounts – the
UK Blue Book. This makes it possible
to benchmark each sector in terms
of resource productivity – material flow
per unit of economic output.
> The Ecological Budget UK provides
an initial understanding of the “upstream”
and “downstream” environmental impacts
of industrial sectors. It does this by
mapping interactions between industries,
showing which sectors use resources
from which others.
CO2 emissions
> Ecological Budget UK has constructed
a new indicator for carbon dioxide that
includes emissions embodied in imports,
extending current CO2 accounts that
measure only emissions from production
(“territorial emissions”).
> To achieve this, Ecological Budget
UK used a monetary input-output table
that tracks the flow of money through
the UK economy. For further information
see the Resource and Energy Analysis
Program (REAP) reports at
www.ecologicalbudget.org.uk.
> Therefore, Ecological Budget UK takes
into account direct and “embedded”
CO2 emissions – those emissions
released during a product’s entire lifecycle
– whereas “direct” emissions relate only
to those produced during the use of the
product. By combining the resource
accounts with the CO2 emissions, we
can understand the relative emissions
impact per tonne of different materials
and products.
> CO2 emissions from consumption
have been calculated for every region
and local authority area in the UK.
These can be compared with territorial
emissions. Ecological Budget UK has
also determined emissions from
consumption of 54 socio-economic
groups using the ACORN classification.
The aim of the Ecological Budget UK is to provide a complete set of resource accounts of the UK, broken down by devolved country and region. Ecological Budget UK also provides CO2 and Ecological Footprint accounts which, in addition to tracking regions, measure the impact of every UK local authority. Below is a list of what these accounts include, and necessary work for the future.

79
Ecological Footprintaccounts> Taking the Global Footprint Network’s
Ecological Footprint standard, Ecological
Budget UK has broken the Footprint
down into a detailed profile (70
categories) of household consumption.
For the first time, a standard and
comparable Footprint analysis has been
provided for every region and local
authority in the UK. This is calculated
statistically from the average household
expenditure of social types, and their
distribution by local authority, and
is available free of charge at
www.sei.se/reap.
AP
PE
ND
IX
Policy
> The REAP software was developed as a
part of Ecological Budget UK, making it
possible to access the datasets in detail,
and project different resource use and
CO2 emissions scenarios into the future.
> REAP gives national, devolved country,
regional and local authorities the
opportunity to explore the effectiveness
of policy decisions. For more information,
visit www.sei.se/reap.
> Ecological Budget UK has helped the
West Midlands and North East regions
identify policy issues and develop
alternative scenarios for the future.
> Ecological Budget UK has made a
significant contribution to the Sustainable
Production and Consumption network –
SCPNet (www.scpnet.org.uk), developing
an evidence base for SCP policy
development in the devolved countries
and English regions.
> The datasets and the REAP tool will
enable quantitative assessment of policy
choices in economic and spatial
development, especially at the regional
level. In particular this feeds into
strategies in transport, housing, energy
and waste management.

80
Established in 1999, the Centre for
Urban & Regional Ecology (CURE) carries
out multidisciplinary research in three
inter-related programme areas:
> Sustainable City-Regions;
> Landscape Impacts & Futures;
> Land Restoration & Management.
The common theme is the organisation
and interaction of complex communities,
both natural and human, at various
scales from the local to the European.
The research is underpinned by an
advanced technical capability for spatial
analysis, modelling and visualisation.
Contact
CURE
School of Planning & Landscape
University of Manchester,
Manchester M13 9PL
Tel: 0161 275 6920/38
www.art.man.ac.uk/PLANNING/cure/
CO
NT
AC
T D
ET
AIL
S Contact details
SEI is an independent, international
research institute specialising in sustainable
development and environment issues.
It works at local, national, regional and
global policy levels. SEI has been engaged
in major environment and development
issues for a quarter of a century and has
become established as a leading expert
on the subject of Sustainable Consumption
within Europe and especially the UK.
Working closely with the European
Environment Agency as well as national,
regional and local governments, has
ensured that the research is applied,
relevant and timely. The Sustainable
Consumption (SC) Group contributes
to the overall SEI mission statement
by bridging the gap between science
and the policy arena.
Contact
SEI
University of York
Heslington
York YO10 5DD
Tel: 01904 432 897
www.regionalsustainability.org
Established in 1961, WWF works to
conserve endangered species, protect
threatened habitats and address global
threats, seeking long-term solutions
that benefit both people and nature.
WWF is committed to exploring alternative
lifestyles based around sustainable
consumption; this is a vital task which
requires us to understand and measure
the global environmental impact of our
everyday decisions and actions. We also
need to know where change is most
beneficial and most needed – whether
at a policy, economic, business or personal
level. WWF’s Ecological Footprint
Programme has been developed to meet
this need, providing all levels of government
with the information and tools they
need to make informed decisions, and
developing models and case studies to
demonstrate footprint strategies in action.
Contact
WWF-UK
Footprint Programme
Panda House
Weyside Park
Godalming
Surrey GU7 1XR.
Tel: 01483 426444
www.wwf.org.uk
www.ecologicalbudget.org.uk


Partners
Funded by:
WWF-UK
Panda House, Weyside ParkGodalming, Surrey GU7 1XRt: +44 (0)1483 426444f: +44 (0)1483 426409
The mission of WWF is to stop the degradation of the planet’snatural environment and to build a future in which humans livein harmony with nature, by:· conserving the world’s biological diversity· ensuring that the use of renewable resources is sustainable· promoting the reduction of pollution and wasteful
consumption
www.wwf.org.uk
Objectives This report forms part of the
Biffaward Programme on Sustainable Resource
Use. The aim of this programme is to provide
accessible, well-researched information about
the flows of different resources through the
UK economy based either singly, or on a
combination of regions, material streams
or industry sectors.
Background Information about material resource
flows through the UK economy is of fundamental
importance to the cost-effective management of
resource flows, especially at the stage when the
resources become ‘waste’.
WW
F-U
Kre
gist
ered
char
itynu
mbe
r10
8124
7A
com
pany
limite
dby
guar
ante
enu
mbe
r40
1672
5P
anda
sym
bol©
1986
WW
F®
WW
Fre
gist
ered
trad
emar
kM
arch
2006
In order to maximise the Programme’s full
potential, data will be generated and classified
in ways that are both consistent with each other,
and with the methodologies of the other generators
of resource flow/waste management data.
In addition to the projects having their own
means of dissemination to their own constituencies,
their data and information will be gathered together
in a common format to facilitate policy making
at corporate, regional and national levels.
More than 30 different mass balance projects
have been funded by Biffaward. For more
information on the Mass Balance UK programme
please visit www.massbalance.org
Biffaward Programme on Sustainable Resource Use
Counting
consumption
United
Kingdom